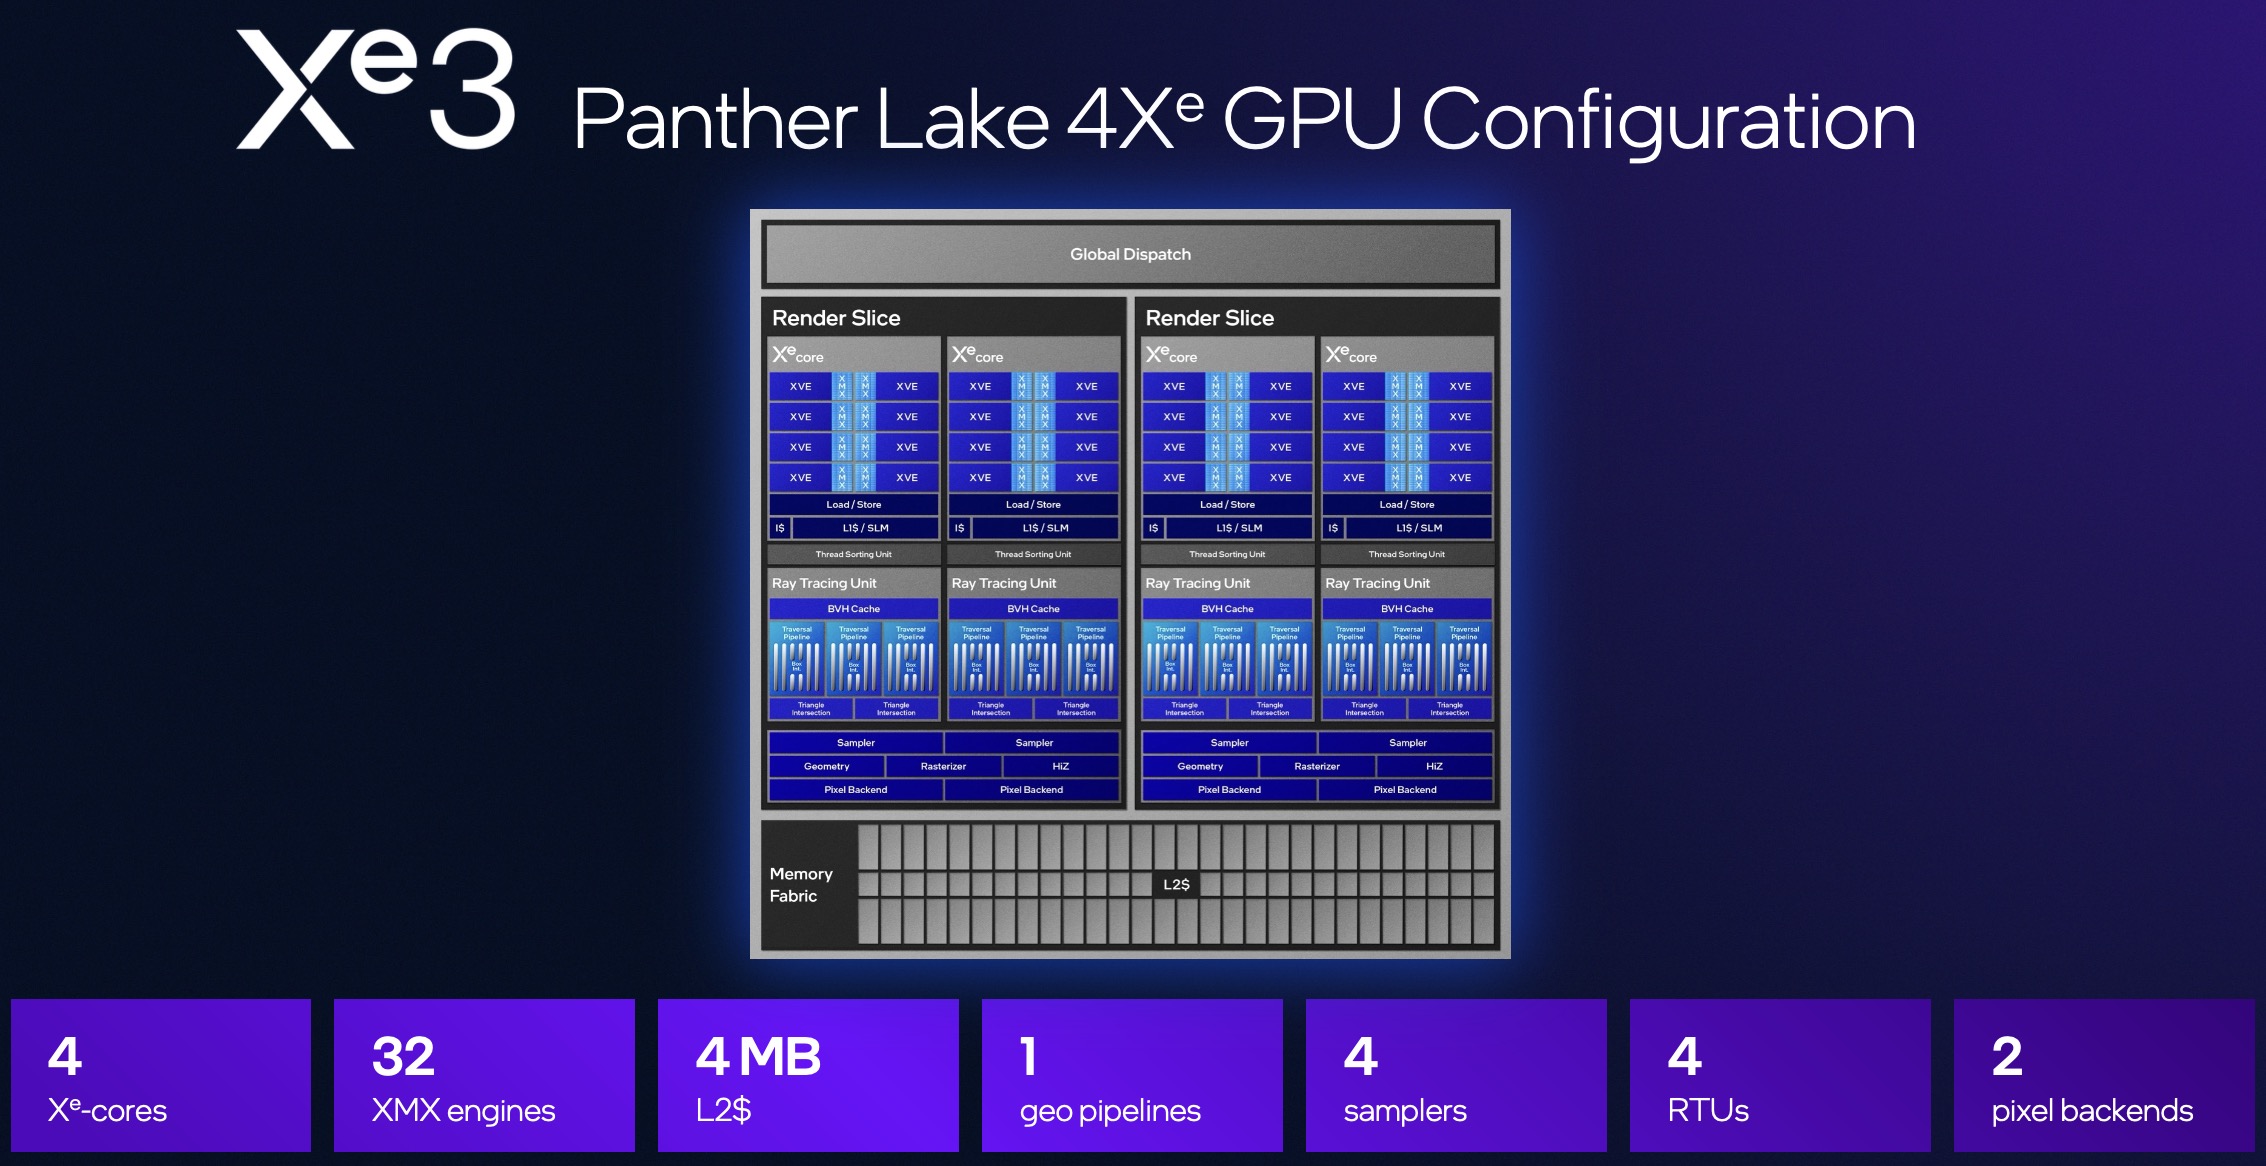
Recensioni Notebook con Intel Graphics 4 Xe3 Panther Lake iGPU la scheda grafica
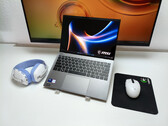
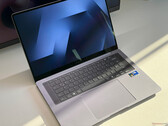
Recensione del portatile MSI Prestige 13 AI+: Il compagno perfetto per gli spostamenti?
Con Prestige 13 AI+, MSI si rivolge agli utenti mobili che sono spesso in viaggio e apprezzano un computer portatile compatto e leggero. Dotato di un nuovissimo processore Panther Lake, il dispositivo da 13 pollici è progettato per conquistare i clienti che cercano la massima portabilità.
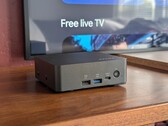
Intel Core Ultra 9 386H, Intel Graphics 4 Xe3 PTL, 13.3", 888 grRecensione dell'MSI Cubi NUC AI+ 3MG: Mini PC con fino a 128 GB di RAM
L'ultimo mini PC MSI riduce le dimensioni e il peso senza rinunciare a troppe caratteristiche importanti. Tuttavia, ci sono alcuni compromessi e limitazioni che vale la pena menzionare.
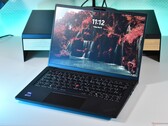
Intel Core Ultra 9 386H, Intel Graphics 4 Xe3 PTL, 552 grRecensione del portatile Lenovo ThinkPad T14 Gen 7: Un nuovo campione di riparabilità
Il ThinkPad T14 è uno dei top seller del più grande produttore di PC al mondo. L'ultimo ThinkPad T14 Gen 7 di Lenovo porta con sé Panther Lake di Intel, la moderna memoria LPCAMM2 e un enorme aggiornamento della riparabilità. Purtroppo, il prezzo potrebbe renderlo meno attraente di quanto potrebbe essere.
Intel Core Ultra 5 325, Intel Graphics 4 Xe3 PTL, 14", 1.4 kgRecensione del Lenovo Yoga Slim 7 Ultra 14IPH11: La migliore alternativa all'XPS 14
Lenovo punta direttamente alla giugulare dell'XPS di Dell con l'ultimo Yoga Slim 7 Ultra 14. Con un peso inferiore a 1 kg, il modello è già molto più leggero dell'ammiraglia Dell, pur mantenendo le stesse opzioni di CPU Intel Panther Lake X7 e X9.
Intel Core Ultra 7 355, Intel Graphics 4 Xe3 PTL, 14", 978 grRecensione del portatile Samsung Galaxy Book6 Pro - Meglio del nuovo XPS 16
Il nuovo Galaxy Book6 Pro di Samsung dispone dei processori Panther Lake di Intel, del Wi-Fi 7 e di un nuovo schermo touchscreen OLED, finalmente più luminoso di prima. I prezzi sono molto alti, tuttavia, e Galaxy Book6 Pro si trova di fronte a rivali eccellenti, quindi è sufficiente per battere XPS 16 o Zenbook S16?
Intel Core Ultra 7 356H, Intel Graphics 4 Xe3 PTL, 16", 1.6 kgDell XPS 16 Core Ultra 5 325: Intel Core Ultra 5 325, 16.00", 1.7 kg
recensione » Recensione del Dell XPS 16: Due passi avanti, un passo indietro
Dell XPS 14 Core Ultra 7 355: Intel Core Ultra 7 355, 14.00", 1.5 kg
recensione » Recensione del Dell XPS 14 Core Ultra 7 355: Ancora grande, ma non così speciale
HP OmniBook X 14-ka0000ng: Intel Core Ultra 5 325, 14.00", 1.3 kg
Recensioni esterne » HP OmniBook X 14-ka0000ng - Recensioni e Specifiche
Lenovo ThinkBook 14 G9 IPL: Intel Core Ultra 5 325, 14.00", 1.4 kg
Recensioni esterne » Lenovo ThinkBook 14 G9 IPL - Recensioni e Specifiche
Lenovo ThinkPad X1 Carbon G14: Intel Core Ultra 7 355, 14.00", 1 kg
Recensioni esterne » Lenovo ThinkPad X1 Carbon G14 - Recensioni e Specifiche
Microsoft Surface Laptop 8 13.8: Intel Core Ultra 5 335, 13.80", 1.4 kg
Recensioni esterne » Microsoft Surface Laptop 8 13.8
HP OmniBook X 14-ka: Intel Core Ultra 7 356H, 14.00", 1.3 kg
Recensioni esterne » HP OmniBook X 14-ka
Asus Vivobook 16 X1607AA: Intel Core Ultra 5 325, 16.00", 1.9 kg
Recensioni esterne » Asus Vivobook 16 X1607AA
Microsoft Surface Pro 13 (2026): Intel Core Ultra 5 335, 13.00", 0.9 kg
Recensioni esterne » Microsoft Surface Pro 13 (2026)
Lenovo Yoga 7 2-in-1 14IPH11: Intel Core Ultra 7 355, 14.00", 1.4 kg
Recensioni esterne » Lenovo Yoga 7 2-in-1 14IPH11
Lenovo Yoga Slim 7 Ultra 14IPH11: Intel Core Ultra 7 355, 14.00", 1 kg
Recensioni esterne » Lenovo Yoga Slim 7 Ultra 14IPH11
MSI Prestige 14 AI+ D3M: Intel Core Ultra 7 355, 14.00", 1.3 kg
Recensioni esterne » MSI Prestige 14 AI+ D3M
Samsung Galaxy Book6 Pro: Intel Core Ultra 7 356H, 16.00", 1.6 kg
Recensioni esterne » Samsung Galaxy Book6 Pro
Samsung Galaxy Book6 NP760VJG-KG5DE: Intel Core Ultra 7 355, 16.00", 1.8 kg
Recensioni esterne » Samsung Galaxy Book6 NP760VJG-KG5DE
MSI Prestige 14 Flip AI+ D3MTG: Intel Core Ultra 9 386H, 14.00", 1.4 kg
Recensioni esterne » MSI Prestige 14 Flip AI+ D3MTG
Acer Aspire 14 AI A14-I71M: Intel Core Ultra 9 386H, 14.00", 1.4 kg
Recensioni esterne » Acer Aspire 14 AI A14-I71M
MSI Prestige 13 AI+ A3MG: Intel Core Ultra 9 386H, 13.30", 0.9 kg
Recensioni esterne » MSI Prestige 13 AI+ A3MG
MSI Prestige 16 AI+ C3MG: Intel Core Ultra 7 355, 16.00", 1.6 kg
Recensioni esterne » MSI Prestige 16 AI+ C3MG
MSI Prestige 16 Flip AI+ C3MTG (2026): Intel Core Ultra 9 386H, 16.00", 1.7 kg
Recensioni esterne » MSI Prestige 16 Flip AI+ C3MTG (2026)
Asus ZenBook S14 UX5406AA: Intel Core Ultra 9 386H, 14.00", 1.2 kg
Recensioni esterne » Asus ZenBook S14 UX5406AA
Dell XPS 14 (2026) DA14260: Intel Core Ultra X7 358H, 14.00", 1.4 kg
Recensioni esterne » Dell XPS 14 (2026) DA14260
Lenovo Yoga Slim 7i 14IPH11: Intel Core Ultra 7 355, 14.00", 1 kg
Recensioni esterne » Lenovo Yoga Slim 7i 14IPH11
Dell XPS 16 (2026) DA16260: Intel Core Ultra 7 355, 16.00", 1.7 kg
Recensioni esterne » Dell XPS 16 (2026) DA16260
MSI Cubi NUC AI+ 3MG: Intel Core Ultra 9 386H, 0.6 kg
» MSI Cubi AI+ 3MG è più veloce di oltre il 60 percento rispetto a prima, ma avrebbe potuto essere ancora migliore
» Il piccolo PC MSI Cubi NUC AI+ 3MG supporta ben 128 GB di RAM rimovibile
» MSI Cubi NUC AI+ 3MG vs. Cubi NUC AI+ 2MG: miglioramenti quasi ovunque
Lenovo ThinkPad T14 Gen 7 21WN00A0GE: Intel Core Ultra 5 325, 14.00", 1.4 kg
» Conseguenza della crisi della RAM: Il downgrade dello schermo di Lenovo sul ThinkPad T14 Gen 7
» Lunar Lake è ancora il re della durata della batteria di Intel: ThinkPad T14 Gen 7 vs. T14 Gen 6
» Questo problema della tastiera è stato finalmente risolto con il nuovo ThinkPad T14 Gen 7
» Un cambiamento di design controverso: Confronto fotografico tra Lenovo ThinkPad T14 Gen 7 e T14 Gen 6
» ThinkPad T14 Gen 7: queste funzioni funzionano con Linux - e queste non funzionano
Lenovo Yoga Slim 7 Ultra 14IPH11: Intel Core Ultra 7 355, 14.00", 1 kg
» Lenovo continua a spedire computer portatili con display ad alta frequenza di aggiornamento impostati su 60 Hz. Ecco una soluzione semplice
» Lenovo Yoga Slim 7 Ultra 14 Aura è uno dei computer portatili più leggeri con Core Ultra X7, ma c'è una fregatura
» Lenovo Yoga Slim 7i Ultra Aura è inferiore a Dell XPS 14 di oltre 300 dollari e con il doppio della RAM
Samsung Galaxy Book6 Pro: Intel Core Ultra 7 356H, 16.00", 1.6 kg
» Il Samsung Galaxy Book6 Pro è un buon portatile multimediale, ma 2100 dollari sono troppo costosi
Dell XPS 16 Core Ultra 5 325: Intel Core Ultra 5 325, 16.00", 1.7 kg
» 2026 Dell XPS 16 funziona in modo sensibilmente più caldo rispetto al modello di ultima generazione
» Il Panther Lake XPS 16 è così efficiente che assorbe solo 1,5 W quando è al minimo, per una durata della batteria incredibilmente lunga
» Sono arrivati i nostri primi benchmark del Core Ultra 5 325 e i risultati sono quasi identici al Core Ultra 7 355
Dell XPS 14 Core Ultra 7 355: Intel Core Ultra 7 355, 14.00", 1.5 kg
» La GPU Intel 4 Xe3 è più lenta del 50% rispetto all'ammiraglia Arc B390, secondo i primi benchmark
» Sono arrivati i primi benchmark del Core Ultra 7 355 e non sono neanche lontanamente paragonabili a quelli del Core Ultra X7
Samsung Galaxy Book6 NP760VJG-KG5DE: Intel Core Ultra 7 355, 16.00", 1.8 kg
» Samsung Galaxy Serie Book6 Hands-On: tutti i modelli, prezzi e data di lancio