Recensioni Notebook con Intel Arc Graphics 140T la scheda grafica
Recensione del portatile MSI Venture 16 AI A2HMTG: Di base, economico, business
Il Venture 16 AI, meno conosciuto, salta tutte le caratteristiche di lusso dei modelli Prestige o Summit, più costosi, per gli utenti dell'ufficio che desiderano solo un computer portatile di base alimentato dal Core H di Intel.
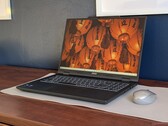
Intel Core Ultra 7 255H, Arc 140T, 16", 2.1 kgRecensione del portatile XMG Evo 15 (M25) - Una buona alternativa Windows al MacBook Air 15?
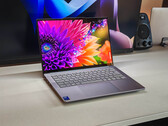
XMG Evo 15 è un notebook sottile da 15 pollici con Intel Arrow Lake, un luminoso display IPS opaco e solide caratteristiche generali. Si tratta di un prodotto versatile e capace, senza grandi punti deboli, disponibile sia con processore Intel che AMD.
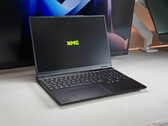
Intel Core Ultra 7 255H, Arc 140T, 15.3", 1.8 kgRecensione dell'Asus NUC 15 Pro+: Prestazioni di alto livello con Intel Core Ultra 9 285H in un mini PC
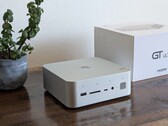
Con l'Asus NUC 15 Pro+, Asus vuole dimostrare quante prestazioni si possono inserire oggi in un case di dimensioni ridotte. Le dimensioni compatte e la tecnologia moderna rendono il mini PC particolarmente interessante. Ma questo piccolo concentrato di potenza è in grado di offrire ciò che i dati sulle prestazioni promettono nell'uso quotidiano? Nel nostro test, scopriamo se il NUC 15 Pro+ è davvero una seria alternativa al classico desktop.
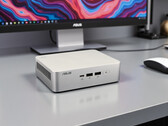
Intel Core Ultra 9 285H, Arc 140T, 690 grRecensione di Beelink GTI15 Ultra: Uno dei mini PC più completi per le sue dimensioni
Il GTI15 Ultra è ancora più veloce di prima, con Arrow Lake-H e porte LAN RJ-45 da 10 Gbps. Tuttavia, gli altoparlanti non sono ancora migliorati rispetto ai tempi del GTI13 Ultra.
Intel Core Ultra 9 285H, Arc 140T, 1.3 kgRecensione del Lenovo Yoga Pro 7i Gen 10 Aura Edition - Laptop multimediale con un ottimo touchscreen OLED
Con l'Intel Core Ultra 9 285H, lo Yoga Pro 14 G10 offre un processore veloce e il nuovo touchscreen OLED 3K con 120 Hz offre un'eccellente qualità dell'immagine. Tuttavia, il limite di potenza elevato comporta anche dei problemi.
Intel Core Ultra 9 285H, Arc 140T, 14.5", 1.6 kgHP ZBook 8 G1i 14: Intel Core Ultra 7 255H, 14.00", 1.7 kg
recensione » Recensione del portatile HP ZBook 8 G1i 14: Il successore del Firefly che punta su Intel ARC
Asus ZenBook 14 OLED UX3405CA, Ultra 7 255H: Intel Core Ultra 7 255H, 14.00", 1.3 kg
recensione » Recensione dell'Asus ZenBook 14 OLED UX3405CA: un subnotebook Intel che recupera terreno
Eurocom Blitz Ultra 2 14: Intel Core Ultra 7 255H, 14.00", 1.6 kg
recensione » Recensione del computer portatile Eurocom Blitz Ultra 2 14: Grande facilità di manutenzione a scapito del peso
Dell 14 Premium: Intel Core Ultra 7 255H, 14.50", 1.7 kg
recensione » Recensione del portatile Dell 14 Premium: Un XPS 14 in tutto e per tutto, ad eccezione del nome
Honor MagicBook Art 14 2025: Intel Core Ultra 7 255H, 14.60", 1 kg
recensione » Recensione dell'Honor MagicBook Art 14 2025: Ultrabook da 1 kg con Arrow Lake ed eccellenti dispositivi di input
GMK EVO-T1: Intel Core Ultra 9 285H, 0.9 kg
recensione » Recensione del GMKtec EVO-T1 con Intel Core Ultra 9 285H, 80W TDP, 64 GB di RAM e opzione eGPU: Mini PC di fascia alta
Lenovo ThinkPad E14 G7-21SYS00H00: Intel Core Ultra 7 255H, 14.00", 1.4 kg
recensione » Recensione del Lenovo ThinkPad E14 G7 - Il portatile da ufficio economico si distingue dalla concorrenza con il suo display da 120 Hz
Geekom Mini IT15, Ultra 9 285H: Intel Core Ultra 9 285H, 0.6 kg
recensione » Recensione del Mini PC 2025: Geekom Mini IT15, una mini-workstation con Intel Core Ultra per professionisti e creativi, recensito
Lenovo ThinkBook 14 Gen 8 21SJ007SGE: Intel Core Ultra 7 255H, 14.00", 1.5 kg
recensione » Recensione del ThinkBook 14 Gen 8 IAL: Questo economico portatile Lenovo è più aggiornabile rispetto alla maggior parte dei ThinkPad
Lenovo Yoga Book 9 14IAH10: Intel Core Ultra 7 255H, 14.00", 1.2 kg
recensione » Recensione del convertibile Lenovo Yoga Book 9 14IAH10: Doppio schermo senza doppio peso
Xiaomi RedmiBook Pro 14 2025: Intel Core Ultra 7 255H, 14.00", 1.4 kg
recensione » Recensione dello Xiaomi RedmiBook Pro 14 2025 - Ora con Arrow Lake e 16 ore di durata della batteria
Asus ZenBook Duo OLED UX8406CA: Intel Core Ultra 9 285H, 14.00", 1.8 kg
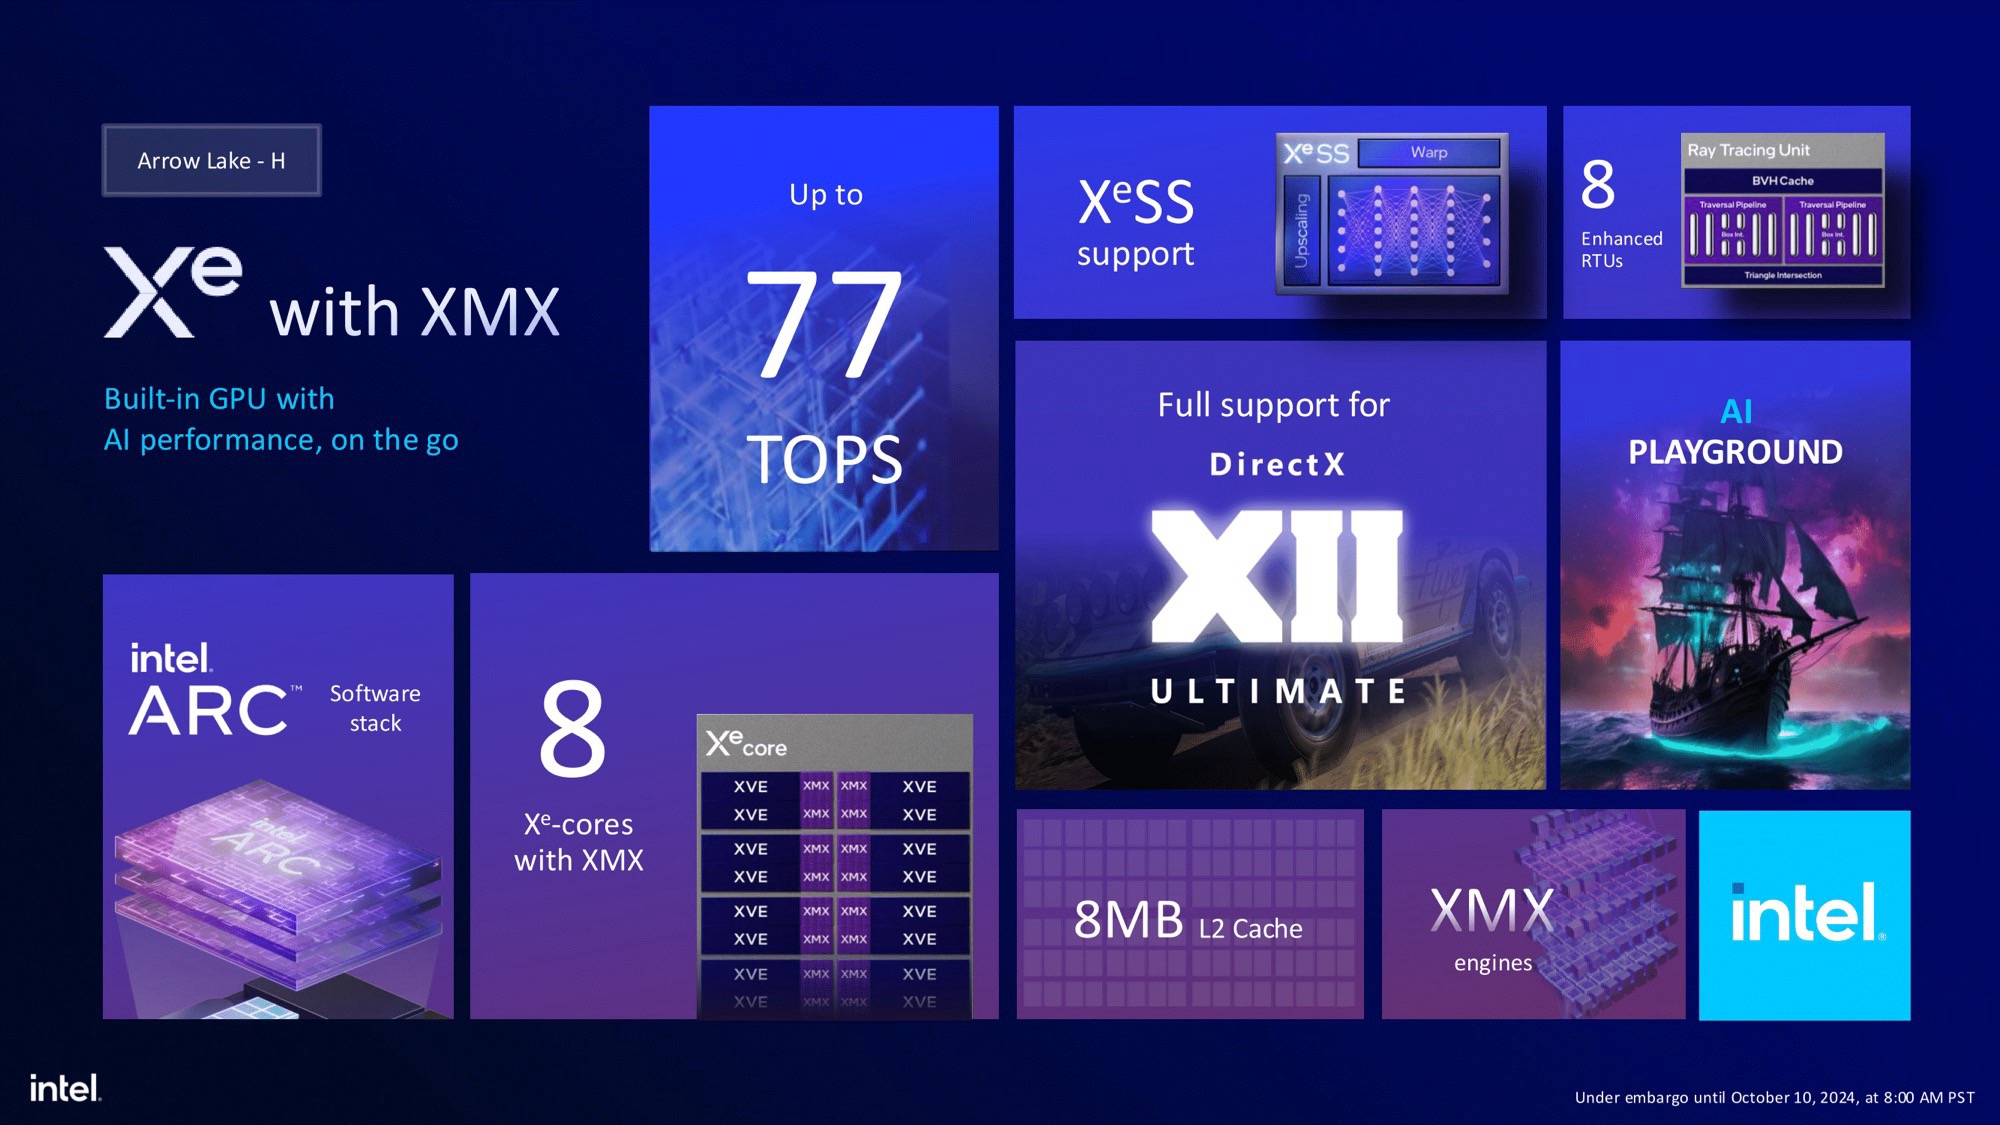
recensione » Analisi dell'Intel Arc Graphics 140T - La iGPU Arrow Lake-H guadagna il supporto per la generazione di fotogrammi
MSI Prestige 16 AI Evo B2HMG: Intel Core Ultra 9 285H, 16.00", 1.6 kg
recensione » Analisi dell'Intel Arc Graphics 140T - La iGPU Arrow Lake-H guadagna il supporto per la generazione di fotogrammi
Asus ZenBook Duo OLED UX8406CA: Intel Core Ultra 9 285H, 14.00", 1.8 kg
recensione » Analisi della CPU Intel Arrow Lake-H: Core Ultra 200H rende Lunar Lake quasi ridondante
MSI Prestige 16 AI Evo B2HMG: Intel Core Ultra 9 285H, 16.00", 1.6 kg
recensione » Analisi della CPU Intel Arrow Lake-H: Core Ultra 200H rende Lunar Lake quasi ridondante
recensione » Recensione dell'MSI Prestige 16 AI Evo - Il portatile multimediale con una CPU Arrow Lake veloce e autonomia impressionante
Asus ZenBook Duo OLED UX8406CA: Intel Core Ultra 9 285H, 14.00", 1.8 kg
recensione » Recensione dell'Asus ZenBook Duo OLED - Il convertibile multischermo ora con Intel Arrow Lake
Lenovo ThinkPad E14 G7-21SYS00H00: Intel Core Ultra 7 255H, 14.00", 1.4 kg
Recensioni esterne » Lenovo ThinkPad E14 G7-21SYS00H00
MSI Modern 15 H AI C2HMG: Intel Core Ultra 9 285H, 15.60", 1.9 kg
Recensioni esterne » MSI Modern 15 H AI C2HMG
Asus Expertbook B5405: Intel Core Ultra 7 255H, 14.00", 1.4 kg
Recensioni esterne » Asus Expertbook B5405
Honor MagicBook Art 14 2025: Intel Core Ultra 7 255H, 14.60", 1 kg
Recensioni esterne » Honor MagicBook Art 14 2025
Dell 14 Premium: Intel Core Ultra 7 255H, 14.50", 1.7 kg
Recensioni esterne » Dell 14 Premium
Acer Aspire Vero 16 AV16-71P: Intel Core Ultra 7 255H, 16.00", 1.8 kg
Recensioni esterne » Acer Aspire Vero 16 AV16-71P
Asus Vivobook S16 S3607CA: Intel Core Ultra 7 255H, 16.00", 1.7 kg
Recensioni esterne » Asus Vivobook S16 S3607CA
Acer Swift Go 16 OLED SFG16-73: Intel Core Ultra 9 285H, 16.00", 1.5 kg
Recensioni esterne » Acer Swift Go 16 OLED SFG16-73
LG gram Pro 16Z90TP: Intel Core Ultra 7 255H, 16.00", 1.2 kg
Recensioni esterne » LG gram Pro 16Z90TP
Lenovo Yoga Pro 7 14IAH10: Intel Core Ultra 9 285H, 14.50", 1.6 kg
Recensioni esterne » Lenovo Yoga Pro 7 14IAH10
Asus Vivobook S14 S3407CA: Intel Core Ultra 7 255H, 14.00", 1.4 kg
Recensioni esterne » Asus Vivobook S14 S3407CA
Lenovo Yoga Book 9 14IAH10: Intel Core Ultra 7 255H, 14.00", 1.2 kg
Recensioni esterne » Lenovo Yoga Book 9 14IAH10
Asus VivoBook S16 OLED S5606CA: Intel Core Ultra 7 255H, 16.00", 1.5 kg
Recensioni esterne » Asus VivoBook S16 OLED S5606CA
Asus Zenbook 14 OLED UX3405CA: Intel Core Ultra 7 255H, 14.00", 1.3 kg
Recensioni esterne » Asus Zenbook 14 OLED UX3405CA
Honor MagicBook Pro 14 (2025): Intel Core Ultra 9 285, 14.60", 1.4 kg
Recensioni esterne » Honor MagicBook Pro 14 (2025)
Asus Zenbook 14 OLED UX3405CA, Ultra 9 285H: Intel Core Ultra 9 285H, 14.00", 1.2 kg
Recensioni esterne » Asus Zenbook 14 OLED UX3405CA, Ultra 9 285H
LG gram Pro 2-in-1 16T90TP: Intel Core Ultra 7 255H, 16.00", 1.4 kg
Recensioni esterne » LG gram Pro 2-in-1 16T90TP
MSI Prestige 16 AI Evo B2HMG: Intel Core Ultra 9 285H, 16.00", 1.6 kg
Recensioni esterne » MSI Prestige 16 AI Evo B2HMG
Asus ZenBook Duo OLED UX8406CA: Intel Core Ultra 9 285H, 14.00", 1.8 kg
Recensioni esterne » Asus ZenBook Duo OLED UX8406CA
MSI Venture 16 AI A2HMTG: Intel Core Ultra 7 255H, 16.00", 2.1 kg
» MSI Venture 16 è sorprendentemente veloce per un portatile da ufficio economico
» Il laptop da ufficio MSI Venture 16, meno conosciuto, offre solo le caratteristiche minime
Beelink GTI15 Ultra: Intel Core Ultra 9 285H, 1.3 kg
» I microfoni Beelink GTI15 Ultra quad sono ottimi per l'attivazione vocale, ma gli altoparlanti sono medi
» Beellnk GTI15 Ultra PC viene lanciato a quasi il doppio del prezzo originale di GTI13 Ultra
Lenovo Yoga Pro 7 14IAH10: Intel Core Ultra 9 285H, 14.50", 1.6 kg
» Lo Yoga Pro 7 di Lenovo con il Core Ultra 9 di Intel mostra il problema dei limiti di potenza elevati
» Lenovo favorisce Intel con uno schermo migliore e un lettore di schede SD sullo Yoga Pro 7 14
HP ZBook 8 G1i 14: Intel Core Ultra 7 255H, 14.00", 1.7 kg
» Il ritorno di un vecchio standard: HP reintroduce la porta RJ45-Ethernet in molti modelli aziendali
Asus ZenBook 14 OLED UX3405CA, Ultra 7 255H: Intel Core Ultra 7 255H, 14.00", 1.3 kg
» Intel ZenBook 14 OLED è dotato di Wi-Fi 7 - ma la versione AMD offre velocità di trasferimento più elevate
» Lo ZenBook 14 è migliore con Intel o AMD quest'anno?
Eurocom Blitz Ultra 2 14: Intel Core Ultra 7 255H, 14.00", 1.6 kg
» Eurocom Blitz Ultra 2 è dotato di funzioni standard che la maggior parte degli altri computer portatili da 14 pollici omette
Honor MagicBook Art 14 2025: Intel Core Ultra 7 255H, 14.60", 1 kg
» Honor pubblicizza una luminosità di picco fino a 1600 nit per il MagicBook Art 14 2025, ma noi misuriamo solo 740 nit
Dell 14 Premium: Intel Core Ultra 7 255H, 14.50", 1.7 kg
» L'XPS 14 continua a vivere attraverso il Dell 14 Premium con pochissime modifiche
» Dell 14 Premium costa quanto il più leggero e potente Razer Blade 14
Honor MagicBook Art 14 2025: Intel Core Ultra 7 255H, 14.60", 1 kg
» Honoril nuovo MagicBook Art 14 2025 ha una tastiera migliore dei moderni ThinkPad
GMK EVO-T1: Intel Core Ultra 9 285H, 0.9 kg
» Recensione di GMKtec EVO-T1: Mini PC con Intel Core Ultra 9 per modelli AI, LLM e giochi tramite OCuLink
Lenovo ThinkPad E14 G7-21SYS00H00: Intel Core Ultra 7 255H, 14.00", 1.4 kg
» Lenovo ThinkPad E14 & ThinkBook 14 - Business vs. prosumer a confronto
» Lenovo offre finalmente un migliore display a 120 Hz per il conveniente ThinkPad E14
» Laptop da ufficio da 14 pollici con ottime opzioni di manutenzione: ThinkPad E14 G7 offre 2 SSD e 2 slot RAM
Lenovo ThinkBook 14 Gen 8 21SJ007SGE: Intel Core Ultra 7 255H, 14.00", 1.5 kg
» Questo portatile Lenovo ThinkBook è un sogno di aggiornabilità - ed è conveniente
Lenovo ThinkPad E16 G3-21SSS00E00: Intel Core Ultra 7 255H
» Il Core Ultra 7 255H vale la pena nel ThinkPad E16 G3? Lo abbiamo testato
Khadas Mind 2s: Intel Core Ultra 7 255H, 0.4 kg
» Mini PC modulare Khadas Mind 2s recensito: Il sostituto portatile del desktop può entrare nelle tasche
Lenovo Yoga Book 9 14IAH10: Intel Core Ultra 7 255H, 14.00", 1.2 kg
» Il throttling della CPU di Lenovo Yoga Book 9 14 Arrow Lake è un po' più forte di quanto vorremmo
» L'ultimo Lenovo Yoga Book 9 14 pesa ancora meno della versione più piccola da 13 pollici, pur offrendo display più grandi