Notebookcheck Logo

Apple M2 Pro 19-Core GPU

Apple M2 Pro 19-Core GPU

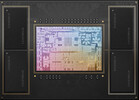
L'Apple M2 Pro 19-Core-GPU è una scheda grafica integrata di Apple che offre tutti i 19 core del chip M2 Pro.

La scheda grafica non ha memoria grafica dedicata ma può utilizzare la veloce memoria unificata LPDDR5-6400 con bus a 256 bit (fino a 200 GBit/s). La GPU ha un clock da 444 MHz a 1398 MHz e mantiene i 1398 MHz nei giochi.

Secondo Apple, le prestazioni dovrebbero essere superiori del 30% rispetto alla vecchia GPU a 16 core dell'M1 Pro.

La GPU è progettata per utilizzare l'API Apple Metal 2 e potrebbe essere ancora basata sulle vecchie architetture PowerVR (usate l'ultima volta nell'Apple A10). Una nuova funzionalità dei MacBook Pro 14 e 16 del 2023 è il supporto per l'uscita HDMI 2.1 e 8k.

L'Apple M2 Pro è prodotto con il processo a 5 nm di seconda generazione presso TSMC. Il consumo energetico della parte GPU dell'M2 Pro è leggermente inferiore a 20 Watt nei giochi (Borderlands 3 misurato con powermetrics).

Apple M2 Serie

M2 Max 38-Core GPU 38
M2 Max 30-Core GPU 30
M2 Pro 19-Core GPU 19 @ 0.44 - 1.4 GHz
M2 Pro 16-Core GPU 16
M2 10-Core GPU 10 @ 1.4 GHz
M2 8-Core GPU 8 @ 1.4 GHz
Pipelines19 - unified
Velocità del core444 - 1398 (Boost) MHz
Tipo di memoriaLPDDR5-6400
Memoria condivisano
Consumo di corrente20 Watt
tecnologia5 nm
Dimensione del portatilemisura media
Data dell'annuncio17.01.2023
CPU in M2 Pro 19-Core GPUGPU Base SpeedGPU Boost / Turbo
Apple M2 Pro12 x 2424 MHz? MHz? MHz

Benchmark

3DMark - 3DMark Wild Life Extreme Unlimited
min: 12968     media: 12983     media: 12982.5 (15%)     massimo: 12997 Points
Blender - Blender 3.3 Classroom METAL *
97 Seconds (10%)
Cinebench R15
Cinebench R15 OpenGL 64 Bit +
Cinebench R15 - Cinebench R15 OpenGL 64 Bit
140.9 fps (8%)
Cinebench R15 OpenGL Ref. Match 64 Bit +
GFXBench - GFXBench 5.0 4K Aztec Ruins High Tier Offscreen
min: 92.1     media: 92.2     media: 92.2 (37%)     massimo: 92.2 fps
GFXBench - GFXBench 5.0 Aztec Ruins High Tier Offscreen
min: 210.4     media: 210.6     media: 210.6 (38%)     massimo: 210.7 fps
3.3 -98%
...
Apple M1 Pro 14-Core GPU
147 -30%
153 -27%
161.4 -23%
Apple M1 Pro 16-Core GPU
166 -21%
178.7 -15%
181.1 -14%
185.4 -12%
187 -11%
208 -1%
Apple M2 Pro 19-Core GPU
210.6
219.7 4%
Apple M1 Max 24-Core GPU
240 14%
242.3 15%
248.5 18%
261.5 24%
288.5 37%
Apple M1 Max 32-Core GPU
309.4 47%
326.1 55%
397.6 89%
...
536 155%
0%
100%
GFXBench - GFXBench 5.0 Aztec Ruins Normal Tier Offscreen
min: 565.3     media: 567     media: 566.7 (42%)     massimo: 568 fps
GFXBench - GFXBench Car Chase Offscreen
min: 434.4     media: 435.2     media: 435.2 (49%)     massimo: 436 fps
GFXBench 3.1 - GFXBench Manhattan ES 3.1 Offscreen
min: 748     media: 748     media: 748.2 (16%)     massimo: 748.4 fps
GFXBench 3.0 - GFXBench 3.0 Manhattan Offscreen
min: 1126.4     media: 1131     media: 1131.2 (66%)     massimo: 1136 fps
GFXBench (DX / GLBenchmark) 2.7
GFXBench T-Rex HD Offscreen C24Z16 +
GFXBench (DX / GLBenchmark) 2.7 - GFXBench T-Rex HD Offscreen C24Z16
min: 1967.2     media: 1970     media: 1969.6 (16%)     massimo: 1972 fps
Geekbench 6.2 - Geekbench 6.2 GPU OpenCL
50447 punti (15%)
Geekbench 6.2 - Geekbench 6.2 GPU Metal
82134 punti (53%)
Power Consumption - The Witcher 3 Power Consumption - external Monitor *
49.6 Watt (7%)
05101520253035404550Tooltip
Power Consumption - Witcher 3 Power Consumption *
55.9 Watt (12%)
0510152025303540455055Tooltip
Power Consumption - Witcher 3 ultra Power Efficiency - external Monitor
min: 1.028     media: 1     media: 1 (85%)     massimo: 1.207 fps per Watt
- Valori di benchmark per questa scheda grafica
- Valori medi di benchmark per questa scheda grafica
* Numeri più piccoli rappresentano prestazioni supeiori

Benchmarks per i giochi

I seguenti benchmarks deirivano dai benchmarks dei portatili recensiti. Le prestazioni dipendono dalla scheda grafica utilizzata, dal clock rate, dal processore, dai settaggi di sistema, dai drivers, e dai sistemi operativi. Quindi i risultati non sono rappresentativi per i portatili con questa GPU. Per informazioni dettagliate sui risultati del benchmark, cliccate sul numero di fps.

Cyberpunk 2077 2.0 Phantom Liberty

Cyberpunk 2077 2.0 Phantom Liberty

2023
basso 1920x1080
39.6  fps    + Confronta
medio 1920x1080
33.5  fps    + Confronta
alto 1920x1080
29.3  fps    + Confronta
ultra 1920x1080
26.5  fps    + Confronta
» Giocabile con tutti i portatili testati con dettagli basso.
ultra 1920x1080
34  fps    + Confronta
» Il Benchmark indica che il gioco non è utilizzabile con i settaggi testati.
basso 1280x720
75.9 79 ~ 77 fps    + Confronta
medio 1920x1080
54 60.3 ~ 57 fps    + Confronta
alto 1920x1080
40 40.6 ~ 40 fps    + Confronta
ultra 1920x1080
29 30.4 ~ 30 fps    + Confronta
» Giocabile con tutti i portatili testati con dettagli alto.
Additional Benchmarks
Very Low Overall Quality (DX11) 1920x1080
78.6
basso 1280x720
269  fps    + Confronta
medio 1920x1080
84  fps    + Confronta
alto 1920x1080
54  fps    + Confronta
ultra 1920x1080
40  fps    + Confronta
QHD 2560x1440
25  fps    + Confronta
» Giocabile con tutti i portatili testati con dettagli ultra.
basso 1280x720
169  fps    + Confronta
medio 1920x1080
80  fps    + Confronta
alto 1920x1080
72  fps    + Confronta
ultra 1920x1080
63  fps    + Confronta
QHD 2560x1440
40  fps    + Confronta
» Giocabile con tutti i portatili testati con dettagli ultra.
alto 1920x1080
57  fps    + Confronta
ultra 1920x1080
51  fps    + Confronta
» Giocabile con tutti i portatili testati con dettagli ultra.
bassomedioaltoultraQHD4K
Cyberpunk 2077 2.0 Phantom Liberty39.633.529.326.5
Baldur's Gate 334
Borderlands 377574030
Total War: Three Kingdoms26984544025
Shadow of the Tomb Raider16980726340
The Witcher 35751
< 30 fps
< 60 fps
< 120 fps
≥ 120 fps

1
1
2

2
2
1
3
1
1
4
1
1
1


Per conoscere altri giochi che potrebbero essere utilizzabili e per una lista completa di tutti i giochi e delle schede grafiche visitate la nostra Gaming List

v1.26
log 27. 03:52:40

#0 no ids found in url (should be separated by "_") +0s ... 0s

#1 not redirecting to Ajax server +0s ... 0s

#2 did not recreate cache, as it is less than 5 days old! Created at Thu, 25 Apr 2024 05:40:10 +0200 +0.001s ... 0.001s

#3 no comparison url found in template nbc.compare_page_1 needed +0.053s ... 0.054s

#4 no comparison url found in template nbc.compare_page_1 needed +0s ... 0.054s

#5 no comparison url found in template nbc.compare_page_1 needed +0s ... 0.055s

#6 no comparison url found in template nbc.compare_page_1 needed +0s ... 0.055s

#7 no comparison url found in template nbc.compare_page_1 needed +0s ... 0.055s

#8 composed specs +0s ... 0.055s

#9 did output specs +0s ... 0.055s

#10 start showIntegratedCPUs +0s ... 0.055s

#11 getting avg benchmarks for device 11568 +0.015s ... 0.069s

#12 got single benchmarks 11568 +0.009s ... 0.078s

#13 got avg benchmarks for devices +0s ... 0.078s

#14 min, max, avg, median took s +0.229s ... 0.308s

#15 before gaming benchmark output +0s ... 0.308s

#16 Got 41 rows for game benchmarks. +0.008s ... 0.316s

#17 composed SQL query for gamebenchmarks +0s ... 0.316s

#18 got data and put it in $dataArray +0.005s ... 0.32s

#19 benchmarks composed for output. +0.266s ... 0.586s

#20 no comparison url found in template nbc.compare_page_1 needed +0.003s ... 0.589s

#21 return log +0s ... 0.589s

Please share our article, every link counts!

Classe 1

GeForce RTX 2080 Super Mobile

Classe 2

M1 Max 32-Core GPU *
GeForce RTX 2070 Super Mobile
M1 Max 24-Core GPU *
Radeon RX 5700M *
M1 Pro 16-Core GPU *
Radeon PRO W6600M *
GeForce RTX 2070 Super Max-Q
M1 Pro 14-Core GPU *
Quadro P4200
Quadro P5000 Max-Q *
GeForce RTX 3050 4GB Laptop GPU
Quadro P4000 Max-Q
Radeon RX 580X (Laptop) *
Radeon RX 580 (Laptop)
Radeon Pro 5300M
Radeon RX 5300M
Quadro P3000 Max-Q *
Radeon Pro WX 7100 *
Radeon RX 570X (Laptop) *
Radeon RX 570 (Laptop) *
Radeon RX 470 (Laptop) *

Classe 3

GeForce GTX 1050 Ti Mobile
Radeon 680M
Quadro P2000 Max-Q
Radeon R9 M395X
GeForce GTX 1050 Ti Max-Q *
WX Vega M GL
Radeon R9 M485X
GeForce GTX 1050 Max-Q *
Radeon 660M
Radeon RX 560X (Laptop)
Radeon RX 560 (Laptop)
Radeon Pro 560X
Radeon Pro 560
Radeon Pro 460
Radeon Pro WX 4130 *
Quadro P620 *
Radeon RX 550X (Laptop)
Radeon Pro 555X
Radeon Pro 555
Radeon Pro 455
Quadro P600
Radeon RX 540X *
Radeon Pro WX 2100 *
Radeon Pro WX 3100 *
Radeon Pro 450
Radeon 630
Radeon 540X *
Quadro P520
Quadro P500 *
Iris Plus Graphics G7 (Ice Lake 64 EU) *
Vega 10 *
Iris Pro Graphics 580
Vega 9
FirePro W5130M
UHD Graphics Xe G4 48EUs *
UHD Graphics 32EUs
UHD Graphics Xe 32EUs (Tiger Lake-H) *
UHD Graphics 750
Vega 7
Radeon R7 M465
Vega 8
Iris Plus Graphics G4 (Ice Lake 48 EU)
Quadro M600M
FirePro W4190M
Radeon R7 M445
UHD Graphics 24EUs (Alder Lake-N) *
Radeon R7 M340
Radeon 610M *
UHD Graphics G1 (Ice Lake 32 EU)
UHD Graphics Xe 16EUs (Tiger Lake-H) *
Radeon R5 (Bristol Ridge)
Adreno 690 *
Adreno 685 *
Adreno 680 *

Classe 4

UHD Graphics 730
Radeon R5 M315 *
Radeon R5 M420 *
UHD Graphics 617
UHD Graphics 615
Radeon R4 (Stoney Ridge)
Radeon R2 (Stoney Ridge)
HD Graphics (Broadwell)

Classe 5

Posizione approssimativa dell'adattatore grafico

> Recensioni e prove di notebook, tablets e smartphones > Info Techniche / Tips > Confronto delle schede video > Apple M2 Pro 19-Core GPU
Klaus Hinum (Update: 2023-11-22)