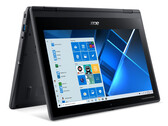
Recensione dell'Acer TravelMate Spin B3: Robusto portatile 2-in-1 con input tramite penna
Intel Pentium Silver N5030 | Intel UHD Graphics 605 | 11.60" | 1.5 kg
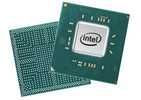
L'Intel UHD Graphics 605 è un processore grafico integrato della generazione Gemini Lake (ad esempio Pentium Silver N5000), annunciato alla fine del 2017. La GPU può convincere con valori di consumo bassi, ma le prestazioni sono solo nel segmento di fascia bassa e raramente sono sufficienti per i giochi moderni. Essendo la configurazione massima della GPU Gemini Lake, la UHD Graphics 605 è dotata di 18 Execution Unit (EU) che funzionano fino a 750 MHz. Le specifiche tecniche della GPU sono basate sull'architettura Gen9 di Intel, utilizzata anche per la più costosa serie Skylake e anche nel precedente HD Graphics 505
.
A causa della mancanza di memoria grafica dedicata o cache eDRAM, l'UHD 605 deve accedere alla memoria principale tramite processore (2x 64bit DDR4/LPDDR4-2400).
Performance
La UHD Graphics 605 offre prestazioni simili a quelle della Intel HD Graphics 505 nei SoCs Apollo Lake (stessa architettura Gen 9). Pertanto, la GPU è adatta solo per alcuni giochi molto bassi ed esigenti come Dirt Rally o Sims 4.
Features
Il motore video decodifica H.265/HEVC (8b e 10b) e VP9 completamente con l' hardware. È possibile collegare fino a tre display tramite DP 1.2a/eDP 1.3 o HDMI 2.0a (incluso HDCP 2.2.2).
Consumo Energetico
Il TDP dell'intero chip Pentium Silver N5000 è di 6 Watt di default, quindi la GPU è usata principalmente per netbook (spesso raffreddati passivamente) o notebook sottili. Il TDP può anche essere ridotto a 4,9 Watt, ma questo ovviamente influisce sulle prestazioni.
Gen. 9 Serie
| |||||||||||||||||||||||||||||||||||||||||||
| Nome in codice | Gemini Lake | ||||||||||||||||||||||||||||||||||||||||||
| Architettura | Gen. 9 Apollo Lake | ||||||||||||||||||||||||||||||||||||||||||
| Pipelines | 18 - unified | ||||||||||||||||||||||||||||||||||||||||||
| Velocità del core | 300 - 750 (Boost) MHz | ||||||||||||||||||||||||||||||||||||||||||
| Larghezza del bus di memoria | 64/128 Bit | ||||||||||||||||||||||||||||||||||||||||||
| Tipo di memoria | DDR4 / LPDDR4 | ||||||||||||||||||||||||||||||||||||||||||
| Memoria condivisa | si | ||||||||||||||||||||||||||||||||||||||||||
| API | DirectX 12_1, OpenGL 4.4 | ||||||||||||||||||||||||||||||||||||||||||
| tecnologia | 14 nm | ||||||||||||||||||||||||||||||||||||||||||
| Caratteristiche | QuickSync | ||||||||||||||||||||||||||||||||||||||||||
| Data dell'annuncio | 11.12.2017 | ||||||||||||||||||||||||||||||||||||||||||
| Link alla pagina del produttore | ark.intel.com | ||||||||||||||||||||||||||||||||||||||||||
| ||||||||||||||||||||||||
I seguenti benchmarks deirivano dai benchmarks dei portatili recensiti. Le prestazioni dipendono dalla scheda grafica utilizzata, dal clock rate, dal processore, dai settaggi di sistema, dai drivers, e dai sistemi operativi. Quindi i risultati non sono rappresentativi per i portatili con questa GPU. Per informazioni dettagliate sui risultati del benchmark, cliccate sul numero di fps.


Per conoscere altri giochi che potrebbero essere utilizzabili e per una lista completa di tutti i giochi e delle schede grafiche visitate la nostra Gaming List

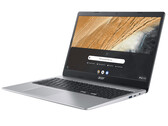
Asus E203MA-FD825TS: Intel Pentium Silver N5000, 11.60", 1 kg
recensione » Recensione del Computer POrtatile Asus E203MA (N5000, UHD605)
Lenovo V130-14IGM: Intel Pentium Silver N5000, 14.00", 1.6 kg
recensione » Recensione del Portatile Lenovo V130-14IGM (Pentium Silver N5000, SSD, HD)
Lenovo Ideapad D330-10IGM: Intel Pentium Silver N5000, 10.10", 1.1 kg
recensione » Recensione del Convertibile Lenovo IdeaPad D330-10IGM (Pentium Silver N5000, eMMC, LTE, WUXGA)
Topjoy Falcon: Intel Pentium Silver N5000, 8.00", 0.7 kg
recensione » Recensione del Convertibile Topjoy Falcon (Prototipo)
Lenovo Yoga 330-11IGM: Intel Pentium Silver N5000, 11.60", 1.3 kg
recensione » Recensione del Portatile Lenovo Yoga 330-11IGM (Pentium N5000)
Acer Swift 1 SF114-32-P8GG: Intel Pentium Silver N5000, 14.00", 1.4 kg
recensione » Recensione del Portatile Acer Swift 1 SF114-32 (N5000, SSD, FHD)
Asus VivoBook 15 X515MA-AH09-CA: Intel Pentium Silver N5030, 15.60", 1.8 kg
Recensioni esterne » Asus VivoBook 15 X515MA-AH09-CA
Lenovo IdeaPad 1 11IGL05, Pentium N5030: Intel Pentium Silver N5030, 11.60", 1.2 kg
Recensioni esterne » Lenovo IdeaPad 1 11IGL05, Pentium N5030
Asus L510MA-DH21: Intel Pentium Silver N5030, 15.60", 1.6 kg
Recensioni esterne » Asus L510MA-DH21
HP Chromebook x360 14a-ca0260nd: Intel Pentium Silver N5030, 14.00", 1.5 kg
Recensioni esterne » HP Chromebook x360 14a-ca0260nd
Acer TravelMate Spin B3 TMB311RN-31-P5KK: Intel Pentium Silver N5030, 11.60", 1.5 kg
Recensioni esterne » Acer TravelMate Spin B3 TMB311RN-31-P5KK
HP Chromebook x360 14a-ca0022nr: Intel Pentium Silver N5000, 14.00", 1.5 kg
Recensioni esterne » HP Chromebook x360 14a-ca0022nr
Acer Chromebook 15 CB315-3HT-P297: Intel Pentium Silver N5030, 15.60", 1.9 kg
Recensioni esterne » Acer Chromebook 15 CB315-3HT-P297
Dell Latitude 11 3190 2-in-1, Pentium N5030: Intel Pentium Silver N5030, 11.60", 1.5 kg
Recensioni esterne » Dell Latitude 11 3190 2-in-1, Pentium N5030
Acer Chromebook 314 C933T-P8SM: Intel Pentium Silver N5030, 14.00", 1.5 kg
Recensioni esterne » Acer Chromebook 314 C933T-P8SM
Lenovo IdeaPad Duet 3i: Intel Pentium Silver N5030, 10.30", 0.6 kg
Recensioni esterne » Lenovo IdeaPad Duet 3i
Lenovo IdeaPad Duet 3 10IGL5-82AT0054SP: Intel Pentium Silver N5030, 10.30", 0.9 kg
Recensioni esterne » Lenovo IdeaPad Duet 3 10IGL5-82AT0054SP
Acer Swift 1 SF114-33-P8Z8: Intel Pentium Silver N5030, 14.00", 1.3 kg
Recensioni esterne » Acer Swift 1 SF114-33-P8Z8
Acer Chromebook 15 CB315-3HT-P297: Intel Pentium Silver N5000, 15.60", 1.6 kg
Recensioni esterne » Acer Chromebook 15 CB315-3HT-P297
Acer Chromebook 314 C933L-P8WA,LTE: Intel Pentium Silver N5030, 14.00", 1.5 kg
Recensioni esterne » Acer Chromebook 314 C933L-P8WA,LTE
HP Chromebook 14a-na0070nd: Intel Pentium Silver N5000, 14.00", 1.5 kg
Recensioni esterne » HP Chromebook 14a-na0070nd
Dell Inspiron 15 3582-6T58P: Intel Pentium Silver N5000, 15.60", 2 kg
Recensioni esterne » Dell Inspiron 15 3582-6T58P
Acer TravelMate B118-M-P385: Intel Pentium Silver N5000, 11.60", 1.5 kg
Recensioni esterne » Acer TravelMate B118-M-P385
Asus X543MA-GQ645T: Intel Pentium Silver N5000, 15.60", 1.9 kg
Recensioni esterne » Asus X543MA-GQ645T
Lenovo V130-15IGM-81HL004HGE: Intel Pentium Silver N5000, 15.60", 1.9 kg
Recensioni esterne » Lenovo V130-15IGM-81HL004HGE
Acer Aspire 1 A114-32-P0K1: Intel Pentium Silver N5000, 14.00", 1.7 kg
Recensioni esterne » Acer Aspire 1 A114-32-P0K1
HP Chromebook x360 12b-ca0350nd: Intel Pentium Silver N5000, 12.00", 1.4 kg
Recensioni esterne » HP Chromebook x360 12b-ca0350nd
Acer Aspire A315-34-P3LC: Intel Pentium Silver N5000, 15.60", 1.9 kg
Recensioni esterne » Acer Aspire A315-34-P3LC
Asus Vivobook X507MA-BR316T: Intel Pentium Silver N5000, 15.60", 1.7 kg
Recensioni esterne » Asus Vivobook X507MA-BR316T
Acer Swift 1 SF114-32-P7FA: Intel Pentium Silver N5000, 14.00", 1.3 kg
Recensioni esterne » Acer Swift 1 SF114-32-P7FA
Lenovo Ideapad D330-10IGM-81H3001PSP: Intel Pentium Silver N5000, 10.10", 1.1 kg
Recensioni esterne » Lenovo Ideapad D330-10IGM-81H3001PSP
HP 15-da0000: Intel Pentium Silver N5000, 15.60", 2.1 kg
Recensioni esterne » HP 15-da0000
Acer TravelMate B1 TMB118-M-P385: Intel Pentium Silver N5000, 11.60", 1.5 kg
Recensioni esterne » Acer TravelMate B1 TMB118-M-P385
Asus VivoBook 17 F705MA-BX029T: Intel Pentium Silver N5000, 17.30", 2.1 kg
Recensioni esterne » Asus VivoBook 17 F705MA-BX029T
Medion Akoya E4271: Intel Pentium Silver N5000, 14.00", 1.7 kg
Recensioni esterne » Medion Akoya E4271
Asus E203MA-FD825TS: Intel Pentium Silver N5000, 11.60", 1 kg
Recensioni esterne » Asus E203MA-FD825TS
Asus X540MA-DM278T: Intel Pentium Silver N5000, 15.60", 1.9 kg
Recensioni esterne » Asus X540MA-DM278T
Medion Akoya E4253-30024991: Intel Pentium Silver N5000, 14.00", 1.4 kg
Recensioni esterne » Medion Akoya E4253-30024991
Medion Akoya E6246-MD63200: Intel Pentium Silver N5000, 15.60", 1.7 kg
Recensioni esterne » Medion Akoya E6246-MD63200
Trekstor Primebook U13B-PO: Intel Pentium Silver N5000, 13.30", 1.3 kg
Recensioni esterne » Trekstor Primebook U13B-PO
Acer Swift 1 SF114-32-P60X: Intel Pentium Silver N5000, 14.00", 1.4 kg
Recensioni esterne » Acer Swift 1 SF114-32-P60X
Lenovo Ideapad D330-10IGM: Intel Pentium Silver N5000, 10.10", 1.1 kg
Recensioni esterne » Lenovo Ideapad D330-10IGM
Lenovo Yoga 330-11IGM: Intel Pentium Silver N5000, 11.60", 1.3 kg
Recensioni esterne » Lenovo Yoga 330-11IGM
Acer Swift 1 SF114-32-P8GG: Intel Pentium Silver N5000, 14.00", 1.4 kg
Recensioni esterne » Acer Swift 1 SF114-32-P8GG
Acer Swift 1 SF114-32-P57N: Intel Pentium Silver N5000, 14.00", 1.4 kg
Recensioni esterne » Acer Swift 1 SF114-32-P57N
Posizione approssimativa dell'adattatore grafico
I nostri Top 10
» Top 10 Portatili Multimedia
» Top 10 Portatili Gaming
» Top 10 Portatili Gaming Leggeri
» Top 10 Portatili da Ufficio e Business economici
» Top 10 Portatili Premium da Ufficio/Business
» Top 10 Portatili sotto i 300 Euro
» Top 10 Portatili sotto i 500 Euro
» Top 10 dei Portatili Workstation
» Top 10 Subnotebooks
» Top 10 Ultrabooks
» Top 10 Convertibili
» Top 10 Tablets
» Top 10 Tablets Windows
» Top 10 Smartphones