Intel HD Graphics 4200
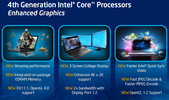
L'Intel HD Graphics 4200 (GT2) è una scheda grafica integrata su alcuni processori ULV Haswell del 2013 (core di quarta generazione). Il clock base relativamente basso può effettuare l'overclock automatico usando la tecnologia Turbo Boost.
In confronto alla HD 4000, il core grafico è stato modificato in molti dettagli. La GPU supporta DirectX 11.1, OpenCL 1.2 ed OpenGL 4.0. Inoltre sfrutta un decoder migliorato per i videos 4K ed un veloce encoder Quick Sync.
Le prestazioni della HD Graphics 4200 sono nettamente inferiori alle HD 4600 ed HD 4400, in quanto la GPU è progettata per modelli ULV della serie Y (11.5 W). Pertanto, i clock rates sono relativamente bassi. Rispetto ad una HD 4000 con clock simile, la HD 4200 è leggermente più veloce grazie ai miglioramenti dell'architettura ed al numero superiore di execution units: la versione GT2 integra 20 EUs, rispetto alle 16 EUs della vecchia HD 4000.
Con i giochi semplici come Anno 2070 o Counter Strike: Global Offensive, le prestazioni sono sufficienti a gestire settaggi bassi e risoluzione 1024 x 768 pixels. Molti titoli attuali come Battlefield 4, tuttavia, non sono giocabili nemmeno con qualità grafica minima. Di seguito troverete dei benchmarks dettagliati.
Grazie al processo di produzione in 22nm 3D Tri-Gate, il consumo energetico è relativamente basso ed adatto anche per i tablets. In aggiunta al TDP da 11.5 watts, le CPUs della serie Y hanno un SDP (consumo energetico medio) di 4.5 o 6 watts (in base al modello).
HD Graphics Serie
| ||||||||||||||||||||||||||||||||||||||||||||||||||||||||||||||||||||||
| Nome in codice | Haswell GT2 | |||||||||||||||||||||||||||||||||||||||||||||||||||||||||||||||||||||
| Architettura | Gen. 7.5 Haswell | |||||||||||||||||||||||||||||||||||||||||||||||||||||||||||||||||||||
| iGPU | Integrated Graphics | |||||||||||||||||||||||||||||||||||||||||||||||||||||||||||||||||||||
| Pipelines | 20 - unified | |||||||||||||||||||||||||||||||||||||||||||||||||||||||||||||||||||||
| Velocità del core | 200 - 850 (Boost) MHz | |||||||||||||||||||||||||||||||||||||||||||||||||||||||||||||||||||||
| Larghezza del bus di memoria | 64/128 Bit | |||||||||||||||||||||||||||||||||||||||||||||||||||||||||||||||||||||
| Memoria condivisa | si | |||||||||||||||||||||||||||||||||||||||||||||||||||||||||||||||||||||
| API | DirectX 11.1, Shader 5.0, OpenGL 4.0 | |||||||||||||||||||||||||||||||||||||||||||||||||||||||||||||||||||||
| tecnologia | 22 nm | |||||||||||||||||||||||||||||||||||||||||||||||||||||||||||||||||||||
| Caratteristiche | QuickSync | |||||||||||||||||||||||||||||||||||||||||||||||||||||||||||||||||||||
| Data dell'annuncio | 05.06.2013 | |||||||||||||||||||||||||||||||||||||||||||||||||||||||||||||||||||||
| ||||||||||||||||||||||||
Benchmark
3DM Vant. Perf. total +
Cinebench R15 OpenGL 64 Bit +
GFXBench T-Rex HD Offscreen C24Z16 +
* Numeri più piccoli rappresentano prestazioni supeiori
Benchmarks per i giochi
I seguenti benchmarks deirivano dai benchmarks dei portatili recensiti. Le prestazioni dipendono dalla scheda grafica utilizzata, dal clock rate, dal processore, dai settaggi di sistema, dai drivers, e dai sistemi operativi. Quindi i risultati non sono rappresentativi per i portatili con questa GPU. Per informazioni dettagliate sui risultati del benchmark, cliccate sul numero di fps.

XCOM 2
2016
Rainbow Six Siege
2015
Just Cause 3
2015
Anno 2205
2015
World of Warships
2015
Metal Gear Solid V
2015
The Witcher 3
2015
Dirt Rally
2015
The Crew
2014
Far Cry 4
2014
F1 2014
2014
The Evil Within
2014
Ryse: Son of Rome
2014
Alien: Isolation
2014
Fifa 15
2014
Sims 4
2014
Risen 3: Titan Lords
2014
GRID: Autosport
2014
Watch Dogs
2014
Thief
2014
X-Plane 10.25
2013
Call of Duty: Ghosts
2013
Battlefield 4
2013
F1 2013
2013
Fifa 14
2013
Total War: Rome II
2013
Saints Row IV
2013
Company of Heroes 2
2013
Metro: Last Light
2013
BioShock Infinite
2013
SimCity
2013
Tomb Raider
2013
Crysis 3
2013
Dead Space 3
2013
Far Cry 3
2012
Hitman: Absolution
2012
Dishonored
2012
Fifa 13
2012
Borderlands 2
2012
Guild Wars 2
2012
Counter-Strike: GO
2012
Sleeping Dogs
2012
Dirt Showdown
2012
Diablo III
2012
Mass Effect 3
2012
Alan Wake
2012
Anno 2070
2011
Battlefield 3
2011
Dirt 3
2011Per conoscere altri giochi che potrebbero essere utilizzabili e per una lista completa di tutti i giochi e delle schede grafiche visitate la nostra Gaming List
Recensioni Notebook con Intel HD Graphics 4200 la scheda grafica

Recensione breve dell'Acer Aspire Switch 11 SW5-171-31U3 aggiornamento
Recensione breve del convertibile Acer Aspire Switch 11 Pro 128GB HDD Dock
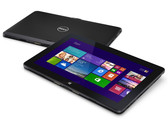
Aggiornamento recensione Tablet Dell Venue 11 Pro 7130
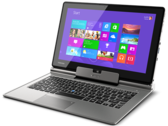
Recensione breve del convertibile Toshiba Portégé Z10t-A2111
HP Split x2 13-m210eg: Intel Core i5-4210Y, 13.30", 2.2 kg
recensione » Recensione breve del convertibile HP Split x2 13-m210eg
Lenovo Miix 2 11: Intel Core i3-4012Y, 11.60", 1.4 kg
recensione » Recensione breve convertibile Lenovo Miix 2 11
Toshiba Satellite W30t-A-101: Intel Core i3-4020Y, 13.30", 2.1 kg
recensione » Recensione Breve Aggiornamento Convertibile Toshiba Satellite W30t-A-101
HP Pro X2 410 G1: Intel Core i5-4202Y, 11.60", 1.6 kg
recensione » Recensione breve del Convertibile HP Pro X2 410 G1
Dell XPS 11: Intel Core i5-4210Y, 11.60", 1.1 kg
recensione » Recensione breve del Convertibile Dell XPS 11-9P33
Sony Vaio Tap 11 SVT-1121G4E/B: Intel Core i5-4210Y, 11.60", 1.1 kg
recensione » Recensione breve del Tablet Sony Vaio Tap 11 SVT-1121G4E/B
HP Spectre 13-h205eg x2: Intel Core i5-4202Y, 13.30", 2 kg
recensione » Recensione breve del Convertibile HP Spectre 13-h205eg x2
Motion R12: Intel Core i7-4610Y, 12.50", 1.4 kg
Recensioni esterne » Motion R12
Acer Aspire Switch 11 SW5-171-31U3: Intel Core i3-4012Y, 11.60", 1.6 kg
Recensioni esterne » Acer Aspire Switch 11 SW5-171-31U3
Acer Aspire Switch 11 SW5-171-325N: Intel Core i3-4012Y, 11.60", 1.5 kg
Recensioni esterne » Acer Aspire Switch 11 SW5-171-325N
Acer Aspire Switch 11 SW5-171-80KM: Intel Core i5-4202Y, 11.60", 1.6 kg
Recensioni esterne » Acer Aspire Switch 11 SW5-171-80KM
Lenovo IdeaPad Yoga 11S-59393621: Intel Core i3-4020Y, 11.60", 1.4 kg
Recensioni esterne » Lenovo IdeaPad Yoga 11S-59393621
Acer Aspire Switch 11 SW5-171-39LB: Intel Core i3-4012Y, 11.60", 1.5 kg
Recensioni esterne » Acer Aspire Switch 11 SW5-171-39LB
HP Pro X2 612 G1: Intel Core i3-4012Y, 12.50", 1.9 kg
Recensioni esterne » HP Pro X2 612 G1
Dell Venue 11 Pro 7000: Intel Core i3-4020Y, 10.80", 0.7 kg
Recensioni esterne » Dell Venue 11 Pro 7000
Toshiba Portege Z10t-A X0432: Intel Core i5-4210Y, 11.60", 1.4 kg
Recensioni esterne » Toshiba Portege Z10t-A X0432
HP Split 13-m200er x2: Intel Core i3-4020Y, 13.30", 1.1 kg
Recensioni esterne » HP Split 13-m200er x2
HP Pro X2 410 G1: Intel Core i5-4202Y, 11.60", 1.6 kg
Recensioni esterne » HP Pro X2 410 G1
HP Split 13-m100er x2: Intel Core i3-4010Y, 13.30", 2.2 kg
Recensioni esterne » HP Split 13-m100er x2
Lenovo Miix 2 11: Intel Core i3-4012Y, 11.60", 0.8 kg
Recensioni esterne » Lenovo Miix 2 11
Toshiba Portege Z10t-A2111: Intel Core i7-4610Y, 11.60", 1.4 kg
Recensioni esterne » Toshiba Portege Z10t-A2111
Panasonic ToughPad FZ-M1: Intel Core i5-4302Y, 7.00", 0.5 kg
Recensioni esterne » Panasonic ToughPad FZ-M1
Sony VAIO SVT1122X9R: Intel Core i5-4210Y, 11.60", 0.8 kg
Recensioni esterne » Sony VAIO SVT1122X9R
Sony Vaio Tap 11 SV-T1121A4E: Intel Core i3-4020Y, 11.60", 0.8 kg
Recensioni esterne » Sony Vaio Tap 11 SV-T1121A4E
HP Spectre 13t-h200 x2: Intel Core i5-4202Y, 13.30", 2 kg
Recensioni esterne » HP Spectre 13t-h200 x2
HP Spectre 13-h211nr x2: Intel Core i5-4202Y, 13.30", 2 kg
Recensioni esterne » HP Spectre 13-h211nr x2
HP Spectre 13-h205eg x2: Intel Core i5-4202Y, 13.30", 2 kg
Recensioni esterne » HP Spectre 13-h205eg x2
Toshiba Satellite W30t-A-101: Intel Core i3-4020Y, 13.30", 1 kg
Recensioni esterne » Toshiba Satellite W30t-A-101
Dell Venue 11 Pro: Intel Core i3-4020Y, 10.80", 1.5 kg
Recensioni esterne » Dell Venue 11 Pro
Dell XPS 11: Intel Core i5-4210Y, 11.60", 1.1 kg
Recensioni esterne » Dell XPS 11
HP Split 13-M170EF x2: Intel Core i3-4010Y, 13.30", 2.2 kg
Recensioni esterne » HP Split 13-M170EF x2
Toshiba Satellite W30t-A-101: Intel Core i3-4020Y, 13.30", 2.1 kg
Recensioni esterne » Toshiba Satellite W30t


