Notebookcheck Logo

NVIDIA GeForce 9800M GT
NVIDIA GeForce 9800M GT

La scheda grafica Nvidia GeForce 9800M GT è basata sul core G92 ma caratterizzata da soli 96 shader (la GTX ne ha 112). La 9800 GT è costruita con una tecnologia da 65 nm e simile alla 8800M GTX (stesso numero di shader). Il chip è destinato a portatili che sostituiscono sistemi desktop.


Come tutte le schede DirectX10, la GeForce 9800 GTX ultilizza i "Unified Shaders" per rendering delle immagini 3D. Non ci sono pixel- e vertex shader dedicati ma i 96 cosi chiamati processori stream fanno tutto il lavoro grafico (nel passato questo lavoro veniva svolto dai pixel- e vertex shader). Inoltre, le unità shader sono overclockate rispetto al chip.


Un vantaggio della serie GeForce 9000 è il processore video integrato PureVideo HD. È in grado di decodificare video in formato H.264-, VC-1-, MPEG2- e WMV9 e semplificando il lavoro della CPU.

Grazie alla scheda grafica integrata Nvidia 9100M, la 9800M GTX supporta Hybrid-SLI (solo HybridPower). HybridPower permette di scegliere tra la scheda integrata o la scheda grafica dedicata, se le performance o il risparmio energetico lo richiedono. Questo funziona solo con Windows Vista. Al momento l'utente per passare da una scheda grafica ad un altra deve usare un programma. Nel futuro Nvidia fare fare tutto il lavoro alla scheda grafica lasciando comunque all'utente di scegliere. GeForceBoost non è supportato da questa scheda, e non ci saranno incrementi di prestazioni combinando la CPU e la 9800M GT.

Compared to desktop graphic cards, the 9800M GT is similar to the GeForce 8800 GS (which features a higher memory clock rate and is therefore a bit faster).

Se la confrontassimo con le schede grafiche per i desktop, la 9800M GT dovrebbe essere simile alla GeForce 8800 GS (la quale ha un clock rate della memoria più alto e quindi lievemente più veloce)

GeForce 9800M Serie

GeForce 9800M GT SLI 192 @ 0.5 GHz256 Bit @ 800 MHz
GeForce 9800M GTS SLI 128 @ 0.6 GHz256 Bit @ 800 MHz
GeForce 9800M GTX 112 @ 0.5 GHz256 Bit @ 800 MHz
GeForce 9800M GT 96 @ 0.5 GHz256 Bit @ 800 MHz
GeForce 9800M GTS 64 @ 0.6 GHz256 Bit @ 800 MHz
GeForce 9800M GS 64 @ 0.53 GHz256 Bit @ 800 MHz
Nome in codiceNB9E-GT2
ArchitetturaG9x
Pipelines96 - unified
Velocità del core500 MHz
Velocità de Shader1250 MHz
Velocità della memoria800 MHz
Larghezza del bus di memoria256 Bit
Tipo di memoriaGDDR3
Max. quantità di memoria512 MB
Memoria condivisano
APIDirectX 10, Shader 4.0
Consumo di corrente65 Watt
Transistor Count754 Milioni
tecnologia65 nm
CaratteristichePureVideo HD, CUDA, PhysX-ready, Hybrid-SLI (HybridPower)
Dimensione del portatilegrande
Data dell'annuncio15.07.2008
InformazioniMXM 3
Link alla pagina del produttorehttp://www.nvidia.com/object/geforce_980...

Benchmark

3DMark Vantage
3DM Vant. Perf. total +
3DMark Vantage - 3DM Vant. Perf. total
4011 Points (1%)
3DM Vant. Perf. GPU no PhysX +
3DMark Vantage - 3DM Vant. Perf. GPU no PhysX
3725 Points (2%)
62 -98%
...
3544 -5%
3592 -4%
AMD Radeon HD 6720G2
3600 -3%
3610 -3%
3639 -2%
3647 -2%
3677 -1%
3679 -1%
3700 -1%
NVIDIA GeForce 9800M GT
3725
3741 0%
3750 1%
AMD Radeon HD 6730M
3752 1%
3804 2%
3858 4%
3860 4%
3866 4%
3868 4%
3881 4%
...
NVIDIA GeForce RTX 4090 Laptop GPU
132443 3456%
0%
100%
3DMark 2001SE - 3DMark 2001 - Standard
min: 34871     media: 35285     media: 35284.5 (37%)     massimo: 35698 Points
3DMark 03 - 3DMark 03 - Standard
min: 30129     media: 30224     media: 30223.5 (16%)     massimo: 30318 Points
3DMark 05 - 3DMark 05 - Standard
min: 14713     media: 14869     media: 14869 (16%)     massimo: 15025 Points
Intel Graphics Media Accelerator (GMA) 500
133.4 -99%
...
14352 -3%
14377 -3%
14502 -2%
14510 -2%
14564 -2%
14733 -1%
14773 -1%
14777 -1%
14855 0%
NVIDIA GeForce 9800M GT
14869
AMD Radeon R7 M260
14924 0%
14938 0%
14952 1%
AMD Radeon HD 6750M
15011 1%
15058 1%
15064 1%
15249 3%
15284 3%
15365 3%
...
55811 275%
0%
100%
3DMark 06 3DMark 06 - Standard 1280x1024 +
3DMark 06
min: 9228     media: 9416     media: 9258 (13%)     massimo: 9762 Points
Cinebench R10 Cinebench R10 Shading (32bit) +
Cinebench R10 - Cinebench R10 Shading (32bit)
min: 4460     media: 4527     media: 4526.5 (3%)     massimo: 4593 punti
- Valori di benchmark per questa scheda grafica
- Valori medi di benchmark per questa scheda grafica
* Numeri più piccoli rappresentano prestazioni supeiori

Benchmarks per i giochi

I seguenti benchmarks deirivano dai benchmarks dei portatili recensiti. Le prestazioni dipendono dalla scheda grafica utilizzata, dal clock rate, dal processore, dai settaggi di sistema, dai drivers, e dai sistemi operativi. Quindi i risultati non sono rappresentativi per i portatili con questa GPU. Per informazioni dettagliate sui risultati del benchmark, cliccate sul numero di fps.

Crysis - GPU Benchmark

Crysis - GPU Benchmark

2007
basso 1024x768
67.3 98.4 ~ 83 fps    + Confronta
medio 1024x768
49.8 55.6 ~ 53 fps    + Confronta
alto 1024x768
33.1 35.5 ~ 34 fps    + Confronta
» Giocabile con tutti i portatili testati con dettagli medio.
Additional Benchmarks
Low 0xAF 0xAA 1280x800
56
Medium 0xAF 0xAA 1280x800
40.7
Low 0xAF 0xAA 1440x900
55.4
Medium 0xAF 0xAA 1440x900
37.3
High 1280x800
27.4
High 800x600
41.5
High 1440x900
24
High 1680x1050
19.2
Medium 1680x1050
31
Low 1680x1050
51.5
Low 0xAF 0xAA 800x600
67.9
Med 0xAF 0xAA 800x600
53.9
Very High 1024x768
20.7
Crysis - CPU Benchmark

Crysis - CPU Benchmark

2007
basso 1024x768
75.3 115.9 ~ 96 fps    + Confronta
medio 1024x768
46.1 52.2 ~ 49 fps    + Confronta
alto 1024x768
30.9 33.1 ~ 32 fps    + Confronta
» Giocabile con tutti i portatili testati con dettagli medio.
Additional Benchmarks
Low 0xAF 0xAA 1280x800
61.7
Medium 0xAF 0xAA 1280x800
39.5
Low 0xAF 0xAA 1440x900
59.1
Medium 0xAF 0xAA 1440x900
36.9
High 1440x900
22.8
Low 1680x1050
55
Medium 1680x1050
31.5
High 1680x1050
18.6
High 0xAF 0xAA 1280x800
26.1
Med 0xAF 0xAA 800x600
51.5
Low 0xAF 0xAA 800x600
78.1
High 0xAF 0xAA 800x600
39.3
Very High 1024x768
19
World in Conflict - Benchmark

World in Conflict - Benchmark

2007
medio 1024x768
66  fps    + Confronta
alto 1024x768
37  fps    + Confronta
» Giocabile con tutti i portatili testati con dettagli alto.
Additional Benchmarks
Medium 0xAF 0xAA 1280x800
64
High 2xAF 2xAA 1280x800
36
Medium 0xAF 0xAA 1440x900
62
High 2xAF 2xAA 1440x900
32
F.E.A.R.

F.E.A.R.

2005
basso 640x480
551 558 ~ 555 fps    + Confronta
medio 800x600
273 274 ~ 274 fps    + Confronta
alto 1024x768
117 118 ~ 118 fps    + Confronta
» Giocabile con tutti i portatili testati con dettagli alto.
Doom 3

Doom 3

2004
basso 640x480
150.9  fps    + Confronta
medio 640x480
146.2  fps    + Confronta
alto 800x600
144.9  fps    + Confronta
ultra 1024x768
141.1  fps    + Confronta
» Giocabile con tutti i portatili testati con dettagli ultra.
Quake 3 Arena - Timedemo

Quake 3 Arena - Timedemo

1999
alto 1024x768
624  fps    + Confronta
» Giocabile con tutti i portatili testati con dettagli alto.

Per conoscere altri giochi che potrebbero essere utilizzabili e per una lista completa di tutti i giochi e delle schede grafiche visitate la nostra Gaming List

v1.22
log 30. 12:03:09

#0 no ids found in url (should be separated by "_") +0s ... 0s

#1 not redirecting to Ajax server +0s ... 0s

#2 did not recreate cache, as it is less than 5 days old! Created at Wed, 29 Mar 2023 14:23:56 +0200 +0.001s ... 0.001s

#3 no comparison url found in template nbc.compare_page_1 needed +0.036s ... 0.038s

#4 no comparison url found in template nbc.compare_page_1 needed +0s ... 0.038s

#5 no comparison url found in template nbc.compare_page_1 needed +0s ... 0.038s

#6 no comparison url found in template nbc.compare_page_1 needed +0s ... 0.038s

#7 no comparison url found in template nbc.compare_page_1 needed +0s ... 0.039s

#8 composed specs +0s ... 0.039s

#9 did output specs +0s ... 0.039s

#10 start showIntegratedCPUs +0s ... 0.039s

#11 getting avg benchmarks for device 773 +0.012s ... 0.051s

#12 got single benchmarks 773 +0.014s ... 0.065s

#13 got avg benchmarks for devices +0s ... 0.065s

#14 min, max, avg, median took s +0.114s ... 0.179s

#15 before gaming benchmark output +0s ... 0.179s

#16 Got 25 rows for game benchmarks. +0.003s ... 0.182s

#17 composed SQL query for gamebenchmarks +0s ... 0.182s

#18 got data and put it in $dataArray +0.003s ... 0.184s

#19 benchmarks composed for output. +0.103s ... 0.288s

#20 no comparison url found in template nbc.compare_page_1 needed +0.003s ... 0.29s

#21 return log +0s ... 0.29s

Prestazioni di gioco

Questi test sono stati svolti con un portatile high end (quad-core CPU), perciò le performance con portatili non cosi performanti potrebbero decrescere.

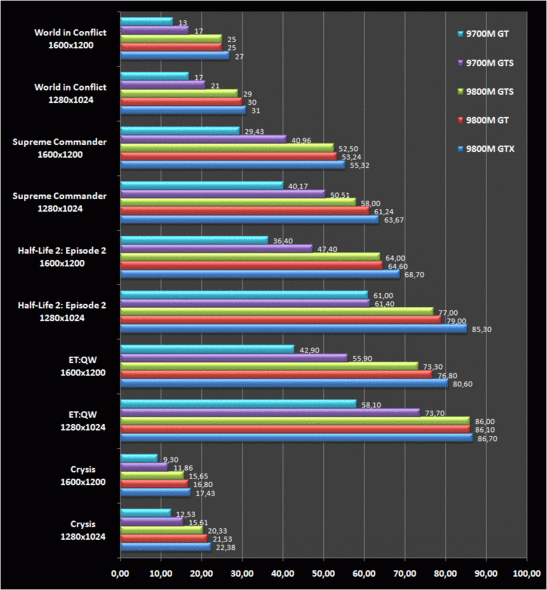
Crysis: 1280x1024, very high: 21 fps -> non giocabile (in high giocabile)
Enemy Territory: Quake Wars: 1600x1200: 76 fps -> giocabile in modo fluido
Half Life 2 - Episode 2: 1600x1200: 64 fps -> giocabile in modo fluido
Supreme Commander: 1600x1200: 53 fps -> giocabile in modo fluido
World in Conflict: 1280x1024: 30 fps -> giocabile

GeForce 9M Serie im Vergleich (Daten von Nvidia mit Desktop Q6600 CPU)

Recensioni Notebook con NVIDIA GeForce 9800M GT la scheda grafica

Packard Bell iPower GX-Q-030: Intel Core 2 Quad Q9000, 17.00", 4.1 kg
  Recensioni esterne » Packard Bell iPower GX-Q-030

Please share our article, every link counts!
.170
Plugin with layout 0 not found, please try 'no Cache' version of the FE Plugin

Classe 1

NVIDIA GeForce RTX 4090 Laptop GPU
NVIDIA GeForce RTX 4080 Laptop GPU
NVIDIA GeForce RTX 4070 Laptop GPU
GeForce RTX 3080 Laptop GPU
RTX A4500 Laptop GPU
NVIDIA GeForce RTX 4060 Laptop GPU
GeForce RTX 2080 Super Mobile
GeForce RTX 3070 Laptop GPU
Radeon RX 7600M XT *
Radeon RX 7700S *

Classe 2

M2 Max 38-Core GPU *
M1 Max 32-Core GPU *
M2 Max 30-Core GPU *
Radeon RX 7600M *
GeForce RTX 3060 Laptop GPU
GeForce RTX 2070 Super Mobile
Radeon RX 7600S *
M1 Max 24-Core GPU *
Radeon RX 6650M XT *
M2 Pro 19-Core GPU *
Radeon RX 5700M *
M2 Pro 16-Core GPU *
M1 Pro 16-Core GPU *
A730M *
Radeon PRO W6600M *
GeForce RTX 2070 Super Max-Q
M1 Pro 14-Core GPU *
Radeon RX 6600S *
Quadro P4200
NVIDIA GeForce RTX 4050 Laptop GPU
GeForce RTX 3050 6GB Laptop GPU
Quadro P5000 Max-Q *
GeForce RTX 3050 4GB Laptop GPU
Radeon RX 6550M *
Radeon RX 6550S *
A370M *
Quadro P4000 Max-Q
Radeon RX 580X (Laptop) *
Radeon RX 580 (Laptop)
Radeon RX 6450M *
Radeon RX 6300M *
Radeon Pro 5300M
Radeon RX 5300M
Quadro P3000 Max-Q *
Radeon Pro WX 7100 *
Radeon RX 570X (Laptop) *
Radeon RX 570 (Laptop) *
Radeon RX 470 (Laptop) *

Classe 3

GeForce GTX 1050 Ti Mobile
Radeon 780M *
Radeon 680M
Quadro P2000 Max-Q
Radeon R9 M395X
GeForce GTX 1050 Ti Max-Q *
WX Vega M GL
Radeon R9 M485X
GeForce GTX 1050 Max-Q *
Radeon RX 560X (Laptop)
Radeon RX 560 (Laptop)
Radeon Pro 560X
Radeon Pro 560
Radeon Pro 460
Radeon Pro WX 4130 *
Quadro P620 *
Radeon RX 550X (Laptop)
Radeon Pro 555X
Radeon Pro 555
Radeon Pro 455
Quadro P600
Radeon 760M *
Radeon 660M
Radeon RX 540X *
Radeon Pro WX 2100 *
Radeon Pro WX 3100 *
Radeon Pro 450
Radeon 630
Radeon 540X *
Quadro P520
Quadro P500 *
Iris Plus Graphics G7 (Ice Lake 64 EU) *
Vega 10 *
Iris Pro Graphics 580
Vega 9
FirePro W5130M
UHD Graphics Xe G4 48EUs *
UHD Graphics Xe 32EUs (Tiger Lake-H) *
UHD Graphics 750
Vega 7
Radeon R7 M465
Vega 8
Iris Plus Graphics G4 (Ice Lake 48 EU)
Quadro M600M
FirePro W4190M
Radeon R7 M445
UHD Graphics Xe 24EUs *
Radeon R7 M340
Radeon 610M *
UHD Graphics G1 (Ice Lake 32 EU)
UHD Graphics Xe 16EUs (Tiger Lake-H) *
Radeon R5 (Bristol Ridge)
Adreno 690 *
Adreno 685 *
Adreno 680 *

Classe 4

UHD Graphics 730
Radeon R5 M315 *
Radeon R5 M420 *
UHD Graphics 617
UHD Graphics 615
UHD Graphics (Jasper Lake 24 EU) *
Radeon R4 (Stoney Ridge)
Radeon R2 (Stoney Ridge)
HD Graphics (Broadwell)

Classe 5

Posizione approssimativa dell'adattatore grafico

> Recensioni e prove di notebook, tablets e smartphones > Info Techniche / Tips > Confronto delle schede video > NVIDIA > NVIDIA GeForce 9800M GT
Klaus Hinum, 2008-10-10 (Update: 2014-09-19)