Recensioni Notebook con NVIDIA GeForce MX130 la scheda grafica
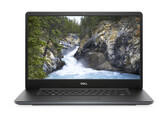
Recensione del Computer Portatile Dell Vostro 15-5581: Un portatile da ufficio con una MX130 che consente un gaming leggero
Il nome Vostro è stato per anni sinonimo della serie di computer portatili economici di Dell. L'azienda ha dato al vecchio cavallo da lavoro un aggiornamento hardware e ha risolto parte dei problemi, ma rimangono alcune decisioni discutibili.
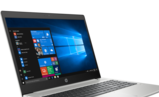
Intel Core i5-8265U, NVIDIA GeForce MX130, 15.6", 2 kgRecensione del Computer Portatile HP ProBook 450 G6 (Core i7-8565U, GeForce MX130)
Abbiamo recentemente coperto diversi computer portatili della serie HP ProBook 400, tra cui il 440 G6 e il 430 G6. Ora è la volta del ProBook 450 G6, la versione da 15 pollici della gamma entry-level business-laptop di HP. L'azienda ha dotato il nostro dispositivo di test con un processore Intel Core i7 e una GPU Nvidia GeForce MX130 che promette di essere un buon pacchetto completo, almeno sulla carta. Continuate a leggere per scoprire se il ProBook 450 G6 migliora rispetto al suo predecessore e se è in grado di sfidare altri affermati laptop aziendali da 15,6 pollici.
Intel Core i7-8565U, NVIDIA GeForce MX130, 15.6", 2 kgRecensione del Portatile Acer TravelMate X3410 (i7, MX130, FHD)
Nel mercato dei laptop aziendali, evitare Dell, Lenovo o HP è difficilmente possibile, ma Acer vuole avere un pezzo di quel segmento di mercato. L'Acer TravelMate X3410 è fatto per attrarre i clienti business, ma sarà in grado di sconfiggere la concorrenza consolidata? Per saperne di più, leggete questa recensione approfondita.
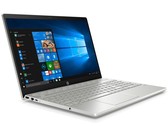
Intel Core i7-8550U, NVIDIA GeForce MX130, 14", 1.7 kgRecensione del Portatile HP Pavilion 15 (Core i5-8250U, NVIDIA MX130)
Dopo aver esaminato la variante AMD dell'HP Pavilion 15, abbiamo ora la versione Intel Core i5 con una GPU NVIDIA GeForce MX130 per i test. Il design rimane lo stesso ed è rifinito con un'alta qualità. Continuate a leggere per scoprire cosa aspettarvi dalla variante Intel del Pavilion 15 e come si pone rispetto al modello AMD.
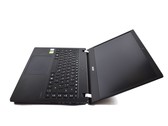
Intel Core i5-8250U, NVIDIA GeForce MX130, 15.6", 1.9 kgRecensione Del Convertibile Lenovo Flex 5 15 (i7-8550U, GeForce MX130)
Non cosi' flessibile. Il Flex 5 di Lenovo e' un economico 2-in-1 con un bell' aspetto e una buona disponibilita' di porte integrate, allettante per la cifra richiesta. Sfortunatamente, il display poco luminoso e una prestazione in Turbo Boost deludente lasciano l' amaro in bocca.
Intel Core i7-8550U, NVIDIA GeForce MX130, 15.6", 2 kgAcer TravelMate P2510-G2-MG-50WE: Intel Core i5-8250U, 15.60", 2.1 kg
recensione » Recensione del Laptop Acer TravelMate P2510 (i5-8250U, MX130)
Acer TravelMate 2410-G2-MG-82E6: Intel Core i7-8550U, 14.00", 1.8 kg
recensione » Recensione del Portatile Acer TravelMate P2410 (i7-8550U, MX130)
Dell Latitude 5491: Intel Core i7-8850H, 14.00", 1.8 kg
recensione » Recensione del portatile Dell Latitude 5491 (8750H, MX130, Touchscreen)
Dell Latitude 5591: Intel Core i7-8850H, 15.60", 2.3 kg
recensione » Recensione del Portatile Dell Latitude 5591 (8750H, MX130, Touchscreen)
Lenovo Flex 6-14IKB: Intel Core i5-8250U, 14.00", 1.7 kg
recensione » Recensione del Convertibile Lenovo Flex 6-14IKB (i5 8250U, GeForce MX130)
Asus VivoBook 15 F510UF-ES71: Intel Core i7-8550U, 15.60", 1.6 kg
recensione » Recensione del Portatile Asus VivoBook 15 F510UF (i7-8550U, GeForce MX130)
Asus VivoBook 15 X542UF-DM143T: Intel Core i5-8250U, 15.60", 2.3 kg
recensione » Recensione del Portatile ASUS VivoBook 15 X542UF (i5-8250U, MX130, SSD, FHD)
Acer Aspire 5 A515-51G-509A: Intel Core i5-8250U, 15.60", 2.2 kg
recensione » Recensione del Portatile Acer Aspire 5 A515-51G-509A (8250U, MX130, FHD)
Lenovo IdeaPad 3 14IML05-81WA005VAU: Intel Core i3-10110U, 14.00", 1.6 kg
Recensioni esterne » Lenovo IdeaPad 3 14IML05-81WA005VAU
HP Pavilion 14-ce3003ns: Intel Core i5-1035G1, 14.00", 1.6 kg
Recensioni esterne » HP Pavilion 14-ce3003ns
HP 15-da1017ns: Intel Core i7-8565U, 15.60", 1.8 kg
Recensioni esterne » HP 15-da1017ns
Acer Aspire 5 A517-51G-87A7: Intel Core i7-8550U, 17.30", 3 kg
Recensioni esterne » Acer Aspire 5 A517-51G-87A7
Acer Aspire 3 A315-53G-888K: Intel Core i7-8550U, 15.60", 2.1 kg
Recensioni esterne » Acer Aspire 3 A315-53G-888K
Acer Aspire 3 A315-53G-5947: Intel Core i5-8250U, 15.60", 2.1 kg
Recensioni esterne » Acer Aspire 3 A315-53G-5947
Lenovo Ideapad 530s-14IKB-81EU00LASP: Intel Core i5-8250U, 14.00", 1.6 kg
Recensioni esterne » Lenovo Ideapad 530s-14IKB-81EU00LASP
HP Pavilion 15-cs2026ng: Intel Core i5-8265U, 15.60", 1.9 kg
Recensioni esterne » HP Pavilion 15-cs2026ng
Asus Vivobook X507UF-EJ171T: Intel Core i3-8130U, 15.60", 1.7 kg
Recensioni esterne » Asus Vivobook X507UF-EJ171T
HP Pavilion x360 14-cd0014ns: Intel Core i7-8550U, 14.00", 1.6 kg
Recensioni esterne » HP Pavilion x360 14-cd0014ns
Acer Aspire 5 A515-52G-78V3: Intel Core i7-8565U, 15.60", 1.9 kg
Recensioni esterne » Acer Aspire 5 A515-52G-78V3
Dell Inspiron 14 5482-cn54805: Intel Core i5-8250U, 14.00", 1.7 kg
Recensioni esterne » Dell Inspiron 14 5482-cn54805
Acer Aspire 3 A315-53G-56SU: Intel Core i5-8250U, 15.60", 2.1 kg
Recensioni esterne » Acer Aspire 3 A315-53G-56SU
Acer Swift 3 SF314-55G-71NF: Intel Core i7-8565U, 14.00", 1.4 kg
Recensioni esterne » Acer Swift 3 SF314-55G-71NF
Asus VivoBook 15 X512UF-BQ135T: Intel Core i7-8550U, 15.60", 1.8 kg
Recensioni esterne » Asus VivoBook 15 X512UF-BQ135T
Acer Aspire 3 A315-53G-51GB: Intel Core i5-8250U, 15.60", 2.1 kg
Recensioni esterne » Acer Aspire 3 A315-53G-51GB
Acer Aspire 5 A515-52G-73ML: Intel Core i7-8565U, 15.60", 1.8 kg
Recensioni esterne » Acer Aspire 5 A515-52G-73ML
Asus Pro P5440UF-BM0043R: Intel Core i5-8265U, 14.00", 1.2 kg
Recensioni esterne » Asus Pro P5440UF-BM0043R
HP 15-da1016ns: Intel Core i7-8565U, 15.60", 1.8 kg
Recensioni esterne » HP 15-da1016ns
HP Pavilion 15-cs0003ng: Intel Core i5-8250U, 15.60", 1.9 kg
Recensioni esterne » HP Pavilion 15-cs0003ng
Asus F507UF-EJ044T: Intel Core i5-8250U, 15.60", 1.7 kg
Recensioni esterne » Asus F507UF-EJ044T
Lenovo Yoga 530-14IKB-81EK00WEGE: Intel Core i7-8550U, 14.00", 1.7 kg
Recensioni esterne » Lenovo Yoga 530-14IKB-81EK00WEGE
Asus VivoBook S15 S510UF-BR452T: Intel Core i7-8550U, 14.00", 1.7 kg
Recensioni esterne » Asus VivoBook S15 S510UF-BR452T
HP Pavilion 15-cs0004ns: Intel Core i5-8250U, 15.60", 1.9 kg
Recensioni esterne » HP Pavilion 15-cs0004ns
HP 15-da0077ns: Intel Core i7-8550U, 15.60", 2.1 kg
Recensioni esterne » HP 15-da0077ns
Acer TravelMate X3410-MG-50LB: Intel Core i5-8250U, 14.00", 1.6 kg
Recensioni esterne » Acer TravelMate X3410-MG-50LB
Lenovo Yoga 530-14IKB-81EK00A5MJ: Intel Core i5-8250U, 14.00", 1.6 kg
Recensioni esterne » Lenovo Yoga 530-14IKB-81EK00A5MJ
Dell Inspiron 14 5482-VC58K: Intel Core i7-8565U, 14.00", 1.8 kg
Recensioni esterne » Dell Inspiron 14 5482-VC58K
Asus Vivobook X507UF-EJ078T: Intel Core i5-8250U, 15.60", 1.7 kg
Recensioni esterne » Asus Vivobook X507UF-EJ078T
Asus Pro P5440UF-XB74: Intel Core i7-8550U, 14.00", 1.2 kg
Recensioni esterne » Asus Pro P5440UF-XB74
Lenovo Flex 6 14 81EM0008US: Intel Core i5-8250U, 14.00", 1.7 kg
Recensioni esterne » Lenovo Flex 6 14 81EM0008US
Lenovo Ideapad 530s-14IKB-81EU00AGFE: Intel Core i5-8250U, 14.00", 1.5 kg
Recensioni esterne » Lenovo Ideapad 530s-14IKB-81EU00AGFE
Dell Inspiron 15 7570, GeForce MX130: Intel Core i5-8250U, 15.60", 2 kg
Recensioni esterne » Dell Inspiron 15 7570, GeForce MX130
Asus VivoBook S15 S530UF-BQ819T: Intel Core i5-8250U, 15.60", 1.8 kg
Recensioni esterne » Asus VivoBook S15 S530UF-BQ819T
HP Pavilion 14-ce0010ns: Intel Core i5-8250U, 14.00", 1.7 kg
Recensioni esterne » HP Pavilion 14-ce0010ns
HP Pavilion 15-cs0649nd: Intel Core i5-8250U, 15.60", 1.9 kg
Recensioni esterne » HP Pavilion 15-cs0649nd
Acer Aspire 5 A515-51G-509A: Intel Core i5-8250U, 15.60", 2.2 kg
Recensioni esterne » Acer Aspire 5 A515-51G-509A
HP Pavilion 14-ce0002ns: Intel Core i5-8250U, 14.00", 1.6 kg
Recensioni esterne » HP Pavilion 14-ce0002ns
HP Pavilion x360 14-cd0011ns: Intel Core i5-8250U, 14.00", 1.6 kg
Recensioni esterne » HP Pavilion x360 14-cd0011ns
Dell Latitude 5591: Intel Core i7-8850H, 15.60", 2.3 kg
Recensioni esterne » Dell Latitude 5591
Dell Latitude 5491: Intel Core i7-8850H, 14.00", 1.8 kg
Recensioni esterne » Dell Latitude 5491
HP Pavilion 14-ce0004ns: Intel Core i5-8250U, 14.00", 1.6 kg
Recensioni esterne » HP Pavilion 14-ce0004ns
HP Pavilion 14-ce0015ns: Intel Core i7-8550U, 14.00", 1.6 kg
Recensioni esterne » HP Pavilion 14-ce0015ns
Acer Aspire 5 A515-51G-56UG: Intel Core i5-8250U, 15.60", 2.2 kg
Recensioni esterne » Acer Aspire 5 A515-51G-56UG
Acer Aspire 5 A515-51G-8907: Intel Core i7-8550U, 15.60", 2.2 kg
Recensioni esterne » Acer Aspire 5 A515-51G-8907
Acer Aspire 5 A515-51G-73QQ: Intel Core i7-7500U, 15.60", 2.2 kg
Recensioni esterne » Acer Aspire 5 A515-51G-73QQ
Lenovo Flex 6-14IKB: Intel Core i5-8250U, 14.00", 1.7 kg
Recensioni esterne » Lenovo Flex 6-14IKB
Acer Aspire 5 A515-51G-558H: Intel Core i5-8250U, 15.60", 2.2 kg
Recensioni esterne » Acer Aspire 5 A515-51G-558H
Acer Aspire 5 A515-51G-55SC: Intel Core i5-8250U, 15.60", 2.2 kg
Recensioni esterne » Acer Aspire 5 A515-51G-55SC