AMD Radeon R7 M460

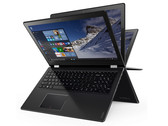
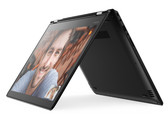
L'AMD Radeon R7 M460 è una scheda grafica entry level per portatili. E' stata annunciata con il Lenovo Yoga 510 (modello da 15") ad inizio 2016. I dettagli tecnici sono più o meno identici alla vecchia Radeon R7 M360 (guardate i benchmarks). Solo la velocità core è aumentata leggermente di 8 MHz nel nostro modello di test.
Radeon R7 M400 Serie
| ||||||||||
| Architettura | GCN | |||||||||
| Pipelines | 384 - unified | |||||||||
| Velocità del core | 984 MHz | |||||||||
| Velocità della memoria | 2000 MHz | |||||||||
| Larghezza del bus di memoria | 64 Bit | |||||||||
| Memoria condivisa | no | |||||||||
| API | DirectX 12, OpenGL 4.3 | |||||||||
| tecnologia | 28 nm | |||||||||
| Caratteristiche | DirectX 12, Mantle, OpenGL 4.3, OpenCL 1.2, Vulkan | |||||||||
| Data dell'annuncio | 21.02.2016 | |||||||||
Benchmark
3DM Vant. Perf. total +
Cinebench R15 OpenGL 64 Bit +
GFXBench T-Rex HD Offscreen C24Z16 +
* Numeri più piccoli rappresentano prestazioni supeiori
Benchmarks per i giochi
I seguenti benchmarks deirivano dai benchmarks dei portatili recensiti. Le prestazioni dipendono dalla scheda grafica utilizzata, dal clock rate, dal processore, dai settaggi di sistema, dai drivers, e dai sistemi operativi. Quindi i risultati non sono rappresentativi per i portatili con questa GPU. Per informazioni dettagliate sui risultati del benchmark, cliccate sul numero di fps.

Titanfall 2
2016
Farming Simulator 17
2016
Battlefield 1
2016
Mafia 3
2016
FIFA 17
2016
No Man's Sky
2016
Doom
2016
Need for Speed 2016
2016
Hitman 2016
2016
The Division
2016
Far Cry Primal
2016
XCOM 2
2016
Rainbow Six Siege
2015
Just Cause 3
2015
Fallout 4
2015
Anno 2205
2015
FIFA 16
2015
World of Warships
2015
Metal Gear Solid V
2015
The Witcher 3
2015
Dirt Rally
2015
GTA V
2015
F1 2014
2014
Alien: Isolation
2014
Sims 4
2014
GRID: Autosport
2014
Battlefield 4
2013
Metro: Last Light
2013
BioShock Infinite
2013
Tomb Raider
2013
Crysis 3
2013
Diablo III
2012| basso | medio | alto | ultra | QHD | 4K | |
|---|---|---|---|---|---|---|
| Call of Duty Infinite Warfare | 29.1 | 26.1 | 14.7 | |||
| Titanfall 2 | 40.8 | 30.6 | 12.5 | |||
| Farming Simulator 17 | 95.8 | 62.6 | 24 | 10 | ||
| Battlefield 1 | 30 | 20.6 | 10.1 | |||
| Mafia 3 | 11.7 | 7.4 | 3.8 | |||
| FIFA 17 | 83.8 | 70.3 | 36.1 | 34.1 | ||
| Deus Ex Mankind Divided | 14.5 | 10.6 | 5.4 | |||
| No Man's Sky | 19.8 | 15.7 | 8.6 | |||
| Mirror's Edge Catalyst | 27.7 | 19.6 | 7.9 | |||
| Doom | 23.3 | 13.3 | 7.9 | |||
| Ashes of the Singularity | 14.7 | 5.1 | ||||
| Need for Speed 2016 | 26.6 | 23 | 14.1 | |||
| Hitman 2016 | 28 | 20.6 | 10.6 | |||
| The Division | 29.9 | 16.3 | 7.2 | |||
| Far Cry Primal | 22 | 10 | 8 | 7 | ||
| XCOM 2 | 22.5 | 7.8 | 5.2 | |||
| Rise of the Tomb Raider | 19.5 | 12.2 | 6.8 | |||
| Rainbow Six Siege | 51.9 | 31.8 | 13.1 | 10.6 | ||
| Just Cause 3 | 32.1 | 25.2 | 11.9 | 10.1 | ||
| Star Wars Battlefront | 36 | 24 | 11 | 9.1 | ||
| Fallout 4 | 27 | 15.8 | 8.2 | 6.5 | ||
| Call of Duty: Black Ops 3 | 43.3 | 23.6 | 12.3 | |||
| Anno 2205 | 31.4 | 16.5 | 7 | 3.7 | ||
| FIFA 16 | 88.1 | 51.8 | 24.5 | |||
| World of Warships | 79.6 | 49.9 | 21.2 | 15 | ||
| Metal Gear Solid V | 43.9 | 30.2 | 12.4 | |||
| Batman: Arkham Knight | 20 | 17 | 9 | |||
| The Witcher 3 | 20.7 | 13.4 | 6.7 | |||
| Dirt Rally | 108.7 | 36.7 | 17.9 | 12.5 | ||
| GTA V | 50.5 | 45.2 | 10.7 | |||
| F1 2014 | 100 | 75 | 44 | 25 | ||
| Alien: Isolation | 50.1 | 37.6 | 18 | 14.7 | ||
| Middle-earth: Shadow of Mordor | 33.3 | 20.9 | 11.1 | 7.3 | ||
| Sims 4 | 137.5 | 49.9 | 21.7 | 18.6 | ||
| GRID: Autosport | 125.3 | 56.6 | 26 | 13.6 | ||
| Battlefield 4 | 59.4 | 38 | 23.9 | 7.8 | ||
| Metro: Last Light | 35.4 | 26.2 | 16 | 7.7 | ||
| BioShock Infinite | 73 | 40 | 32 | 10 | ||
| Tomb Raider | 80 | 39.9 | 30 | 14.7 | ||
| Crysis 3 | 29.9 | 18.3 | 13.7 | 5.2 | ||
| Diablo III | 92.2 | 60.5 | 50.7 | 29.9 | ||
| basso | medio | alto | ultra | QHD | 4K | < 30 fps < 60 fps < 120 fps ≥ 120 fps | 17 13 9 2 | 24 12 4 | 34 6 | 21 1 | | |
Per conoscere altri giochi che potrebbero essere utilizzabili e per una lista completa di tutti i giochi e delle schede grafiche visitate la nostra Gaming List
Recensioni Notebook con AMD Radeon R7 M460 la scheda grafica


Recensione Breve del Convertibile Lenovo Yoga 510-15ISK
Lenovo Ideapad 510S-14IKB: Intel Core i7-7500U, 14.00", 1.7 kg
Recensioni esterne » Lenovo Ideapad 510S-14IKB


