NVIDIA GeForce 930M

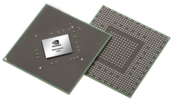
La NVIDIA GeForce 930M (a volte chiamata anche Nvidia GeForce GT 930M) è una scheda di fascia medio bassa, DirectX 11 compatibile per portatili lanciata a marzo 2015. Si basa sulla GeForce 840M degli ultimi anni. In aggiunta alla "normale" 930M da 25 Watt, c'è anche una variante a basso consumo con un TDP di 12 Watt e supporto per DDR3 e GDDR5. La variante DDR3 dovrebbe essere di circa il 10% più lenta rispetto alla versione 25 Watt. Le performance della versione GDDR5 è ancora sconosciuta. Anche lo shader count per queste 930M a basso consumo è sconosciuto. Come la versione LP ha un clock da appena 457 MHz + Boost e potrebbe avere più shaders (o un Boost superiore).
Architettura
Rispetto alla Kepler, la Maxwell è stata ottimizzata in molti dettagli per migliorare l'efficienza energetica. Multiprocessors Streaming più piccoli (SMM) con solo 128 ALUs (Kepler: 192) ed uno scheduler ottimizzato dovrebbero consentire un miglior utilizzo degli shaders. Nvidia promette che un SMM Maxwell con 128 ALUs riesce ad offrire il 90 percento di prestazioni di una Kepler SMX con 192 ALUs. La 930M potrebbe sfruttare in pieno il GM108 con 3 SMMs (384 shader cores, 24 TMUs, e 8 ROPs grazie all'interfaccia a 64-bit).
Un altra ottimizzazione è la cache L2 ingrandita. La maggiore dimensione consente la gestione di parte del traffico di memoria su un'interfaccia ridotta senza limitare troppo le prestazioni.
Similmente al GM107, il GM108 supporta DirectX 11.2.
Performance
Le performance dovrebbero essere leggermente sotto una media GeForce 840M a causa del core clock più lento. Questo significa che i giochi pesanti come Evolve sono giocabili solo con settaggi bassi. I giochi meno pesanti come F1 2014 o Fifa 15 d'altro canto dovrebbero girare anche con dettagli elevati. guardate i gaming benchmarks di seguito per maggiori dettagli.
Features
Il GM108 integra la sesta generazione di motori video PureVideo HD (VP6), che offre migliori prestazioni di decodifica per videos H.264 e MPEG-2. Ovviamente, il VP6 supporta tutte le features delle precedenti generazioni (supporto 4K, PIP, codifica video via NVENC API). Sfortunatamente, l'HDMI 2.0 ancora non è supportato.
Consumo Energetico
Il consumo energetico della GeForce 930M dovrebbe essere di circa 33 Watts o meno. Pertanto, la 930M è più adatta per portatili da 13" o superiori. La serie 900M supporta anche Optimus per lo switch automatico tra la scheda grafica integrata e la GPU Nvidia.
GeForce 900M Serie
| ||||||||||||||||||||||||||||
| Nome in codice | N16S-GM-B/S, N16S-LP | |||||||||||||||||||||||||||
| Architettura | Maxwell | |||||||||||||||||||||||||||
| Pipelines | 384 - unified | |||||||||||||||||||||||||||
| Velocità del core | 928 - 941 (Boost) MHz | |||||||||||||||||||||||||||
| Velocità della memoria | 1800 MHz | |||||||||||||||||||||||||||
| Larghezza del bus di memoria | 64 Bit | |||||||||||||||||||||||||||
| Tipo di memoria | DDR3 | |||||||||||||||||||||||||||
| Max. quantità di memoria | 2048 MB | |||||||||||||||||||||||||||
| Memoria condivisa | no | |||||||||||||||||||||||||||
| API | DirectX 12 (FL 11_0), Shader 5.0, OpenGL 4.5 | |||||||||||||||||||||||||||
| Consumo di corrente | 12 / 25 Watt | |||||||||||||||||||||||||||
| tecnologia | 28 nm | |||||||||||||||||||||||||||
| Caratteristiche | GPU Boost 2.0, Optimus, PhysX, CUDA, GeForce Experience, GameWorks | |||||||||||||||||||||||||||
| Data dell'annuncio | 12.03.2015 | |||||||||||||||||||||||||||
| Link alla pagina del produttore | www.geforce.com | |||||||||||||||||||||||||||
Benchmark
3DM Vant. Perf. total +
specvp11 snx-01 +
Cinebench R15 OpenGL 64 Bit +
GFXBench T-Rex HD Offscreen C24Z16 +
* Numeri più piccoli rappresentano prestazioni supeiori
Benchmarks per i giochi
I seguenti benchmarks deirivano dai benchmarks dei portatili recensiti. Le prestazioni dipendono dalla scheda grafica utilizzata, dal clock rate, dal processore, dai settaggi di sistema, dai drivers, e dai sistemi operativi. Quindi i risultati non sono rappresentativi per i portatili con questa GPU. Per informazioni dettagliate sui risultati del benchmark, cliccate sul numero di fps.

Doom Eternal
2020
Hunt Showdown
2020
Escape from Tarkov
2020
Need for Speed Heat
2019
GRID 2019
2019
FIFA 20
2019
Borderlands 3
2019
Control
2019
F1 2019
2019
Anno 1800
2019
The Division 2
2019
Dirt Rally 2.0
2019
Anthem
2019
Far Cry New Dawn
2019
Metro Exodus
2019
Apex Legends
2019
Just Cause 4
2018
Darksiders III
2018
Battlefield V
2018
Farming Simulator 19
2018
Fallout 76
2018
Hitman 2
2018
Forza Horizon 4
2018
FIFA 19
2018
F1 2018
2018
Monster Hunter World
2018
The Crew 2
2018
Far Cry 5
2018
X-Plane 11.11
2018
Fortnite
2018
Call of Duty WWII
2017
ELEX
2017
The Evil Within 2
2017
FIFA 18
2017
Ark Survival Evolved
2017
F1 2017
2017
Team Fortress 2
2017
Dirt 4
2017
Rocket League
2017
Prey
2017
For Honor
2017
Resident Evil 7
2017
Watch Dogs 2
2016
Dishonored 2
2016
Titanfall 2
2016
Farming Simulator 17
2016
Battlefield 1
2016
Civilization 6
2016
Mafia 3
2016
FIFA 17
2016
Overwatch
2016
Doom
2016
Need for Speed 2016
2016
Hitman 2016
2016
The Division
2016
Far Cry Primal
2016
XCOM 2
2016
Rainbow Six Siege
2015
Just Cause 3
2015
Fallout 4
2015
Anno 2205
2015
FIFA 16
2015
World of Warships
2015
Metal Gear Solid V
2015
Mad Max
2015
Dota 2 Reborn
2015
The Witcher 3
2015
Dirt Rally
2015
GTA V
2015
Battlefield Hardline
2015
Evolve
2015
The Crew
2014
Far Cry 4
2014
F1 2014
2014
The Evil Within
2014
Ryse: Son of Rome
2014
Alien: Isolation
2014
Fifa 15
2014
Sims 4
2014
Risen 3: Titan Lords
2014
GRID: Autosport
2014
Watch Dogs
2014
Thief
2014
Battlefield 4
2013
Metro: Last Light
2013
BioShock Infinite
2013
Tomb Raider
2013
Crysis 3
2013
Diablo III
2012
Anno 2070
2011Per conoscere altri giochi che potrebbero essere utilizzabili e per una lista completa di tutti i giochi e delle schede grafiche visitate la nostra Gaming List
Recensioni Notebook con NVIDIA GeForce 930M la scheda grafica


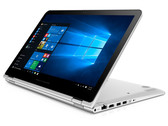
Recensione breve dell'HP Envy 15 x360 Convertible (Core i5-6200U)

Recensione breve del notebook HP Envy 15-w000ng x360

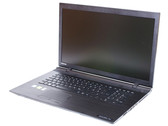
Recensione Breve del Portatile Toshiba Satellite P50-C-10G

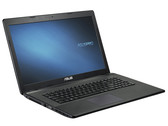
Recensione breve del Portatile Asus AsusPro Essential P751JF
Toshiba Satellite L50-C-18U: Intel Core i5-5200U, 15.60", 2 kg
Recensioni esterne » Toshiba Satellite L50-C-18U
Toshiba Satellite Pro A50-C-1MT: Intel Core i5-6200U, 15.60", 2.2 kg
Recensioni esterne » Toshiba Satellite Pro A50-C-1MT
Medion Akoya P7641-MD99855: Intel Core i5-6200U, 17.30", 2.7 kg
Recensioni esterne » Medion Akoya P7641-MD99855
Toshiba Tecra Z40-C-103: Intel Core i7-6600U, 14.00", 1.5 kg
Recensioni esterne » Toshiba Tecra Z40-C-103
Toshiba Satellite L50-C-275: Intel Core i5-6200U, 15.60", 2.1 kg
Recensioni esterne » Toshiba Satellite L50-C-275
Asus K555LF-XO017D: Intel Core i7-5500U, 15.60", 2.3 kg
Recensioni esterne » Asus K555LF-XO017D
Dell Vostro 5459: Intel Core i5-6200U, 14.00", 1.7 kg
Recensioni esterne » Dell Vostro 5459
Toshiba Tecra Z50-C1550: Intel Core i7-6600U, 15.60", 2.2 kg
Recensioni esterne » Toshiba Tecra Z50-C1550
Toshiba Satellite P50-C186: Intel Core i7-6500U, 15.60", 2.2 kg
Recensioni esterne » Toshiba Satellite P50-C186
Toshiba Satellite P50-C-129: Intel Core i7-5500U, 15.60", 2 kg
Recensioni esterne » Toshiba Satellite P50-C-129
Asus A555LF: Intel Core i5-5200U, 15.60", 2.3 kg
Recensioni esterne » Asus A555LF
Toshiba Satellite P50-C-10e: Intel Core i7-5500U, 15.60", 2.2 kg
Recensioni esterne » Toshiba Satellite P50-C-10e
Toshiba Satellite P50-C-10G: Intel Core i7-5500U, 15.60", 2.2 kg
Recensioni esterne » Toshiba Satellite P50-C-10G
Toshiba Satellite L50-C-15C: Intel Core i7-5500U, 15.60", 2.2 kg
Recensioni esterne » Toshiba Satellite L50-C-15C
Toshiba Satellite L50-C-111: Intel Core i5-5200U, 15.60", 2.2 kg
Recensioni esterne » Toshiba Satellite L50-C-111


