Notebookcheck Logo

Nvidia GeForce RTX 5050 Laptop

Nvidia GeForce RTX 5050 Laptop è una scheda grafica dedicata della famiglia Blackwell per i computer portatili, presentata dal Team Green nel giugno 2025. Utilizza il chip GB207.

Come la GPU RTX 4050 Laptop, la GPU offre 2.560 shader unificati (core CUDA) combinati con un bus di memoria a 128 bit per 8 GB di memoria grafica GDDR7.

Altre caratteristiche della GPU includono core di ray tracing nativi di quinta generazione, supporto PCIe 5, DisplayPort 2.1a e prestazioni AI 440 TOPS (grazie ai core Tensor integrati).

Le prestazioni senza la generazione di fotogrammi DLSS dovrebbero essere simili a quelle della vecchia GPU RTX 4060 per computer portatili gPU per laptop. La RTX 5060 è più veloce del 21 - 22% a 115 W (incluso Dynamic Boost) nei test 3DMark (via Videocardz). Come sempre, le prestazioni dipendono fortemente dal consumo energetico (TGP) e dal raffreddamento. Pertanto, ci saranno anche modelli significativamente più lenti nei computer portatili.

Il chip è prodotto presso TSMC utilizzando il processo a 4 nm (4N). Il consumo energetico (TGP) è specificato in 35-100 watt (115 watt incluso Dynamic Boost 2.0).

GeForce RTX 5000 Laptop GPU Serie

GeForce RTX 5090 Laptop 10496 @ 0.99 - 1.52 GHz256 Bit @ 28000 MHz
GeForce RTX 5080 Laptop 8192 @ 0.98 - 2.29 GHz256 Bit @ 28000 MHz
GeForce RTX 5070 Ti Laptop 5888 @ 0.85 - 2.22 GHz192 Bit @ 32000 MHz
GeForce RTX 5070 Laptop 4608 @ 2.24 - 2.52 GHz128 Bit @ 32000 MHz
GeForce RTX 5060 Laptop 3328 @ 0.95 - 1.46 GHz128 Bit @ 24000 MHz
GeForce RTX 5050 Laptop 2560 @ 1.02 - 2.66 GHz128 Bit @ 14000 MHz
Nome in codiceGN22-X2
ArchitetturaBlackwell
Pipelines2560 - unified
TMUs80
ROPs32
Raytracing Cores20
Tensor / AI Cores80
Velocità del core1020 - 2662 (Boost) MHz
CacheL1: 2.5 MB, L2: 32 MB
Velocità della memoria14000 effective = 1750 MHz
Larghezza del bus di memoria128 Bit
Tipo di memoriaGDDR6
Max. quantità di memoria8 GB
Memoria condivisano
Memory Bandwidth224 GB/s
APIDirectX 12_2
Consumo di corrente100 Watt (35 - 100 Watt TGP)
tecnologia5 nm
PCIe5
Displays4 Displays (max.), DisplayPort 2.1a
Dimensione del portatilemisura media
Data dell'annuncio02.01.2025
Link alla pagina del produttorewww.nvidia.com
PredecessorNVIDIA GeForce RTX 4050 Laptop GPU

Benchmark

Performance Rating - 3DMark 11 + Fire Strike + Time Spy
10.5 pt (32%)
Restrict / Search: Model: Max. age: years
3DMark - 3DMark Time Spy Score
9799 Points (26%)
3DMark - 3DMark Time Spy Graphics
9784 Points (20%)
Restrict / Search: Model: Max. age: years
3DMark - 3DMark Cloud Gate Score
52328 Points (49%)
3DMark - 3DMark Cloud Gate Graphics
149542 Points (37%)
3DMark - 3DMark Fire Strike Standard Score
23840 Points (36%)
3DMark - 3DMark Fire Strike Standard Graphics
28040 Points (26%)
3DMark - 3DMark Ice Storm Graphics
436477 Points (48%)
3DMark 11 - 3DM11 Performance Score
28133 Points (34%)
3DMark 11 - 3DM11 Performance GPU
33119 Points (25%)
171.8 -99%
...
28692 -13%
NVIDIA GeForce RTX 2070 Super Mobile
29416 -11%
29447 -11%
29663 -10%
30499 -8%
31142 -6%
32331 -2%
32662 -1%
32846 -1%
Nvidia GeForce RTX 5050 Laptop
33119
33169 0%
33497 1%
34188 3%
34860 5%
35101 6%
NVIDIA GeForce RTX 2080 Super Mobile
35153 6%
35286 7%
35743 8%
35944 9%
...
59943 81%
max:
NVIDIA GeForce RTX 5090
129772 292%
0%
100%
Restrict / Search: Model: Max. age: years
3DMark Vantage
3DM Vant. Perf. total +
3DMark Vantage - 3DM Vant. Perf. total
76534 Points (22%)
3DM Vant. Perf. GPU no PhysX +
3DMark Vantage - 3DM Vant. Perf. GPU no PhysX
82905 Points (45%)
Restrict / Search: Model: Max. age: years
3DMark 06 3DMark 06 - Standard 1280x1024 +
3DMark 06
47989 Points (63%)
Blender - Blender 3.3 Classroom CUDA *
50 Seconds (7%)
Blender - Blender 3.3 Classroom OPTIX *
29 Seconds (11%)
Cinebench R10 Cinebench R10 Shading (32bit) +
Cinebench R10 - Cinebench R10 Shading (32bit)
15349 punti (11%)
Cinebench R11.5 Cinebench R11.5 OpenGL 64 Bit +
Cinebench R11.5 - Cinebench R11.5 OpenGL 64 Bit
135.1 fps (44%)
Cinebench R15
Cinebench R15 OpenGL 64 Bit +
Cinebench R15 - Cinebench R15 OpenGL 64 Bit
min: 166.8     media: 173.9     media: 173.9 (10%)     massimo: 180.9 fps
Cinebench R15 OpenGL Ref. Match 64 Bit +
Cinebench R15 - Cinebench R15 OpenGL Ref. Match 64 Bit
99.6 % (100%)
GFXBench - GFXBench 5.0 4K Aztec Ruins High Tier Offscreen
100.4 fps (38%)
GFXBench - GFXBench 5.0 Aztec Ruins High Tier Offscreen
232.1 fps (42%)
3.3 -99%
...
Apple M1 Pro 16-Core GPU
166 -28%
178.7 -23%
181.1 -22%
AMD Radeon 8050S
182.6 -21%
185.4 -20%
187 -19%
208 -10%
210.6 -9%
219.7 -5%
Nvidia GeForce RTX 5050 Laptop
232.1
236.4 2%
236.4 2%
Apple M1 Max 24-Core GPU
240 3%
242.3 4%
Nvidia GeForce RTX 5070 Laptop
273.8 18%
277.7 20%
283.6 22%
283.8 22%
285.4 23%
...
530 128%
0%
100%
Restrict / Search: Model: Max. age: years
GFXBench - GFXBench 5.0 Aztec Ruins Normal Tier Offscreen
609 fps (45%)
Basemark GPU 1.2 - Basemark GPU 1.2 Vulkan Official Medium Offscreen 1080
104.6 fps (3%)
Geekbench 6.5 - Geekbench 6.5 GPU OpenCL
91972 punti (24%)
Geekbench 6.5 - Geekbench 6.5 GPU Vulkan
10922 punti (3%)
LuxMark v2.0 64Bit - LuxMark v2.0 Room GPU
5328 Samples/s (19%)
LuxMark v2.0 64Bit - LuxMark v2.0 Sala GPU
11437 Samples/s (20%)
ComputeMark v2.1 - ComputeMark v2.1 Result
20725 punti (17%)
Power Consumption - Furmark Stress Test Power Consumption - external Monitor *
150.7 Watt (20%)
0102030405060708090100110120130140150160Tooltip
Power Consumption - Cyberpunk 2077 Power Consumption 150cd *
173.4 Watt (48%)
0102030405060708090100110120130140150160170180Tooltip
Power Consumption - Cyberpunk 2077 Power Consumption - external Monitor *
171.9 Watt (22%)
0102030405060708090100110120130140150160170180Tooltip
- Valori di benchmark per questa scheda grafica
red legend - Valori medi di benchmark per questa scheda grafica
* Numeri più piccoli rappresentano prestazioni supeiori

Benchmarks per i giochi

I seguenti benchmarks deirivano dai benchmarks dei portatili recensiti. Le prestazioni dipendono dalla scheda grafica utilizzata, dal clock rate, dal processore, dai settaggi di sistema, dai drivers, e dai sistemi operativi. Quindi i risultati non sono rappresentativi per i portatili con questa GPU. Per informazioni dettagliate sui risultati del benchmark, cliccate sul numero di fps.

F1 25

F1 25

2025
medio 1920x1080
157  fps    + Confronta
alto 1920x1080
132  fps    + Confronta
ultra 1920x1080
15  fps    + Confronta
QHD 2560x1440
5  fps    + Confronta
QHD DLSS 2560x1440
9  fps    + Confronta
» Giocabile con tutti i portatili testati con dettagli alto.
medio 1920x1080
58.4  fps    + Confronta + 📈 Graph
alto 1920x1080
52.6  fps    + Confronta + 📈 Graph
ultra 1920x1080
51  fps    + Confronta + 📈 Graph
QHD 2560x1440
31.9  fps    + Confronta + 📈 Graph
QHD DLSS 2560x1440
49.5  fps    + Confronta + 📈 Graph
» Giocabile con tutti i portatili testati con dettagli ultra.
medio 1920x1080
52.2  fps    + Confronta + 📈 Graph
alto 1920x1080
48.2  fps    + Confronta + 📈 Graph
ultra 1920x1080
25  fps    + Confronta + 📈 Graph
QHD 2560x1440
13.4  fps    + Confronta + 📈 Graph
QHD DLSS 2560x1440
26.5  fps    + Confronta + 📈 Graph
» Giocabile con tutti i portatili testati con dettagli alto.
medio 1920x1080
51  fps    + Confronta
alto 1920x1080
43  fps    + Confronta
ultra 1920x1080
29  fps    + Confronta
QHD 2560x1440
25  fps    + Confronta
QHD DLSS 2560x1440
29  fps    + Confronta
» Giocabile con tutti i portatili testati con dettagli alto.
medio 1920x1080
90.5  fps    + Confronta + 📈 Graph
alto 1920x1080
73.6  fps    + Confronta + 📈 Graph
ultra 1920x1080
51.6  fps    + Confronta + 📈 Graph
QHD 2560x1440
36.8  fps    + Confronta + 📈 Graph
QHD DLSS 2560x1440
50.3  fps    + Confronta + 📈 Graph
» Giocabile con tutti i portatili testati con dettagli ultra.
alto 1920x1080
52.1  fps    + Confronta + 📈 Graph
ultra 1920x1080
15.6  fps    + Confronta + 📈 Graph
QHD 2560x1440
9.6  fps    + Confronta + 📈 Graph
QHD DLSS 2560x1440
0 (!)  fps    + Confronta
» Giocabile con tutti i portatili testati con dettagli alto.
Stalker 2

Stalker 2

2024
medio 1920x1080
56.4  fps    + Confronta + 📈 Graph
alto 1920x1080
48  fps    + Confronta + 📈 Graph
ultra 1920x1080
39.9  fps    + Confronta + 📈 Graph
QHD 2560x1440
29  fps    + Confronta + 📈 Graph
QHD DLSS 2560x1440
62.7  fps    + Confronta + 📈 Graph
» Giocabile con tutti i portatili testati con dettagli ultra.
medio 1920x1080
79.9  fps    + Confronta + 📈 Graph
alto 1920x1080
54.2  fps    + Confronta + 📈 Graph
ultra 1920x1080
41.3  fps    + Confronta + 📈 Graph
QHD 2560x1440
30.4  fps    + Confronta + 📈 Graph
QHD DLSS 2560x1440
39.5  fps    + Confronta + 📈 Graph
» Giocabile con tutti i portatili testati con dettagli ultra.
medio 1920x1080
79.2  fps    + Confronta + 📈 Graph
alto 1920x1080
75.6  fps    + Confronta + 📈 Graph
ultra 1920x1080
70.8  fps    + Confronta + 📈 Graph
QHD 2560x1440
49.5  fps    + Confronta + 📈 Graph
QHD DLSS 2560x1440
65.7  fps    + Confronta + 📈 Graph
» Giocabile con tutti i portatili testati con dettagli ultra.
medio 1920x1080 cinem.
46.5  fps    + Confronta + 📈 Graph
alto 1920x1080 cinem.
41.2  fps    + Confronta + 📈 Graph
ultra 1920x1080 cinem.
33  fps    + Confronta + 📈 Graph
QHD 2560x1440 cinem.
23.2  fps    + Confronta + 📈 Graph
QHD DLSS 2560x1440 cinem.
32.6  fps    + Confronta + 📈 Graph
» Giocabile con tutti i portatili testati con dettagli alto.
medio 1920x1080
50.4  fps    + Confronta + 📈 Graph
alto 1920x1080
35.1  fps    + Confronta + 📈 Graph
QHD 2560x1440
24.2  fps    + Confronta + 📈 Graph
QHD DLSS 2560x1440
39.6  fps    + Confronta + 📈 Graph
» Giocabile con tutti i portatili testati con dettagli alto.
medio 1920x1080
75.9  fps    + Confronta + 📈 Graph
alto 1920x1080
68.2  fps    + Confronta + 📈 Graph
ultra 1920x1080
54.5  fps    + Confronta + 📈 Graph
QHD 2560x1440
39.7  fps    + Confronta + 📈 Graph
QHD DLSS 2560x1440
55.2  fps    + Confronta + 📈 Graph
» Giocabile con tutti i portatili testati con dettagli ultra.
medio 1920x1080
86.2  fps    + Confronta + 📈 Graph
alto 1920x1080
64.1  fps    + Confronta + 📈 Graph
ultra 1920x1080
62  fps    + Confronta + 📈 Graph
QHD 2560x1440
45.7  fps    + Confronta + 📈 Graph
QHD DLSS 2560x1440
58.4  fps    + Confronta + 📈 Graph
» Giocabile con tutti i portatili testati con dettagli ultra.
medio 1920x1080
98.1  fps    + Confronta
alto 1920x1080
87.7  fps    + Confronta
ultra 1920x1080
76.9  fps    + Confronta
QHD 2560x1440
47.2  fps    + Confronta
» Giocabile con tutti i portatili testati con dettagli ultra.
Additional Benchmarks
30min Start Ultra Preset (FSR off) 1920x1080
69.1
medio 1920x1080
108.4  fps    + Confronta + 📈 Graph
alto 1920x1080
87.3  fps    + Confronta + 📈 Graph
ultra 1920x1080
86.3  fps    + Confronta + 📈 Graph
QHD 2560x1440
60  fps    + Confronta + 📈 Graph
» Giocabile con tutti i portatili testati con dettagli ultra.
Strange Brigade

Strange Brigade

2018
medio 1920x1080
278  fps    + Confronta
alto 1920x1080
220  fps    + Confronta
ultra 1920x1080
189.6  fps    + Confronta
QHD 2560x1440
132  fps    + Confronta
» Giocabile con tutti i portatili testati con dettagli ultra.
basso 1280x720
98.5  fps    + Confronta
medio 1920x1080
88.5  fps    + Confronta
alto 1920x1080
77.1  fps    + Confronta
» Giocabile con tutti i portatili testati con dettagli alto.
medio 1920x1080
139.3  fps    + Confronta
alto 1920x1080
102  fps    + Confronta
QHD 2560x1440
73.6  fps    + Confronta
» Giocabile con tutti i portatili testati con dettagli alto.
basso 1280x720
165.7  fps    + Confronta
medio 1366x768
137.7  fps    + Confronta
alto 1920x1080
131  fps    + Confronta
ultra 1920x1080
119.9  fps    + Confronta
» Giocabile con tutti i portatili testati con dettagli ultra.
GTA V

GTA V

2015
medio 1366x768
177.2  fps    + Confronta
alto 1920x1080
170.4  fps    + Confronta
ultra 1920x1080
117.6  fps    + Confronta
QHD 2560x1440
93.7  fps    + Confronta
» Giocabile con tutti i portatili testati con dettagli ultra.
bassomedioaltoultraQHD4K
F1 25157132155
Doom: The Dark Ages58.452.65131.9
The Elder Scrolls IV Oblivion Remastered52.248.22513.4
Assassin's Creed Shadows51432925
Kingdom Come Deliverance 290.573.651.636.8
Indiana Jones and the Great Circle52.115.69.58
Stalker 256.44839.929
Until Dawn79.954.241.330.4
Space Marine 279.275.670.849.5
Star Wars Outlaws46.541.23323.2
Senua's Saga Hellblade 250.435.124.2
Ghost of Tsushima75.968.254.539.7
Horizon Forbidden West86.264.16245.7
Cyberpunk 2077 2.2 Phantom Liberty98.187.776.947.2
Baldur's Gate 3108.487.386.360
Strange Brigade278220189.6132
X-Plane 11.1198.588.577.1
Final Fantasy XV Benchmark139.310273.6
Dota 2 Reborn165.7137.7131119.9
GTA V177.2170.4117.693.7
bassomedioaltoultraQHD4K
< 30 fps
< 60 fps
< 120 fps
≥ 120 fps


1
1

6
8
5

8
8
4
4
6
6
1
7
7
3
1


Per conoscere altri giochi che potrebbero essere utilizzabili e per una lista completa di tutti i giochi e delle schede grafiche visitate la nostra Gaming List

v1.33
log 30. 20:34:41

#0 ran 0s before starting gpusingle class +0s ... 0s

#1 no ids found in url (should be separated by "_") +0s ... 0s

#2 not redirecting to Ajax server +0s ... 0s

#3 did not recreate cache, as it is less than 5 days old! Created at Tue, 30 Sep 2025 20:03:30 +0200 +0.001s ... 0.001s

#4 no comparison url found in template nbc.compare_page_1 needed +0.026s ... 0.027s

#5 no comparison url found in template nbc.compare_page_1 needed +0s ... 0.027s

#6 no comparison url found in template nbc.compare_page_1 needed +0s ... 0.027s

#7 no comparison url found in template nbc.compare_page_1 needed +0s ... 0.027s

#8 no comparison url found in template nbc.compare_page_1 needed +0s ... 0.027s

#9 composed specs +0.001s ... 0.028s

#10 did output specs +0s ... 0.028s

#11 start showIntegratedCPUs +0s ... 0.028s

#12 getting avg benchmarks for device 12923 +0.028s ... 0.056s

#13 got single benchmarks 12923 +0.016s ... 0.072s

#14 got avg benchmarks for devices +0s ... 0.072s

#15 min, max, avg, median took s +0.588s ... 0.66s

#16 before gaming benchmark output +0s ... 0.66s

#17 Got 89 rows for game benchmarks. +0.02s ... 0.68s

#18 composed SQL query for gamebenchmarks +0s ... 0.68s

#19 got data and put it in $dataArray +0.013s ... 0.693s

#20 benchmarks composed for output. +0.135s ... 0.828s

#21 no comparison url found in template nbc.compare_page_1 needed +0.002s ... 0.83s

#22 return log +0s ... 0.83s

Recensioni Notebook con Nvidia GeForce RTX 5050 Laptop la scheda grafica

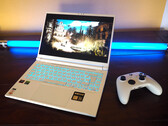
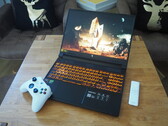
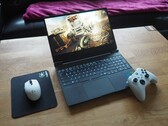
Medion Erazer Scout 17 E1 con RTX 5050 in recensione

Recensione del Medion Erazer Scout 17 E1: Valutazione del valore della RTX 5050 Laptop come GPU di fascia media inferiore

Medion Erazer Scout 17 E1 è il primo notebook basato su GeForce RTX 5050 Laptop ad arrivare nella nostra redazione. La nostra recensione mette alla prova l'RTX ...
Intel Core 5 210H | Nvidia GeForce RTX 5050 Laptop | 17.30" | 2.7 kg

Gigabyte Gaming A16 GA63H: AMD Ryzen 7 260, 16.00", 2.2 kg
  Recensioni esterne » Gigabyte Gaming A16 GA63H

Acer Nitro V15 ANV15-52: Intel Core i7-13620H, 15.60", 2.1 kg
  Recensioni esterne » Acer Nitro V15 ANV15-52

LG gram Pro AI 17 17Z90TR: Intel Core Ultra 9 285H, 17.00", 1.5 kg
  Recensioni esterne » LG gram Pro AI 17 17Z90TR

Asus TUF Gaming A18 FA808UH: AMD Ryzen 7 260, 18.00", 2.6 kg
  Recensioni esterne » Asus TUF Gaming A18 FA808UH

Asus TUF Gaming F16 FX608JHR: Intel Core i7-14650HX, 16.00", 2.2 kg
  Recensioni esterne » Asus TUF Gaming F16 FX608JHR

Asus TUF Gaming F16 FX608JHV: Intel Core i5-13450HX, 16.00", 2.2 kg
  Recensioni esterne » Asus TUF Gaming F16 FX608JH

Asus V16 V3607VH: Intel Core 7 240H, 16.00", 2 kg
  Recensioni esterne » Asus V16 V3607VH

Please share our article, every link counts!
Mail Logo

Classe 1

Classe 2

GeForce RTX 2080 Super Mobile
RTX PRO 2000 Blackwell Generation Laptop *
M1 Max 32-Core GPU *
GeForce RTX 2070 Super Mobile
M1 Max 24-Core GPU *
Radeon 8050S *
Radeon RX 5700M *
M1 Pro 16-Core GPU *
Radeon PRO W6600M *
GeForce RTX 2070 Super Max-Q
M1 Pro 14-Core GPU *
RTX PRO 1000 Blackwell Generation Laptop *
Quadro P4200
RTX PRO 500 Blackwell Generation Laptop *
Radeon 8040S *
Arc 140T *
Quadro P5000 Max-Q *
Arc 130T *
GeForce RTX 3050 4GB Laptop GPU

Classe 3

Quadro P4000 Max-Q
Radeon RX 580X (Laptop) *
Radeon RX 580 (Laptop)
Radeon Pro 5300M
Radeon RX 5300M
Quadro P3000 Max-Q *
Adreno 840 *
Radeon Pro WX 7100 *
Radeon RX 570X (Laptop) *
Radeon RX 570 (Laptop) *
Radeon RX 470 (Laptop) *
GeForce GTX 1050 Ti Mobile
Radeon 680M
Quadro P2000 Max-Q
Radeon R9 M395X
GeForce GTX 1050 Ti Max-Q *
WX Vega M GL
Radeon R9 M485X
GeForce GTX 1050 Max-Q *
Radeon 660M
Radeon RX 560X (Laptop)
Radeon RX 560 (Laptop)
Radeon Pro 560X
Radeon Pro 560
Radeon Pro 460
Radeon Pro WX 4130 *
Quadro P620 *
Radeon RX 550X (Laptop)
Radeon Pro 555X
Radeon Pro 555
Radeon Pro 455
Quadro P600
Arc Graphics 3-core (Arrow Lake) *
Radeon RX 540X *
Radeon Pro WX 2100 *
Radeon Pro WX 3100 *
Arc Graphics 2-core (Arrow Lake) *
Radeon Pro 450
Radeon 630
Radeon 540X *
Quadro P520
Quadro P500 *
Iris Plus Graphics G7 (Ice Lake 64 EU) *
Vega 10 *
Iris Pro Graphics 580
Vega 9
FirePro W5130M
UHD Graphics Xe G4 48EUs *
UHD Graphics 32EUs
UHD Graphics Xe 32EUs (Tiger Lake-H) *
UHD Graphics 750
UHD Graphics 730
Vega 7
Radeon R7 M465
Vega 8
Iris Plus Graphics G4 (Ice Lake 48 EU)
Quadro M600M
FirePro W4190M
Radeon R7 M445
UHD Graphics 24EUs (Alder Lake-N) *
Radeon R7 M340
Radeon 610M *
UHD Graphics G1 (Ice Lake 32 EU)
UHD Graphics Xe 16EUs (Tiger Lake-H) *
Radeon R5 (Bristol Ridge)
Adreno 690 *
Adreno 685 *
Adreno 680 *

Classe 4

Posizione approssimativa dell'adattatore grafico

Klaus Hinum, 2025-07- 1 (Update: 2025-07- 1)