Notebookcheck Logo

Nvidia GeForce RTX 5070 Ti Laptop

Nvidia GeForce RTX 5070 Ti Laptop è una scheda grafica mobile della famiglia Blackwell per computer portatili, presentata al CES 2025. Si basa sul chip GB205, con 5.888 core shader/CUDA con clock a 847-1995 MHz (a seconda del modello) e 12 GB di memoria GDDR7 con interfaccia a 192 bit. Il modello dispone anche di 46 RT-cores, oltre a 80 ROPs.

Come novità, Blackwell offre il supporto per la Multi-Frame Generation (MFG) con DLSS4, grazie alla quinta generazione di core Tensor.

Prestazioni

Come dimostrano i nostri test, il laptop RTX 5070 Ti è più veloce del 23% rispetto al laptop RTX 5070 standard RTX 5070 in media nei benchmark. Il delta delle prestazioni di gioco è inferiore; in questo caso, il laptop RTX 5070 Ti è solo il 15% più veloce in media del laptop RTX 5070. La controparte desktop, la RTX 5070 Tiè più veloce del 34%. Inoltre, con la citata Multi-Frame Generation (MFG) è possibile ottenere tassi di frame impressionanti, ma bisogna tenere presente la latenza.

Consumo di energia

Il chip GB205 è prodotto presso TSMC nel processo 4N (custom 4NP 5nm). Il TGP massimo consentito per questo modello è di 140 watt (incluso Dynamic Boost).

GeForce RTX 5000 Laptop GPU Serie

GeForce RTX 5090 Laptop 10496 @ 0.99 - 1.52 GHz256 Bit @ 28000 MHz
GeForce RTX 5080 Laptop 8192 @ 0.98 - 2.29 GHz256 Bit @ 28000 MHz
GeForce RTX 5070 Ti Laptop 5888 192 Bit @ 32000 MHz
GeForce RTX 5070 Laptop 4608 @ 2.24 - 2.52 GHz128 Bit @ 32000 MHz
GeForce RTX 5060 Laptop 3328 @ 0.95 - 1.46 GHz128 Bit @ 24000 MHz
GeForce RTX 5050 Laptop 2560 @ 1.02 - 2.66 GHz128 Bit @ 14000 MHz
Nome in codiceGN22-X7
ArchitetturaBlackwell
Pipelines5888 - unified
TMUs184
ROPs64
Raytracing Cores46
Tensor / AI Cores184
CacheL1: 5.8 MB, L2: 48 MB
Velocità della memoria32000 effective = 2000 MHz
Larghezza del bus di memoria192 Bit
Tipo di memoriaGDDR7
Max. quantità di memoria12 GB
Memoria condivisano
Memory Bandwidth677 GB/s
APIDirectX 12_2, OpenCL 3.0, Vulkan 1.4
Consumo di corrente115 Watt (60 - 115 Watt TGP)
tecnologia5 nm
PCIe5
Displays4 Displays (max.), HDMI 2.1b, DisplayPort 2.1b
Dimensione del portatilegrande
Data dell'annuncio02.01.2025

Benchmark

Performance Rating - 3DMark 11 + Fire Strike + Time Spy
16.7 pt (50%)
Restrict / Search: Model: Max. age: years
3DMark - 3DMark Time Spy Score
min: 13812     media: 16409     media: 16839.5 (45%)     massimo: 17747 Points
3DMark - 3DMark Time Spy Graphics
min: 14945     media: 16838     media: 17225 (35%)     massimo: 17981 Points
Restrict / Search: Model: Max. age: years
3DMark - 3DMark Ice Storm Unlimited Graphics
882191 Points (89%)
3DMark - 3DMark Ice Storm Extreme Graphics
659227 Points (77%)
3DMark - 3DMark Cloud Gate Score
min: 61167     media: 73232     media: 74060 (70%)     massimo: 82832 Points
3DMark - 3DMark Cloud Gate Graphics
min: 134306     media: 166921     media: 155373 (38%)     massimo: 223650 Points
3DMark - 3DMark Fire Strike Standard Score
min: 32615     media: 36726     media: 36215 (55%)     massimo: 42125 Points
3DMark - 3DMark Fire Strike Standard Graphics
min: 39170     media: 44122     media: 44603.5 (41%)     massimo: 47933 Points
3DMark - 3DMark Ice Storm Graphics
760743 Points (84%)
3DMark - 3DMark Wild Life Extreme Unlimited
min: 28297     media: 31578     media: 33562 (39%)     massimo: 33585 Points
3DMark - 3DMark Night Raid
82266 Points (78%)
3DMark - 3DMark Night Raid Graphics Score
182827 Points (70%)
3DMark 11 - 3DM11 Performance Score
min: 37247     media: 44080     media: 45294 (55%)     massimo: 47299 Points
3DMark 11 - 3DM11 Performance GPU
min: 50966     media: 56687     media: 56824 (43%)     massimo: 61651 Points
Restrict / Search: Model: Max. age: years
3DMark Vantage
3DM Vant. Perf. total +
3DMark Vantage - 3DM Vant. Perf. total
min: 121273     media: 122137     media: 122137 (35%)     massimo: 123001 Points
3DM Vant. Perf. GPU no PhysX +
3DMark Vantage - 3DM Vant. Perf. GPU no PhysX
min: 122701     media: 128541     media: 128540 (70%)     massimo: 134380 Points
Restrict / Search: Model: Max. age: years
3DMark 05 - 3DMark 05 - Standard
68580 Points (75%)
Intel Graphics Media Accelerator (GMA) 500
133.4 -100%
...
50971 -26%
52117 -24%
Intel Arc Graphics 140T
53521 -22%
53991 -21%
54320 -21%
55811 -19%
61850 -10%
62666 -9%
63165 -8%
Nvidia GeForce RTX 5070 Ti Laptop
68580
68868 0%
69623 2%
73485 7%
...
68868 0%
max:
87172 27%
0%
100%
Restrict / Search: Model: Max. age: years
3DMark 06 3DMark 06 - Standard 1280x1024 +
3DMark 06
min: 60964     media: 65414     media: 65214 (85%)     massimo: 70064 Points
Unigine Valley 1.0 - Unigine Valley 1.0 DX
198.1 fps (60%)
Blender - Blender 3.3 Classroom CUDA *
min: 24     media: 25.7     media: 24.5 (4%)     massimo: 33 Seconds
Blender - Blender 3.3 Classroom OPTIX *
min: 13     media: 14.8     media: 15 (6%)     massimo: 16 Seconds
SPECviewperf 12
specvp12 sw-03 +
SPECviewperf 12 - specvp12 sw-03
92.2 fps (23%)
specvp12 snx-02 +
SPECviewperf 12 - specvp12 snx-02
18.5 fps (3%)
specvp12 showcase-01 +
SPECviewperf 12 - specvp12 showcase-01
190 fps (33%)
specvp12 mediacal-01 +
SPECviewperf 12 - specvp12 mediacal-01
98.6 fps (25%)
specvp12 maya-04 +
SPECviewperf 12 - specvp12 maya-04
188 fps (51%)
specvp12 energy-01 +
SPECviewperf 12 - specvp12 energy-01
29 fps (26%)
specvp12 creo-01 +
SPECviewperf 12 - specvp12 creo-01
90.3 fps (36%)
specvp12 catia-04 +
SPECviewperf 12 - specvp12 catia-04
171 fps (28%)
specvp12 3dsmax-05 +
SPECviewperf 12 - specvp12 3dsmax-05
284 fps (43%)
SPECviewperf 13 specvp13 sw-04 +
SPECviewperf 13 - specvp13 sw-04
92.9 fps (25%)
specvp13 snx-03 +
SPECviewperf 13 - specvp13 snx-03
14.1 fps (2%)
specvp13 showcase-02 +
SPECviewperf 13 - specvp13 showcase-02
91.3 fps (16%)
specvp13 medical-02 +
SPECviewperf 13 - specvp13 medical-02
36.2 fps (6%)
specvp13 maya-05 +
SPECviewperf 13 - specvp13 maya-05
202 fps (23%)
specvp13 energy-02 +
SPECviewperf 13 - specvp13 energy-02
22.6 fps (7%)
specvp13 creo-02 +
SPECviewperf 13 - specvp13 creo-02
152 fps (22%)
specvp13 catia-05 +
SPECviewperf 13 - specvp13 catia-05
92.7 fps (10%)
specvp13 3dsmax-06 +
SPECviewperf 13 - specvp13 3dsmax-06
166 fps (26%)
SPECviewperf 2020 specvp2020 snx-04 1080p +
SPECviewperf 2020 - specvp2020 snx-04 1080p
33.6 fps (4%)
specvp2020 medical-03 1080p +
SPECviewperf 2020 - specvp2020 medical-03 1080p
50.8 fps (14%)
specvp2020 maya-06 1080p +
SPECviewperf 2020 - specvp2020 maya-06 1080p
503 fps (54%)
specvp2020 energy-03 1080p +
SPECviewperf 2020 - specvp2020 energy-03 1080p
26 fps (4%)
specvp2020 creo-03 1080p +
SPECviewperf 2020 - specvp2020 creo-03 1080p
85.1 fps (29%)
specvp2020 catia-06 1080p +
SPECviewperf 2020 - specvp2020 catia-06 1080p
39.1 fps (19%)
specvp2020 3dsmax-07 1080p +
SPECviewperf 2020 - specvp2020 3dsmax-07 1080p
76.8 fps (20%)
Cinebench R10 Cinebench R10 Shading (32bit) +
Cinebench R10 - Cinebench R10 Shading (32bit)
24671 punti (18%)
Cinebench R11.5 Cinebench R11.5 OpenGL 64 Bit +
Cinebench R11.5 - Cinebench R11.5 OpenGL 64 Bit
236.6 fps (78%)
Cinebench R15
Cinebench R15 OpenGL 64 Bit +
Cinebench R15 - Cinebench R15 OpenGL 64 Bit
min: 271     media: 311.9     media: 327 (19%)     massimo: 335.41 fps
Cinebench R15 OpenGL Ref. Match 64 Bit +
Cinebench R15 - Cinebench R15 OpenGL Ref. Match 64 Bit
99.6 % (100%)
GFXBench - GFXBench 5.0 4K Aztec Ruins High Tier Offscreen
184.7 fps (69%)
GFXBench - GFXBench 5.0 Aztec Ruins High Tier Offscreen
403.5 fps (72%)
Restrict / Search: Model: Max. age: years
GFXBench - GFXBench 5.0 Aztec Ruins Normal Tier Offscreen
960 fps (71%)
GFXBench - GFXBench Car Chase Offscreen
859 fps (81%)
GFXBench 3.1 - GFXBench Manhattan ES 3.1 Offscreen
983 fps (21%)
GFXBench 3.0 - GFXBench 3.0 Manhattan Offscreen
1084 fps (45%)
GFXBench (DX / GLBenchmark) 2.7
GFXBench T-Rex HD Offscreen C24Z16 +
GFXBench (DX / GLBenchmark) 2.7 - GFXBench T-Rex HD Offscreen C24Z16
3321 fps (26%)
Basemark GPU 1.2 - Basemark GPU 1.2 Vulkan Official Medium Offscreen 1080
min: 68.3     media: 430     media: 114.4 (3%)     massimo: 1863 fps
Basemark GPU 1.2 - Basemark GPU 1.2 Vulkan Official High Offscreen 2160
min: 3.64     media: 5.2     media: 5.2 (1%)     massimo: 6.84 fps
Geekbench 6.4 - Geekbench 6.4 GPU OpenCL
min: 67235     media: 145675     media: 155654 (41%)     massimo: 178141 punti
Geekbench 6.4 - Geekbench 6.4 GPU Vulkan
min: 7769     media: 58670     media: 40229 (10%)     massimo: 166112 punti
LuxMark v2.0 64Bit - LuxMark v2.0 Room GPU
min: 7623     media: 7789     media: 7788.5 (28%)     massimo: 7954 Samples/s
LuxMark v2.0 64Bit - LuxMark v2.0 Sala GPU
min: 15570     media: 15671     media: 15671 (27%)     massimo: 15772 Samples/s
ComputeMark v2.1 - ComputeMark v2.1 Result
min: 40170     media: 41323     media: 41323 (34%)     massimo: 42476 punti
Power Consumption - Furmark Stress Test Power Consumption - external Monitor *
min: 163.3     media: 187.7     media: 185.3 (25%)     massimo: 203 Watt
0153045607590105120135150165180195210225Tooltip
Power Consumption - The Witcher 3 Power Consumption - external Monitor *
221 Watt (31%)
0153045607590105120135150165180195210225Tooltip
Power Consumption - Power Efficiency - Witcher 3 ultra external Monitor
0.7 fps per Watt (58%)
Power Consumption - Cyberpunk 2077 Power Consumption 150cd *
min: 221     media: 245.1     media: 245 (71%)     massimo: 285 Watt
020406080100120140160180200220240260280300Tooltip
Power Consumption - Cyberpunk 2077 Power Consumption - external Monitor *
min: 217     media: 241     media: 242 (31%)     massimo: 278 Watt
0153045607590105120135150165180195210225240255270Tooltip
Power Consumption - Power Efficiency - Cyberpunk 2077 ultra
min: 0.4258     media: 0.5     media: 0.5 (2%)     massimo: 0.509 fps per Watt
Emissions Witcher 3 Fan Noise +
Emissions - Witcher 3 Fan Noise
50.4 dB(A) (72%)
- Valori di benchmark per questa scheda grafica
red legend - Valori medi di benchmark per questa scheda grafica
* Numeri più piccoli rappresentano prestazioni supeiori

Benchmarks per i giochi

I seguenti benchmarks deirivano dai benchmarks dei portatili recensiti. Le prestazioni dipendono dalla scheda grafica utilizzata, dal clock rate, dal processore, dai settaggi di sistema, dai drivers, e dai sistemi operativi. Quindi i risultati non sono rappresentativi per i portatili con questa GPU. Per informazioni dettagliate sui risultati del benchmark, cliccate sul numero di fps.

F1 25

F1 25

2025
basso 1920x1080
181.7 188.4 242 260 ~ 218 fps    + Confronta
medio 1920x1080
181.2 184.5 217 243 ~ 206 fps    + Confronta
alto 1920x1080
168.3 170.8 171.9 225 ~ 184 fps    + Confronta
ultra 1920x1080
33.3 35 35.3 42.1 ~ 36 fps    + Confronta
QHD 2560x1440
18 20 21.3 25 ~ 21 fps    + Confronta
QHD DLSS 2560x1440
32 36.9 39.3 45.9 ~ 39 fps    + Confronta
» Giocabile con la maggior parte dei portatili testati con dettagli ultra.
Additional Benchmarks
Ultra High Preset 16xAF TAA 1920x1080
69.7
64.7
61
85.3
basso 1920x1080
93  fps    + Confronta
medio 1920x1080
77.5 94.8 94.9 ~ 89 fps    + Confronta + 📈 Graph
alto 1920x1080
67.3 84.3 86.1 ~ 79 fps    + Confronta + 📈 Graph
ultra 1920x1080
65 82.7 85.4 ~ 78 fps    + Confronta + 📈 Graph
QHD 2560x1440
45.7 57.9 59.1 ~ 54 fps    + Confronta + 📈 Graph
QHD DLSS 2560x1440
61 79.1 82.5 ~ 74 fps    + Confronta + 📈 Graph
» Giocabile con tutti i portatili testati con dettagli ultra.
basso 1920x1080
116  fps    + Confronta + 📈 Graph
medio 1920x1080
86.9 94 112.6 ~ 98 fps    + Confronta + 📈 Graph
alto 1920x1080
78.2 81.8 90.8 ~ 84 fps    + Confronta + 📈 Graph
ultra 1920x1080
40 42.9 44 ~ 42 fps    + Confronta + 📈 Graph
QHD 2560x1440
28 30.1 30.9 ~ 30 fps    + Confronta + 📈 Graph
QHD DLSS 2560x1440
41.9 44.7 47.4 ~ 45 fps    + Confronta + 📈 Graph
» Giocabile con tutti i portatili testati con dettagli ultra.
basso 1920x1080
81 85 90 93 94 ~ 89 fps    + Confronta
medio 1920x1080
76 77 84 84 89 ~ 82 fps    + Confronta
alto 1920x1080
63 66 70 72 77 ~ 70 fps    + Confronta
ultra 1920x1080
47 52 52 53 55 55 58 ~ 53 fps    + Confronta
QHD 2560x1440
40 41 42 44 45 47 48 ~ 44 fps    + Confronta
4K 3840x2160
31 32 ~ 32 fps    + Confronta
4K DLSS 3840x2160
41 44 ~ 43 fps    + Confronta
QHD DLSS 2560x1440
49 51 58 59 ~ 54 fps    + Confronta
» Giocabile con tutti i portatili testati con dettagli ultra.
Additional Benchmarks
Ultra High + GI + DLSS Quality + FG 2560x1440
78
70
84
Ultra High + GI + DLSS Quality + FG 3840x2160
56
basso 1920x1080
443  fps    + Confronta + 📈 Graph
medio 1920x1080
192.1 212 261 ~ 222 fps    + Confronta + 📈 Graph
alto 1920x1080
187.5 202 213 ~ 201 fps    + Confronta + 📈 Graph
QHD 2560x1440
129.1 141.9 144 ~ 138 fps    + Confronta + 📈 Graph
» Giocabile con tutti i portatili testati con dettagli alto.
basso 1920x1080
93.1  fps    + Confronta
medio 1920x1080
84  fps    + Confronta
ultra 1920x1080
67.2 70.8 ~ 69 fps    + Confronta
QHD 2560x1440
54.7 55 ~ 55 fps    + Confronta
4K 3840x2160
33.4  fps    + Confronta
QHD DLSS 2560x1440
66.6 70.6 ~ 69 fps    + Confronta
» Giocabile con tutti i portatili testati con dettagli ultra.
basso 1920x1080
189.3  fps    + Confronta + 📈 Graph
medio 1920x1080
145.2 152.4 153.5 ~ 150 fps    + Confronta + 📈 Graph
alto 1920x1080
118.8 125.2 126.7 ~ 124 fps    + Confronta + 📈 Graph
ultra 1920x1080
84.1 88.2 90 ~ 87 fps    + Confronta + 📈 Graph
QHD 2560x1440
59 62.7 65 ~ 62 fps    + Confronta + 📈 Graph
QHD DLSS 2560x1440
79.2 86.1 94.7 ~ 87 fps    + Confronta + 📈 Graph
» Giocabile con tutti i portatili testati con dettagli ultra.
basso 1920x1080
126.7 144.4 158.1 ~ 143 fps    + Confronta + 📈 Graph
alto 1920x1080
93.5 102.4 118.6 ~ 105 fps    + Confronta + 📈 Graph
ultra 1920x1080
82.2 89.9 101 105.1 107.4 ~ 97 fps    + Confronta + 📈 Graph
QHD 2560x1440
63.5 68.4 77.6 80.8 82.5 ~ 75 fps    + Confronta + 📈 Graph
4K 3840x2160
31.7 43.1 ~ 37 fps    + Confronta
QHD DLSS 2560x1440
91.1 96 99.9 ~ 96 fps    + Confronta + 📈 Graph
» Giocabile con tutti i portatili testati con dettagli ultra.
Additional Benchmarks
Very Ultra Preset + Full Path Tracing + Quality DLSS + Frame Generation 2560x1440
20.2
Stalker 2

Stalker 2

2024
medio 1920x1080
84.6 89.8 ~ 87 fps    + Confronta + 📈 Graph
alto 1920x1080
73.6 76.6 ~ 75 fps    + Confronta + 📈 Graph
ultra 1920x1080
62 65.5 ~ 64 fps    + Confronta + 📈 Graph
QHD 2560x1440
46.9 49.9 ~ 48 fps    + Confronta + 📈 Graph
QHD DLSS 2560x1440
100.8 104.6 ~ 103 fps    + Confronta + 📈 Graph
» Giocabile con tutti i portatili testati con dettagli ultra.
basso 1920x1080
138 152 159 ~ 150 fps    + Confronta
medio 1920x1080
135 142 150 ~ 142 fps    + Confronta
alto 1920x1080
100 100 121 ~ 107 fps    + Confronta
ultra 1920x1080
94 94 97 112 ~ 99 fps    + Confronta
QHD 2560x1440
65 68 68 89 ~ 73 fps    + Confronta
4K 3840x2160
37  fps    + Confronta
4K DLSS 3840x2160
58  fps    + Confronta
QHD DLSS 2560x1440
98  fps    + Confronta
» Giocabile con tutti i portatili testati con dettagli ultra.
medio 1920x1080
99.3  fps    + Confronta + 📈 Graph
alto 1920x1080
85.9  fps    + Confronta + 📈 Graph
ultra 1920x1080
67.7  fps    + Confronta + 📈 Graph
QHD 2560x1440
48  fps    + Confronta + 📈 Graph
QHD DLSS 2560x1440
61.4  fps    + Confronta + 📈 Graph
» Giocabile con tutti i portatili testati con dettagli ultra.
medio 1920x1080
90.9  fps    + Confronta + 📈 Graph
alto 1920x1080
88.8  fps    + Confronta + 📈 Graph
ultra 1920x1080
87.7  fps    + Confronta + 📈 Graph
QHD 2560x1440
73.1  fps    + Confronta + 📈 Graph
QHD DLSS 2560x1440
84.6  fps    + Confronta + 📈 Graph
» Giocabile con tutti i portatili testati con dettagli ultra.
basso 1920x1080 cinem.
86.8  fps    + Confronta + 📈 Graph
medio 1920x1080 cinem.
70.7 82.3 ~ 77 fps    + Confronta + 📈 Graph
alto 1920x1080 cinem.
66.5 72.2 ~ 69 fps    + Confronta + 📈 Graph
ultra 1920x1080 cinem.
55.9 60.3 ~ 58 fps    + Confronta + 📈 Graph
QHD 2560x1440 cinem.
40.3 43.5 ~ 42 fps    + Confronta + 📈 Graph
QHD DLSS 2560x1440 cinem.
56.8 59.6 ~ 58 fps    + Confronta + 📈 Graph
» Giocabile con tutti i portatili testati con dettagli ultra.
Additional Benchmarks
ultra, RT ultra, DLSS, FG RR 2560x1440 cinem.
64.9
low 1280x720 cinem.
84.7
basso 1920x1080
133  fps    + Confronta
medio 1920x1080
100  fps    + Confronta
alto 1920x1080
78  fps    + Confronta
ultra 1920x1080
44  fps    + Confronta
QHD 2560x1440
33  fps    + Confronta
QHD DLSS 2560x1440
49  fps    + Confronta
» Giocabile con tutti i portatili testati con dettagli ultra.
Additional Benchmarks
low TSR 100 1280x720
192
cinematic RT: Very High DLSS 68 FG 2560x1440
59
F1 24

F1 24

2024
basso 1920x1080
247 322 ~ 285 fps    + Confronta
medio 1920x1080
226 236 350 ~ 271 fps    + Confronta
alto 1920x1080
217 223 232 250 291 ~ 243 fps    + Confronta
ultra 1920x1080
87.2 93 98.7 106.4 107.6 108 114.8 ~ 102 fps    + Confronta
QHD 2560x1440
53.2 60.4 66.4 68.5 69.4 71.2 72.1 ~ 66 fps    + Confronta
4K 3840x2160
28.1 35.6 ~ 32 fps    + Confronta
4K DLSS 3840x2160
38.6 61.4 ~ 50 fps    + Confronta
QHD DLSS 2560x1440
78.1 88.5 94.1 98.4 106 115.8 ~ 97 fps    + Confronta
QHD FSR 2560x1440
113.8  fps    + Confronta
» Giocabile con tutti i portatili testati con dettagli ultra.
medio 1920x1080
77.2  fps    + Confronta + 📈 Graph
alto 1920x1080
55  fps    + Confronta + 📈 Graph
QHD 2560x1440
40  fps    + Confronta + 📈 Graph
QHD DLSS 2560x1440
59.1  fps    + Confronta + 📈 Graph
» Giocabile con tutti i portatili testati con dettagli alto.
medio 1920x1080
106.5  fps    + Confronta + 📈 Graph
alto 1920x1080
102  fps    + Confronta + 📈 Graph
ultra 1920x1080
83.8  fps    + Confronta + 📈 Graph
QHD 2560x1440
60.7  fps    + Confronta + 📈 Graph
QHD DLSS 2560x1440
83.9  fps    + Confronta + 📈 Graph
» Giocabile con tutti i portatili testati con dettagli ultra.
medio 1920x1080
131.1  fps    + Confronta + 📈 Graph
alto 1920x1080
97.5  fps    + Confronta + 📈 Graph
ultra 1920x1080
96  fps    + Confronta + 📈 Graph
QHD 2560x1440
72.6  fps    + Confronta + 📈 Graph
QHD DLSS 2560x1440
93.1  fps    + Confronta + 📈 Graph
» Giocabile con tutti i portatili testati con dettagli ultra.
alto 1920x1080
83  fps    + Confronta + 📈 Graph
QHD 2560x1440
74.8  fps    + Confronta + 📈 Graph
» Giocabile con tutti i portatili testati con dettagli alto.
medio 1920x1080
143.8  fps    + Confronta + 📈 Graph
alto 1920x1080
141.7  fps    + Confronta + 📈 Graph
ultra 1920x1080
141.4  fps    + Confronta + 📈 Graph
QHD 2560x1440
101.6  fps    + Confronta + 📈 Graph
» Giocabile con tutti i portatili testati con dettagli ultra.
medio 1920x1080
358  fps    + Confronta + 📈 Graph
alto 1920x1080
358  fps    + Confronta + 📈 Graph
ultra 1920x1080
357  fps    + Confronta + 📈 Graph
QHD 2560x1440
356  fps    + Confronta + 📈 Graph
» Giocabile con tutti i portatili testati con dettagli ultra.
basso 1920x1080
126  fps    + Confronta
medio 1920x1080
114  fps    + Confronta
alto 1920x1080
98  fps    + Confronta
ultra 1920x1080
74  fps    + Confronta
QHD 2560x1440
47  fps    + Confronta
» Giocabile con tutti i portatili testati con dettagli ultra.
Additional Benchmarks
Low Preset TAA 1280x720
183
basso 1920x1080
93.2 93.2 108.9 ~ 98 fps    + Confronta
medio 1920x1080
87.2 88.3 103.5 ~ 93 fps    + Confronta
alto 1920x1080
79.5 81.7 95.8 96 ~ 88 fps    + Confronta
QHD 2560x1440
54.5 54.6 63.9 64.5 ~ 59 fps    + Confronta
4K 3840x2160
33.6  fps    + Confronta
» Giocabile con tutti i portatili testati con dettagli alto.
Additional Benchmarks
High Preset + Ultra Ray Tracing 3840x2160
13.1
High Preset + Ultra Ray Tracing + Quality DLSS 3840x2160
22.9
High Preset + Ultra Ray Tracing + Quality DLSS + FG 2x 3840x2160
39.8
High Preset + Ultra Ray Tracing + Quality DLSS + FG 4x 3840x2160
72.4
basso 1920x1080
521.4  fps    + Confronta
medio 1920x1080
317.1  fps    + Confronta
alto 1920x1080
200.2  fps    + Confronta
ultra 1920x1080
161.4  fps    + Confronta
QHD 2560x1440
127.4  fps    + Confronta
» Giocabile con tutti i portatili testati con dettagli ultra.
Additional Benchmarks
Low Preset 1280x720
641.8
medio 1920x1080
316  fps    + Confronta + 📈 Graph
alto 1920x1080
265  fps    + Confronta + 📈 Graph
ultra 1920x1080
222  fps    + Confronta + 📈 Graph
QHD 2560x1440
174.1  fps    + Confronta + 📈 Graph
» Giocabile con tutti i portatili testati con dettagli ultra.
basso 1920x1080
131.6 149.4 150.4 161.7 175.1 188.6 203 ~ 166 fps    + Confronta
medio 1920x1080
127.4 134.4 138.5 139.8 156.8 166.9 169.2 178.7 ~ 151 fps    + Confronta
alto 1920x1080
115.9 117 126.4 133.9 135.4 138 143.2 144.6 154.1 ~ 134 fps    + Confronta
ultra 1920x1080
104.9 105.4 115.7 119.6 124.1 126.7 129 129.9 132.4 135.5 ~ 122 fps    + Confronta
QHD 2560x1440
68.4 71.7 75 80.8 81 81.6 82.6 84.3 87.5 ~ 79 fps    + Confronta
4K 3840x2160
35.9 37.1 37.3 ~ 37 fps    + Confronta
4K DLSS 3840x2160
57.4  fps    + Confronta
4K FSR 3840x2160
33.6  fps    + Confronta
QHD DLSS 2560x1440
81.5 83.6 91.2 91.6 93.9 94.2 102.1 ~ 91 fps    + Confronta
» Giocabile con tutti i portatili testati con dettagli ultra.
Additional Benchmarks
Low Preset (FSR off) 1280x720
206
157
Ray Tracing Ultra Preset (DLSS off) 1920x1080
60.7
Ultra Preset (FSR2 on) 1920x1080
157.7
Ray Tracing Ultra Preset (DLSS off, no Path Tracing) 3840x2160
17.7
30min Start Ultra Preset (FSR off) 1920x1080
104.9
122.6
104.9
99.1
110.5
120.5
116.2
113.2
103.9
Ray Tracing Overdrive Preset (no DLSS, no FG) 3840x2160
3.7
Ray Tracing Overdrive Preset + DLSS 4 Transformer Quality (no FG) 3840x2160
19.4
19.9
18.9
Ray Tracing Overdrive Preset + DLSS 4 Transformer Quality + Frame Generation (M)FG 2x 3840x2160
34
35.8
31
Ray Tracing Overdrive Preset + DLSS 4 Transformer Quality + Frame Generation MFG 4x 3840x2160
61.8
66.8
54
basso 1920x1080
167.7 175.8 175.9 176.3 202.6 ~ 180 fps    + Confronta + 📈 Graph
medio 1920x1080
129.1 131.1 150.1 154.7 172.8 179.1 188 ~ 158 fps    + Confronta + 📈 Graph
alto 1920x1080
108.1 111.1 131.7 137.6 151.9 154.2 161 ~ 137 fps    + Confronta + 📈 Graph
ultra 1920x1080
108.3 131.2 131.7 138.9 147.4 153.9 156 157 158.6 246.1 ~ 153 fps    + Confronta + 📈 Graph
QHD 2560x1440
91 93.9 97.6 99.1 103 108.6 109.2 112.4 175.5 ~ 110 fps    + Confronta + 📈 Graph
4K 3840x2160
46.6 59.2 91.4 ~ 66 fps    + Confronta + 📈 Graph
4K DLSS 3840x2160
72.4 94.6 102.5 ~ 90 fps    + Confronta
QHD DLSS 2560x1440
130  fps    + Confronta
» Giocabile con tutti i portatili testati con dettagli ultra.
Additional Benchmarks
Low Preset SMAA 1280x720
245
233
Far Cry 6

Far Cry 6

2021
basso 1280x720
170.9  fps    + Confronta + 📈 Graph
medio 1920x1080
150.2  fps    + Confronta + 📈 Graph
alto 1920x1080
136  fps    + Confronta + 📈 Graph
ultra 1920x1080
135.7  fps    + Confronta + 📈 Graph
QHD 2560x1440
116.7  fps    + Confronta + 📈 Graph
» Giocabile con tutti i portatili testati con dettagli ultra.
Additional Benchmarks
Low Graphics Quality 1920x1080
164.6
Ultra Graphics Quality + HD Textures + DXR TAA 1920x1080
102.4
Anno 1800

Anno 1800

2019
basso 1280x720
182.4  fps    + Confronta + 📈 Graph
medio 1920x1080
164.8  fps    + Confronta + 📈 Graph
alto 1920x1080
133.5  fps    + Confronta + 📈 Graph
ultra 1920x1080
86.4  fps    + Confronta + 📈 Graph
QHD 2560x1440
76.6  fps    + Confronta + 📈 Graph
» Giocabile con tutti i portatili testati con dettagli ultra.
Strange Brigade

Strange Brigade

2018
basso 1280x720
392 403 438 483 585 643 ~ 491 fps    + Confronta
medio 1920x1080
201 338 348 362 464 479 ~ 365 fps    + Confronta
alto 1920x1080
156.5 294 308 328 381 403 ~ 312 fps    + Confronta
ultra 1920x1080
136.4 266 276 303 337 347 353 ~ 288 fps    + Confronta
QHD 2560x1440
103.8 198.9 209 228 229 246 250 ~ 209 fps    + Confronta
4K 3840x2160
131.7 138.1 ~ 135 fps    + Confronta
» Giocabile con tutti i portatili testati con dettagli ultra.
Far Cry 5

Far Cry 5

2018
basso 1280x720
174  fps    + Confronta + 📈 Graph
medio 1920x1080
155  fps    + Confronta + 📈 Graph
alto 1920x1080
145  fps    + Confronta + 📈 Graph
ultra 1920x1080
142  fps    + Confronta + 📈 Graph
QHD 2560x1440
144  fps    + Confronta + 📈 Graph
» Giocabile con tutti i portatili testati con dettagli ultra.
Additional Benchmarks
Low Preset TAA 1920x1080
170
basso 1280x720
107.9 121.8 138.7 144.1 155.1 155.8 156.9 165 173.7 ~ 147 fps    + Confronta
medio 1920x1080
99.8 110.2 114.7 123.7 136.4 140.1 142.2 144.1 145.4 ~ 129 fps    + Confronta
alto 1920x1080
80.7 90.6 101.6 106.6 115.5 116 117.5 118.3 124.6 ~ 108 fps    + Confronta
4K 3840x2160
91.8 108.2 ~ 100 fps    + Confronta
» Giocabile con tutti i portatili testati con dettagli alto.
basso 1280x720
195.7 213 217 223 231 234 ~ 219 fps    + Confronta
medio 1920x1080
164.7 180.2 183.4 197.6 208 216 221 230 ~ 200 fps    + Confronta
alto 1920x1080
135.8 144.3 147.8 156.8 163.1 166 167.2 173.1 180.1 181.4 ~ 162 fps    + Confronta
QHD 2560x1440
107.6 109 119.7 125.2 126.2 127 129.5 132.4 134.2 139.2 ~ 125 fps    + Confronta
4K 3840x2160
74.1 77.5 78.8 ~ 77 fps    + Confronta
» Giocabile con tutti i portatili testati con dettagli alto.
basso 1280x720
166.9 170.3 209 213 223 223 228 256 263 ~ 217 fps    + Confronta
medio 1366x768
153.7 155.7 183.9 186 192.9 198.2 199.7 217 222 ~ 190 fps    + Confronta
alto 1920x1080
145.7 152.7 175.8 178.8 185.5 189.3 189.7 213 215 ~ 183 fps    + Confronta
ultra 1920x1080
134.2 141.1 164.7 165.4 171.4 174 174.8 193 193.9 ~ 168 fps    + Confronta
4K 3840x2160
170.7 173.1 ~ 172 fps    + Confronta
» Giocabile con tutti i portatili testati con dettagli ultra.
basso 1024x768
686  fps    + Confronta + 📈 Graph
medio 1366x768
517  fps    + Confronta + 📈 Graph
alto 1920x1080
341  fps    + Confronta + 📈 Graph
ultra 1920x1080
154 176.2 ~ 165 fps    + Confronta + 📈 Graph
QHD 2560x1440
130  fps    + Confronta + 📈 Graph
» Giocabile con tutti i portatili testati con dettagli ultra.
Additional Benchmarks
Medium Graphics & Postprocessing 1920x1080
394
GTA V

GTA V

2015
basso 1024x768
185.8 187.6 ~ 187 fps    + Confronta
medio 1366x768
185.4 185.6 186 187.6 ~ 186 fps    + Confronta
alto 1920x1080
164.5 179 180.2 181 184.7 ~ 178 fps    + Confronta
ultra 1920x1080
124.7 144.8 147.6 149 152.9 161 161 164.6 ~ 151 fps    + Confronta
QHD 2560x1440
117.3 123.8 138.8 139.1 143 147.3 147.3 151.4 ~ 139 fps    + Confronta
4K 3840x2160
124.2  fps    + Confronta
» Giocabile con tutti i portatili testati con dettagli ultra.
Additional Benchmarks
Highest Settings possible 16xAF 4xMSAA + FXAA 3840x2160
83.3
62.5
Normal/Off 4xAF 1920x1080
184.1
187.2
Lowest Settings possible 1920x1080
186.3
187.9
bassomedioaltoultraQHD4K
F1 252182061843621
Doom: The Dark Ages9389797854
The Elder Scrolls IV Oblivion Remastered11698844230
Assassin's Creed Shadows898270534432
Civilization 7443222201138
Monster Hunter Wilds93.184695533.4
Kingdom Come Deliverance 2189.31501248762
Indiana Jones and the Great Circle143105977537
Stalker 287756448
Call of Duty Black Ops 6150142107997337
Until Dawn99.385.967.748
Space Marine 290.988.887.773.1
Star Wars Outlaws86.877695842
Black Myth: Wukong133100784433
F1 242852712431026632
Senua's Saga Hellblade 277.25540
Ghost of Tsushima106.510283.860.7
Horizon Forbidden West131.197.59672.6
Dragon's Dogma 28374.8
Helldivers 2143.8141.7141.4101.6
Prince of Persia The Lost Crown358358357356
Avatar Frontiers of Pandora126114987447
Alan Wake 29893885933.6
Total War Pharaoh521.4317.1200.2161.4127.4
Counter-Strike 2316265222174.1
Cyberpunk 2077 2.2 Phantom Liberty1661511341227937
Baldur's Gate 318015813715311066
Far Cry 6170.9150.2136135.7116.7
Anno 1800182.4164.8133.586.476.6
Strange Brigade491365312288209135
Far Cry 5174155145142144
X-Plane 11.11147129108100
Final Fantasy XV Benchmark21920016212577
Dota 2 Reborn217190183168172
The Witcher 3686517341165130
GTA V187186178151139124.2
bassomedioaltoultraQHD4K
< 30 fps
< 60 fps
< 120 fps
≥ 120 fps


6
20


13
21

1
16
18

5
13
12
1
11
13
9

7
3
3

Per conoscere altri giochi che potrebbero essere utilizzabili e per una lista completa di tutti i giochi e delle schede grafiche visitate la nostra Gaming List

v1.33
log 12. 15:10:05

#0 ran 0s before starting gpusingle class +0s ... 0s

#1 no ids found in url (should be separated by "_") +0s ... 0s

#2 not redirecting to Ajax server +0s ... 0s

#3 did not recreate cache, as it is less than 5 days old! Created at Wed, 10 Sep 2025 11:52:14 +0200 +0.001s ... 0.001s

#4 no comparison url found in template nbc.compare_page_1 needed +0.026s ... 0.027s

#5 no comparison url found in template nbc.compare_page_1 needed +0s ... 0.027s

#6 no comparison url found in template nbc.compare_page_1 needed +0s ... 0.027s

#7 no comparison url found in template nbc.compare_page_1 needed +0s ... 0.027s

#8 no comparison url found in template nbc.compare_page_1 needed +0s ... 0.028s

#9 composed specs +0s ... 0.028s

#10 did output specs +0s ... 0.028s

#11 start showIntegratedCPUs +0s ... 0.028s

#12 getting avg benchmarks for device 12926 +0.024s ... 0.052s

#13 got single benchmarks 12926 +0.037s ... 0.089s

#14 got avg benchmarks for devices +0s ... 0.089s

#15 min, max, avg, median took s +0.999s ... 1.088s

#16 before gaming benchmark output +0s ... 1.088s

#17 Got 581 rows for game benchmarks. +0.231s ... 1.319s

#18 composed SQL query for gamebenchmarks +0s ... 1.319s

#19 got data and put it in $dataArray +0.023s ... 1.343s

#20 benchmarks composed for output. +0.287s ... 1.63s

#21 no comparison url found in template nbc.compare_page_1 needed +0.003s ... 1.633s

#22 return log +0s ... 1.633s

Recensioni Notebook con Nvidia GeForce RTX 5070 Ti Laptop la scheda grafica
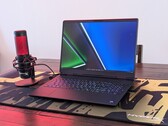
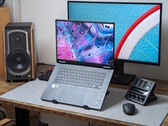
Recensione del gaming laptop XMG Focus 17 M25: La GPU più economica per laptop Nvidia RTX 5070 Ti

Recensione del gaming laptop XMG Focus 17 M25: La GPU più economica per laptop Nvidia RTX 5070 Ti

Il nuovo XMG Focus 17 M25 è il modo più conveniente per ottenere la nuova GPU per laptop Nvidia GeForce RTX 5070 Ti. Il laptop da gioco da 17 pollici è in vendi...
Intel Core i9-13900HX | Nvidia GeForce RTX 5070 Ti Laptop | 17.30" | 2.8 kg
Libro giochi Chuwi

Recensione Chuwi Gamebook: gaming Notebook con Ryzen 9 9955HX e GPU RTX 5070 Ti

Il Chuwi Gamebook ha un design dell'involucro di alta qualità con componenti più potenti. Questo avvicina il portatile ai modelli di gioco di classe superiore, ...
AMD Ryzen 9 9955HX | Nvidia GeForce RTX 5070 Ti Laptop | 16.00" | 2.5 kg
Recensione del computer portatile gaming Medion Erazer Major 16 X1: RTX 5070 Ti in overdrive

Recensione del computer portatile gaming Medion Erazer Major 16 X1: RTX 5070 Ti in overdrive

Erazer Major 16 X1 di Medion abbina un telaio robusto a prestazioni solide come la RTX 5070 Ti. Nella nostra recensione, il laptop da gioco da 16 pollici si con...
Intel Core Ultra 7 255HX | Nvidia GeForce RTX 5070 Ti Laptop | 16.00" | 2.5 kg
Recensione del Lenovo Legion Pro 5 16IAX10H OLED: Il gamer RTX 5070 Ti più potente finora

Recensione del Lenovo Legion Pro 5 16IAX10H OLED: Il gamer RTX 5070 Ti più potente finora

Cosa serve per rendere uno dei portatili da gioco più importanti dello scorso anno un modello nuovo ancora migliore? Mantenere i punti di forza e lavorare sui p...
Intel Core Ultra 9 275HX | Nvidia GeForce RTX 5070 Ti Laptop | 16.00" | 2.4 kg
Recensione dell'MSI Vector 16 HX AI: Un portatile per il gaming ricco di funzionalità con RTX 5070 Ti

Recensione dell'MSI Vector 16 HX AI: Un portatile per il gaming ricco di funzionalità con RTX 5070 Ti

Con Vector 16 HX AI, MSI offre un notebook da gioco convincente, alimentato da hardware Intel (Arrow Lake) e Nvidia (Blackwell) all'avanguardia. Tuttavia, uno s...
Intel Core Ultra 7 255HX | Nvidia GeForce RTX 5070 Ti Laptop | 16.00" | 2.6 kg

Asus ROG Zephyrus G16 2025 5070 Ti: Intel Core Ultra 9 285H, 16.00", 1.9 kg
  recensione » Recensione dell'Asus ROG Zephyrus G16 2025: un gamer più snello convince con la RTX 5070 Ti laptop

Asus ROG Zephyrus G14 2025 5070 Ti: AMD Ryzen AI 9 HX 370, 14.00", 1.6 kg
  recensione » Recensione dell'Asus ROG Zephyrus G14 2025: Il portatile RTX 5070 Ti è quasi veloce quanto il portatile RTX 5080

MSI Vector A18 HX A9W: AMD Ryzen 9 9955HX, 18.00", 3.5 kg
  recensione » Recensione del computer portatile MSI Vector A18 HX A9W: GeForce RTX 5070 Ti è la strada da percorrere

SCHENKER XMG Pro 16 (E25): Intel Core Ultra 9 275HX, 16.00", 2.5 kg
  recensione » Recensione del laptop XMG Pro 16 (E25): Il laptop RTX 5070 Ti e fino a 128 GB di RAM all'interno di un ibrido gaming/workstation

SCHENKER XMG Pro 16 (E25) Engineering Sample: Intel Core Ultra 9 275HX
  recensione » Recensione del computer portatile Nvidia GeForce RTX 5070 Ti - Di fascia alta con soli 12 GB di VRAM?

Asus ROG Strix G18 G815LR: Intel Core Ultra 9 275HX, 18.00", 3.2 kg
  Recensioni esterne » Asus ROG Strix G18 G815LR

Alienware 16 Area-51, RTX 5070 Ti: Intel Core Ultra 9 275HX, 16.00", 3.4 kg
  Recensioni esterne » Alienware 16 Area-51, RTX 5070 Ti

Lenovo Legion Pro 5 16IAX10, RTX 5070 Ti: Intel Core Ultra 9 275HX, 16.00", 2.4 kg
  Recensioni esterne » Lenovo Legion Pro 5 16IAX10, RTX 5070 Ti

Asus ROG Zephyrus G16 2025 5070 Ti: Intel Core Ultra 9 285H, 16.00", 1.9 kg
  Recensioni esterne » Asus ROG Zephyrus G16 2025 5070 Ti

Chuwi Gamebook, R9 9955HX: AMD Ryzen 9 9955HX, 16.00", 2.5 kg
  Recensioni esterne » Chuwi Gamebook, R9 9955HX

Asus ROG Zephyrus G16 GU605CR: Intel Core Ultra 9 285H, 16.00", 2 kg
  Recensioni esterne » Asus ROG Zephyrus G16 GU605CR

Asus ROG Strix G16 G615LR: Intel Core Ultra 9 275HX, 16.00", 2.7 kg
  Recensioni esterne » Asus ROG Strix G16 G615LR

Asus ROG Zephyrus G14 2025 5070 Ti: AMD Ryzen AI 9 HX 370, 14.00", 1.6 kg
  Recensioni esterne » Asus ROG Zephyrus G14 2025 5070 Ti

MSI Vector 16 HX AI A2XWHG, Ultra 9 275HX: Intel Core Ultra 9 275HX, 16.00", 2.7 kg
  Recensioni esterne » MSI Vector 16 HX AI A2XWHG, Ultra 9 275HX

Asus ROG Strix G16 G614FR: AMD Ryzen 9 9955HX3D, 16.00", 2.5 kg
  Recensioni esterne » Asus ROG Strix G16 G614FR

MSI Stealth A18 AI+ A3XWHG: AMD Ryzen AI 9 HX 370, 18.00", 2.9 kg
  Recensioni esterne » MSI Stealth A18 AI+ A3XWHG

Asus ROG Zephyrus G14 GA403WR: AMD Ryzen AI 9 HX 370, 14.00", 1.6 kg
  Recensioni esterne » Asus ROG Zephyrus G14 GA403WR

MSI Vector 16 HX AI A2XWHG: Intel Core Ultra 7 255HX, 16.00", 2.6 kg
  Recensioni esterne » MSI Vector 16 HX AI A2XWHG

Acer Predator Helios Neo 18 AI PHN18-72: Intel Core Ultra 9 275HX, 18.00", 3.3 kg
  Recensioni esterne » Acer Predator Helios Neo 18 AI PHN18-72

SCHENKER XMG Focus 17 M25: Intel Core i9-13900HX, 17.30", 2.8 kg
   » Il Focus 17 M25 di XMG con la RTX 5070 Ti è attualmente il portatile da gioco con il miglior rapporto qualità/prezzo

Chuwi Gamebook, R9 9955HX: AMD Ryzen 9 9955HX, 16.00", 2.5 kg
   » Chuwi si avventura nel gioco - notebook potente con AMD Ryzen 9 e GPU Nvidia GeForce RTX 5070 Ti recensiti

MSI Vector A18 HX A9W: AMD Ryzen 9 9955HX, 18.00", 3.5 kg
   » Questi sono i computer portatili più lenti e più veloci con grafica GeForce RTX 5070 attualmente disponibili

Lenovo Legion 5 Pro 16IAX10H: Intel Core Ultra 9 275HX, 16.00", 2.4 kg
   » Lenovo Legion Pro 5i 16 vs Legion Pro 7i 16: li abbiamo recensiti entrambi

Asus ROG Zephyrus G14 2025 5070 Ti: AMD Ryzen AI 9 HX 370, 14.00", 1.6 kg
   » Verdetto su Asus ROG Zephyrus G16: potente, ma ancora più lento del suo fratello minore G14

Asus ROG Zephyrus G16 2025 5070 Ti: Intel Core Ultra 9 285H, 16.00", 1.9 kg
   » Verdetto su Asus ROG Zephyrus G16: potente, ma ancora più lento del suo fratello minore G14

Asus ROG Zephyrus G14 2025 5070 Ti: AMD Ryzen AI 9 HX 370, 14.00", 1.6 kg
   » L'Asus ROG Zephyrus G14 non ha rivali, poiché il Razer Blade 14 è limitato alla RTX 5070 Laptop

SCHENKER XMG Pro 16 (E25): Intel Core Ultra 9 275HX, 16.00", 2.5 kg
   » Prestazioni di RTX 4080 Laptop per i soldi di RTX 4070 Laptop - XMG Pro 16 con il nuovo 5070 Ti Laptop mostra prestazioni forti nella nostra recensione

Please share our article, every link counts!
Mail Logo

Classe 1

Classe 2

GeForce RTX 2080 Super Mobile
RTX PRO 2000 Blackwell Generation Laptop *
M1 Max 32-Core GPU *
GeForce RTX 2070 Super Mobile
M1 Max 24-Core GPU *
Radeon 8050S *
Radeon RX 5700M *
M1 Pro 16-Core GPU *
Radeon PRO W6600M *
GeForce RTX 2070 Super Max-Q
M1 Pro 14-Core GPU *
RTX PRO 1000 Blackwell Generation Laptop *
Quadro P4200
RTX PRO 500 Blackwell Generation Laptop *
Radeon 8040S *
Arc 140T *
Quadro P5000 Max-Q *
Arc 130T *
GeForce RTX 3050 4GB Laptop GPU

Classe 3

Quadro P4000 Max-Q
Radeon RX 580X (Laptop) *
Radeon RX 580 (Laptop)
Radeon Pro 5300M
Radeon RX 5300M
Quadro P3000 Max-Q *
Radeon Pro WX 7100 *
Radeon RX 570X (Laptop) *
Radeon RX 570 (Laptop) *
Radeon RX 470 (Laptop) *
GeForce GTX 1050 Ti Mobile
Radeon 680M
Quadro P2000 Max-Q
Radeon R9 M395X
GeForce GTX 1050 Ti Max-Q *
WX Vega M GL
Radeon R9 M485X
GeForce GTX 1050 Max-Q *
Radeon 660M
Radeon RX 560X (Laptop)
Radeon RX 560 (Laptop)
Radeon Pro 560X
Radeon Pro 560
Radeon Pro 460
Radeon Pro WX 4130 *
Quadro P620 *
Radeon RX 550X (Laptop)
Radeon Pro 555X
Radeon Pro 555
Radeon Pro 455
Quadro P600
Arc Graphics 3-core (Arrow Lake) *
Radeon RX 540X *
Radeon Pro WX 2100 *
Radeon Pro WX 3100 *
Arc Graphics 2-core (Arrow Lake) *
Radeon Pro 450
Radeon 630
Radeon 540X *
Quadro P520
Quadro P500 *
Iris Plus Graphics G7 (Ice Lake 64 EU) *
Vega 10 *
Iris Pro Graphics 580
Vega 9
FirePro W5130M
UHD Graphics Xe G4 48EUs *
UHD Graphics 32EUs
UHD Graphics Xe 32EUs (Tiger Lake-H) *
UHD Graphics 750
UHD Graphics 730
Vega 7
Radeon R7 M465
Vega 8
Iris Plus Graphics G4 (Ice Lake 48 EU)
Quadro M600M
FirePro W4190M
Radeon R7 M445
UHD Graphics 24EUs (Alder Lake-N) *
Radeon R7 M340
Radeon 610M *
UHD Graphics G1 (Ice Lake 32 EU)
UHD Graphics Xe 16EUs (Tiger Lake-H) *
Radeon R5 (Bristol Ridge)
Adreno 690 *
Adreno 685 *
Adreno 680 *

Classe 4

Posizione approssimativa dell'adattatore grafico

Klaus Hinum, 2025-07-29 (Update: 2025-07-29)