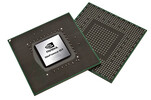
NVIDIA GeForce GT 720M

La NVIDIA GeForce GT 720M è una scheda grafica entry-level, DirectX 11 compatibile annunciata nella primavera 2013. Il suo core si basa sul chip GF117 da 28nm (architettura Fermi) con memoria DDR3 64-bit. Rispetto alla 710M, la GT 720M ha un clock leggermente superiore.
Architettura
Il GF117 si basa sul chip GF108 Fermi ottimizzato (GeForce GT 540M) ed offre 96 shaders, 16 TMUs e 4 ROPs. Ogni shader core ha un clock veloce il doppio rispetto al resto del chip grafico, una tecnica conosciuta come hot clocking. Maggiori dettagli ed informazioni sul Fermi possono essere reperite sulla pagina della GPU GT 435M.
Bisogna considerare che il GF117 non offre porte grafiche dedicate e pertanto può essere usata solo unitamente ad Optimus.
La GT 720M supporta il GPU Boost 2.0, che può effettuare l'overclock automatico della scheda se il sistema di raffreddamento del laptop lo consente. Questa feature è disponibile su qualsiasi notebook con una scheda grafica della serie 700M.
Prestazioni
In base ai clock rates, le prestazioni 3D della GeForce GT 720M si attestano sopra la vecchia GT 620M, ma nettamente sotto la GT 630M nella maggioranza dei casi. Questo dipende dall'interfaccia di memoria a 64 bit, che limita notevolmente le prestazioni. Rispetto alla concorrenza, la 720M offre prestazioni simili alla HD Graphics 4400/4600 o alla Radeon HD 8570M. Nel complesso, la scheda si colloca nel segmento di prestazioni basse. I giochi attuali (del 2013) girano in modo fluido solo con settaggi bassi.
Features
Gli shader cores (chiamati anche CUDA cores) possono essere usati per calcoli generici con APIs come CUDA, DirectCompute 2.1 ed OpenCL. Teoricamente è possibile usare PhysX, ma la GT 720M è troppo lenta per gestire insieme PhysX ed il rendering 3D dei giochi moderni. Il 3D Vision non è supportato secondo quanto dichiara Nvidia.
Consumo energetico
Il consumo energetico della Geforce GT 720M dovrebbe essere relativamente elevato (circa 25 W), a causa dell'elevato clock rates. Ne consegue che, la GPU è più adatta per portatili a partire dal 14-15 pollici.
Produttore | NVIDIA |
GeForce GT 700M Serie | |
Nome in codice | N14M-GE |
Architettura | Fermi |
Pipelines | 96 - unified |
Velocità del core | 625 - 938 (Boost) MHz |
Velocità de Shader | 1250 - 1876 MHz |
Velocità della memoria | 1800 - 2000 MHz |
Larghezza del bus di memoria | 64 Bit |
Tipo di memoria | DDR3 |
Max. quantità di memoria | 2048 MB |
Memoria condivisa | no |
DirectX | DirectX 11, Shader 5.0 |
tecnologia | 28 nm |
Caratteristiche | PhysX, Verde Drivers,
CUDA, Play, Optimus, GPU Boost 2.0 |
Dimensione del portatile | misura media |
Data dell'annuncio | 01.04.2013 |
Benchmark
Performance Rating - 3DMark 11 + Fire Strike + Time Spy
5.1 pt (5%)
...
AMD Radeon R5 (Carrizo) 0%
AMD Radeon R7 M340 1%
AMD Radeon R7 M260 2%
...
AMD Radeon RX 6800 XT 1787%
3DMark - 3DMark Ice Storm Unlimited Graphics
59694 Points (9%)
MSI CX61-i572M | 4200M | 8192 MB | 938 / MHz | 2048MB | 59694 |
...
Qualcomm Adreno 619 -7%
AMD Radeon R5 (Bristol Ridge) -3%
AMD Radeon R6 M340DX 0%
Apple A10 Fusion GPU / PowerVR 2%
Intel UHD Graphics 615 3%
...
3DMark - 3DMark Ice Storm Extreme Graphics
28203 Points (4%)
MSI CX61-i572M | 4200M | 8192 MB | 938 / MHz | 2048MB | 28203 |
...
Intel UHD Graphics 615 -4%
AMD Radeon R5 (Carrizo) 17%
...
AMD Radeon RX 6800 XT 1397%
3DMark - 3DMark Cloud Gate Score
min: 3819 media: 4494 media: 4522 (6%) massimo: 5443 Points
...
AMD Radeon R7 M260 -3%
AMD Radeon R5 (Carrizo) -3%
Intel UHD Graphics 615 2%
AMD Radeon HD 6450 GDDR5 2%
...
AMD Radeon RX 6800 XT 1495%
3DMark - 3DMark Cloud Gate Graphics
min: 4812 media: 5304 media: 5426 (3%) massimo: 5670 Points
...
AMD Radeon R5 M315 -5%
...
3DMark - 3DMark Fire Strike Standard Score
min: 668 media: 757 media: 779 (2%) massimo: 783 Points
...
Intel UHD Graphics 615 -3%
...
AMD Radeon RX 6900 XT 5059%
3DMark - 3DMark Fire Strike Standard Graphics
min: 714 media: 802 media: 822 (2%) massimo: 834 Points
...
Intel UHD Graphics 615 2%
...
AMD Radeon RX 6900 XT 6208%
3DMark - 3DMark Ice Storm Graphics
min: 46704 media: 53196 media: 52259.5 (7%) massimo: 61035 Points
...
AMD Radeon R6 M340DX -3%
AMD Radeon R5 (Bristol Ridge) -3%
AMD Radeon Pro WX Vega M GL 0%
AMD Radeon RX 550X (Laptop) 3%
...
AMD Radeon RX 6800 XT 753%
3DMark 11 - 3DM11 Performance Score
min: 1070 media: 1262 media: 1321 (3%) massimo: 1358 Points
...
Intel UHD Graphics 615 0%
AMD Radeon HD 6730M 1%
AMD Radeon HD 6750M 2%
...
AMD Radeon RX 6900 XT 3261%
3DMark 11 - 3DM11 Performance GPU
min: 962 media: 1143 media: 1213 (2%) massimo: 1218 Points
...
AMD Radeon HD 6730M 0%
AMD Radeon HD 6750M 0%
Intel UHD Graphics 615 2%
...
AMD Radeon RX 6900 XT 5072%
3DMark Vantage
3DM Vant. Perf. total +3DMark Vantage - 3DM Vant. Perf. total
min: 4022 media: 4582 media: 4584.5 (4%) massimo: 5137 Points
...
AMD Radeon HD 6730M -3%
ATI Mobility Radeon HD 5830 4%
...
AMD Radeon RX 6800 XT 2006%
3DM Vant. Perf. GPU no PhysX +3DMark Vantage - 3DM Vant. Perf. GPU no PhysX
min: 3484 media: 3868 media: 3931.5 (4%) massimo: 4123 Points
...
AMD Radeon HD 6730M -3%
...
3DMark 2001SE - 3DMark 2001 - Standard
15036 Points (16%)
MSI CX61-i572M | 4200M | 8192 MB | 938 / MHz | 2048MB | 15036 |
...
ATI Radeon HD 4350 2%
...
3DMark 03 - 3DMark 03 - Standard
20881 Points (11%)
MSI CX61-i572M | 4200M | 8192 MB | 938 / MHz | 2048MB | 20881 |
VIA S3 Graphics ProSavage8 -100%
...
ATI Radeon HD 5570 0%
ATI Mobility Radeon HD 5165 0%
...
3DMark 05 - 3DMark 05 - Standard
min: 12260 media: 13952 media: 13951.5 (20%) massimo: 15643 Points
Intel Graphics Media Accelerator (GMA) 500 -99%
...
ATI Mobility Radeon HD 5730 -1%
...
3DMark 06 3DMark 06 - Standard 1280x1024 +min: 6822 media: 7750 media: 7896 (15%) massimo: 8415 Points
...
AMD Radeon HD 6755G2 -5%
AMD Radeon R7 M260 -1%
AMD Radeon HD 6730M 2%
ATI Mobility Radeon HD 5830 3%
...
AMD Radeon RX 6800 XT 509%
Unigine Heaven 3.0 - Unigine Heaven 3.0 DX 11
11.6 fps (4%)
MSI CX61-i572M | 4200M | 8192 MB | 938 / MHz | 2048MB | 11.6 |
...
...
Unigine Heaven 3.0 - Unigine Heaven 3.0 OpenGL
11.6 fps (5%)
MSI CX61-i572M | 4200M | 8192 MB | 938 / MHz | 2048MB | 11.6 |
...
AMD FirePro W2100 -3%
AMD Radeon R7 M260 -3%
...
Unigine Heaven 2.1 - Heaven 2.1 high
15.1 fps (3%)
MSI CX61-i572M | 4200M | 8192 MB | 938 / MHz | 2048MB | 15.1 |
...
AMD Radeon HD 6720G2 -2%
AMD Radeon HD 6750M 1%
AMD Radeon R6 M340DX 1%
ATI Radeon HD 5570 5%
...
SPECviewperf 11
specvp11 snx-01 +SPECviewperf 11 - specvp11 snx-01
min: 3.12 media: 3.8 media: 3.8 (3%) massimo: 4.51 fps
MSI CX61-i572M | 4200M | 8192 MB | 938 / MHz | 2048MB | 3.12 |
Lenovo IdeaPad S510p 59-405717 | 4200U | 4096 MB | | 2048MB | 4.51 |
...
AMD Radeon HD 6540G2 9%
NVIDIA GeForce 930MX 9%
AMD Radeon HD 6720G2 10%
...
AMD Radeon Pro Vega 56 3565%
specvp11 tcvis-02 +SPECviewperf 11 - specvp11 tcvis-02
min: 1.21 media: 1.3 media: 1.3 (2%) massimo: 1.34 fps
MSI CX61-i572M | 4200M | 8192 MB | 938 / MHz | 2048MB | 1.21 |
Lenovo IdeaPad S510p 59-405717 | 4200U | 4096 MB | | 2048MB | 1.34 |
...
NVIDIA GeForce 930MX 11%
...
specvp11 sw-02 +SPECviewperf 11 - specvp11 sw-02
min: 7.83 media: 8.6 media: 8.6 (10%) massimo: 9.37 fps
MSI CX61-i572M | 4200M | 8192 MB | 938 / MHz | 2048MB | 7.83 |
Lenovo IdeaPad S510p 59-405717 | 4200U | 4096 MB | | 2048MB | 9.37 |
...
AMD Radeon HD 6720G2 7%
AMD Radeon HD 6540G2 9%
NVIDIA GeForce 930MX 9%
...
AMD Radeon Pro Vega 56 862%
specvp11 proe-05 +SPECviewperf 11 - specvp11 proe-05
min: 1.24 media: 1.3 media: 1.3 (6%) massimo: 1.4 fps
Lenovo IdeaPad S510p 59-405717 | 4200U | 4096 MB | | 2048MB | 1.24 |
MSI CX61-i572M | 4200M | 8192 MB | 938 / MHz | 2048MB | 1.4 |
...
NVIDIA GeForce GTX 680M 4%
ATI Radeon HD 5850 7%
...
specvp11 maya-03 +SPECviewperf 11 - specvp11 maya-03
min: 6.42 media: 7.8 media: 7.8 (6%) massimo: 9.18 fps
Lenovo IdeaPad S510p 59-405717 | 4200U | 4096 MB | | 2048MB | 6.42 |
MSI CX61-i572M | 4200M | 8192 MB | 938 / MHz | 2048MB | 9.18 |
NVIDIA GeForce GTX 580 -81%
...
AMD Radeon R7 M340 2%
...
AMD Radeon Pro Vega 56 1605%
specvp11 lightwave-01 +SPECviewperf 11 - specvp11 lightwave-01
min: 12.81 media: 14.8 media: 14.8 (16%) massimo: 16.76 fps
Lenovo IdeaPad S510p 59-405717 | 4200U | 4096 MB | | 2048MB | 12.81 |
MSI CX61-i572M | 4200M | 8192 MB | 938 / MHz | 2048MB | 16.76 |
...
...
AMD Radeon Pro Vega 56 530%
specvp11 ensight-04 +SPECviewperf 11 - specvp11 ensight-04
min: 15.38 media: 15.9 media: 15.9 (8%) massimo: 16.41 fps
MSI CX61-i572M | 4200M | 8192 MB | 938 / MHz | 2048MB | 15.38 |
Lenovo IdeaPad S510p 59-405717 | 4200U | 4096 MB | | 2048MB | 16.41 |
...
AMD Radeon R7 M260 -4%
AMD Radeon R7 M340 4%
ATI Radeon HD 5850 7%
...
specvp11 catia-03 +SPECviewperf 11 - specvp11 catia-03
min: 6.7 media: 6.9 media: 6.9 (8%) massimo: 7.1 fps
Lenovo IdeaPad S510p 59-405717 | 4200U | 4096 MB | | 2048MB | 6.7 |
MSI CX61-i572M | 4200M | 8192 MB | 938 / MHz | 2048MB | 7.1 |
...
AMD Radeon HD 6730M -11%
NVIDIA GeForce GTX 680M -2%
AMD Radeon HD 6970M 0%
...
Windows 7 Experience Index - Win7 Gaming graphics
6.5 Points (82%)
MSI CX61-i572M | 4200M | 8192 MB | 938 / MHz | 2048MB | 6.5 |
Intel Graphics Media Accelerator (GMA) 500 -64%
...
...
Windows 7 Experience Index - Win7 Graphics
5.1 Points (65%)
MSI CX61-i572M | 4200M | 8192 MB | 938 / MHz | 2048MB | 5.1 |
...
...
Cinebench R10 Cinebench R10 Shading (32bit) +Cinebench R10 - Cinebench R10 Shading (32bit)
min: 5172 media: 5932 media: 5824 (27%) massimo: 6667 punti
Intel Graphics Media Accelerator (GMA) 500 -100%
...
...
AMD Radeon RX 5700 XT (Desktop) 257%
Cinebench R11.5 Cinebench R11.5 OpenGL 64 Bit +Cinebench R11.5 - Cinebench R11.5 OpenGL 64 Bit
min: 21.45 media: 27.4 media: 28.4 (13%) massimo: 31.07 fps
...
AMD Radeon HD 6550D -3%
AMD Radeon R7 M340 -2%
...
AMD Radeon RX 6800 XT 520%
Cinebench R15
Cinebench R15 OpenGL 64 Bit +Cinebench R15 - Cinebench R15 OpenGL 64 Bit
min: 32.82 media: 35.7 media: 36 (10%) massimo: 37.77 fps
...
AMD Radeon R7 M340 -5%
AMD Radeon R7 M260 -4%
AMD FirePro W2100 -1%
Intel UHD Graphics 617 10%
...
AMD Radeon RX 6800 XT 651%
Cinebench R15 OpenGL Ref. Match 64 Bit +Cinebench R15 - Cinebench R15 OpenGL Ref. Match 64 Bit
99.6 % (100%)
...
NVIDIA Quadro P600 0%
NVIDIA Quadro P620 0%
...
GFXBench (DX / GLBenchmark) 2.7
GLBench 2.7 T-Rex HD Offscreen C24Z16 +GFXBench (DX / GLBenchmark) 2.7 - GLBench 2.7 T-Rex HD Offscreen C24Z16
50 fps (0%)
...
AMD Radeon R2 (Stoney Ridge) -15%
Intel HD Graphics (Broadwell) -6%
Qualcomm Adreno 512 -4%
PowerVR GM9446 14%
AMD Radeon R4 (Stoney Ridge) 14%
Qualcomm Adreno 616 25%
...
GLBench 2.7 T-Rex HD Onscreen C24Z16 +GFXBench (DX / GLBenchmark) 2.7 - GLBench 2.7 T-Rex HD Onscreen C24Z16
48 fps (1%)
...
ARM Mali-G52 MP2 -10%
Qualcomm Adreno 512 -2%
Intel UHD Graphics 615 2%
PowerVR GM9446 2%
Intel HD Graphics (Broadwell) 5%
ARM Mali-T880 MP12 8%
ARM Mali-G71 MP8 9%
...
LuxMark v2.0 64Bit - LuxMark v2.0 Room GPU
min: 60 media: 139 media: 139 (1%) massimo: 218 Samples/s
...
AMD FirePro W2100 -1%
...
LuxMark v2.0 64Bit - LuxMark v2.0 Sala GPU
min: 108 media: 239 media: 239 (1%) massimo: 370 Samples/s
...
AMD FirePro W2100 2%
AMD Radeon R7 M340 15%
...
AMD Radeon RX 6900 XT 13038%
ComputeMark v2.1 - ComputeMark v2.1 Result
min: 674 media: 679 media: 678.5 (1%) massimo: 683 punti
...
AMD Radeon R4 (Stoney Ridge) -10%
...
- Valori di benchmark per questa scheda grafica

- Valori medi di benchmark per questa scheda grafica
* Numeri più piccoli rappresentano prestazioni supeiori
Benchmarks per i giochi
I seguenti benchmarks deirivano dai benchmarks dei portatili recensiti. Le prestazioni dipendono dalla scheda grafica utilizzata, dal clock rate, dal processore, dai settaggi di sistema, dai drivers, e dai sistemi operativi. Quindi i risultati non sono rappresentativi per i portatili con questa GPU. Per informazioni dettagliate sui risultati del benchmark, cliccate sul numero di fps.
AMD Radeon R4 (Stoney Ridge) -37%
AMD Radeon R5 (Bristol Ridge) -10%
Intel HD Graphics 630 19%
Intel UHD Graphics G1 (Ice Lake 32 EU) 87%
NVIDIA GeForce 930MX 119%
...
AMD Radeon RX 6800 XT 2454%
» Il Benchmark indica che il gioco non è utilizzabile con i settaggi testati.
AMD Radeon R4 (Stoney Ridge) -46%
AMD Radeon R5 (Bristol Ridge) -22%
Intel UHD Graphics 630 8%
AMD Radeon RX Vega 10 31%
Intel UHD Graphics G1 (Ice Lake 32 EU) 55%
Intel Iris Plus Graphics G7 (Ice Lake 64 EU) 83%
...
» Il Benchmark indica che il gioco non è utilizzabile con i settaggi testati.
AMD Radeon R4 (Stoney Ridge) -57%
...
AMD Radeon R5 (Bristol Ridge) -43%
Intel HD Graphics 630 -16%
Intel Iris Plus Graphics G7 (Ice Lake 64 EU) -15%
Intel UHD Graphics G1 (Ice Lake 32 EU) 4%
Intel Iris Plus Graphics G4 (Ice Lake 48 EU) 22%
NVIDIA GeForce 930MX 44%
AMD Radeon RX Vega 8 (Ryzen 2000/3000) 54%
...
» Il Benchmark indica che il gioco non è utilizzabile con i settaggi testati.
AMD Radeon R4 (Stoney Ridge) -50%
AMD Radeon R5 (Bristol Ridge) -40%
Intel HD Graphics 630 10%
Intel UHD Graphics G1 (Ice Lake 32 EU) 70%
AMD Radeon RX Vega 8 (Ryzen 2000/3000) 85%
...
» Il Benchmark indica che il gioco non è utilizzabile con i settaggi testati.
AMD Radeon R5 (Bristol Ridge) -26%
Intel UHD Graphics G1 (Ice Lake 32 EU) 24%
Intel HD Graphics 630 26%
Intel Iris Plus Graphics G7 (Ice Lake 64 EU) 49%
Intel Iris Plus Graphics G4 (Ice Lake 48 EU) 65%
...
Intel HD Graphics 630 13%
Intel UHD Graphics G1 (Ice Lake 32 EU) 29%
Intel Iris Plus Graphics G7 (Ice Lake 64 EU) 51%
Intel UHD Graphics 630 67%
Intel Iris Plus Graphics G4 (Ice Lake 48 EU) 96%
...
» Giocabile con tutti i portatili testati con dettagli basso.
Intel UHD Graphics 615 -49%
AMD Radeon R4 (Stoney Ridge) -43%
AMD Radeon R5 (Bristol Ridge) -29%
NVIDIA GeForce GT 710 -5%
Intel HD Graphics 630 -1%
Intel UHD Graphics 630 24%
Intel UHD Graphics G1 (Ice Lake 32 EU) 25%
NVIDIA Quadro P520 69%
...
AMD Radeon RX 6900 XT 1278%
» Il Benchmark indica che il gioco non è utilizzabile con i settaggi testati.
Intel UHD Graphics 615 -12%
AMD Radeon R4 (Stoney Ridge) -6%
AMD Radeon R5 (Bristol Ridge) 19%
Intel HD Graphics 630 71%
Intel UHD Graphics 630 88%
...
» Il Benchmark indica che il gioco non è utilizzabile con i settaggi testati.
...
AMD Radeon R4 (Stoney Ridge) -50%
Intel UHD Graphics 615 -45%
AMD Radeon R5 (Bristol Ridge) -23%
NVIDIA Quadro P520 36%
Intel UHD Graphics 630 59%
Intel HD Graphics 630 59%
Intel UHD Graphics G1 (Ice Lake 32 EU) 80%
...
» Il Benchmark indica che il gioco non è utilizzabile con i settaggi testati.
...
AMD Radeon R4 (Stoney Ridge) -36%
Intel UHD Graphics 615 -30%
AMD Radeon R5 (Bristol Ridge) -28%
Intel HD Graphics 630 -8%
Intel UHD Graphics G1 (Ice Lake 32 EU) 28%
Intel Iris Plus Graphics G7 (Ice Lake 64 EU) 49%
NVIDIA GeForce 930MX 71%
...
AMD Radeon RX 6900 XT 1167%
» Il Benchmark indica che il gioco non è utilizzabile con i settaggi testati.
Intel UHD Graphics 615 -58%
AMD Radeon R5 (Bristol Ridge) -50%
Intel UHD Graphics G1 (Ice Lake 32 EU) 25%
Intel HD Graphics 630 25%
Intel Iris Plus Graphics G4 (Ice Lake 48 EU) 75%
Intel UHD Graphics 630 92%
...
AMD Radeon RX 6800 XT 1933%
» Il Benchmark indica che il gioco non è utilizzabile con i settaggi testati.
Intel UHD Graphics 615 -9%
AMD Radeon R4 (Stoney Ridge) 25%
AMD Radeon R5 (Bristol Ridge) 38%
Intel HD Graphics 630 66%
...
» Il Benchmark indica che il gioco non è utilizzabile con i settaggi testati.
AMD Radeon R5 (Bristol Ridge) -69%
Intel HD Graphics 630 -6%
AMD Radeon RX Vega 8 (Ryzen 2000/3000) 10%
Intel Iris Plus Graphics G7 (Ice Lake 64 EU) 22%
Intel UHD Graphics 630 32%
AMD Radeon RX Vega 10 77%
NVIDIA GeForce 930MX 88%
...
» Il Benchmark indica che il gioco non è utilizzabile con i settaggi testati.
...
Intel UHD Graphics 615 -30%
AMD Radeon R5 (Bristol Ridge) -20%
NVIDIA GeForce GT 710 10%
Intel HD Graphics 630 20%
Intel UHD Graphics G1 (Ice Lake 32 EU) 40%
Intel UHD Graphics 630 70%
...
» Il Benchmark indica che il gioco non è utilizzabile con i settaggi testati.
...
Intel UHD Graphics 615 -22%
AMD Radeon R4 (Stoney Ridge) -9%
NVIDIA GeForce GT 710 -3%
AMD Radeon R5 (Bristol Ridge) 0%
...
AMD Radeon RX 6900 XT 3368%
» Il Benchmark indica che il gioco non è utilizzabile con i settaggi testati.
...
Intel UHD Graphics 615 -49%
AMD Radeon R4 (Stoney Ridge) -29%
AMD Radeon R5 (Bristol Ridge) -17%
Intel HD Graphics 630 41%
Intel UHD Graphics G1 (Ice Lake 32 EU) 67%
...
» Il Benchmark indica che il gioco non è utilizzabile con i settaggi testati.
AMD Radeon R4 (Stoney Ridge) 27%
Intel UHD Graphics 615 33%
AMD Radeon R5 (Bristol Ridge) 51%
Intel Iris Plus Graphics G7 (Ice Lake 64 EU) 68%
Intel HD Graphics 630 85%
...
» Il Benchmark indica che il gioco non è utilizzabile con i settaggi testati.
...
Intel UHD Graphics 615 -44%
AMD Radeon R4 (Stoney Ridge) -26%
AMD Radeon R5 (Bristol Ridge) -24%
NVIDIA Quadro P520 66%
AMD Radeon RX Vega 10 108%
NVIDIA GeForce 930MX 110%
...
NVIDIA GeForce GTX 1080 (Desktop) 778%
Intel UHD Graphics 615 -66%
AMD Radeon R4 (Stoney Ridge) -65%
NVIDIA GeForce 930MX 7%
AMD Radeon RX Vega 10 12%
AMD Radeon RX Vega 8 (Ryzen 2000/3000) 21%
AMD Radeon 540X 38%
NVIDIA Quadro P520 54%
...
NVIDIA GeForce RTX 2080 Super Mobile 1028%
» Il Benchmark indica che il gioco non è utilizzabile con i settaggi testati.
Intel UHD Graphics 615 -55%
Intel Iris Xe Graphics G7 80EUs -38%
AMD Radeon R5 (Bristol Ridge) -27%
Intel HD Graphics 630 15%
Intel UHD Graphics G1 (Ice Lake 32 EU) 54%
Intel UHD Graphics 630 74%
Intel Iris Plus Graphics G7 (Ice Lake 64 EU) 99%
...
AMD Radeon RX 6900 XT 1408%
» Il Benchmark indica che il gioco non è utilizzabile con i settaggi testati.
...
AMD Radeon R5 (Bristol Ridge) -32%
AMD Radeon R4 (Stoney Ridge) -28%
Intel UHD Graphics 615 -7%
Intel HD Graphics 630 31%
Intel UHD Graphics 630 57%
...
AMD Radeon R4 (Stoney Ridge) -20%
Intel UHD Graphics 615 7%
Intel HD Graphics 630 45%
Intel UHD Graphics 630 63%
...
NVIDIA GeForce GTX 1080 (Desktop) 1512%
» Giocabile con tutti i portatili testati con dettagli basso.
AMD Radeon R5 (Bristol Ridge) -26%
Intel HD Graphics 630 9%
Intel UHD Graphics 630 19%
...
NVIDIA Titan RTX 329%
» Il Benchmark indica che il gioco non è utilizzabile con i settaggi testati.
AMD Radeon R4 (Stoney Ridge) -20%
Intel UHD Graphics 615 -8%
AMD Radeon R5 (Bristol Ridge) 10%
Intel HD Graphics 630 35%
Intel UHD Graphics 630 54%
...
» Il Benchmark indica che il gioco non è utilizzabile con i settaggi testati.
AMD Radeon R4 (Stoney Ridge) -37%
AMD Radeon R5 (Bristol Ridge) -36%
Intel UHD Graphics 630 86%
...
» Il Benchmark indica che il gioco non è utilizzabile con i settaggi testati.
Intel UHD Graphics 615 -22%
Intel UHD Graphics 630 22%
Intel UHD Graphics G1 (Ice Lake 32 EU) 56%
AMD Radeon RX Vega 10 78%
...
» Il Benchmark indica che il gioco non è utilizzabile con i settaggi testati.
Intel UHD Graphics 615 -7%
AMD Radeon R5 (Bristol Ridge) 14%
Intel Iris Plus Graphics G7 (Ice Lake 64 EU) 57%
...
AMD Radeon RX 6900 XT 2400%
» Il Benchmark indica che il gioco non è utilizzabile con i settaggi testati.
Intel HD Graphics 630 -26%
Intel UHD Graphics 630 17%
AMD Radeon RX Vega 10 54%
...
Intel HD Graphics 630 -34%
Intel UHD Graphics 630 -2%
AMD Radeon RX Vega 10 47%
AMD Radeon RX Vega 8 (Ryzen 2000/3000) 90%
...
» Giocabile con tutti i portatili testati con dettagli basso.
...
Intel UHD Graphics 615 -17%
AMD Radeon R4 (Stoney Ridge) -8%
AMD Radeon R5 (Bristol Ridge) -8%
Intel HD Graphics 630 17%
Intel UHD Graphics G1 (Ice Lake 32 EU) 25%
Intel Iris Plus Graphics G4 (Ice Lake 48 EU) 36%
Intel UHD Graphics 630 42%
...
AMD Radeon RX 6900 XT 1967%
Intel HD Graphics 630 25%
Intel UHD Graphics 630 50%
Intel UHD Graphics G1 (Ice Lake 32 EU) 75%
AMD Radeon RX Vega 9 100%
...
AMD Radeon RX 6900 XT 5450%
» Il Benchmark indica che il gioco non è utilizzabile con i settaggi testati.
...
AMD Radeon R4 (Stoney Ridge) -37%
AMD Radeon R5 (Bristol Ridge) -21%
Intel HD Graphics 630 37%
...
» Il Benchmark indica che il gioco non è utilizzabile con i settaggi testati.
AMD Radeon R4 (Stoney Ridge) -78%
AMD Radeon R5 (Bristol Ridge) -23%
Intel UHD Graphics 615 3%
Intel HD Graphics 630 19%
AMD Radeon RX Vega 10 52%
Intel UHD Graphics 630 81%
Intel Iris Plus Graphics G7 (Ice Lake 64 EU) 96%
...
NVIDIA GeForce GTX 1650 Super (Desktop) 1739%
» Il Benchmark indica che il gioco non è utilizzabile con i settaggi testati.
AMD Radeon R5 (Bristol Ridge) -41%
Intel UHD Graphics 630 7%
Intel HD Graphics 630 30%
AMD Radeon RX Vega 10 62%
...
AMD Radeon Pro 555 287%
» Il Benchmark indica che il gioco non è utilizzabile con i settaggi testati.
...
AMD Radeon R5 (Bristol Ridge) -50%
Intel UHD Graphics 615 -40%
NVIDIA GeForce GT 710 10%
Intel HD Graphics 630 30%
Intel UHD Graphics 630 40%
...
» Il Benchmark indica che il gioco non è utilizzabile con i settaggi testati.
...
Intel Iris Plus Graphics G7 (Ice Lake 64 EU) -7%
AMD Radeon 540X -5%
AMD Radeon RX Vega 10 -2%
Intel UHD Graphics G1 (Ice Lake 32 EU) 6%
AMD Radeon RX Vega 7 10%
Intel HD Graphics 630 12%
Intel Iris Plus Graphics G4 (Ice Lake 48 EU) 20%
Intel UHD Graphics 630 23%
...
...
AMD Radeon R4 (Stoney Ridge) -38%
Intel UHD Graphics 615 -32%
AMD Radeon R5 (Bristol Ridge) -27%
Intel UHD Graphics 630 46%
Intel HD Graphics 630 47%
Intel Iris Plus Graphics G7 (Ice Lake 64 EU) 50%
Intel UHD Graphics G1 (Ice Lake 32 EU) 53%
Intel Iris Plus Graphics G4 (Ice Lake 48 EU) 80%
...
» Giocabile con tutti i portatili testati con dettagli basso.
...
Intel UHD Graphics G1 (Ice Lake 32 EU) -7%
Intel Iris Plus Graphics G4 (Ice Lake 48 EU) -7%
AMD Radeon RX Vega 10 -3%
AMD Radeon RX 550X (Laptop) 2%
AMD Radeon RX Vega 8 (Ryzen 2000/3000) 3%
NVIDIA GeForce GT 710 7%
AMD Radeon 540X 10%
Intel Iris Plus Graphics G7 (Ice Lake 64 EU) 16%
Intel HD Graphics 630 20%
...
...
Intel UHD Graphics 617 -12%
Intel UHD Graphics 630 -7%
Intel Iris Plus Graphics G7 (Ice Lake 64 EU) -1%
NVIDIA GeForce GT 710 2%
AMD Radeon RX Vega 10 17%
Intel HD Graphics 630 23%
AMD Radeon RX Vega 8 (Ryzen 2000/3000) 27%
AMD Radeon 540X 31%
...
...
Intel UHD Graphics G1 (Ice Lake 32 EU) -18%
Intel UHD Graphics 617 -15%
Intel UHD Graphics 630 -9%
NVIDIA GeForce GT 710 -2%
Intel Iris Plus Graphics G7 (Ice Lake 64 EU) -1%
AMD Radeon RX Vega 10 10%
Intel HD Graphics 630 16%
AMD Radeon RX Vega 8 (Ryzen 2000/3000) 21%
AMD Radeon 540X 23%
AMD Radeon RX 550X (Laptop) 26%
Intel UHD Graphics Xe G4 48EUs 48%
...
» Il Benchmark indica che il gioco non è utilizzabile con i settaggi testati.
...
AMD Radeon R5 (Bristol Ridge) -25%