Intel HD Graphics 6000

L'Intel HD Graphics 6000 (GT3) Þ una scheda grafica Broadwell integrata presentata ad inizio 2015. Si trova in molti SoCs low-voltage (15 W TDP) come il Core i5-5250U o l'i7-5650U. La cosiddetta GPU GT3 offre 48 EUs (execution Units) e quindi un po' di potenza shader in pi¨ rispetto alla precedente HD 5000 (40 EUs). In base alla specifica CPU, la frequenza massima GPU varia tra 950 e 1000 MHz.
Architettura e Features
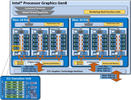
Il Broadwell sfrutta una GPU basata sull'architettura Intel Gen8, che Þ stata ottimizzata in vari aspetti rispetto alla precedente Gen7.5 (Haswell). Tra l'altro, gli shader arrays chiamati "subslice" sono stati riorganizzati ed ora offrono 8 Execution Units (EUs) ciascuno. Tre subslices formano una "slice" per un totale di 24 EUs. Unitamente con altri miglioramenti come caches L1 maggiore e frontend ottimizzato, la GPU integrata Þ diventata pi¨ veloce e pi¨ efficiente rispetto al suo predecessore.
L'HD Graphics 6000 rappresenta la versione top-end della famiglia di GPU Broadwell e consiste in due slices con 48 EUs. Oltre questa, c'Þ anche una variante low-end (GT1, 12 EUs), una mid-range (GT2, 24 EUs) e una high-end (GT3e, 48 EUs + eDRAM).
Tutte le GPUs Broadwell supportano OpenCL 2.0 e DirectX 11.2. Il motore video ora pu‗ decodificare l'H.265 usando entrambe le funzioni hardware e gli GPU shaders. Possono essere collegati fino a tre displays tramite DP 1.2/eDP 1.3 (max. 3840 x 2160 @ 60 Hz) o HDMI 1.4a (max. 3840 x 2160 @ 24 Hz). Tuttavia l'HDMI 2.0, non Þ supportato.
Performance
In base alla specifica CPU, la frequenza massima della GPU varia tra 950 e 1000 MHz. A causa del basso TDP, tuttavia, il clock medio nelle applicazioni 3D sarÓ nettamente inferiore. Ci aspettiamo che l'HD Graphics 6000 superi la precedente HD 5000 del 20 - 25 percento ed offra prestazioni simili ad una GeForce 820M dedicata.
I giochi del 2014/2015 saranno fluidi solo con dettagli (molto) bassi.
Consumo Energetico
Utilizzando il nuovo processo in 14 nm, i chips Broadwell LV hanno un TDP da 15 W e di conseguenza sono adatti per ultrabooks sottili. Il TDP Þ flessibile e pu‗ essere ulteriormente ridotto (9,5 W), il che ha un significativo impatto sulle performance.
HD Graphics Serie
| ||||||||||||||||||||||||||||||||||||||||||||||||||||||||||||||||||||||
| Nome in codice | Broadwell GT3 | |||||||||||||||||||||||||||||||||||||||||||||||||||||||||||||||||||||
| Architettura | Gen. 8 Broadwell | |||||||||||||||||||||||||||||||||||||||||||||||||||||||||||||||||||||
| iGPU | Integrated Graphics | |||||||||||||||||||||||||||||||||||||||||||||||||||||||||||||||||||||
| Pipelines | 48 - unified | |||||||||||||||||||||||||||||||||||||||||||||||||||||||||||||||||||||
| Velocità del core | 300 - 1000 (Boost) MHz | |||||||||||||||||||||||||||||||||||||||||||||||||||||||||||||||||||||
| Larghezza del bus di memoria | 64/128 Bit | |||||||||||||||||||||||||||||||||||||||||||||||||||||||||||||||||||||
| Memoria condivisa | si | |||||||||||||||||||||||||||||||||||||||||||||||||||||||||||||||||||||
| API | DirectX 12 (FL 11_1), OpenGL 4.3 | |||||||||||||||||||||||||||||||||||||||||||||||||||||||||||||||||||||
| Transistor Count | 1.9 Billion | |||||||||||||||||||||||||||||||||||||||||||||||||||||||||||||||||||||
| tecnologia | 14 nm | |||||||||||||||||||||||||||||||||||||||||||||||||||||||||||||||||||||
| Caratteristiche | QuickSync | |||||||||||||||||||||||||||||||||||||||||||||||||||||||||||||||||||||
| Data dell'annuncio | 05.01.2015 | |||||||||||||||||||||||||||||||||||||||||||||||||||||||||||||||||||||
| ||||||||||||||||||||||||
Benchmark
3DM Vant. Perf. total +
specvp12 sw-03 +
Cinebench R15 OpenGL 64 Bit +
* Numeri più piccoli rappresentano prestazioni supeiori
Benchmarks per i giochi
I seguenti benchmarks deirivano dai benchmarks dei portatili recensiti. Le prestazioni dipendono dalla scheda grafica utilizzata, dal clock rate, dal processore, dai settaggi di sistema, dai drivers, e dai sistemi operativi. Quindi i risultati non sono rappresentativi per i portatili con questa GPU. Per informazioni dettagliate sui risultati del benchmark, cliccate sul numero di fps.

X-Plane 11.11
2018
Team Fortress 2
2017
Dirt 4
2017
Rocket League
2017
Farming Simulator 17
2016
Overwatch
2016
Rainbow Six Siege
2015
Just Cause 3
2015
FIFA 16
2015
World of Warships
2015
Metal Gear Solid V
2015
Mad Max
2015
Dota 2 Reborn
2015
The Witcher 3
2015
Dirt Rally
2015
Battlefield Hardline
2015
Evolve
2015
F1 2014
2014
Ryse: Son of Rome
2014
Alien: Isolation
2014
Fifa 15
2014
Sims 4
2014
GRID: Autosport
2014
Thief
2014
X-Plane 10.25
2013
Battlefield 4
2013
Total War: Rome II
2013
Company of Heroes 2
2013
Metro: Last Light
2013
BioShock Infinite
2013
Tomb Raider
2013
Crysis 3
2013
Dirt Showdown
2012
Diablo III
2012
StarCraft 2
2010Per conoscere altri giochi che potrebbero essere utilizzabili e per una lista completa di tutti i giochi e delle schede grafiche visitate la nostra Gaming List
Recensioni Notebook con Intel HD Graphics 6000 la scheda grafica


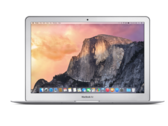
Recensione Breve del portatile Apple MacBook Air 13 (2015)

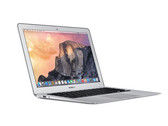
Recensione breve del Notebook Apple MacBook Air 11 (Inizio 2015)

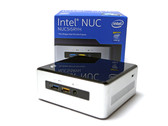
Recensione breve del Mini PC Intel NUC 5i5RYH
Apple MacBook Air 13.3" 1.8 GHz (2017): Intel Core i5-5350U, 13.30", 1.4 kg
Recensioni esterne » Apple MacBook Air 13.3" 1.8 GHz (2017)
Apple MacBook Air 11 inch 2015-03: Intel Core i5-5250U, 11.00", 1.1 kg
Recensioni esterne » Apple MacBook Air 11 inch 2015-03
Apple MacBook Air 13 inch 2015-03: Intel Core i5-5250U, 13.30", 1.4 kg
Recensioni esterne » Apple MacBook Air 13 inch 2015-03


