Recensione del Computer Portatile Chuwi AeroBook (2019): Un compatto ultrabook crowdfunded
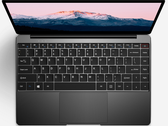
Intel Core m3-6Y30 | Intel HD Graphics 515 | 13.30" | 1.2 kg

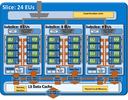
L'Intel HD Graphics 515 (GT2) è una scheda grafica integrata low-end, che si trova su Core m-series della generazione Skylake. Questa versione "GT2" della GPU Skylake GPU offre 24 Execution Units (EUs) con clock fino a 1000 MHz (in base al modello di CPU). A causa dell'assenza di memoria grafica dedicata o cache eDRAM, l'HD 515 deve accedere alla memoria principale (2x 64bit DDR3L-1600 / LPDDR3-1866).
Performance
Stando ad Intel, l'HD Graphics 515 è del 41 percento più veloce rispetto alla precedente HD Graphics 5300 (Broadwell). Tuttavia, la GPU gestirà solo giochi semplici come Counter-Strike o Dota con frame rates decenti. In base allo specifico modello di CPU, alla configurazione di memoria e al TDP (4.5 W, configurabile), le performance possono variare in modo sostanziale.
Features
Il motore video rielaborato ora decodifica H.265/HEVC completamente con l'hardware e quindi è molto più efficiente rispetto a prima. E' possibile collegare displays tramite DP 1.2 / eDP 1.3 (max. 3840 x 2160 @ 60 Hz), mentre l'HDMI è limitata alla vecchia versione 1.4a (max. 3840 x 2160 @ 30 Hz). Tuttavia, l'HDMI 2.0 può essere aggiunto utilizzando un converter DisplayPort. Possono essere controllati fino a tre displays simultaneamente.
Consumo energetico
L'HD Graphics 515 si può trovare in processori Core m con TDP da 4.5 W (3.5/3.8 W cTDP down, 7 W cTDP up) e di conseguenza è adatta a portatili 2-in-1 e tablets molto sottili con raffreddamento passivo.
Gen. 9 Serie
| |||||||||||||||||||||||||||||||||||||||||||
| Nome in codice | Skylake GT2 | ||||||||||||||||||||||||||||||||||||||||||
| Architettura | Gen. 9 Skylake | ||||||||||||||||||||||||||||||||||||||||||
| Pipelines | 24 - unified | ||||||||||||||||||||||||||||||||||||||||||
| Velocità del core | 300 - 1000 (Boost) MHz | ||||||||||||||||||||||||||||||||||||||||||
| Larghezza del bus di memoria | 64/128 Bit | ||||||||||||||||||||||||||||||||||||||||||
| Tipo di memoria | DDR3L/LPDDR3 | ||||||||||||||||||||||||||||||||||||||||||
| Memoria condivisa | si | ||||||||||||||||||||||||||||||||||||||||||
| API | DirectX 12_1, OpenGL 4.4 | ||||||||||||||||||||||||||||||||||||||||||
| tecnologia | 14 nm | ||||||||||||||||||||||||||||||||||||||||||
| Caratteristiche | QuickSync | ||||||||||||||||||||||||||||||||||||||||||
| Data dell'annuncio | 01.09.2015 | ||||||||||||||||||||||||||||||||||||||||||
| ||||||||||||||||||||||||
I seguenti benchmarks deirivano dai benchmarks dei portatili recensiti. Le prestazioni dipendono dalla scheda grafica utilizzata, dal clock rate, dal processore, dai settaggi di sistema, dai drivers, e dai sistemi operativi. Quindi i risultati non sono rappresentativi per i portatili con questa GPU. Per informazioni dettagliate sui risultati del benchmark, cliccate sul numero di fps.


Per conoscere altri giochi che potrebbero essere utilizzabili e per una lista completa di tutti i giochi e delle schede grafiche visitate la nostra Gaming List


HP Spectre x2 12-a001ng: Intel Core m3-6Y30, 12.00", 1.2 kg
recensione » Recensione breve del Convertibile HP Spectre x2 12-a001ng
Toshiba Portege Z20t-C-121: Intel Core m7-6Y75, 12.50", 1.5 kg
recensione » Recensione breve dello Sganciabile Toshiba Portégé Z20t-C-121
Acer Aspire Switch 12S SW7-272-M3A0: Intel Core m3-6Y30, 12.50", 1.4 kg
recensione » Recensione Breve del Convertibile Acer Aspire Switch 12S SW7-272-M3A0
Lenovo Yoga 900S-12ISK-80ML: Intel Core m5-6Y54, 12.50", 1 kg
recensione » Recensione breve del Convertibile Lenovo Yoga 900S 12ISK
Asus Zenbook UX360CA-FC060T: Intel Core m3-6Y30, 13.30", 1.3 kg
recensione » Recensione breve del Convertibile Asus Zenbook UX360CA-FC060T
HP EliteBook Folio G1 V1C37EA: Intel Core m5-6Y54, 12.50", 1 kg
recensione » Recensione breve del Subnotebook HP EliteBook Folio G1
Lenovo ThinkPad X1 Tablet: Intel Core m7-6Y75, 12.00", 1 kg
recensione » Recensione breve del tablet Lenovo ThinkPad X1
Dell Latitude 13 7370: Intel Core m5-6Y57, 13.30", 1.2 kg
recensione » Recensione breve dell'Ultrabook Dell Latitude 13 7370
Apple MacBook 12 (Early 2016) 1.1 GHz: Intel Core m3-6Y30, 12.00", 0.9 kg
recensione » Recensione Breve del Poratile Apple MacBook 12 (inizio 2016) 1.1 GHz
HP Elite x2 1012 G1: Intel Core m5-6Y54, 12.10", 1.2 kg
recensione » Recensione Breve del Convertibile HP Elite x2 1012 G1
Dell Latitude 11 5175: Intel Core m5-6Y57, 10.80", 0.7 kg
recensione » Recensione Breve del Tablet Dell Latitude 11 5175
Samsung Galaxy Tab Pro S W700N: Intel Core m3-6Y30, 12.10", 0.7 kg
recensione » Recensione Breve del Tablet 2-in-1 Samsung Galaxy Tab Pro S W700N
Dell XPS 12 9250 4K: Intel Core m7-6Y75, 12.50", 1.3 kg
recensione » Recensione breve del Convertibile Dell XPS 12 9250 4K
Asus Zenbook UX305CA-FB055T: Intel Core m7-6Y75, 13.30", 1.2 kg
recensione » Recensione Breve del subnotebook Asus Zenbook UX305CA-FB055T
HP Spectre x2 12-a003ng K3D42EA: Intel Core m7-6Y75, 12.00", 1.2 kg
recensione » Recensione Breve del Portatile HP Spectre x2 12-a003ng (K3D42EA)
Lenovo IdeaPad Miix 700: Intel Core m5-6Y54, 12.00", 1.1 kg
recensione » Recensione Breve del Convertibile Lenovo IdeaPad Miix 700
Asus Zenbook UX305CA-EHM1: Intel Core m3-6Y30, 13.30", 1.2 kg
recensione » Recensione breve del subnotebook Asus Zenbook UX305CA-EHM1
Microsoft Surface Pro 4, Core m3: Intel Core m3-6Y30, 12.30", 1.1 kg
recensione » Recensione completa del tablet Microsoft Surface Pro 4 (Core m3)
Alldocube KBook: Intel Core m3-6Y30, 13.50", 1.5 kg
Recensioni esterne » Alldocube KBook
Chuwi AeroBook 13 inch 2019: Intel Core m3-6Y30, 13.30", 1.2 kg
Recensioni esterne » Chuwi AeroBook 13 inch 2019
Asus Chromebook Flip C302CA-GU010: Intel Core m3-6Y30, 12.50", 1.2 kg
Recensioni esterne » Asus Chromebook Flip C302CA-GU010
HP Spectre x2 12-a001na: Intel Core m3-6Y30, 12.10", 1.2 kg
Recensioni esterne » HP Spectre x2 12-a001na
Asus Chromebook C302CA-GU001: Intel Core m3-6Y30, 12.50", 1.2 kg
Recensioni esterne » Asus Chromebook C302CA-GU001
Panasonic Toughpad FZ-Q2: Intel Core m5-6Y57, 12.50", 1 kg
Recensioni esterne » Panasonic Toughpad FZ-Q2
Asus Chromebook Flip C302CA-GU009: Intel Core m3-6Y30, 12.50", 1.2 kg
Recensioni esterne » Asus Chromebook Flip C302CA-GU009
HP EliteBook 1030 G1-Z2U93ES: Intel Core m7-6Y75, 13.30", 1.2 kg
Recensioni esterne » HP EliteBook 1030 G1-Z2U93ES
Dell Latitude 13 7370, Core m7: Intel Core m7-6Y75, 13.30", 1.3 kg
Recensioni esterne » Dell Latitude 13 7370, Core m7
HP EliteBook Folio G1-V1C64EA: Intel Core m5-6Y54, 12.50", 1.1 kg
Recensioni esterne » HP EliteBook Folio G1-V1C64EA
HP Chromebook 13 G1, Core m3: Intel Core m3-6Y30, 13.30", 1.2 kg
Recensioni esterne » HP Chromebook 13 G1, Core m3
Lenovo ThinkPad X1 Tablet: Intel Core m7-6Y75, 12.00", 1 kg
Recensioni esterne » Lenovo ThinkPad X1 Tablet
HP EliteBook Folio G1-Z2U98ES: Intel Core m7-6Y75, 12.50", 1 kg
Recensioni esterne » HP EliteBook Folio G1-Z2U98ES
Medion Akoya P3401T 2in1: Intel Core m5-6Y54, 12.50", 1.3 kg
Recensioni esterne » Medion Akoya P3401T 2in1
Kogan Atlas UltraSlim Pro-KALAP13SPZA: Intel Core m3-6Y30, 13.30", 1.4 kg
Recensioni esterne » Kogan Atlas UltraSlim Pro-KALAP13SPZA
Asus ZenBook Flip UX360CA-DBM2T: Intel Core m3-6Y30, 13.30", 1.4 kg
Recensioni esterne » Asus ZenBook Flip UX360CA-DBM2T
Samsung Chromebook Pro XE510C24-K01US: Intel Core m3-6Y30, 12.30", 1.1 kg
Recensioni esterne » Samsung Chromebook Pro XE510C24-K01US
HP Pavilion x2 12-b101ns: Intel Core m3-6Y30, 12.00", 1.5 kg
Recensioni esterne » HP Pavilion x2 12-b101ns
Toshiba Portege Z20t-C-144: Intel Core m7-6Y75, 12.50", 1.5 kg
Recensioni esterne » Toshiba Portege Z20t-C-144
Asus Chromebook Flip C302CA-DHM4: Intel Core m3-6Y30, 12.50", 1.2 kg
Recensioni esterne » Asus Chromebook Flip C302CA-DHM4
Lenovo Yoga 710-11-80TX001JCK: Intel Core m5-6Y54, 11.60", 1.1 kg
Recensioni esterne » Lenovo Yoga 710-11-80TX001JCK
Asus Zenbook Flip UX360CA-C4072T: Intel Core m3-6Y30, 13.30", 1.3 kg
Recensioni esterne » Asus Zenbook Flip UX360CA-C4072T
Asus ZenBook UX360CA-DQ099T: Intel Core m7-6Y75, 13.30", 1.3 kg
Recensioni esterne » Asus ZenBook UX360CA-DQ099T
HP Elite x2 1012 G1-L5H20EA: Intel Core m5-6Y54, 12.00", 0.8 kg
Recensioni esterne » HP Elite x2 1012 G1-L5H20EA
Lenovo Yoga 900S-12ISK-80ML004RMX: Intel Core m5-6Y54, 12.50", 1 kg
Recensioni esterne » Lenovo Yoga 900S-12ISK-80ML004RMX
Lenovo Yoga 900S-12ISK-80ML0068PB: Intel Core m7-6Y75, 12.50", 1 kg
Recensioni esterne » Lenovo Yoga 900S-12ISK-80ML0068PB
Asus UX360CA-C4089T: Intel Core m3-6Y30, 13.30", 1.3 kg
Recensioni esterne » Asus UX360CA-C4089T
Cube i9: Intel Core m3-6Y30, 12.20", 1 kg
Recensioni esterne » Cube i9
Samsung Galaxy Tab PRO S W708N LTE 128GB: Intel Core m3-6Y30, 12.10", 0.7 kg
Recensioni esterne » Samsung Galaxy Tab PRO S W708N LTE 128GB
Asus ZenBook UX360CA-C4112TS: Intel Core m7-6Y75, 13.30", 1.3 kg
Recensioni esterne » Asus ZenBook UX360CA-C4112TS
HP EliteBook 1030 G1-X2F03EA: Intel Core m7-6Y75, 13.30", 1.2 kg
Recensioni esterne » HP EliteBook 1030 G1-X2F03EA
Huawei MateBook HZ-W19: Intel Core m5-6Y54, 12.00", 1.2 kg
Recensioni esterne » Huawei MateBook HZ-W19
Asus Zenbook UX360CA-C4044T: Intel Core m3-6Y30, 13.30", 1.3 kg
Recensioni esterne » Asus Zenbook UX360CA-C4044T
Asus ZenBook UX360CA-C4017T: Intel Core m3-6Y30, 13.30", 1.3 kg
Recensioni esterne » Asus ZenBook UX360CA-C4017T
Samsung Galaxy Tab Pro S W703: Intel Core m3-6Y30, 12.10", 0.7 kg
Recensioni esterne » Samsung Galaxy Tab Pro S W703
HP EliteBook Folio G1-X2F49EA: Intel Core m7-6Y75, 12.50", 1 kg
Recensioni esterne » HP EliteBook Folio G1-X2F49EA
HP Elite x2 1012 G1-L5H11EA: Intel Core m5-6Y57, 12.10", 1.2 kg
Recensioni esterne » HP Elite x2 1012 G1-L5H11EA
HP Elite x2 1012 G1-L5H19EA: Intel Core m5-6Y54, 12.50", 1.2 kg
Recensioni esterne » HP Elite x2 1012 G1-L5H19EA
Acer Aspire Switch 12S SW7-272-M0JS: Intel Core m5-6Y54, 12.50", 1.4 kg
Recensioni esterne » Acer Aspire Switch 12S SW7-272-M0JS
HP Pavilion x2 12-b030ng: Intel Core m3-6Y30, 12.00", 1.5 kg
Recensioni esterne » HP Pavilion x2 12-b030ng
HP EliteBook Folio G1-V1C39EA: Intel Core m5-6Y54, 12.50", 1 kg
Recensioni esterne » HP EliteBook Folio G1-V1C39EA
HP EliteBook Folio G1-W8H05PA: Intel Core m7-6Y75, 12.50", 1 kg
Recensioni esterne » HP EliteBook Folio G1-W8H05PA
Xiaomi Mi Notebook Air 12.5 2016: Intel Core m3-6Y30, 12.50", 1.1 kg
Recensioni esterne » Xiaomi Mi Air 12 inch 2016
HP Spectre x2 12-a003ng K3D42EA: Intel Core m7-6Y75, 12.00", 1.2 kg
Recensioni esterne » HP Spectre x2 12-a003ng K3D42EA
Toshiba Portege Z20t-C-121: Intel Core m7-6Y75, 12.50", 1.5 kg
Recensioni esterne » Toshiba Portege Z20t-C-121
Asus Zenbook UX305CA-FB219T: Intel Core m7-6Y75, 13.30", 1.2 kg
Recensioni esterne » Asus Zenbook UX305CA-FB219T
Lenovo Ideapad Miix 700-80QL00BUGE: Intel Core m7-6Y75, 12.10", 0.8 kg
Recensioni esterne » Lenovo Ideapad Miix 700-80QL00BUGE
Huawei MateBook m5-6Y54: Intel Core m5-6Y54, 12.00", 1.2 kg
Recensioni esterne » Huawei MateBook m5-6Y57
Lenovo Yoga 710-11-80TX000CUS: Intel Core m3-6Y30, 11.60", 1 kg
Recensioni esterne » Lenovo Yoga 710-11-80TX000CUS
HP Chromebook 13 G1 Core m5: Intel Core m5-6Y57, 13.30", 1.2 kg
Recensioni esterne » HP Chromebook 13 G1, Core m5
HP Elitebook Folio G1-V1C40EA: Intel Core m5-6Y54, 12.50", 1 kg
Recensioni esterne » HP Elitebook Folio G1-V1C40EA
HP Elite x2 1012 G1-L5H17EA: Intel Core m3-6Y30, 12.00", 0.8 kg
Recensioni esterne » HP Elite x2 1012 G1-L5H17EA
HP Spectre x2 12-a002tu: Intel Core m5-6Y54, 12.10", 0.8 kg
Recensioni esterne » HP Spectre x2 12-a002tu
Dell Latitude 11-5179: Intel Core m5-6Y57, 10.80", 0.8 kg
Recensioni esterne » Dell Latitude 11-5179
Acer Aspire Switch 12S SW7-272-M3A0: Intel Core m3-6Y30, 12.50", 1.4 kg
Recensioni esterne » Acer Aspire Switch 12S SW7-272-M3A0
Lenovo Yoga 710-11-80TX000AUS: Intel Core m5-6Y54, 11.60", 1 kg
Recensioni esterne » Lenovo Yoga 710-11-80TX000AUS
Dell Inspiron 11-3169: Intel Core m3-6Y30, 11.60", 1.3 kg
Recensioni esterne » Dell Inspiron 11-3169
Asus UX305CA-DQ150T: Intel Core m3-6Y30, 13.30", 1.2 kg
Recensioni esterne » Asus UX305CA-DQ150T
Lenovo Yoga 900S-12ISK-80ML001XGE: Intel Core m7-6Y75, 12.50", 1 kg
Recensioni esterne » Lenovo Yoga 900S-12ISK-80ML001XGE
Dell XPS 12 9250-9303: Intel Core m5-6Y57, 12.50", 1.3 kg
Recensioni esterne » Dell XPS 12 9250-9303
Asus Transformer Book T302CA: Intel Core m7-6Y75, 12.50", 0.8 kg
Recensioni esterne » Asus Transformer Book T302CA
Asus ZenBook Flip UX360CA-C4055T : Intel Core m5-6Y54, 13.30", 1.3 kg
Recensioni esterne » Asus ZenBook Flip UX360CA-C4055T
Panasonic Toughbook CF-20: Intel Core m5-6Y57, 10.10", 1.8 kg
Recensioni esterne » Panasonic Toughbook CF-20
Toshiba Portege Z20T-C2112: Intel Core m5-6Y57, 12.50", 1.5 kg
Recensioni esterne » Toshiba Portege Z20T-C2112
Asus UX360CA-C4019T: Intel Core m3-6Y30, 13.30", 1.3 kg
Recensioni esterne » Asus UX360CA-C4019T
Toshiba Portege Z20t-C-121: Intel Core m7-6Y75, 12.50", 1.6 kg
Recensioni esterne » Toshiba Portege Z20t-C-121
Asus UX305CA-FC022T: Intel Core m3-6Y30, 13.30", 1.2 kg
Recensioni esterne » Asus UX305CA-FC022T
Dell Latitude 11 5175: Intel Core m5-6Y57, 10.80", 0.7 kg
Recensioni esterne » Dell Latitude 11 5175
HP EliteBook Folio G1 V1C37EA: Intel Core m5-6Y54, 12.50", 1 kg
Recensioni esterne » HP EliteBook Folio G1 V1C37EA
Dell XPS 12 9250 4K: Intel Core m7-6Y75, 12.50", 1.3 kg
Recensioni esterne » Dell XPS 12 9250 4K
HP EliteBook Folio G1-V1C36EA: Intel Core m7-6Y75, 12.50", 1.1 kg
Recensioni esterne » HP EliteBook Folio G1-V1C36EA
Lenovo ThinkPad X1 Tablet: Intel Core m7-6Y75, 12.10", 1 kg
Recensioni esterne » Lenovo ThinkPad X1 Tablet
Dell Latitude 13 7370: Intel Core m5-6Y57, 13.30", 1.2 kg
Recensioni esterne » Dell Latitude 13 7370
Lenovo Yoga 900S-12ISK-80ML: Intel Core m5-6Y54, 12.50", 1 kg
Recensioni esterne » Lenovo Yoga 900S-12ISK-80ML
Apple MacBook 12 (Early 2016) 1.1 GHz: Intel Core m3-6Y30, 12.00", 0.9 kg
Recensioni esterne » Apple MacBook 12 (Early 2016) 1.1 GHz
Apple MacBook 12 (Early 2016) 1.2 GHz: Intel Core m5-6Y54, 12.00", 0.9 kg
Recensioni esterne » Apple MacBook 12 (Early 2016) 1.2 GHz
Apple MacBook 12 (Early 2016) 1.3 GHz: Intel Core m7-6Y75, 12.00", 0.9 kg
Recensioni esterne » Apple MacBook 12 (Early 2016) 1.3 GHz
Huawei MateBook: Intel Core m3-6Y30, 12.00", 0.6 kg
Recensioni esterne » Huawei MateBook
Dell Latitude 12 E7275: Intel Core m7-6Y75, 12.50", 1.4 kg
Recensioni esterne » Dell Latitude 12 E7275
Asus UX305CA-FC106T: Intel Core m5-6Y54, 13.30", 1.2 kg
Recensioni esterne » Asus UX305CA-FC106T
Lenovo IdeaPad Miix 700: Intel Core m5-6Y54, 12.00", 1.1 kg
Recensioni esterne » Lenovo IdeaPad Miix 700
HP Spectre x2 12-a005nd: Intel Core m3-6Y30, 12.00", 1.2 kg
Recensioni esterne » HP Spectre x2 12-a005nd
HP Spectre X2 12-a000nf: Intel Core m3-6Y30, 12.00", 1.2 kg
Recensioni esterne » HP Spectre X2 12-a000nf
Dell XPS 12-9250: Intel Core m7-6Y75, 12.50", 1.3 kg
Recensioni esterne » Dell XPS 12-9250
Samsung Galaxy Tab Pro S W700N: Intel Core m3-6Y30, 12.10", 0.7 kg
Recensioni esterne » Samsung Galaxy Tab Pro S W700N
Lenovo Yoga 700-11ISK: Intel Core m3-6Y30, 11.60", 1.1 kg
Recensioni esterne » Lenovo Yoga 700-11ISK
Asus UX305CA-FC037T: Intel Core m3-6Y30, 13.30", 1.2 kg
Recensioni esterne » Asus UX305CA-FC037T
HP Elite x2 1012 G1: Intel Core m5-6Y54, 12.10", 1.2 kg
Recensioni esterne » HP Elite x2 1012 G1, Core m5-6Y54
HP Spectre x2 12-a002dx: Intel Core m7-6Y75, 12.10", 1.2 kg
Recensioni esterne » HP Spectre x2 12-a002dx
Asus UX305CA-FB055T: Intel Core m7-6Y75, 13.30", 1.2 kg
Recensioni esterne » Asus UX305CA-FB055T
Microsoft Surface Pro 4, Core m3: Intel Core m3-6Y30, 12.30", 1.1 kg
Recensioni esterne » Microsoft Surface Pro 4, Core m3
Posizione approssimativa dell'adattatore grafico
I nostri Top 10
» Top 10 Portatili Multimedia
» Top 10 Portatili Gaming
» Top 10 Portatili Gaming Leggeri
» Top 10 Portatili da Ufficio e Business economici
» Top 10 Portatili Premium da Ufficio/Business
» Top 10 Portatili sotto i 300 Euro
» Top 10 Portatili sotto i 500 Euro
» Top 10 dei Portatili Workstation
» Top 10 Subnotebooks
» Top 10 Ultrabooks
» Top 10 Convertibili
» Top 10 Tablets
» Top 10 Tablets Windows
» Top 10 Smartphones