Recensione breve del Convertibile Dell XPS 12 9250 4K
| |||||||||||||||||||||||||
Distribuzione della luminosità: 81 %
Al centro con la batteria: 437 cd/m²
Contrasto: 1249:1 (Nero: 0.35 cd/m²)
ΔE ColorChecker Calman: 3.56 | ∀{0.5-29.43 Ø4.72}
ΔE Greyscale Calman: 2.67 | ∀{0.09-98 Ø4.97}
100% sRGB (Calman 2D)
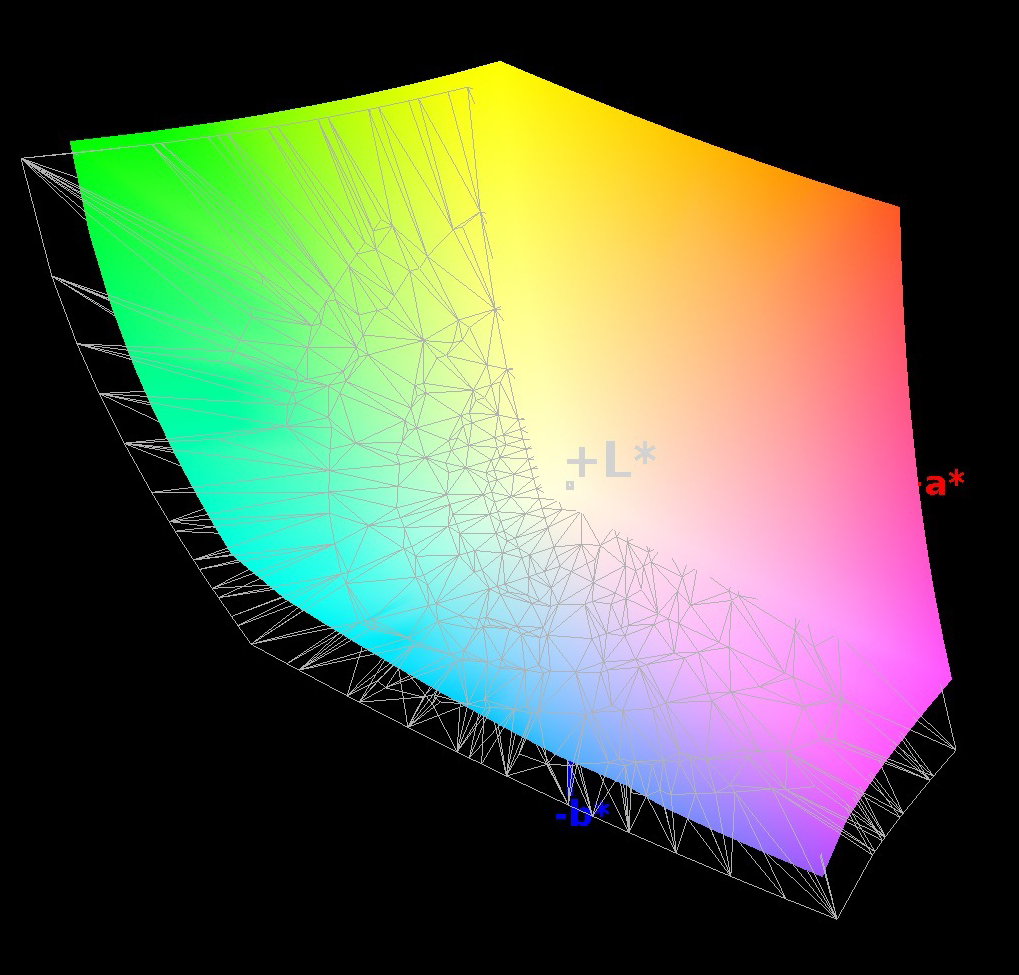
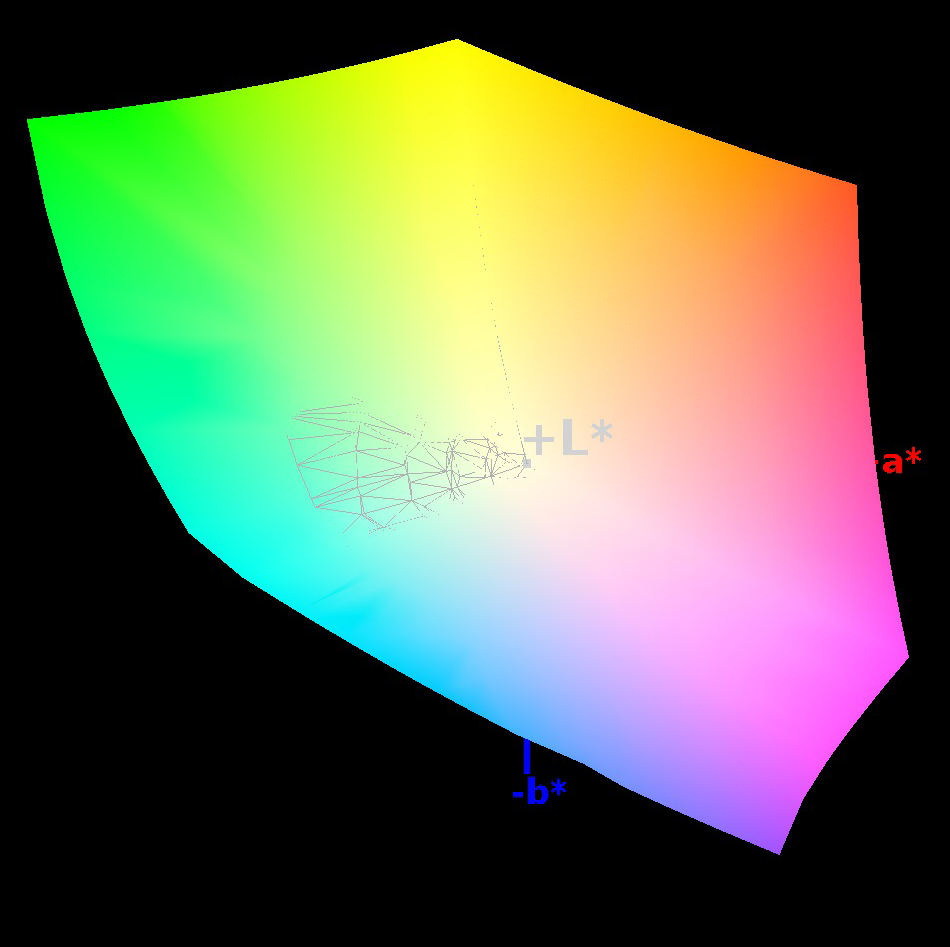
100% sRGB (Argyll 1.6.3 3D)
86% AdobeRGB 1998 (Argyll 1.6.3 3D)
98.1% AdobeRGB 1998 (Argyll 3D)
99.8% sRGB (Argyll 3D)
83.9% Display P3 (Argyll 3D)
Gamma: 2.17
CCT: 6681 K
| Dell XPS 12 9250 4K HD Graphics 515, 6Y75, Samsung PM951 NVMe 512 GB | HP Spectre x2 12-a003ng K3D42EA HD Graphics 515, 6Y75, Sandisk X300 SD7SN6S-256G-1006 | HP Elite x2 1011 G1 HD Graphics 5300, 5Y51, Samsung SSD PM851 256 GB MZNTE256HMHP | Microsoft Surface Pro 4, Core m3 HD Graphics 515, 6Y30, Samsung MZFLV128 NVMe | Asus Zenbook UX305CA-FB055T HD Graphics 515, 6Y75, Micron M600 MTFDDAV512MBF M.2 | Toshiba Portege Z20t-B-10C HD Graphics 5300, 5Y71, Toshiba HG6 THNSNJ256GVNU | |
|---|---|---|---|---|---|---|
| Display | -37% | -44% | -18% | -27% | -47% | |
| Display P3 Coverage (%) | 83.9 | 52.9 -37% | 44.4 -47% | 67.5 -20% | 59.1 -30% | 42.63 -49% |
| sRGB Coverage (%) | 99.8 | 71.8 -28% | 66.4 -33% | 96.6 -3% | 85.5 -14% | 63.6 -36% |
| AdobeRGB 1998 Coverage (%) | 98.1 | 52.6 -46% | 45.91 -53% | 69 -30% | 61 -38% | 44.1 -55% |
| Response Times | -3% | -9% | 9% | |||
| Response Time Grey 50% / Grey 80% * (ms) | 36 ? | 47 ? -31% | 46 ? -28% | 38 ? -6% | ||
| Response Time Black / White * (ms) | 35 ? | 26 ? 26% | 31 ? 11% | 27 ? 23% | ||
| PWM Frequency (Hz) | 1000 ? | 50 ? | 1429 ? | |||
| Screen | -40% | -51% | -4% | -19% | -71% | |
| Brightness middle (cd/m²) | 437 | 353 -19% | 364 -17% | 389.2 -11% | 390 -11% | 342 -22% |
| Brightness (cd/m²) | 399 | 347 -13% | 331 -17% | 392 -2% | 352 -12% | 301 -25% |
| Brightness Distribution (%) | 81 | 91 12% | 84 4% | 92 14% | 81 0% | 76 -6% |
| Black Level * (cd/m²) | 0.35 | 0.44 -26% | 0.44 -26% | 0.27 23% | 0.69 -97% | 0.393 -12% |
| Contrast (:1) | 1249 | 802 -36% | 827 -34% | 1441 15% | 565 -55% | 870 -30% |
| Colorchecker dE 2000 * | 3.56 | 6.09 -71% | 7.32 -106% | 3.61 -1% | 3.04 15% | 9.69 -172% |
| Colorchecker dE 2000 max. * | 9.3 | 7.01 25% | ||||
| Greyscale dE 2000 * | 2.67 | 6.24 -134% | 7.37 -176% | 3.8 -42% | 2.88 -8% | 9.27 -247% |
| Gamma | 2.17 101% | 2.41 91% | 2.03 108% | 2.16 102% | 2.43 91% | 2.95 75% |
| CCT | 6681 97% | 7238 90% | 6479 100% | 5969 109% | 6848 95% | 6010 108% |
| Color Space (Percent of AdobeRGB 1998) (%) | 86 | 46 -47% | 42.2 -51% | 63 -27% | 55 -36% | 40.4 -53% |
| Color Space (Percent of sRGB) (%) | 100 | 71 -29% | 66.1 -34% | 97 -3% | 85 -15% | |
| Media totale (Programma / Settaggio) | -27% /
-34% | -48% /
-49% | -10% /
-7% | -12% /
-17% | -59% /
-64% |
* ... Meglio usare valori piccoli
Tempi di risposta del Display
| ↔ Tempi di risposta dal Nero al Bianco | ||
|---|---|---|
| 35 ms ... aumenta ↗ e diminuisce ↘ combinato | ↗ 8 ms Incremento | 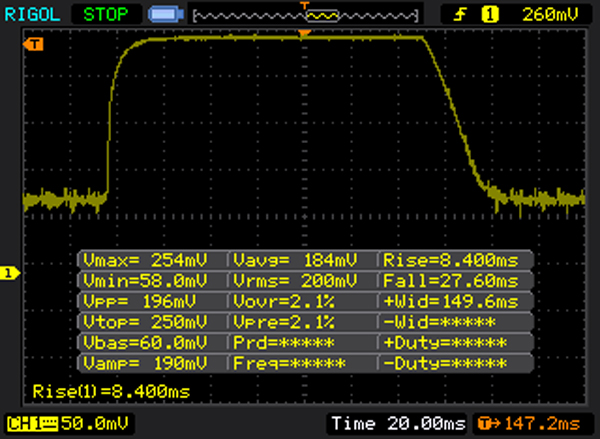 |
| ↘ 27 ms Calo | ||
| Lo schermo mostra tempi di risposta lenti nei nostri tests e sarà insoddisfacente per i gamers. In confronto, tutti i dispositivi di test variano da 0.1 (minimo) a 240 (massimo) ms. » 92 % di tutti i dispositivi è migliore. Questo significa che i tempi di risposta rilevati sono peggiori rispetto alla media di tutti i dispositivi testati (19.9 ms). | ||
| ↔ Tempo di risposta dal 50% Grigio all'80% Grigio | ||
| 36 ms ... aumenta ↗ e diminuisce ↘ combinato | ↗ 19 ms Incremento | 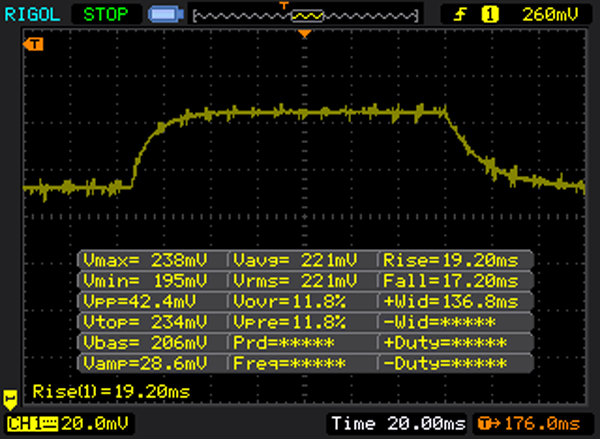 |
| ↘ 17 ms Calo | ||
| Lo schermo mostra tempi di risposta lenti nei nostri tests e sarà insoddisfacente per i gamers. In confronto, tutti i dispositivi di test variano da 0.165 (minimo) a 636 (massimo) ms. » 50 % di tutti i dispositivi è migliore. Questo significa che i tempi di risposta rilevati sono peggiori rispetto alla media di tutti i dispositivi testati (31.1 ms). | ||
Sfarfallio dello schermo / PWM (Pulse-Width Modulation)
| flickering dello schermo / PWM rilevato | 1000 Hz | ≤ 20 % settaggio luminosita' | 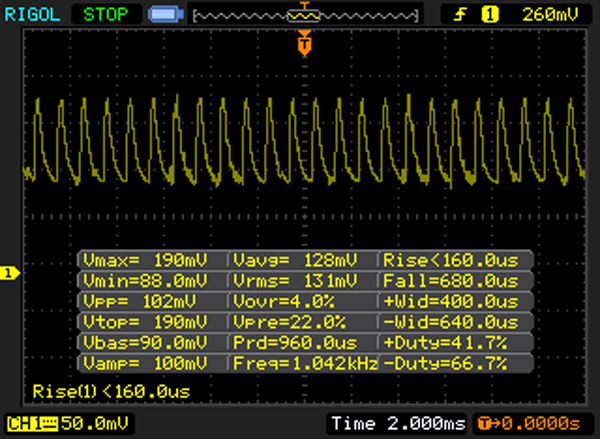 |
Il display sfarfalla a 1000 Hz (Probabilmente a causa dell'uso di PWM) Flickering rilevato ad una luminosita' di 20 % o inferiore. Non dovrebbe verificarsi flickering o PWM sopra questo valore di luminosita'. La frequenza di 1000 Hz è abbastanza alta, quindi la maggioranza degli utenti sensibili al PWM non dovrebbero notare alcun flickering. In confronto: 52 % di tutti i dispositivi testati non utilizza PWM per ridurre la luminosita' del display. Se è rilevato PWM, una media di 7784 (minimo: 5 - massimo: 343500) Hz è stata rilevata. | |||
| PCMark 7 Score | 4318 punti | |
| PCMark 8 Home Score Accelerated v2 | 2277 punti | |
| PCMark 8 Creative Score Accelerated v2 | 2903 punti | |
| PCMark 8 Work Score Accelerated v2 | 3084 punti | |
Aiuto | ||

| 3DMark 11 Performance | 1115 punti | |
| 3DMark Ice Storm Standard Score | 27409 punti | |
| 3DMark Cloud Gate Standard Score | 3457 punti | |
| 3DMark Fire Strike Score | 553 punti | |
| 3DMark Fire Strike Extreme Score | 277 punti | |
Aiuto | ||
| basso | medio | alto | ultra | |
|---|---|---|---|---|
| BioShock Infinite (2013) | 33.28 | 17.37 | 20.1 | 4.67 |
| Battlefield 4 (2013) | 24.81 | 17.88 | 11.94 | 6.67 |
| Rise of the Tomb Raider (2016) | 8.3 | 5.67 |
(±) La temperatura massima sul lato superiore è di 41.4 °C / 107 F, rispetto alla media di 35.4 °C / 96 F, che varia da 19.6 a 60 °C per questa classe Convertible.
(±) Il lato inferiore si riscalda fino ad un massimo di 43.9 °C / 111 F, rispetto alla media di 36.9 °C / 98 F
(+) In idle, la temperatura media del lato superiore è di 30.2 °C / 86 F, rispetto alla media deld ispositivo di 30.3 °C / 87 F.
(-) I poggiapolsi e il touchpad possono diventare molto caldi al tatto con un massimo di 41.4 °C / 106.5 F.
(-) La temperatura media della zona del palmo della mano di dispositivi simili e'stata di 28 °C / 82.4 F (-13.4 °C / -24.1 F).
| Dell XPS 12 9250 4K HD Graphics 515, 6Y75, Samsung PM951 NVMe 512 GB | HP Spectre x2 12-a003ng K3D42EA HD Graphics 515, 6Y75, Sandisk X300 SD7SN6S-256G-1006 | HP Elite x2 1011 G1 HD Graphics 5300, 5Y51, Samsung SSD PM851 256 GB MZNTE256HMHP | Asus Zenbook UX305CA-FB055T HD Graphics 515, 6Y75, Micron M600 MTFDDAV512MBF M.2 | Toshiba Portege Z20t-B-10C HD Graphics 5300, 5Y71, Toshiba HG6 THNSNJ256GVNU | |
|---|---|---|---|---|---|
| Power Consumption | 20% | 52% | 21% | 33% | |
| Idle Minimum * (Watt) | 5.4 | 4.5 17% | 1.5 72% | 4.2 22% | 2.4 56% |
| Idle Average * (Watt) | 10.2 | 7.7 25% | 4 61% | 8.4 18% | 4.6 55% |
| Idle Maximum * (Watt) | 12.5 | 8.3 34% | 5 60% | 8.9 29% | 5.6 55% |
| Load Average * (Watt) | 21.4 | 19.8 7% | 13.9 35% | 15.9 26% | 15.6 27% |
| Load Maximum * (Watt) | 24.4 | 20.6 16% | 16.9 31% | 22.5 8% | 30.7 -26% |
* ... Meglio usare valori piccoli
| Off / Standby | |
| Idle | |
| Sotto carico |
|
Leggenda:
min: | |
| Dell XPS 12 9250 4K 28 Wh | HP Spectre x2 12-a003ng K3D42EA 42 Wh | HP Elite x2 1011 G1 54 Wh | Microsoft Surface Pro 4, Core m3 38 Wh | Asus Zenbook UX305CA-FB055T 45 Wh | Toshiba Portege Z20t-B-10C 72 Wh | |
|---|---|---|---|---|---|---|
| Autonomia della batteria | 92% | 187% | 85% | 108% | 269% | |
| Reader / Idle (h) | 6.2 | 15.9 156% | 17.7 185% | 13.2 113% | 16.9 173% | 26.9 334% |
| WiFi v1.3 (h) | 4.1 | 6 46% | 11.3 176% | 8.1 98% | 6.7 63% | 12.7 210% |
| Load (h) | 1.6 | 2.8 75% | 4.8 200% | 2.3 44% | 3 88% | 5.8 262% |
Pro
Contro
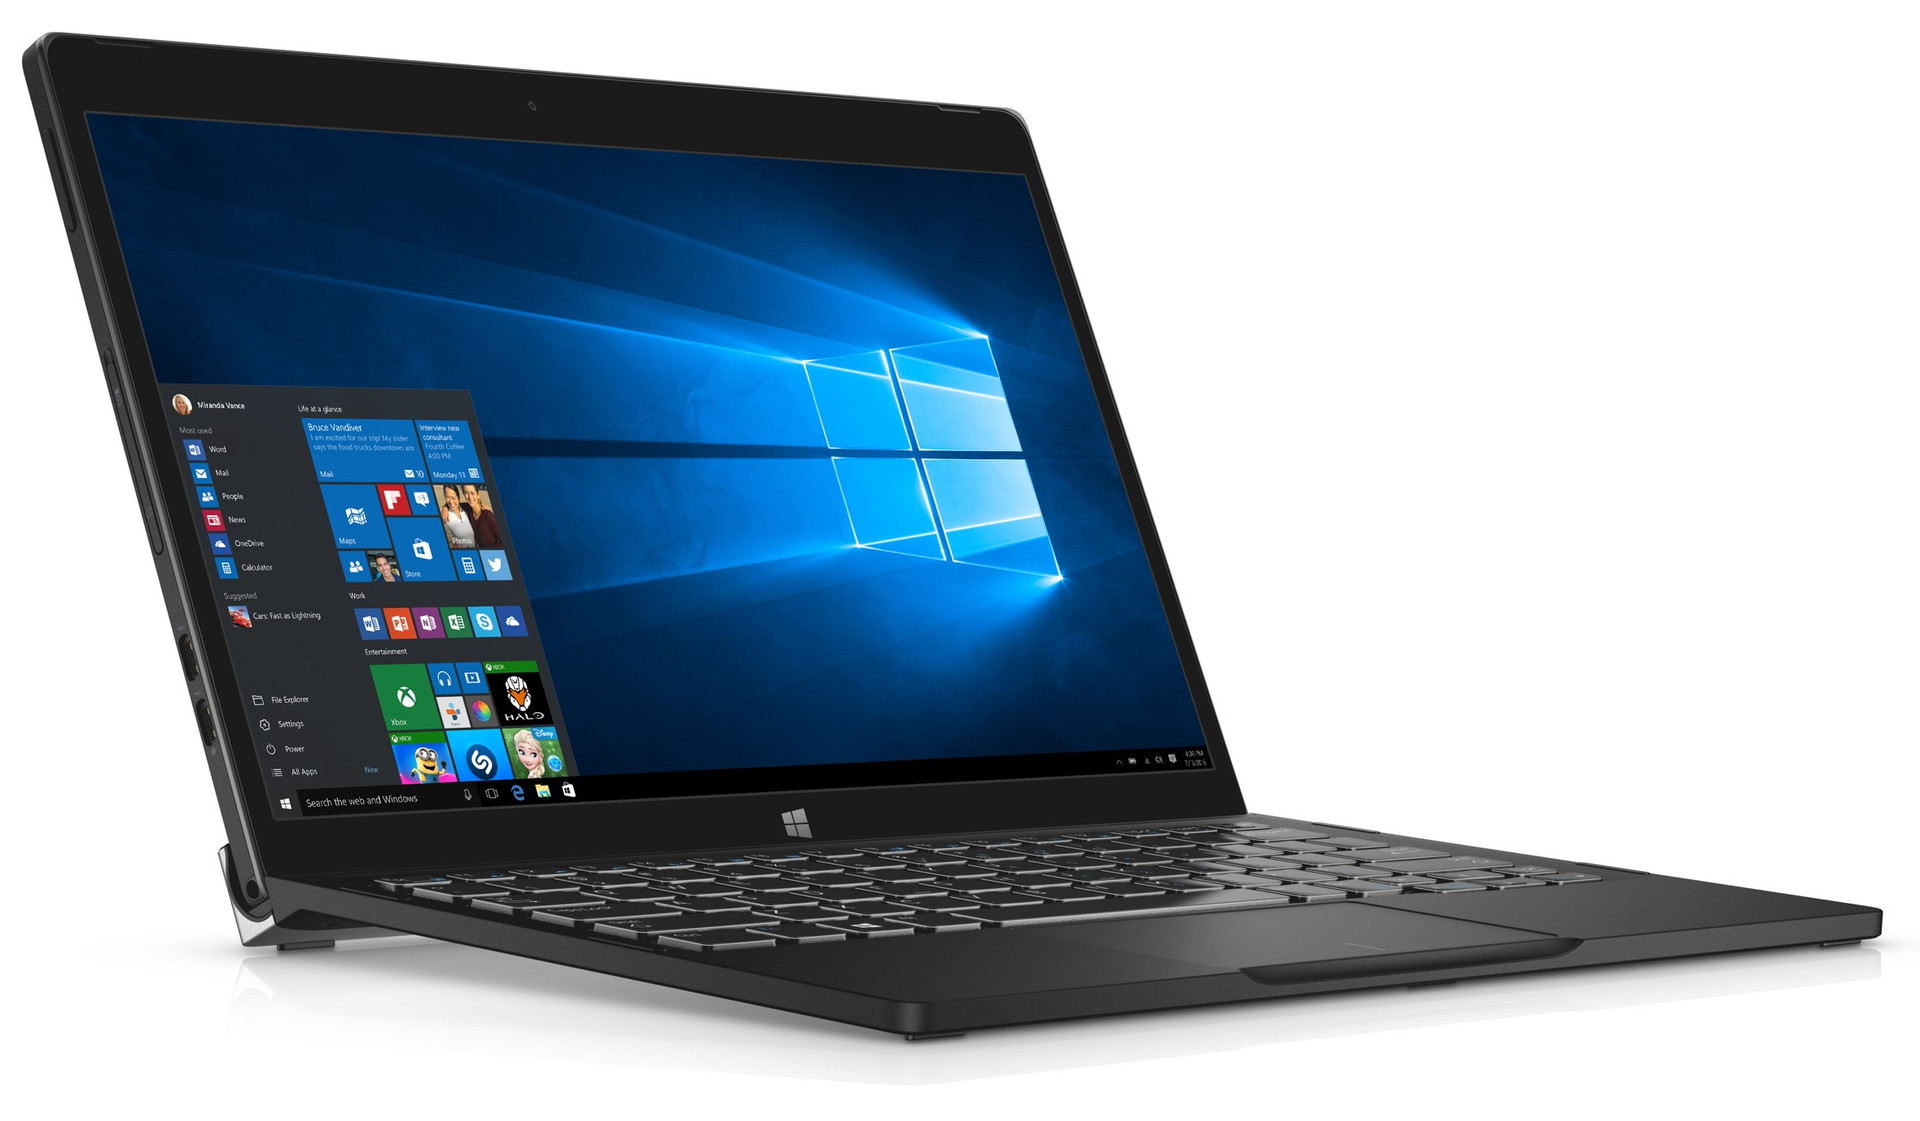
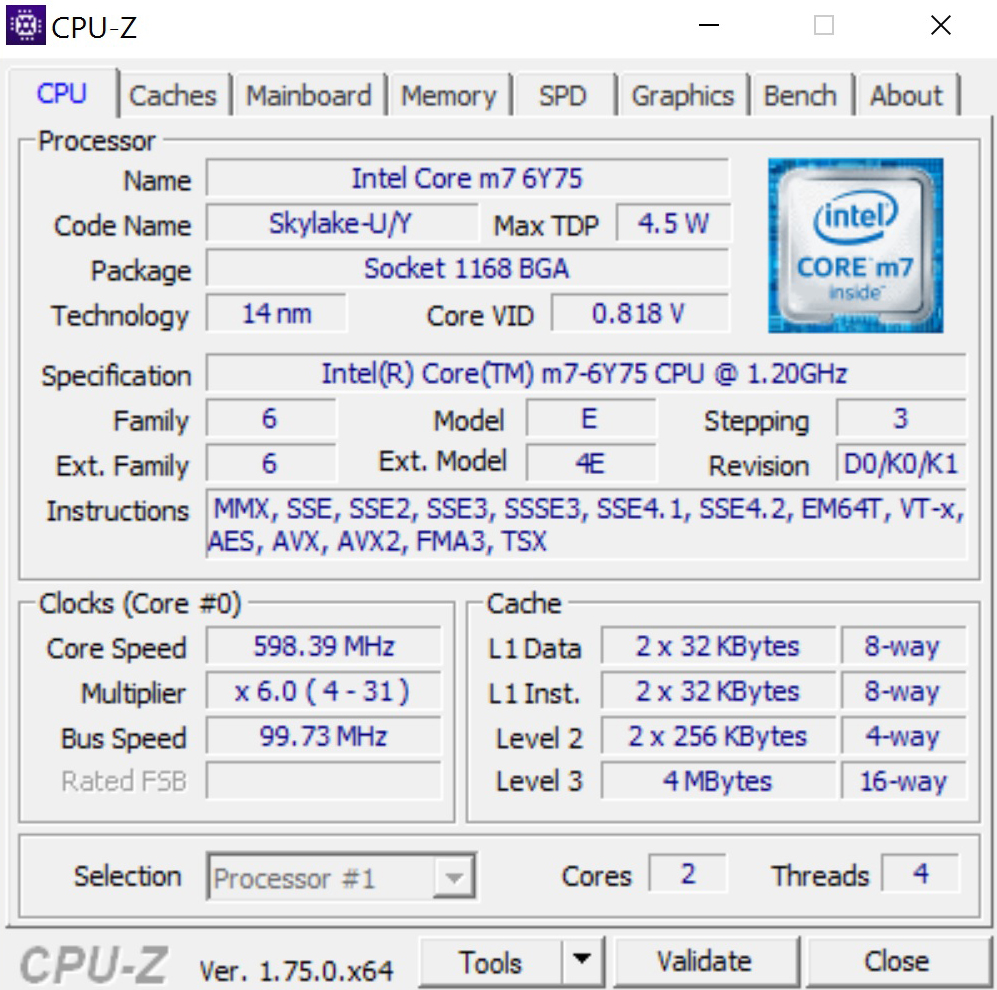
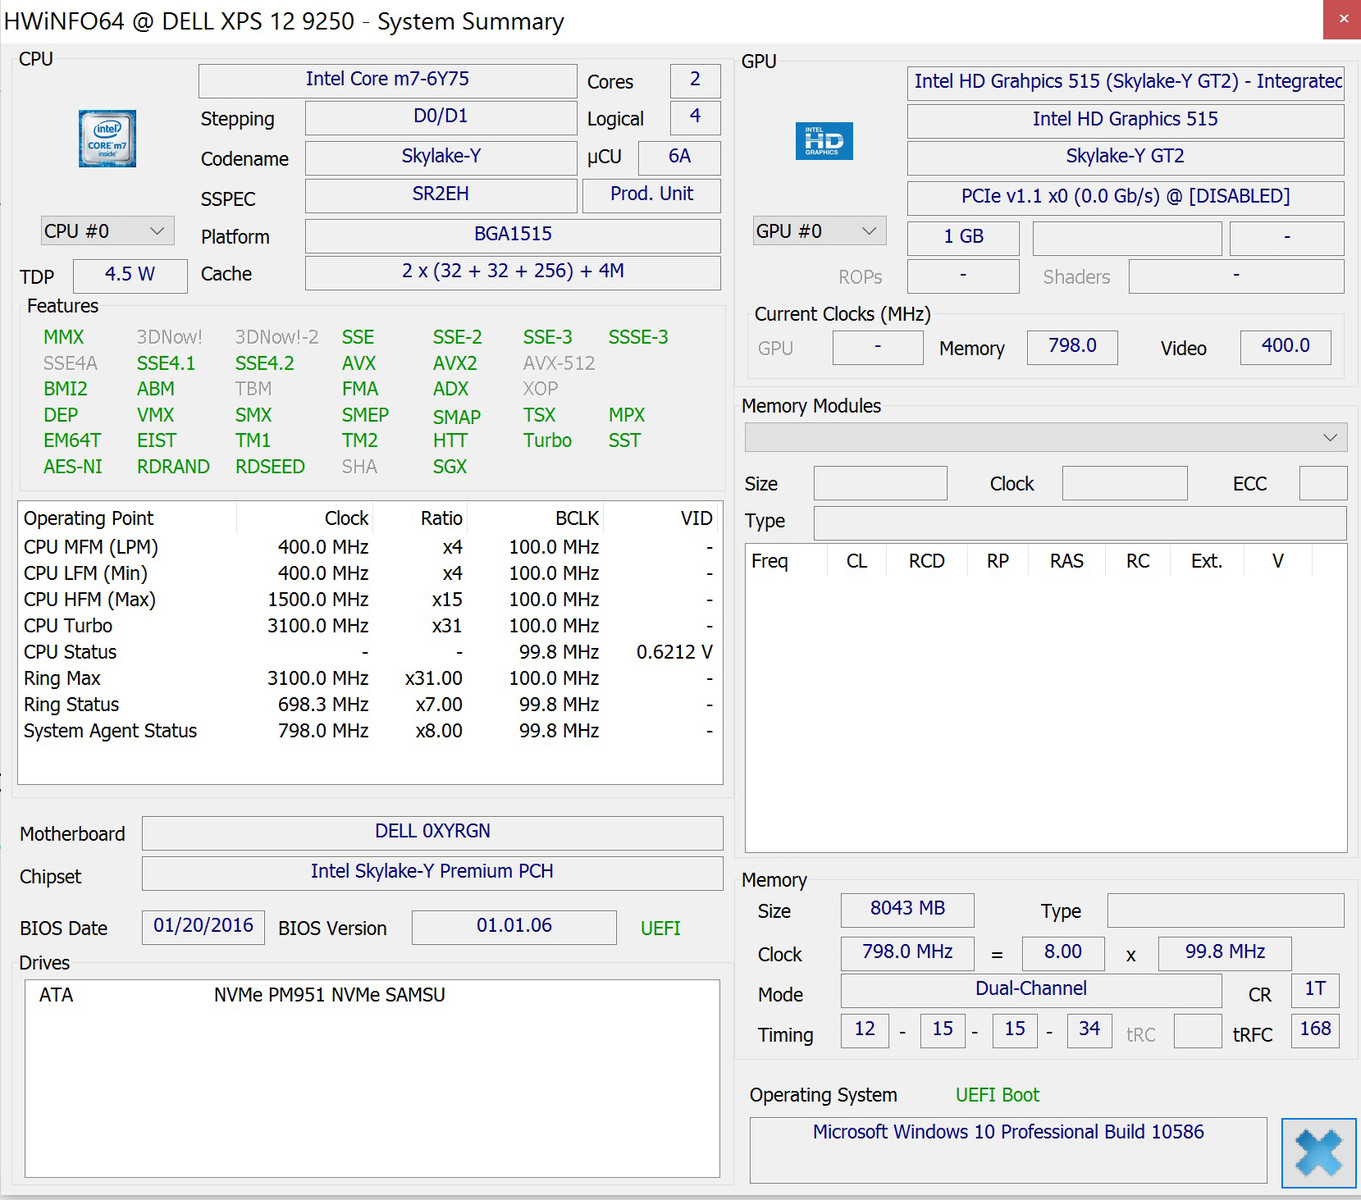
Il Dell XPS 12 9250 è un sottile convertibile da 12.5". Il processore Intel Core m7 6Y75 ha abbastanza potenza per le applicazioni di routine, ed il suo TDP consente un raffreddamento passivo. L'SSD impressiona con gli elevati valori di lettura ed assicura un sistema scattante. L'elevata risoluzione, lo schermo da 12.5" e 3840x2160 pixels convince anche per l'elevato contrasto, la buona gamma di colore e gli angoli di visuale stabili. E' anche molto reattivo come dispositivo di input ed esegue immediatamente i comandi. La keyboard dock si adatta bene al look del tablet e piace per la silenziosità e la precisione della funzione touchpad.
A primo impatti, un elegante convertibile che diventa ancora più interessante se si guarda da vicino nelle specifiche. La domanda reste se Dell abbia fissato un prezzo troppo elevato.
Nonostante tutto questo, ci sono anche alcune critiche. L'angolo dello schermo non può essere regolato, il che non è molto comodo davanti a una scrivania. Sebbene il modello testato abbia il processore più potente della linea Intel Core m, le performance non sono sfruttate in pieno. Pertanto il Microsoft Surface Pro 4 con un Core m3, ad esempio, a volte è più veloce. Avremmo sperato anche in una autonomia maggiore. La batteria dovrebbe andare meglio in un tablet soprattutto se rivolto al settore business.
Ora sapete quali sono i punti deboli se volete acquistare questo dispositivo. Dell chiede bene 1799 Euro (~$2051) per la configurazione testata. Sicuramente non è un affare, ma è uno dei pochi dispositivi con pannello 4K in formato 12.5" - questo il fattore trainante. Forse una configurazione con una CPU meno potente si potrebbe ipotizzare visto che non si sfruttano in pieno le prestazioni del processore Core m7.
Nota: si tratta di una recensione breve, con alcune sezioni non tradotte, per la versione integrale in inglese guardate qui.
Dell XPS 12 9250 4K
- 04/18/2016 v5.1 (old)
Sebastian Bade