Notebookcheck Logo

Intel Arc 8-Cores iGPU

Intel Arc 8-Cores

L'iGPU Intel Arc con 8 core (ID 7D55) è una scheda grafica integrata nei SoC Meteor Lake basata sull'architettura Xe LPG (simile alle GPU Arc dedicate, ma con un focus sull'efficienza). Offre tutti gli 8 core Xe (128 motori vettoriali Xe), 8 unità di ray-tracing, 8 campionatori e 4 backend di pixel.

Il nome Arc può essere utilizzato solo se si utilizzano almeno 16 GB di RAM in modalità doppio canale. Altrimenti, l'unica iGPU si chiama "Intel Graphics" ed è anche significativamente più lenta.

Secondo Intel, le prestazioni sono state raddoppiate rispetto alla generazione precedente (probabilmente ancora in Alder Lake).

L'iGPU supporta DirectX 12 Ultimate (probabilmente DX 12_2 come le GPU Arc per desktop). L'unità grafica supporta anche XeSS AI Super Sampling.

Il motore multimediale di Meteor Lake si trova nel tile SOC e supporta la codifica e la decodifica HDR fino a 8k60 10 bit di MPEG2, AVC, VP9, HEVC e AV1. Anche il motore di visualizzazione si trova nel tile SoC e supporta HDMI 2.1 e DisplayPort 2.1 20G con HDR fino a 8K60.

Il tile GPU del chip Meteor Lake è prodotto presso TSMC in 5nm (processo 5N).

Arc LPG Serie

Arc 8-Cores 8 @ 2.3 GHz
Arc 7-Cores 7 @ 2.2 GHz
Graphics 4-Core 4 @ 1.95 GHz
Nome in codiceMeteor Lake iGPU
ArchitetturaXe LPG
Pipelines8 - unified
Raytracing Cores8
Velocità del core2300 (Boost) MHz
CacheL1: 1.5 MB
Memoria condivisano
APIDirectX 12_2, OpenGL 4.6, Vulkan 1.3
tecnologia5 nm
DisplaysHDMI 2.1b, DisplayPort 2.0 20G
Data dell'annuncio14.12.2023
CPU in Arc 8-CoresGPU Base SpeedGPU Boost / Turbo
Intel Core Ultra 9 185H16 x 3800 MHz, 45 W? MHz2350 MHz
Intel Core Ultra 7 165H16 x 3800 MHz, 28 W? MHz2300 MHz
Intel Core Ultra 7 155H16 x 3800 MHz, 28 W? MHz2250 MHz
Intel Core Ultra 5 135H14 x 3600 MHz, 28 W? MHz2200 MHz
min. - max.? MHz2200 - 2350 MHz

Benchmark

Performance Rating - 3DMark 11 + Fire Strike + Time Spy
3.9 pt (12%)
3DMark - 3DMark Time Spy Score
min: 2178     media: 3423     media: 3504 (10%)     massimo: 4151 Points
3DMark - 3DMark Time Spy Graphics
min: 2018     media: 3132     media: 3205.5 (8%)     massimo: 3756 Points
3DMark - 3DMark Ice Storm Extreme Graphics
159748 Points (20%)
3DMark - 3DMark Cloud Gate Score
min: 18794     media: 30031     media: 30231.5 (32%)     massimo: 37020 Points
3DMark - 3DMark Cloud Gate Graphics
min: 35698     media: 43071     media: 43977.5 (12%)     massimo: 51286 Points
3DMark - 3DMark Fire Strike Standard Score
min: 5203     media: 7509     media: 7874 (14%)     massimo: 9001 Points
3DMark - 3DMark Fire Strike Standard Graphics
min: 5568     media: 8228     media: 8561 (10%)     massimo: 9650 Points
3DMark - 3DMark Ice Storm Graphics
min: 160401     media: 189213     media: 190580 (23%)     massimo: 215292 Points
3DMark - 3DMark Wild Life Extreme Unlimited
min: 4294     media: 5866     media: 5869 (7%)     massimo: 6558 Points
3DMark 11 - 3DM11 Performance Score
min: 7756     media: 11766     media: 12151 (17%)     massimo: 13904 Points
3DMark 11 - 3DM11 Performance GPU
min: 8064     media: 11823     media: 12230 (11%)     massimo: 13716 Points
3DMark Vantage
3DM Vant. Perf. total +
3DMark Vantage - 3DM Vant. Perf. total
min: 38877     media: 41031     media: 41031 (12%)     massimo: 43185 Points
3DM Vant. Perf. GPU no PhysX +
3DMark 05 - 3DMark 05 - Standard
42967 Points (47%)
Intel Graphics Media Accelerator (GMA) 500
133.4 -100%
...
32434 -25%
33386 -22%
35504 -17%
35662 -17%
36878 -14%
37669 -12%
AMD Radeon RX Vega 7
38073 -11%
38999 -9%
39066 -9%
Intel Arc 8-Cores iGPU
42967
43138 0%
AMD Radeon 680M
43450 1%
AMD Radeon 660M
43616 2%
46269 8%
48758 13%
50571 18%
50971 19%
52117 21%
53254 24%
...
61850 44%
max:
87172 103%
0%
100%
3DMark 06 3DMark 06 - Standard 1280x1024 +
3DMark 06
36831 Points (48%)
Unigine Valley 1.0 - Unigine Valley 1.0 DX
17.1 fps (6%)
SPECviewperf 12
specvp12 sw-03 +
SPECviewperf 12 - specvp12 sw-03
42.7 fps (11%)
specvp12 snx-02 +
specvp12 showcase-01 +
SPECviewperf 12 - specvp12 showcase-01
18.2 fps (4%)
specvp12 mediacal-01 +
SPECviewperf 12 - specvp12 mediacal-01
16.9 fps (4%)
specvp12 maya-04 +
SPECviewperf 12 - specvp12 maya-04
54.9 fps (15%)
specvp12 energy-01 +
SPECviewperf 12 - specvp12 energy-01
0.9 fps (1%)
specvp12 creo-01 +
SPECviewperf 12 - specvp12 creo-01
23.1 fps (9%)
specvp12 catia-04 +
specvp12 3dsmax-05 +
SPECviewperf 12 - specvp12 3dsmax-05
49.8 fps (9%)
SPECviewperf 13 specvp13 sw-04 +
SPECviewperf 13 - specvp13 sw-04
44.8 fps (12%)
specvp13 snx-03 +
SPECviewperf 13 - specvp13 snx-03
5.9 fps (1%)
specvp13 showcase-02 +
SPECviewperf 13 - specvp13 showcase-02
18.2 fps (4%)
specvp13 medical-02 +
SPECviewperf 13 - specvp13 medical-02
29.7 fps (6%)
specvp13 maya-05 +
SPECviewperf 13 - specvp13 maya-05
59.5 fps (7%)
specvp13 energy-02 +
SPECviewperf 13 - specvp13 energy-02
5.7 fps (2%)
specvp13 creo-02 +
SPECviewperf 13 - specvp13 creo-02
29.6 fps (4%)
specvp13 catia-05 +
SPECviewperf 13 - specvp13 catia-05
71.6 fps (8%)
specvp13 3dsmax-06 +
SPECviewperf 13 - specvp13 3dsmax-06
46.4 fps (8%)
SPECviewperf 2020 specvp2020 solidworks-05 4k +
SPECviewperf 2020 - specvp2020 solidworks-05 4k
11 fps (3%)
specvp2020 snx-04 4k +
specvp2020 medical-03 4k +
SPECviewperf 2020 - specvp2020 medical-03 4k
5.1 fps (5%)
specvp2020 maya-06 4k +
SPECviewperf 2020 - specvp2020 maya-06 4k
35.4 fps (6%)
specvp2020 energy-03 4k +
SPECviewperf 2020 - specvp2020 energy-03 4k
4.6 fps (1%)
specvp2020 creo-03 4k +
SPECviewperf 2020 - specvp2020 creo-03 4k
17.9 fps (8%)
specvp2020 catia-06 4k +
SPECviewperf 2020 - specvp2020 catia-06 4k
10 fps (7%)
specvp2020 3dsmax-07 4k +
SPECviewperf 2020 - specvp2020 3dsmax-07 4k
12.9 fps (5%)
Cinebench R10 Cinebench R10 Shading (32bit) +
Cinebench R11.5 Cinebench R11.5 OpenGL 64 Bit +
Cinebench R11.5 - Cinebench R11.5 OpenGL 64 Bit
min: 101.92     media: 105.4     media: 105.4 (36%)     massimo: 108.87 fps
Cinebench R15
Cinebench R15 OpenGL 64 Bit +
Cinebench R15 - Cinebench R15 OpenGL 64 Bit
min: 135.3     media: 151.8     media: 151.8 (9%)     massimo: 176.3 fps
Cinebench R15 OpenGL Ref. Match 64 Bit +
Cinebench R15 - Cinebench R15 OpenGL Ref. Match 64 Bit
97.8 % (98%)
GFXBench - GFXBench 5.0 4K Aztec Ruins High Tier Offscreen
min: 36.6     media: 38.6     media: 38.6 (16%)     massimo: 40.5 fps
GFXBench - GFXBench 5.0 Aztec Ruins High Tier Offscreen
83.4 fps (15%)
3.3 -96%
...
62.7 -25%
62.8 -25%
63.8 -24%
64.8 -22%
65.5 -21%
Apple M1 7-Core GPU
72.4 -13%
Apple M1 8-Core GPU
74.3 -11%
78.8 -6%
80.5 -3%
Intel Arc 8-Cores iGPU
83.4
87.1 4%
89.3 7%
Apple M2 8-Core GPU
91 9%
93.2 12%
94.7 14%
96.8 16%
Apple M2 10-Core GPU
100.4 20%
102.9 23%
108 29%
...
536 543%
0%
100%
GFXBench - GFXBench 5.0 Aztec Ruins Normal Tier Offscreen
min: 210     media: 221.6     media: 221.6 (16%)     massimo: 233.2 fps
GFXBench - GFXBench Car Chase Offscreen
167.1 fps (19%)
GFXBench (DX / GLBenchmark) 2.7
GFXBench T-Rex HD Offscreen C24Z16 +
GFXBench (DX / GLBenchmark) 2.7 - GFXBench T-Rex HD Offscreen C24Z16
817 fps (7%)
Basemark GPU 1.2 - Basemark GPU 1.2 Vulkan Official Medium Offscreen 1080
min: 104.6     media: 227.7     media: 269 (2%)     massimo: 345 fps
Basemark GPU 1.2 - Basemark GPU 1.2 Vulkan Official High Offscreen 2160
3.6 fps (1%)
Geekbench 6.2 - Geekbench 6.2 GPU OpenCL
min: 17911     media: 31972     media: 34126 (10%)     massimo: 36188 punti
Geekbench 6.2 - Geekbench 6.2 GPU Vulkan
min: 20875     media: 30843     media: 32858 (11%)     massimo: 34520 punti
LuxMark v2.0 64Bit - LuxMark v2.0 Room GPU
min: 549     media: 632     media: 631.5 (3%)     massimo: 714 Samples/s
LuxMark v2.0 64Bit - LuxMark v2.0 Sala GPU
min: 2319     media: 2465     media: 2465 (4%)     massimo: 2611 Samples/s
ComputeMark v2.1 - ComputeMark v2.1 Result
min: 7480     media: 7554     media: 7553.5 (8%)     massimo: 7627 punti
Power Consumption - Furmark Stress Test Power Consumption - external Monitor *
min: 35     media: 47.6     media: 49.2 (7%)     massimo: 60.6 Watt
051015202530354045505560657075Tooltip
Power Consumption - The Witcher 3 Power Consumption - external Monitor *
min: 27     media: 42.6     media: 44.4 (6%)     massimo: 55.8 Watt
05101520253035404550556065707580Tooltip
Power Consumption - Witcher 3 Power Consumption *
min: 29.7     media: 46.8     media: 46.6 (10%)     massimo: 60.9 Watt
05101520253035404550556065707580Tooltip
Power Consumption - Witcher 3 ultra Power Efficiency
min: 0.3826     media: 0.5     media: 0.5 (49%)     massimo: 0.553 fps per Watt
Power Consumption - Witcher 3 ultra Power Efficiency - external Monitor
min: 0.4516     media: 0.5     media: 0.5 (44%)     massimo: 0.615 fps per Watt
Emissions Witcher 3 Fan Noise +
Emissions - Witcher 3 Fan Noise
min: 27     media: 37.7     media: 37.8 (60%)     massimo: 46.3 dB(A)
- Valori di benchmark per questa scheda grafica
- Valori medi di benchmark per questa scheda grafica
* Numeri più piccoli rappresentano prestazioni supeiori

Benchmarks per i giochi

I seguenti benchmarks deirivano dai benchmarks dei portatili recensiti. Le prestazioni dipendono dalla scheda grafica utilizzata, dal clock rate, dal processore, dai settaggi di sistema, dai drivers, e dai sistemi operativi. Quindi i risultati non sono rappresentativi per i portatili con questa GPU. Per informazioni dettagliate sui risultati del benchmark, cliccate sul numero di fps.

Dragon's Dogma 2

Dragon's Dogma 2

2024
basso 1920x1080
18  fps    + Confronta + 📈 Graph
alto 1920x1080
14.5  fps    + Confronta + 📈 Graph
» Il Benchmark indica che il gioco non è utilizzabile con i settaggi testati.
Additional Benchmarks
Low Preset 1280x720
22.5
Horizon Forbidden West

Horizon Forbidden West

2024
basso 1920x1080
30.6  fps    + Confronta + 📈 Graph
medio 1920x1080
27.1  fps    + Confronta + 📈 Graph
alto 1920x1080
18.5  fps    + Confronta + 📈 Graph
ultra 1920x1080
16.2  fps    + Confronta + 📈 Graph
» Il Benchmark indica che il gioco non è utilizzabile con i settaggi testati.
Alone in the Dark

Alone in the Dark

2024
basso 1920x1080
69  fps    + Confronta
medio 1920x1080
56  fps    + Confronta
alto 1920x1080
49  fps    + Confronta
ultra 1920x1080
29  fps    + Confronta
» Giocabile con tutti i portatili testati con dettagli alto.
Last Epoch

Last Epoch

2024
basso 1920x1080
45.8 73.9 ~ 60 fps    + Confronta + 📈 Graph
medio 1920x1080
39.1 52.4 ~ 46 fps    + Confronta + 📈 Graph
alto 1920x1080
33.9 46.4 ~ 40 fps    + Confronta + 📈 Graph
ultra 1920x1080
27.6 40.3 ~ 34 fps    + Confronta + 📈 Graph
» Giocabile con la maggior parte dei portatili testati con dettagli alto.
Additional Benchmarks
Very Low Preset 1280x720
59.3
Skull & Bones

Skull & Bones

2024
basso 1920x1080
36  fps    + Confronta
medio 1920x1080
32  fps    + Confronta
alto 1920x1080
27  fps    + Confronta
ultra 1920x1080
21  fps    + Confronta
» Giocabile con tutti i portatili testati con dettagli basso.
Helldivers 2

Helldivers 2

2024
basso 1920x1080
39.2  fps    + Confronta + 📈 Graph
medio 1920x1080
30  fps    + Confronta + 📈 Graph
alto 1920x1080
27.5  fps    + Confronta + 📈 Graph
ultra 1920x1080
27.2  fps    + Confronta + 📈 Graph
» Giocabile con tutti i portatili testati con dettagli basso.
Enshrouded

Enshrouded

2024
basso 1920x1080
27  fps    + Confronta + 📈 Graph
medio 1920x1080
22  fps    + Confronta + 📈 Graph
alto 1920x1080
16.8  fps    + Confronta + 📈 Graph
ultra 1920x1080
0 (!)  fps    + Confronta
» Il Benchmark indica che il gioco non è utilizzabile con i settaggi testati.
Palworld

Palworld

2024
basso 1920x1080
40.6  fps    + Confronta + 📈 Graph
medio 1920x1080
37.1  fps    + Confronta + 📈 Graph
alto 1920x1080
29.5  fps    + Confronta + 📈 Graph
ultra 1920x1080
27.3  fps    + Confronta + 📈 Graph
» Giocabile con tutti i portatili testati con dettagli medio.
Prince of Persia The Lost Crown

Prince of Persia The Lost Crown

2024
medio 1920x1080
183.9 208 ~ 196 fps    + Confronta + 📈 Graph
alto 1920x1080
128.6 142.8 ~ 136 fps    + Confronta + 📈 Graph
ultra 1920x1080
120.9 134.2 ~ 128 fps    + Confronta + 📈 Graph
» Giocabile con tutti i portatili testati con dettagli ultra.
Ready or Not

Ready or Not

2023
basso 1920x1080
60.4  fps    + Confronta + 📈 Graph
medio 1920x1080
46.9  fps    + Confronta + 📈 Graph
alto 1920x1080
45.8  fps    + Confronta + 📈 Graph
ultra 1920x1080
32.5  fps    + Confronta + 📈 Graph
» Giocabile con tutti i portatili testati con dettagli alto.
The Finals

The Finals

2023
basso 1920x1080
99.5  fps    + Confronta + 📈 Graph
medio 1920x1080
68.9  fps    + Confronta + 📈 Graph
alto 1920x1080
60.5  fps    + Confronta + 📈 Graph
ultra 1920x1080
46.4  fps    + Confronta + 📈 Graph
» Giocabile con tutti i portatili testati con dettagli ultra.
Avatar Frontiers of Pandora

Avatar Frontiers of Pandora

2023
basso 1920x1080
18  fps    + Confronta
medio 1920x1080
16  fps    + Confronta
alto 1920x1080
14  fps    + Confronta
ultra 1920x1080
11  fps    + Confronta
» Il Benchmark indica che il gioco non è utilizzabile con i settaggi testati.
EA Sports WRC

EA Sports WRC

2023
basso 1920x1080
35.8  fps    + Confronta
medio 1920x1080
26.6  fps    + Confronta
alto 1920x1080
24.7  fps    + Confronta
ultra 1920x1080
22.4  fps    + Confronta
» Giocabile con tutti i portatili testati con dettagli basso.
Lords of the Fallen

Lords of the Fallen

2023
basso 1920x1080
20.2  fps    + Confronta + 📈 Graph
medio 1920x1080
18  fps    + Confronta + 📈 Graph
alto 1920x1080
16.3  fps    + Confronta + 📈 Graph
ultra 1920x1080
14.2  fps    + Confronta + 📈 Graph
» Il Benchmark indica che il gioco non è utilizzabile con i settaggi testati.
Total War Pharaoh

Total War Pharaoh

2023
basso 1920x1080
82.7 116 ~ 99 fps    + Confronta
medio 1920x1080
62.5 74.8 ~ 69 fps    + Confronta
alto 1920x1080
45.6 53.6 ~ 50 fps    + Confronta
ultra 1920x1080
35.5 40.6 ~ 38 fps    + Confronta
» Giocabile con tutti i portatili testati con dettagli ultra.
Additional Benchmarks
Low Preset 1280x720
136.5
Assassin's Creed Mirage

Assassin's Creed Mirage

2023
basso 1920x1080
34  fps    + Confronta
medio 1920x1080
33  fps    + Confronta
alto 1920x1080
30  fps    + Confronta
ultra 1920x1080
25  fps    + Confronta
» Il Benchmark indica che il gioco non è utilizzabile con i settaggi testati.
Counter-Strike 2

Counter-Strike 2

2023
basso 1920x1080
111.1  fps    + Confronta + 📈 Graph
medio 1920x1080
84.5  fps    + Confronta + 📈 Graph
alto 1920x1080
52.1  fps    + Confronta + 📈 Graph
ultra 1920x1080
31.8  fps    + Confronta + 📈 Graph
» Giocabile con tutti i portatili testati con dettagli alto.
Cyberpunk 2077 2.0 Phantom Liberty

Cyberpunk 2077 2.0 Phantom Liberty

2023
basso 1920x1080
11.3 18.5 21.7 23.3 27.6 29.5 31.5 31.7 32.4 32.9 34.1 34.7 35.7 ~ 28 fps    + Confronta
medio 1920x1080
9.4 16.3 23.8 24.8 25.4 26.3 26.3 26.5 26.8 29.5 29.5 29.6 ~ 25 fps    + Confronta
alto 1920x1080
7.3 15.1 16.9 17.8 20.4 22.5 22.8 22.8 22.9 23.4 24 25 25.2 ~ 20 fps    + Confronta
ultra 1920x1080
13 18.4 19.7 20.5 20.7 21.2 22 22.1 ~ 20 fps    + Confronta
QHD 2560x1440
13.1  fps    + Confronta
» Il Benchmark indica che il gioco non è utilizzabile con i settaggi testati.
Additional Benchmarks
Low Preset (FSR off) 1280x720
37.3
53.8
49
46.1
44.3
45.6
Steam Deck 1280x720
41.1
34.1
52
48.8
Lies of P

Lies of P

2023
basso 1920x1080
56.9  fps    + Confronta + 📈 Graph
medio 1920x1080
48.1  fps    + Confronta + 📈 Graph
alto 1920x1080
41.7  fps    + Confronta + 📈 Graph
ultra 1920x1080
33.2  fps    + Confronta + 📈 Graph
» Giocabile con tutti i portatili testati con dettagli alto.
The Crew Motorfest

The Crew Motorfest

2023
basso 1920x1080
32  fps    + Confronta
medio 1920x1080
30  fps    + Confronta
alto 1920x1080
25  fps    + Confronta
ultra 1920x1080
21  fps    + Confronta
» Il Benchmark indica che il gioco non è utilizzabile con i settaggi testati.
Starfield

Starfield

2023
medio 1920x1080
11.5  fps    + Confronta
» Il Benchmark indica che il gioco non è utilizzabile con i settaggi testati.
basso 1920x1080
50  fps    + Confronta + 📈 Graph
medio 1920x1080
40.1  fps    + Confronta + 📈 Graph
alto 1920x1080
36.2  fps    + Confronta + 📈 Graph
ultra 1920x1080
32.2  fps    + Confronta + 📈 Graph
» Giocabile con tutti i portatili testati con dettagli alto.
basso 1920x1080
45.9  fps    + Confronta + 📈 Graph
medio 1920x1080
45.7  fps    + Confronta + 📈 Graph
alto 1920x1080
39.5  fps    + Confronta + 📈 Graph
ultra 1920x1080
29.2  fps    + Confronta + 📈 Graph
» Giocabile con tutti i portatili testati con dettagli alto.
basso 1920x1080
24.5 29.1 31.9 33.8 36.9 ~ 31 fps    + Confronta
medio 1920x1080
22.8 22.9 23.5 28.2 28.8 30.2 ~ 26 fps    + Confronta
alto 1920x1080
20.6 21.2 21.2 24.1 25 26.8 ~ 23 fps    + Confronta
ultra 1920x1080
19 19.1 19.9 23.4 24.4 24.4 ~ 22 fps    + Confronta
» Il Benchmark indica che il gioco non è utilizzabile con i settaggi testati.
Additional Benchmarks
Low Preset 1280x720
52.6
52.2
medio 1920x1080
28.4  fps    + Confronta
alto 1920x1080
29  fps    + Confronta
ultra 1920x1080
25.9  fps    + Confronta
QHD 2560x1440
21.1  fps    + Confronta
» Il Benchmark indica che il gioco non è utilizzabile con i settaggi testati.
F1 23

F1 23

2023
basso 1920x1080
15.2 17.3 37.4 44.1 64.6 68.2 70.9 71.5 71.9 72.3 73.1 80.1 ~ 57 fps    + Confronta
medio 1920x1080
15 25.1 35.4 36.3 59 59.5 62.1 62.9 65.1 65.8 66.8 74.2 ~ 52 fps    + Confronta
alto 1920x1080
10.6 25.6 26.6 27.1 35.9 37.6 38.7 40.7 44.8 44.9 46.1 50.4 ~ 36 fps    + Confronta
ultra 1920x1080
7.5 10 11.4 11.5 12.2 12.7 13.5 14 ~ 12 fps    + Confronta
» Giocabile con la maggior parte dei portatili testati con dettagli alto.
Additional Benchmarks
Ultra Low Preset TAA 1280x720
93.7
110.9
73.4
72.4
113.9
basso 1920x1080
39.6  fps    + Confronta + 📈 Graph
medio 1920x1080
30.5  fps    + Confronta + 📈 Graph
alto 1920x1080
26.7  fps    + Confronta + 📈 Graph
ultra 1920x1080
18.4  fps    + Confronta + 📈 Graph
» Giocabile con tutti i portatili testati con dettagli basso.
basso 1920x1080
62.2  fps    + Confronta
medio 1920x1080
50.1  fps    + Confronta
alto 1920x1080
39  fps    + Confronta
ultra 1920x1080
38.6  fps    + Confronta
» Giocabile con tutti i portatili testati con dettagli ultra.
basso 1920x1080
29.8  fps    + Confronta + 📈 Graph
medio 1920x1080
21  fps    + Confronta + 📈 Graph
alto 1920x1080
19.4  fps    + Confronta + 📈 Graph
ultra 1920x1080
18.7  fps    + Confronta + 📈 Graph
» Il Benchmark indica che il gioco non è utilizzabile con i settaggi testati.
basso 1920x1080
45.7 61 ~ 53 fps    + Confronta + 📈 Graph
medio 1920x1080
35.4 44.1 ~ 40 fps    + Confronta + 📈 Graph
alto 1920x1080
24.6 30.9 ~ 28 fps    + Confronta + 📈 Graph
ultra 1920x1080
18.7 22.2 ~ 20 fps    + Confronta + 📈 Graph
» Giocabile con tutti i portatili testati con dettagli medio.
Additional Benchmarks
Low Preset 1280x720
69
Returnal

Returnal

2023
basso 1920x1080
37  fps    + Confronta
medio 1920x1080
36  fps    + Confronta
alto 1920x1080
32  fps    + Confronta
ultra 1920x1080
28  fps    + Confronta
» Giocabile con tutti i portatili testati con dettagli medio.
medio 1920x1080
25.7  fps    + Confronta
alto 1920x1080
19.3  fps    + Confronta
ultra 1920x1080
15.6  fps    + Confronta
» Il Benchmark indica che il gioco non è utilizzabile con i settaggi testati.
F1 22

F1 22

2022
basso 1920x1080
56.2 59.1 72.1 72.4 72.7 73.1 76.3 77.2 77.7 78.2 78.3 ~ 72 fps    + Confronta
medio 1920x1080
49.6 53.9 62.2 65.1 66.6 67 70.8 70.9 71.4 71.6 71.7 ~ 66 fps    + Confronta
alto 1920x1080
36.8 40.9 46.7 51.1 53.3 53.7 55 55.1 56.2 ~ 50 fps    + Confronta
ultra 1920x1080
5.1 9.3 11.9 14.1 14.4 14.7 14.9 15 15.3 ~ 13 fps    + Confronta
» Giocabile con tutti i portatili testati con dettagli alto.
Additional Benchmarks
Ultra Low Preset 16xAF TAA 1280x720
113.4
127.2
86.6
120.3
107.7
120.5
120.8
107.4
basso 1920x1080
44.9 47.3 47.4 50.4 53.3 53.8 ~ 50 fps    + Confronta
medio 1920x1080
35.3 36.3 40.6 41.2 42.6 42.7 ~ 40 fps    + Confronta
alto 1920x1080
24.7 25.7 29.1 30 30.1 31.5 ~ 29 fps    + Confronta
ultra 1920x1080
20.2 20.2 24.1 24.3 25 25.1 ~ 23 fps    + Confronta
» Giocabile con tutti i portatili testati con dettagli medio.
Additional Benchmarks
Lowest Preset (DX12) 1280x720
80.8
87
81.2
82.5
83.8
82.1
basso 1920x1080
67.7  fps    + Confronta
medio 1920x1080
51.8  fps    + Confronta
alto 1920x1080
41.7  fps    + Confronta
ultra 1920x1080
36.6  fps    + Confronta
» Giocabile con tutti i portatili testati con dettagli ultra.
Additional Benchmarks
Low Preset 1280x720
80
medio 1920x1080
31.1  fps    + Confronta
alto 1920x1080
29.9  fps    + Confronta
» Il Benchmark indica che il gioco non è utilizzabile con i settaggi testati.
basso 1920x1080
27  fps    + Confronta + 📈 Graph
medio 1920x1080
24  fps    + Confronta + 📈 Graph
alto 1920x1080
18.3  fps    + Confronta + 📈 Graph
ultra 1920x1080
12.9  fps    + Confronta + 📈 Graph
» Il Benchmark indica che il gioco non è utilizzabile con i settaggi testati.
Additional Benchmarks
Low Preset 1280x720
35.2
Far Cry 6

Far Cry 6

2021
basso 1280x720
61.9  fps    + Confronta + 📈 Graph
medio 1920x1080
37.7  fps    + Confronta + 📈 Graph
alto 1920x1080
32.1  fps    + Confronta + 📈 Graph
ultra 1920x1080
27.2  fps    + Confronta + 📈 Graph
» Giocabile con tutti i portatili testati con dettagli medio.
Additional Benchmarks
Low Graphics Quality 1920x1080
42.9
F1 2021

F1 2021

2021
basso 1280x720
94.8 143.5 143.6 145.9 147.5 ~ 135 fps    + Confronta
medio 1920x1080
50.8 73.9 75.9 80.4 80.6 ~ 72 fps    + Confronta
alto 1920x1080
41.3 56.4 60 63.2 63.8 ~ 57 fps    + Confronta
ultra 1920x1080
20.3 26.2 26.9 28.8 31 ~ 27 fps    + Confronta
» Giocabile con tutti i portatili testati con dettagli alto.
basso 1280x720
58  fps    + Confronta
medio 1920x1080
33 35 ~ 34 fps    + Confronta
alto 1920x1080
28 (!) 30 ~ 29 fps    + Confronta
ultra 1920x1080
26 27 ~ 27 fps    + Confronta
» Giocabile con tutti i portatili testati con dettagli basso.
basso 1280x720
68.5  fps    + Confronta
medio 1920x1080
38.5  fps    + Confronta
alto 1920x1080
27.7  fps    + Confronta
ultra 1920x1080
22.6  fps    + Confronta
» Giocabile con tutti i portatili testati con dettagli medio.
Additional Benchmarks
Very Low Overall Quality (DX11) 1920x1080
55.8
basso 1280x720
130  fps    + Confronta
medio 1920x1080
59  fps    + Confronta
alto 1920x1080
46  fps    + Confronta
ultra 1920x1080
33  fps    + Confronta
» Giocabile con tutti i portatili testati con dettagli alto.
basso 1280x720
65  fps    + Confronta + 📈 Graph
medio 1920x1080
39  fps    + Confronta + 📈 Graph
alto 1920x1080
37  fps    + Confronta + 📈 Graph
ultra 1920x1080
35  fps    + Confronta + 📈 Graph
» Giocabile con tutti i portatili testati con dettagli alto.
basso 1280x720
52.2  fps    + Confronta
medio 1920x1080
33.9  fps    + Confronta
alto 1920x1080
25  fps    + Confronta
ultra 1920x1080
19.7  fps    + Confronta
» Giocabile con tutti i portatili testati con dettagli basso.
basso 1280x720
131.4  fps    + Confronta
medio 1920x1080
62.5  fps    + Confronta
alto 1920x1080
49.5  fps    + Confronta
ultra 1920x1080
48.2  fps    + Confronta
» Giocabile con tutti i portatili testati con dettagli ultra.
Additional Benchmarks
Lowest Preset 1920x1080
88.4
Strange Brigade

Strange Brigade

2018
basso 1280x720
121 131.8 141 141.9 144 147.3 151.6 154.8 159.4 165.4 166 173.8 177.4 179.5 189 190.2 205 208 ~ 164 fps    + Confronta
medio 1920x1080
52.7 53 56 57 60.6 61.9 66 67.6 70 70.5 71 71.1 72 73.4 75.4 80.3 84 87.7 ~ 68 fps    + Confronta
alto 1920x1080
39 41 41.4 50.4 52 52.4 53.3 56.4 57.8 57.8 58.9 59 59 59.7 61.4 64 66.7 72.3 ~ 56 fps    + Confronta
ultra 1920x1080
27.1 31 32 35 38.8 38.9 41 43.2 43.8 44 44.3 46.1 46.8 47 47 50.3 52.5 53 58.9 ~ 43 fps    + Confronta
QHD 2560x1440
42  fps    + Confronta
» Giocabile con la maggior parte dei portatili testati con dettagli ultra.
Far Cry 5

Far Cry 5

2018
basso 1280x720
47 54 54 59 61 63 63 63 65 67 69 69 72 84 91 ~ 65 fps    + Confronta + 📈 Graph
medio 1920x1080
31 33 35 36 37 37 37 39 39 39 40 44 45 52 54 ~ 40 fps    + Confronta + 📈 Graph
alto 1920x1080
22 29 31 33 33 34 35 35 35 36 37 37 37 38 41 48 50 ~ 36 fps    + Confronta + 📈 Graph
ultra 1920x1080
25 27 28 31 32 32 33 33 34 34 35 35 35 36 38 45 46 ~ 34 fps    + Confronta + 📈 Graph
QHD 2560x1440
32  fps    + Confronta
» Giocabile con la maggior parte dei portatili testati con dettagli alto.
Additional Benchmarks
Low Preset TAA 1920x1080
38
45
basso 1280x720
46.1 47.1 47.4 47.5 49 50.3 50.9 51.4 52 52.2 52.4 52.7 53.4 54.4 54.5 55.4 55.4 56.1 58 61.5 63.1 ~ 53 fps    + Confronta
medio 1920x1080
31.2 35.8 36 37.7 38.3 38.9 39.2 39.8 40.1 41 41.1 41.1 41.3 42 42.5 44 45.1 46 46.6 46.7 46.9 ~ 41 fps    + Confronta
alto 1920x1080
27.9 30.2 30.8 31.2 31.3 32 32.1 32.1 32.4 33.4 33.5 35 35.7 36.1 36.8 36.9 37.6 37.8 38.2 38.2 ~ 34 fps    + Confronta
» Giocabile con la maggior parte dei portatili testati con dettagli medio.
basso 1280x720
35.6 42.8 43.8 47.6 51.5 52.8 56.6 56.9 57.2 58.1 59.1 61 63 63.3 64 68.4 83.3 84.1 ~ 58 fps    + Confronta
medio 1920x1080
28 29.7 30.3 32.1 32.1 33.5 34.8 35.8 36 36.1 36.3 36.5 37.3 37.9 38 38.8 45 45.9 ~ 36 fps    + Confronta
alto 1920x1080
14.7 17 18.2 19.2 21 21.2 21.8 23.2 23.9 24.1 24.1 24.4 24.4 24.4 24.6 24.9 26.6 30.6 31.7 ~ 23 fps    + Confronta
QHD 2560x1440
13.4 14 23 ~ 17 fps    + Confronta
» Giocabile con la maggior parte dei portatili testati con dettagli medio.
basso 1280x720
78.3 89.9 98.4 98.9 98.9 99.3 99.4 100.9 100.9 101.2 101.7 102.4 102.5 103.2 103.5 104.1 104.6 105.7 106.5 106.8 ~ 100 fps    + Confronta
medio 1366x768
55.8 69.4 71.4 75.6 75.9 79.2 83 84.3 89.4 90.4 90.9 92.6 92.8 92.9 94.1 94.1 95.3 96.5 96.9 97.4 ~ 86 fps    + Confronta
alto 1920x1080
39.8 57.7 61.5 64.1 66.8 67.2 69.3 70.3 72.3 74.5 74.9 75.7 76 76.7 76.8 77.3 79.1 83 84.6 85.2 ~ 72 fps    + Confronta
ultra 1920x1080
43.7 53.3 59.6 60.4 63.6 63.9 66.5 67.1 68.3 71.1 71.1 72.3 73.4 73.6 74 74.4 75.4 75.6 79.8 80.2 ~ 68 fps    + Confronta
» Giocabile con tutti i portatili testati con dettagli ultra.
basso 1024x768
92 120 126 126 128 131.2 131.3 132 132.9 135.1 135.6 141 142.7 156 157 ~ 132 fps    + Confronta + 📈 Graph
medio 1366x768
59 68 73 76.8 78 78 79.1 80 88.1 88.2 88.4 89 91.5 97 100 ~ 82 fps    + Confronta + 📈 Graph
alto 1920x1080
36 40 40 40.4 42 42.4 44 44.8 51 51.7 54.1 54.3 54.3 56 57 ~ 47 fps    + Confronta + 📈 Graph
ultra 1920x1080
14.5 18.4 19.2 20.1 20.4 20.5 20.8 20.9 23 23.1 23.3 23.8 24.5 24.6 25.1 25.2 25.5 26.1 28 ~ 22 fps    + Confronta + 📈 Graph
» Giocabile con tutti i portatili testati con dettagli alto.
Additional Benchmarks
Medium Graphics & Postprocessing 1920x1080
53.8
51.7
GTA V

GTA V

2015
basso 1024x768
99.1 101.3 102.4 110.5 124.1 126.5 139.1 147.3 153.3 160.3 160.3 161 163.3 166.9 171.5 175 ~ 141 fps    + Confronta
medio 1366x768
59.9 85.7 90.4 93.8 107.7 120.8 124.1 134.8 135.8 139.5 148 148.2 152.8 154.9 160.9 164.4 168.4 ~ 129 fps    + Confronta
alto 1920x1080
19.1 22.6 24.2 26.2 31.3 32.2 33.1 33.4 33.5 33.9 34.8 35.2 36.2 36.3 36.9 37.6 41.2 41.3 ~ 33 fps    + Confronta
ultra 1920x1080
9.6 10 11 12.1 12.3 12.7 13.1 13.3 13.7 13.8 14.1 14.2 14.3 14.3 14.6 15.9 15.9 16.5 ~ 13 fps    + Confronta
» Giocabile con tutti i portatili testati con dettagli medio.
Additional Benchmarks
Normal/Off 4xAF 1920x1080
123.9
121.8
108.9
118.4
156
139.7
90.4
69.3
111
101
Lowest Settings possible 1920x1080
138.3
130.9
130.5
128.3
167.5
152.7
62.9
119.5
122.2
bassomedioaltoultraQHD4K
Dragon's Dogma 21814.5
Horizon Forbidden West30.627.118.516.2
Alone in the Dark69564929
Last Epoch60464034
Skull & Bones36322721
Helldivers 239.23027.527.2
Enshrouded272216.8
Palworld40.637.129.527.3
Prince of Persia The Lost Crown196136128
Ready or Not60.446.945.832.5
The Finals99.568.960.546.4
Avatar Frontiers of Pandora18161411
EA Sports WRC35.826.624.722.4
Lords of the Fallen20.21816.314.2
Total War Pharaoh99695038
Assassin's Creed Mirage34333025
Counter-Strike 2111.184.552.131.8
Cyberpunk 2077 2.0 Phantom Liberty2825202013.1
Lies of P56.948.141.733.2
The Crew Motorfest32302521
Starfield11.5
Armored Core 65040.136.232.2
Atlas Fallen45.945.739.529.2
Baldur's Gate 331262322
Ratchet & Clank Rift Apart28.42925.921.1
F1 2357523612
Resident Evil 4 Remake39.630.526.718.4
Company of Heroes 362.250.13938.6
Sons of the Forest29.82119.418.7
Atomic Heart53402820
Returnal37363228
Hogwarts Legacy25.719.315.6
F1 2272665013
Tiny Tina's Wonderlands50402923
GRID Legends67.751.841.736.6
Dying Light 231.129.9
God of War272418.312.9
Far Cry 661.937.732.127.2
F1 2021135725727
Horizon Zero Dawn58342927
Borderlands 368.538.527.722.6
Total War: Three Kingdoms130594633
Far Cry New Dawn65393735
Metro Exodus52.233.92519.7
Shadow of the Tomb Raider131.462.549.548.2
Strange Brigade16468564342
Far Cry 56540363432
X-Plane 11.11534134
Final Fantasy XV Benchmark58362317
Dota 2 Reborn100867268
The Witcher 3132824722
GTA V1411293313
< 30 fps
< 60 fps
< 120 fps
≥ 120 fps
7
20
14
6
12
28
9
2
24
24
2
1
30
14
1
1
3
2


Per conoscere altri giochi che potrebbero essere utilizzabili e per una lista completa di tutti i giochi e delle schede grafiche visitate la nostra Gaming List

v1.26
log 25. 12:16:34

#0 no ids found in url (should be separated by "_") +0s ... 0s

#1 not redirecting to Ajax server +0s ... 0s

#2 did not recreate cache, as it is less than 5 days old! Created at Thu, 25 Apr 2024 05:40:10 +0200 +0.001s ... 0.001s

#3 no comparison url found in template nbc.compare_page_1 needed +0.052s ... 0.054s

#4 no comparison url found in template nbc.compare_page_1 needed +0s ... 0.054s

#5 composed specs +0s ... 0.054s

#6 did output specs +0s ... 0.054s

#7 start showIntegratedCPUs +0s ... 0.054s

#8 getting avg benchmarks for device 12086 +0.035s ... 0.089s

#9 got single benchmarks 12086 +0.078s ... 0.167s

#10 got avg benchmarks for devices +0s ... 0.167s

#11 min, max, avg, median took s +1.132s ... 1.299s

#12 before gaming benchmark output +0.001s ... 1.3s

#13 Got 885 rows for game benchmarks. +0.262s ... 1.561s

#14 composed SQL query for gamebenchmarks +0s ... 1.561s

#15 got data and put it in $dataArray +0.039s ... 1.6s

#16 benchmarks composed for output. +2.264s ... 3.864s

#17 no comparison url found in template nbc.compare_page_1 needed +0.007s ... 3.871s

#18 return log +0s ... 3.871s

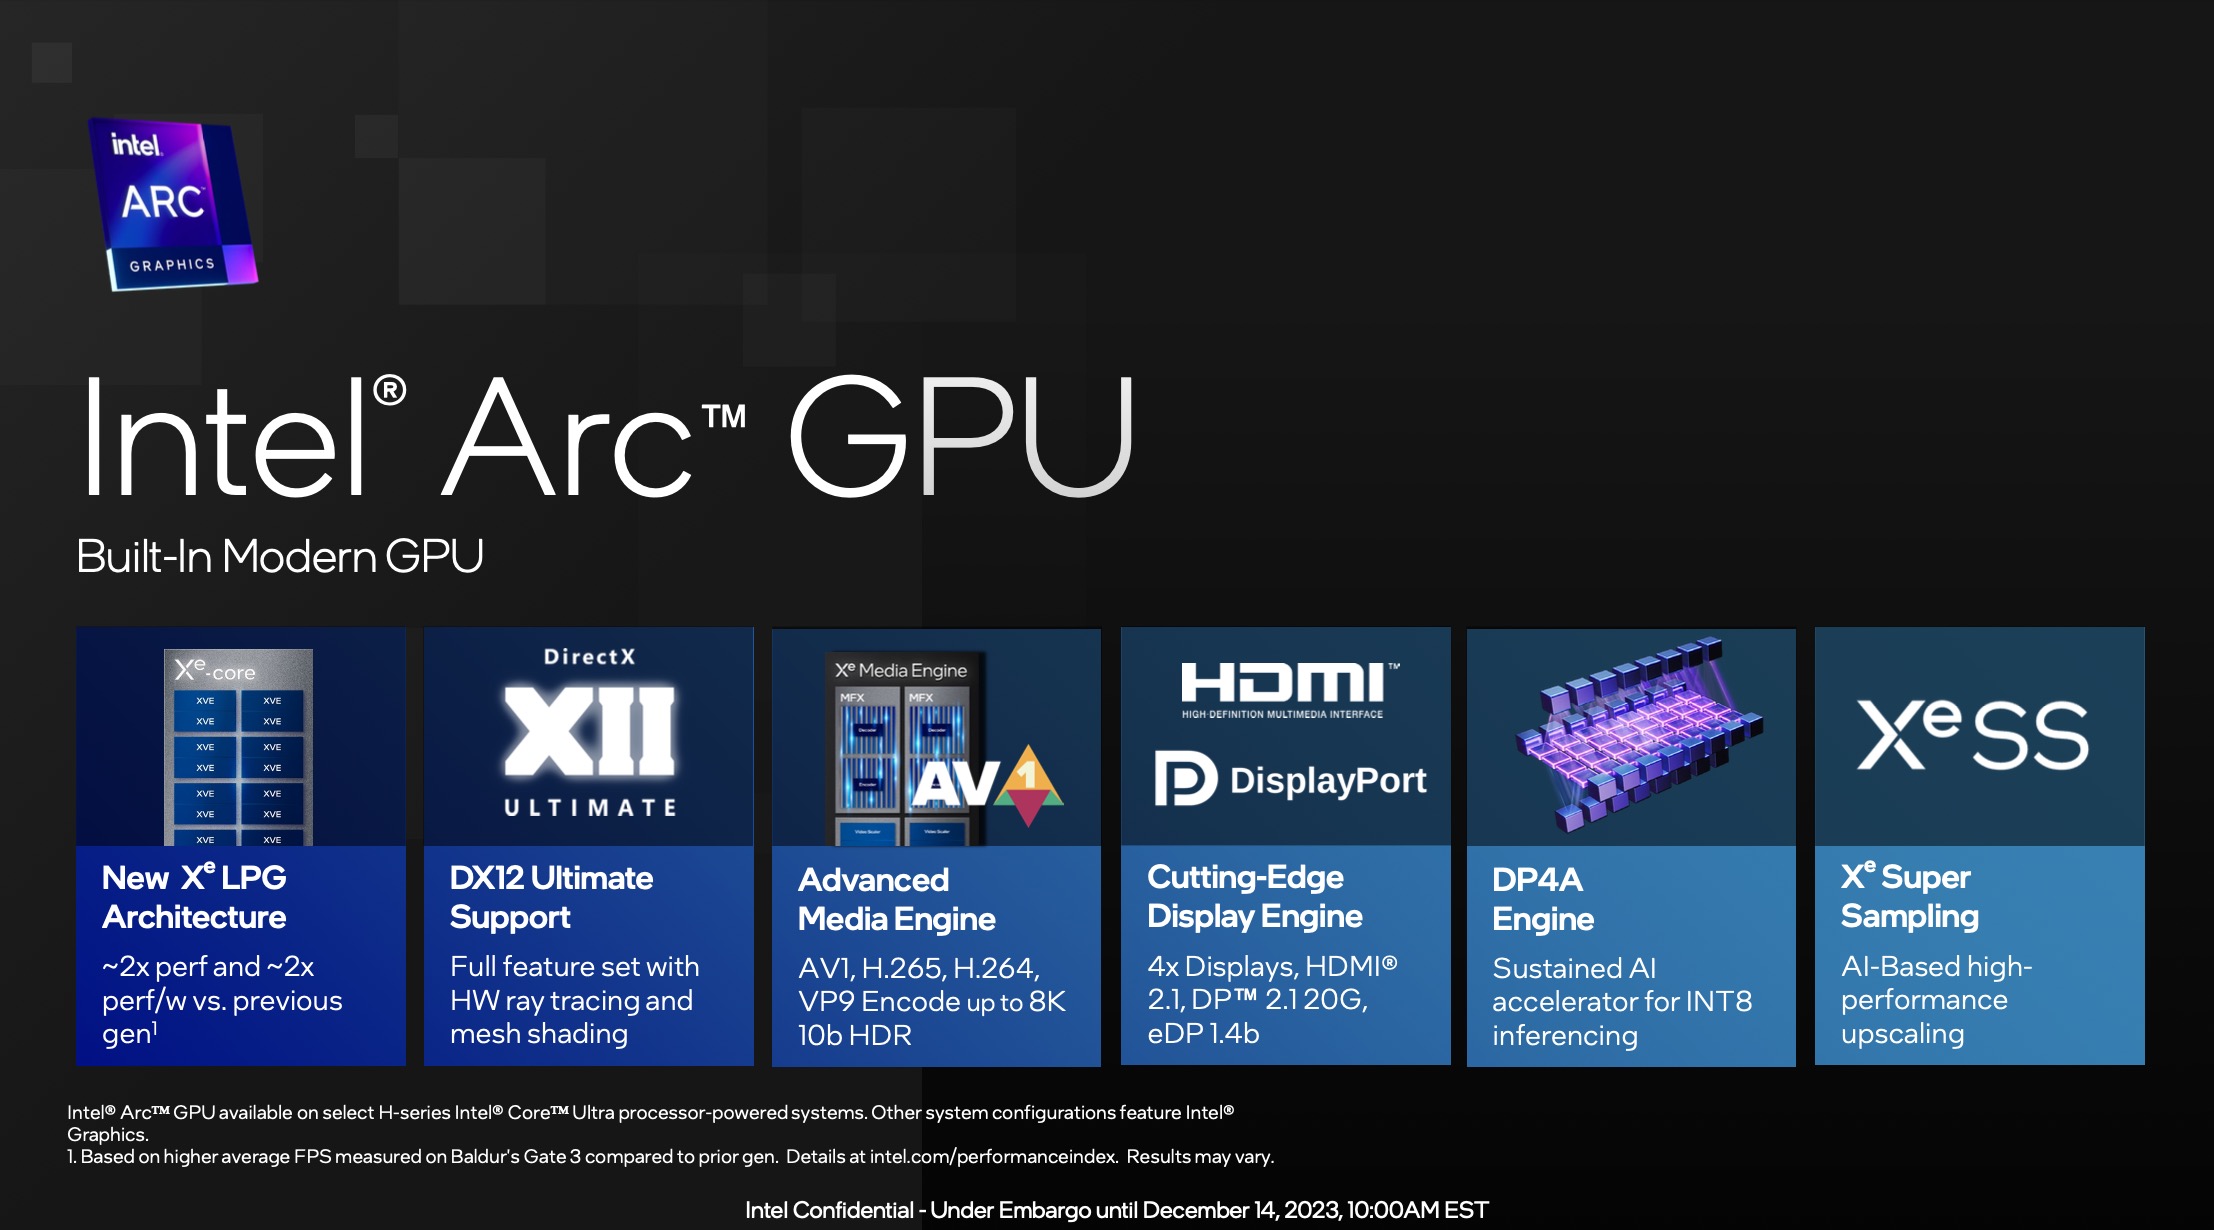
Recensioni Notebook con Intel Arc 8-Cores iGPU la scheda grafica

Recensione di Xiaomi RedmiBook Pro 16 2024 - Forse il miglior portatile Meteor Lake con una lunga durata della batteria

Recensione di Xiaomi RedmiBook Pro 16 2024 - Forse il miglior portatile Meteor Lake con una lunga durata della batteria

Un case in metallo, Core Ultra 7, 32 GB di RAM, un display IPS 3K e una buona tastiera: il RedmiBook Pro 16 offre tutto questo a meno di 1.000 Euro (~$1.066). I...
Intel Core Ultra 7 155H | Intel Arc 8-Cores iGPU | 16.00" | 1.9 kg
Recensione del Samsung Galaxy Book4 Pro 14 - Laptop costoso per tutti i giorni con schermo OLED touch screen

Recensione del Samsung Galaxy Book4 Pro 14 - Laptop costoso per tutti i giorni con schermo OLED touch screen

Galaxy Book4 Pro 14 è il notebook sottile e leggero di Samsung per l'uso quotidiano. È dotato di un recente processore Meteor Lake e di uno schermo touch screen...
Intel Core Ultra 7 155H | Intel Arc 8-Cores iGPU | 14.00" | 1.2 kg
LG Gram 17 (2024)

Recensione del portatile LG Gram 17 (2024) - Piccoli miglioramenti e un nuovo Core Ultra 7

Il nuovo Gram di LG è rimasto fedele alla serie. Dall'esterno, non è cambiato quasi nulla del sottile dispositivo da 17 pollici. All'interno, un processore Mete...
Intel Core Ultra 7 155H | Intel Arc 8-Cores iGPU | 17.00" | 1.3 kg
Recensione del Lenovo Yoga 9 2-in-1 14IMH9: Più piccolo e leggero con grafica Arc più veloce

Recensione del Lenovo Yoga 9 2-in-1 14IMH9: Più piccolo e leggero con grafica Arc più veloce

Lo Yoga 9 2-in-1 G9 migliora diversi aspetti dello Yoga 9 2-in-1 G8, ma rimangono alcuni svantaggi fondamentali, tra cui lo spiacevole effetto moiré che rende i...
Intel Core Ultra 7 155H | Intel Arc 8-Cores iGPU | 14.00" | 1.3 kg
Acemagic F2A

Recensione dell'Acemagic F2A: un mini-PC AI con processore Meteor Lake Core Ultra 7 155H di Intel, 32 GB di RAM DDR5 e Wi-Fi 7

Acemagic commercializza PC da ufficio ad alte prestazioni con gli ultimi processori Meteor Lake di Intel con il nome F2A. Abbiamo esaminato da vicino l'Acemagic...
Intel Core Ultra 7 155H | Intel Arc 8-Cores iGPU | | 768 gr

Samsung Galaxy Book4 Pro 16: Intel Core Ultra 7 155H, 16.00", 1.5 kg
  recensione » Galaxy Recensione del portatile Book4 Pro 16: L'alternativa di Samsung al Apple MacBook Air 15

AcePC Wizbox AI: Intel Core Ultra 7 155H, 0.8 kg
  recensione » Recensione del mini PC AcePC Wizbox AI: Intel Meteor Lake diventa mini

Dell Inspiron 14 Plus 7440: Intel Core Ultra 7 155H, 14.00", 1.6 kg
  recensione » Recensione del laptop Dell Inspiron 14 Plus 7440: lascia la GeForce RTX per l'Intel Arc integrata

Lenovo Yoga Slim 7 14IMH9: Intel Core Ultra 7 155H, 14.00", 1.4 kg
  recensione » Recensione del computer portatile Lenovo Yoga Slim 7 14 G9: Nuovo formato più piccolo con tasto Co-Pilot integrato

Lenovo Yoga Pro 7 14IMH9: Intel Core Ultra 7 155H, 14.50", 1.6 kg
  recensione » Recensione del portatile Lenovo Yoga Pro 7 14: Intel Arc si confronta con Radeon 780M

MSI Prestige 13 AI Evo: Intel Core Ultra 7 155H, 13.30", 1 kg
  recensione » Recensione del portatile MSI Prestige 13 AI Evo - Core Ultra 7 e OLED con un peso inferiore a 1 kg

Asus Zenbook Duo OLED UX8406MA: Intel Core Ultra 9 185H, 14.00", 1.7 kg
  recensione » Recensione del convertibile Asus Zenbook Duo OLED (2024): Campione di multitasking con Core Ultra 9

HP Spectre x360 16-aa0074ng: Intel Core Ultra 7 155H, 16.00", 1.9 kg
  recensione » Recensione del portatile convertibile 2-in-1 HP Spectre x360 16 (2024): Un potente Core-Ultra tuttofare con OLED

Lenovo ThinkPad X1 Carbon G12: Intel Core Ultra 7 155H, 14.00", 1.1 kg
  recensione » Recensione del notebook Lenovo ThinkPad X1 Carbon G12: Il primo aggiornamento importante in tre anni

Asus ZenBook 14 UX3405MA: Intel Core Ultra 7 155H, 14.00", 1.2 kg
  recensione » Recensione dell'Asus Zenbook 14 OLED - Il subnotebook da 1,2 kg con OLED a 120 Hz e Core Ultra 7

HP Spectre x360 14-eu0078ng: Intel Core Ultra 7 155H, 14.00", 1.5 kg
  recensione » Recensione dell'HP Spectre x360 14 - Il convertibile di fascia alta ora con un OLED più grande da 120 Hz

MSI Prestige 16 B1MG-001US: Intel Core Ultra 7 155H, 16.00", 1.6 kg
  recensione » Recensione del portatile MSI Prestige 16 B1MG: Dal Core i7 Xe al Core Ultra 7 Arc

Acer Swift Go 14 SFG14-72: Intel Core Ultra 7 155H, 14.00", 1.3 kg
  recensione » Recensione dell'Acer Swift Go 14 - Il Meteor Lake Core Ultra 7 colpisce per il suo nucleo AI

  recensione » Analisi di Intel Meteor Lake - Core Ultra 7 155H convince solo con le prestazioni della GPU

Asus ZenBook 14 UX3405MA: Intel Core Ultra 7 155H
  recensione » Analisi di Intel Meteor Lake - Core Ultra 7 155H convince solo con le prestazioni della GPU

LG Gram 17 17Z90S-G.AA79G: Intel Core Ultra 7 155H, 17.00", 1.3 kg
  Recensioni esterne » LG Gram 17 17Z90S-G.AA79G

Asus Zenbook 14 OLED Q425: Intel Core Ultra 7 155H, 14.00", 1.3 kg
  Recensioni esterne » Asus Zenbook 14 OLED Q425

LG gram Pro 17Z90SP: Intel Core Ultra 7 155H, 17.00", 1.3 kg
  Recensioni esterne » LG gram Pro 17Z90SP

Dell Inspiron 14 Plus 7440: Intel Core Ultra 7 155H, 14.00", 1.6 kg
  Recensioni esterne » Dell Inspiron 14 Plus 7440

Lenovo Yoga Pro 7 14IMH9: Intel Core Ultra 7 155H, 14.50", 1.6 kg
  Recensioni esterne » Lenovo Yoga Pro 7 14IMH9

LG gram Pro 2-in-1 16T90SP: Intel Core Ultra 7 155H, 16.00", 1.4 kg
  Recensioni esterne » LG gram Pro 2-in-1 16T90SP

Xiaomi RedmiBook Pro 16 2024: Intel Core Ultra 7 155H, 16.00", 1.9 kg
  Recensioni esterne » Xiaomi RedmiBook Pro 16 2024

Lenovo Yoga Slim 7 14IMH9: Intel Core Ultra 7 155H, 14.00", 1.4 kg
  Recensioni esterne » Lenovo Yoga Slim 7 14IMH9

Samsung Galaxy Book4 Pro 360, Ultra 7 155H: Intel Core Ultra 7 155H, 16.00", 1.7 kg
  Recensioni esterne » Samsung Galaxy Book4 Pro 360, Ultra 7 155H

Lenovo ThinkPad X1 Carbon G12: Intel Core Ultra 7 155H, 14.00", 1.1 kg
  Recensioni esterne » Lenovo ThinkPad X1 Carbon G12

Samsung Galaxy Book4 Pro 14: Intel Core Ultra 7 155H, 14.00", 1.2 kg
  Recensioni esterne » Samsung Galaxy Book4 Pro 14

Samsung Galaxy Book4 Pro 16: Intel Core Ultra 7 155H, 16.00", 1.5 kg
  Recensioni esterne » Samsung Galaxy Book4 Pro 16

MSI Claw: Intel Core Ultra 7 155H, 7.00", 0.7 kg
  Recensioni esterne » MSI Claw

HP Spectre x360 16-aa0074ng: Intel Core Ultra 7 155H, 16.00", 1.9 kg
  Recensioni esterne » HP Spectre x360 16-aa0074ng

Lenovo Yoga 9 14IMH9: Intel Core Ultra 7 155H, 14.00", 1.3 kg
  Recensioni esterne » Lenovo Yoga 9 14IMH9

HP Spectre x360 14-eu0078ng: Intel Core Ultra 7 155H, 14.00", 1.5 kg
  Recensioni esterne » HP Spectre x360 14-eu0078ng

MSI Prestige 16 B1MG-001US: Intel Core Ultra 7 155H, 16.00", 1.6 kg
  Recensioni esterne » MSI Prestige 16 B1MG-001US

Acer Swift Go 14 SFG14-72: Intel Core Ultra 7 155H, 14.00", 1.3 kg
  Recensioni esterne » Acer Swift Go 14 SFG14-72

Medion E15443: Intel Core Ultra 7 155H, 15.60", 1.8 kg
  Recensioni esterne » Medion E15443

MSI Prestige 13 AI Evo: Intel Core Ultra 7 155H, 13.30", 1 kg
  Recensioni esterne » MSI Prestige 13 AI Evo

Asus Zenbook Duo OLED UX8406MA: Intel Core Ultra 9 185H, 14.00", 1.7 kg
  Recensioni esterne » Asus Zenbook Duo OLED UX8406MA

Asus ZenBook 14 UX3405MA: Intel Core Ultra 7 155H, 14.00", 1.2 kg
  Recensioni esterne » Asus ZenBook 14 UX3405MA

Asus Zenbook Duo OLED UX8406MA: Intel Core Ultra 9 185H, 14.00", 1.7 kg
   » Asus Zenbook Duo OLED (2024) è attualmente il miglior dispositivo multischermo sul mercato

Asus ZenBook 14 UX3405MA: Intel Core Ultra 7 155H, 14.00", 1.2 kg
   » Il nuovo Asus Zenbook 14 OLED 2024 ha un grande difetto

Please share our article, every link counts!

Classe 0

newitem

Classe 1

GeForce RTX 2080 Super Mobile

Classe 2

M1 Max 32-Core GPU *
GeForce RTX 2070 Super Mobile
M1 Max 24-Core GPU *
Radeon RX 5700M *
M1 Pro 16-Core GPU *
Radeon PRO W6600M *
GeForce RTX 2070 Super Max-Q
M1 Pro 14-Core GPU *
Quadro P4200
Quadro P5000 Max-Q *
GeForce RTX 3050 4GB Laptop GPU
Quadro P4000 Max-Q
Radeon RX 580X (Laptop) *
Radeon RX 580 (Laptop)
Radeon Pro 5300M
Radeon RX 5300M
Quadro P3000 Max-Q *
Radeon Pro WX 7100 *
Radeon RX 570X (Laptop) *
Radeon RX 570 (Laptop) *
Radeon RX 470 (Laptop) *

Classe 3

GeForce GTX 1050 Ti Mobile
Radeon 680M
Quadro P2000 Max-Q
Radeon R9 M395X
GeForce GTX 1050 Ti Max-Q *
WX Vega M GL
Radeon R9 M485X
GeForce GTX 1050 Max-Q *
Radeon 660M
Radeon RX 560X (Laptop)
Radeon RX 560 (Laptop)
Radeon Pro 560X
Radeon Pro 560
Radeon Pro 460
Radeon Pro WX 4130 *
Quadro P620 *
Radeon RX 550X (Laptop)
Radeon Pro 555X
Radeon Pro 555
Radeon Pro 455
Quadro P600
Radeon RX 540X *
Radeon Pro WX 2100 *
Radeon Pro WX 3100 *
Radeon Pro 450
Radeon 630
Radeon 540X *
Quadro P520
Quadro P500 *
Iris Plus Graphics G7 (Ice Lake 64 EU) *
Vega 10 *
Iris Pro Graphics 580
Vega 9
FirePro W5130M
UHD Graphics Xe G4 48EUs *
UHD Graphics 32EUs
UHD Graphics Xe 32EUs (Tiger Lake-H) *
UHD Graphics 750
Vega 7
Radeon R7 M465
Vega 8
Iris Plus Graphics G4 (Ice Lake 48 EU)
Quadro M600M
FirePro W4190M
Radeon R7 M445
UHD Graphics 24EUs (Alder Lake-N) *
Radeon R7 M340
Radeon 610M *
UHD Graphics G1 (Ice Lake 32 EU)
UHD Graphics Xe 16EUs (Tiger Lake-H) *
Radeon R5 (Bristol Ridge)
Adreno 690 *
Adreno 685 *
Adreno 680 *

Classe 4

UHD Graphics 730
Radeon R5 M315 *
Radeon R5 M420 *
UHD Graphics 617
UHD Graphics 615
Radeon R4 (Stoney Ridge)
Radeon R2 (Stoney Ridge)
HD Graphics (Broadwell)

Classe 5

Posizione approssimativa dell'adattatore grafico

> Recensioni e prove di notebook, tablets e smartphones > Info Techniche / Tips > Confronto delle schede video > Intel > Intel Arc 8-Cores
Klaus Hinum, 2023-12-14 (Update: 2023-12-14)