Recensione dell'Acer Swift Go 14 - Il Meteor Lake Core Ultra 7 colpisce per il suo nucleo AI
Non sono passati nemmeno due mesi da quando abbiamo recensito l'Acer Swift Go 14. Questo modello ci ha impressionato per le sue buone prestazioni ad un prezzo accessibile. Il nostro attuale dispositivo di recensione è dotato dell'ultima generazione di processori Intel. L'Acer Swift Go 14 - che sarà disponibile dalla prossima primavera - è dotato di un processore Intel Core Ultra 155H. Da un punto di vista hardware, Acer ci ha fornito un computer portatile basato su un dispositivo con specifiche standard. Tuttavia, entro la primavera, ci saranno ancora piccoli miglioramenti al software di accompagnamento, alla gestione delle prestazioni e al BIOS. Per questo motivo, non assegneremo una valutazione fino a quando non vedremo quali miglioramenti futuri l'ultima generazione di processori Intel apporterà a questo modello premium con display OLED.
In alcuni benchmark, abbiamo registrato prestazioni più che doppie rispetto al predecessore, che montava un Intel Core i5-1335U. Inoltre, la nuova iGPU Arc di Intel farà senza dubbio piacere a molti giocatori, con la grafica Intel ora almeno alla pari con la Radeon RX 780M.
Intel stessa confronta spesso i suoi nuovi processori con Ryzen R7 7840U di AMD e, per questo motivo, nell'ambito del nostro confronto daremo un'occhiata all'HP Pavillon Plus 14, che è dotato di entrambe le varianti di processore Intel e AMD. Un rappresentante piuttosto insolito potrebbe essere Ayaneo Air 1S, ma anche questo dispositivo è dotato del potente chip concorrente di AMD. Infine, l'LG Gram 2in1 e l'Acer Swift Go 14 SFG14-71 con il loro processore di 13esima generazione concludono il nostro illustre gruppo.
Potenziali concorrenti a confronto
Punteggio | Data | Modello | Peso | Altezza | Dimensione | Risoluzione | Prezzo |
|---|---|---|---|---|---|---|---|
v (old) | 12/2023 | Acer Swift Go 14 SFG14-72 Ultra 7 155H, Arc 8-Core | 1.3 kg | 14.9 mm | 14.00" | 2880x1800 | |
| 85.6 % v7 (old) | 11/2023 | Acer Swift Go 14 SFG14-71 i5-1335U, Iris Xe G7 80EUs | 1.3 kg | 14.9 mm | 14.00" | 2880x1800 | |
| 85.8 % v7 (old) | 11/2023 | LG Gram 2in1 16 16T90R - G.AA78G i7-1360P, Iris Xe G7 96EUs | 1.5 kg | 17.2 mm | 16.00" | 2560x1600 | |
| 87.5 % v7 (old) | 12/2023 | HP Pavilion Plus 14-ew0153TU i7-1355U, Iris Xe G7 96EUs | 1.4 kg | 17.5 mm | 14.00" | 2880x1800 | |
| 90.4 % v7 (old) | 12/2023 | Lenovo ThinkPad T14 G4 21K4S02000 R7 PRO 7840U, Radeon 780M | 1.5 kg | 17.9 mm | 14.00" | 1920x1200 | |
| 88.2 % v7 (old) | 10/2023 | Ayaneo Air 1S Retro Power R7 7840U, Radeon 780M | 443.8 gr | 21 mm | 5.50" | 1920x1080 | |
| 87.8 % v7 (old) | 11/2023 | HP Pavilion Plus 14-ey0095cl R7 7840U, Radeon 780M | 1.4 kg | 18.8 mm | 14.00" | 2880x1800 |
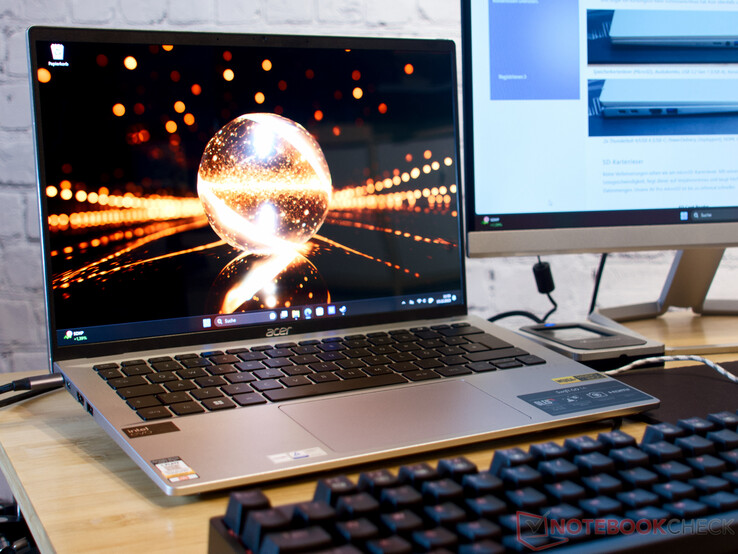
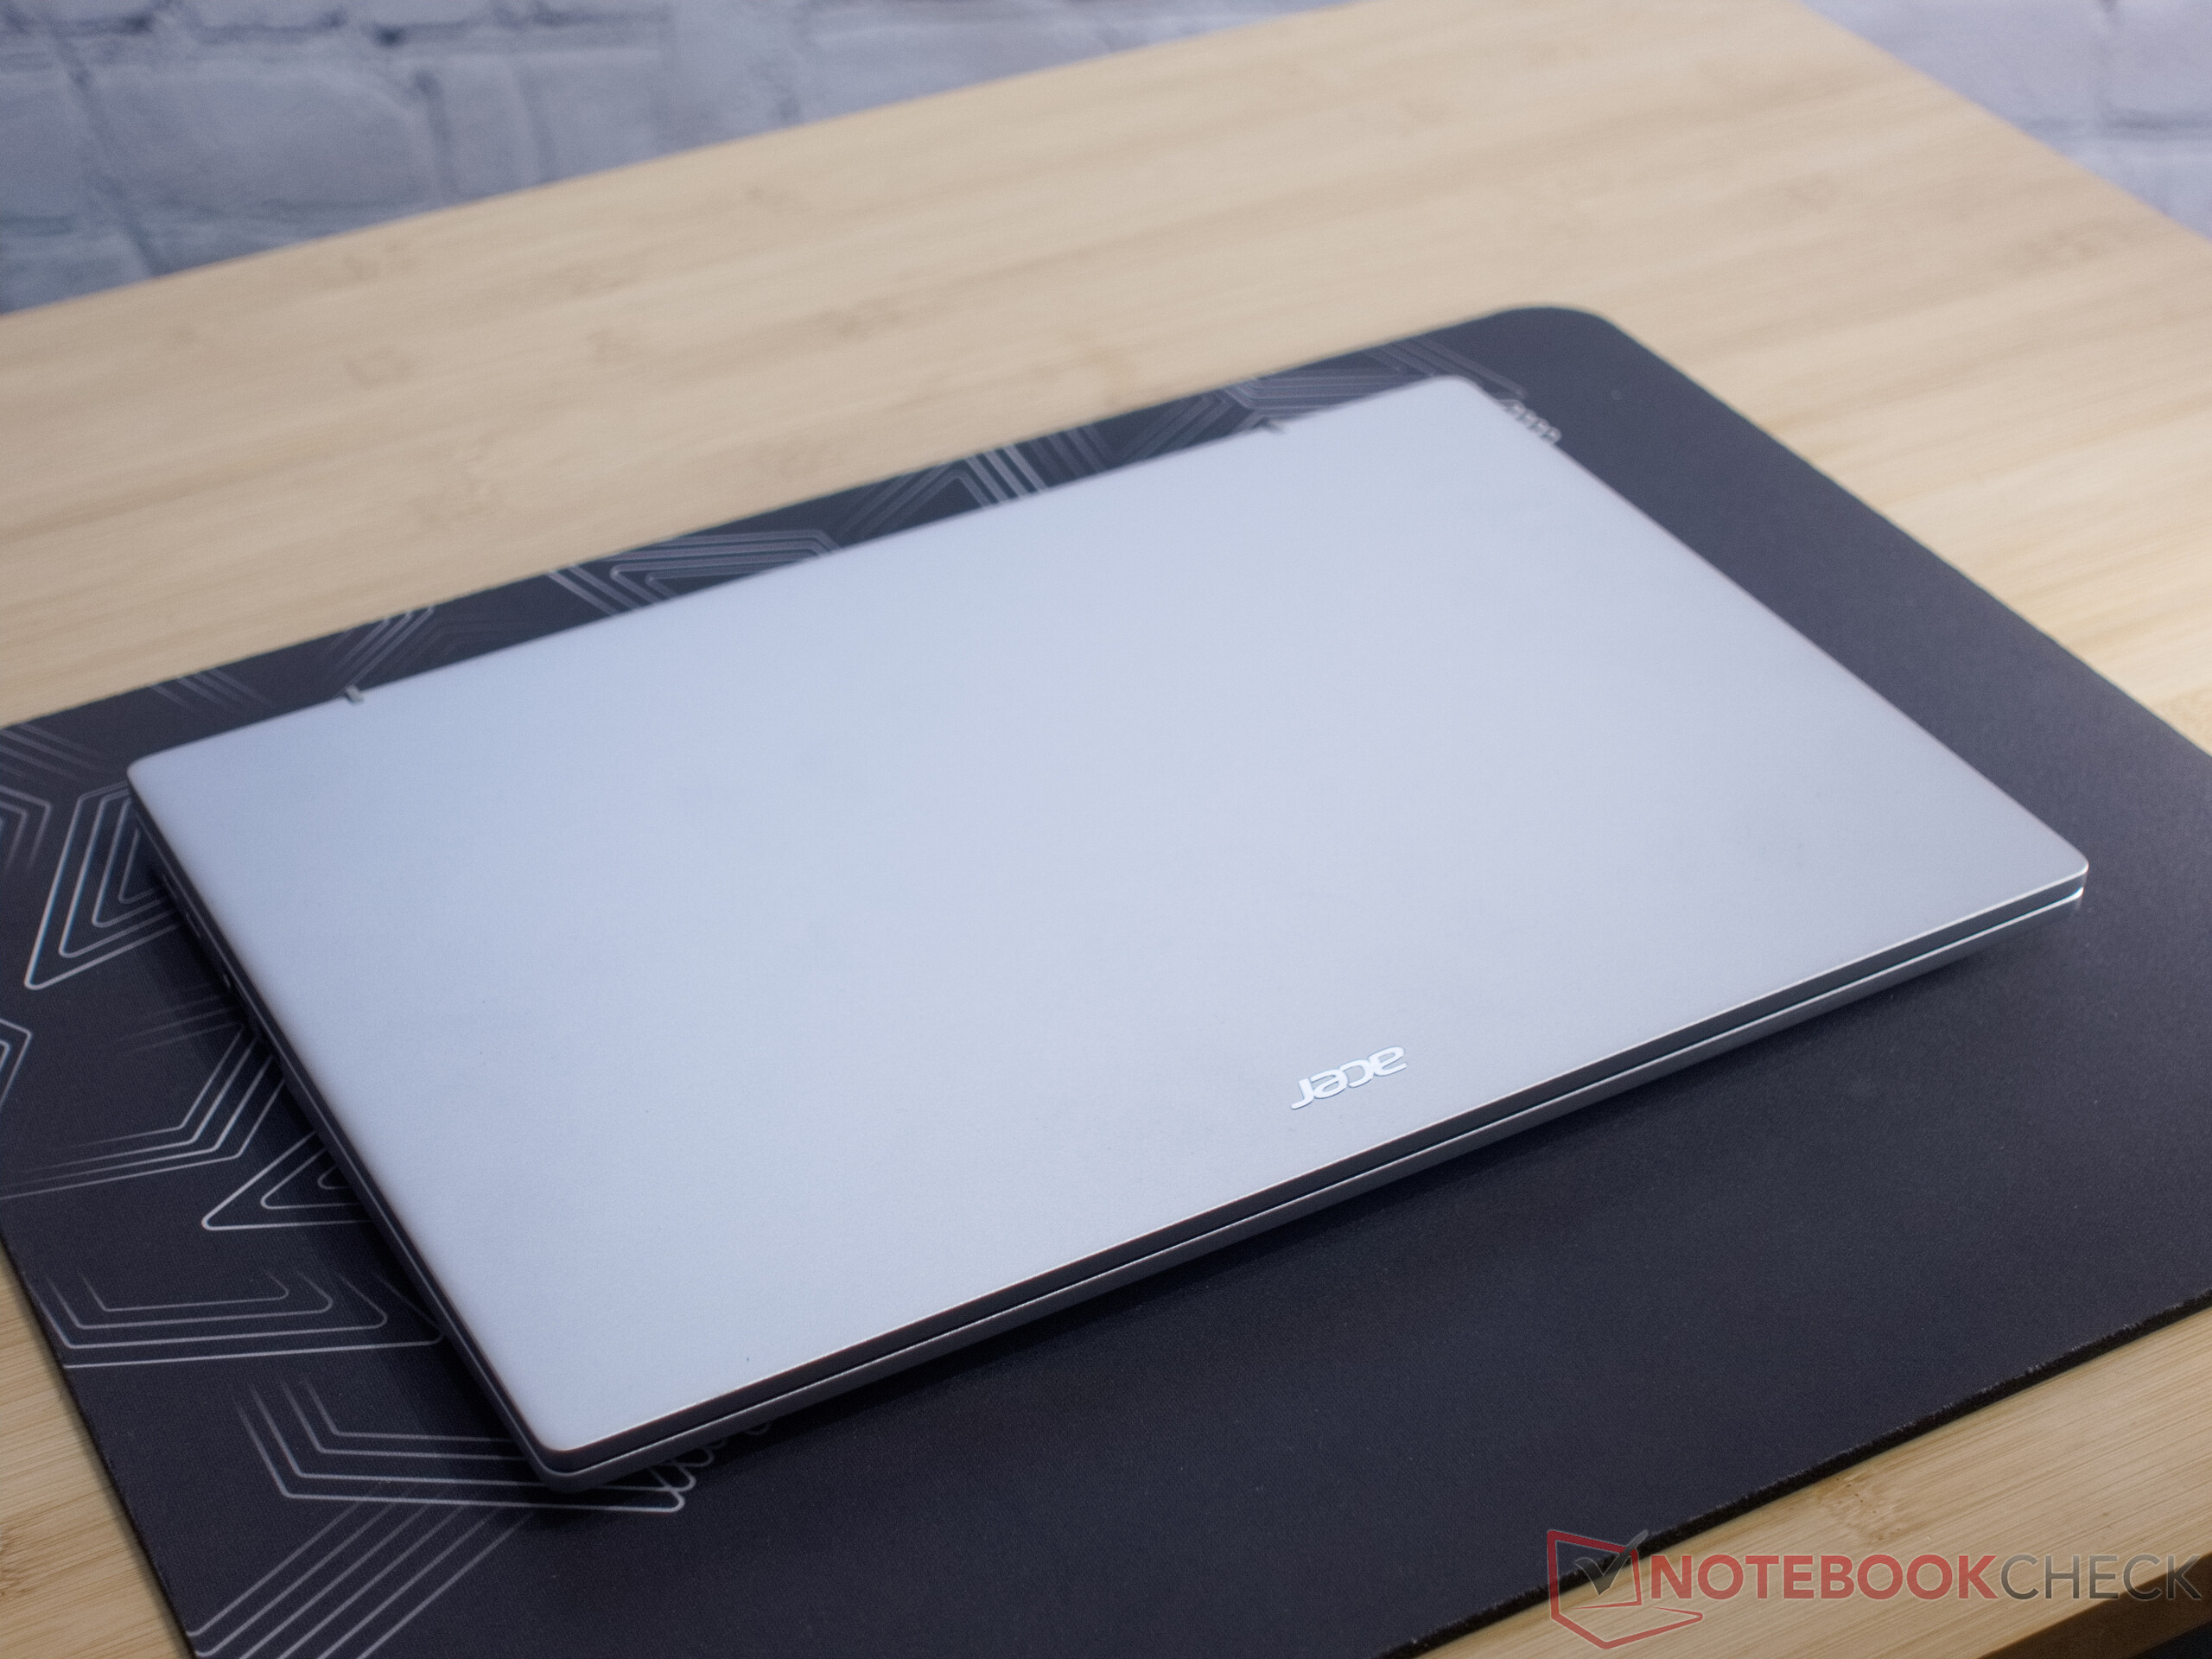
Cassa - Alluminio angolare
Anche se le prime impressioni suggerirebbero che il dispositivo non ha subito alcuna modifica, abbiamo notato che Acer ha apportato miglioramenti dettagliati al telaio in alluminio. Il design angolare della cornice non rivela alcun difetto di fabbricazione e questo significa che potremmo quasi copiare e incollare l'intera descrizione del predecessore. Tuttavia, Acer è riuscita a installare un touchpad significativamente più grande, migliorando sensibilmente l'usabilità del portatile.
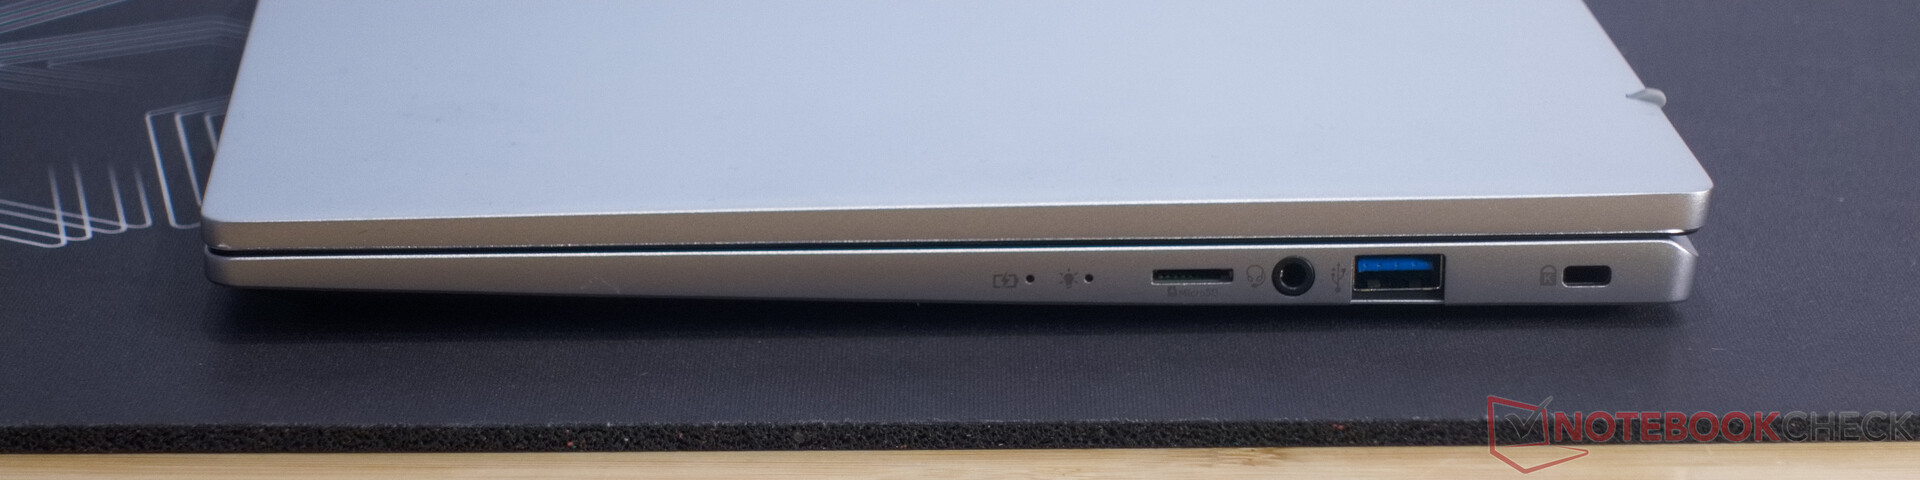
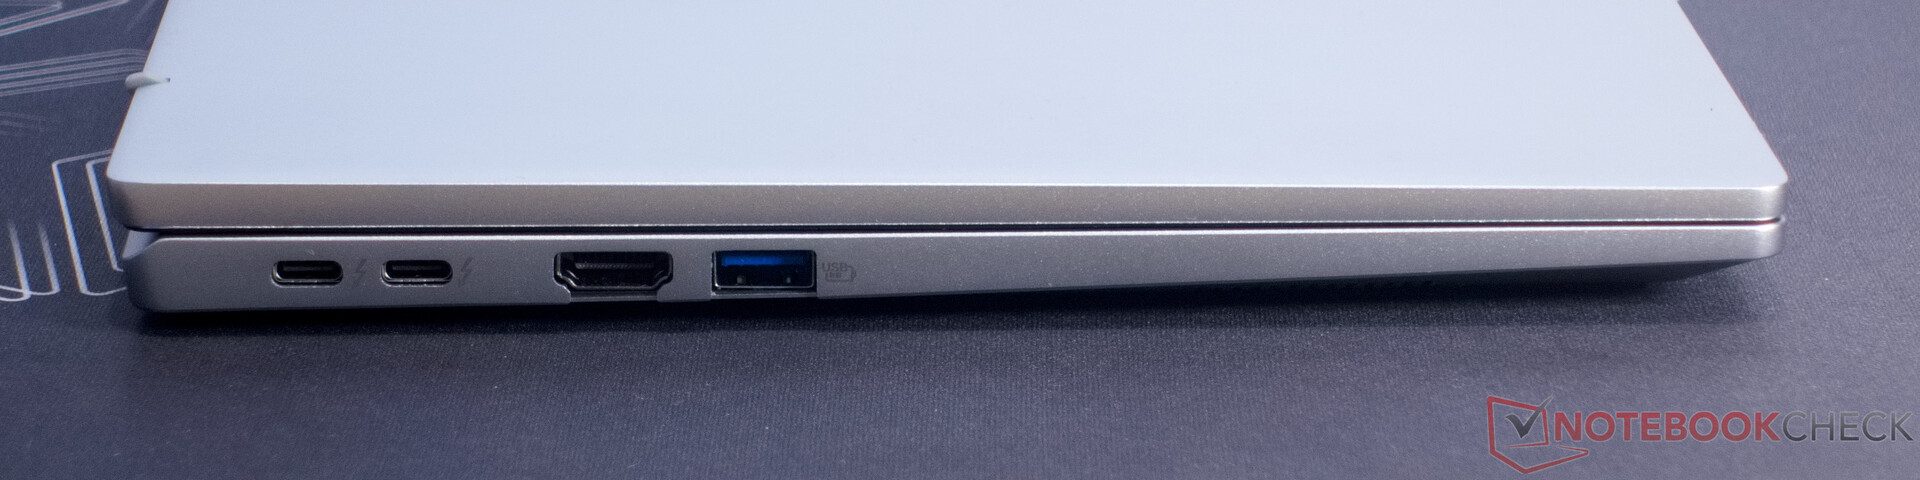
Caratteristiche - Wi-Fi micidiale e una webcam eccellente
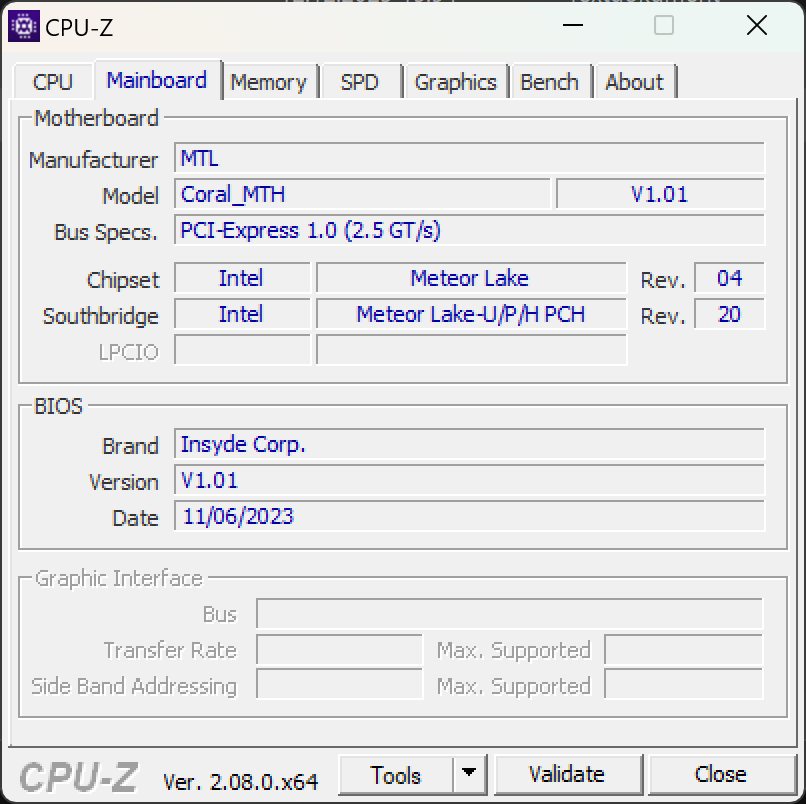
È possibile collegare fino a tre monitor al piccolo computer portatile tramite HDMI 2.1 ed entrambe le porte Thunderbolt 4. L'attuale processore Intel Meteor Lake supporta l'output fino a quattro monitor contemporaneamente. Allo stesso modo, Acer è riuscita a inserire un lettore di schede microSD e persino un mini slot Kensington Lock.
Lettore di schede SD
Non ci sono miglioramenti nel lettore di schede microSD. Con la sua lenta velocità di lettura di 28 MB/s, è paragonabile al modello dello scorso anno ed è adatto solo per piccole quantità di dati. La nostra microSD AV Pro è fino a dieci volte più veloce.
| SD Card Reader | |
| average JPG Copy Test (av. of 3 runs) | |
| Media della classe Subnotebook (23.7 - 188, n=9, ultimi 2 anni) | |
| Acer Swift Go 14 SFG14-72 | |
| maximum AS SSD Seq Read Test (1GB) | |
| Media della classe Subnotebook (24.9 - 195, n=8, ultimi 2 anni) | |
| Acer Swift Go 14 SFG14-72 | |
Comunicazione
Utilizzando iPerf3 e l'Asus GT-AXE11000, nel nostro test Wi-Fi, l'Acer Swift Go ha dimostrato velocità di trasferimento notevolmente superiori sia nelle reti a 5 GHz che a 6 GHz. Con un massimo di 1,9 GBit/s, i caricamenti e i download su una rete domestica procedono a ritmo sostenuto.
Webcam
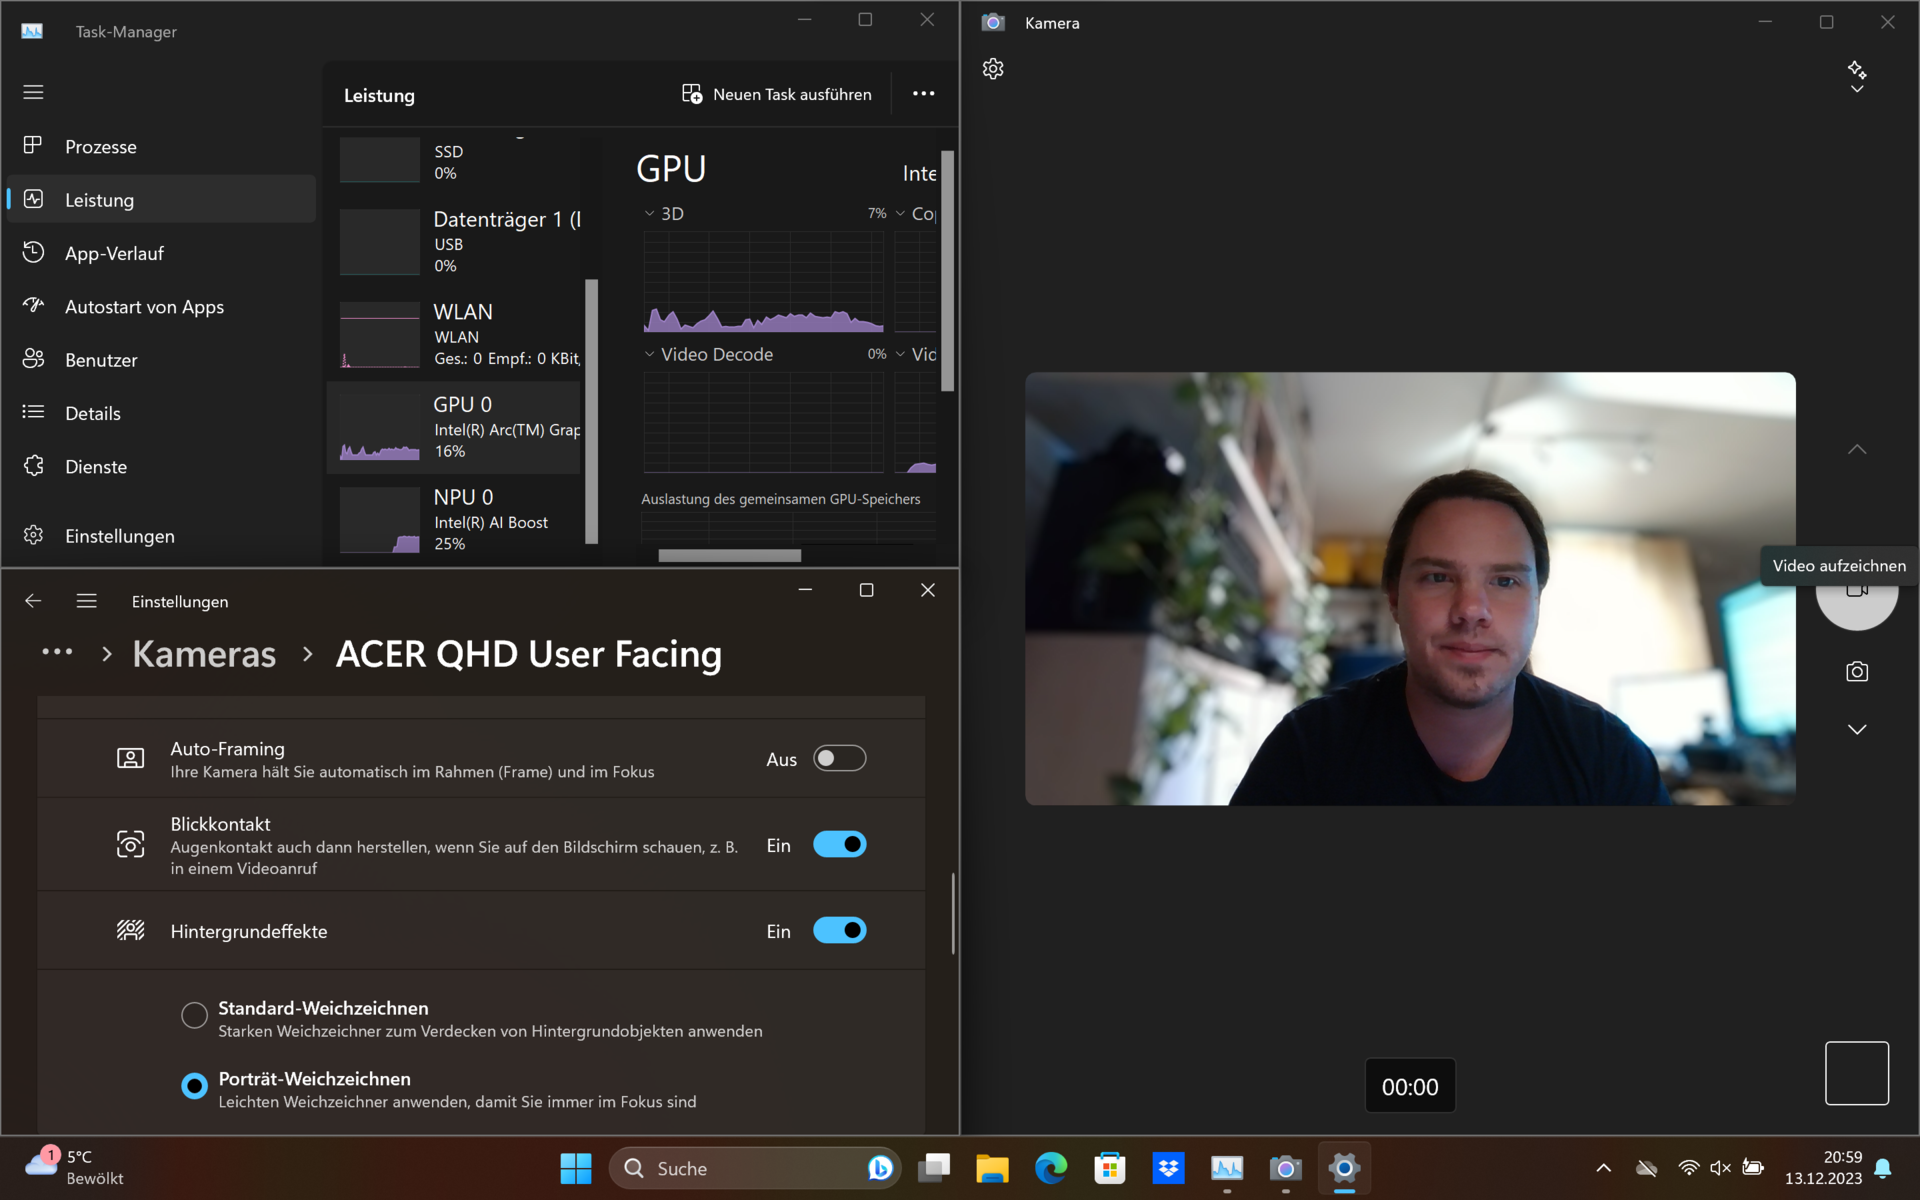
La webcam QHD dell'Acer Swift Go ha fornito risultati davvero impressionanti. La qualità dell'immagine può essere migliorata ancora di più grazie alla NPU di Intel e a Windows Studio Effects. Tuttavia, questo imposta l'iGPU e, come ci si aspetterebbe, le ventole dell'Acer Swift Go fanno sentire la loro presenza in modo rapido e rumoroso.


Sicurezza
Sono presenti un sensore di impronte digitali, uno slot Kensington Lock e un TPM 2.0. Ciò significa che sono soddisfatti tutti i requisiti di sicurezza di base per quanto riguarda il furto fisico e la protezione degli accessi.
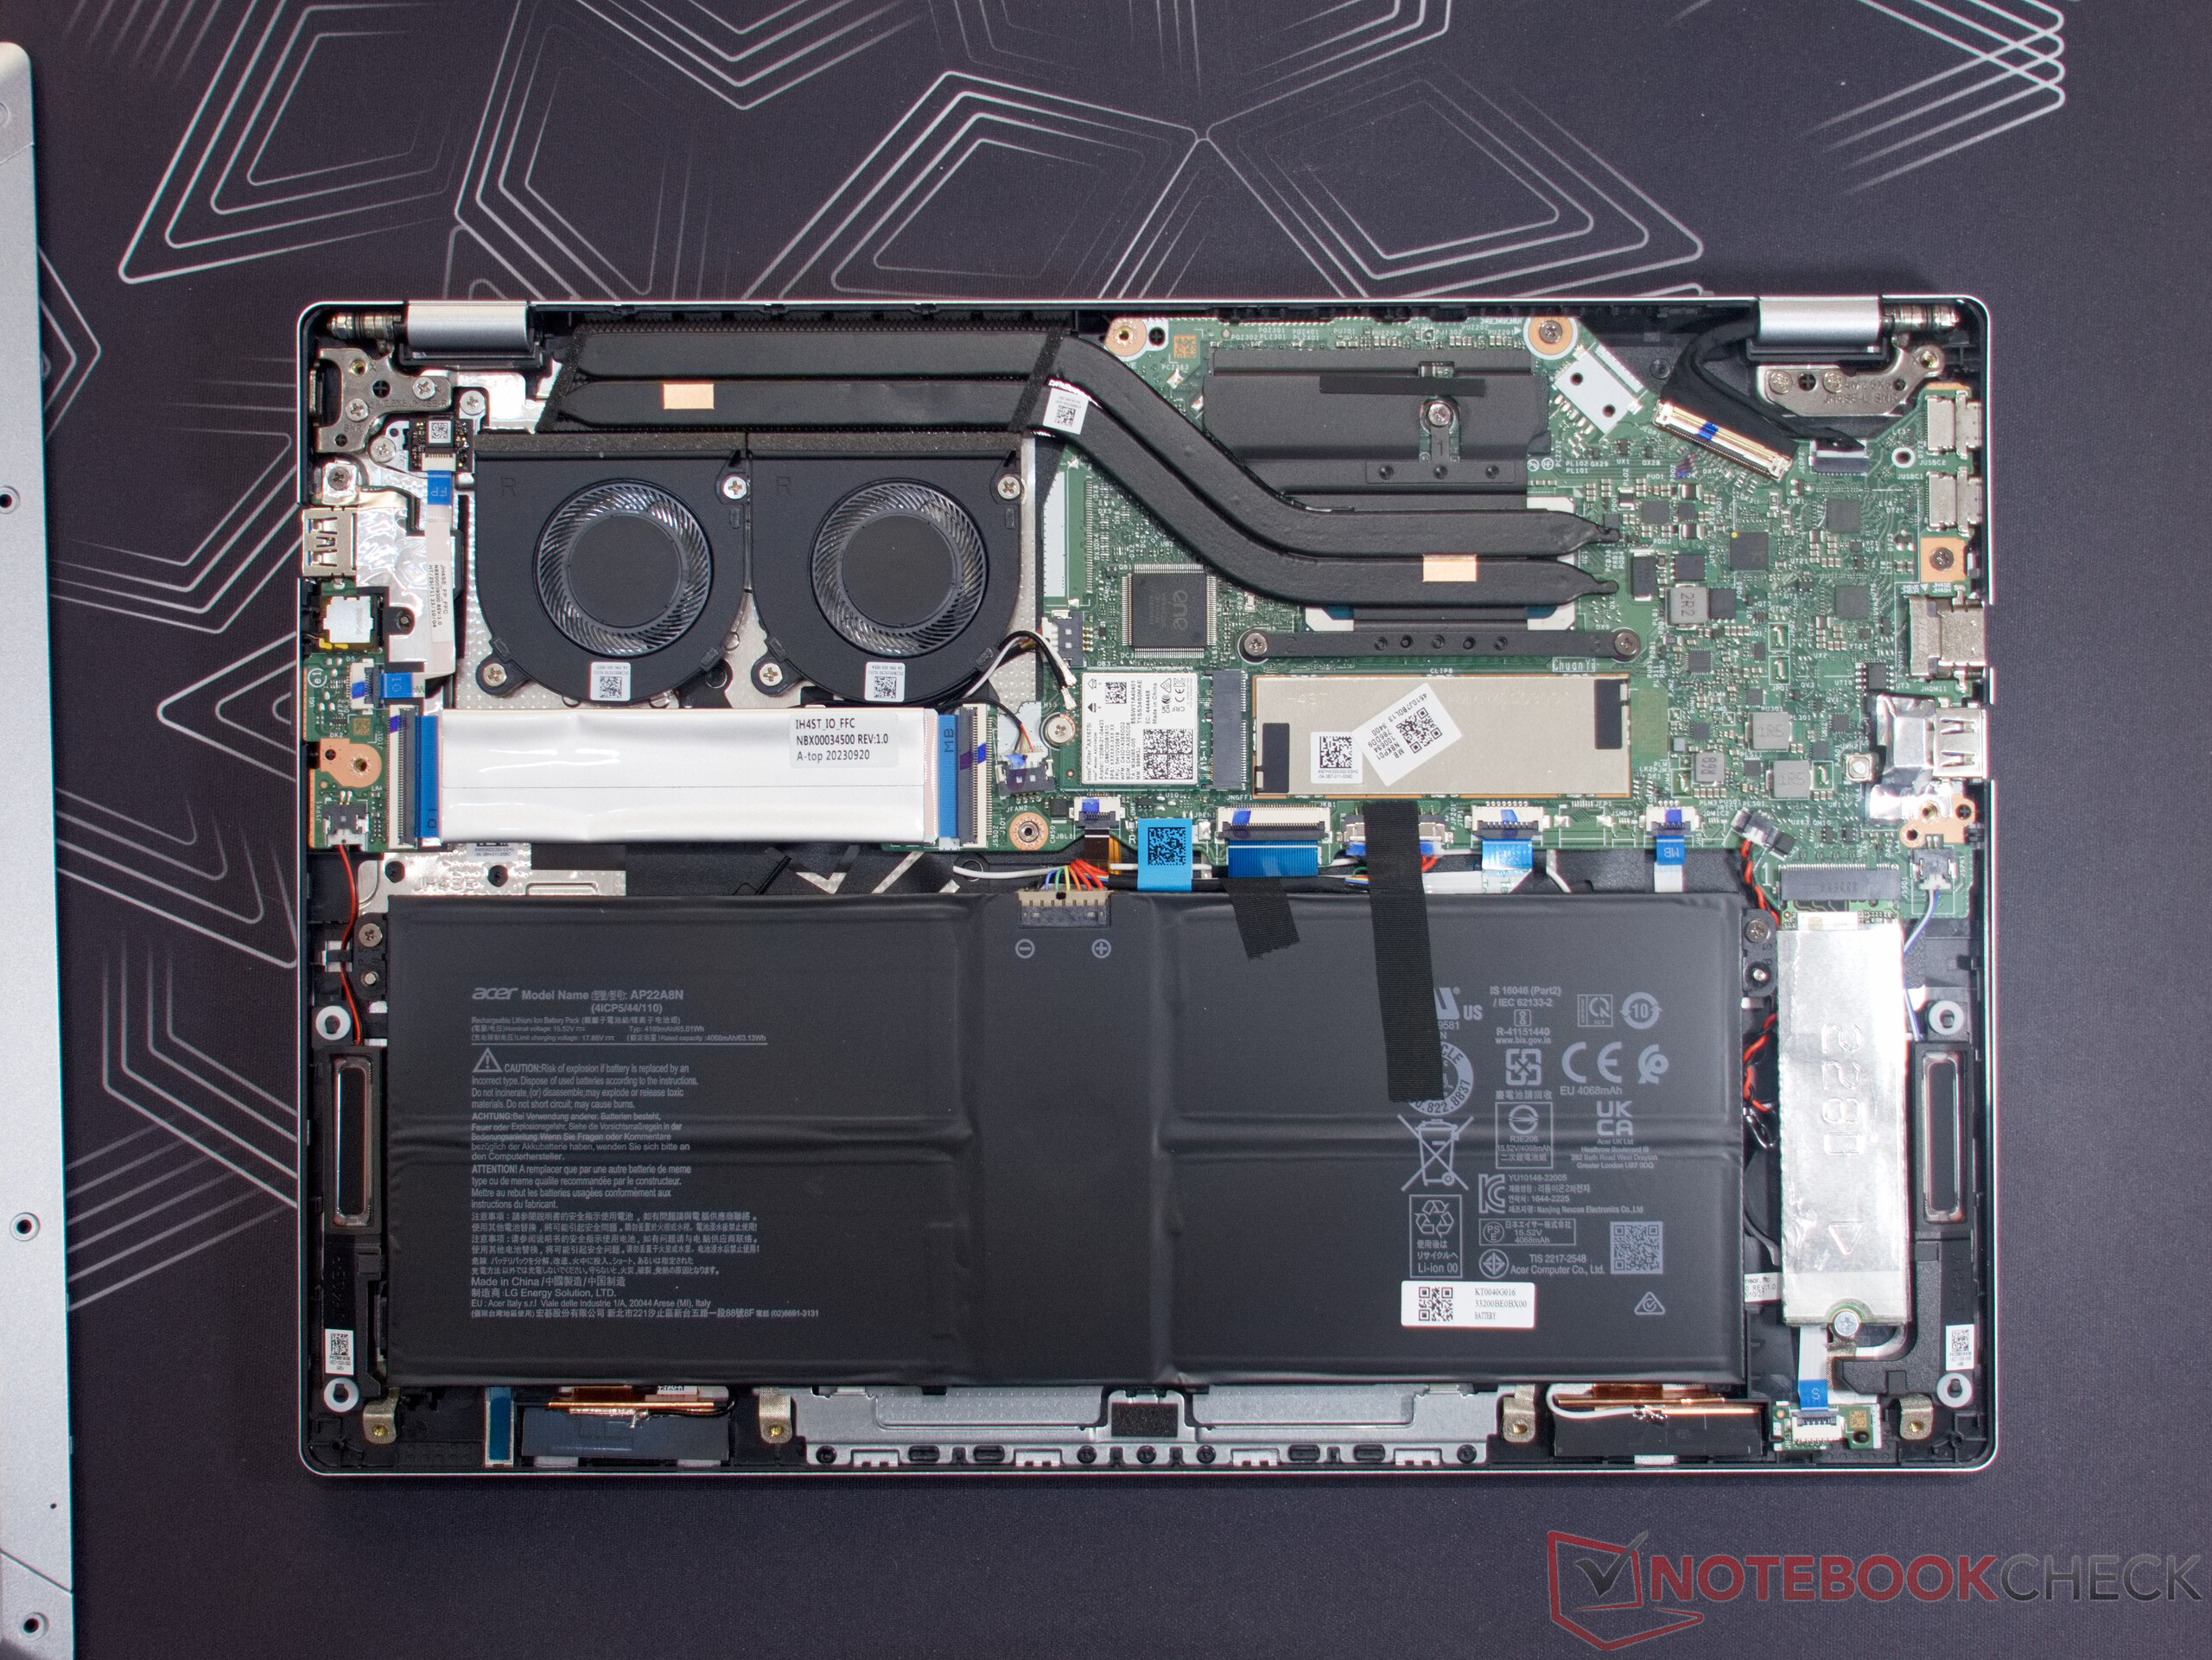
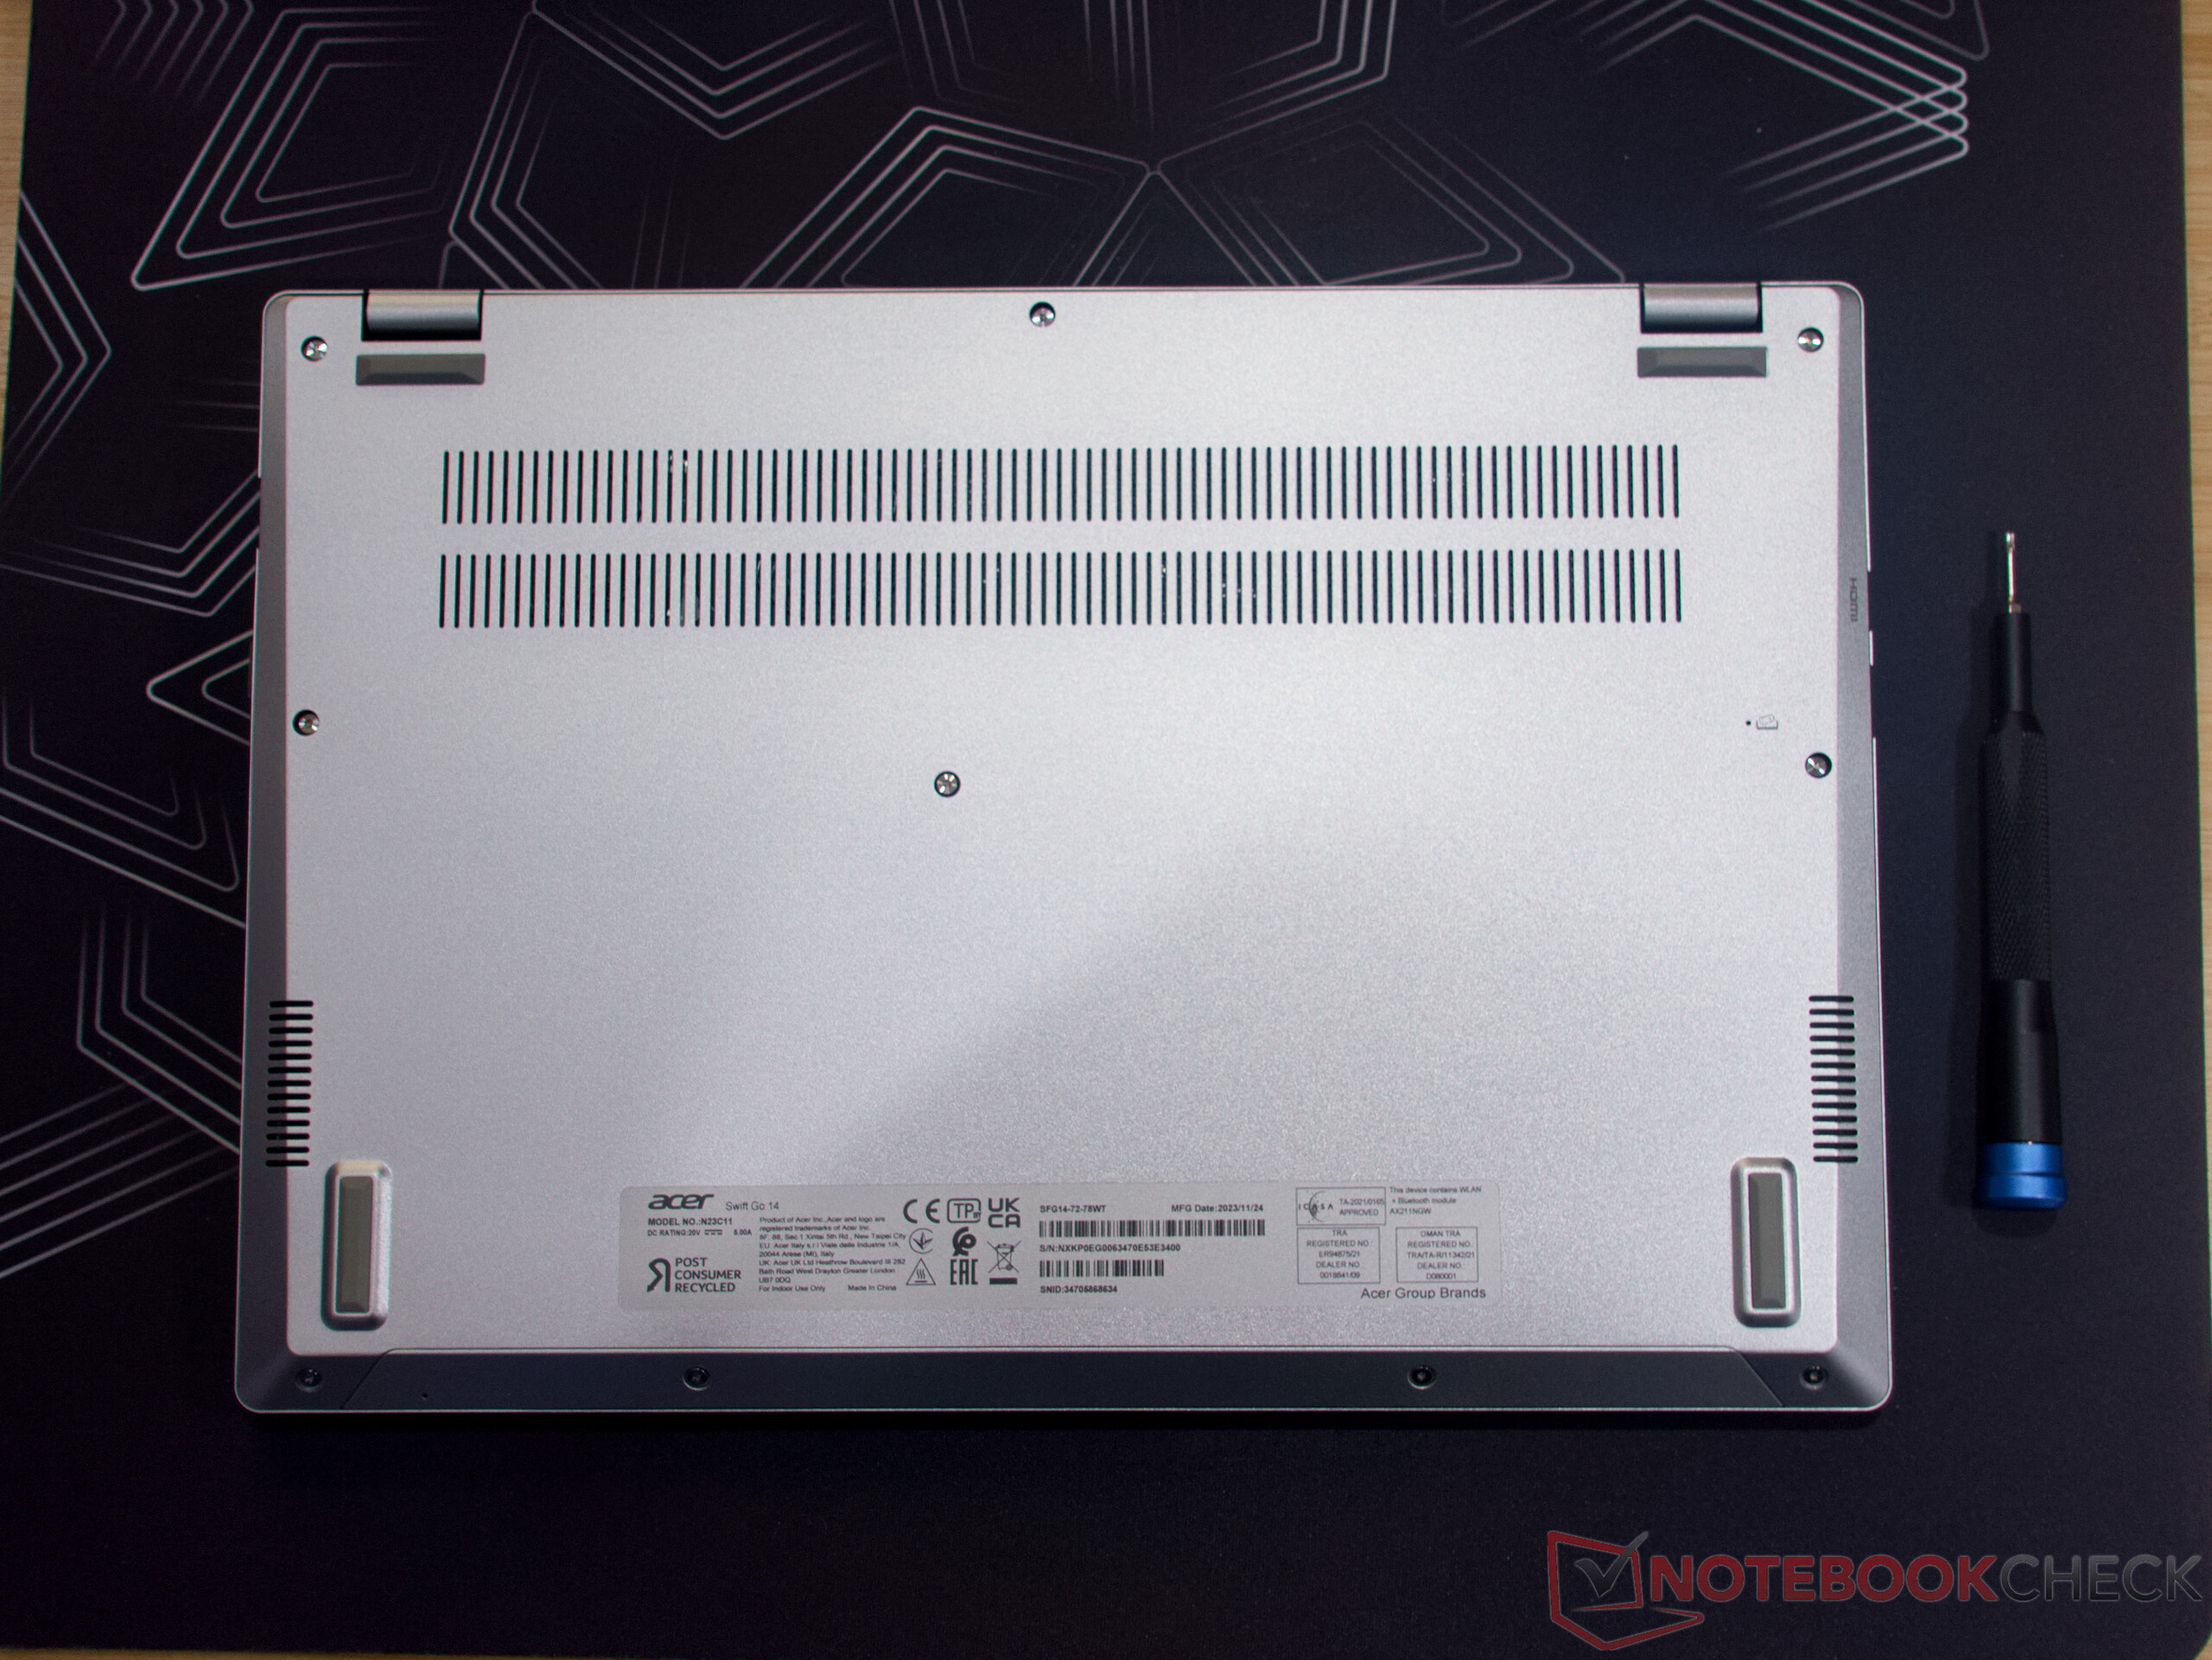
Manutenzione
Abbiamo richiesto un cacciavite TX5 e una ventosa per aprire l'Acer Swift Go. Proprio come con il predecessoreall'interno del portatile si trovano molte opzioni di manutenzione. Sono disponibili due slot M.2 (uno occupato) e un modulo Wi-Fi installato. Le ventole possono essere facilmente rimosse per la pulizia. Solo la RAM da 32 GB, di dimensioni generose, è saldata. Tra l'altro, lo slot M.2 libero si trova sotto il cavo a nastro accanto alle ventole.
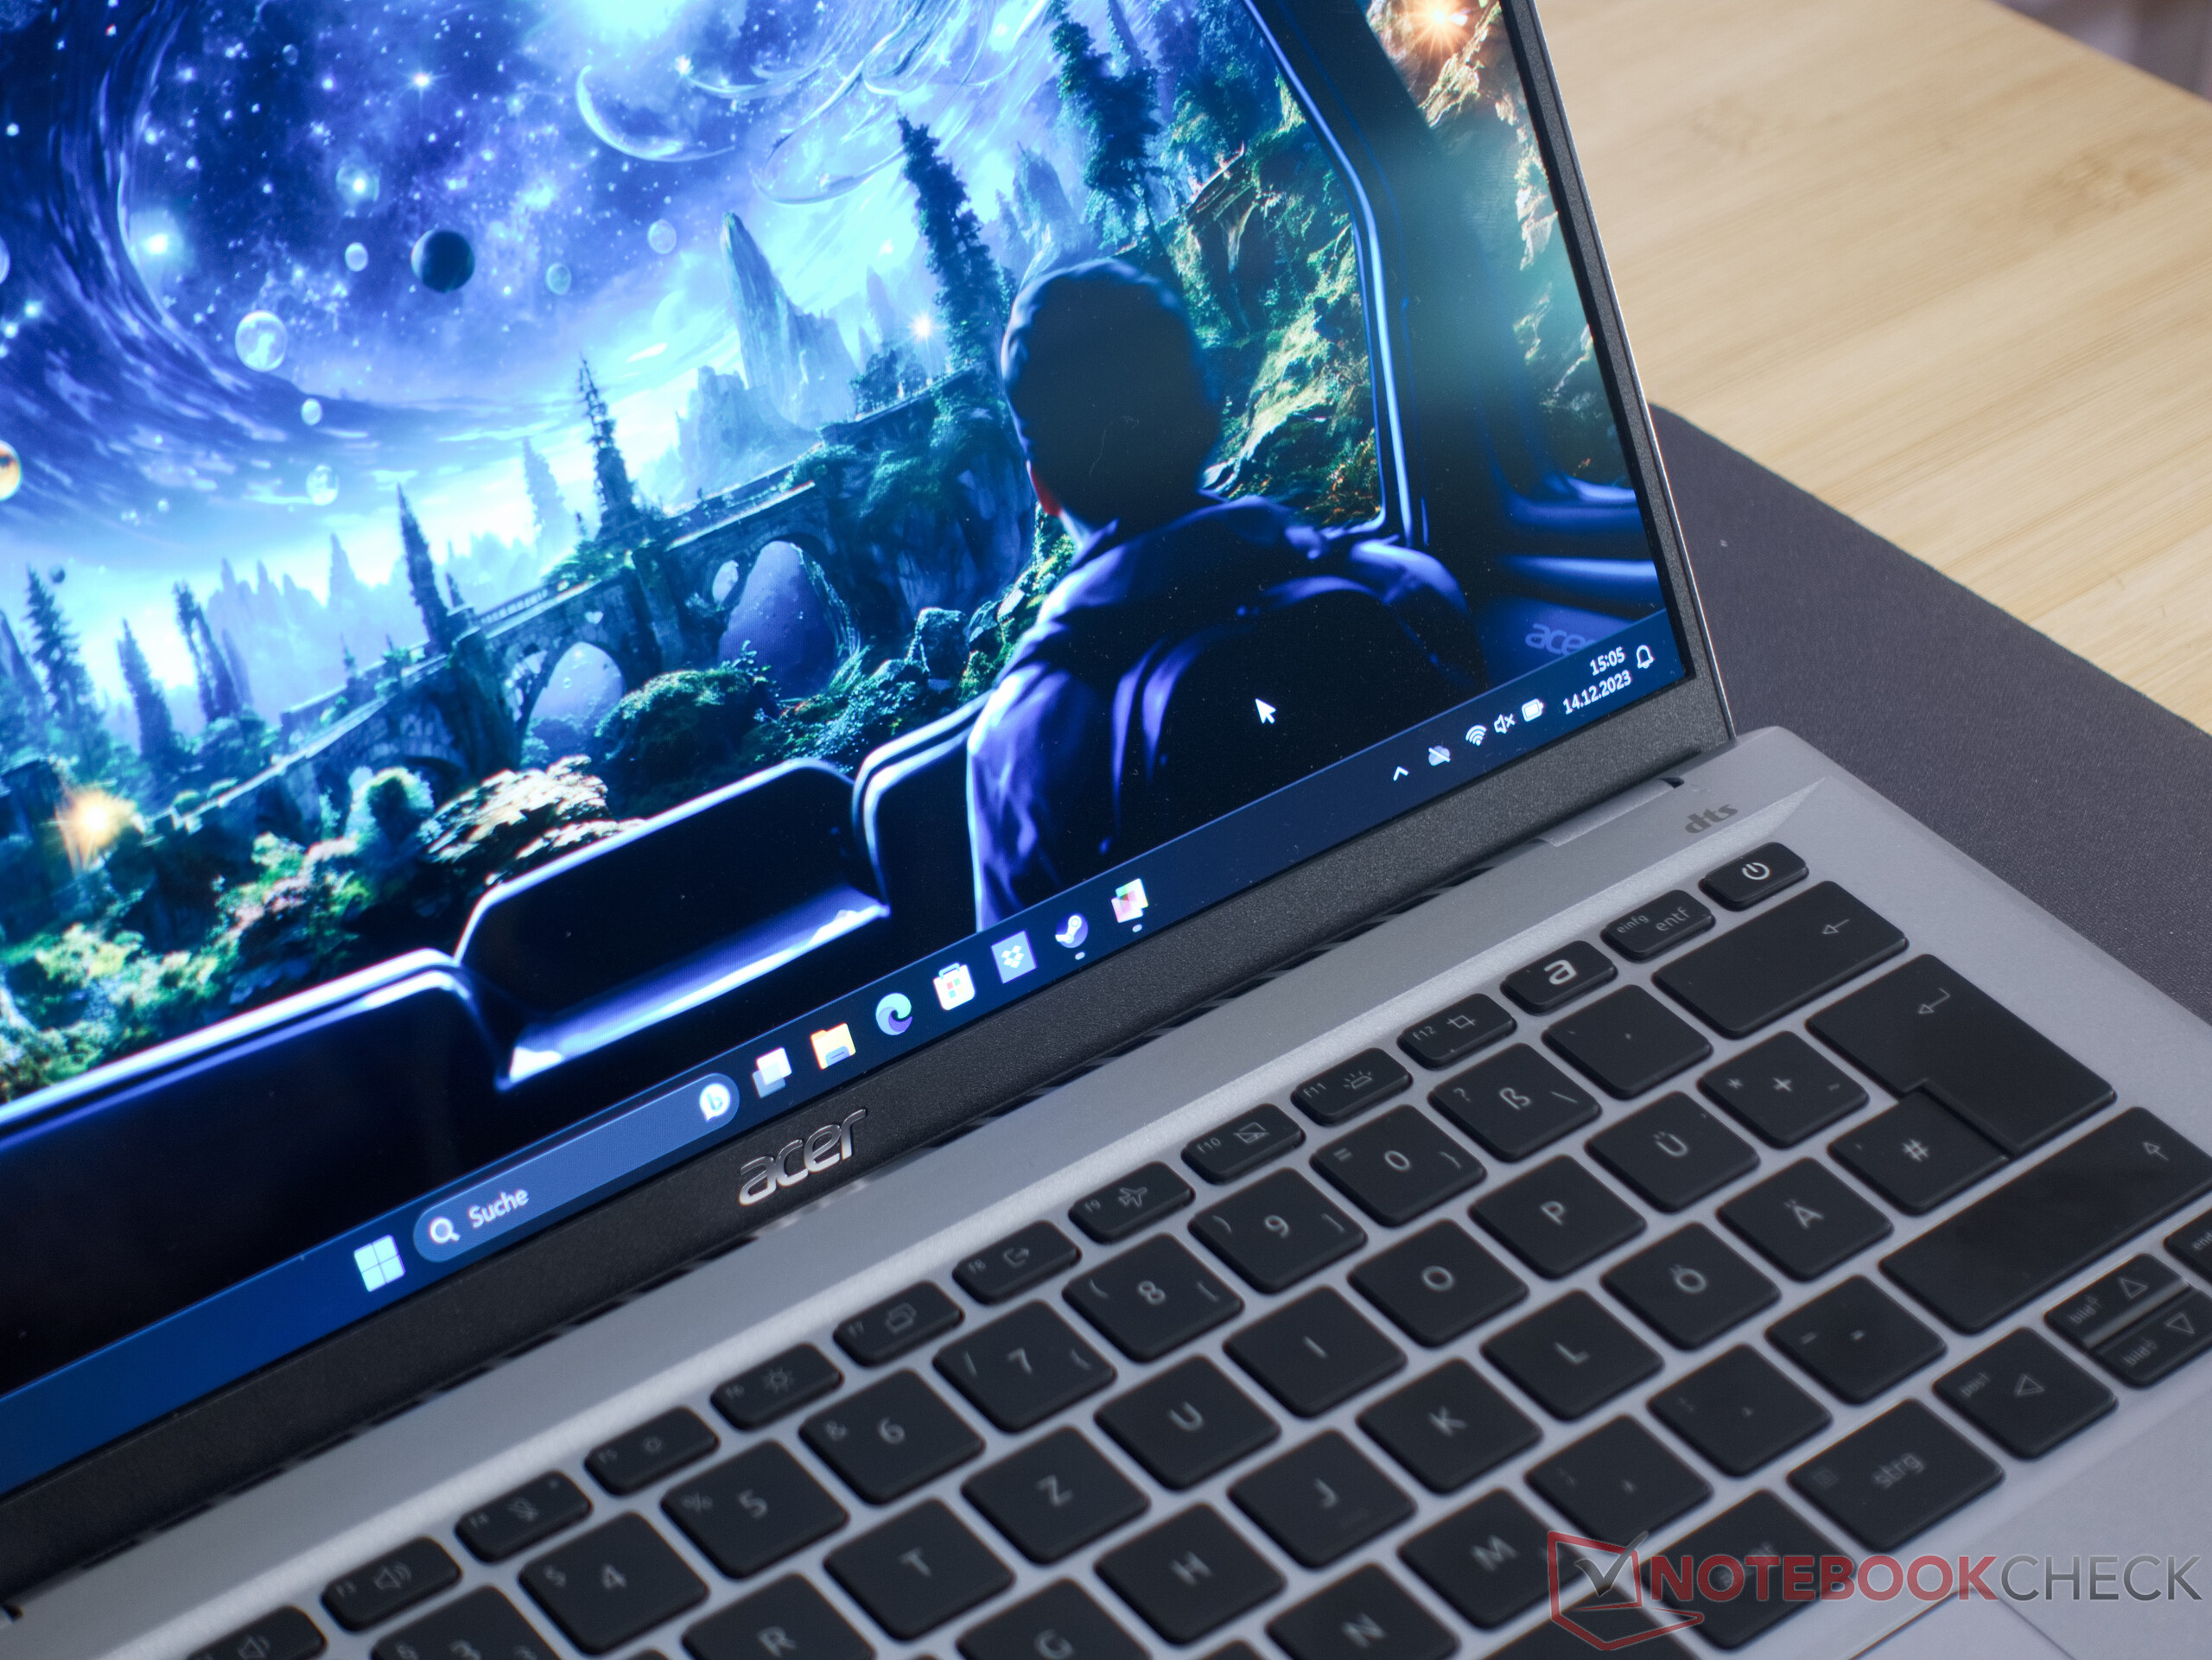
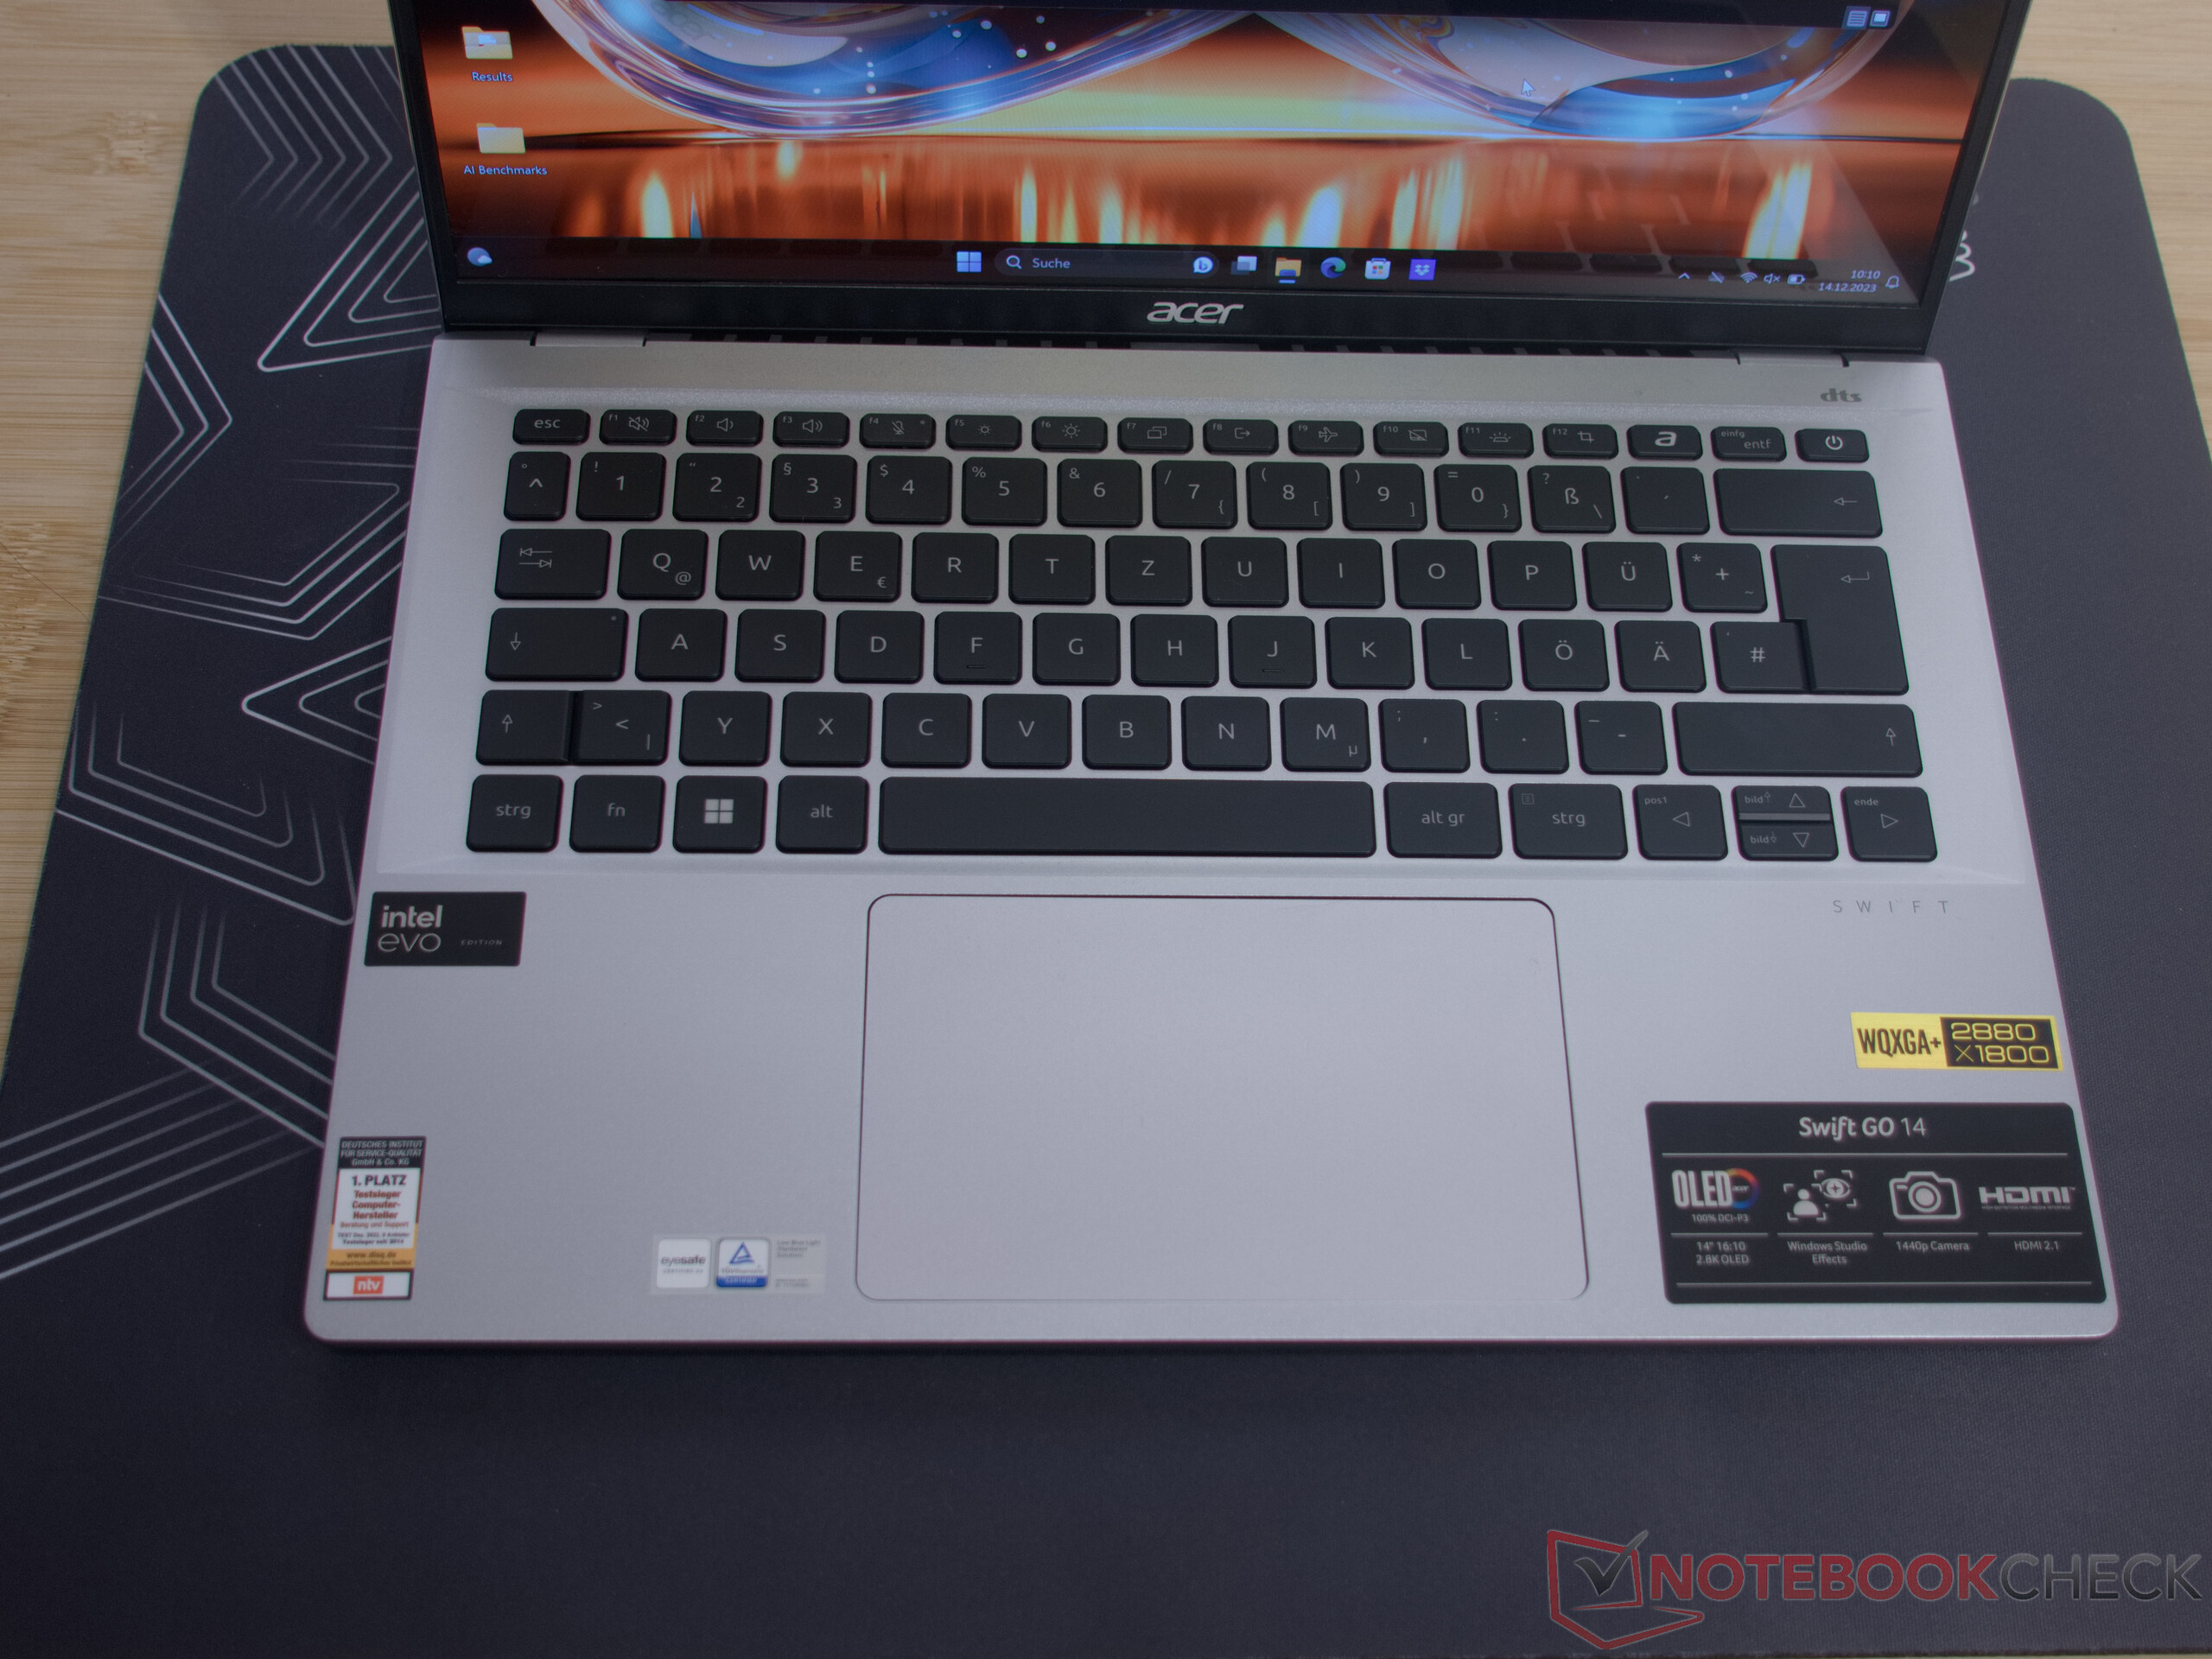
Dispositivi di input - Un grande touchpad
Tastiera
Soprattutto, il punto di pressione dei tasti retroilluminati potrebbe essere un po' più nitido. Per il resto, la tastiera offre una piacevole esperienza di digitazione. In ambienti bui, la retroilluminazione dei tasti può essere regolata su due livelli. Come il predecessore, anche il guscio superiore può essere leggermente piegato e questo potrebbe irritare alcuni utenti quando si premono con forza i tasti.
Touchpad
Nella nuova versione, Acer ha aumentato significativamente le dimensioni del touchpad di Swift Go 14, ma i raggi negli angoli sono rimasti. Questo cambiamento non si limita all'aspetto estetico. In pratica, molte operazioni come il drag and drop e la copia sono più facili da eseguire. Ora 12 x 8 cm, il clickpad offre molto più spazio per gli input e il controllo dei gesti.
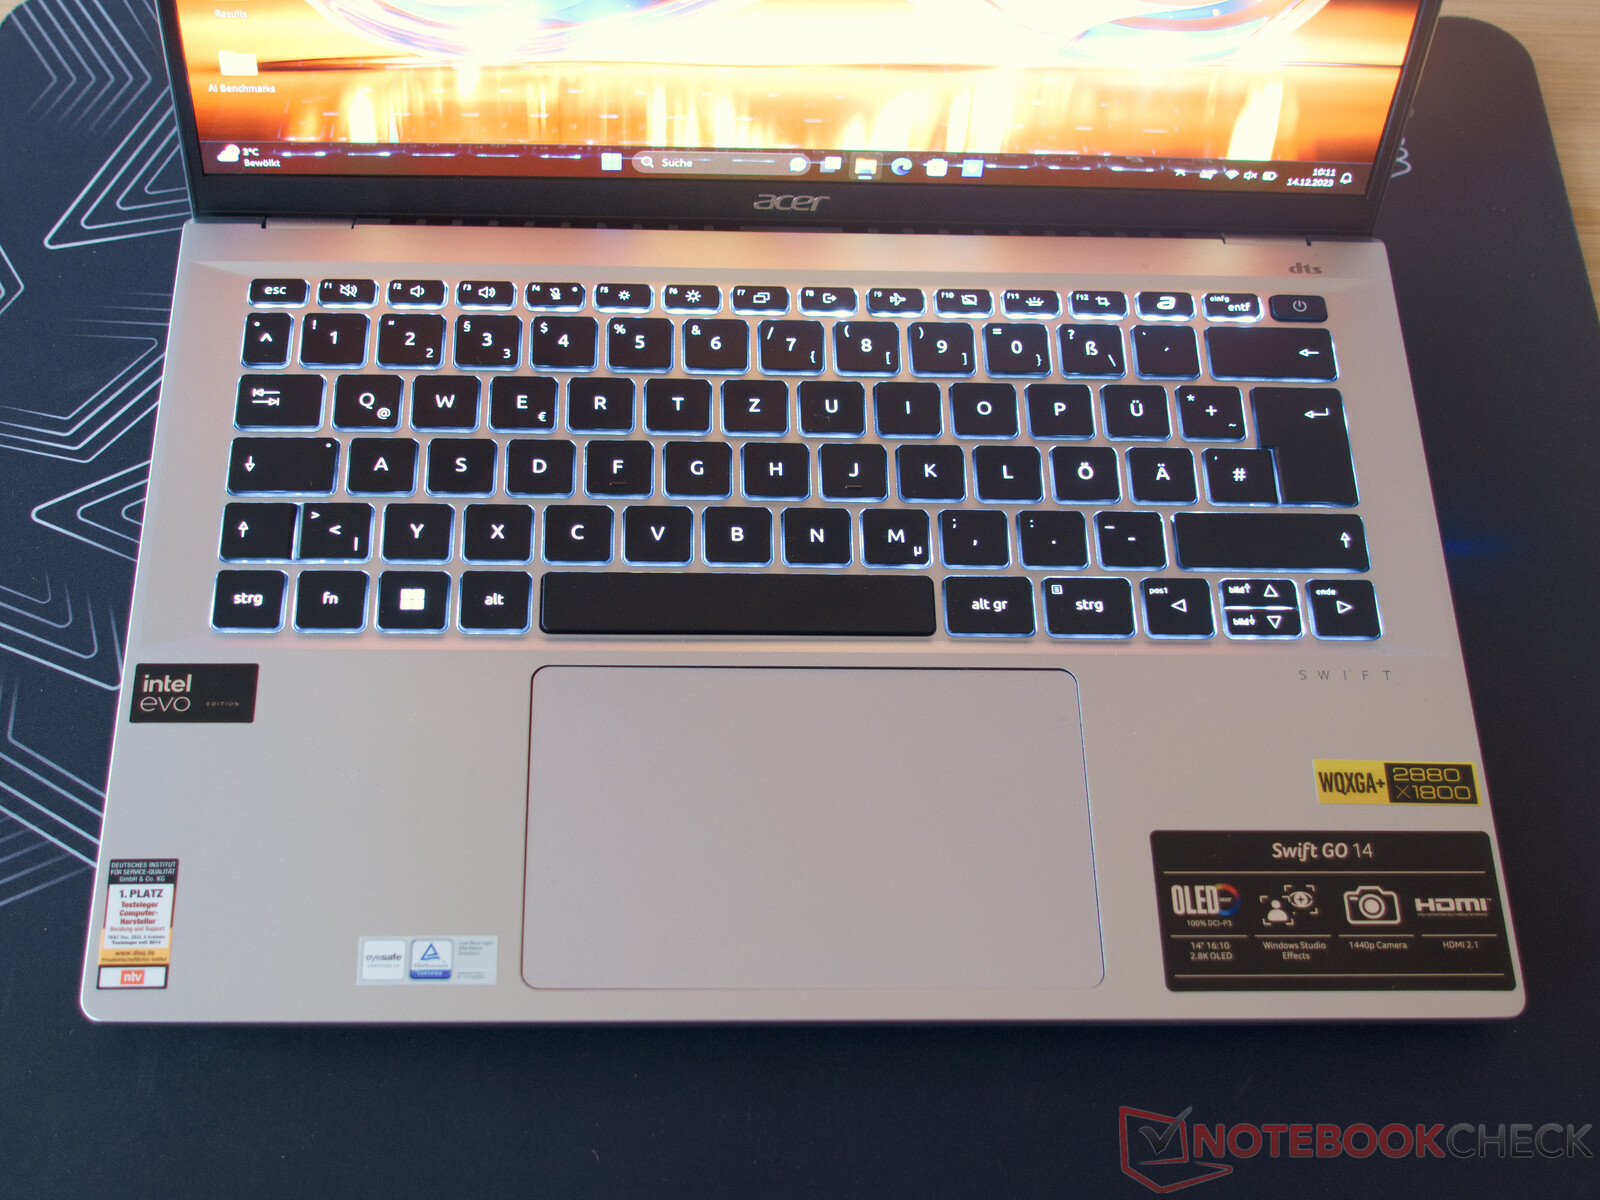
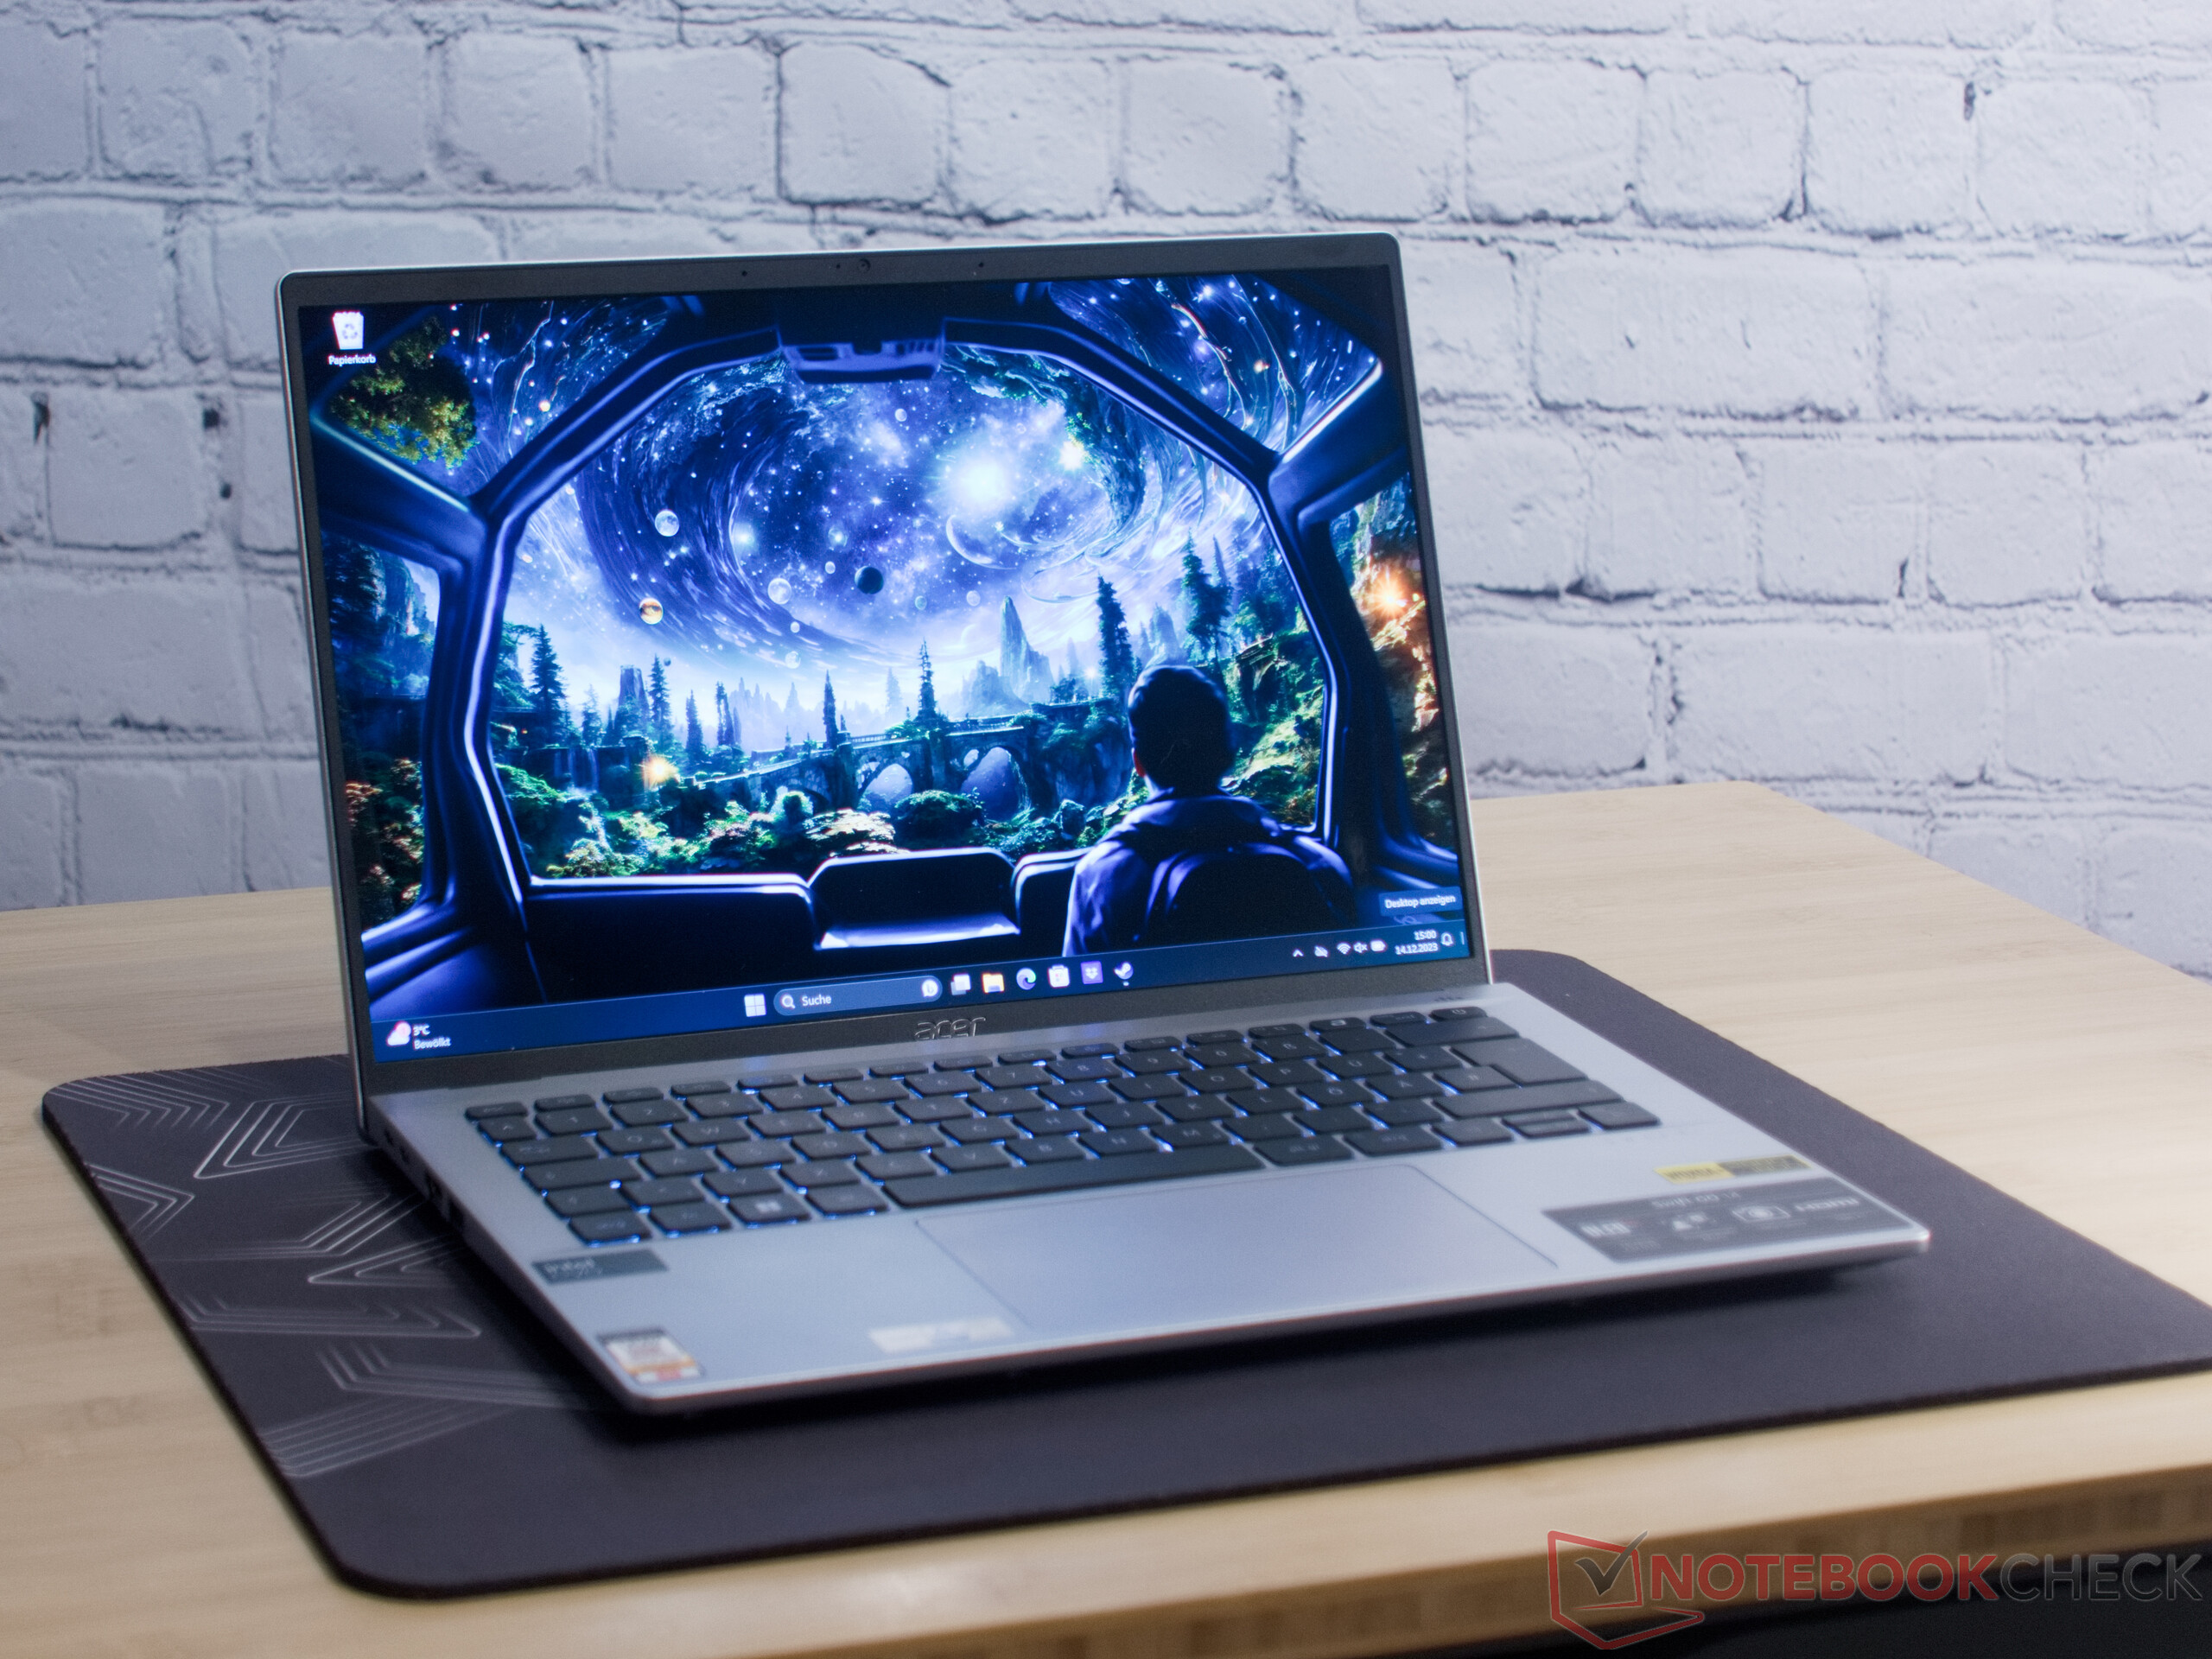
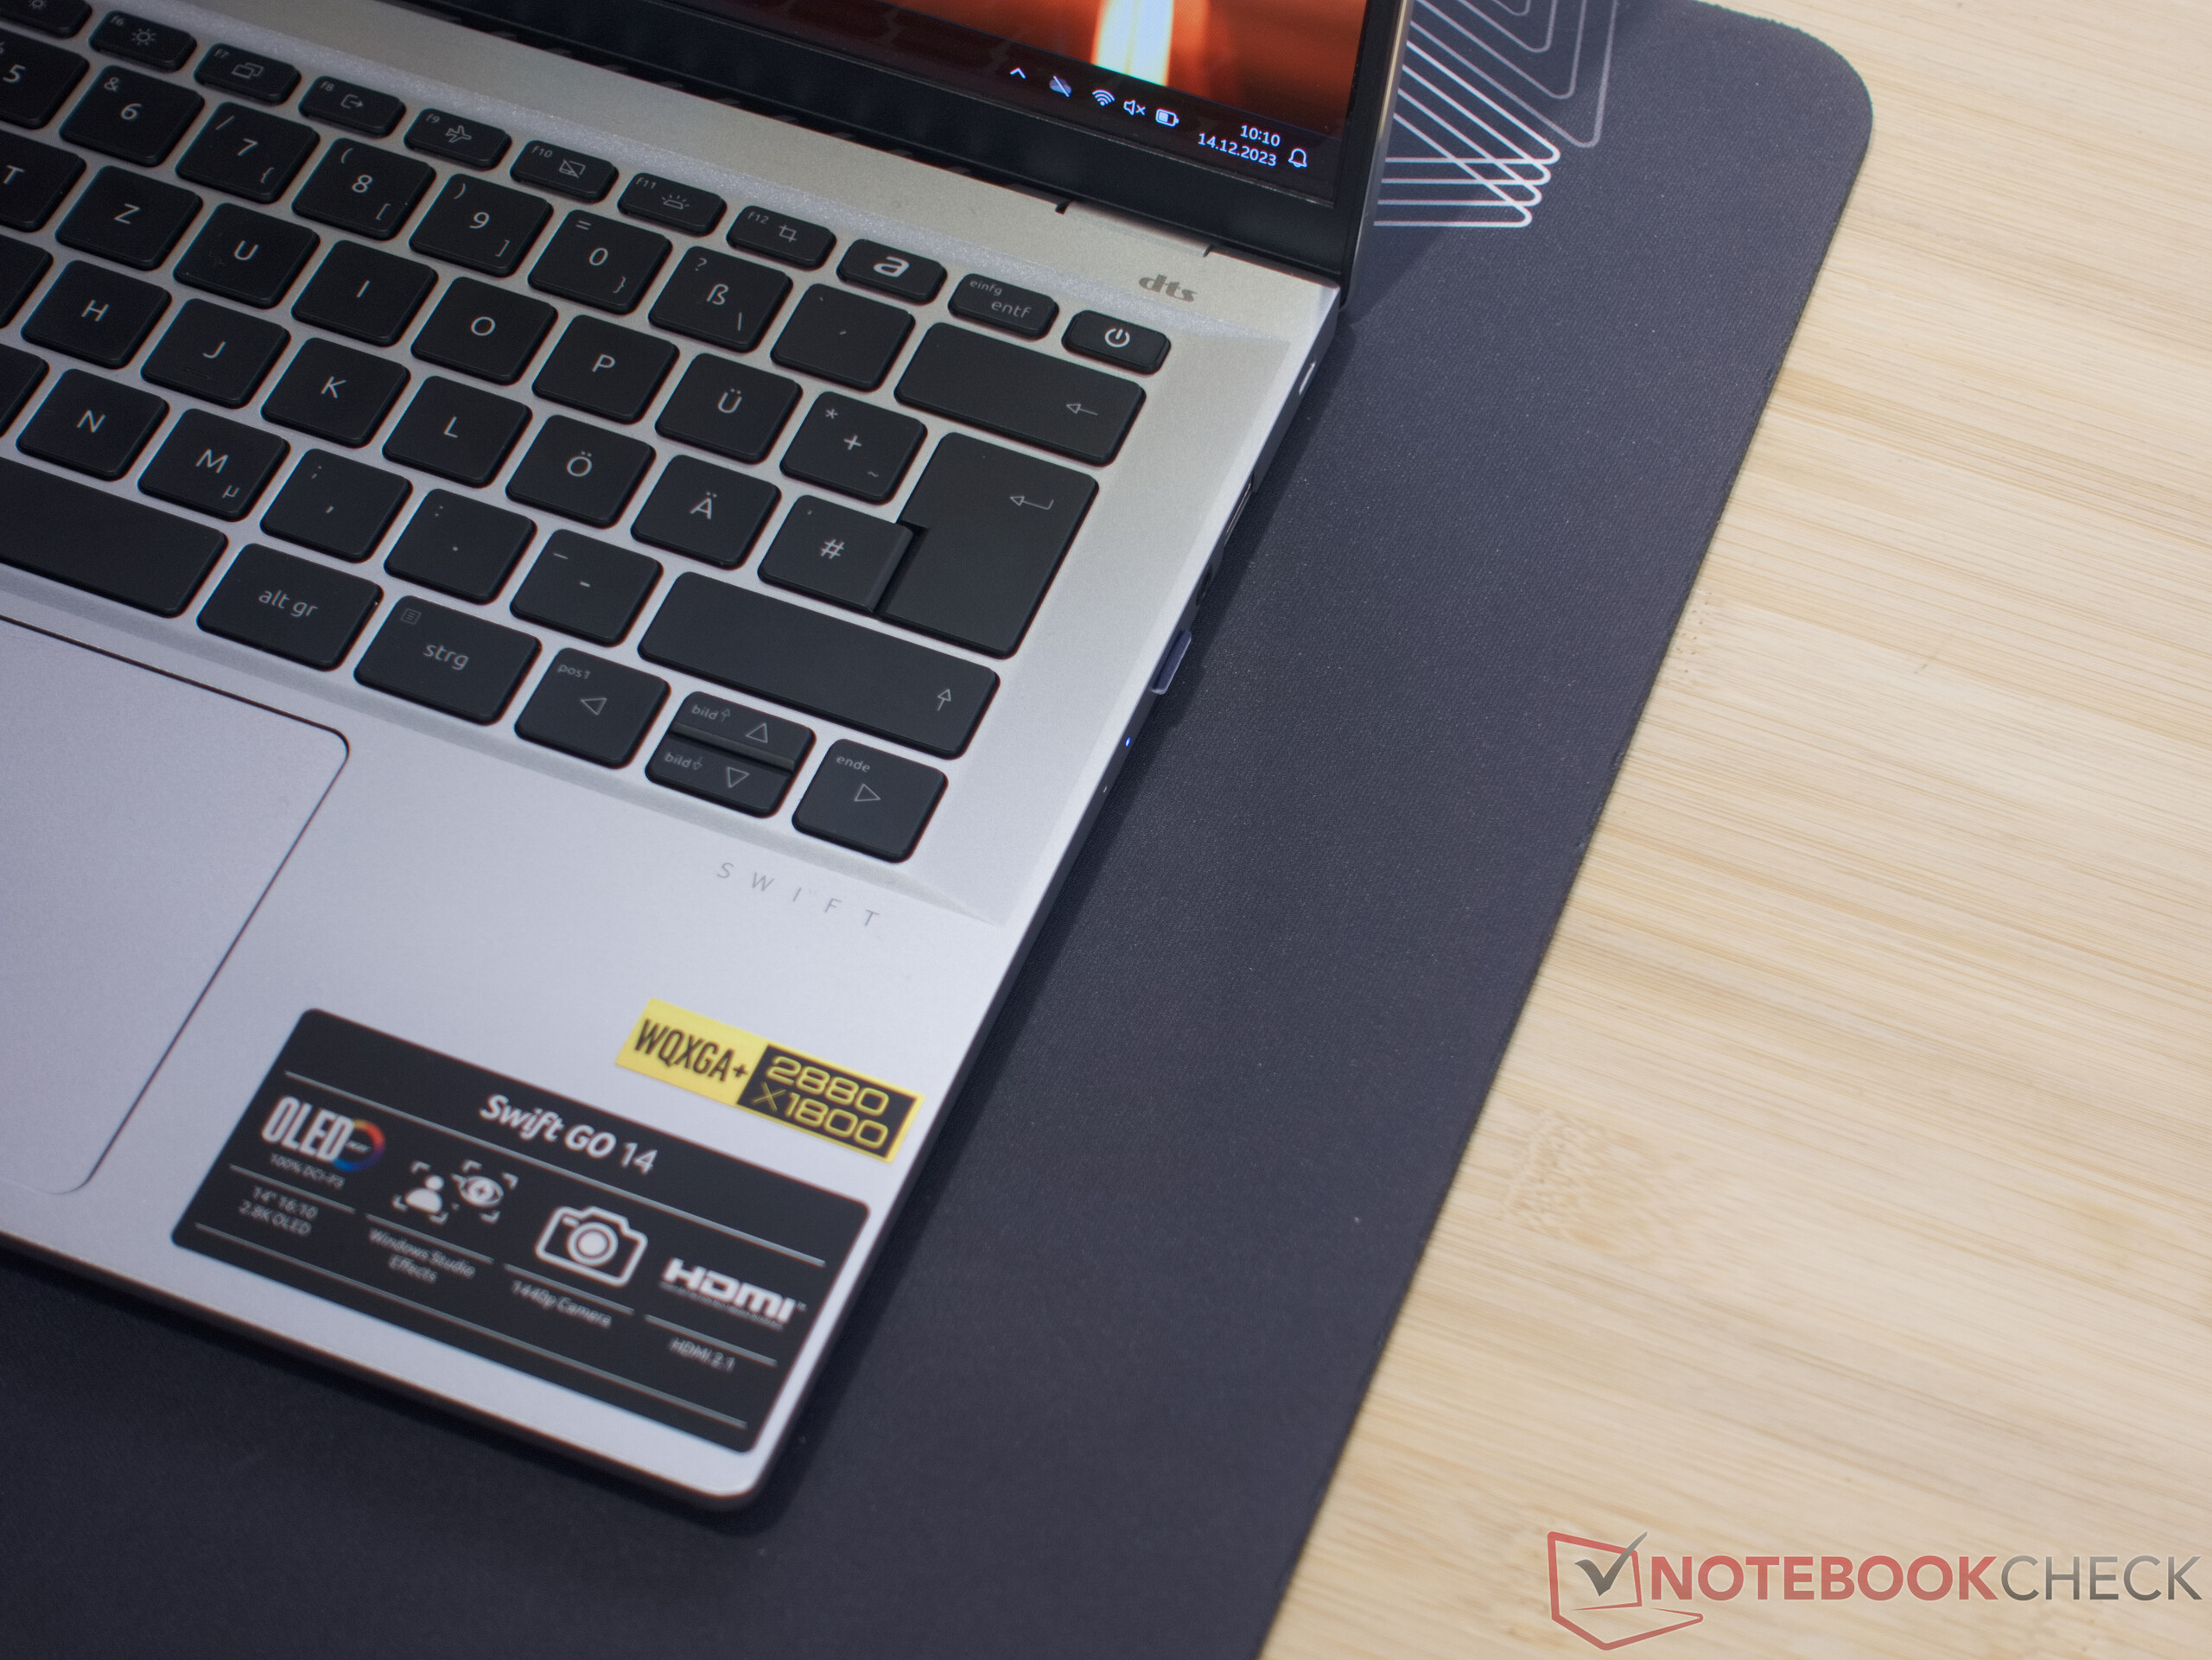
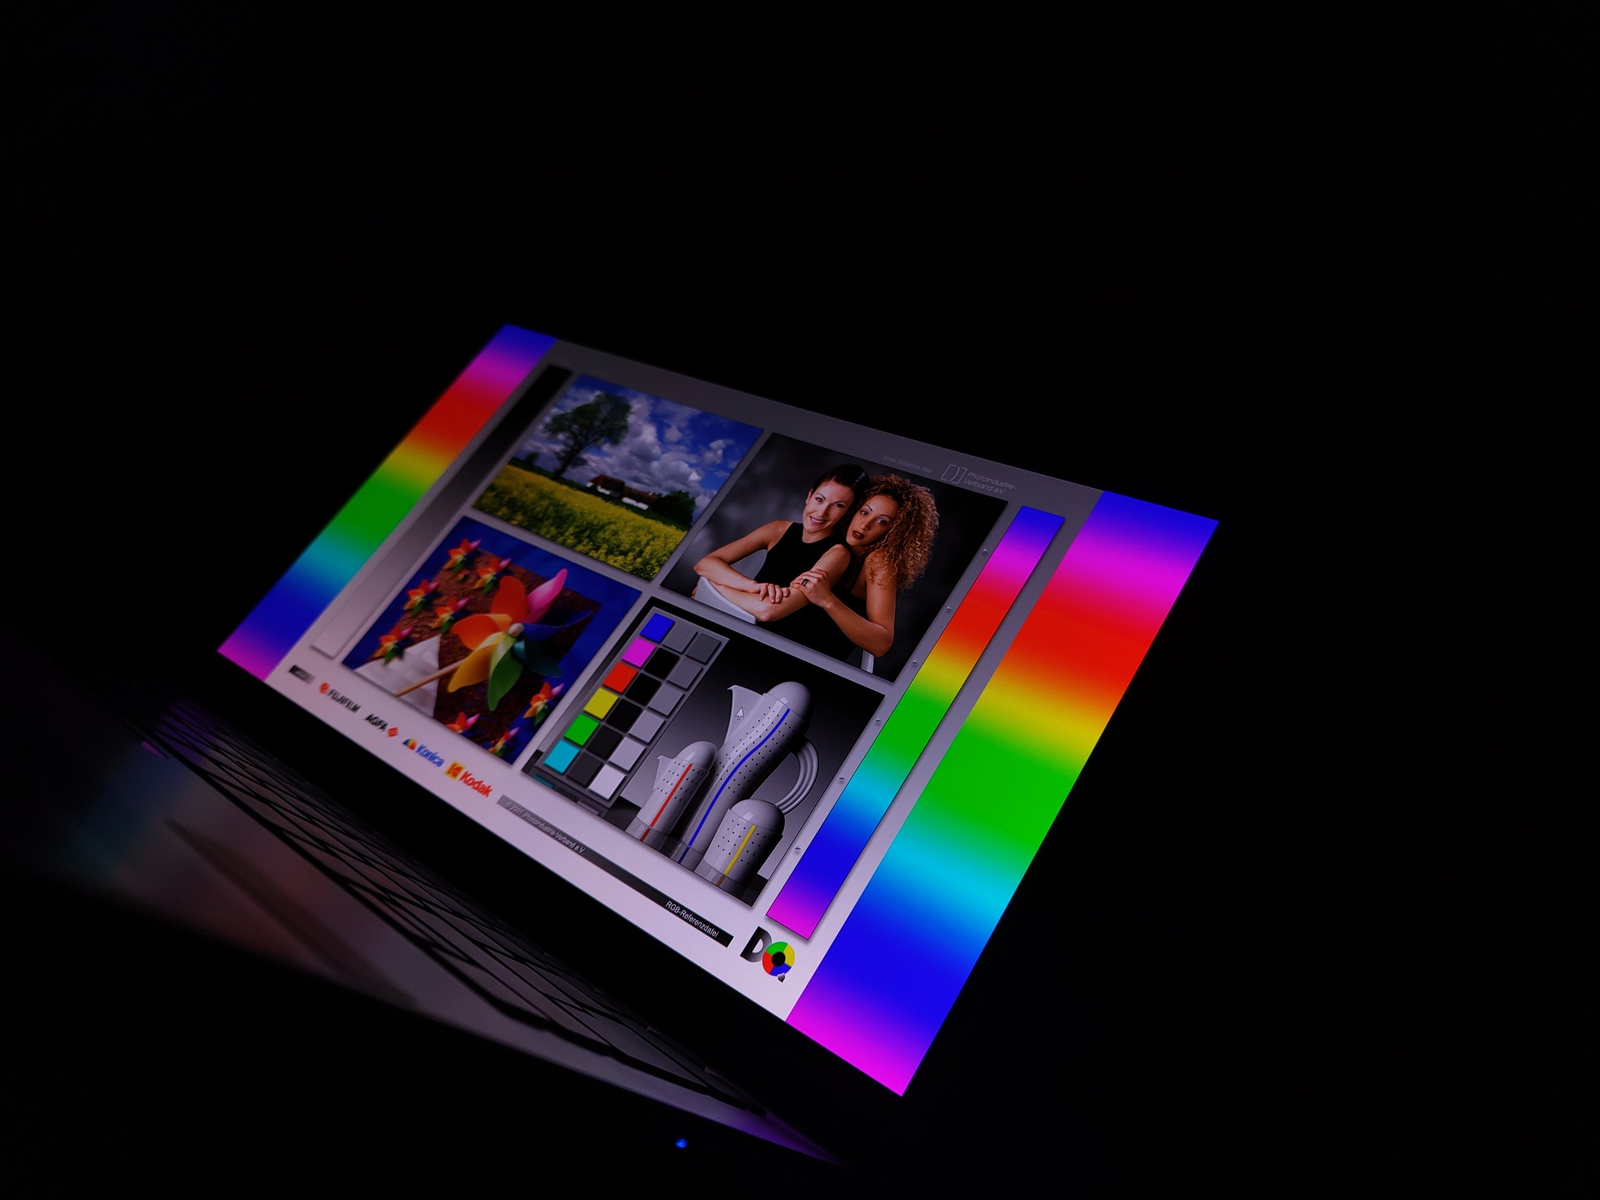
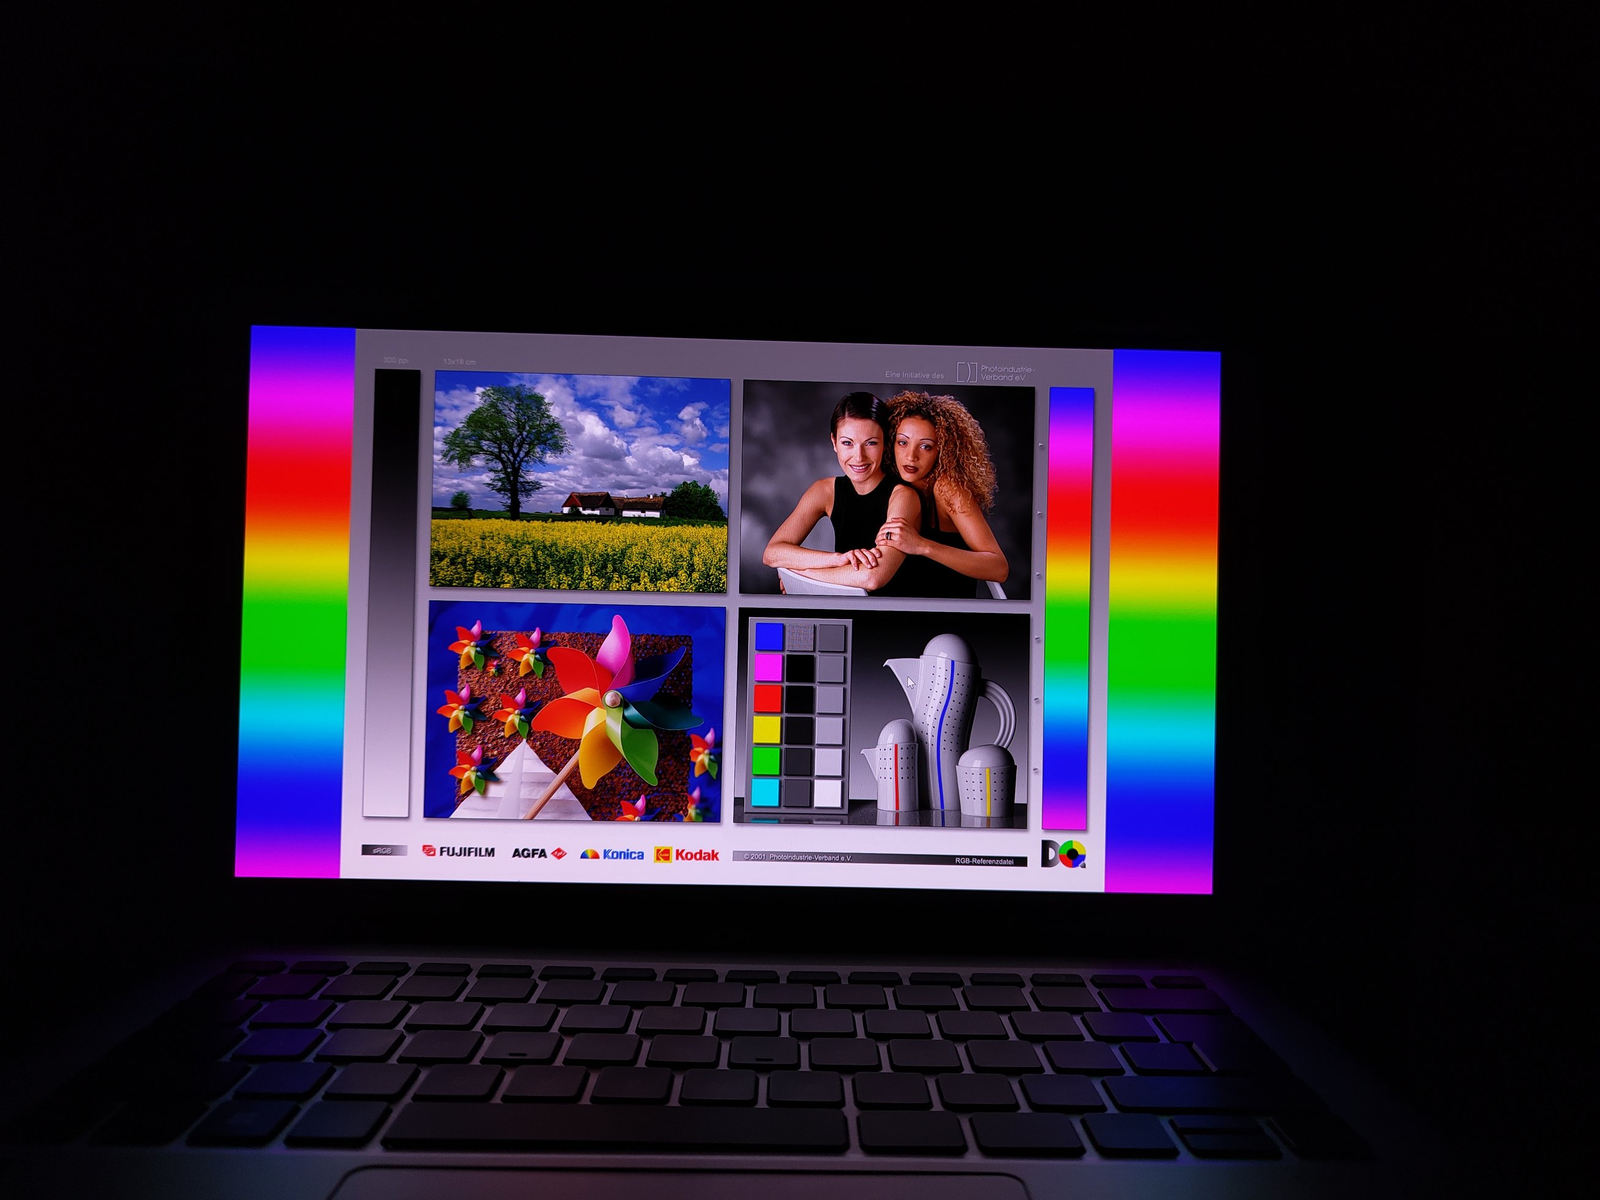
Display - OLED da 2,8K, 90Hz e HDR500
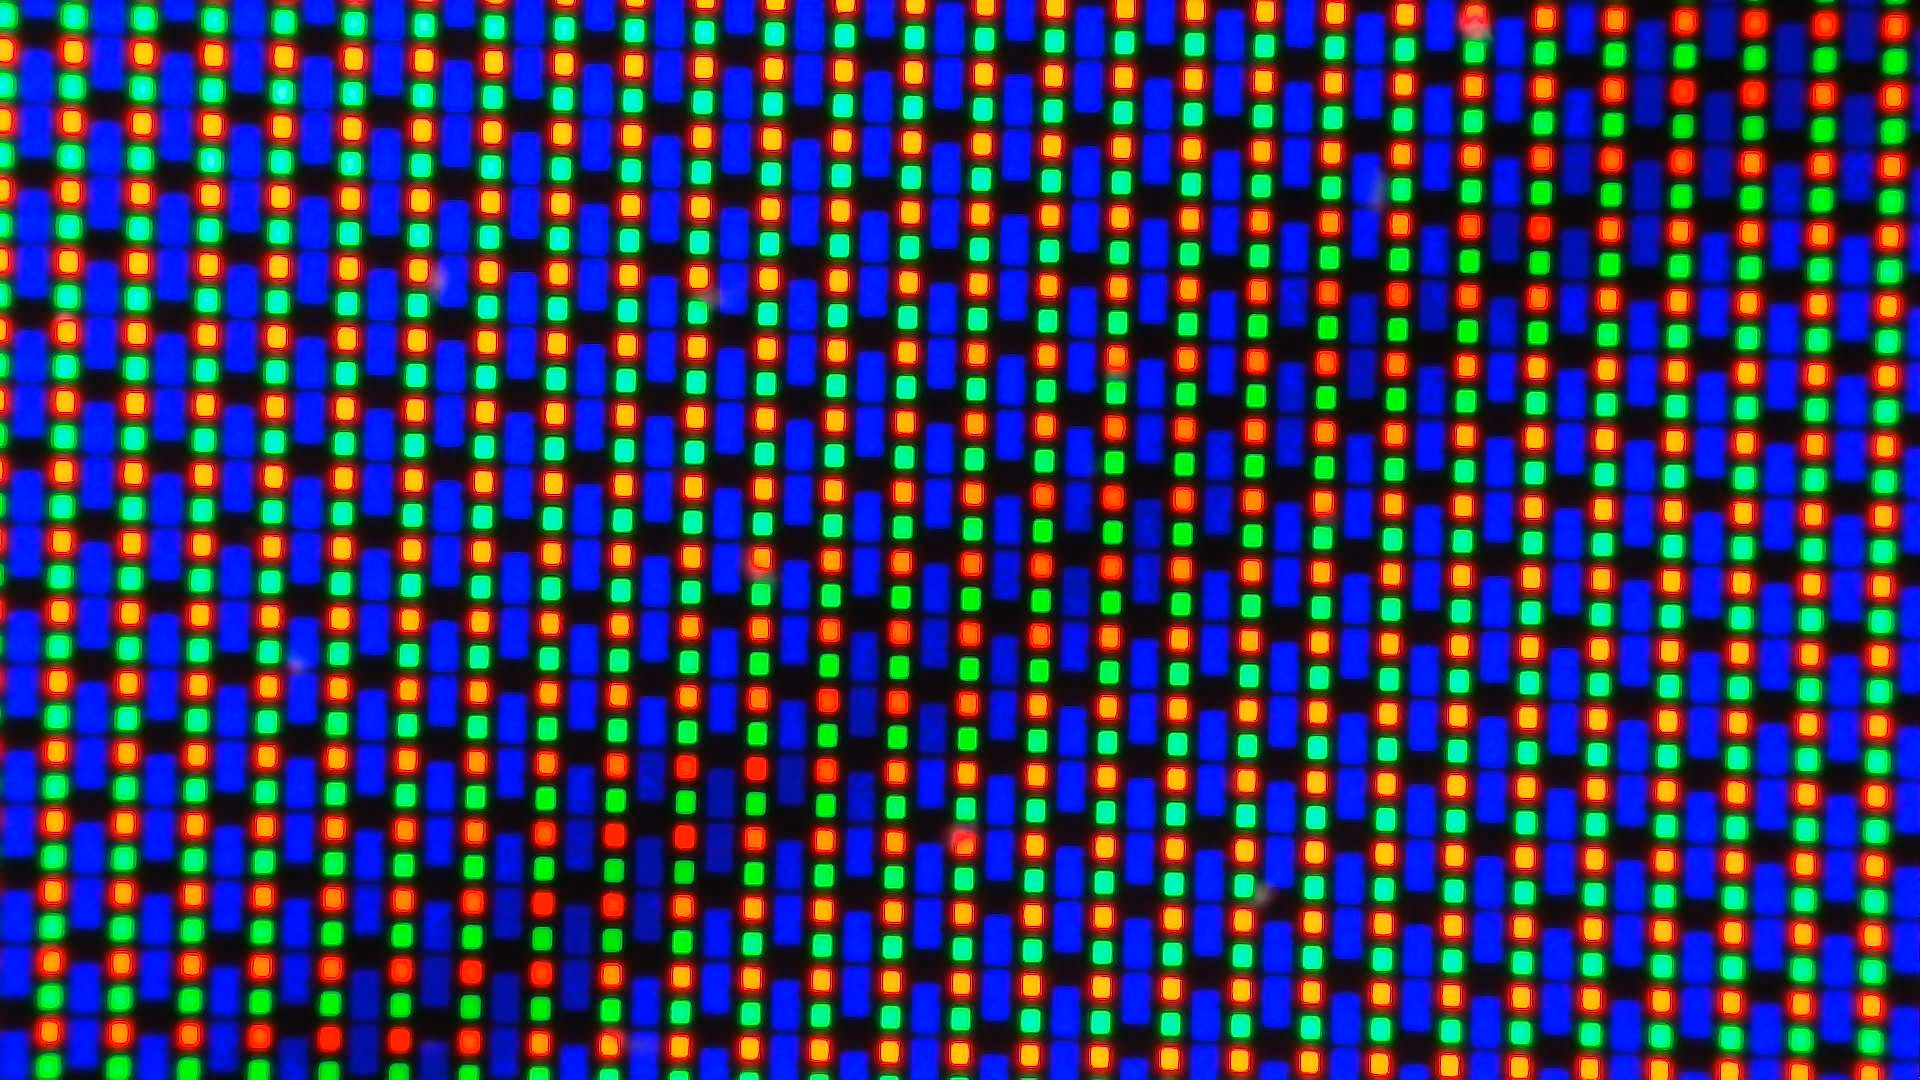
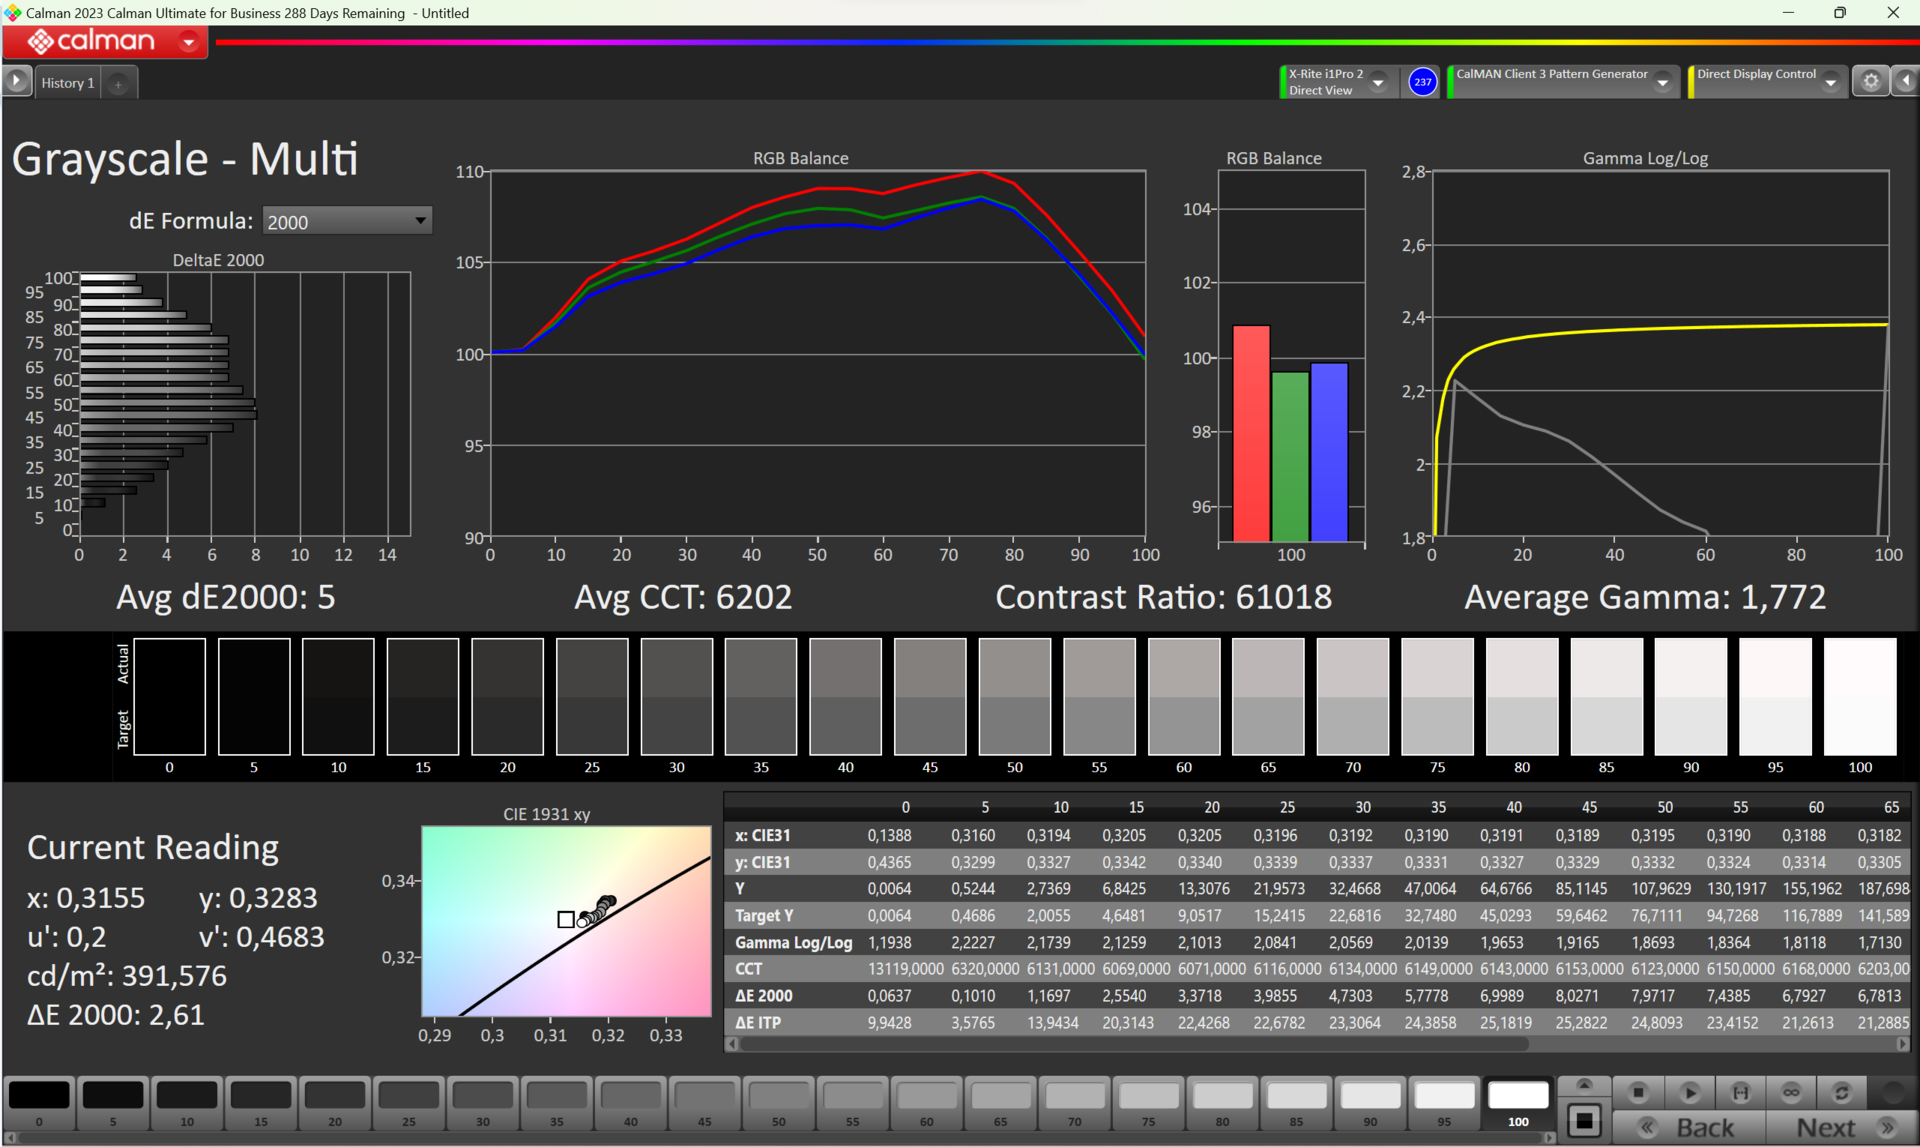
Il modello Acer Swift Go con processore Meteor Lake ospita ora un pannello OLED molto più luminoso. Può raggiungere i 400 cd/m², e anche di più, quando si visualizzano contenuti HDR. I neri profondi e gli alti livelli di contrasto sono standard per questo tipo di tecnologia di visualizzazione. La luminosità è uniforme e con una risoluzione di 2,8K, in un formato 16:10 da 14 pollici (circa 36 cm), è difficile vedere i singoli pixel a occhio nudo. Tutto questo ci garantisce una qualità d'immagine meravigliosa, in grado di brillare sia all'aperto che sotto le luci dello studio.
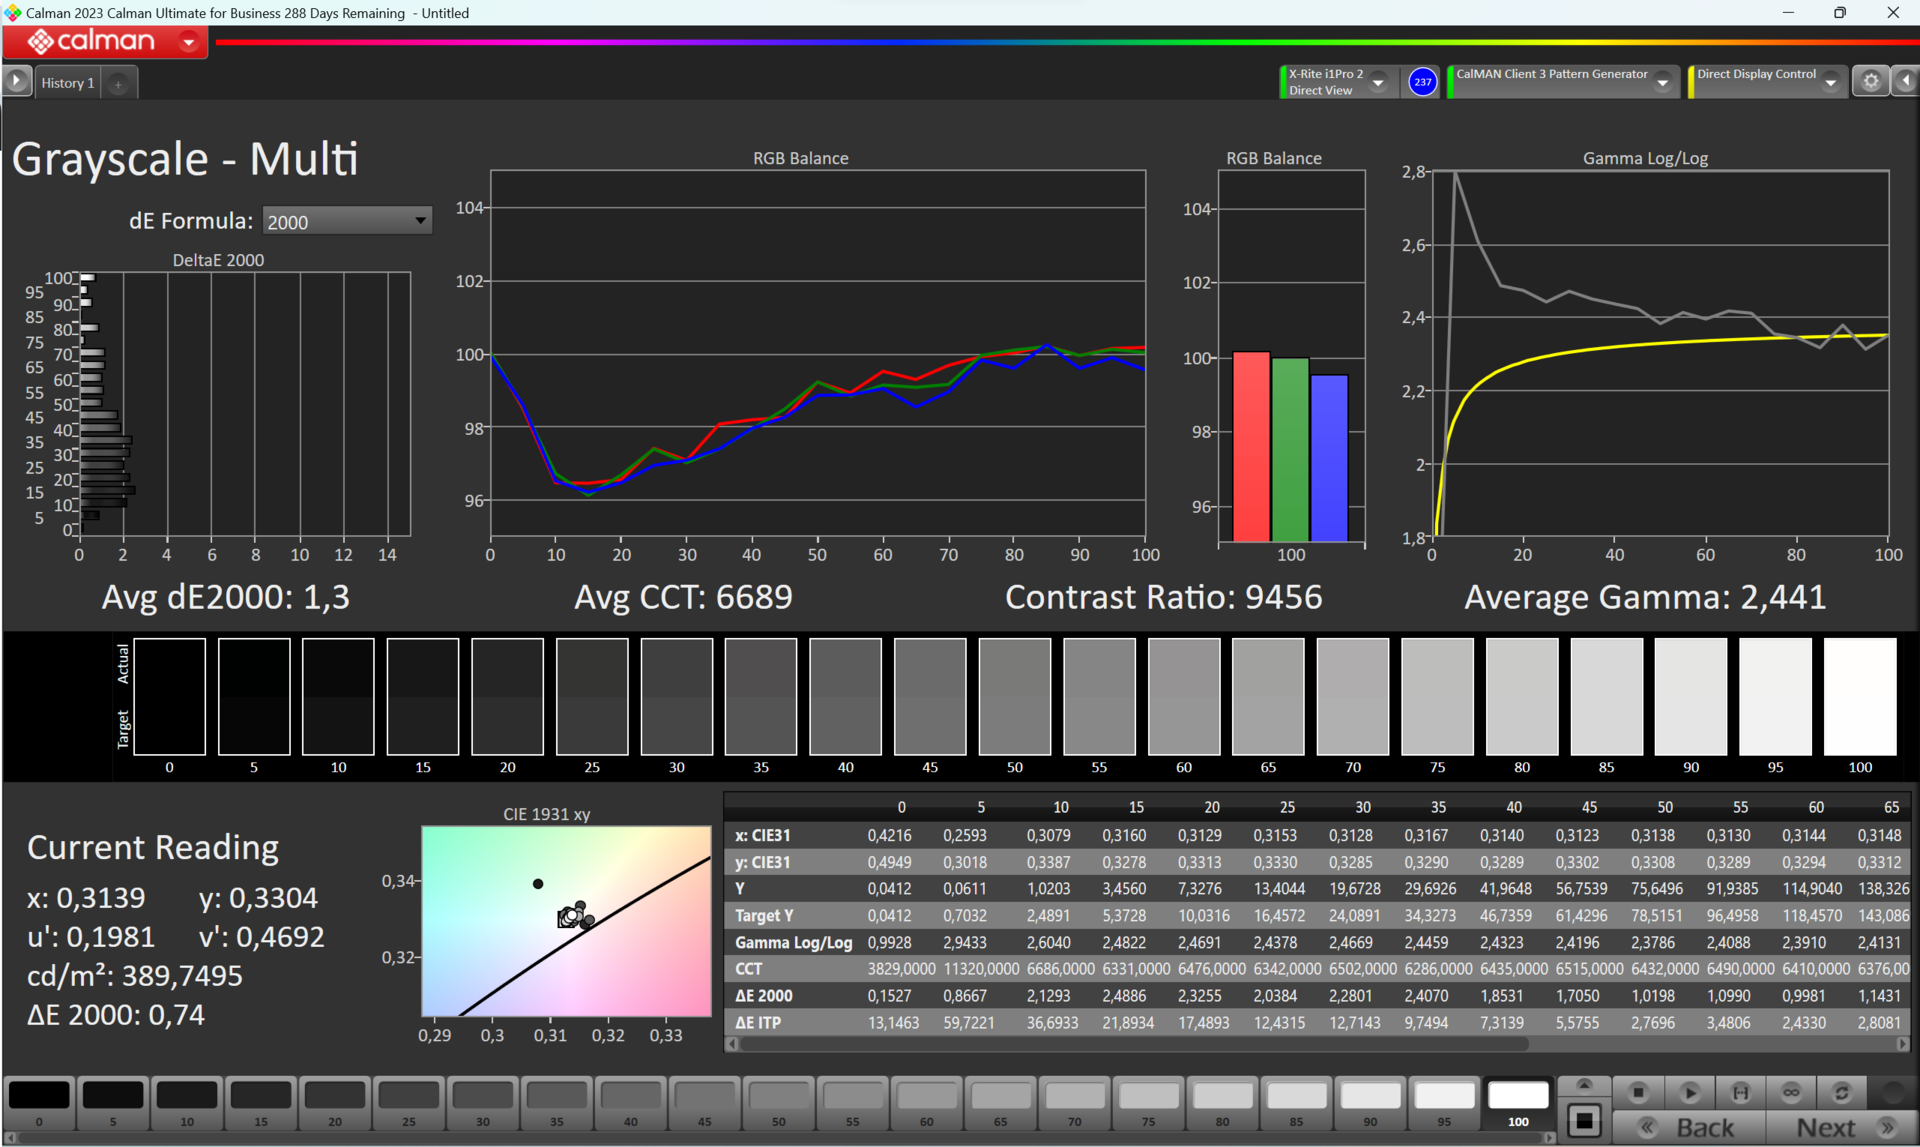
La nuova applicazione AcerSense dello Swift Go offre più profili di visualizzazione. Tuttavia, non abbiamo ancora osservato alcuna modifica dei valori misurati nei vari profili. Come detto all'inizio, Acer sta ancora lavorando sui dettagli finali del portatile.
| |||||||||||||||||||||||||
Distribuzione della luminosità: 98 %
Al centro con la batteria: 385 cd/m²
Contrasto: 9440:1 (Nero: 0.0411 cd/m²)
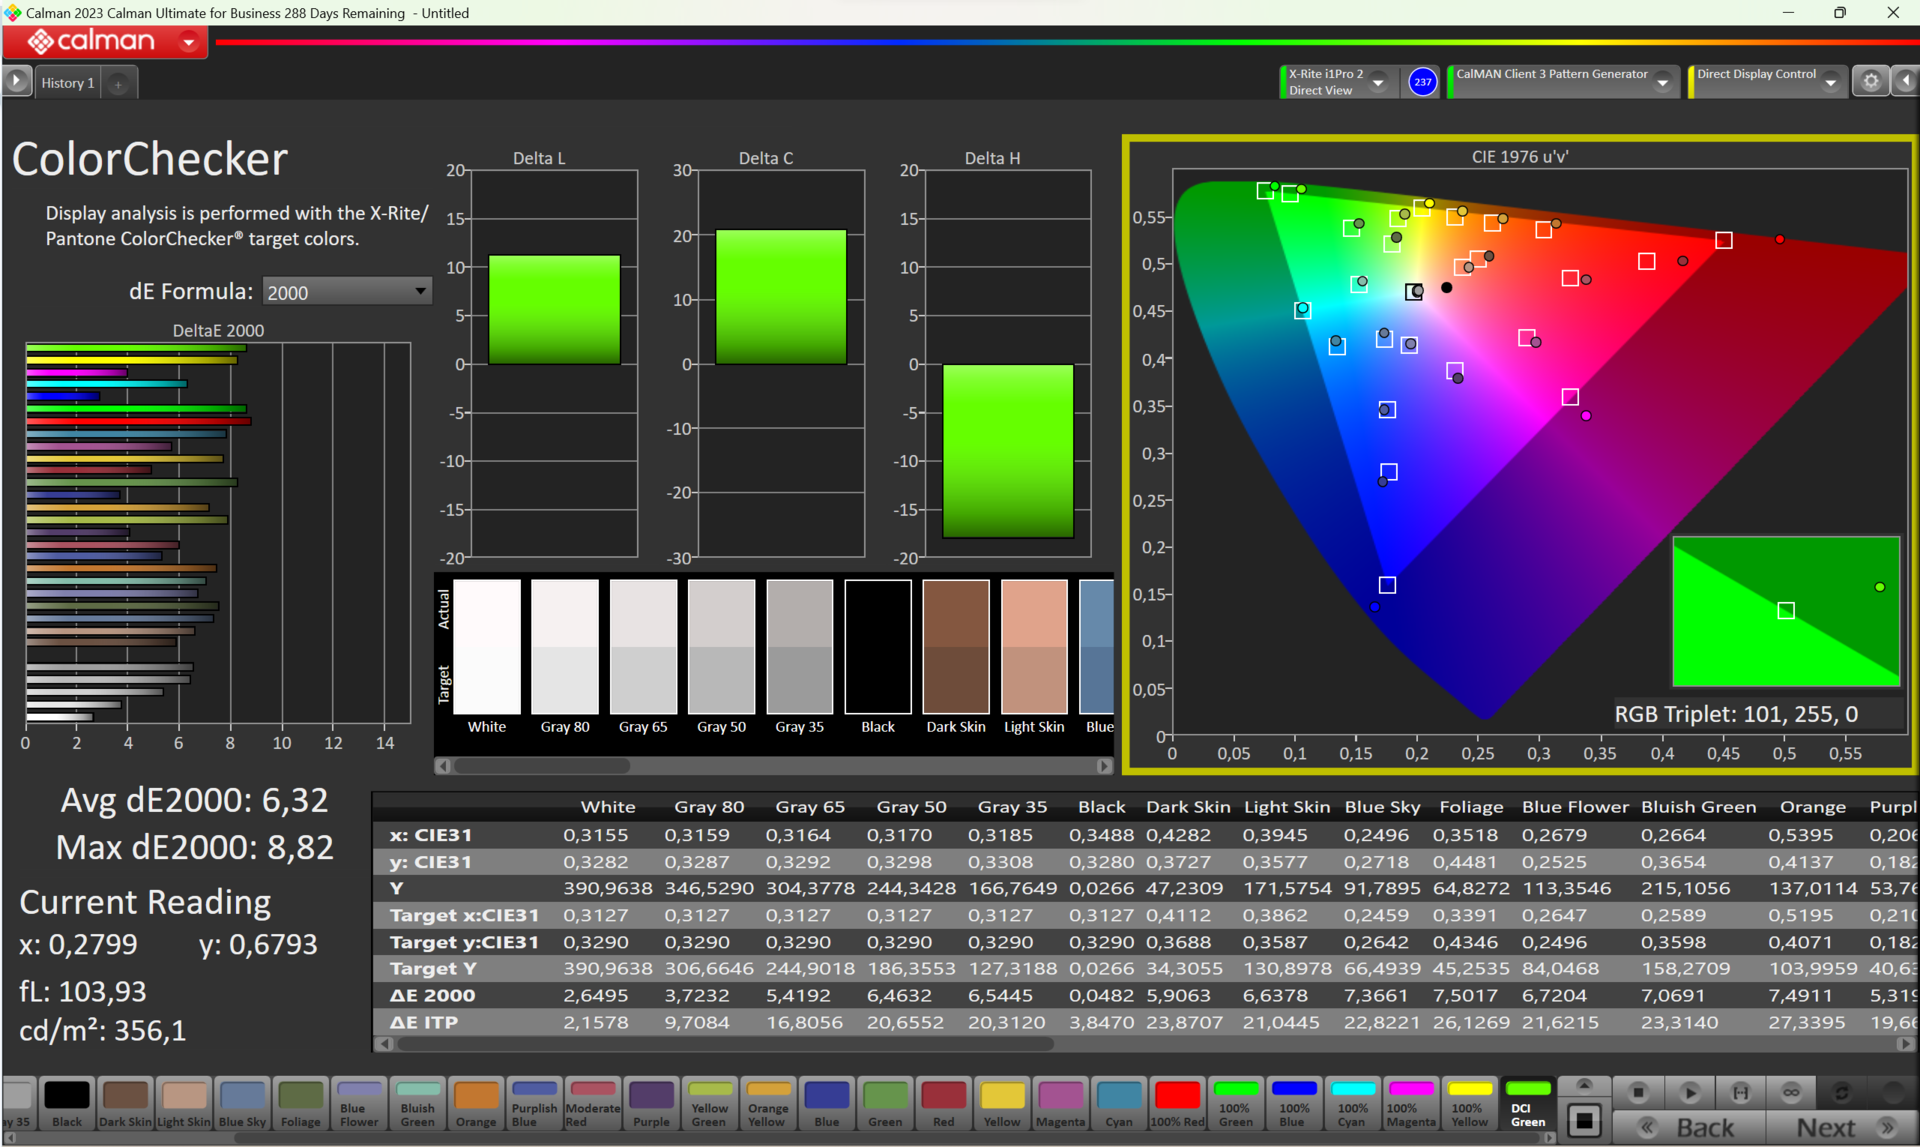
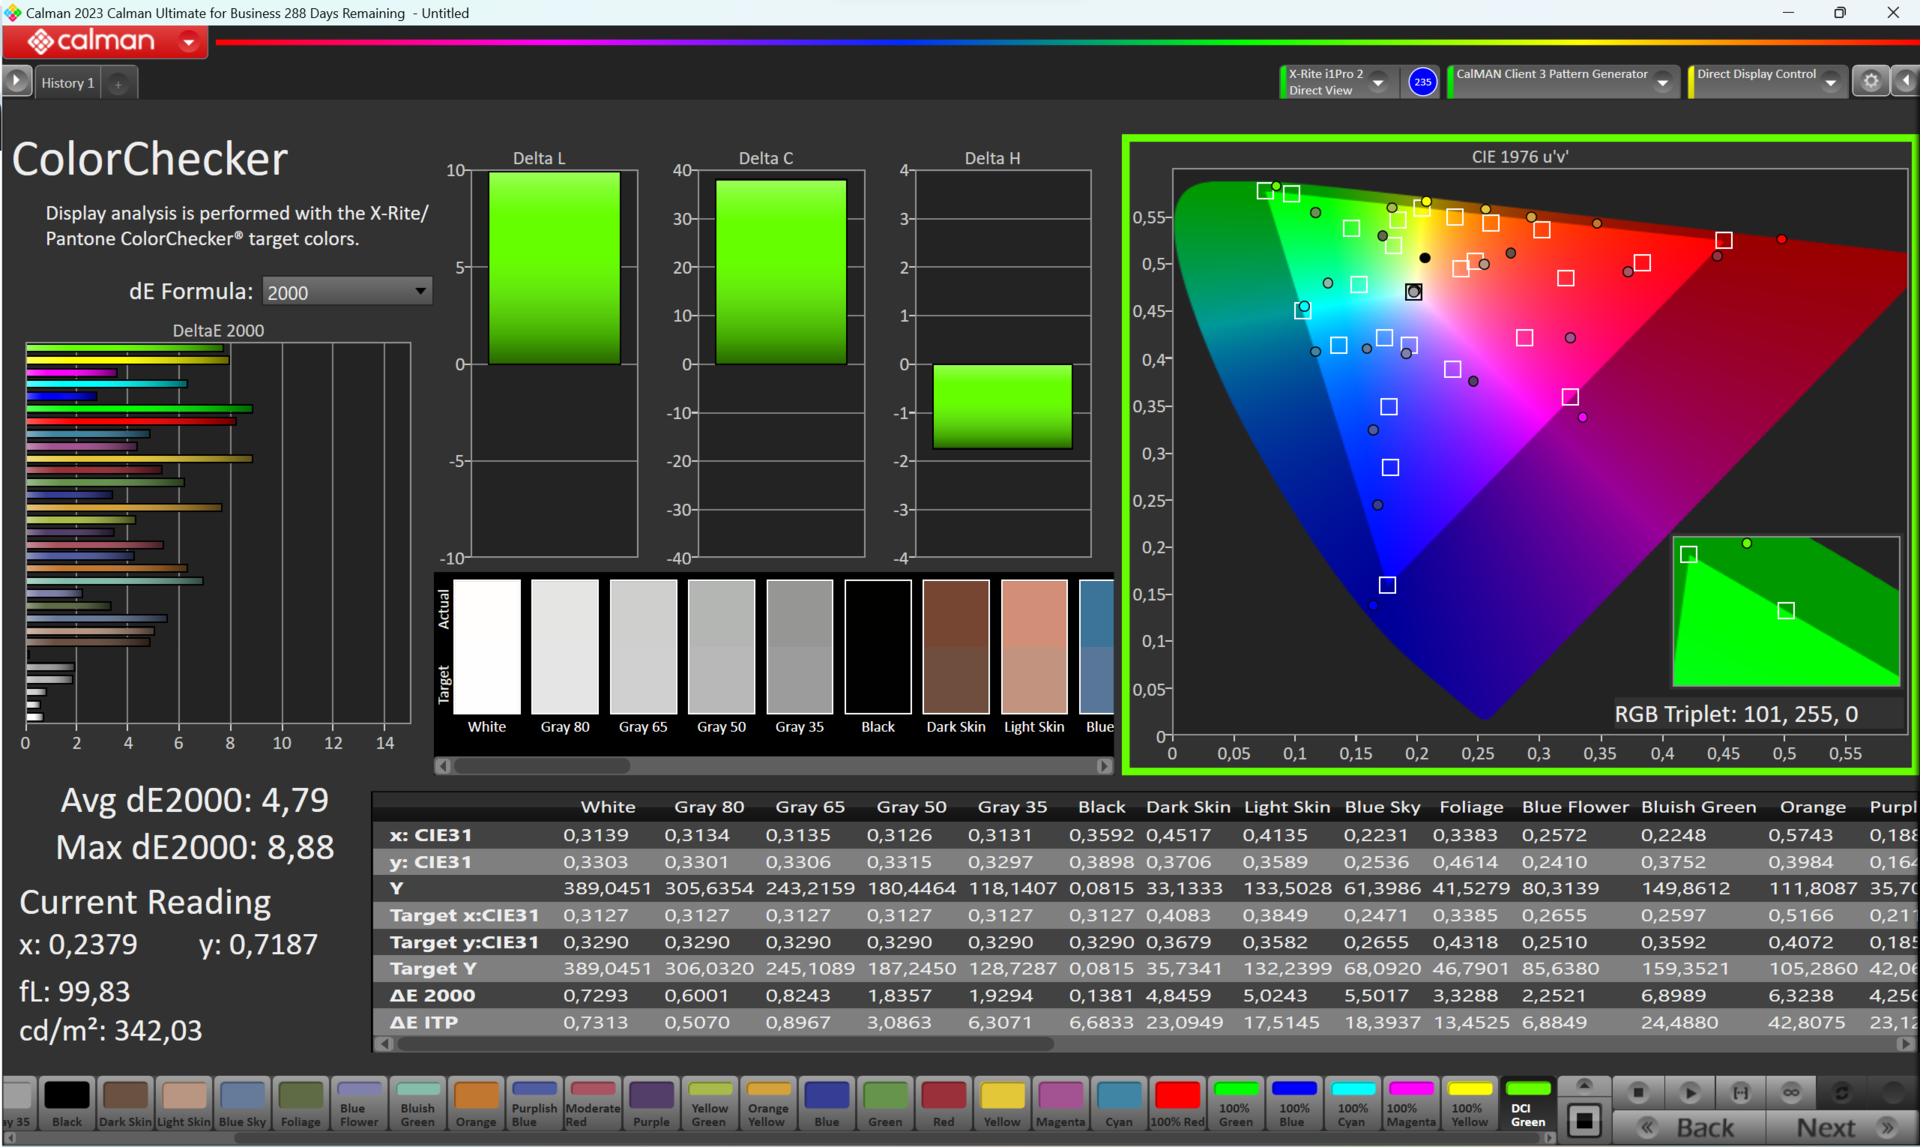
ΔE ColorChecker Calman: 6.32 | ∀{0.5-29.43 Ø4.71}
calibrated: 4.79
ΔE Greyscale Calman: 2.61 | ∀{0.09-98 Ø4.96}
98.56% AdobeRGB 1998 (Argyll 3D)
99.99% sRGB (Argyll 3D)
99.75% Display P3 (Argyll 3D)
Gamma: 1.772
CCT: 6202 K
| Acer Swift Go 14 SFG14-72 ATNA40YK11-0, OLED, 2880x1800, 14" | LG Gram 2in1 16 16T90R - G.AA78G LP160WQ1-SPB2, IPS, 2560x1600, 16" | HP Pavilion Plus 14-ew0153TU Samsung SDC4197, OLED, 2880x1800, 14" | Lenovo ThinkPad T14 G4 21K4S02000 MNE007JA1-1, IPS LED, 1920x1200, 14" | Ayaneo Air 1S Retro Power Ayaneo-OLED, OLED, 1920x1080, 5.5" | HP Pavilion Plus 14-ey0095cl Samsung SDC4197, OLED, 2880x1800, 14" | |
|---|---|---|---|---|---|---|
| Display | -6% | -3% | -22% | 0% | -1% | |
| Display P3 Coverage (%) | 99.75 | 96.5 -3% | 97.9 -2% | 67.1 -33% | 99.85 0% | 99.8 0% |
| sRGB Coverage (%) | 99.99 | 99.9 0% | 99.6 0% | 97.8 -2% | 100 0% | 100 0% |
| AdobeRGB 1998 Coverage (%) | 98.56 | 84.6 -14% | 92.1 -7% | 69.4 -30% | 99.71 1% | 95.8 -3% |
| Response Times | -856% | -182% | -871% | -20% | 78% | |
| Response Time Grey 50% / Grey 80% * (ms) | 2.2 ? | 38.4 ? -1645% | 10.8 ? -391% | 38.4 ? -1645% | 4.4 ? -100% | 0.82 ? 63% |
| Response Time Black / White * (ms) | 12.8 ? | 21.4 ? -67% | 9.29 ? 27% | 25.1 ? -96% | 5 ? 61% | 0.95 ? 93% |
| PWM Frequency (Hz) | 300 | 120 ? | 240 ? | 504.7 ? | ||
| Screen | -107% | 65% | -32% | -42% | 29% | |
| Brightness middle (cd/m²) | 388 | 329 -15% | 387 0% | 398 3% | 331 -15% | 384 -1% |
| Brightness (cd/m²) | 391 | 310 -21% | 387 -1% | 379 -3% | 339 -13% | 386 -1% |
| Brightness Distribution (%) | 98 | 88 -10% | 97 -1% | 90 -8% | 90 -8% | 98 0% |
| Black Level * (cd/m²) | 0.0411 | 0.39 -849% | 0.01 76% | 0.23 -460% | 0.07 -70% | |
| Contrast (:1) | 9440 | 844 -91% | 38700 310% | 1730 -82% | 4729 -50% | |
| Colorchecker dE 2000 * | 6.32 | 3.52 44% | 2.03 68% | 1.3 79% | 4.76 25% | 4.06 36% |
| Colorchecker dE 2000 max. * | 8.82 | 6.96 21% | 3.86 56% | 3.1 65% | 9.2 -4% | 6.73 24% |
| Colorchecker dE 2000 calibrated * | 4.79 | 1.15 76% | 1.6 67% | 1.2 75% | 5.04 -5% | 0.49 90% |
| Greyscale dE 2000 * | 2.61 | 5.75 -120% | 2.3 12% | 1.4 46% | 8.79 -237% | 1.1 58% |
| Gamma | 1.772 124% | 2.137 103% | 2.23 99% | 2.26 97% | 2.155 102% | 2.26 97% |
| CCT | 6202 105% | 7584 86% | 6523 100% | 6448 101% | 7571 86% | 6331 103% |
| Media totale (Programma / Settaggio) | -323% /
-192% | -40% /
15% | -308% /
-149% | -21% /
-30% | 35% /
30% |
* ... Meglio usare valori piccoli


Tutti e tre gli spazi di colore sono quasi completamente coperti dall'eccellente OLED. Solo lo spazio colore Adobe RGB manca del 3% alla perfezione.
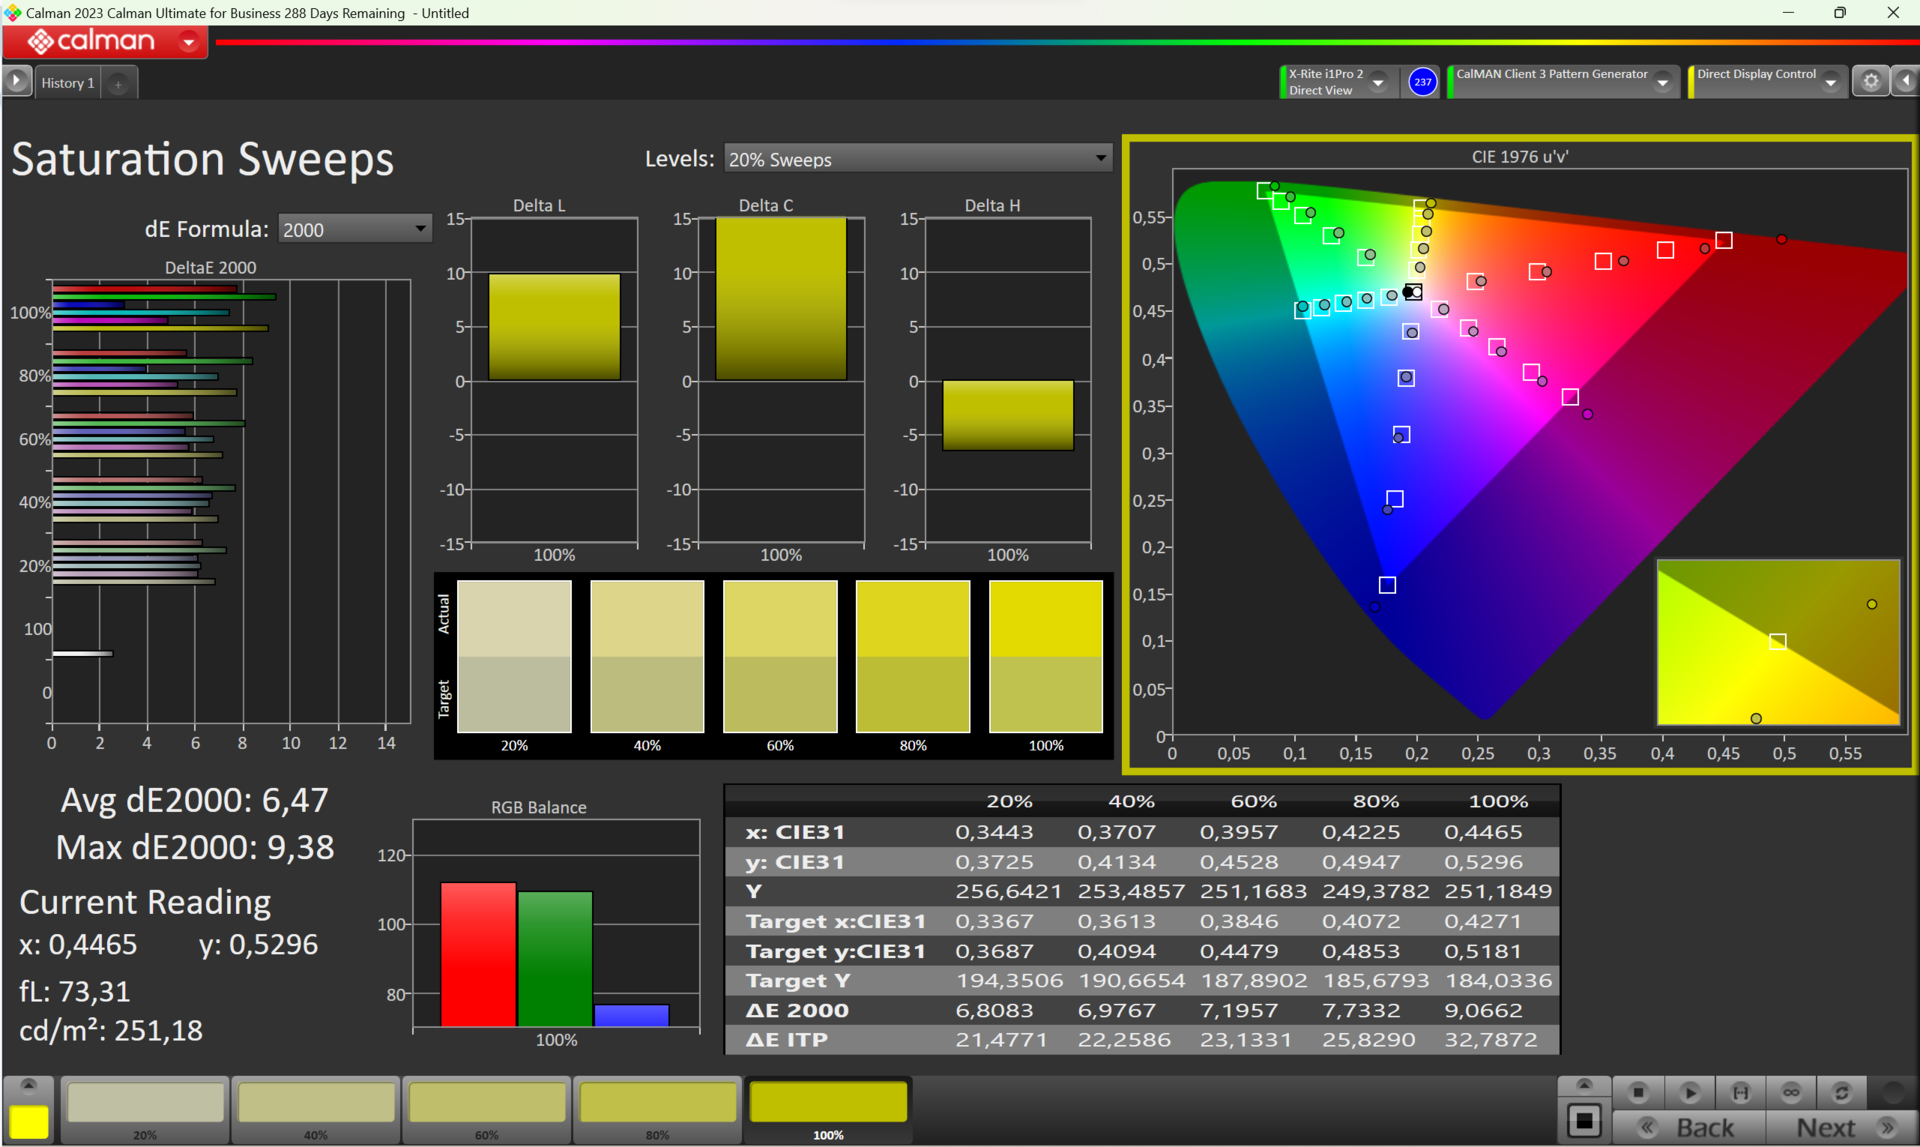
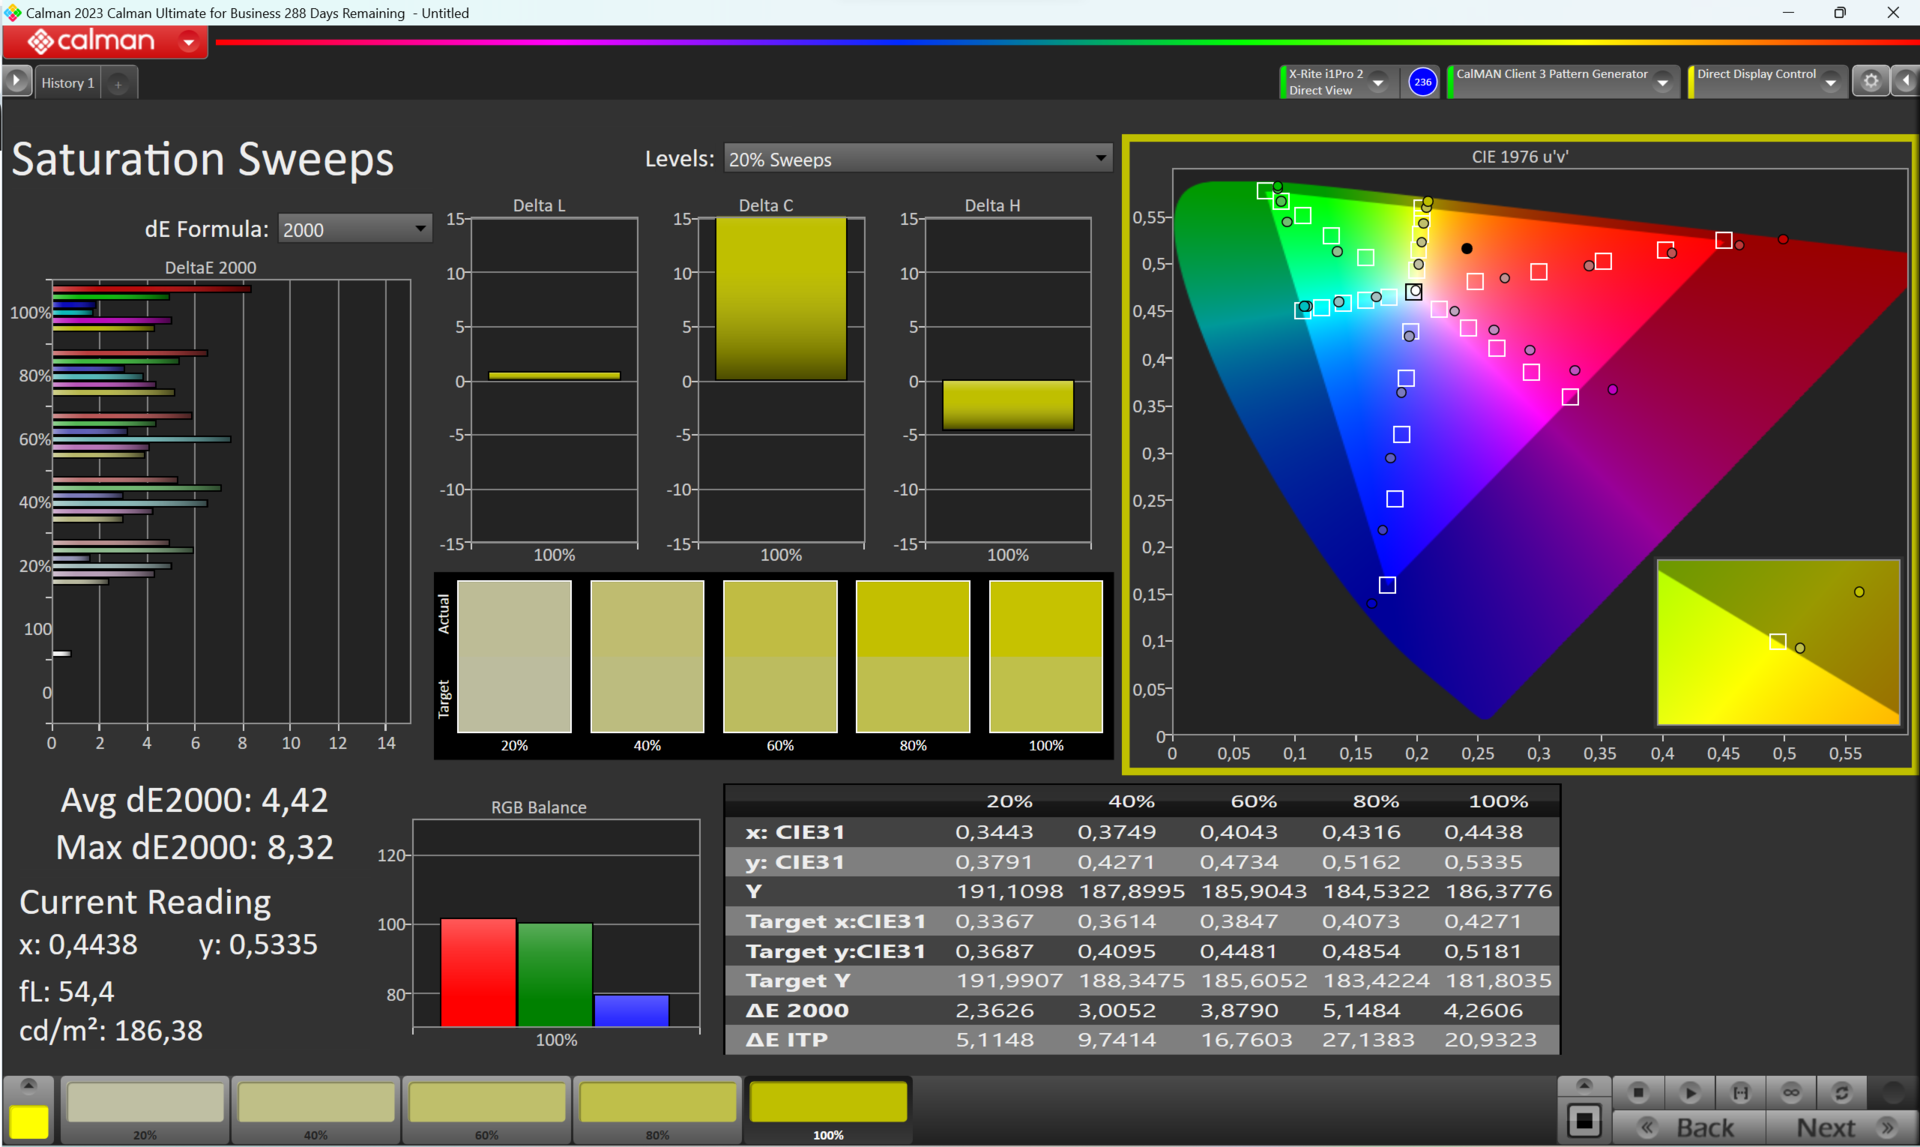
Finora, i vari profili di visualizzazione non hanno mostrato alcun miglioramento delle deviazioni cromatiche misurate che, allo stato attuale, sono ancora molto elevate. Ad esempio, nello spazio colore Adobe RGB, il nostro profilo ICC offre piccoli miglioramenti nella riproduzione dei colori. Possiamo anche supporre che Acer apporterà miglioramenti in quest'area nel software finito.
Tempi di risposta del Display
| ↔ Tempi di risposta dal Nero al Bianco | ||
|---|---|---|
| 12.8 ms ... aumenta ↗ e diminuisce ↘ combinato | ↗ 11.8 ms Incremento |  |
| ↘ 1 ms Calo | ||
| Lo schermo mostra buoni tempi di risposta durante i nostri tests, ma potrebbe essere troppo lento per i gamers competitivi. In confronto, tutti i dispositivi di test variano da 0.1 (minimo) a 240 (massimo) ms. » 33 % di tutti i dispositivi è migliore. Questo significa che i tempi di risposta rilevati sono migliori rispettto alla media di tutti i dispositivi testati (19.8 ms). | ||
| ↔ Tempo di risposta dal 50% Grigio all'80% Grigio | ||
| 2.2 ms ... aumenta ↗ e diminuisce ↘ combinato | ↗ 1 ms Incremento |  |
| ↘ 1.2 ms Calo | ||
| Lo schermo ha mostrato valori di risposta molto veloci nei nostri tests ed è molto adatto per i gaming veloce. In confronto, tutti i dispositivi di test variano da 0.165 (minimo) a 636 (massimo) ms. » 11 % di tutti i dispositivi è migliore. Questo significa che i tempi di risposta rilevati sono migliori rispettto alla media di tutti i dispositivi testati (31 ms). | ||
Sfarfallio dello schermo / PWM (Pulse-Width Modulation)
| flickering dello schermo / PWM rilevato | 300 Hz |  | |
Il display sfarfalla a 300 Hz (Probabilmente a causa dell'uso di PWM) . La frequenza di 300 Hz è relativamente elevata, quindi la maggioranza degli utenti sensibili al PWM non dovrebbe notare alcun flickering. Tuttavia, è stato segnalato che alcuni utenti sono sensibili al PWM a 500 Hz ed oltre, quindi prestate attenzione. In confronto: 52 % di tutti i dispositivi testati non utilizza PWM per ridurre la luminosita' del display. Se è rilevato PWM, una media di 7757 (minimo: 5 - massimo: 343500) Hz è stata rilevata. | |||
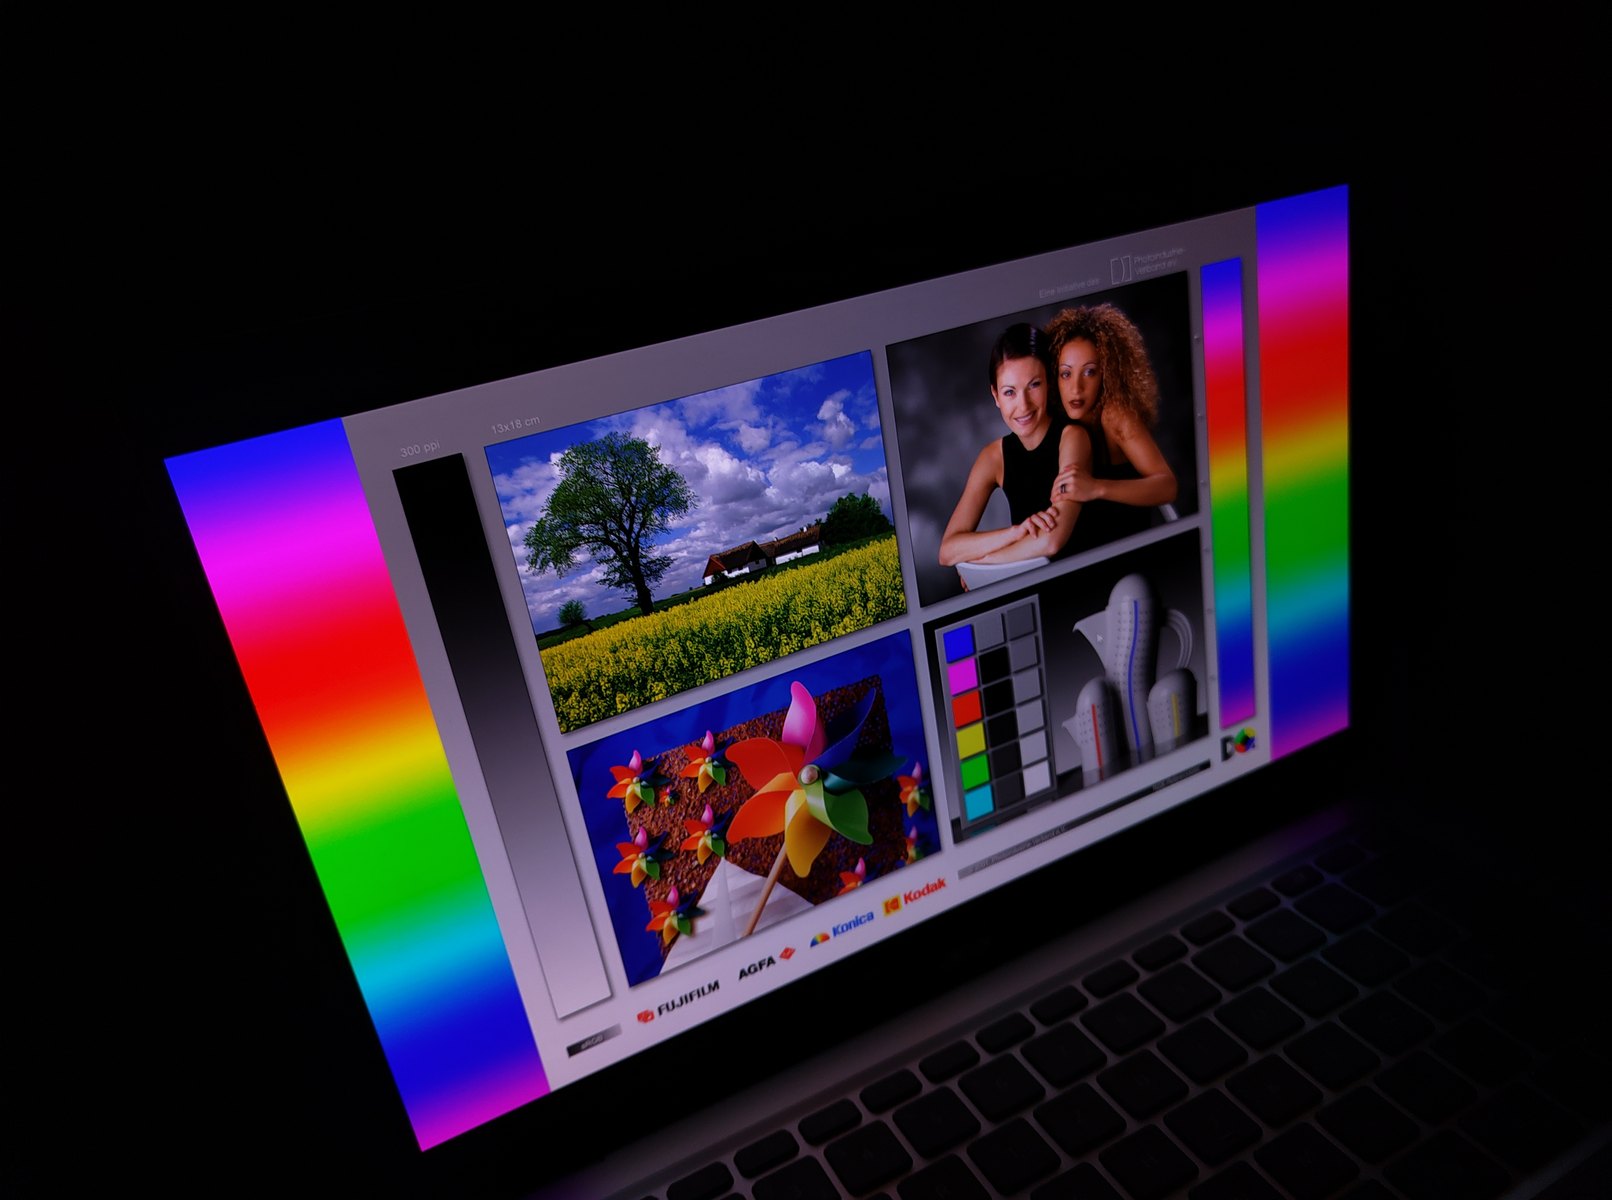
Grazie all'elevata luminosità, l'Acer Swift Go si comporta bene in situazioni esterne, nonostante il display lucido. Anche l'analisi dell'angolo di visione non ha rivelato alcuna anomalia.
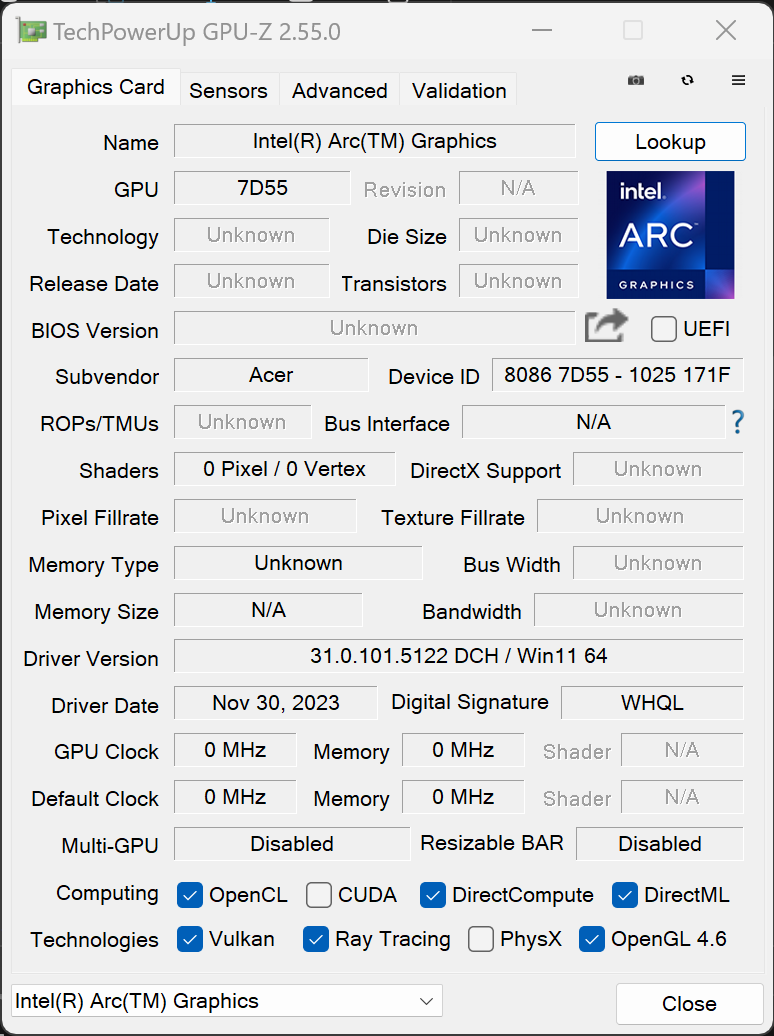
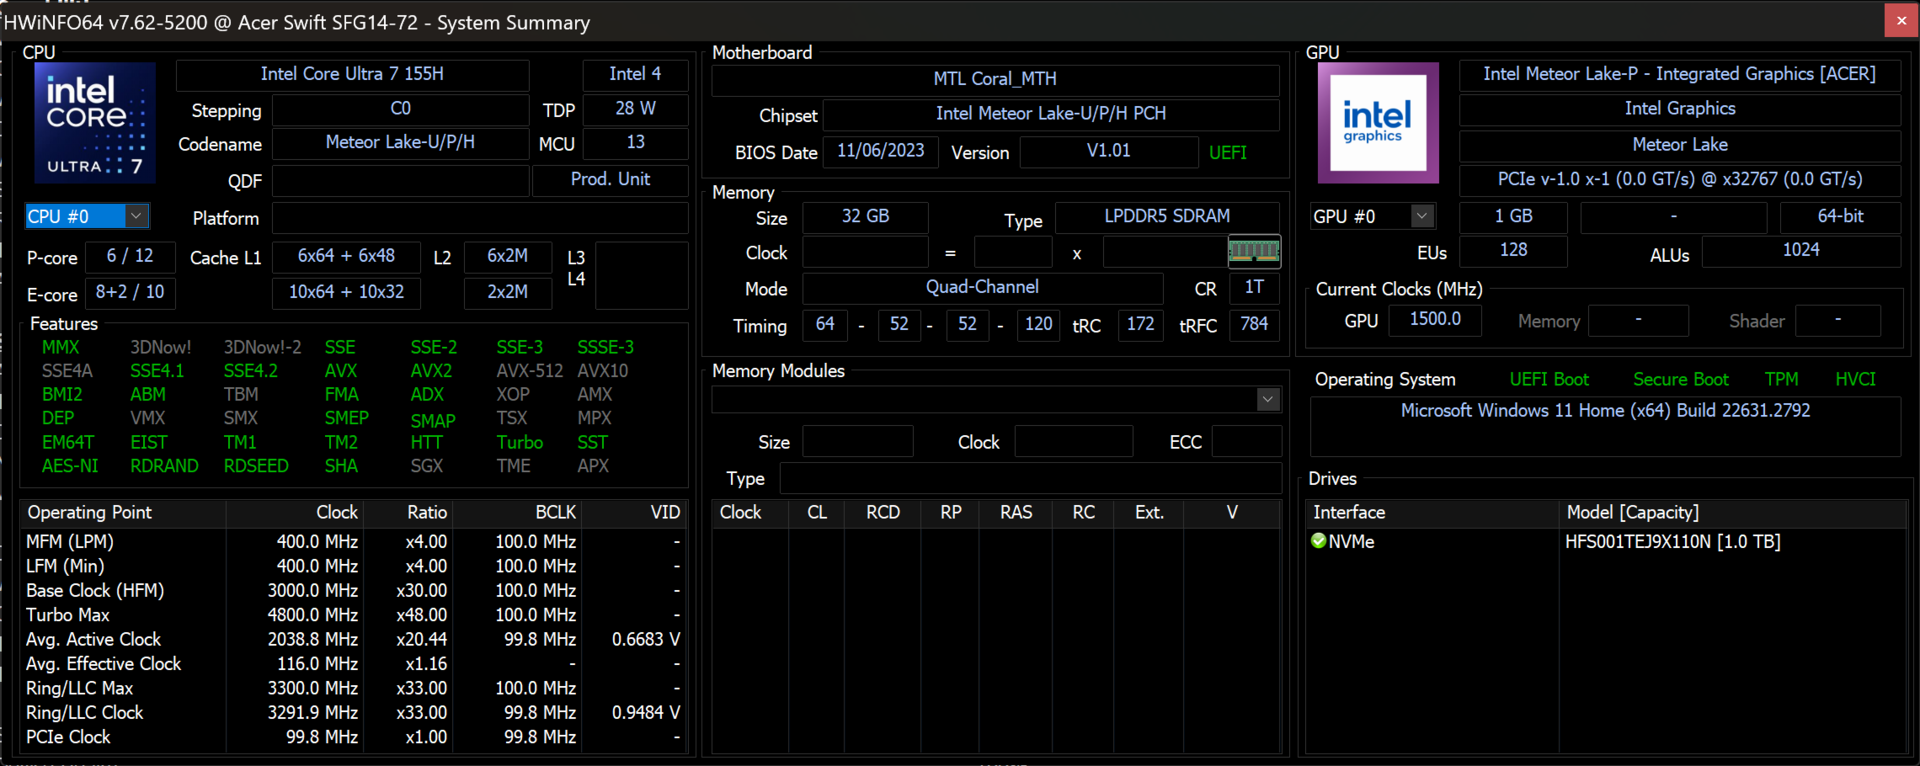
Prestazioni - Meteor Lake trasforma lo Swift Go in una piccola macchina da gioco
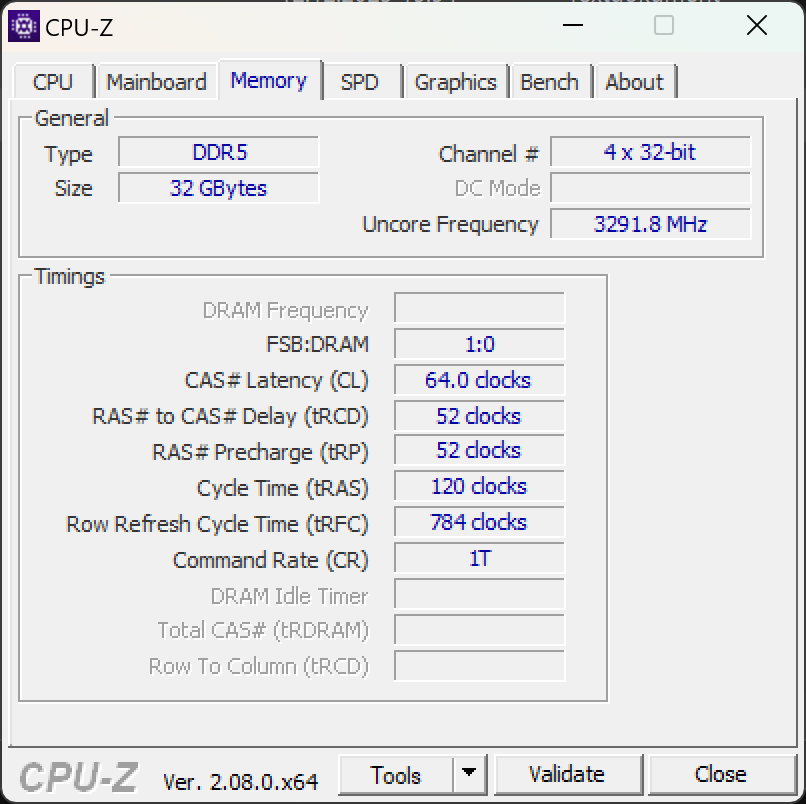
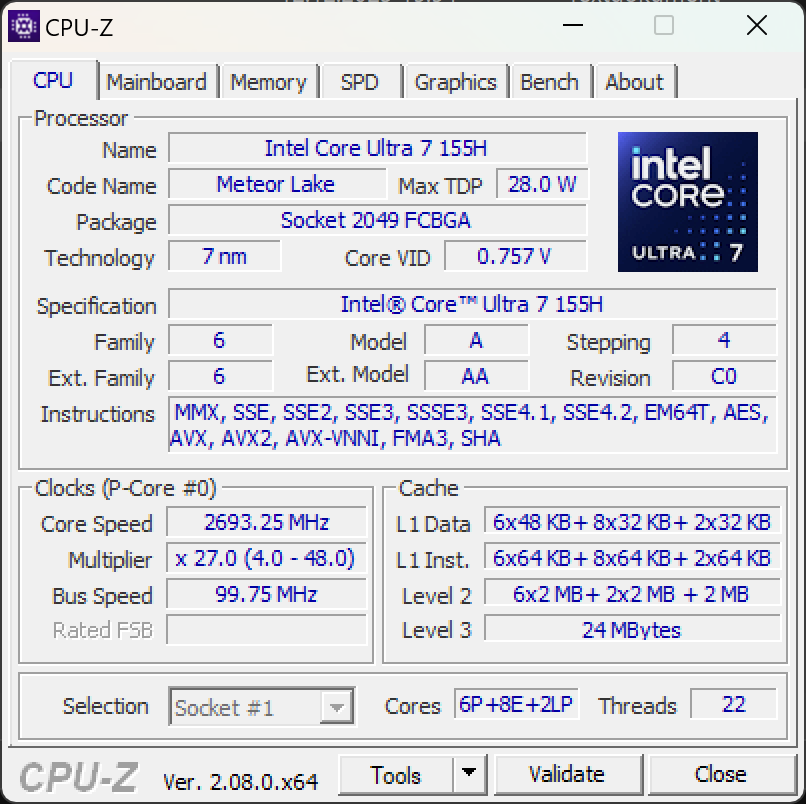
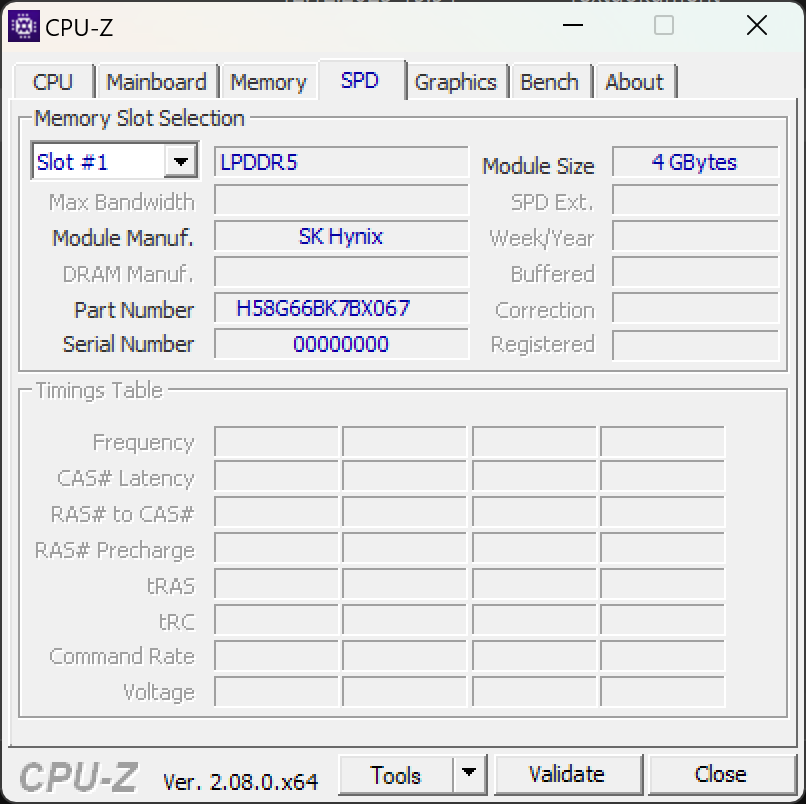
Il nuovo Acer Swift Go 14 offre un processore Intel Meteor Lake. Per la prima volta, il processore Intel Core Ultra 7 155H ospita anche un'iGPU Arc iGPU con otto core e una NPU. Il dispositivo è completato da 32 GB di RAM DDR5 e da un SSD SK Hynix NVMe da 1 TB.

Condizioni del test
Come detto all'inizio, l'Acer Swift Go 14 che stiamo trattando è un dispositivo che corrisponde alle specifiche hardware standard. Il software e il firmware della nostra macchina da recensire non sono ancora del tutto perfezionati. Ad esempio, nel nostro Swift Go 14, i valori per il boost delle prestazioni erano inizialmente configurati un po' troppo alti. Nel corso del test, abbiamo anche avuto problemi con AlterView preinstallato, che crea sfondi 3D visivamente accattivanti. Dopo un vivace scambio con Acer, abbiamo deciso di rimuovere il software. Siamo anche riusciti a ridurre il PL2 a 55 watt, lasciando il PL1 a 45 watt, il tutto con l'aiuto di Throttle Stop di TechPowerUp. Questo ha aiutato il portatile a funzionare in modo notevolmente migliore e più stabile. Acer effettuerà una messa a punto molto più dettagliata quando si tratterà di gestire le prestazioni finali. Questo dovrebbe far sì che il portatile goda di prestazioni migliori di quelle attuali.
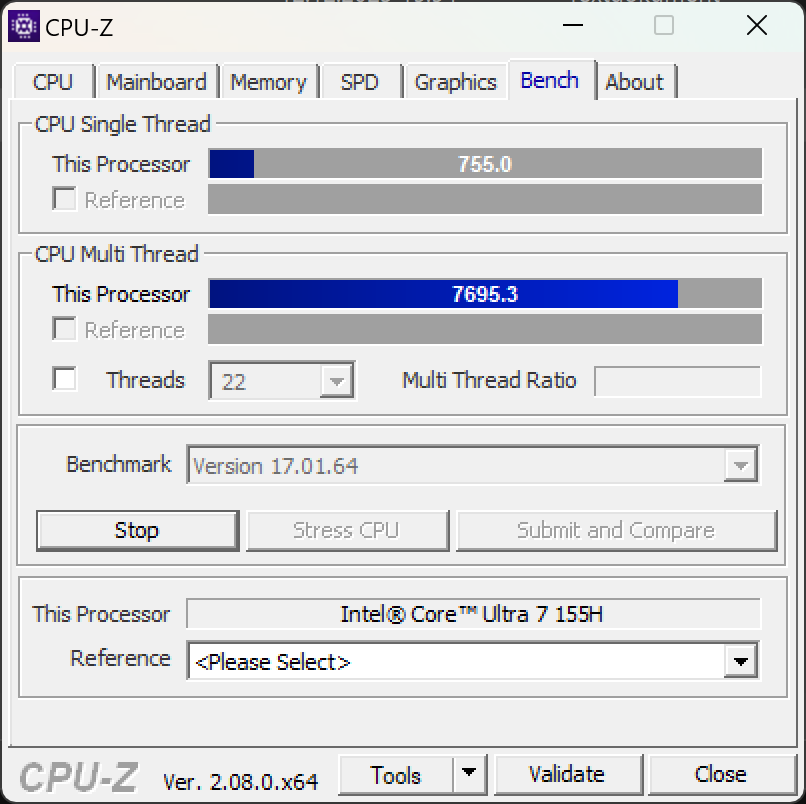
Processore
Il nuovo processore di Intel porta con sé alcuni cambiamenti attesi da tempo. Per la prima volta, il chip con processo produttivo a 7 nm offre ora una NPU e la nuova iGPU Arc. Il Core Ultra 7 155H ospita sei core P, otto core E e due core LP E- aggiuntivi, che si dice siano particolarmente efficienti dal punto di vista energetico. Ciò significa che è disponibile un totale di 22 thread.
L'ultima generazione di processori Intel non gode di un chiaro vantaggio in termini di prestazioni rispetto al suo predecessore più simile di 13esima generazione. Qui abbiamo a che fare con due dispositivi con l'Intel Core i7-13700H. Allo stesso modo, offre sei core P e otto core E-. Mancano solo entrambi i core E a basso consumo. Il più recente processore di Intel di solito se la cava bene rispetto al suo diretto concorrente, il AMD Ryzen 7 7840U. Negli ultimi tempi (e sorprendentemente), il team rosso ha il naso davanti quando si tratta di prestazioni single-core in Cinebench R23. Abbiamo già pubblicato un'analisi dettagliata della nuova generazione di processori.
Cinebench R15 Multi Continuous Test
Cinebench R23: Multi Core | Single Core
Cinebench R20: CPU (Multi Core) | CPU (Single Core)
Cinebench R15: CPU Multi 64Bit | CPU Single 64Bit
Blender: v2.79 BMW27 CPU
7-Zip 18.03: 7z b 4 | 7z b 4 -mmt1
Geekbench 5.5: Multi-Core | Single-Core
HWBOT x265 Benchmark v2.2: 4k Preset
LibreOffice : 20 Documents To PDF
R Benchmark 2.5: Overall mean
| CPU Performance rating | |
| Media Intel Core Ultra 7 155H | |
| Acer Swift Go 14 SFG14-72 | |
| Lenovo ThinkPad T14 G4 21K4S02000 | |
| HP Pavilion Plus 14-ey0095cl | |
| Ayaneo Air 1S Retro Power | |
| Media della classe Subnotebook | |
| LG Gram 2in1 16 16T90R - G.AA78G | |
| HP Pavilion Plus 14-ew0153TU | |
| Acer Swift Go 14 SFG14-71 | |
| Cinebench R23 / Multi Core | |
| Acer Swift Go 14 SFG14-72 | |
| Media Intel Core Ultra 7 155H (9769 - 19007, n=52) | |
| Lenovo ThinkPad T14 G4 21K4S02000 | |
| Media della classe Subnotebook (1555 - 21812, n=60, ultimi 2 anni) | |
| Ayaneo Air 1S Retro Power | |
| HP Pavilion Plus 14-ey0095cl | |
| LG Gram 2in1 16 16T90R - G.AA78G | |
| Acer Swift Go 14 SFG14-71 | |
| HP Pavilion Plus 14-ew0153TU | |
| Cinebench R23 / Single Core | |
| Acer Swift Go 14 SFG14-72 | |
| Lenovo ThinkPad T14 G4 21K4S02000 | |
| HP Pavilion Plus 14-ew0153TU | |
| Media della classe Subnotebook (358 - 2213, n=61, ultimi 2 anni) | |
| Media Intel Core Ultra 7 155H (1496 - 1815, n=52) | |
| Ayaneo Air 1S Retro Power | |
| LG Gram 2in1 16 16T90R - G.AA78G | |
| HP Pavilion Plus 14-ey0095cl | |
| Acer Swift Go 14 SFG14-71 | |
| Cinebench R20 / CPU (Multi Core) | |
| Media Intel Core Ultra 7 155H (3798 - 7409, n=50) | |
| Acer Swift Go 14 SFG14-72 | |
| Lenovo ThinkPad T14 G4 21K4S02000 | |
| Media della classe Subnotebook (579 - 8541, n=57, ultimi 2 anni) | |
| Ayaneo Air 1S Retro Power | |
| LG Gram 2in1 16 16T90R - G.AA78G | |
| HP Pavilion Plus 14-ey0095cl | |
| HP Pavilion Plus 14-ew0153TU | |
| Acer Swift Go 14 SFG14-71 | |
| Cinebench R20 / CPU (Single Core) | |
| Lenovo ThinkPad T14 G4 21K4S02000 | |
| Acer Swift Go 14 SFG14-72 | |
| Ayaneo Air 1S Retro Power | |
| Media Intel Core Ultra 7 155H (601 - 696, n=50) | |
| Media della classe Subnotebook (128 - 832, n=57, ultimi 2 anni) | |
| HP Pavilion Plus 14-ew0153TU | |
| LG Gram 2in1 16 16T90R - G.AA78G | |
| HP Pavilion Plus 14-ey0095cl | |
| Acer Swift Go 14 SFG14-71 | |
| Cinebench R15 / CPU Multi 64Bit | |
| Acer Swift Go 14 SFG14-72 | |
| Media Intel Core Ultra 7 155H (1932 - 2880, n=56) | |
| LG Gram 2in1 16 16T90R - G.AA78G | |
| Lenovo ThinkPad T14 G4 21K4S02000 | |
| Media della classe Subnotebook (327 - 3345, n=57, ultimi 2 anni) | |
| HP Pavilion Plus 14-ey0095cl | |
| Ayaneo Air 1S Retro Power | |
| Acer Swift Go 14 SFG14-71 | |
| HP Pavilion Plus 14-ew0153TU | |
| Cinebench R15 / CPU Single 64Bit | |
| Lenovo ThinkPad T14 G4 21K4S02000 | |
| HP Pavilion Plus 14-ey0095cl | |
| Ayaneo Air 1S Retro Power | |
| Media della classe Subnotebook (72.4 - 322, n=57, ultimi 2 anni) | |
| Acer Swift Go 14 SFG14-72 | |
| Media Intel Core Ultra 7 155H (99.6 - 268, n=52) | |
| LG Gram 2in1 16 16T90R - G.AA78G | |
| HP Pavilion Plus 14-ew0153TU | |
| Acer Swift Go 14 SFG14-71 | |
| Blender / v2.79 BMW27 CPU | |
| HP Pavilion Plus 14-ew0153TU | |
| Acer Swift Go 14 SFG14-71 | |
| Media della classe Subnotebook (159 - 2271, n=58, ultimi 2 anni) | |
| LG Gram 2in1 16 16T90R - G.AA78G | |
| HP Pavilion Plus 14-ey0095cl | |
| Ayaneo Air 1S Retro Power | |
| Lenovo ThinkPad T14 G4 21K4S02000 | |
| Media Intel Core Ultra 7 155H (175 - 381, n=47) | |
| Acer Swift Go 14 SFG14-72 | |
| 7-Zip 18.03 / 7z b 4 | |
| Acer Swift Go 14 SFG14-72 | |
| Media Intel Core Ultra 7 155H (41739 - 70254, n=50) | |
| Lenovo ThinkPad T14 G4 21K4S02000 | |
| Ayaneo Air 1S Retro Power | |
| HP Pavilion Plus 14-ey0095cl | |
| Media della classe Subnotebook (11668 - 77867, n=57, ultimi 2 anni) | |
| LG Gram 2in1 16 16T90R - G.AA78G | |
| Acer Swift Go 14 SFG14-71 | |
| HP Pavilion Plus 14-ew0153TU | |
| 7-Zip 18.03 / 7z b 4 -mmt1 | |
| HP Pavilion Plus 14-ey0095cl | |
| Lenovo ThinkPad T14 G4 21K4S02000 | |
| Ayaneo Air 1S Retro Power | |
| Media della classe Subnotebook (2643 - 6699, n=59, ultimi 2 anni) | |
| HP Pavilion Plus 14-ew0153TU | |
| Media Intel Core Ultra 7 155H (4594 - 5621, n=50) | |
| Acer Swift Go 14 SFG14-72 | |
| Acer Swift Go 14 SFG14-71 | |
| LG Gram 2in1 16 16T90R - G.AA78G | |
| Geekbench 5.5 / Multi-Core | |
| Media Intel Core Ultra 7 155H (10017 - 13556, n=52) | |
| Acer Swift Go 14 SFG14-72 | |
| Media della classe Subnotebook (2557 - 17218, n=48, ultimi 2 anni) | |
| LG Gram 2in1 16 16T90R - G.AA78G | |
| Lenovo ThinkPad T14 G4 21K4S02000 | |
| HP Pavilion Plus 14-ey0095cl | |
| HP Pavilion Plus 14-ew0153TU | |
| Acer Swift Go 14 SFG14-71 | |
| Ayaneo Air 1S Retro Power | |
| Geekbench 5.5 / Single-Core | |
| Media della classe Subnotebook (726 - 2224, n=48, ultimi 2 anni) | |
| Lenovo ThinkPad T14 G4 21K4S02000 | |
| HP Pavilion Plus 14-ey0095cl | |
| HP Pavilion Plus 14-ew0153TU | |
| Media Intel Core Ultra 7 155H (1462 - 1824, n=52) | |
| Acer Swift Go 14 SFG14-72 | |
| Ayaneo Air 1S Retro Power | |
| LG Gram 2in1 16 16T90R - G.AA78G | |
| Acer Swift Go 14 SFG14-71 | |
| HWBOT x265 Benchmark v2.2 / 4k Preset | |
| Media Intel Core Ultra 7 155H (9.93 - 21.2, n=50) | |
| Acer Swift Go 14 SFG14-72 | |
| Lenovo ThinkPad T14 G4 21K4S02000 | |
| HP Pavilion Plus 14-ey0095cl | |
| Ayaneo Air 1S Retro Power | |
| Media della classe Subnotebook (0.97 - 25.1, n=57, ultimi 2 anni) | |
| LG Gram 2in1 16 16T90R - G.AA78G | |
| Acer Swift Go 14 SFG14-71 | |
| HP Pavilion Plus 14-ew0153TU | |
| LibreOffice / 20 Documents To PDF | |
| Acer Swift Go 14 SFG14-71 | |
| LG Gram 2in1 16 16T90R - G.AA78G | |
| Media della classe Subnotebook (39.9 - 220, n=56, ultimi 2 anni) | |
| HP Pavilion Plus 14-ew0153TU | |
| Acer Swift Go 14 SFG14-72 | |
| HP Pavilion Plus 14-ey0095cl | |
| Media Intel Core Ultra 7 155H (37.5 - 79.2, n=49) | |
| Ayaneo Air 1S Retro Power | |
| Lenovo ThinkPad T14 G4 21K4S02000 | |
| R Benchmark 2.5 / Overall mean | |
| LG Gram 2in1 16 16T90R - G.AA78G | |
| Media della classe Subnotebook (0.4024 - 1.456, n=58, ultimi 2 anni) | |
| Acer Swift Go 14 SFG14-71 | |
| Acer Swift Go 14 SFG14-72 | |
| Media Intel Core Ultra 7 155H (0.4457 - 0.53, n=49) | |
| HP Pavilion Plus 14-ew0153TU | |
| Lenovo ThinkPad T14 G4 21K4S02000 | |
| Ayaneo Air 1S Retro Power | |
| HP Pavilion Plus 14-ey0095cl | |
* ... Meglio usare valori piccoli
AIDA64: FP32 Ray-Trace | FPU Julia | CPU SHA3 | CPU Queen | FPU SinJulia | FPU Mandel | CPU AES | CPU ZLib | FP64 Ray-Trace | CPU PhotoWorxx
| Performance rating | |
| Lenovo ThinkPad T14 G4 21K4S02000 | |
| HP Pavilion Plus 14-ey0095cl | |
| Ayaneo Air 1S Retro Power | |
| Acer Swift Go 14 SFG14-72 | |
| Media Intel Core Ultra 7 155H | |
| Media della classe Subnotebook | |
| LG Gram 2in1 16 16T90R - G.AA78G | |
| Acer Swift Go 14 SFG14-71 | |
| HP Pavilion Plus 14-ew0153TU | |
| AIDA64 / FP32 Ray-Trace | |
| Lenovo ThinkPad T14 G4 21K4S02000 | |
| Ayaneo Air 1S Retro Power | |
| HP Pavilion Plus 14-ey0095cl | |
| Media della classe Subnotebook (1135 - 32888, n=58, ultimi 2 anni) | |
| Acer Swift Go 14 SFG14-72 | |
| Media Intel Core Ultra 7 155H (6670 - 18470, n=50) | |
| LG Gram 2in1 16 16T90R - G.AA78G | |
| LG Gram 2in1 16 16T90R - G.AA78G | |
| Acer Swift Go 14 SFG14-71 | |
| HP Pavilion Plus 14-ew0153TU | |
| AIDA64 / FPU Julia | |
| Lenovo ThinkPad T14 G4 21K4S02000 | |
| HP Pavilion Plus 14-ey0095cl | |
| Ayaneo Air 1S Retro Power | |
| Acer Swift Go 14 SFG14-72 | |
| Media Intel Core Ultra 7 155H (40905 - 93181, n=50) | |
| Media della classe Subnotebook (5218 - 123315, n=58, ultimi 2 anni) | |
| LG Gram 2in1 16 16T90R - G.AA78G | |
| Acer Swift Go 14 SFG14-71 | |
| HP Pavilion Plus 14-ew0153TU | |
| AIDA64 / CPU SHA3 | |
| Lenovo ThinkPad T14 G4 21K4S02000 | |
| Ayaneo Air 1S Retro Power | |
| HP Pavilion Plus 14-ey0095cl | |
| Acer Swift Go 14 SFG14-72 | |
| Media Intel Core Ultra 7 155H (1940 - 4436, n=50) | |
| Media della classe Subnotebook (444 - 5287, n=58, ultimi 2 anni) | |
| LG Gram 2in1 16 16T90R - G.AA78G | |
| Acer Swift Go 14 SFG14-71 | |
| HP Pavilion Plus 14-ew0153TU | |
| AIDA64 / CPU Queen | |
| Lenovo ThinkPad T14 G4 21K4S02000 | |
| HP Pavilion Plus 14-ey0095cl | |
| Ayaneo Air 1S Retro Power | |
| Acer Swift Go 14 SFG14-72 | |
| Media Intel Core Ultra 7 155H (64698 - 94181, n=50) | |
| LG Gram 2in1 16 16T90R - G.AA78G | |
| HP Pavilion Plus 14-ew0153TU | |
| Media della classe Subnotebook (10579 - 95002, n=49, ultimi 2 anni) | |
| Acer Swift Go 14 SFG14-71 | |
| AIDA64 / FPU SinJulia | |
| Lenovo ThinkPad T14 G4 21K4S02000 | |
| Ayaneo Air 1S Retro Power | |
| HP Pavilion Plus 14-ey0095cl | |
| Acer Swift Go 14 SFG14-72 | |
| Media Intel Core Ultra 7 155H (5639 - 10647, n=50) | |
| LG Gram 2in1 16 16T90R - G.AA78G | |
| Media della classe Subnotebook (744 - 18418, n=58, ultimi 2 anni) | |
| HP Pavilion Plus 14-ew0153TU | |
| Acer Swift Go 14 SFG14-71 | |
| AIDA64 / FPU Mandel | |
| Lenovo ThinkPad T14 G4 21K4S02000 | |
| HP Pavilion Plus 14-ey0095cl | |
| Ayaneo Air 1S Retro Power | |
| Acer Swift Go 14 SFG14-72 | |
| Media Intel Core Ultra 7 155H (18236 - 47685, n=50) | |
| Media della classe Subnotebook (3341 - 65433, n=58, ultimi 2 anni) | |
| LG Gram 2in1 16 16T90R - G.AA78G | |
| Acer Swift Go 14 SFG14-71 | |
| HP Pavilion Plus 14-ew0153TU | |
| AIDA64 / CPU AES | |
| Lenovo ThinkPad T14 G4 21K4S02000 | |
| LG Gram 2in1 16 16T90R - G.AA78G | |
| Media Intel Core Ultra 7 155H (45713 - 152179, n=50) | |
| Acer Swift Go 14 SFG14-72 | |
| Ayaneo Air 1S Retro Power | |
| Media della classe Subnotebook (638 - 96917, n=58, ultimi 2 anni) | |
| HP Pavilion Plus 14-ey0095cl | |
| Acer Swift Go 14 SFG14-71 | |
| HP Pavilion Plus 14-ew0153TU | |
| AIDA64 / CPU ZLib | |
| Media Intel Core Ultra 7 155H (557 - 1250, n=50) | |
| Acer Swift Go 14 SFG14-72 | |
| Lenovo ThinkPad T14 G4 21K4S02000 | |
| HP Pavilion Plus 14-ey0095cl | |
| Ayaneo Air 1S Retro Power | |
| LG Gram 2in1 16 16T90R - G.AA78G | |
| Media della classe Subnotebook (164.9 - 1379, n=58, ultimi 2 anni) | |
| Acer Swift Go 14 SFG14-71 | |
| HP Pavilion Plus 14-ew0153TU | |
| AIDA64 / FP64 Ray-Trace | |
| Lenovo ThinkPad T14 G4 21K4S02000 | |
| HP Pavilion Plus 14-ey0095cl | |
| Ayaneo Air 1S Retro Power | |
| Media della classe Subnotebook (610 - 17495, n=58, ultimi 2 anni) | |
| Acer Swift Go 14 SFG14-72 | |
| Media Intel Core Ultra 7 155H (3569 - 9802, n=50) | |
| LG Gram 2in1 16 16T90R - G.AA78G | |
| Acer Swift Go 14 SFG14-71 | |
| HP Pavilion Plus 14-ew0153TU | |
| AIDA64 / CPU PhotoWorxx | |
| Media della classe Subnotebook (6569 - 85600, n=58, ultimi 2 anni) | |
| Media Intel Core Ultra 7 155H (32719 - 54223, n=50) | |
| Acer Swift Go 14 SFG14-72 | |
| LG Gram 2in1 16 16T90R - G.AA78G | |
| Lenovo ThinkPad T14 G4 21K4S02000 | |
| HP Pavilion Plus 14-ew0153TU | |
| Acer Swift Go 14 SFG14-71 | |
| HP Pavilion Plus 14-ey0095cl | |
| Ayaneo Air 1S Retro Power | |
Prestazioni del sistema
Secondo Intel, la nuova iGPU Arc è la principale responsabile dei miglioramenti significativi delle prestazioni grafiche. Questo diventa chiaro non appena diamo un'occhiata alla sezione di creazione di contenuti digitali in PCMark 10. In quest'area, lo Swift Go 14 e la sua iGPU Arc sono impressionanti. Nel complesso, le prestazioni di sistema dell'Acer Swift Go 14 sono molto più elevate rispetto al suo predecessore e alla maggior parte dei dispositivi di confronto. Ciò significa che abbiamo a che fare con un dispositivo potente, che non ha motivo di tirarsi indietro nemmeno di fronte alle applicazioni 3D.
CrossMark: Overall | Productivity | Creativity | Responsiveness
WebXPRT 3: Overall
WebXPRT 4: Overall
Mozilla Kraken 1.1: Total
| PCMark 10 / Score | |
| Media della classe Subnotebook (4920 - 9939, n=45, ultimi 2 anni) | |
| Lenovo ThinkPad T14 G4 21K4S02000 | |
| Media Intel Core Ultra 7 155H, Intel Arc 8-Core iGPU (4809 - 7529, n=34) | |
| Acer Swift Go 14 SFG14-72 | |
| HP Pavilion Plus 14-ey0095cl | |
| Ayaneo Air 1S Retro Power | |
| LG Gram 2in1 16 16T90R - G.AA78G | |
| HP Pavilion Plus 14-ew0153TU | |
| Acer Swift Go 14 SFG14-71 | |
| PCMark 10 / Essentials | |
| LG Gram 2in1 16 16T90R - G.AA78G | |
| Lenovo ThinkPad T14 G4 21K4S02000 | |
| Media Intel Core Ultra 7 155H, Intel Arc 8-Core iGPU (7605 - 11289, n=34) | |
| Media della classe Subnotebook (8552 - 11646, n=45, ultimi 2 anni) | |
| Acer Swift Go 14 SFG14-72 | |
| HP Pavilion Plus 14-ew0153TU | |
| Acer Swift Go 14 SFG14-71 | |
| HP Pavilion Plus 14-ey0095cl | |
| Ayaneo Air 1S Retro Power | |
| PCMark 10 / Productivity | |
| Lenovo ThinkPad T14 G4 21K4S02000 | |
| Media della classe Subnotebook (5435 - 16606, n=45, ultimi 2 anni) | |
| HP Pavilion Plus 14-ey0095cl | |
| Media Intel Core Ultra 7 155H, Intel Arc 8-Core iGPU (6042 - 10591, n=34) | |
| Acer Swift Go 14 SFG14-72 | |
| Ayaneo Air 1S Retro Power | |
| Acer Swift Go 14 SFG14-71 | |
| HP Pavilion Plus 14-ew0153TU | |
| LG Gram 2in1 16 16T90R - G.AA78G | |
| PCMark 10 / Digital Content Creation | |
| Media della classe Subnotebook (5722 - 13779, n=45, ultimi 2 anni) | |
| Acer Swift Go 14 SFG14-72 | |
| Media Intel Core Ultra 7 155H, Intel Arc 8-Core iGPU (4985 - 10709, n=34) | |
| Lenovo ThinkPad T14 G4 21K4S02000 | |
| HP Pavilion Plus 14-ey0095cl | |
| Ayaneo Air 1S Retro Power | |
| LG Gram 2in1 16 16T90R - G.AA78G | |
| HP Pavilion Plus 14-ew0153TU | |
| Acer Swift Go 14 SFG14-71 | |
| CrossMark / Overall | |
| Lenovo ThinkPad T14 G4 21K4S02000 | |
| Media della classe Subnotebook (365 - 2356, n=60, ultimi 2 anni) | |
| Media Intel Core Ultra 7 155H, Intel Arc 8-Core iGPU (1366 - 1903, n=34) | |
| Acer Swift Go 14 SFG14-72 | |
| HP Pavilion Plus 14-ew0153TU | |
| LG Gram 2in1 16 16T90R - G.AA78G | |
| HP Pavilion Plus 14-ey0095cl | |
| Acer Swift Go 14 SFG14-71 | |
| Ayaneo Air 1S Retro Power | |
| CrossMark / Productivity | |
| Lenovo ThinkPad T14 G4 21K4S02000 | |
| Media Intel Core Ultra 7 155H, Intel Arc 8-Core iGPU (1291 - 1798, n=33) | |
| Media della classe Subnotebook (364 - 2277, n=60, ultimi 2 anni) | |
| HP Pavilion Plus 14-ew0153TU | |
| HP Pavilion Plus 14-ey0095cl | |
| Acer Swift Go 14 SFG14-72 | |
| LG Gram 2in1 16 16T90R - G.AA78G | |
| Acer Swift Go 14 SFG14-71 | |
| Ayaneo Air 1S Retro Power | |
| CrossMark / Creativity | |
| Media della classe Subnotebook (372 - 2743, n=60, ultimi 2 anni) | |
| Lenovo ThinkPad T14 G4 21K4S02000 | |
| Media Intel Core Ultra 7 155H, Intel Arc 8-Core iGPU (1519 - 1929, n=33) | |
| Acer Swift Go 14 SFG14-72 | |
| HP Pavilion Plus 14-ey0095cl | |
| HP Pavilion Plus 14-ew0153TU | |
| LG Gram 2in1 16 16T90R - G.AA78G | |
| Acer Swift Go 14 SFG14-71 | |
| Ayaneo Air 1S Retro Power | |
| CrossMark / Responsiveness | |
| LG Gram 2in1 16 16T90R - G.AA78G | |
| Acer Swift Go 14 SFG14-71 | |
| Media Intel Core Ultra 7 155H, Intel Arc 8-Core iGPU (939 - 1802, n=33) | |
| Lenovo ThinkPad T14 G4 21K4S02000 | |
| Acer Swift Go 14 SFG14-72 | |
| Media della classe Subnotebook (312 - 1854, n=60, ultimi 2 anni) | |
| HP Pavilion Plus 14-ew0153TU | |
| HP Pavilion Plus 14-ey0095cl | |
| Ayaneo Air 1S Retro Power | |
| WebXPRT 3 / Overall | |
| Media della classe Subnotebook (156 - 530, n=56, ultimi 2 anni) | |
| Lenovo ThinkPad T14 G4 21K4S02000 | |
| HP Pavilion Plus 14-ey0095cl | |
| Acer Swift Go 14 SFG14-72 | |
| Media Intel Core Ultra 7 155H, Intel Arc 8-Core iGPU (252 - 299, n=34) | |
| HP Pavilion Plus 14-ew0153TU | |
| LG Gram 2in1 16 16T90R - G.AA78G | |
| Acer Swift Go 14 SFG14-71 | |
| Ayaneo Air 1S Retro Power | |
| WebXPRT 4 / Overall | |
| Media della classe Subnotebook (132 - 378, n=61, ultimi 2 anni) | |
| HP Pavilion Plus 14-ew0153TU | |
| Media Intel Core Ultra 7 155H, Intel Arc 8-Core iGPU (166.4 - 309, n=29) | |
| HP Pavilion Plus 14-ey0095cl | |
| Ayaneo Air 1S Retro Power | |
| Mozilla Kraken 1.1 / Total | |
| LG Gram 2in1 16 16T90R - G.AA78G | |
| HP Pavilion Plus 14-ey0095cl | |
| Acer Swift Go 14 SFG14-71 | |
| Acer Swift Go 14 SFG14-71 | |
| Media Intel Core Ultra 7 155H, Intel Arc 8-Core iGPU (517 - 614, n=35) | |
| Acer Swift Go 14 SFG14-72 | |
| Lenovo ThinkPad T14 G4 21K4S02000 | |
| Ayaneo Air 1S Retro Power | |
| HP Pavilion Plus 14-ew0153TU | |
| Media della classe Subnotebook (234 - 1104, n=61, ultimi 2 anni) | |
* ... Meglio usare valori piccoli
| PCMark 10 Score | 6625 punti | |
Aiuto | ||
| AIDA64 / Memory Copy | |
| Media della classe Subnotebook (14554 - 131023, n=58, ultimi 2 anni) | |
| Media Intel Core Ultra 7 155H (62397 - 96791, n=50) | |
| Acer Swift Go 14 SFG14-72 | |
| AIDA64 / Memory Read | |
| Media della classe Subnotebook (15948 - 127174, n=58, ultimi 2 anni) | |
| Media Intel Core Ultra 7 155H (60544 - 90647, n=50) | |
| Acer Swift Go 14 SFG14-72 | |
| AIDA64 / Memory Write | |
| Media della classe Subnotebook (15709 - 135141, n=58, ultimi 2 anni) | |
| Acer Swift Go 14 SFG14-72 | |
| Media Intel Core Ultra 7 155H (58692 - 93451, n=50) | |
| AIDA64 / Memory Latency | |
| Acer Swift Go 14 SFG14-72 | |
| Media Intel Core Ultra 7 155H (116.2 - 233, n=50) | |
| Media della classe Subnotebook (6.1 - 159.9, n=56, ultimi 2 anni) | |
* ... Meglio usare valori piccoli
Memoria di massa
Nella Swift Go 14, una nuova SSD NVMe di SK Hynix fa il suo lavoro e riesce a raggiungere velocità di trasferimento da medie a elevate in ogni benchmark. Nel ciclo DiskSpd, in cui si analizzano le prestazioni dello storage per un periodo più lungo, la velocità di lettura scende leggermente.

* ... Meglio usare valori piccoli
Continuous Performance Read: DiskSpd Read Loop, Queue Depth 8
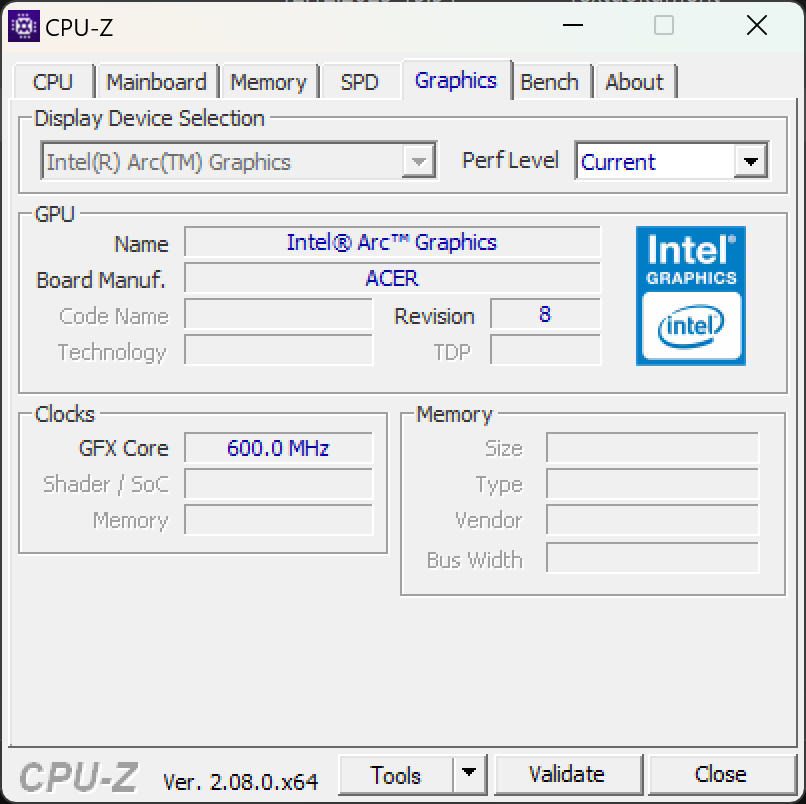
Scheda grafica
Secondo Intel, le prestazioni grafiche del nuovo processore per laptop sarebbero doppie rispetto a quelle della 13esima generazione. In ogni caso, i nostri primi benchmark confermano prestazioni molto elevate con l'iGPU Arc a otto core arc iGPU a otto core è riuscita persino a battere in modo convincente la AMD Radeon 780M. Le GPU dedicate di Intel per i computer portatili non sono all'altezza nella nostra analisi. Anche tralasciando le prestazioni 3D, le prestazioni dell'iGPU di Acer Swift Go sono sorprendentemente elevate.
| 3DMark 06 Standard Score | punti | |
| 3DMark Vantage P Result | 43185 punti | |
| 3DMark 11 Performance | 13075 punti | |
| 3DMark Ice Storm Standard Score | 157591 punti | |
| 3DMark Cloud Gate Standard Score | 29783 punti | |
| 3DMark Fire Strike Score | 8314 punti | |
| 3DMark Time Spy Score | 3471 punti | |
Aiuto | ||
* ... Meglio usare valori piccoli
Prestazioni di gioco
Con la sua grafica notevolmente migliorata, il Intel Core Ultra 7 155H convince quando si gioca, a patto che non si esageri con le impostazioni di qualità o la risoluzione. I giochi Full HD a qualità media o alta sono giocabili a oltre 60fps, nella maggior parte dei giochi che abbiamo testato. Ciò significa che potrebbe fare a meno del tipo di dGPU presente in molti computer portatili, come la GeForce RTX 2050 o la Arc 530M.
| The Witcher 3 - 1920x1080 Ultra Graphics & Postprocessing (HBAO+) | |
| Ayaneo Air 1S Retro Power | |
| HP Pavilion Plus 14-ey0095cl | |
| Lenovo ThinkPad T14 G4 21K4S02000 | |
| Media della classe Subnotebook (13.9 - 34.6, n=13, ultimi 2 anni) | |
| Acer Swift Go 14 SFG14-72 | |
| LG Gram 2in1 16 16T90R - G.AA78G | |
| HP Pavilion Plus 14-ew0153TU | |
| Acer Swift Go 14 SFG14-71 | |
Il quasi raddoppio delle prestazioni grafiche diventa evidente quando si osservano i tassi di frame in The Witcher 3 con impostazioni di ultra-qualità. Lo Swift Go 14 offre quasi il doppio dei fotogrammi al secondo rispetto allo Schenker Vision 14.
Witcher 3 FPS diagram
| basso | medio | alto | ultra | QHD | |
|---|---|---|---|---|---|
| GTA V (2015) | 124.1 | 120.8 | 34.8 | 13.1 | |
| The Witcher 3 (2015) | 23.3 | ||||
| Dota 2 Reborn (2015) | 99.4 | 90.4 | 76 | 73.4 | |
| Final Fantasy XV Benchmark (2018) | 42.8 | 32.1 | 18.2 | 14 | |
| X-Plane 11.11 (2018) | 54.5 | 42.5 | 36.1 | ||
| Far Cry 5 (2018) | 35 | 33 | |||
| Strange Brigade (2018) | 141.9 | 60.6 | 52 | 43.2 | |
| Horizon Zero Dawn (2020) | 33 | 28 () | 26 | ||
| Dying Light 2 (2022) | 31.1 | 29.9 | |||
| Hogwarts Legacy (2023) | 25.7 | 19.3 | 15.6 | ||
| F1 23 (2023) | 64.6 | 59 | 35.9 | 12.2 | |
| Ratchet & Clank Rift Apart (2023) | 28.4 | 29 | 25.9 | 21.1 | |
| Starfield (2023) | 11.5 | ||||
| Baldur's Gate 3 (2023) | 22.8 | 20.6 | 19.1 | ||
| Cyberpunk 2077 (2023) | 34.1 | 29.6 | 24 | 13.1 | |
| EA Sports WRC (2023) | 35.8 | 26.6 | 24.7 | 22.4 |
Prestazioni della NPU
All'interno dell'Intel Core Ultra 7 155H si trova un'unità di elaborazione neurale. Questa parte del processore ha il compito di elaborare le applicazioni AI in modo molto efficiente. Ciò significa che modelli come la Diffusione Stabile o i modelli linguistici possono già essere eseguiti sul dispositivo. Utilizzando il benchmark UL Procyon AI Interface, abbiamo messo la GPU testa a testa con la NPU e contemporaneamente abbiamo verificato il consumo energetico. In entrambi gli scenari, è apparso subito chiaro che le prestazioni della NPU erano solo leggermente inferiori a quelle della iGPU Arc quando si trattava di elaborare reti neurali, ma i requisiti energetici erano quasi dimezzati. Questo rende sicuramente l'acceleratore AI più efficiente del chip grafico per le stesse applicazioni.
Pertanto, è possibile che molte delle applicazioni AI che attualmente vengono eseguite tramite il cloud possano presto essere eseguite localmente sul laptop stesso, in modo efficiente dal punto di vista energetico, senza la necessità di una connessione a Internet.
Power consumption UL Procyon Ai Inference benchmark on an external monitor
| UL Procyon for Windows | |
| Acer Swift Go 14 SFG14-72 | |
| Overall Score Integer NPU | |
| Overall Score Integer GPU | |
Intel ci ha gentilmente fornito una versione di Gimp che include già Diffusione Stabile con OpenVINO e supporto NPU. Dopo una lunga configurazione, il programma testo-immagine ha funzionato in modo sorprendentemente rapido. Finora era possibile eseguire Stable Diffusion su schede grafiche Arc.


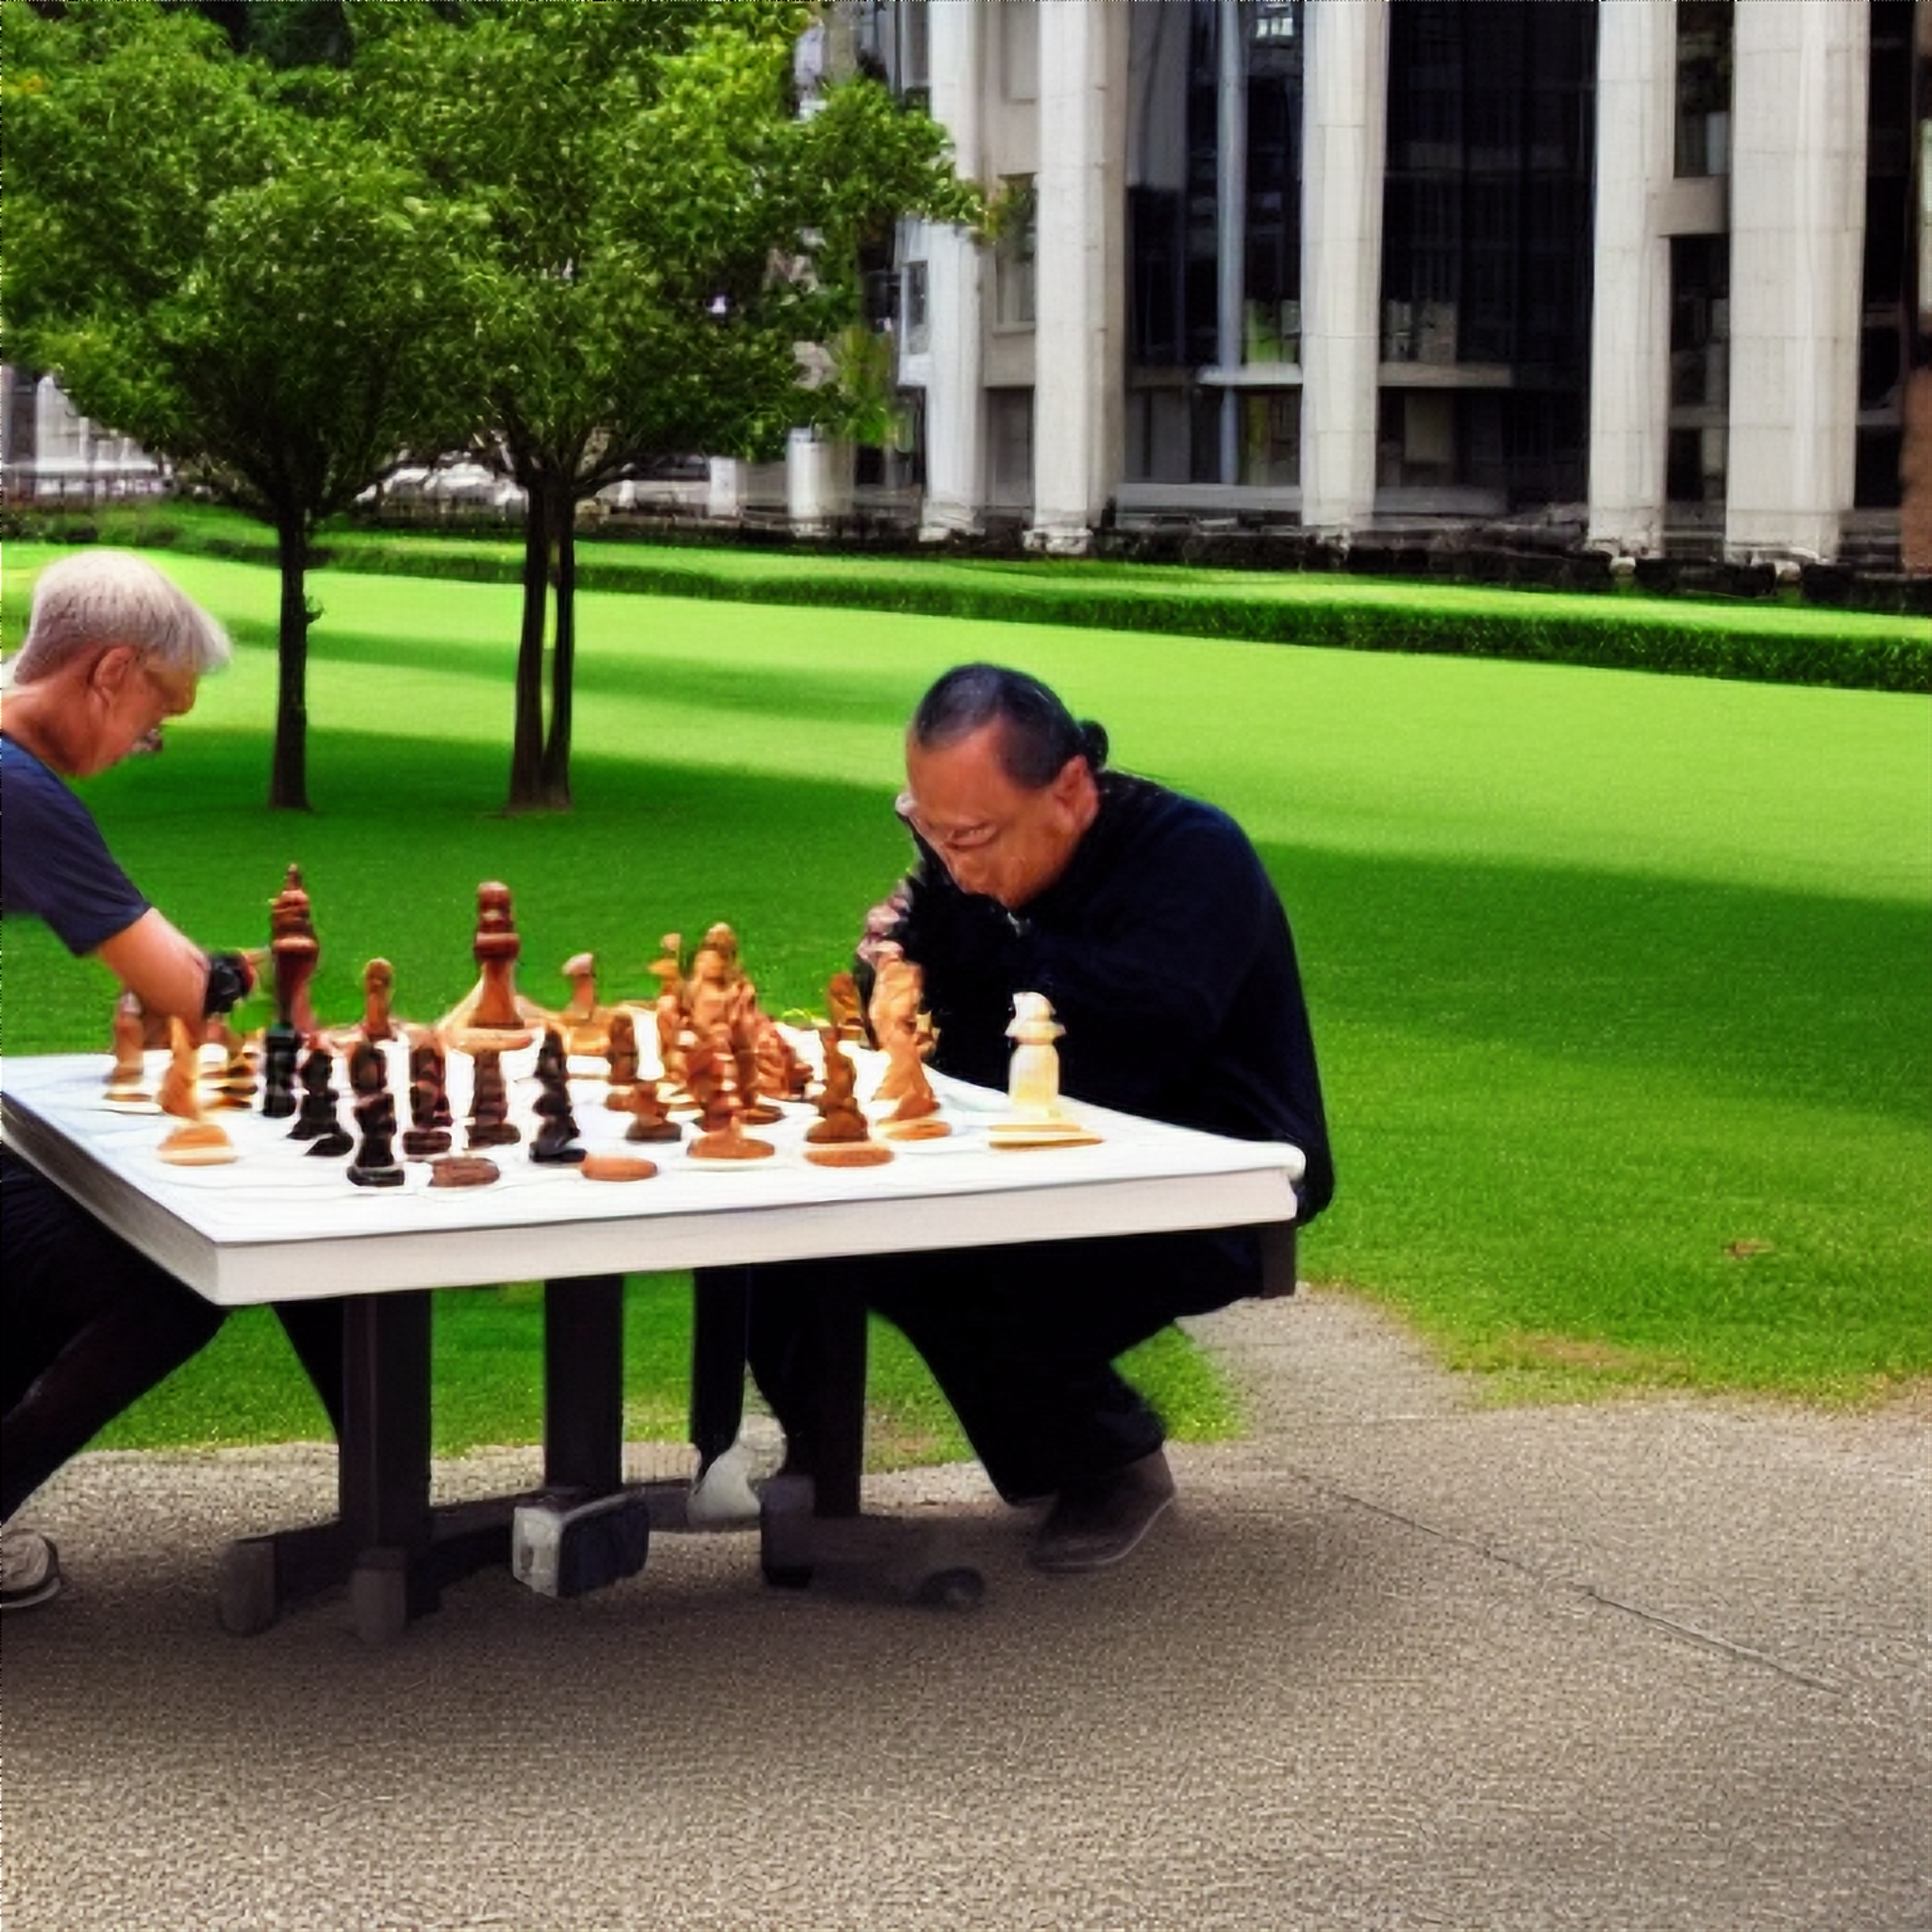

Certo, non tutte le immagini create dalla rete neurale sono particolarmente utilizzabili. La Diffusione Stabile ha solo una capacità limitata di gestire volti, piedi e mani, visti da lontano. Ma anche i compiti che lei ha impostato per il programma devono essere definiti il più chiaramente possibile. È necessaria una certa esperienza in questo settore per assicurarsi di ottenere ciò che ha chiesto.
Emissioni - Rimane per lo più silenzioso
Emissioni di rumore
Nonostante le prestazioni di alto livello, il nuovo Acer Swift Go non è diventato più rumoroso. Con quasi 45 dB(A) a pieno carico, non si può dire che sia silenzioso, ma è tollerabile. L'Acer Swift Go gestisce le attività di piccole e medie dimensioni di solito senza la presenza udibile della ventola.
Rumorosità
| Idle |
| 25 / 25 / 26.2 dB(A) |
| Sotto carico |
| 35.7 / 45.5 dB(A) |
 | ||
30 dB silenzioso 40 dB(A) udibile 50 dB(A) rumoroso |
||
min: | ||
| Acer Swift Go 14 SFG14-72 Arc 8-Core, Ultra 7 155H, SK hynix HFS001TEJ9X110NA | Acer Swift Go 14 SFG14-71 Iris Xe G7 80EUs, i5-1335U, WD PC SN740 SDDQNQD-512G-1014 | LG Gram 2in1 16 16T90R - G.AA78G Iris Xe G7 96EUs, i7-1360P, Samsung PM9A1 MZVL21T0HCLR | HP Pavilion Plus 14-ew0153TU Iris Xe G7 96EUs, i7-1355U, SK hynix PC801 HFS001TEJ9X101N | Lenovo ThinkPad T14 G4 21K4S02000 Radeon 780M, R7 PRO 7840U, Samsung PM9A1a MZVL21T0HDLU | Ayaneo Air 1S Retro Power Radeon 780M, R7 7840U, Ayaneo CyberThunder-2TB | HP Pavilion Plus 14-ey0095cl Radeon 780M, R7 7840U, WDC PC SN810 1TB | |
|---|---|---|---|---|---|---|---|
| Noise | 4% | 5% | 20% | 14% | 3% | 6% | |
| off /ambiente * (dB) | 25 | 24.9 -0% | 25.1 -0% | 19.35 23% | 23.1 8% | 23 8% | 23.4 6% |
| Idle Minimum * (dB) | 25 | 24.9 -0% | 25.1 -0% | 20.57 18% | 23.1 8% | 24.7 1% | 24.1 4% |
| Idle Average * (dB) | 25 | 24.9 -0% | 25.1 -0% | 20.57 18% | 23.1 8% | 25.2 -1% | 24.1 4% |
| Idle Maximum * (dB) | 26.2 | 24.9 5% | 26.1 -0% | 20.57 21% | 23.1 12% | 25.2 4% | 25.3 3% |
| Load Average * (dB) | 35.7 | 31.9 11% | 31.4 12% | 32.18 10% | 26.5 26% | 32.1 10% | 33.4 6% |
| Load Maximum * (dB) | 45.5 | 43.2 5% | 36.6 20% | 32.26 29% | 35.78 21% | 47.1 -4% | 39.4 13% |
| Witcher 3 ultra * (dB) | 43.2 | 41.1 | 29.44 | 35.7 | 39.4 |
* ... Meglio usare valori piccoli
Temperatura
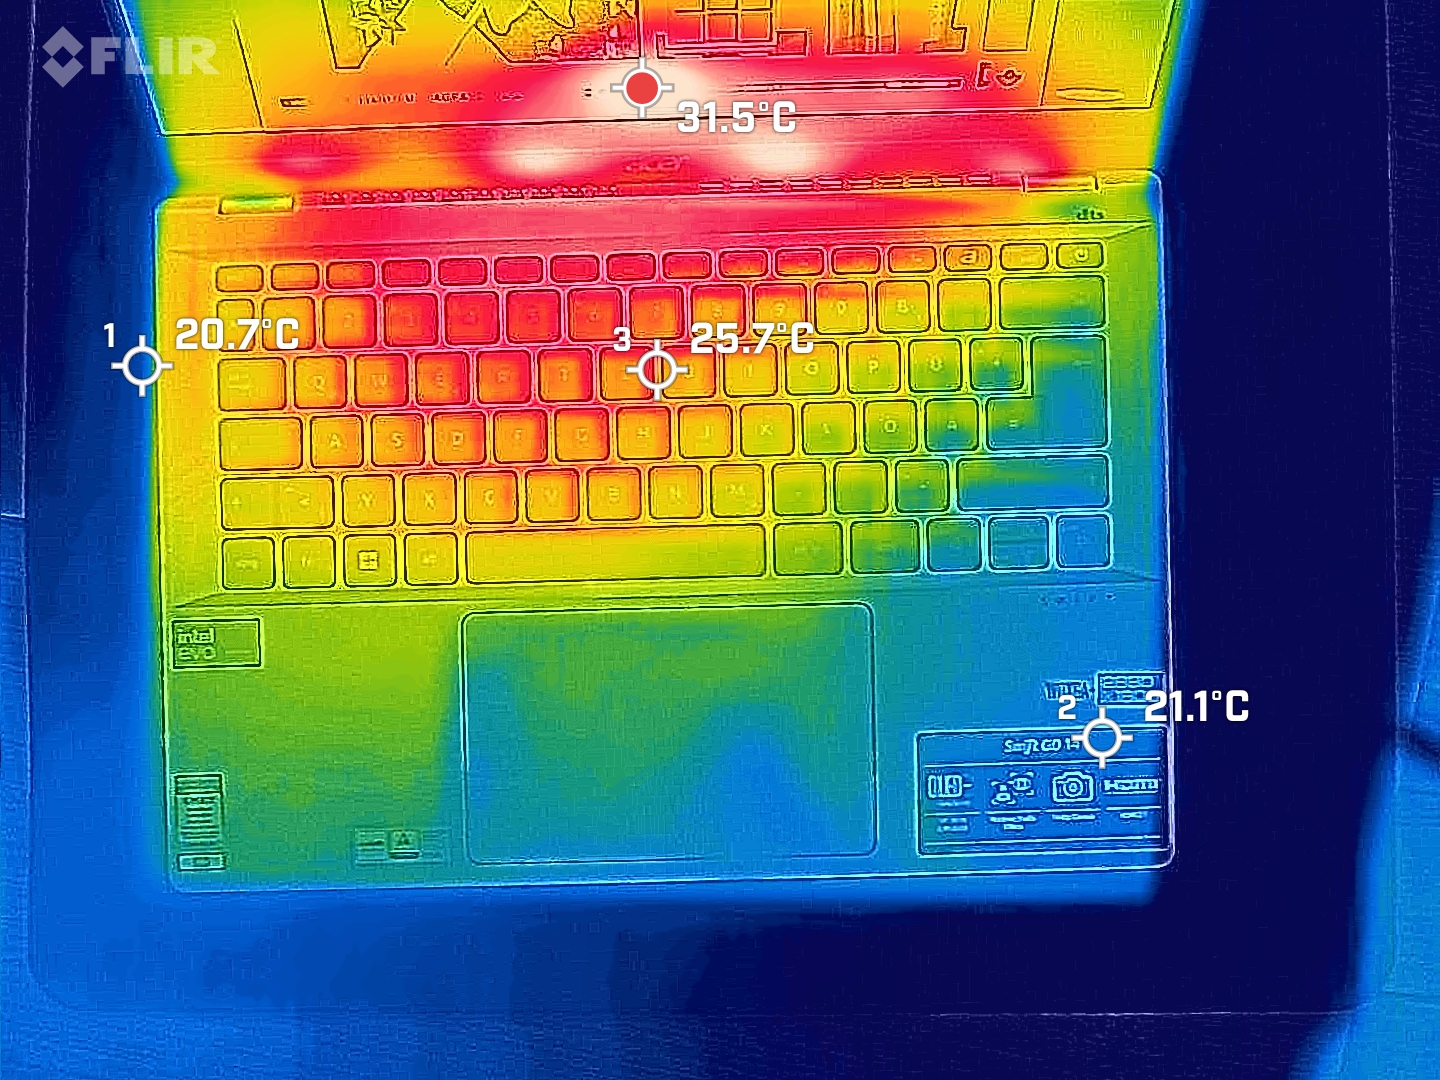
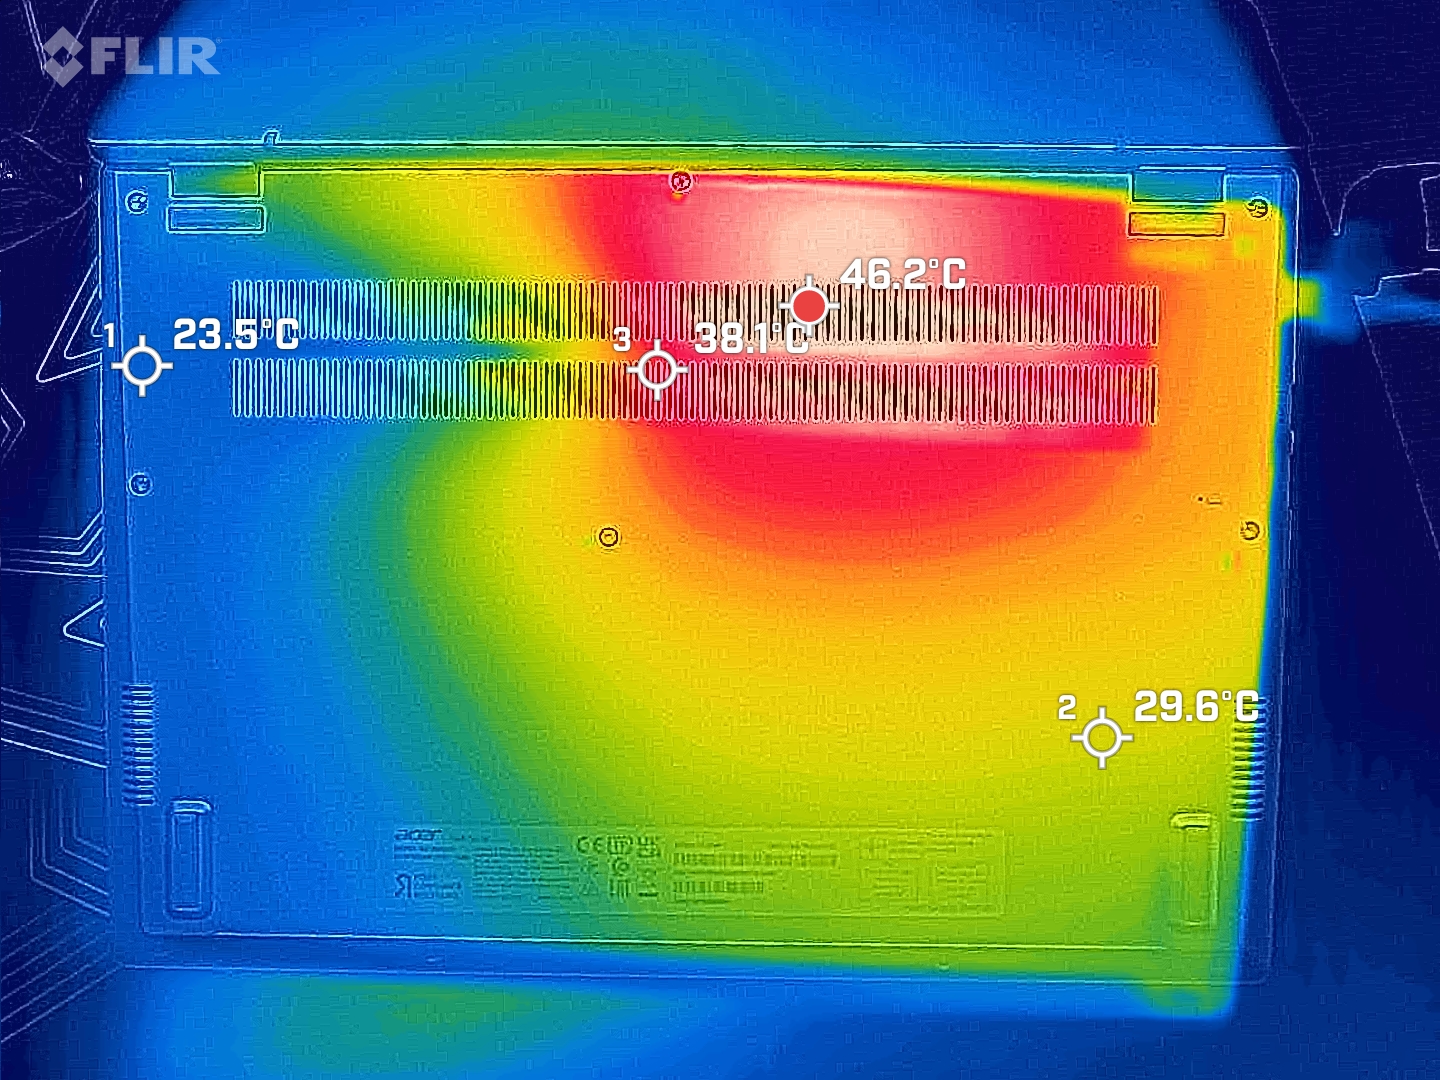
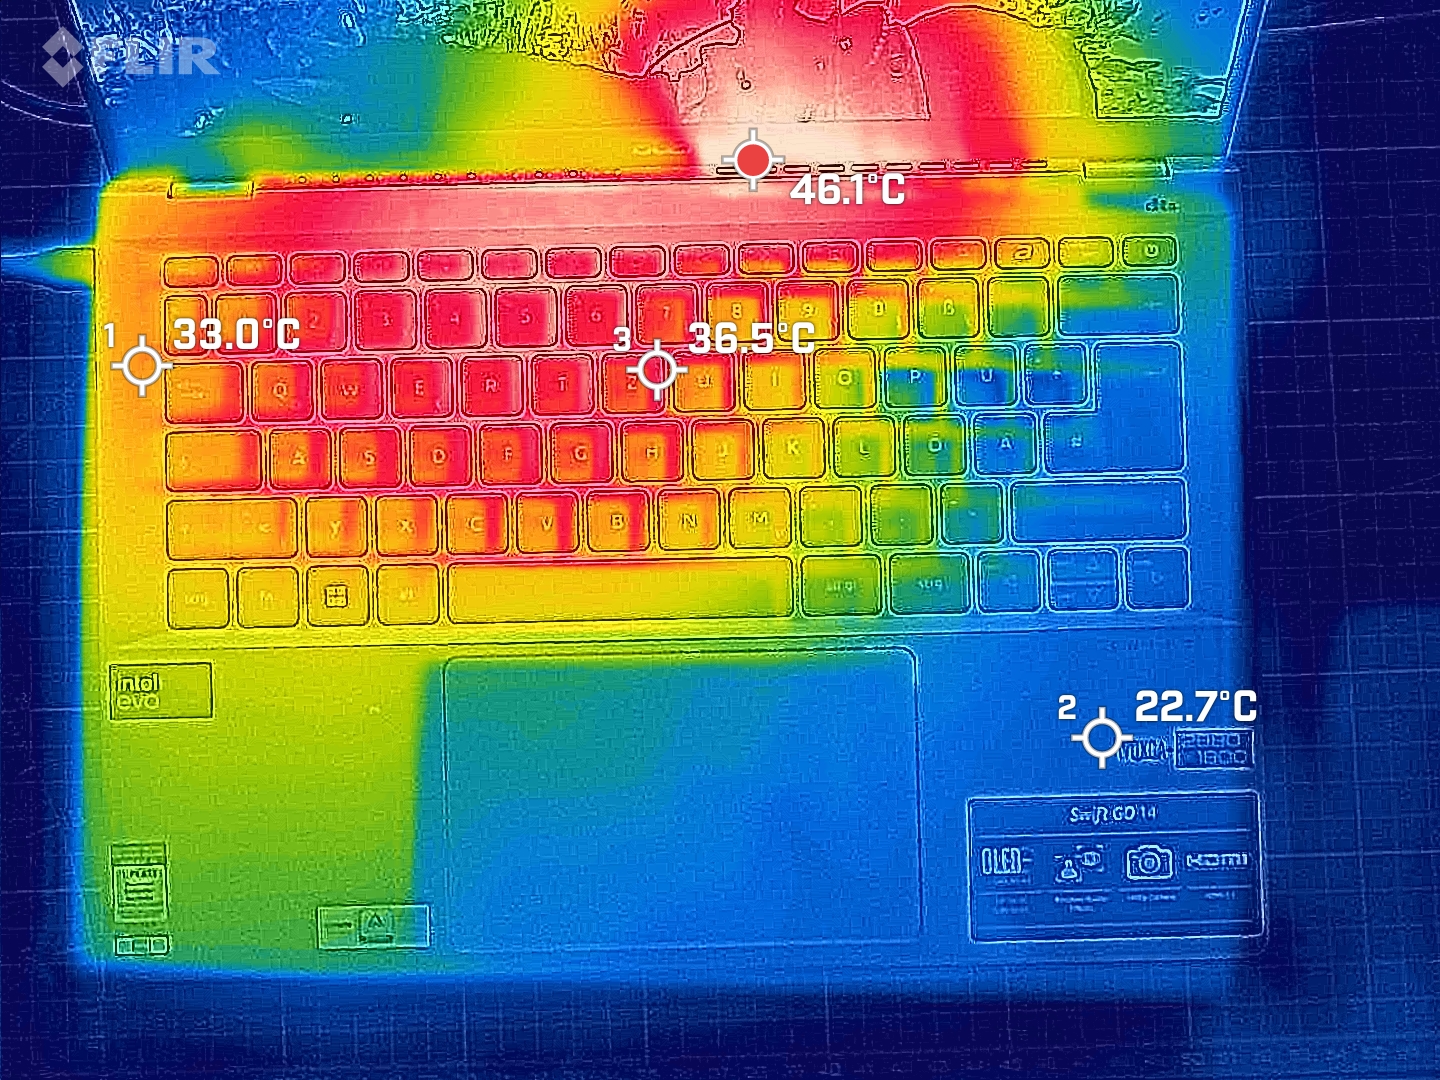
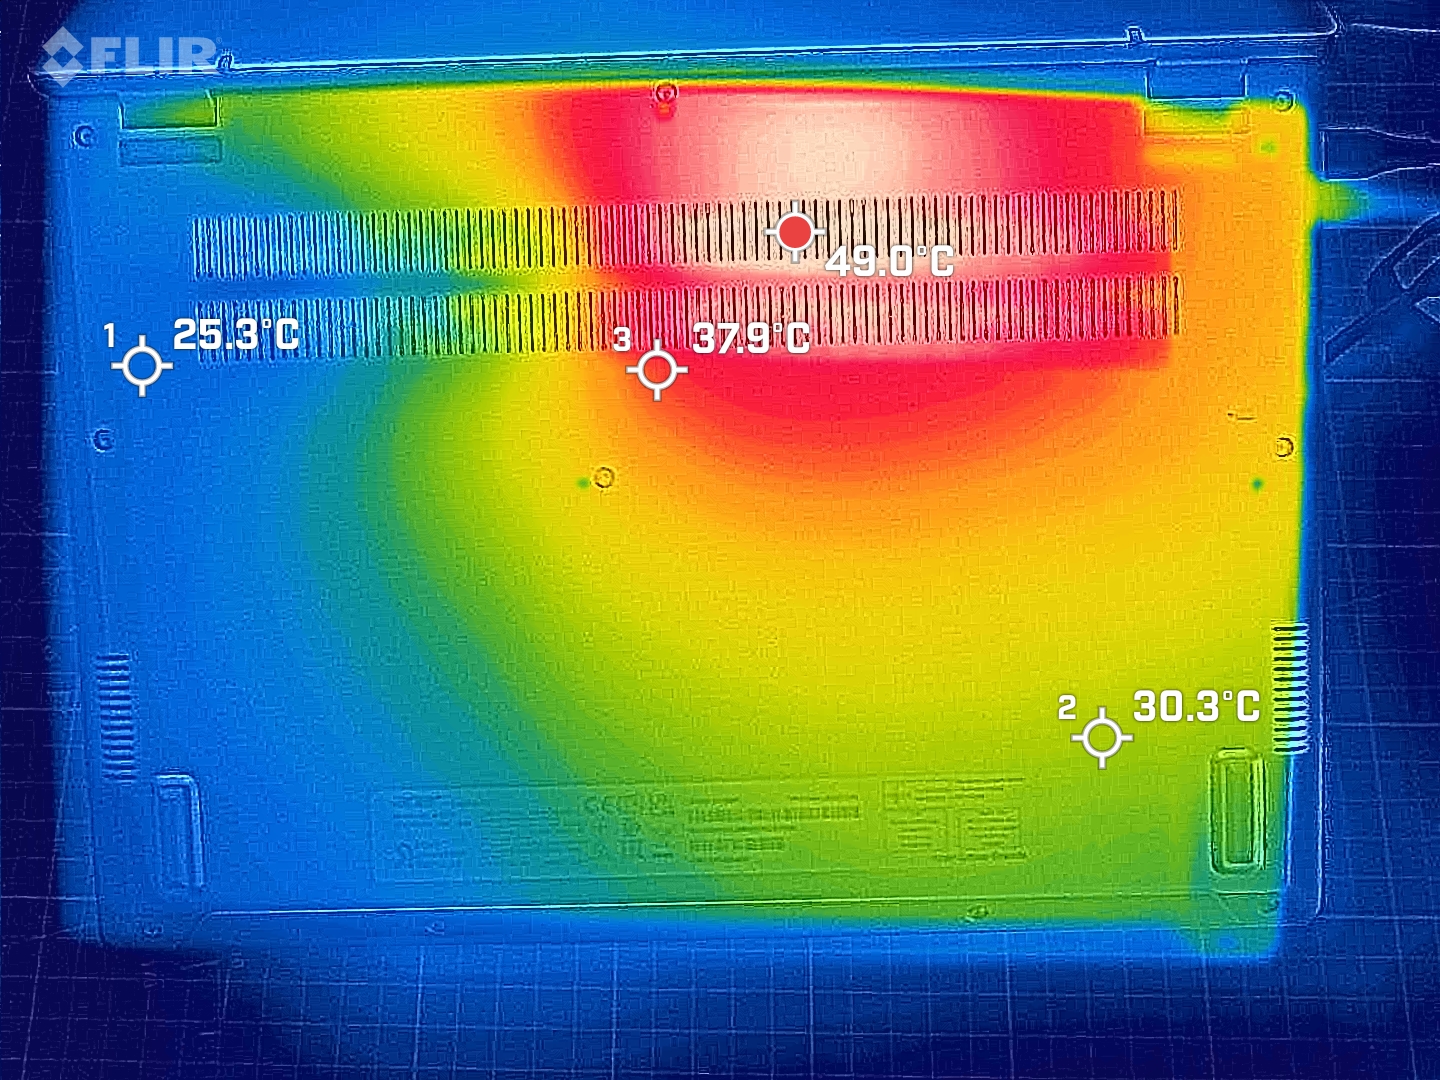
Purtroppo, ciò che non è cambiato sono le temperature superficiali molto elevate del portatile, che abbiamo misurato durante i test. La barra dietro la tastiera è riuscita addirittura a raggiungere i 40 °C. Tuttavia, l'area che si riscalda di più è lo schermo, sul quale viene indirizzata l'aria espulsa dalla ventola. Ciononostante, in condizioni normali di funzionamento, quando naviga in Internet o utilizza le applicazioni da ufficio, la superficie del portatile si riscalda solo un po' più della temperatura ambiente.
(+) La temperatura massima sul lato superiore è di 36.5 °C / 98 F, rispetto alla media di 35.9 °C / 97 F, che varia da 21.4 a 59 °C per questa classe Subnotebook.
(-) Il lato inferiore si riscalda fino ad un massimo di 49.5 °C / 121 F, rispetto alla media di 39.2 °C / 103 F
(+) In idle, la temperatura media del lato superiore è di 22.6 °C / 73 F, rispetto alla media deld ispositivo di 30.8 °C / 87 F.
(+) I poggiapolsi e il touchpad sono piu' freddi della temperatura della pelle con un massimo di 26.2 °C / 79.2 F e sono quindi freddi al tatto.
(±) La temperatura media della zona del palmo della mano di dispositivi simili e'stata di 28.2 °C / 82.8 F (+2 °C / 3.6 F).
| Acer Swift Go 14 SFG14-72 Intel Core Ultra 7 155H, Intel Arc 8-Core iGPU | Acer Swift Go 14 SFG14-71 Intel Core i5-1335U, Intel Iris Xe Graphics G7 80EUs | LG Gram 2in1 16 16T90R - G.AA78G Intel Core i7-1360P, Intel Iris Xe Graphics G7 96EUs | HP Pavilion Plus 14-ew0153TU Intel Core i7-1355U, Intel Iris Xe Graphics G7 96EUs | Lenovo ThinkPad T14 G4 21K4S02000 AMD Ryzen 7 PRO 7840U, AMD Radeon 780M | Ayaneo Air 1S Retro Power AMD Ryzen 7 7840U, AMD Radeon 780M | HP Pavilion Plus 14-ey0095cl AMD Ryzen 7 7840U, AMD Radeon 780M | |
|---|---|---|---|---|---|---|---|
| Heat | -2% | -22% | 4% | 3% | -30% | 12% | |
| Maximum Upper Side * (°C) | 36.5 | 44.8 -23% | 55 -51% | 36.6 -0% | 43.5 -19% | 55 -51% | 39 -7% |
| Maximum Bottom * (°C) | 49.5 | 34.8 30% | 55.4 -12% | 37.2 25% | 47.4 4% | 53.2 -7% | 35.8 28% |
| Idle Upper Side * (°C) | 25.5 | 30.7 -20% | 34.9 -37% | 31.6 -24% | 24.9 2% | 37.1 -45% | 25.2 1% |
| Idle Bottom * (°C) | 35 | 32.5 7% | 30 14% | 30 14% | 26 26% | 40.1 -15% | 25.6 27% |
* ... Meglio usare valori piccoli
Test da sforzo
Come già detto, abbiamo impostato le prestazioni boost del processore a un livello leggermente inferiore al valore impostato da Acer. Il nostro stress test ha rivelato che l'impostazione delle prestazioni continue del Core Ultra 7 (PL1) è un po' troppo alta. Dopo un po', si assesta a circa 43 watt invece di 45, ma riesce a mantenere il livello di prestazioni a lungo termine.
Altoparlanti
Nel complesso, gli altoparlanti dell'Acer Swift Go hanno un buon suono. Solo i bassi potrebbero essere un po' più incisivi. Non siamo stati in grado di distinguere una differenza rispetto al predecessore.
Acer Swift Go 14 SFG14-72 analisi audio
(+) | gli altoparlanti sono relativamente potenti (86.7 dB)
Bassi 100 - 315 Hz
(-) | quasi nessun basso - in media 29.6% inferiori alla media
(±) | la linearità dei bassi è media (13.8% delta rispetto alla precedente frequenza)
Medi 400 - 2000 Hz
(±) | medi elevati - circa 6.4% superiore alla media
(+) | medi lineari (5.4% delta rispetto alla precedente frequenza)
Alti 2 - 16 kHz
(±) | alti elevati - circa 5.7% superiori alla media
(±) | la linearità degli alti è media (7.4% delta rispetto alla precedente frequenza)
Nel complesso 100 - 16.000 Hz
(±) | la linearità complessiva del suono è media (22.6% di differenza rispetto alla media
Rispetto alla stessa classe
» 77% di tutti i dispositivi testati in questa classe è stato migliore, 4% simile, 18% peggiore
» Il migliore ha avuto un delta di 5%, medio di 18%, peggiore di 53%
Rispetto a tutti i dispositivi testati
» 67% di tutti i dispositivi testati in questa classe è stato migliore, 6% similare, 28% peggiore
» Il migliore ha avuto un delta di 4%, medio di 23%, peggiore di 134%
Acer Swift Go 14 SFG14-71 analisi audio
(+) | gli altoparlanti sono relativamente potenti (82.1 dB)
Bassi 100 - 315 Hz
(-) | quasi nessun basso - in media 29.2% inferiori alla media
(±) | la linearità dei bassi è media (11.1% delta rispetto alla precedente frequenza)
Medi 400 - 2000 Hz
(+) | medi bilanciati - solo only 3.9% rispetto alla media
(+) | medi lineari (6.5% delta rispetto alla precedente frequenza)
Alti 2 - 16 kHz
(+) | Alti bilanciati - appena 2.1% dalla media
(+) | alti lineari (5% delta rispetto alla precedente frequenza)
Nel complesso 100 - 16.000 Hz
(±) | la linearità complessiva del suono è media (20.4% di differenza rispetto alla media
Rispetto alla stessa classe
» 45% di tutti i dispositivi testati in questa classe è stato migliore, 10% simile, 45% peggiore
» Il migliore ha avuto un delta di 7%, medio di 21%, peggiore di 53%
Rispetto a tutti i dispositivi testati
» 54% di tutti i dispositivi testati in questa classe è stato migliore, 8% similare, 38% peggiore
» Il migliore ha avuto un delta di 4%, medio di 23%, peggiore di 134%
Gestione dell'energia - Meteor Lake può essere economico
Consumo di energia
Si dice che i nuovi processori Meteor Lake di Intel siano significativamente più efficienti dal punto di vista energetico rispetto al suo predecessore. Questo non era del tutto evidente nei nostri test, ma, ancora una volta, questo evidenzia lo stato di beta del software installato. Sono evidenti forti fluttuazioni in quasi tutte le misurazioni energetiche, il che indica picchi di carico più ridotti.
| Off / Standby | |
| Idle | |
| Sotto carico |
|
Leggenda:
min: | |
| Acer Swift Go 14 SFG14-72 Ultra 7 155H, Arc 8-Core, SK hynix HFS001TEJ9X110NA, OLED, 2880x1800, 14" | LG Gram 2in1 16 16T90R - G.AA78G i7-1360P, Iris Xe G7 96EUs, Samsung PM9A1 MZVL21T0HCLR, IPS, 2560x1600, 16" | HP Pavilion Plus 14-ew0153TU i7-1355U, Iris Xe G7 96EUs, SK hynix PC801 HFS001TEJ9X101N, OLED, 2880x1800, 14" | Lenovo ThinkPad T14 G4 21K4S02000 R7 PRO 7840U, Radeon 780M, Samsung PM9A1a MZVL21T0HDLU, IPS LED, 1920x1200, 14" | Ayaneo Air 1S Retro Power R7 7840U, Radeon 780M, Ayaneo CyberThunder-2TB, OLED, 1920x1080, 5.5" | HP Pavilion Plus 14-ey0095cl R7 7840U, Radeon 780M, WDC PC SN810 1TB, OLED, 2880x1800, 14" | Media Intel Arc 8-Core iGPU | Media della classe Subnotebook | |
|---|---|---|---|---|---|---|---|---|
| Power Consumption | 9% | 14% | 38% | 22% | 15% | 3% | 29% | |
| Idle Minimum * (Watt) | 5.5 | 5.5 -0% | 6.7 -22% | 3.3 40% | 7.01 -27% | 6 -9% | 5.31 ? 3% | 3.76 ? 32% |
| Idle Average * (Watt) | 10.1 | 7.2 29% | 7.16 29% | 5.6 45% | 7.91 22% | 6.5 36% | 8.56 ? 15% | 6.54 ? 35% |
| Idle Maximum * (Watt) | 11.2 | 12.9 -15% | 11.17 -0% | 6.1 46% | 12.3 -10% | 13.9 -24% | 11.9 ? -6% | 7.89 ? 30% |
| Load Average * (Watt) | 45.9 | 55 -20% | 46.5 -1% | 40.1 13% | 19.66 57% | 41.9 9% | 53.6 ? -17% | 42 ? 8% |
| Witcher 3 ultra * (Watt) | 60.9 | 47 23% | 37.2 39% | 41.4 32% | 38.2 37% | 43.9 28% | ||
| Load Maximum * (Watt) | 104.1 | 63.6 39% | 64.36 38% | 51.8 50% | 50 52% | 50.8 51% | 84.2 ? 19% | 64.8 ? 38% |
* ... Meglio usare valori piccoli
Power consumption Witcher 3 / stress test
Power consumption with an external monitor
Durata della batteria
L'Acer Swift Go 14, con il suo processore Intel Meteor Lake e la batteria da 65 Wh, ha mancato di poco il traguardo delle otto ore nel test di navigazione internet Wi-Fi. Secondo le nostre misurazioni energetiche, è il pannello OLED a consumare più energia durante la navigazione. La visita di siti web e l'esecuzione di applicazioni in modalità scura dovrebbero migliorare notevolmente i tempi di esecuzione. Con il predecessore, erano possibili quasi 45 minuti di autonomia in più.
| Acer Swift Go 14 SFG14-72 Ultra 7 155H, Arc 8-Core, 65 Wh | Acer Swift Go 14 SFG14-71 i5-1335U, Iris Xe G7 80EUs, 54.6 Wh | LG Gram 2in1 16 16T90R - G.AA78G i7-1360P, Iris Xe G7 96EUs, 80 Wh | HP Pavilion Plus 14-ew0153TU i7-1355U, Iris Xe G7 96EUs, 68 Wh | Lenovo ThinkPad T14 G4 21K4S02000 R7 PRO 7840U, Radeon 780M, 52.5 Wh | Ayaneo Air 1S Retro Power R7 7840U, Radeon 780M, 37.5 Wh | HP Pavilion Plus 14-ey0095cl R7 7840U, Radeon 780M, 68 Wh | Media della classe Subnotebook | |
|---|---|---|---|---|---|---|---|---|
| Autonomia della batteria | -5% | 58% | 20% | 48% | -17% | 37% | 70% | |
| WiFi v1.3 (h) | 8 | 7.6 -5% | 11.9 49% | 9.6 20% | 12.2 53% | 5.9 -26% | 8.5 6% | 14 ? 75% |
| Load (h) | 1.2 | 2 67% | 1.7 42% | 1.1 -8% | 2 67% | 1.969 ? 64% | ||
| H.264 (h) | 12 | 3.1 | 15.4 ? | |||||
| Gaming (h) | 1.2 | |||||||
| Reader / Idle (h) | 16.9 | 28.6 ? |
Pro
Contro
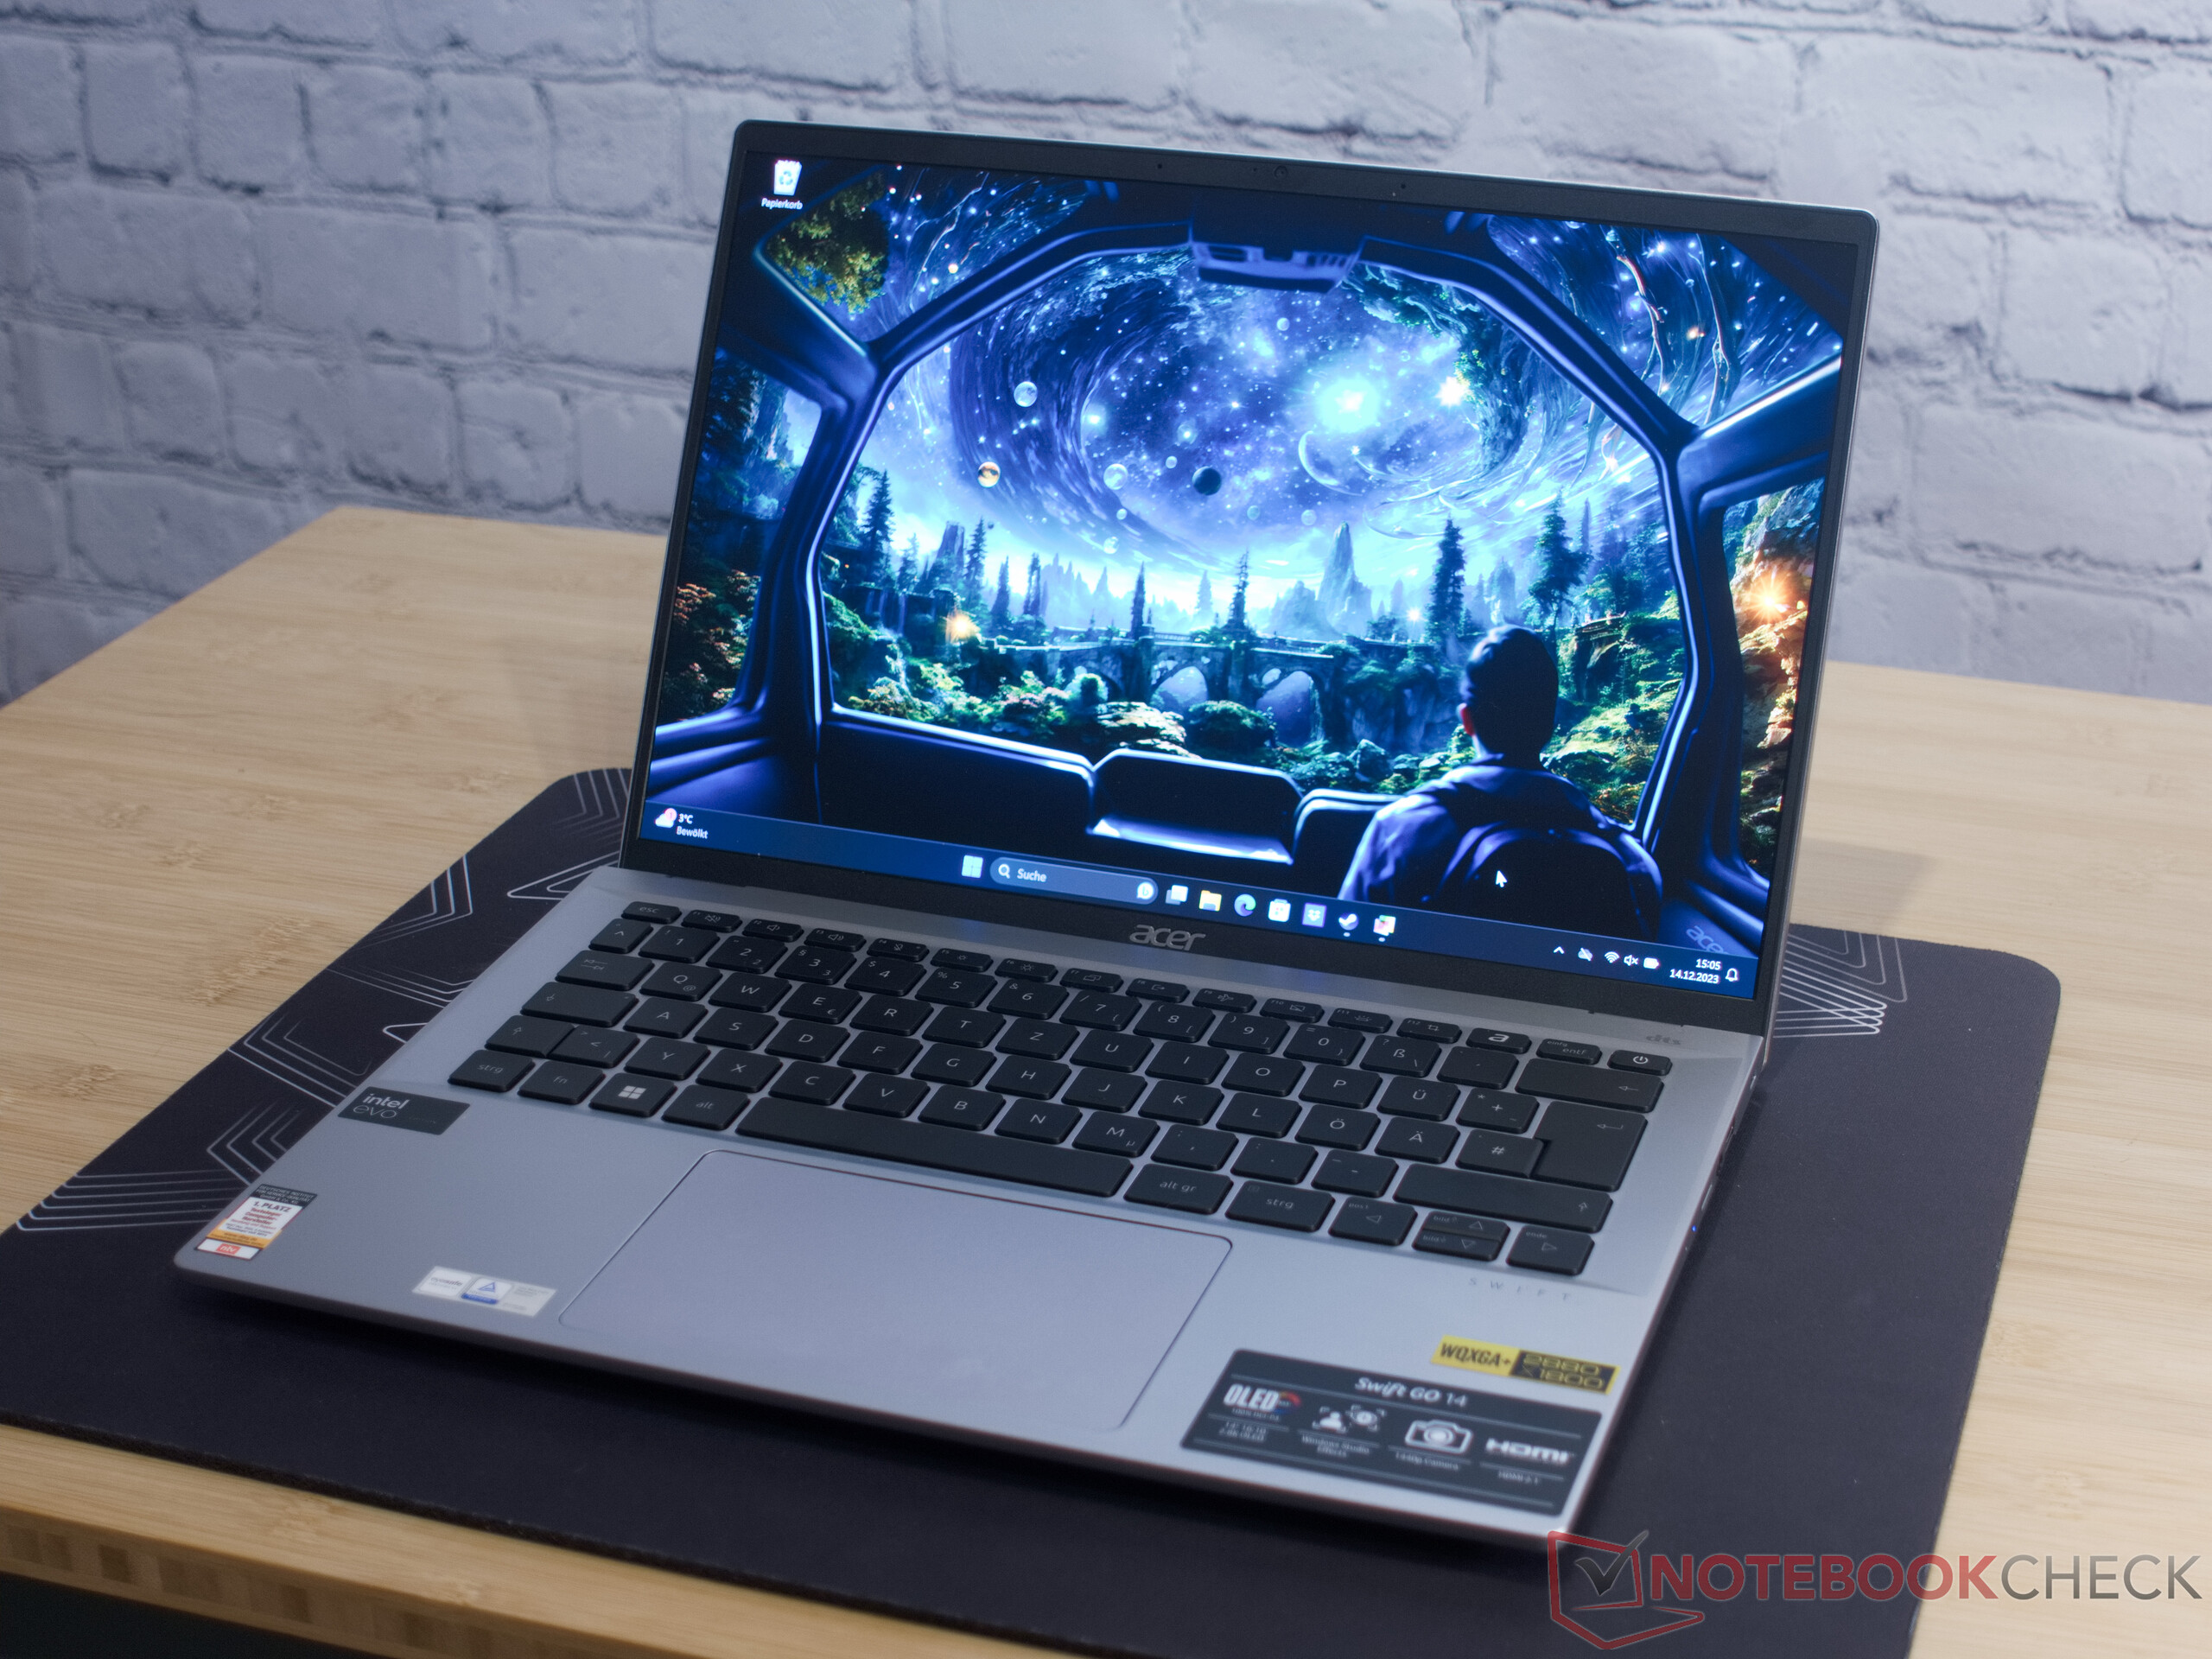
Verdetto - Non solo l'ufficio

Acer ci ha fatto arrivare lo Swift Go 14 un po' prima che il dispositivo arrivi sul mercato e questo significa che non tutto funziona alla perfezione. Ma abbiamo già avuto modo di provare l'ultima generazione di processori Intel e siamo rimasti colpiti dalle prestazioni grafiche di alto livello del chip Meteor Lake. Terremo d'occhio le modifiche del dispositivo fino alla primavera del prossimo anno e poi daremo il nostro verdetto finale sullo Swift Go 14 (2024). Tuttavia, abbiamo già notato che la macchina compatta beneficia di un chip molto più potente Core Ultra 7. Le maggiori prestazioni grafiche consentono al portatile e al suo eccellente display OLED di godere di uno spettro di applicazioni più ampio. Questo, almeno, rende possibile il gioco e l'editing video. Il nucleo NPU del processore Processore Meteor Lake è stato anche in grado di dimostrare la sua potenza nei nostri test.
Con un peso di 1,3 kg, l'Acer Swift Go 14 è un dispositivo leggero e potente che racchiude una notevole potenza all'interno del suo elegante case. Il processore Meteor Lake di Intel garantisce una gamma significativamente più ampia di applicazioni.
Non c'è dubbio che lo Swift Go 14 sia un dispositivo mobile. Grazie a Thunderbolt 4, HDMI 2.1 e alcune porte aggiuntive, la connettività non manca. A breve, ci saranno altre alternative con i processori Meteor Lake, con Asus che offre già un chipset di questo tipo nel suo ZenBook 14. Chi è troppo impaziente per aspettare i computer portatili con processori Intel dovrebbe dare un'occhiata alle macchine da 14 pollici con AMD Ryzen 7 7840U, come il HP Pavilion Plus 14.
Prezzo e disponibilità
La disponibilità dello Swift Go 14 è prevista a partire da febbraio 2024. Finora è stato annunciato un prezzo di acquisto previsto di poco inferiore a 1.000 euro per la Germania.
Transparency
La selezione dei dispositivi da recensire viene effettuata dalla nostra redazione. Il campione di prova è stato fornito all'autore come prestito dal produttore o dal rivenditore ai fini di questa recensione. L'istituto di credito non ha avuto alcuna influenza su questa recensione, né il produttore ne ha ricevuto una copia prima della pubblicazione. Non vi era alcun obbligo di pubblicare questa recensione. In quanto società mediatica indipendente, Notebookcheck non è soggetta all'autorità di produttori, rivenditori o editori.
Ecco come Notebookcheck esegue i test
Ogni anno, Notebookcheck esamina in modo indipendente centinaia di laptop e smartphone utilizzando procedure standardizzate per garantire che tutti i risultati siano comparabili. Da circa 20 anni sviluppiamo continuamente i nostri metodi di prova e nel frattempo stabiliamo gli standard di settore. Nei nostri laboratori di prova, tecnici ed editori esperti utilizzano apparecchiature di misurazione di alta qualità. Questi test comportano un processo di validazione in più fasi. Il nostro complesso sistema di valutazione si basa su centinaia di misurazioni e parametri di riferimento ben fondati, che mantengono l'obiettività.Price comparison

