Recensione del portatile MSI Prestige 13 AI Evo - Core Ultra 7 e OLED con un peso inferiore a 1 kg
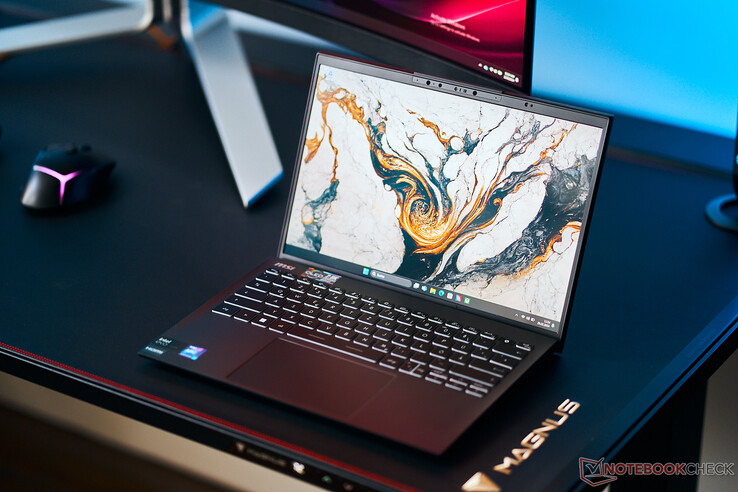
MSI Prestige 13 AI Evo è un subnotebook compatto che pesa meno di 1 chilogrammo. Il nuovo modello 2024 ha ricevuto un processore Meteor Lake di Intel e un modulo Wi-Fi 7. Il nostro dispositivo di prova è la variante con il Core Ultra 7 155H. Il nostro dispositivo di prova è la variante con il Core Ultra 7 155H, Intel Arc Graphics, 32 GB di RAM, un SSD da 1 TB e un display OLED da 2,8K per circa 1.300 dollari.
Potenziali concorrenti a confrontos
Punteggio | Data | Modello | Peso | Altezza | Dimensione | Risoluzione | Prezzo |
|---|---|---|---|---|---|---|---|
| 86.6 % v7 (old) | 03/2024 | MSI Prestige 13 AI Evo Ultra 7 155H, Arc 8-Core | 967 gr | 16.9 mm | 13.30" | 2880x1800 | |
| 89.5 % v7 (old) | 08/2023 | Lenovo ThinkPad X1 Nano Gen 3 i7-1360P, Iris Xe G7 96EUs | 989 gr | 14.8 mm | 13.00" | 2160x1350 | |
| 90.2 % v7 (old) | 10/2023 | Dell Latitude 13 7340 i5-1345U i5-1345U, Iris Xe G7 80EUs | 1.1 kg | 18.2 mm | 13.30" | 1920x1200 | |
| 91.9 % v7 (old) | 07/2023 | HP Dragonfly G4 i7-1365U, Iris Xe G7 96EUs | 1.1 kg | 16.3 mm | 13.50" | 1920x1280 | |
| 85.4 % v7 (old) | 05/2023 | Asus ZenBook S13 OLED UX5304 i7-1355U, Iris Xe G7 96EUs | 1 kg | 11.8 mm | 13.30" | 2880x1800 |
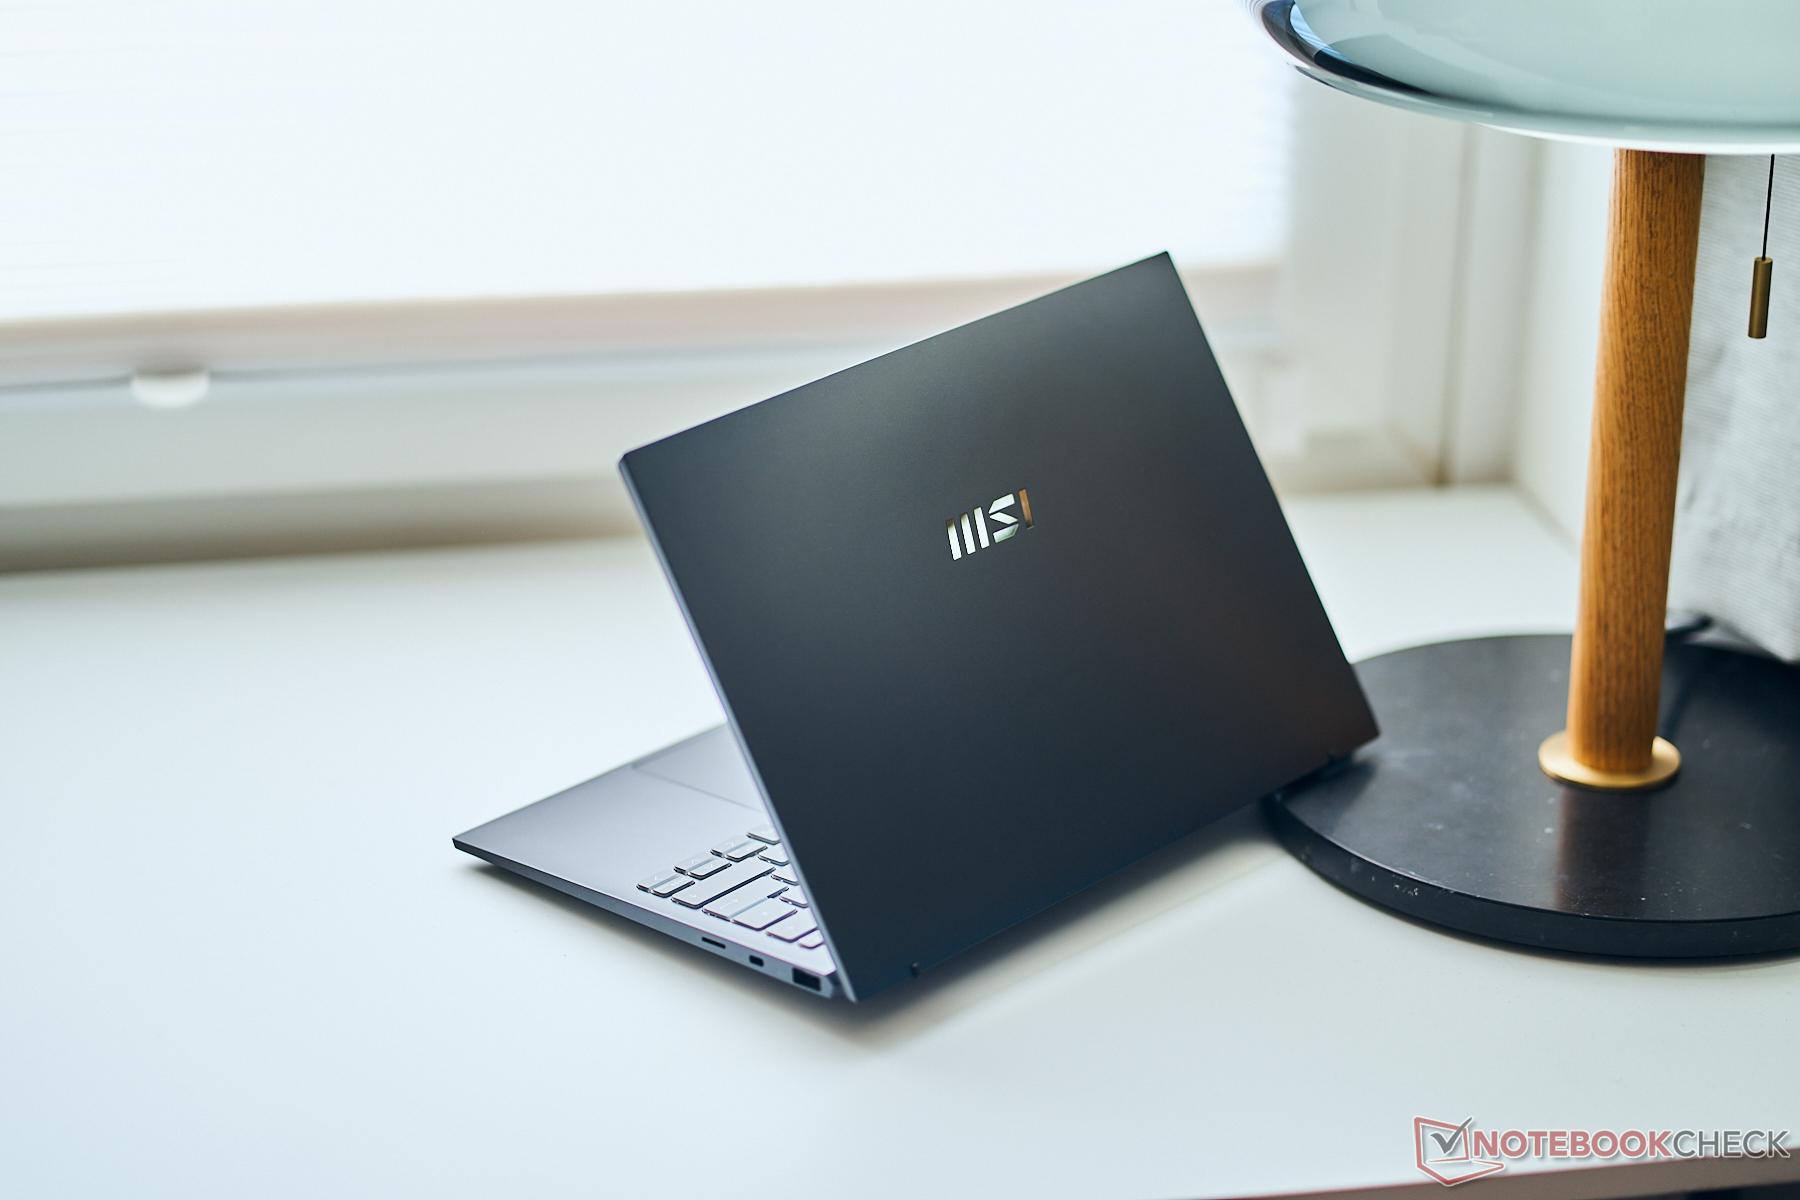
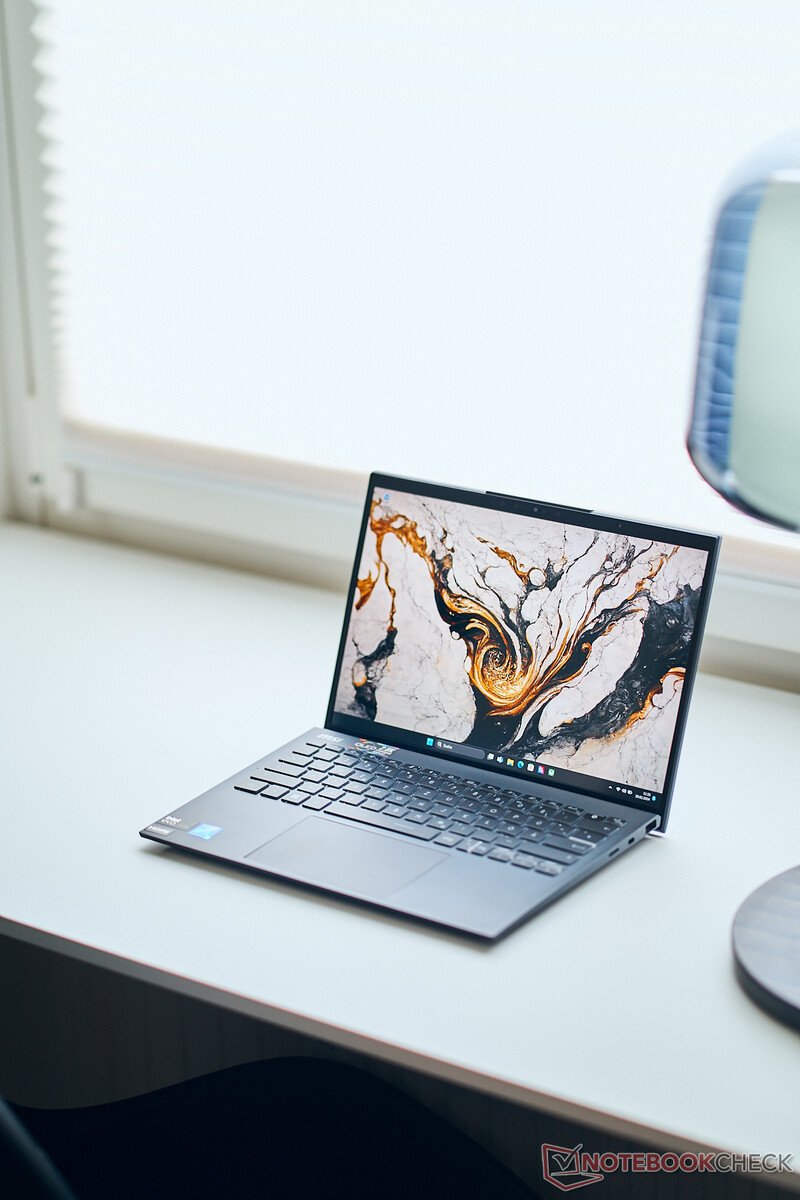
Cassa - Il Prestige 13 con una cassa in lega di magnesio
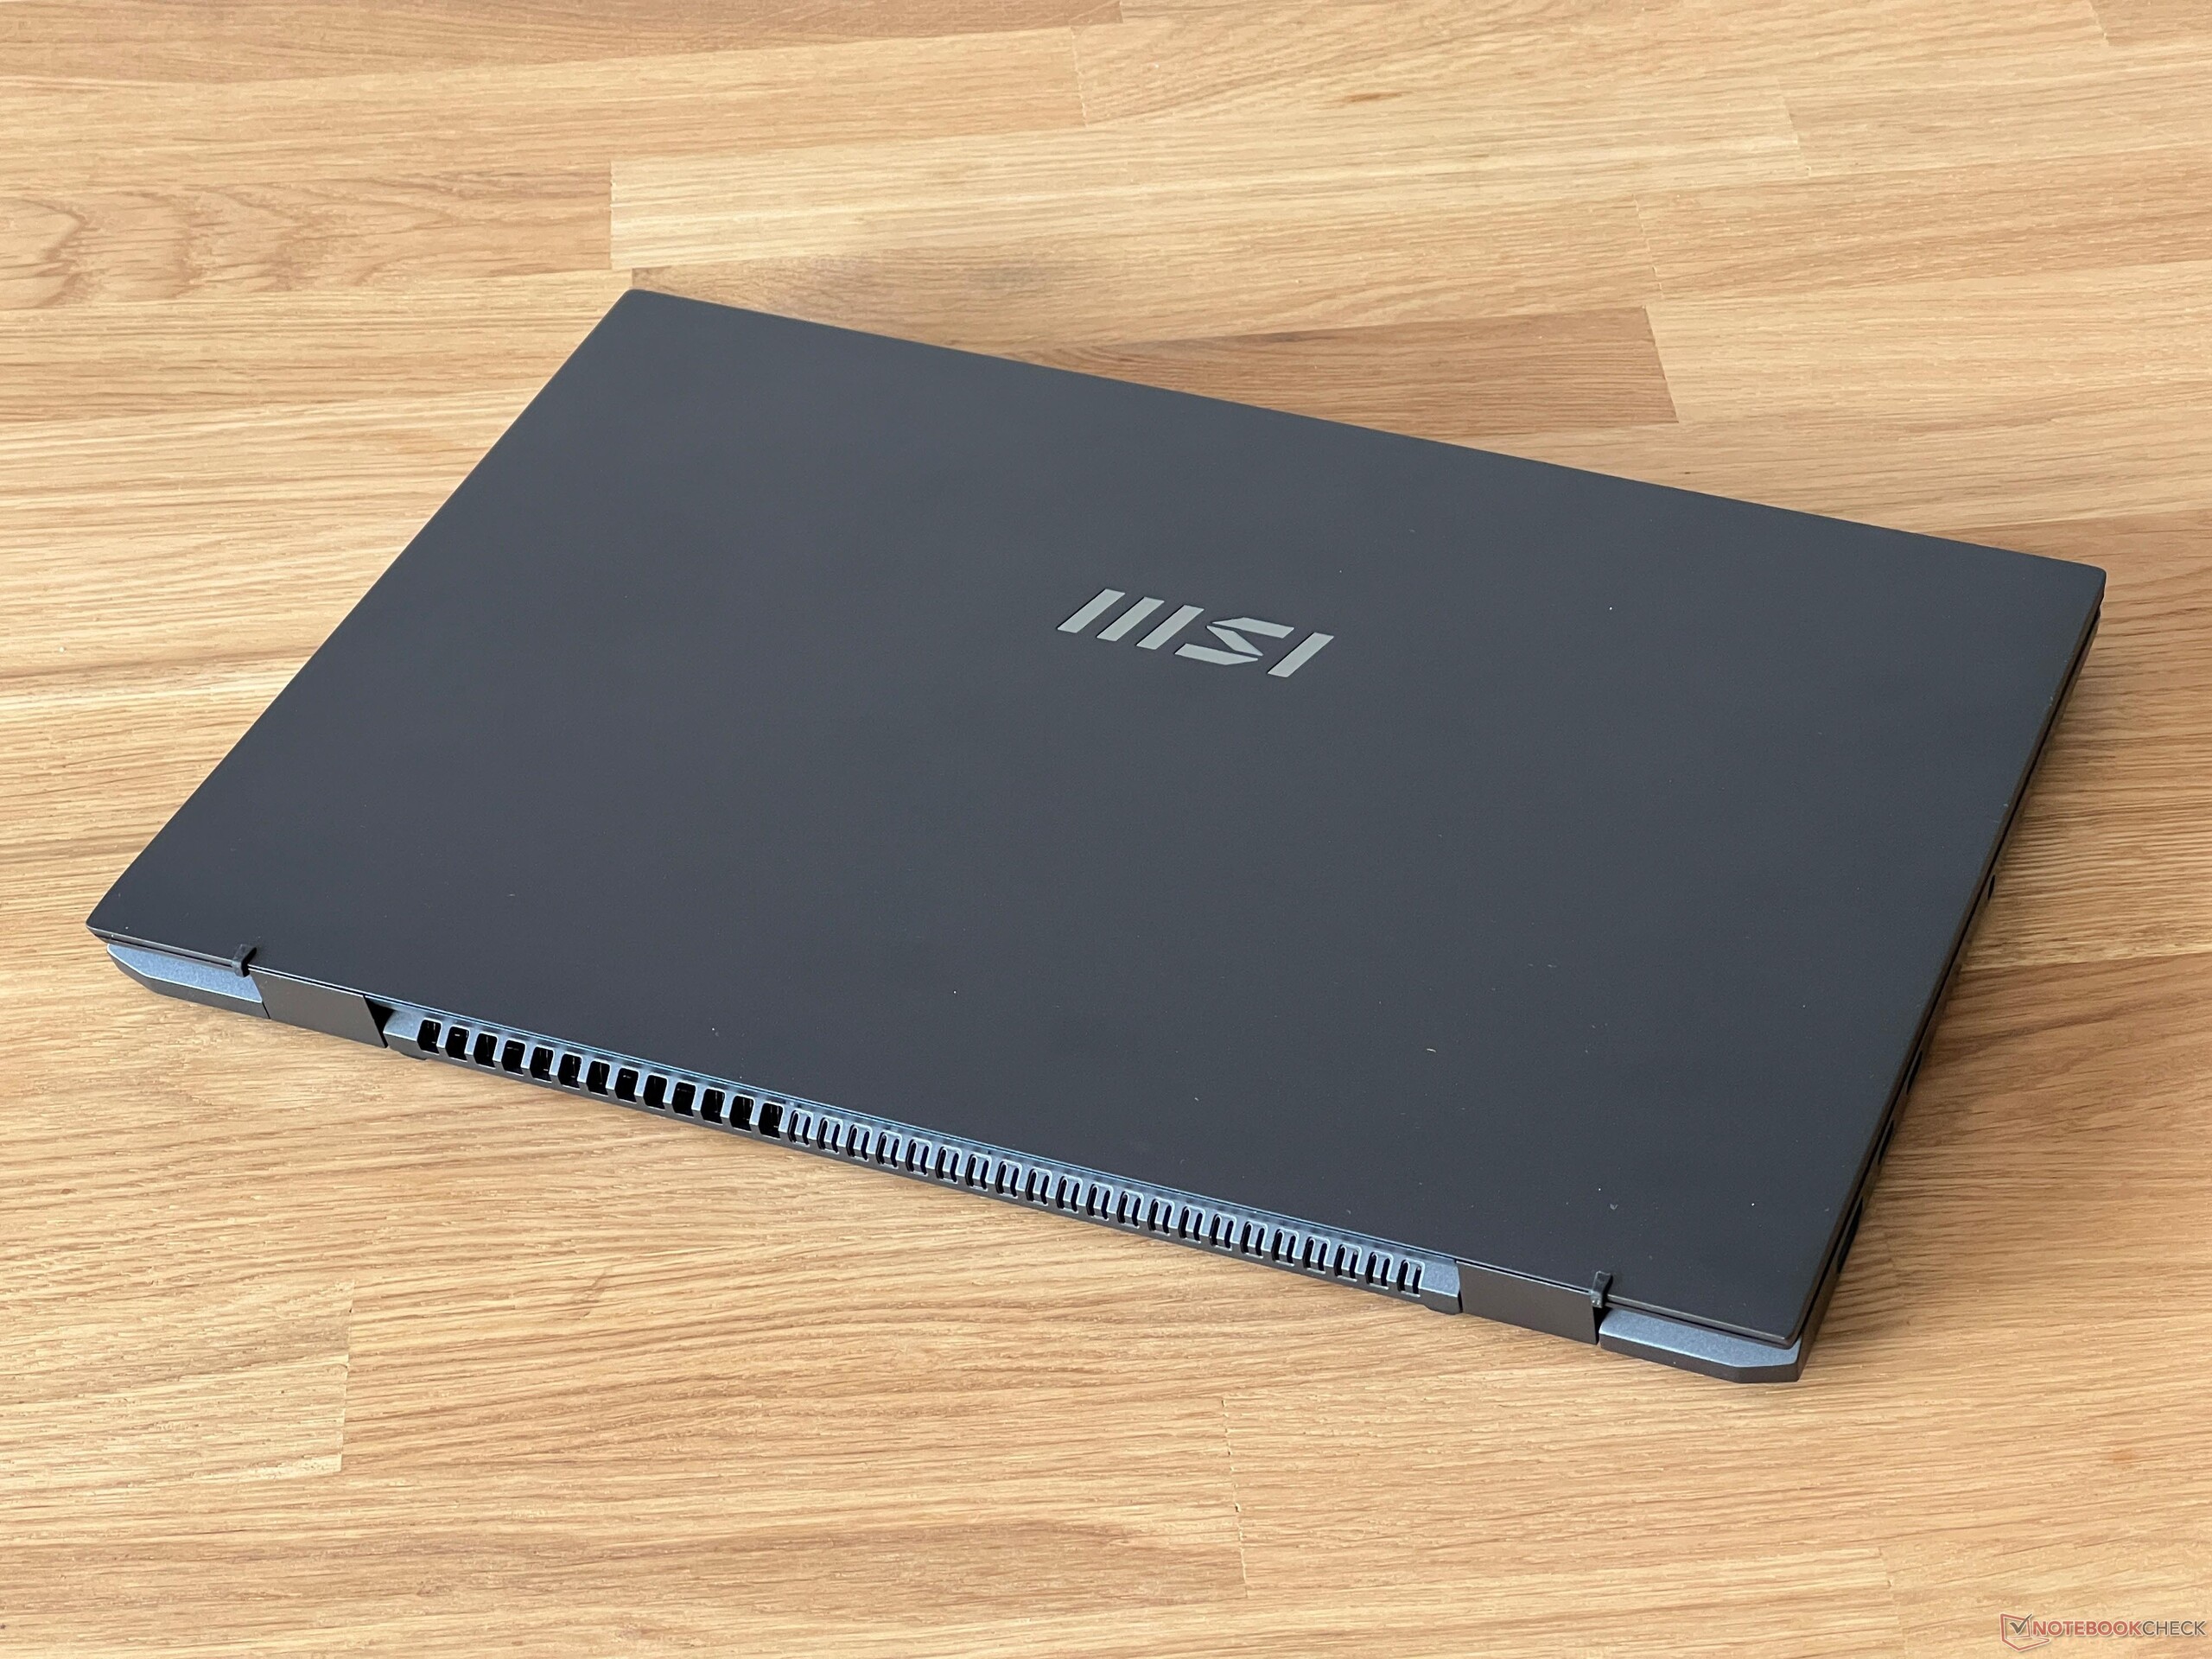
MSI offre il Prestige 13 in grigio scuro (Stellar Gray) - lo stesso del nostro dispositivo di prova - o in alternativa in bianco (Pure White). Entrambe le versioni utilizzano una lega di magnesio e alluminio, che presumibilmente contribuisce anche al peso ridotto del dispositivo, pari a 976 grammi. Quando si entra per la prima volta in contatto con il portatile, si rimane immediatamente sorpresi da quanto sia davvero leggero. Le sue superfici sono di alta qualità e, anche sul modello scuro, le impronte digitali non sembrano essere un problema troppo grande. A parte il logo MSI, il Prestige 13 non presenta ulteriori elementi di design. Le cornici sono abbastanza sottili su entrambi i lati, ma la cornice lungo il bordo superiore è piuttosto ampia a causa della webcam installata.
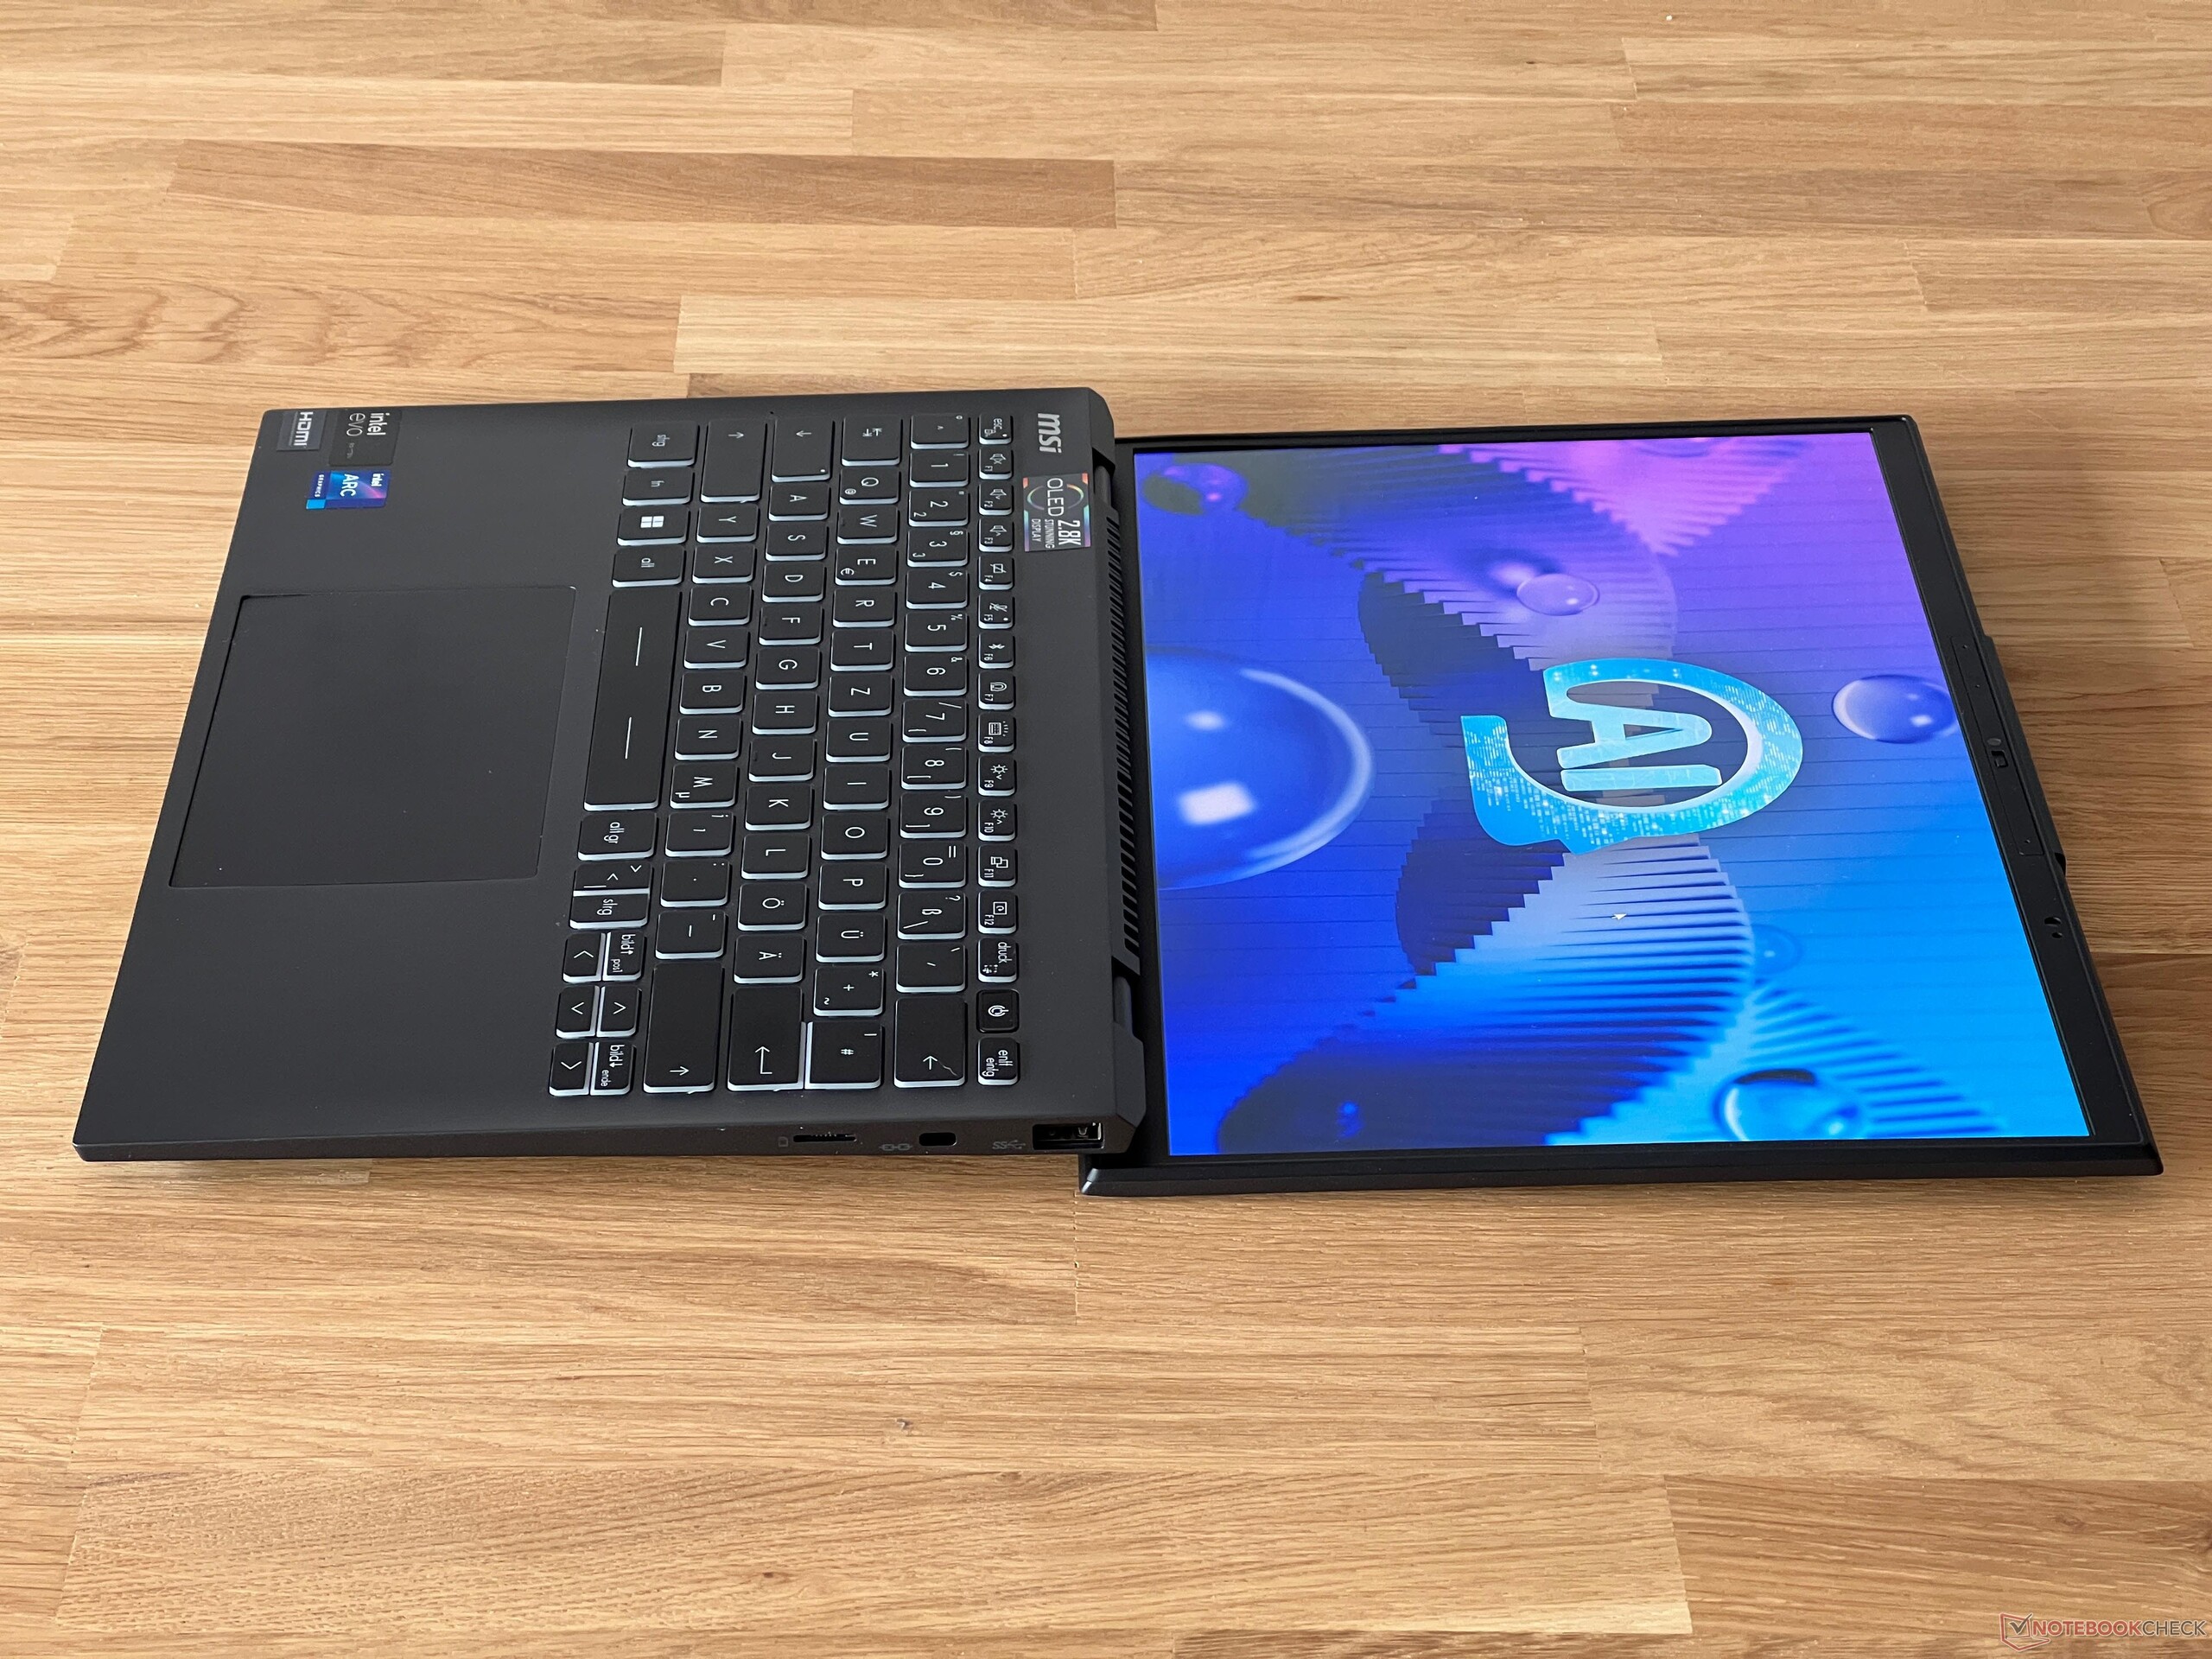
È costruito bene, tuttavia soffre di alcuni problemi di stabilità. L'area posteriore dell'unità di base si solleva leggermente quando si apre il coperchio e la parte centrale della tastiera può essere deformata verso l'interno con un po' di pressione. Tuttavia, quando si digita normalmente, questo non dovrebbe essere un problema troppo grande. Se si ruota leggermente l'unità di base, il portatile emette dei rumori scricchiolanti. Le cerniere del display sono fissate molto saldamente e impediscono efficacemente al coperchio di oscillare; questo rende solo un po' difficile aprirlo con una mano. L'angolo di apertura massimo è di 180 gradi e il coperchio stesso è molto stabile.
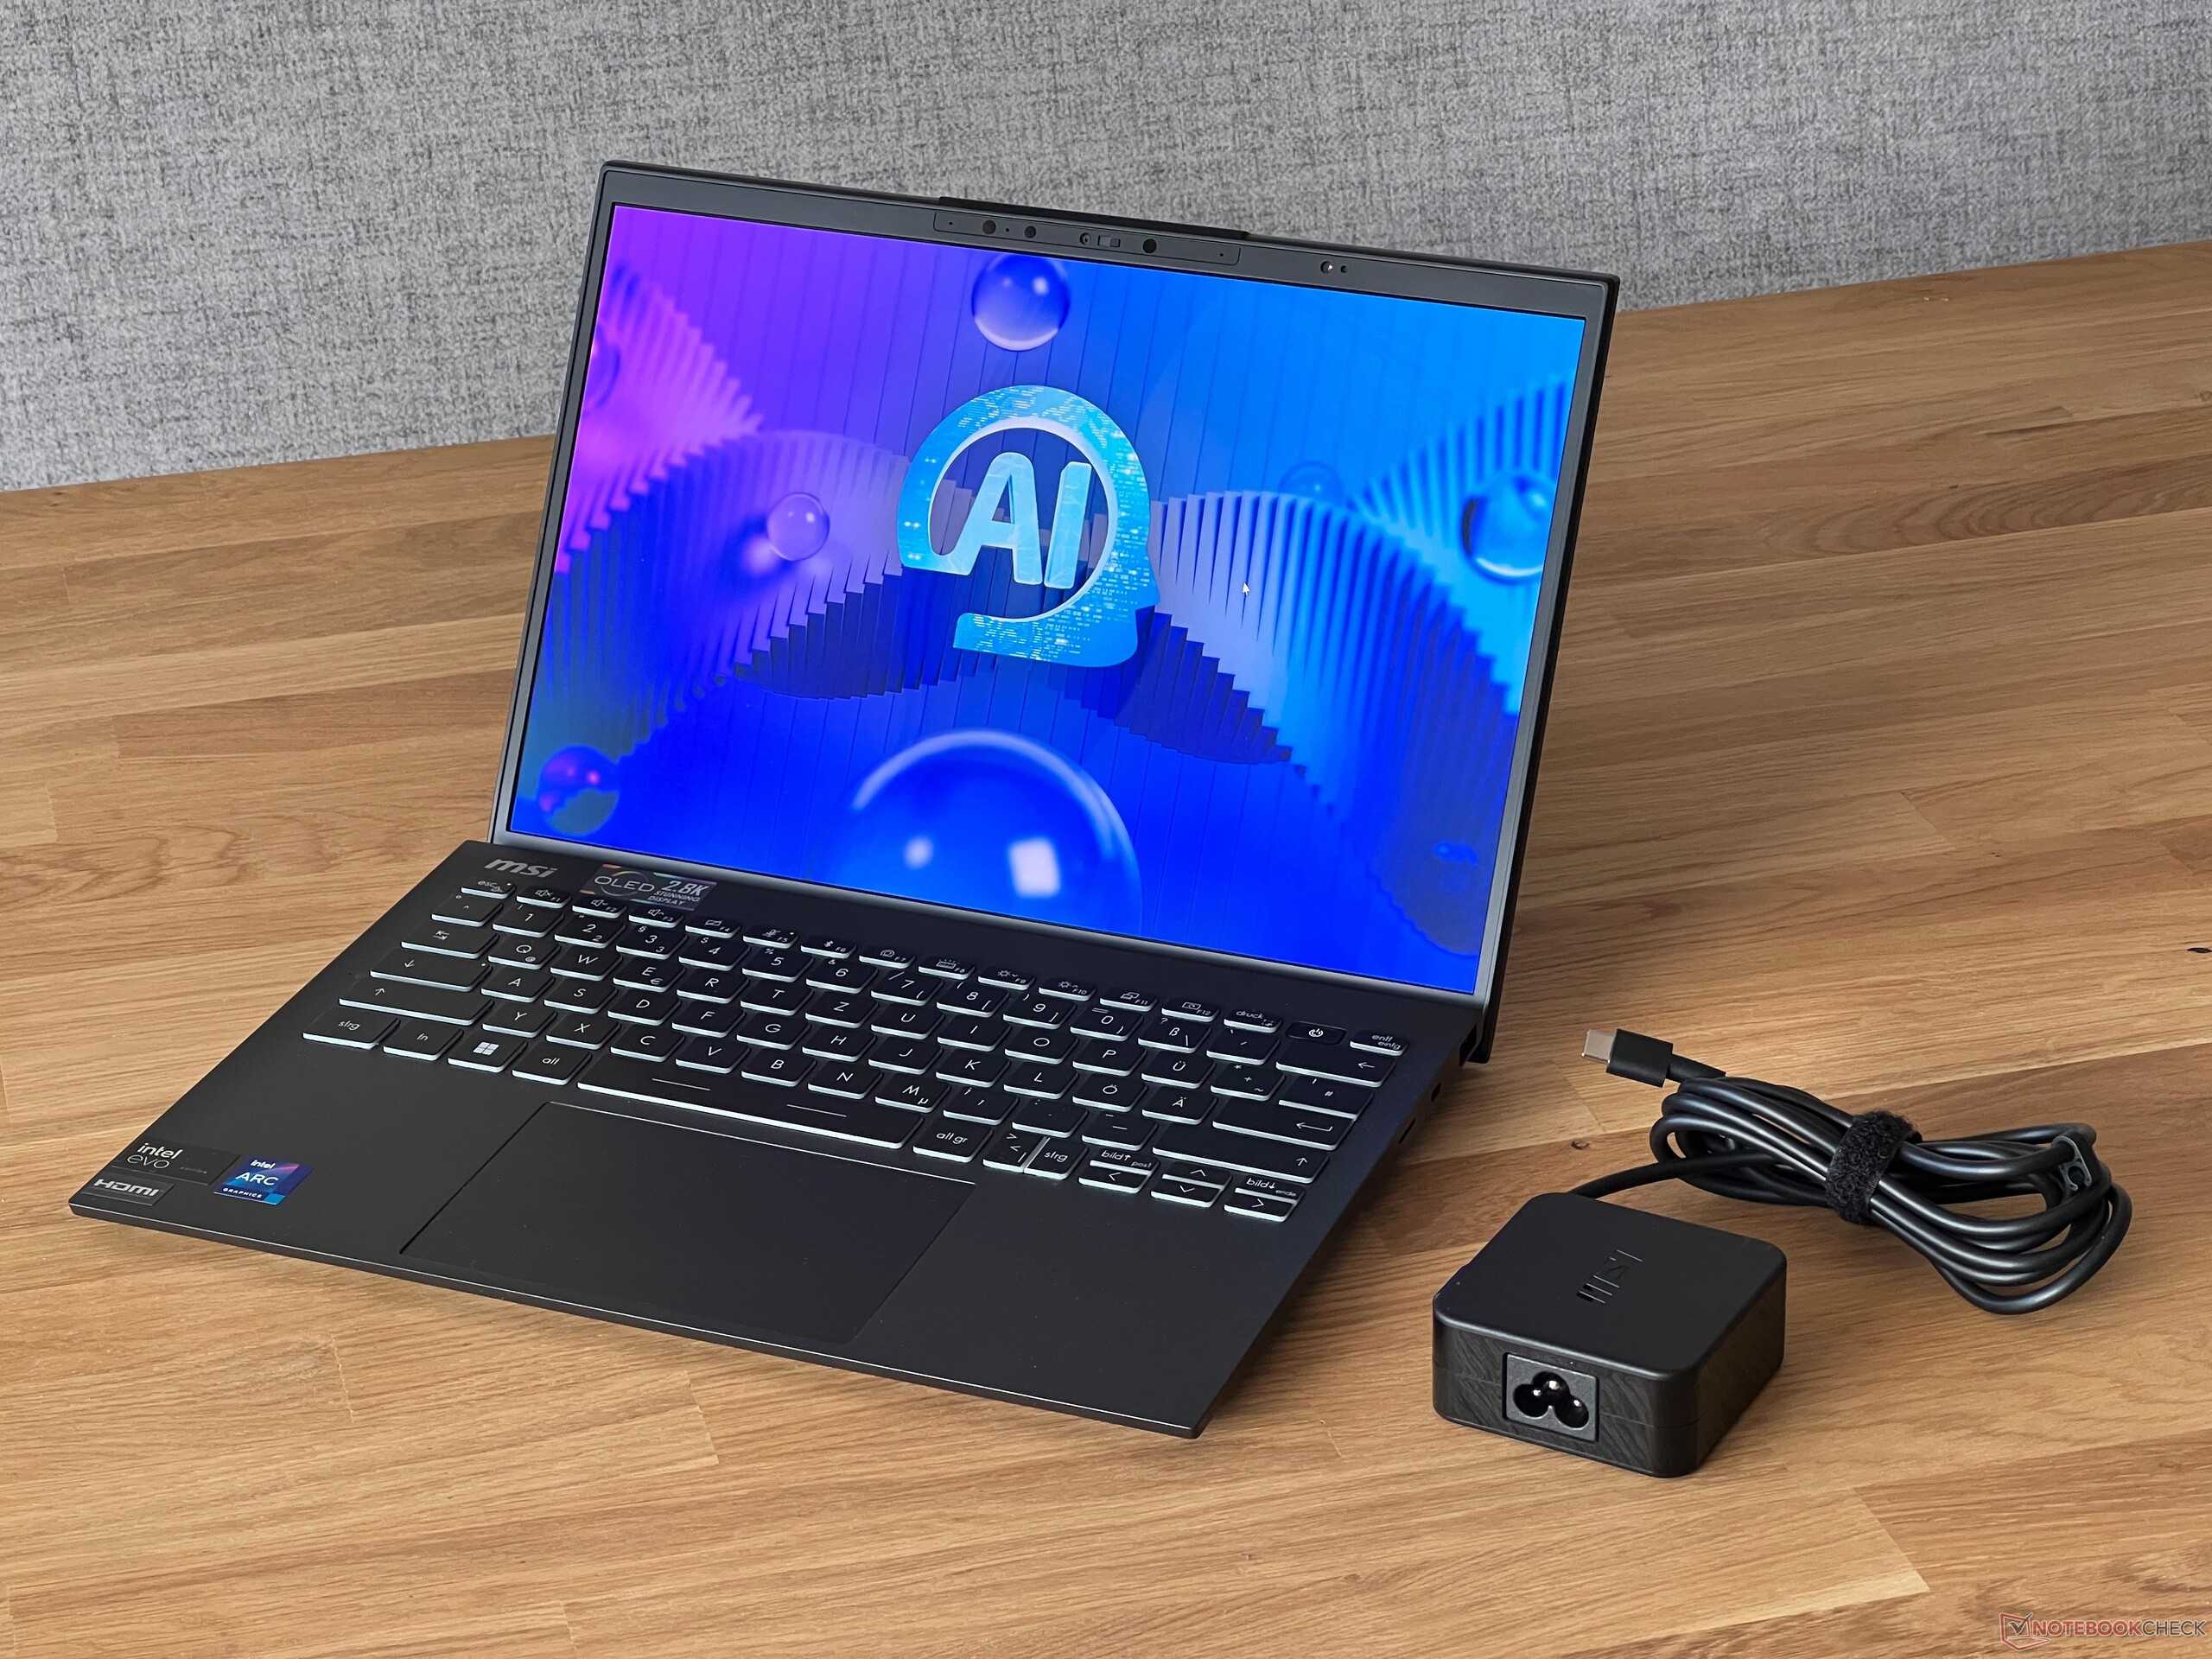
Con un peso inferiore a 1 chilogrammo, il Prestige 13 è estremamente leggero, ma lo stesso si può dire per gli altri dispositivi di confronto. Anche per quanto riguarda l'ingombro, i concorrenti non occupano molto spazio. Il Prestige può essere facilmente riposto in qualsiasi borsa. MSI utilizza un alimentatore compatto da 65 watt, tuttavia non si tratta di un alimentatore plug-in, motivo per cui è piuttosto pesante, con 341 grammi.
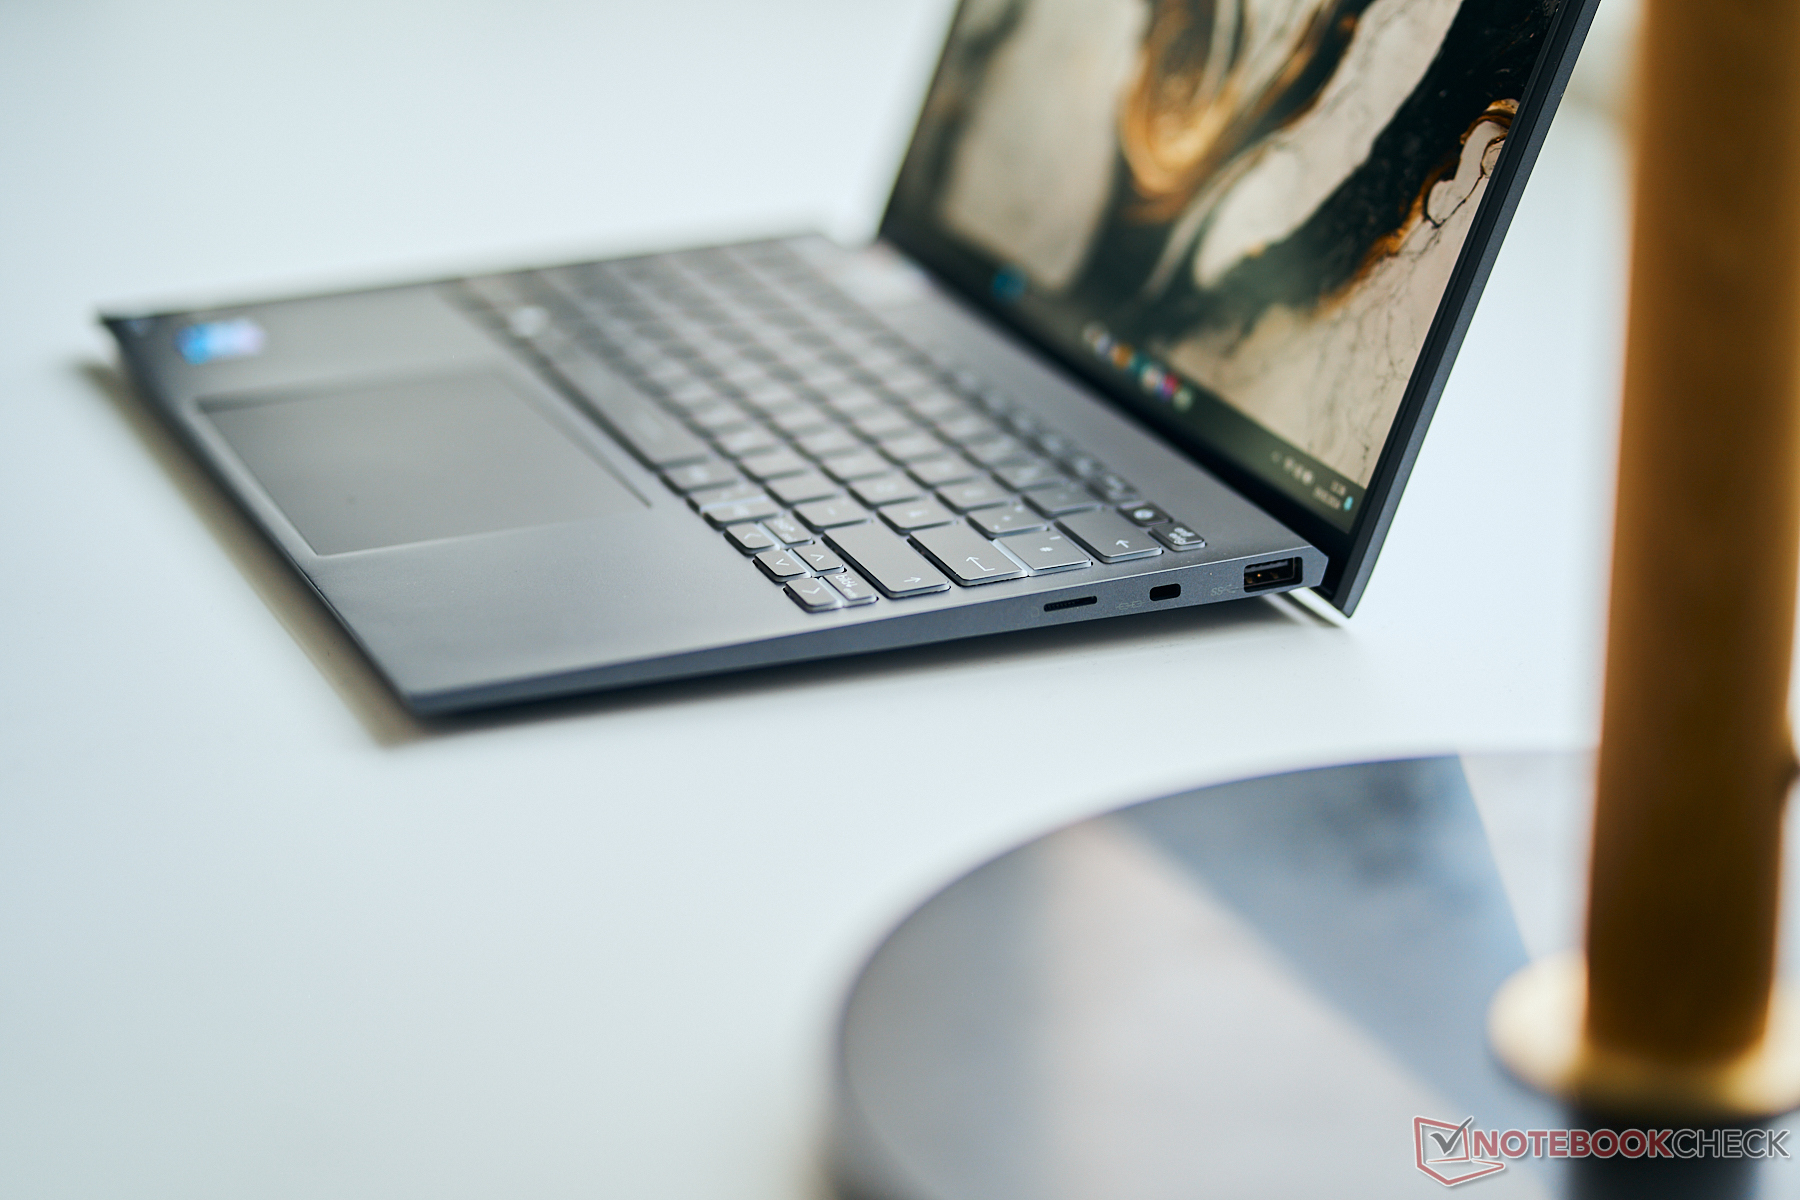
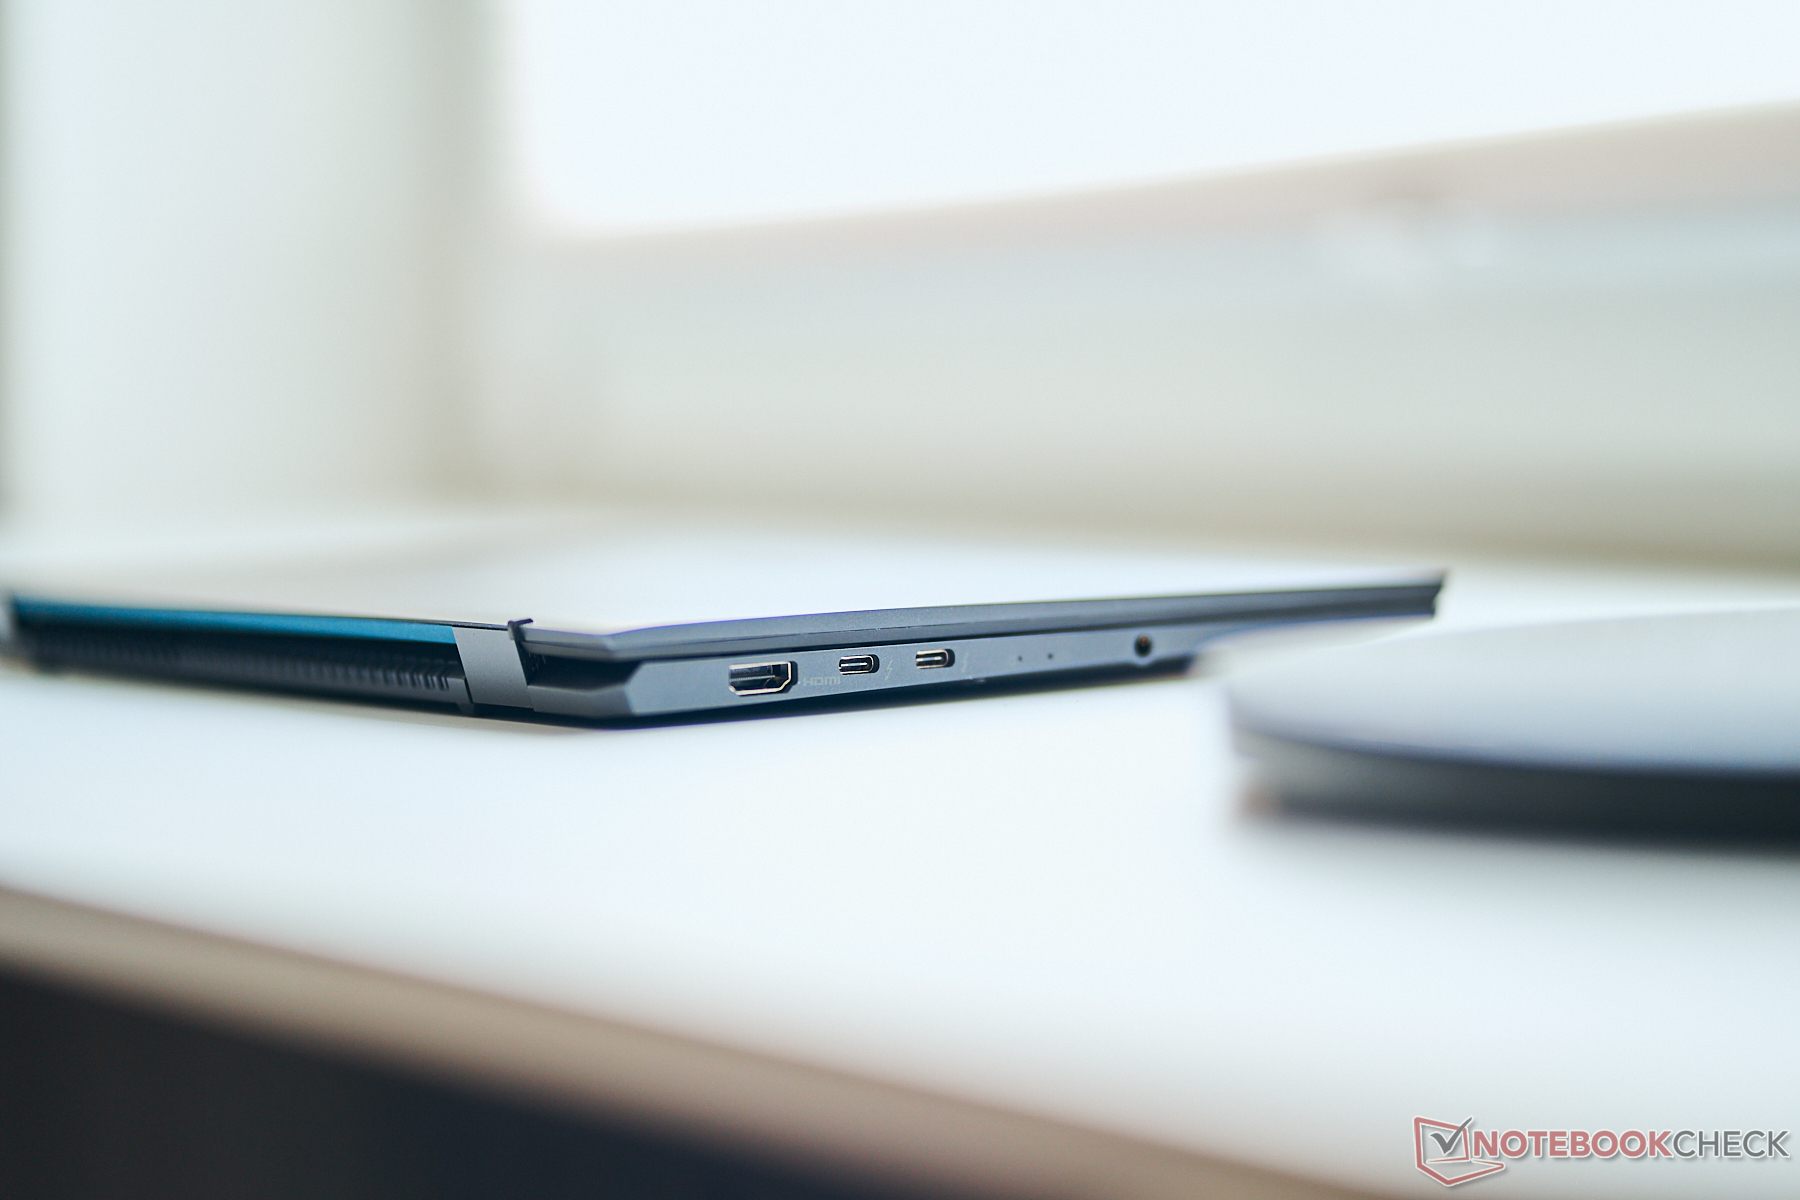
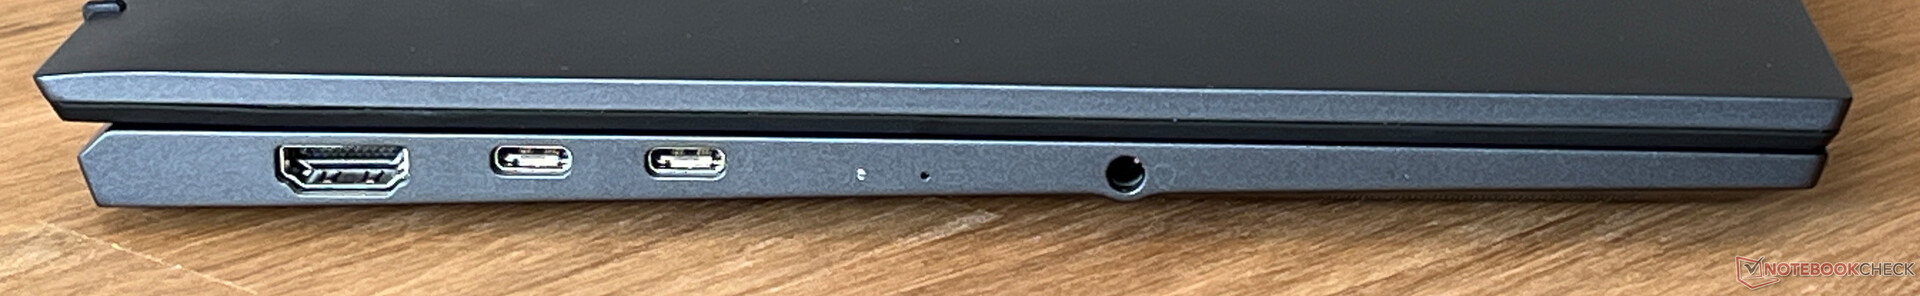
Connettività - MSI con Thunderbolt 4 e HDMI 2.1
Il Prestige 13 può essere compatto, ma è anche dotato di tutte le connessioni importanti, tra cui USB-C, USB-A e un'uscita HDMI completa. Ci piace anche il modo in cui le porte sono distribuite sul portatile e non abbiamo molto da criticare.
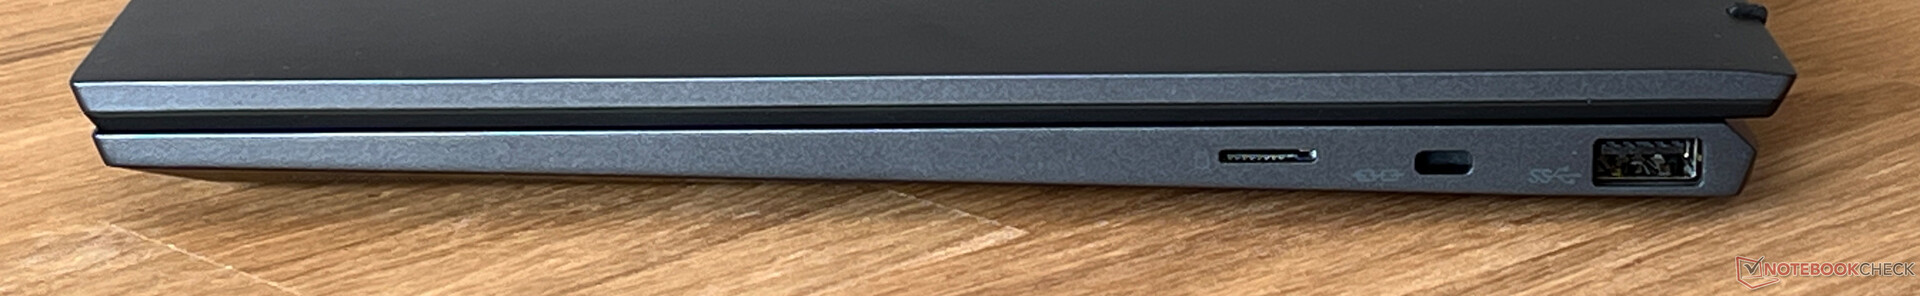
Lettore di schede SD
Il lato destro del dispositivo ospita un lettore di schede microSD (meccanismo a molla) che, in combinazione con la nostra scheda di riferimento (Angelbird AV Pro V60), ha raggiunto ottime velocità di trasferimento. Durante la copia di immagini, abbiamo notato una media di oltre 140 MB/s e un massimo di oltre 200 MB/s. Nessuno degli altri dispositivi di confronto dispone di un lettore di schede.
| SD Card Reader | |
| average JPG Copy Test (av. of 3 runs) | |
| MSI Prestige 13 AI Evo (Angelbird AV Pro V60) | |
| Media della classe Subnotebook (23.7 - 188, n=9, ultimi 2 anni) | |
| maximum AS SSD Seq Read Test (1GB) | |
| MSI Prestige 13 AI Evo (Angelbird AV Pro V60) | |
| Media della classe Subnotebook (24.9 - 195, n=8, ultimi 2 anni) | |
Comunicazione
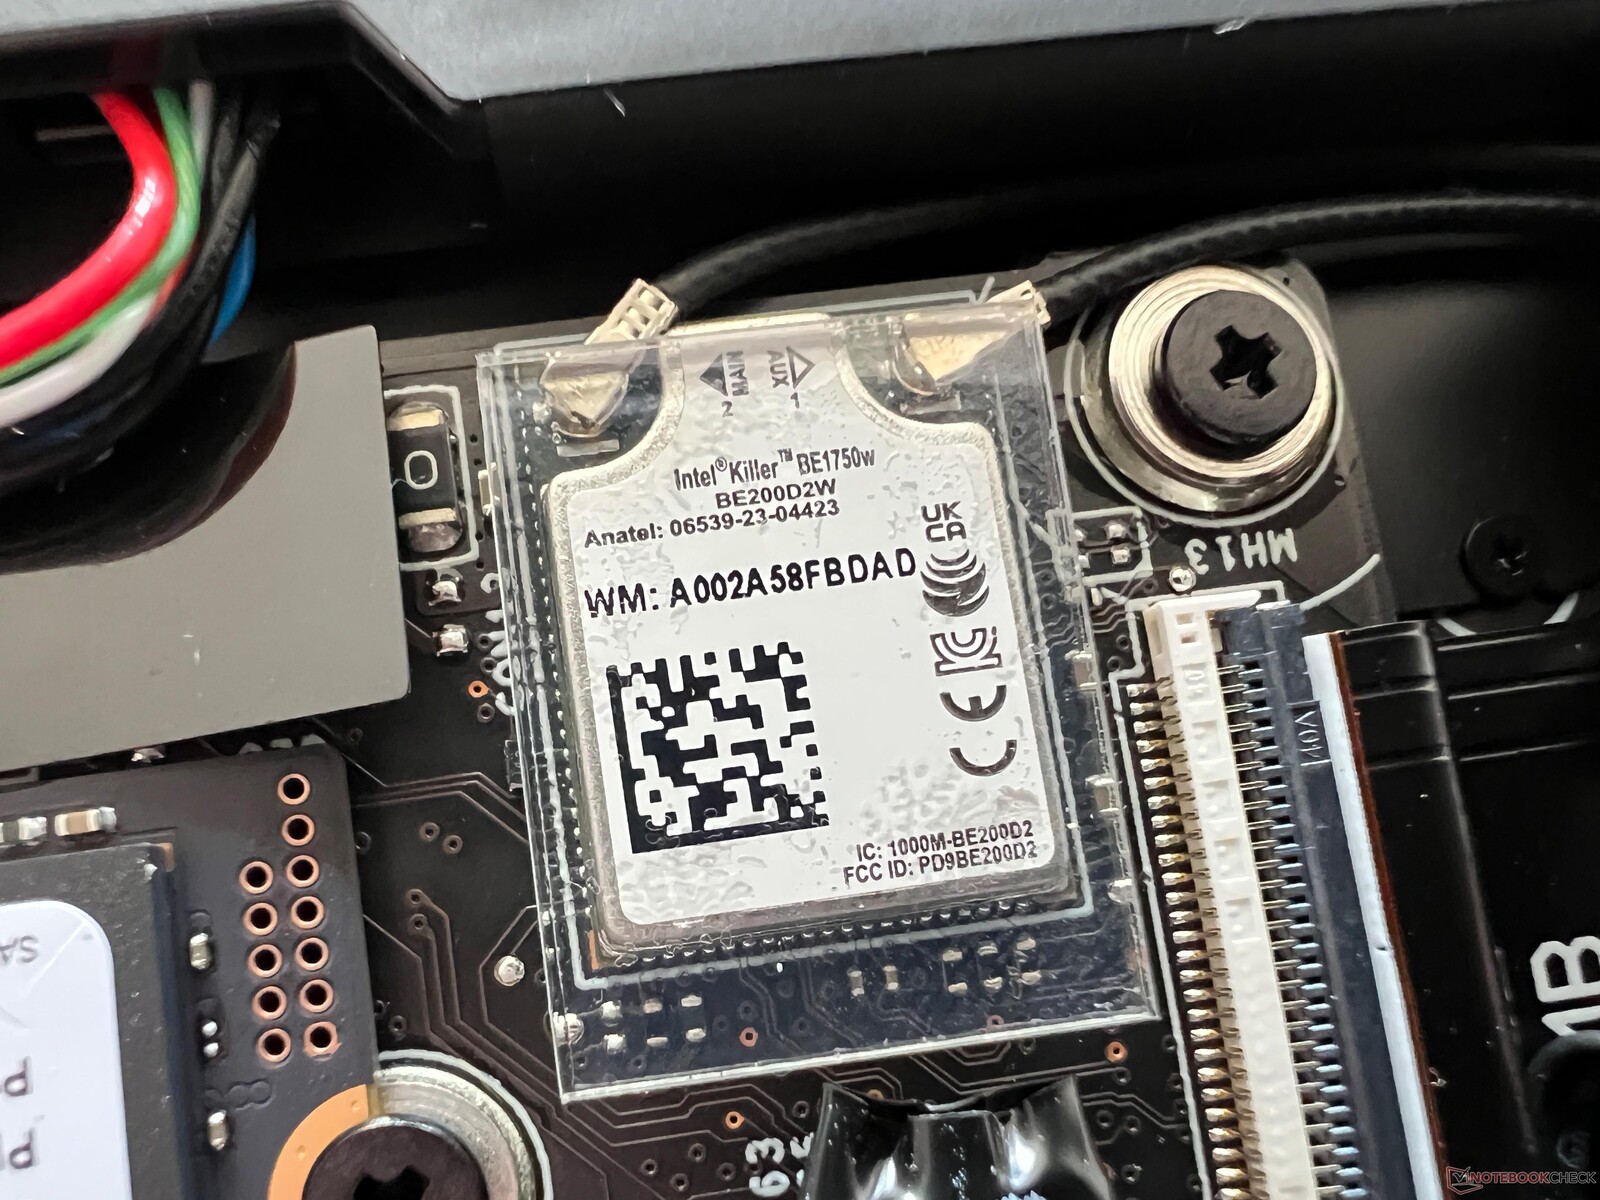
MSI ha installato il nuovo modulo BE1750W (320 MHz) Wi-Fi 7 di Intel nel portatile. Purtroppo, non possiamo ancora utilizzare il nuovo standard con il nostro attuale router di riferimento. Tuttavia, le velocità di trasferimento tramite Wi-Fi 6 erano molto stabili ed elevate.
| Networking | |
| MSI Prestige 13 AI Evo | |
| iperf3 transmit AXE11000 | |
| iperf3 receive AXE11000 | |
| Lenovo ThinkPad X1 Nano Gen 3 | |
| iperf3 transmit AXE11000 | |
| iperf3 receive AXE11000 | |
| iperf3 transmit AXE11000 6GHz | |
| iperf3 receive AXE11000 6GHz | |
| Dell Latitude 13 7340 i5-1345U | |
| iperf3 transmit AXE11000 | |
| iperf3 receive AXE11000 | |
| iperf3 transmit AXE11000 6GHz | |
| iperf3 receive AXE11000 6GHz | |
| HP Dragonfly G4 | |
| iperf3 transmit AXE11000 | |
| iperf3 receive AXE11000 | |
| iperf3 transmit AXE11000 6GHz | |
| iperf3 receive AXE11000 6GHz | |
| Asus ZenBook S13 OLED UX5304 | |
| iperf3 transmit AXE11000 | |
| iperf3 receive AXE11000 | |
Webcam
La webcam a 1080p offre una qualità d'immagine decente in buone condizioni di illuminazione e non presenta una copertura meccanica. Supporta anche gli effetti di Windows Studio (sfondo soft focus, contatto visivo, tracking). Inoltre, è installata una telecamera IR per il riconoscimento facciale tramite Windows Hello.


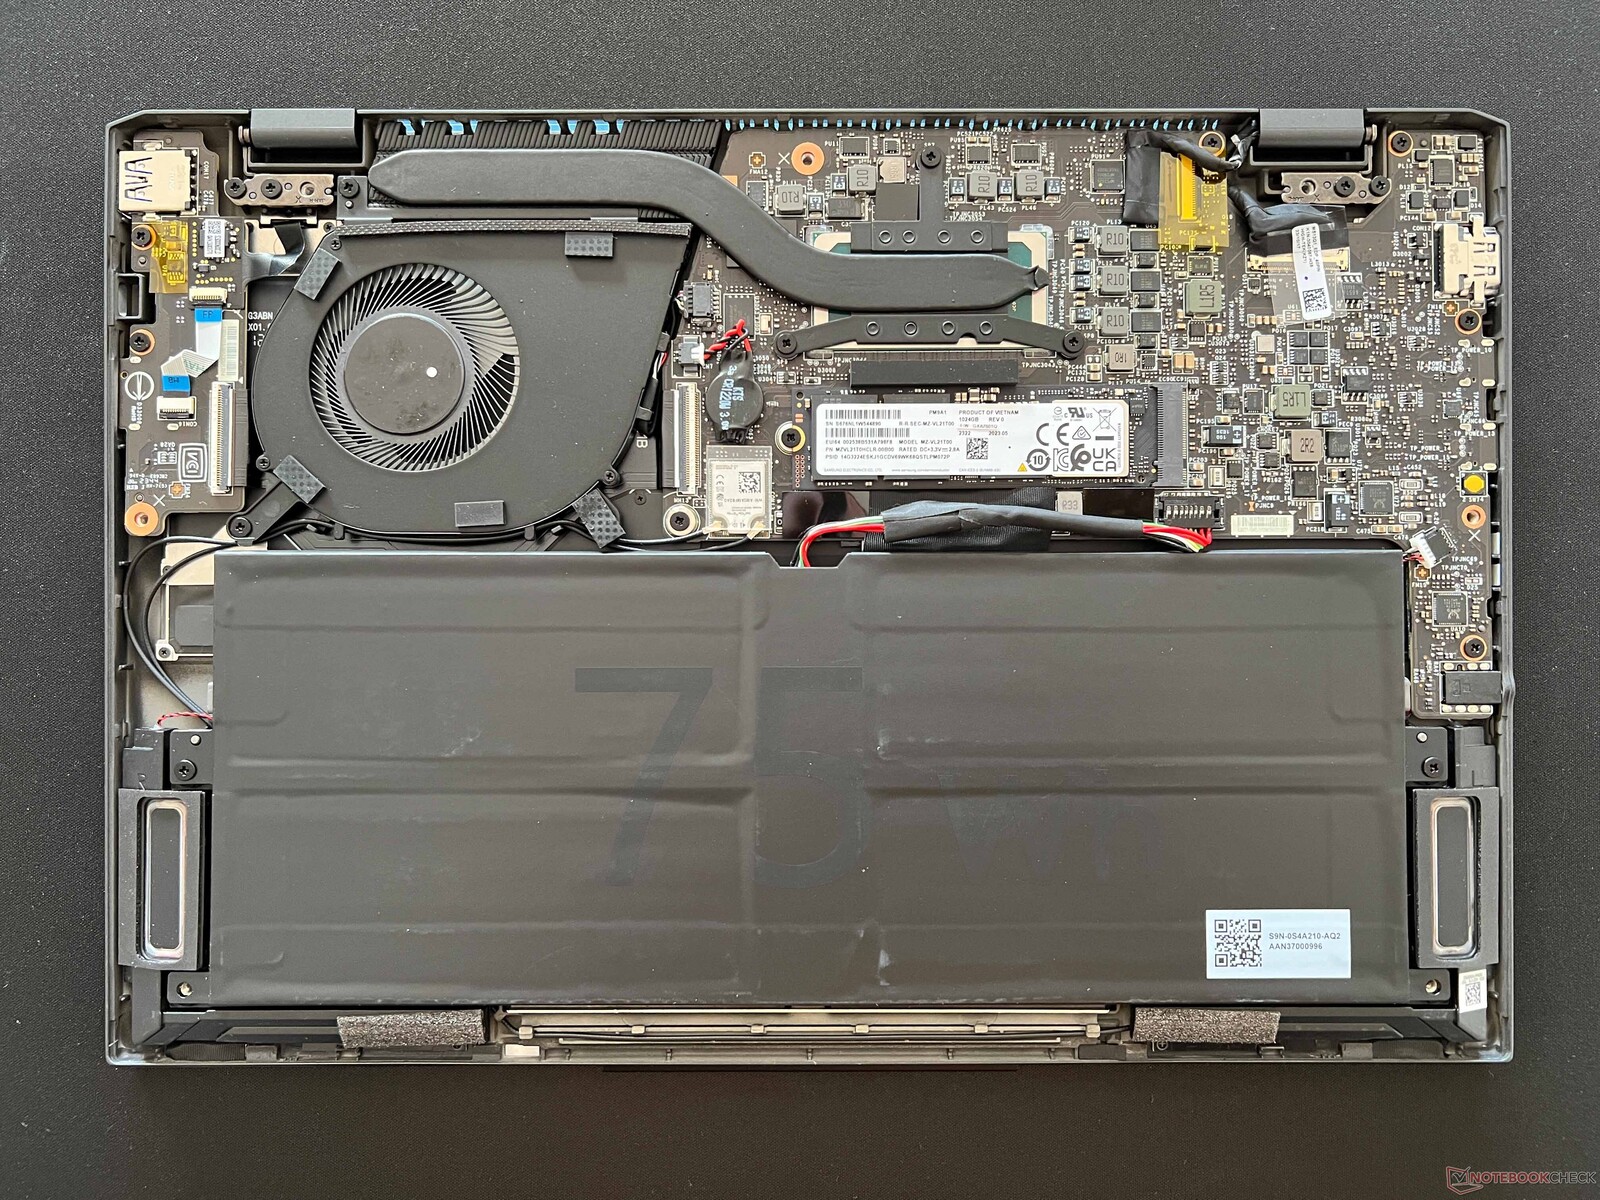
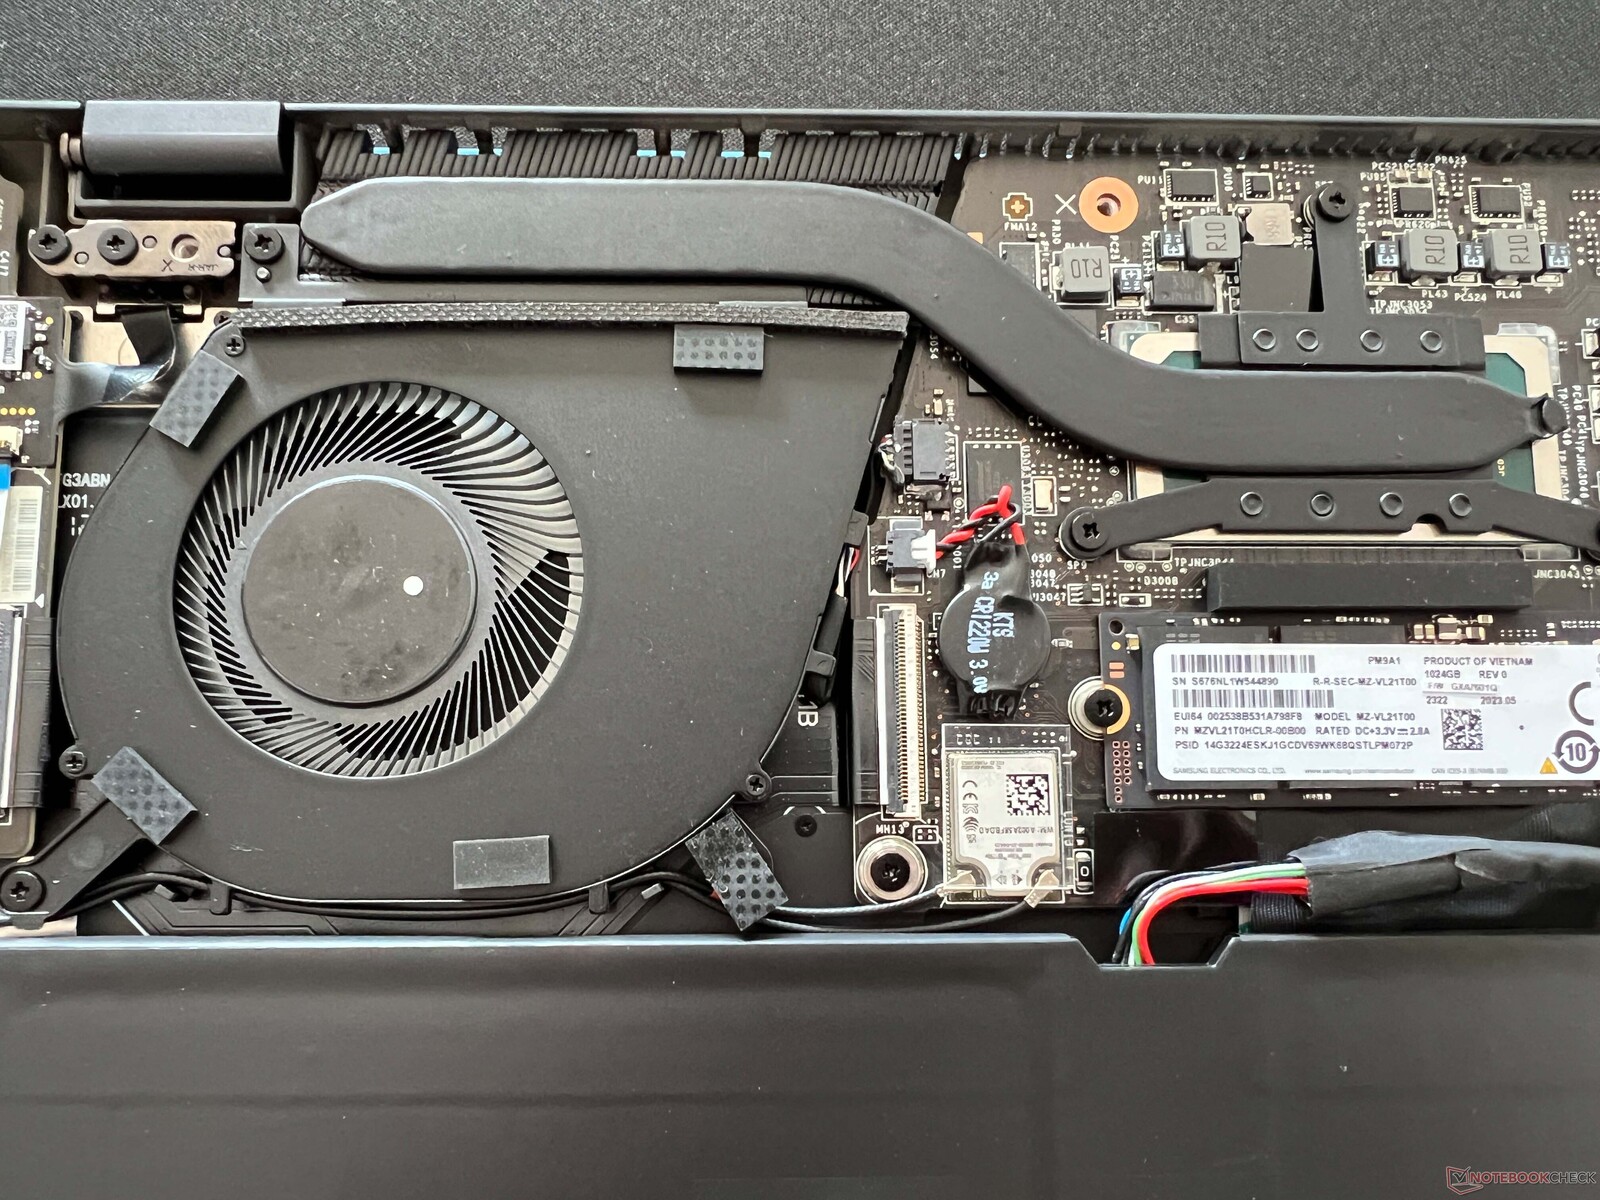
Manutenzione
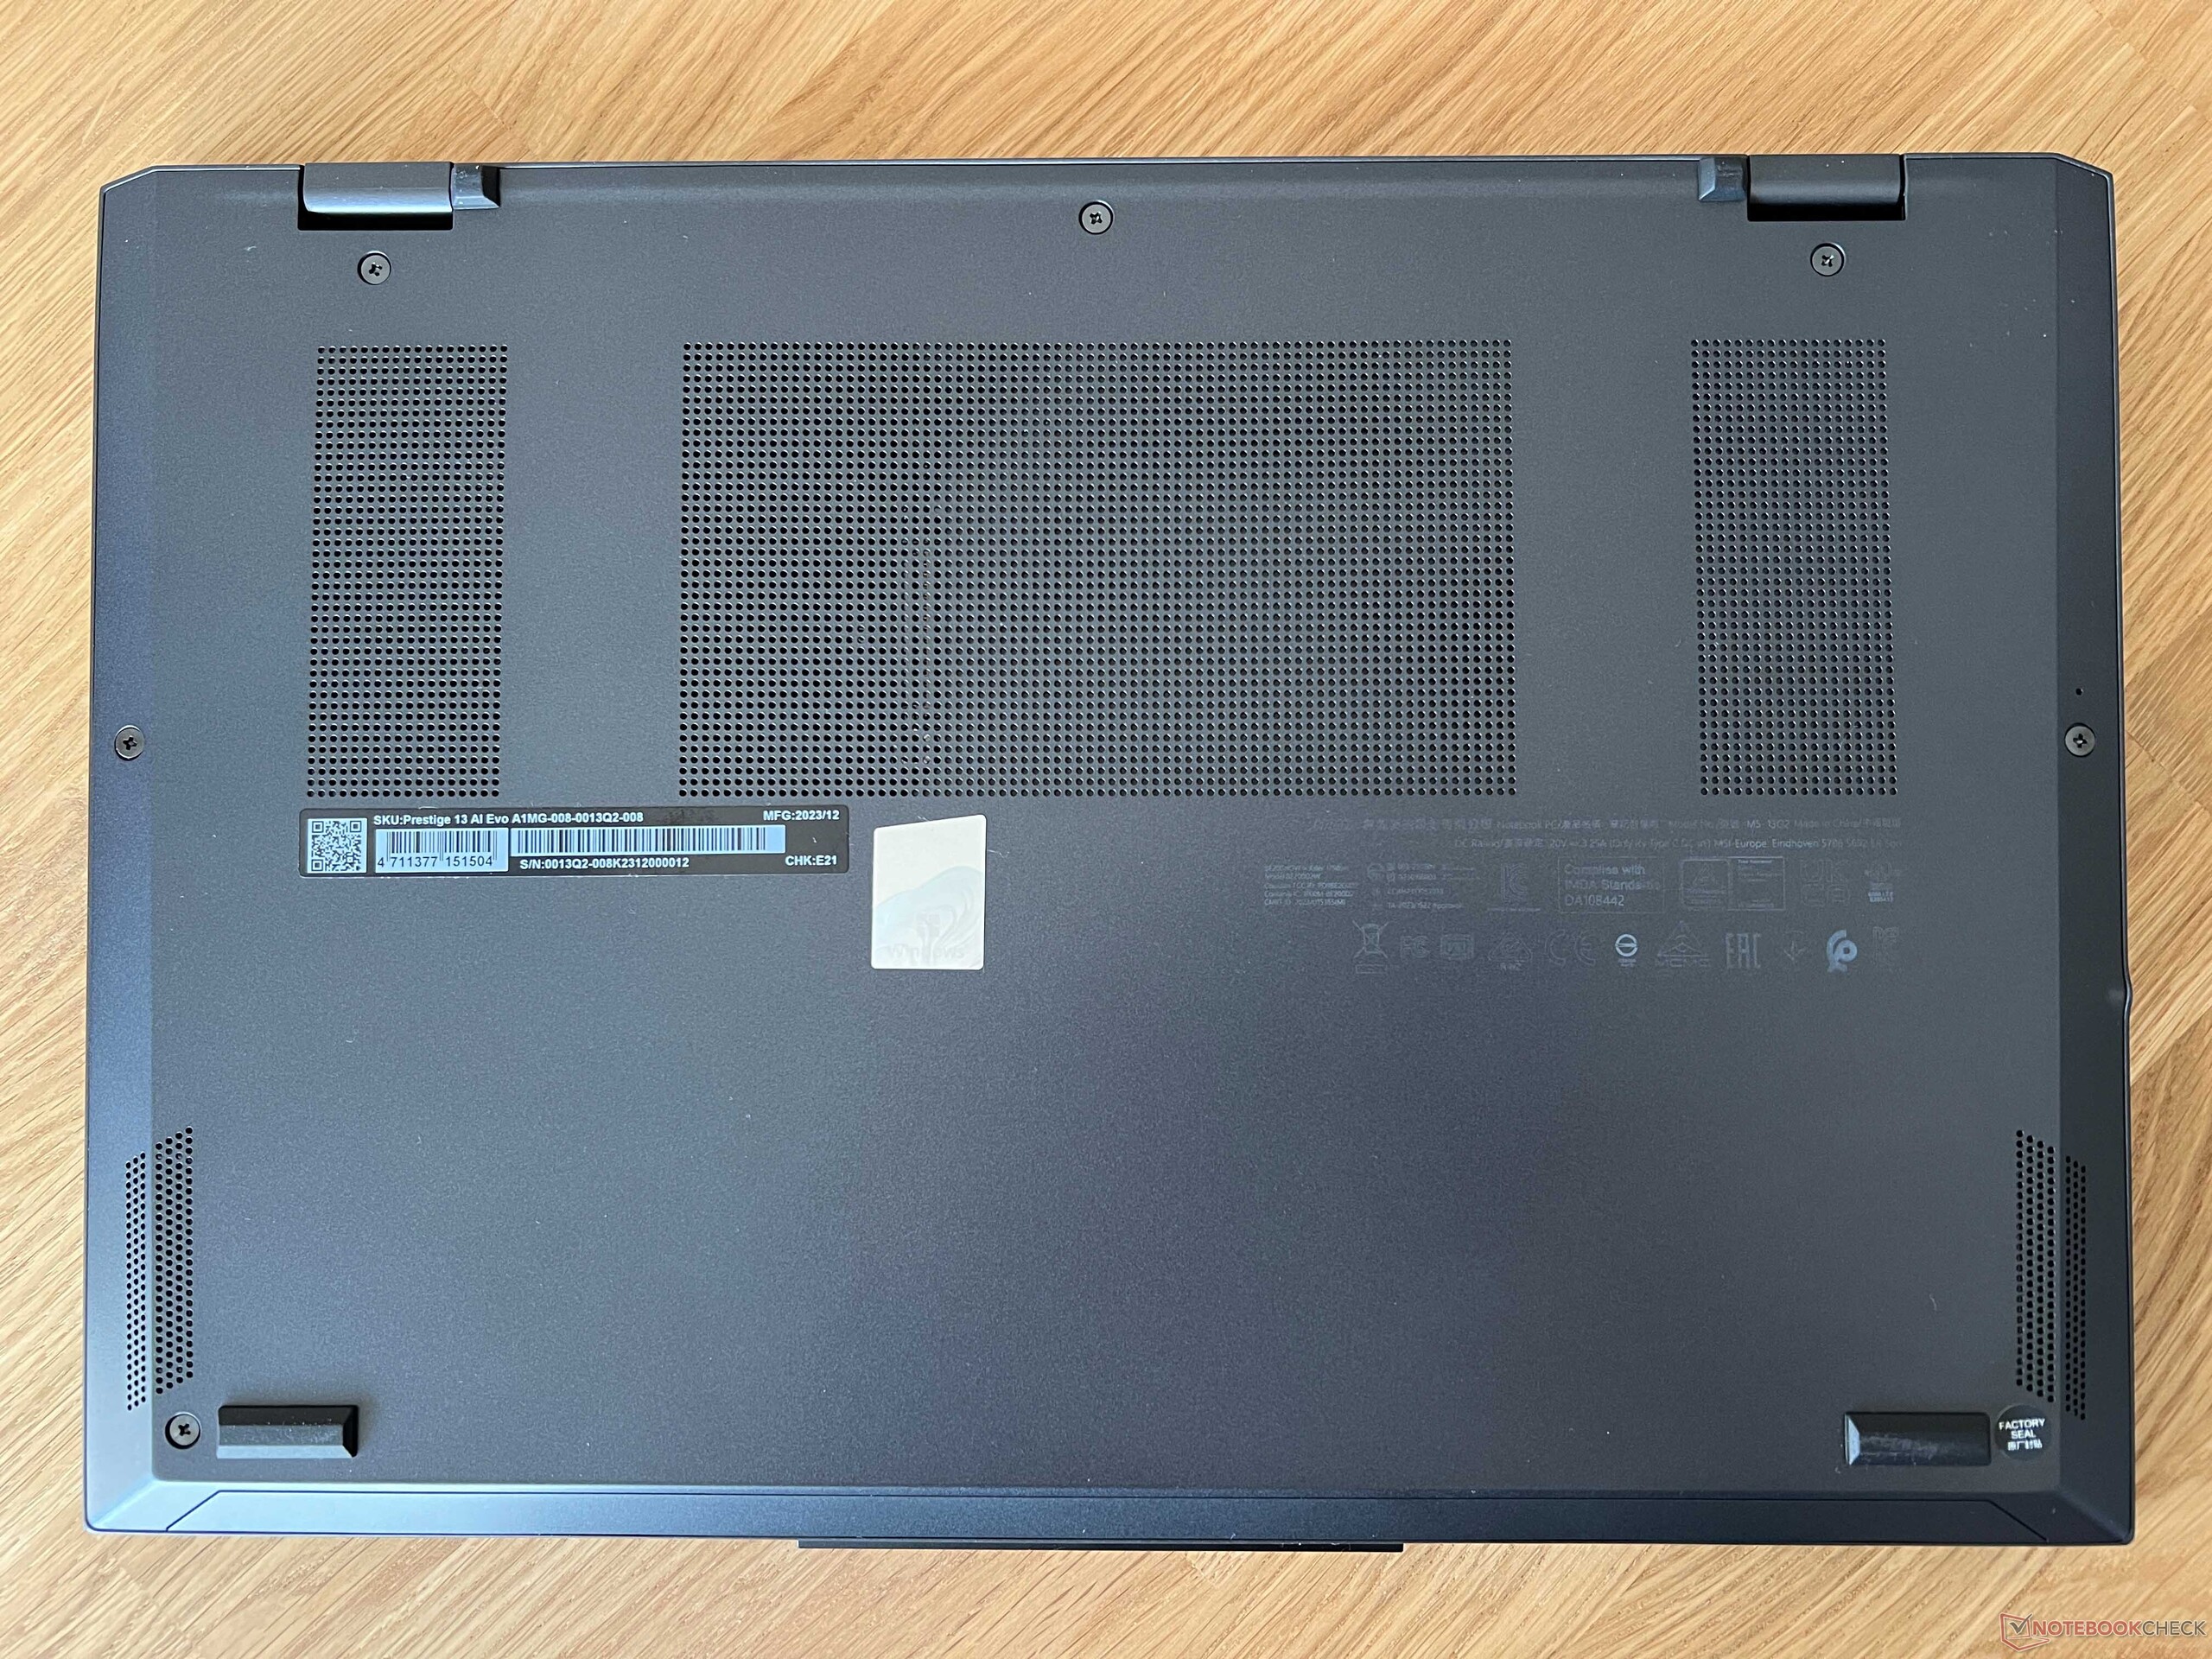
La parte inferiore del case è fissata con normali viti a croce e può essere facilmente rimossa. La ventola può essere pulita e l'SSD e la batteria possono essere sostituiti. Tutti gli altri componenti, invece, sono saldati. Questo include i moduli RAM e WLAN.
Dispositivi di input - Tastiera ridimensionata
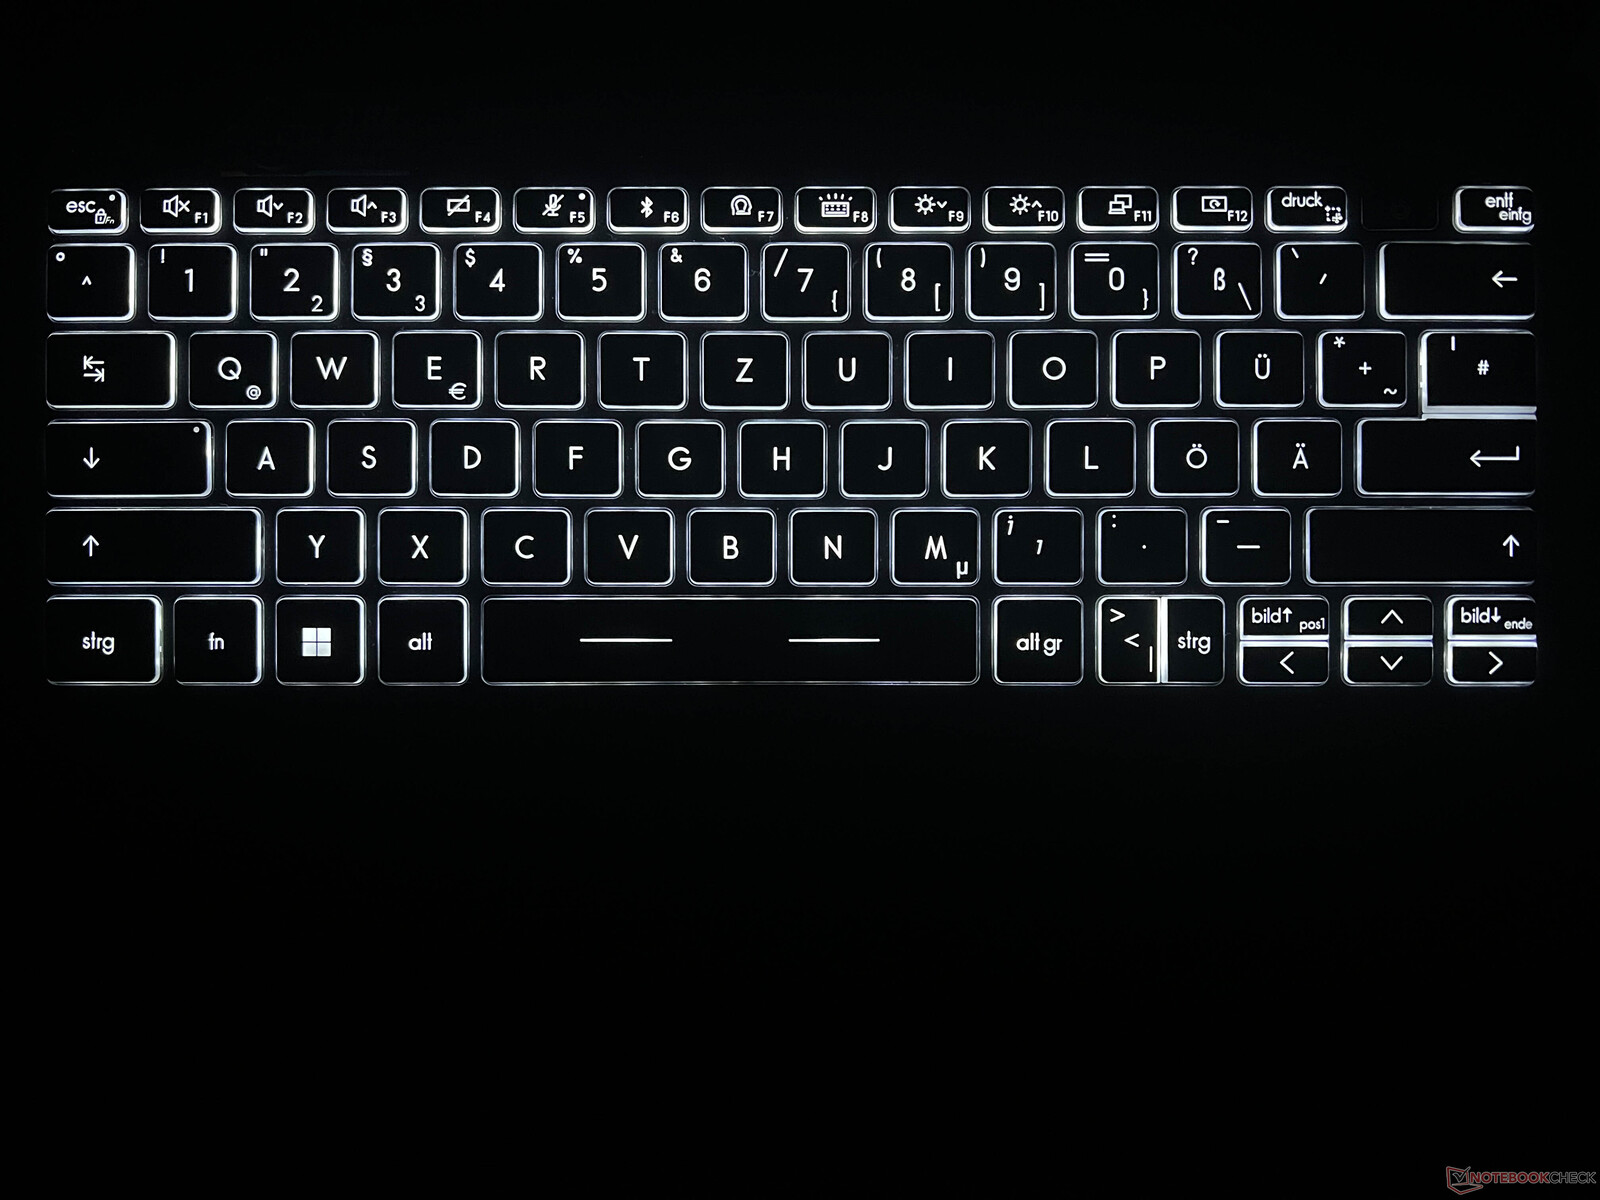
La tastiera nera è nella media per quanto riguarda la digitazione. La meccanica è precisa, ma i tasti non sono molto alti (17 mm di larghezza, 1,4 mm di altezza), il che potrebbe costringere ad abituarsi all'inizio. Il layout in generale sembra piuttosto angusto, ma almeno MSI ha installato dei tasti dedicati per l'apertura/chiusura dell'immagine. Il pulsante di accensione (che include uno scanner di impronte digitali) si trova in alto a destra e si trova in una posizione più profonda all'interno del case, il che significa che si può percepire facilmente. Il tasto di cancellazione si trova all'estrema destra. La retroilluminazione bianca della tastiera presenta tre livelli di intensità.
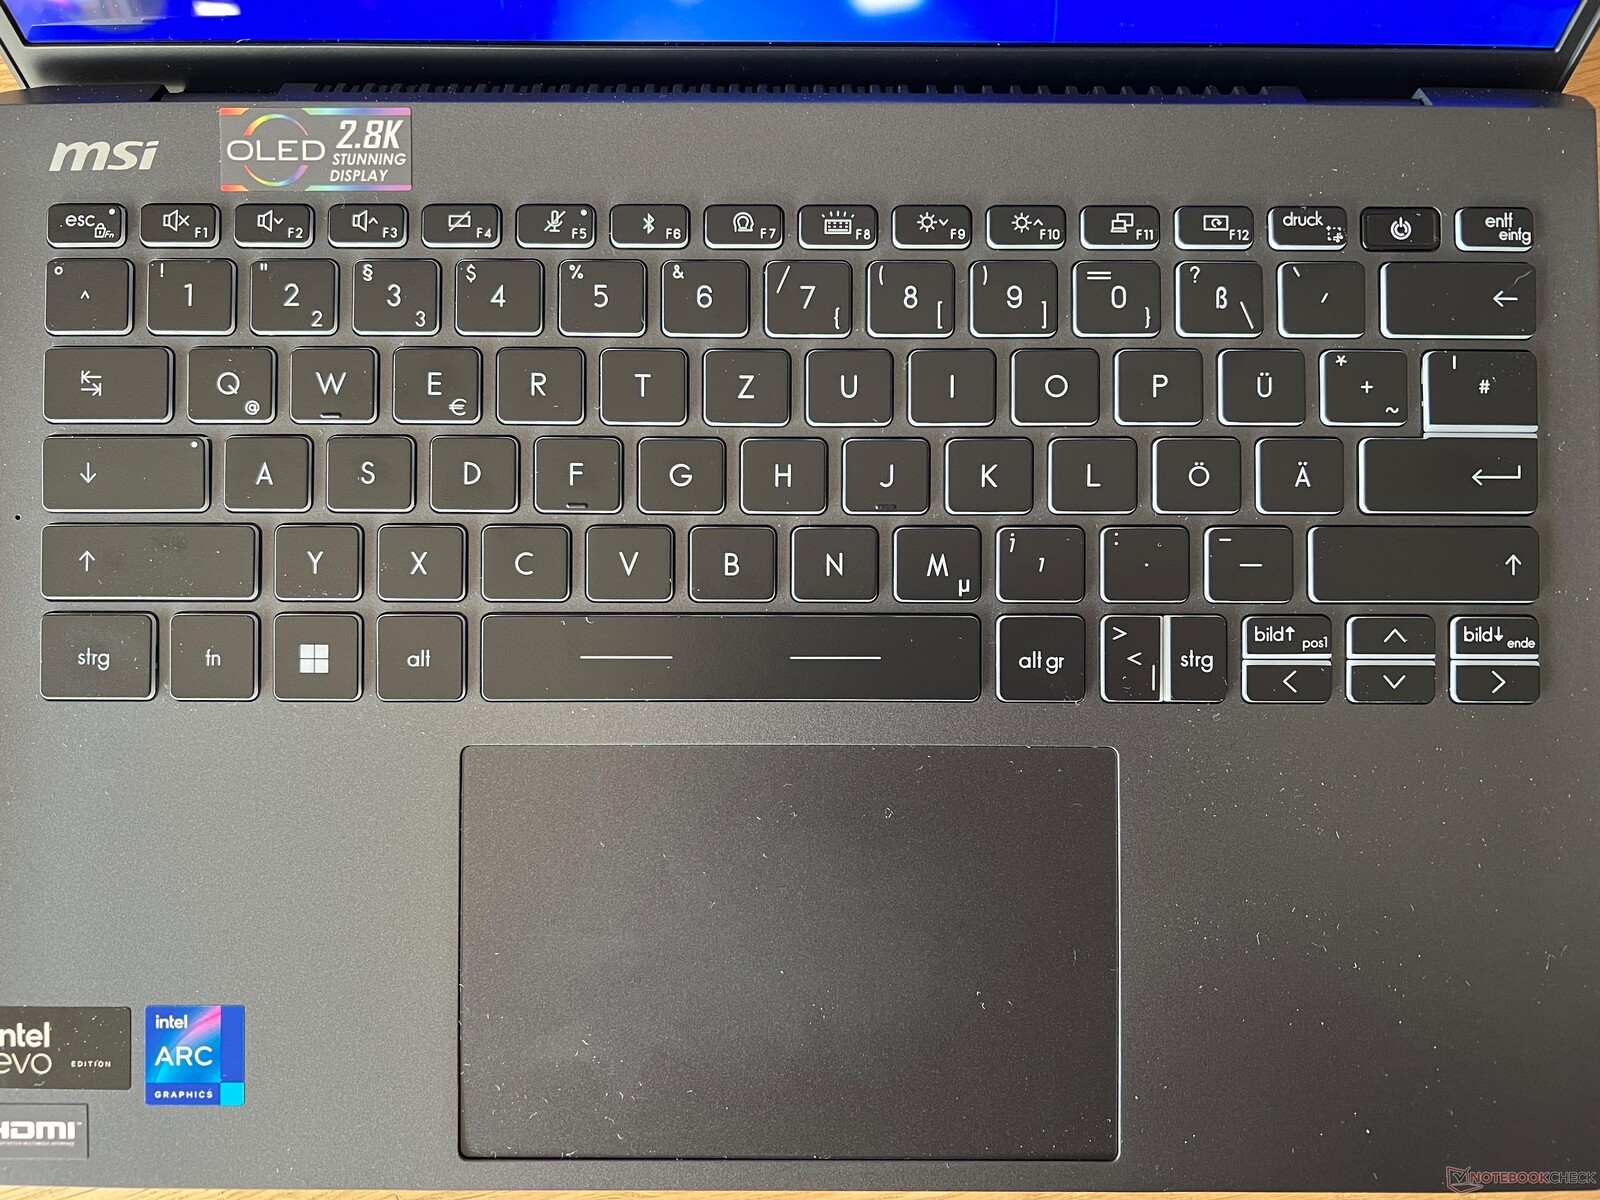
Il clickpad (12 x 7,5 cm) è bello e liscio e non abbiamo avuto problemi durante l'uso. La metà inferiore del pad può essere premuta e il rumore del clic che produce è molto uniforme. Potrebbe essere un po' più silenzioso, ma non ha assolutamente un suono scadente.
Display - OLED 2.8K senza touch
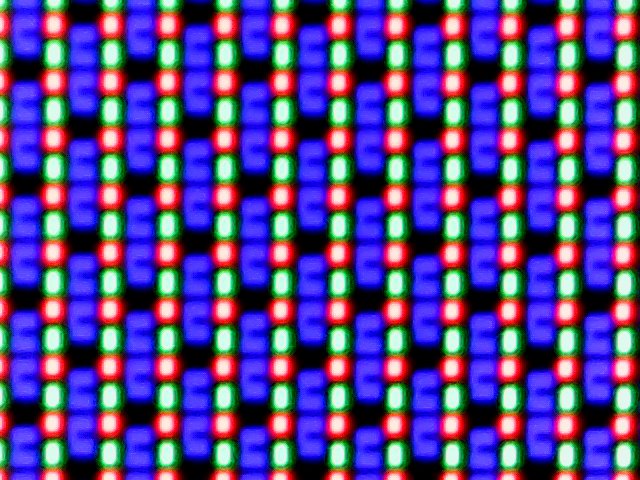
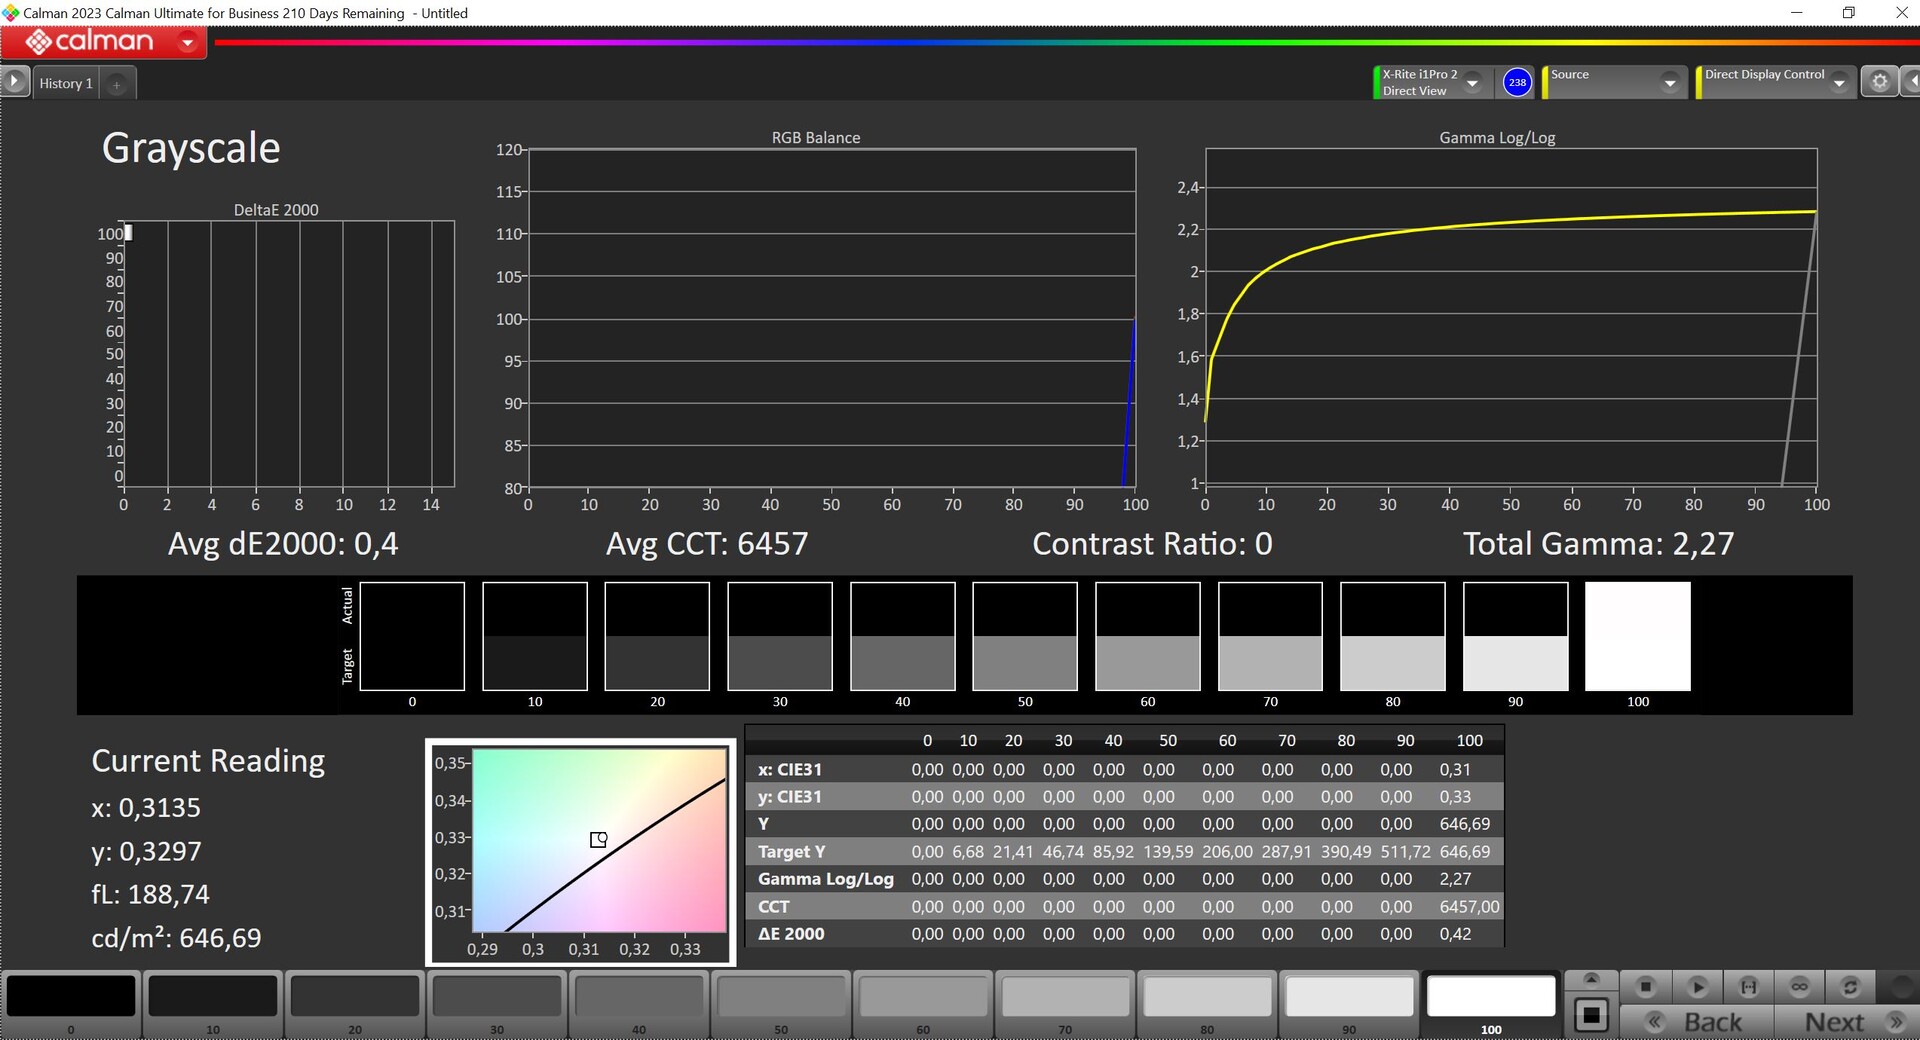
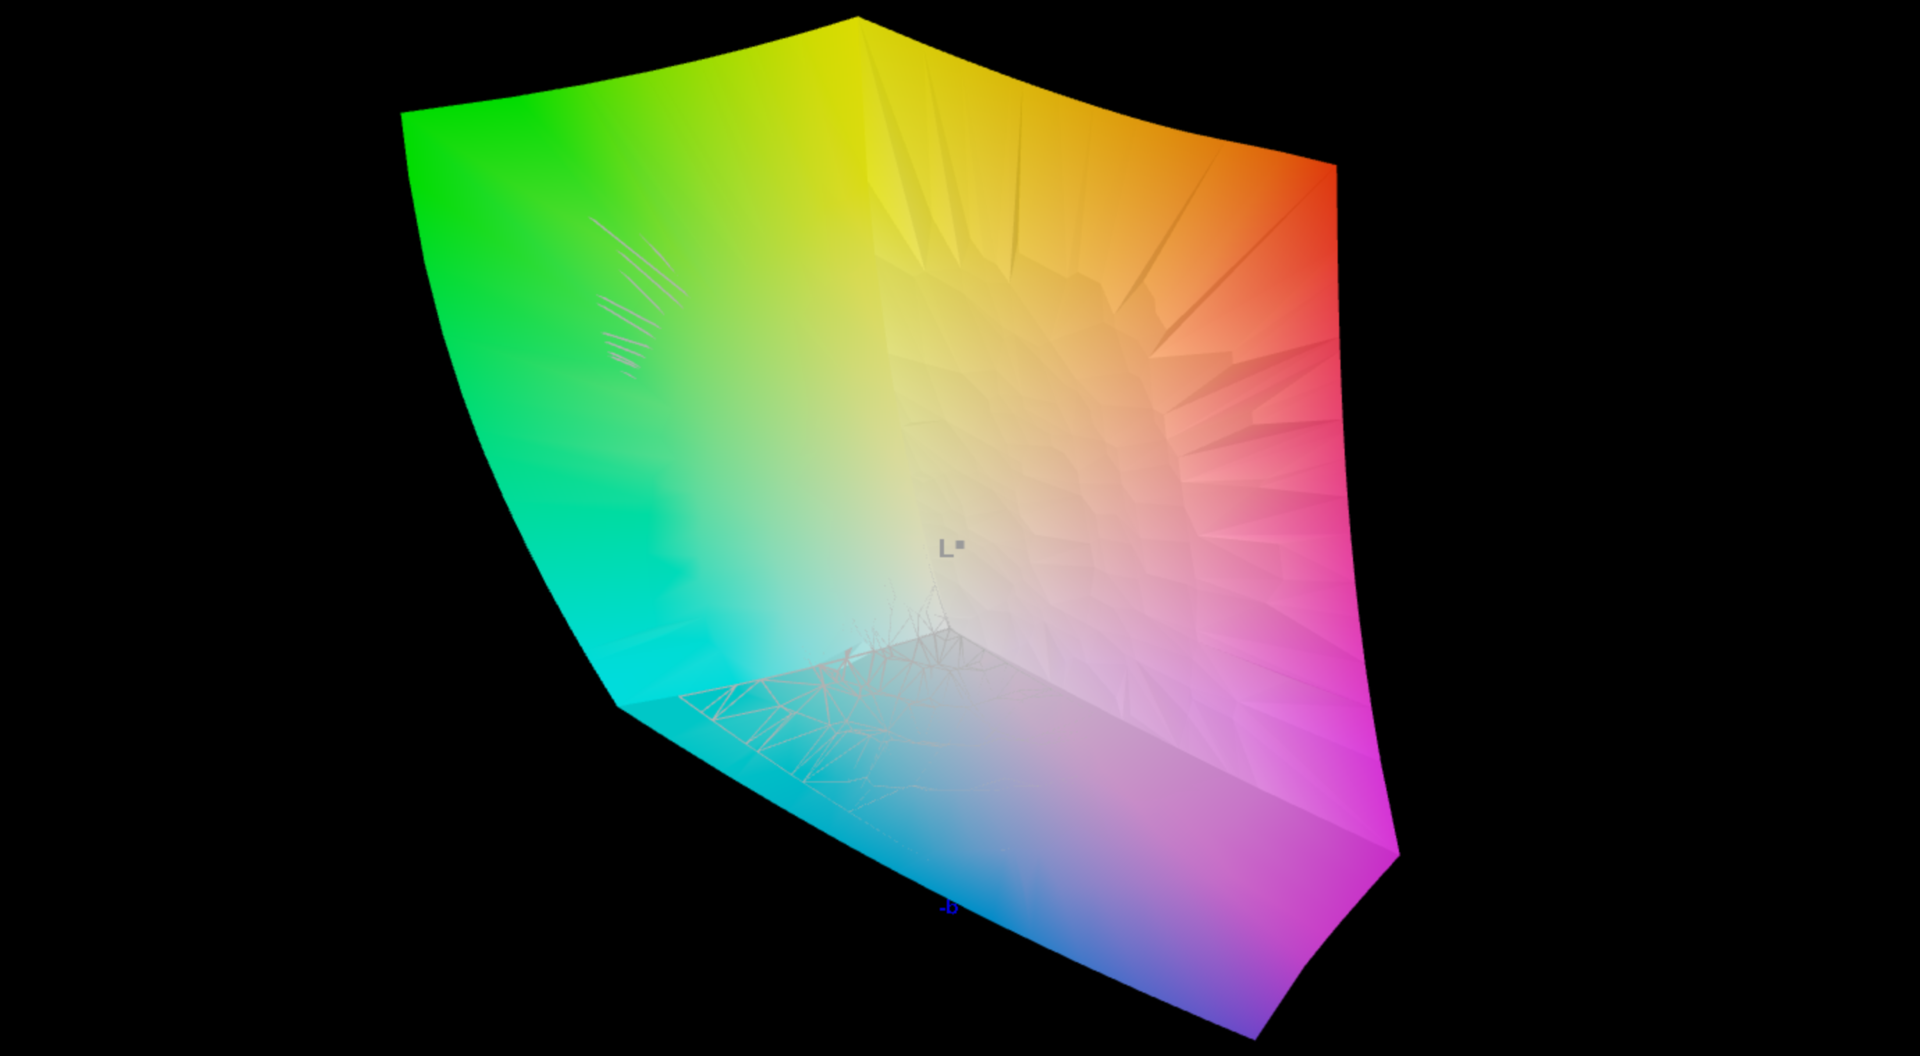
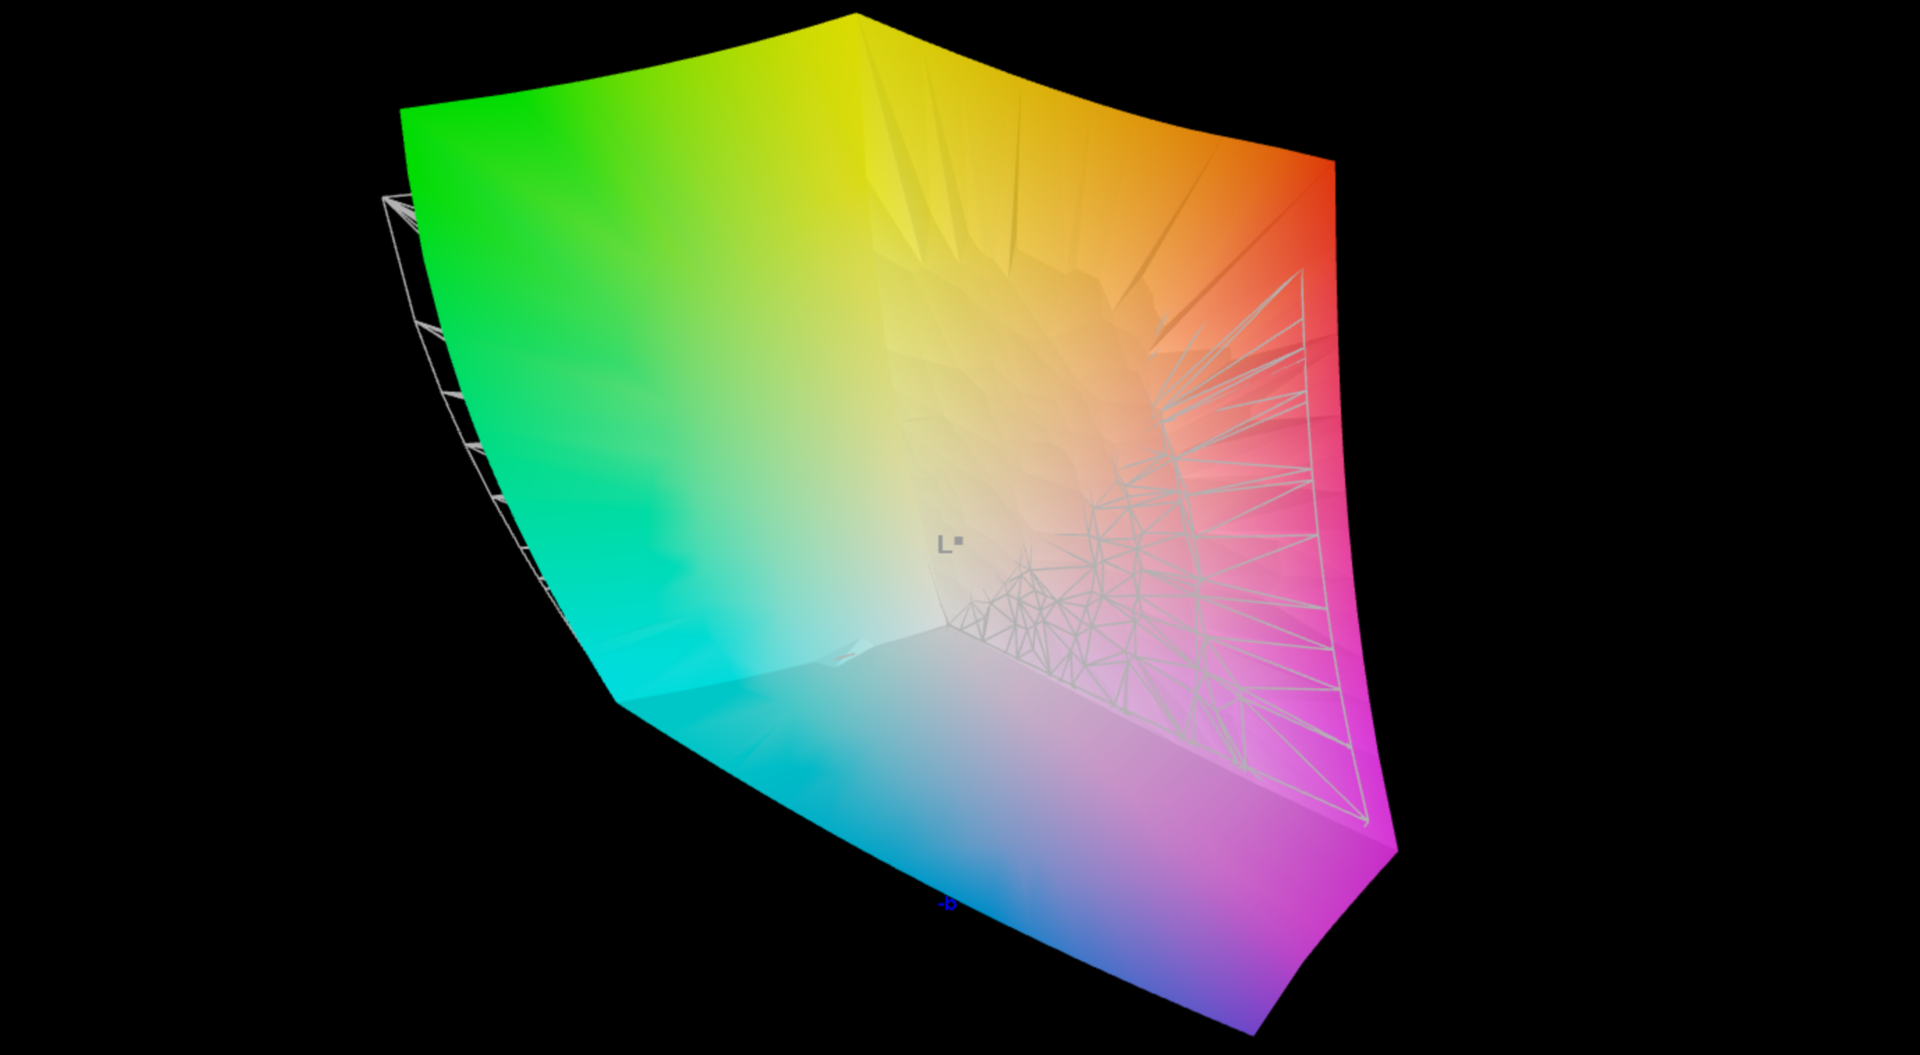
MSI ha installato nel dispositivo un pannello OLED riflettente 16:10 da 13,3 pollici con una risoluzione di 2.880 x 1.800 pixel. Soggettivamente, la qualità dell'immagine è impressionante e i colori sono super vividi. Inoltre, i suoi tempi di risposta sono molto bassi. La sua luminosità massima SDR è di poco superiore a 400 cd/m² e, grazie al suo basso valore di nero, presenta un elevato rapporto di contrasto. Anche questo contribuisce alla qualità dell'immagine vivida. Gli ingressi touch non sono supportati, ma la sua luminosità può essere regolata automaticamente in base alle condizioni di illuminazione ambientale.
Nell'uso dell'HDR, la sua luminosità massima HDR sale fino a 647 cd/m² quando vengono rappresentati piccoli estratti di immagine e poco più di 500 cd/m² quando viene rappresentato quasi interamente il bianco. Come accade anche su tutti gli altri computer portatili Windows, deve prima attivare manualmente la modalità HDR per evitare che la gestione del colore non funzioni correttamente.
| |||||||||||||||||||||||||
Distribuzione della luminosità: 98 %
Al centro con la batteria: 405 cd/m²
Contrasto: ∞:1 (Nero: 0 cd/m²)
ΔE ColorChecker Calman: 2.1 | ∀{0.5-29.43 Ø4.73}
ΔE Greyscale Calman: 1.2 | ∀{0.09-98 Ø4.97}
97.8% AdobeRGB 1998 (Argyll 3D)
100% sRGB (Argyll 3D)
99.9% Display P3 (Argyll 3D)
Gamma: 2.16
CCT: 6465 K
| MSI Prestige 13 AI Evo ATNA33AA07-0, OLED, 2880x1800, 13.3" | Lenovo ThinkPad X1 Nano Gen 3 MND007ZA1-3, IPS, 2160x1350, 13" | Dell Latitude 13 7340 i5-1345U Chi Mei 133JCG, IPS, 1920x1200, 13.3" | HP Dragonfly G4 Chi Mei CMN13C0, IPS, 1920x1280, 13.5" | Asus ZenBook S13 OLED UX5304 SDC417B, OLED, 2880x1800, 13.3" | |
|---|---|---|---|---|---|
| Display | -20% | -23% | -21% | -0% | |
| Display P3 Coverage (%) | 99.9 | 68.5 -31% | 65.9 -34% | 68.4 -32% | 99.7 0% |
| sRGB Coverage (%) | 100 | 99.5 0% | 96.8 -3% | 98.3 -2% | 100 0% |
| AdobeRGB 1998 Coverage (%) | 97.8 | 69.7 -29% | 67.8 -31% | 70.4 -28% | 96.9 -1% |
| Response Times | -2092% | -2565% | -2572% | -21% | |
| Response Time Grey 50% / Grey 80% * (ms) | 1.54 ? | 39.9 ? -2491% | 51 ? -3212% | 48.8 ? -3069% | 2 ? -30% |
| Response Time Black / White * (ms) | 1.44 ? | 25.8 ? -1692% | 29.04 ? -1917% | 31.3 ? -2074% | 1.6 ? -11% |
| PWM Frequency (Hz) | 240 ? | 240 ? | |||
| Screen | -1% | -65% | -14% | 13% | |
| Brightness middle (cd/m²) | 404 | 461.2 14% | 471 17% | 408.8 1% | 361 -11% |
| Brightness (cd/m²) | 407 | 428 5% | 437 7% | 399 -2% | 365 -10% |
| Brightness Distribution (%) | 98 | 86 -12% | 87 -11% | 90 -8% | 98 0% |
| Black Level * (cd/m²) | 0.29 | 0.2033 | 0.32 | ||
| Colorchecker dE 2000 * | 2.1 | 1.79 15% | 3.24 -54% | 2.02 4% | 1.2 43% |
| Colorchecker dE 2000 max. * | 4.3 | 3.3 23% | 7.19 -67% | 3.84 11% | 1.9 56% |
| Greyscale dE 2000 * | 1.2 | 1.8 -50% | 4.6 -283% | 2.3 -92% | 1.2 -0% |
| Gamma | 2.16 102% | 2.24 98% | 2.2 100% | 2.27 97% | |
| CCT | 6465 101% | 6588 99% | 6520 100% | 6203 105% | 6486 100% |
| Contrast (:1) | 1590 | 2317 | 1278 | ||
| Colorchecker dE 2000 calibrated * | 0.47 | 1.08 | 0.61 | ||
| Media totale (Programma / Settaggio) | -704% /
-386% | -884% /
-508% | -869% /
-481% | -3% /
3% |
* ... Meglio usare valori piccoli
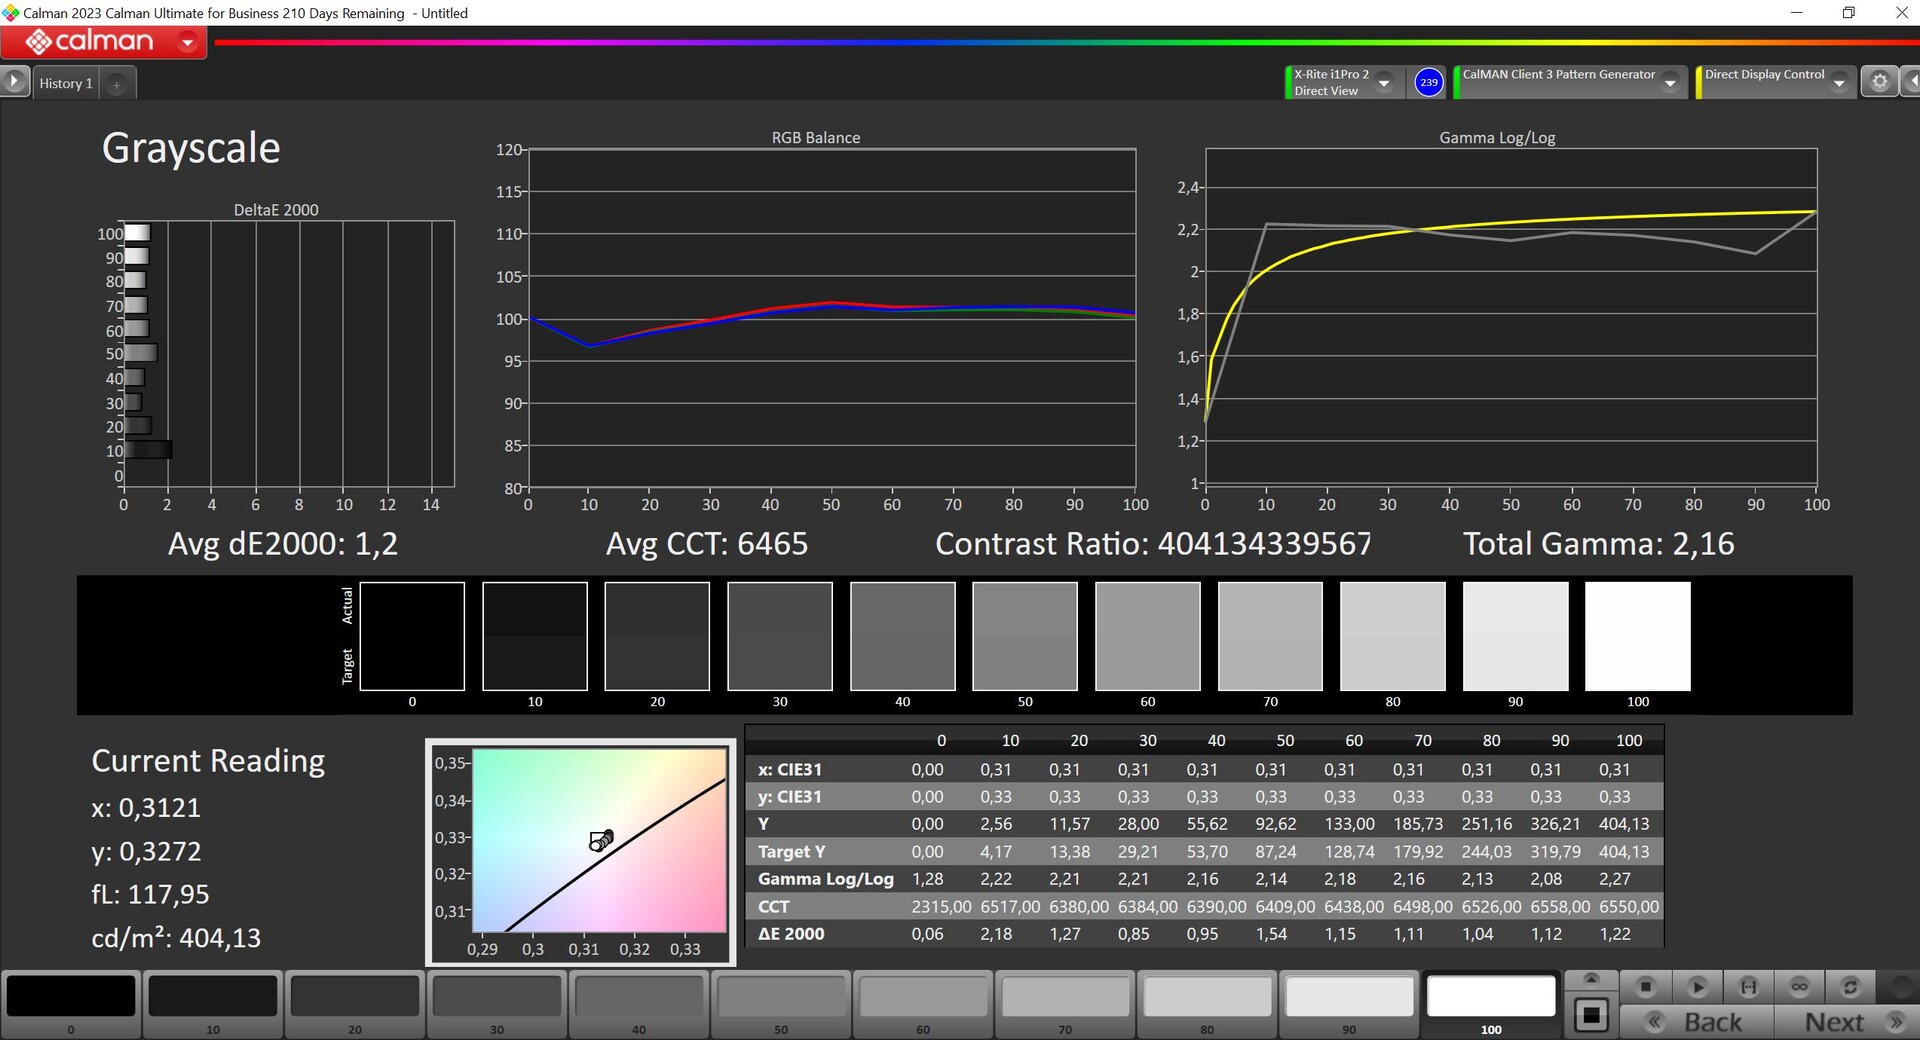
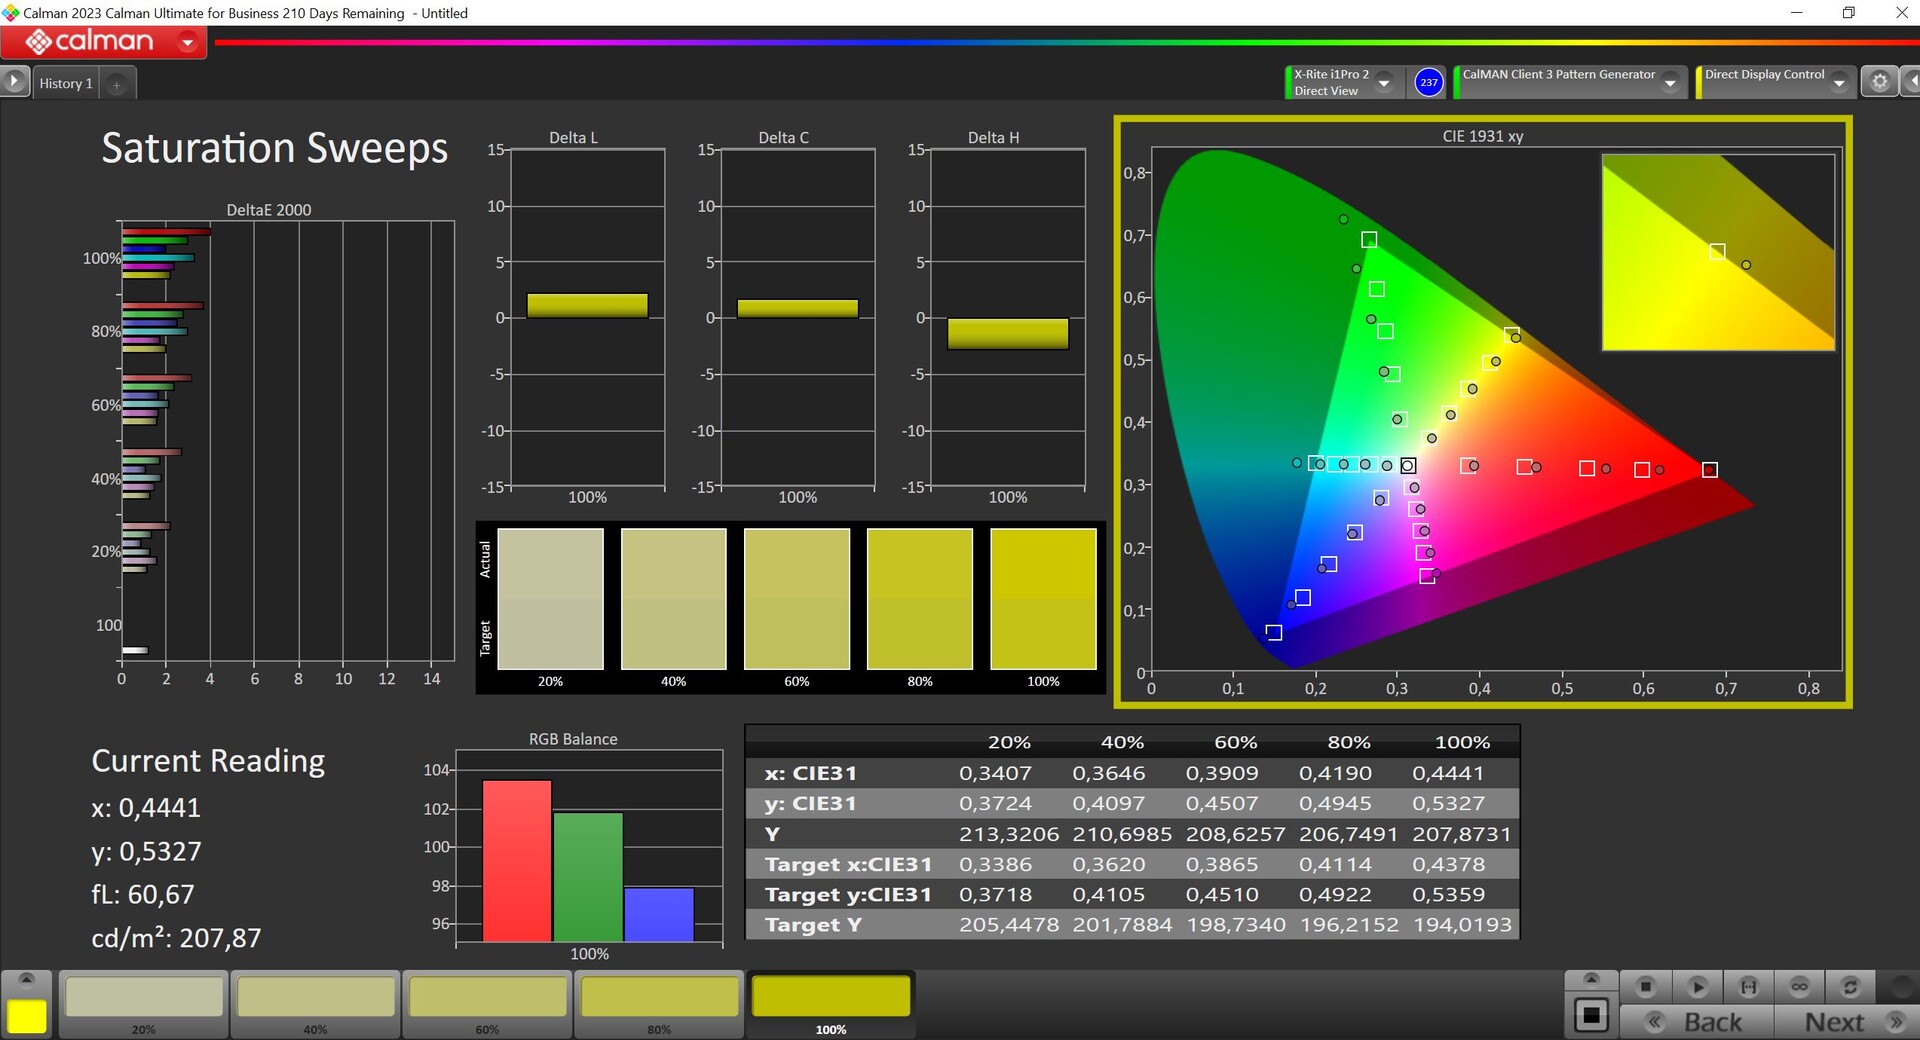
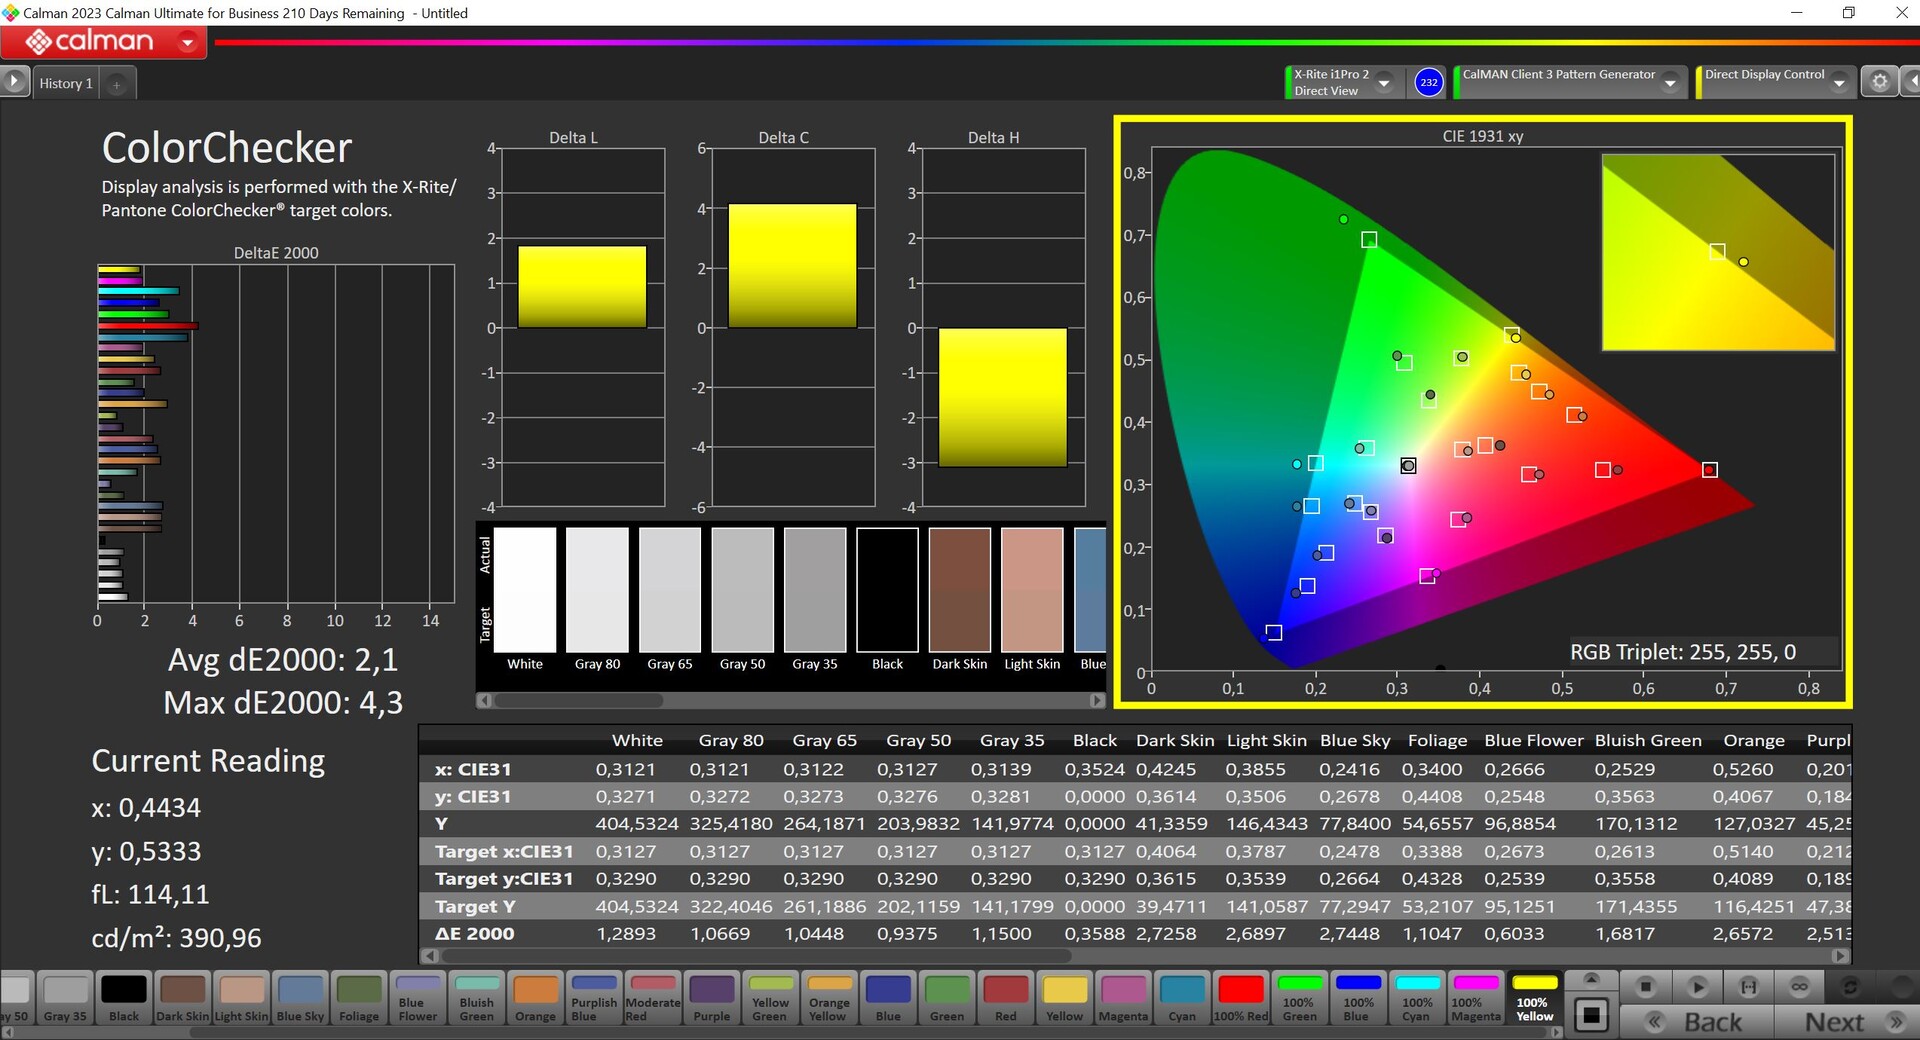
Abbiamo analizzato il pannello utilizzando il software professionale CalMAN (X-Rite i1 Pro2) e, subito dopo l'acquisto, ha fornito una buona rappresentazione. Non abbiamo notato alcuna sfumatura di colore e anche la temperatura del colore era accurata, solo che alcuni colori (100 %) erano superiori all'importante deviazione DeltaE-2000 di 3 (rispetto al riferimento P3). Non siamo stati in grado di correggere questo aspetto attraverso la calibrazione, inoltre MSI non offre un profilo sRGB. Di conseguenza, il Prestige 13 non è il più adatto per l'editing di immagini.

Tempi di risposta del Display
| ↔ Tempi di risposta dal Nero al Bianco | ||
|---|---|---|
| 1.44 ms ... aumenta ↗ e diminuisce ↘ combinato | ↗ 0.73 ms Incremento | 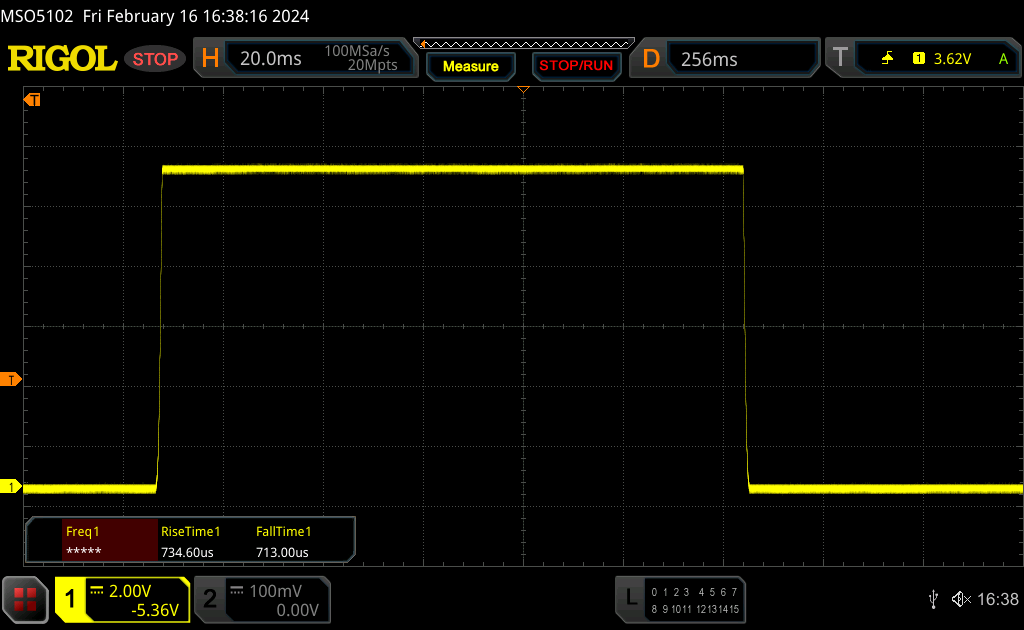 |
| ↘ 0.71 ms Calo | ||
| Lo schermo ha mostrato valori di risposta molto veloci nei nostri tests ed è molto adatto per i gaming veloce. In confronto, tutti i dispositivi di test variano da 0.1 (minimo) a 240 (massimo) ms. » 9 % di tutti i dispositivi è migliore. Questo significa che i tempi di risposta rilevati sono migliori rispettto alla media di tutti i dispositivi testati (19.9 ms). | ||
| ↔ Tempo di risposta dal 50% Grigio all'80% Grigio | ||
| 1.54 ms ... aumenta ↗ e diminuisce ↘ combinato | ↗ 0.79 ms Incremento | 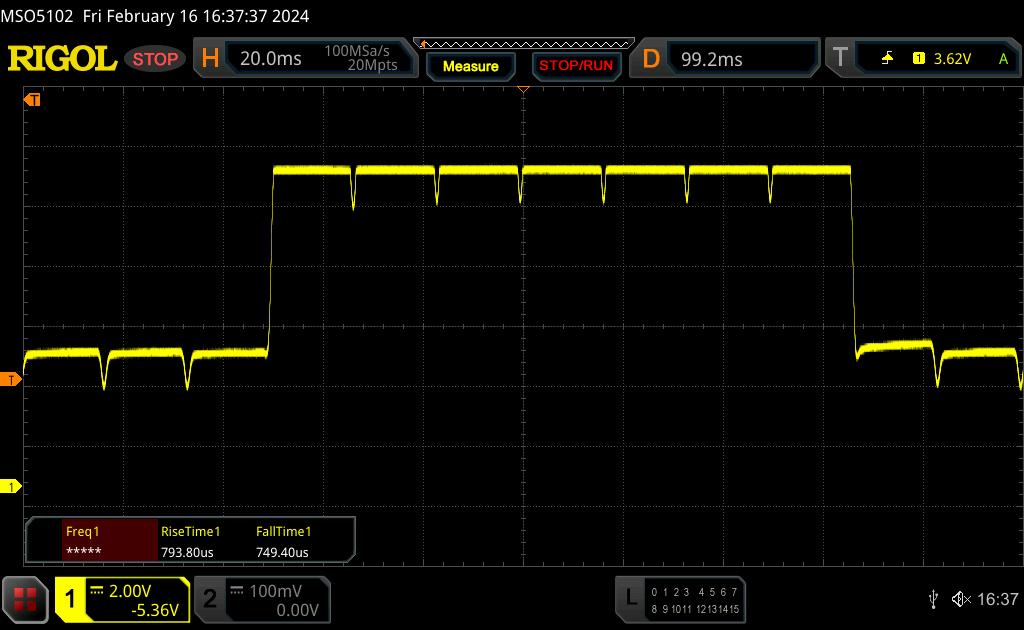 |
| ↘ 0.75 ms Calo | ||
| Lo schermo ha mostrato valori di risposta molto veloci nei nostri tests ed è molto adatto per i gaming veloce. In confronto, tutti i dispositivi di test variano da 0.165 (minimo) a 636 (massimo) ms. » 7 % di tutti i dispositivi è migliore. Questo significa che i tempi di risposta rilevati sono migliori rispettto alla media di tutti i dispositivi testati (31.1 ms). | ||
Sfarfallio dello schermo / PWM (Pulse-Width Modulation)
| flickering dello schermo / PWM rilevato | 240 Hz | ≤ 42 % settaggio luminosita' | 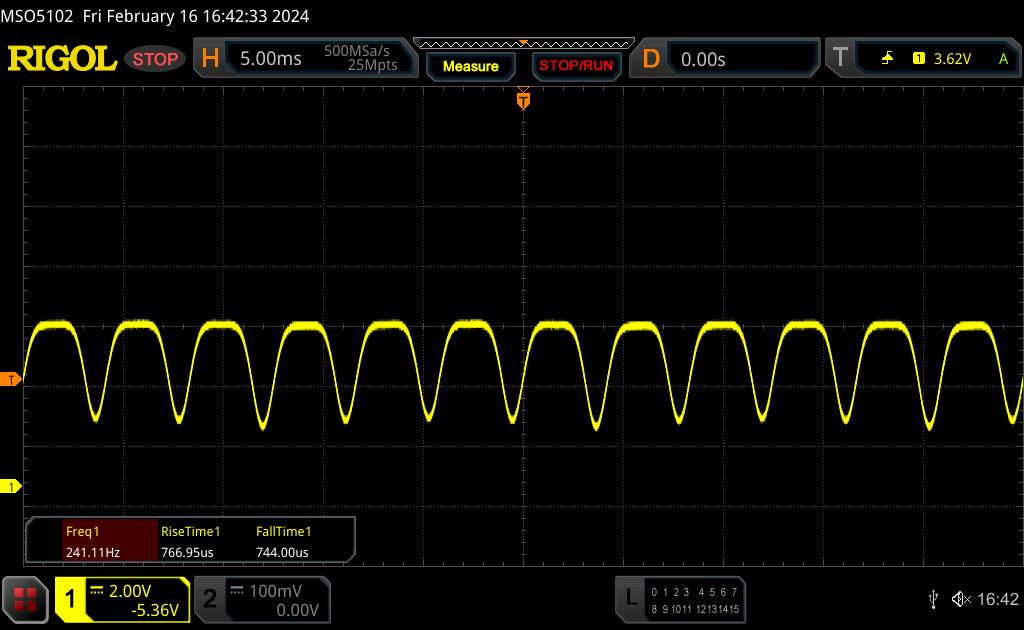 |
Il display sfarfalla a 240 Hz (Probabilmente a causa dell'uso di PWM) Flickering rilevato ad una luminosita' di 42 % o inferiore. Non dovrebbe verificarsi flickering o PWM sopra questo valore di luminosita'. La frequenza di 240 Hz è relativamente bassa, quindi gli utenti sensibili potrebbero notare il flickering ed accusare stanchezza agli occhi a questo livello di luminosità e a livelli inferiori. In confronto: 52 % di tutti i dispositivi testati non utilizza PWM per ridurre la luminosita' del display. Se è rilevato PWM, una media di 7798 (minimo: 5 - massimo: 343500) Hz è stata rilevata. | |||
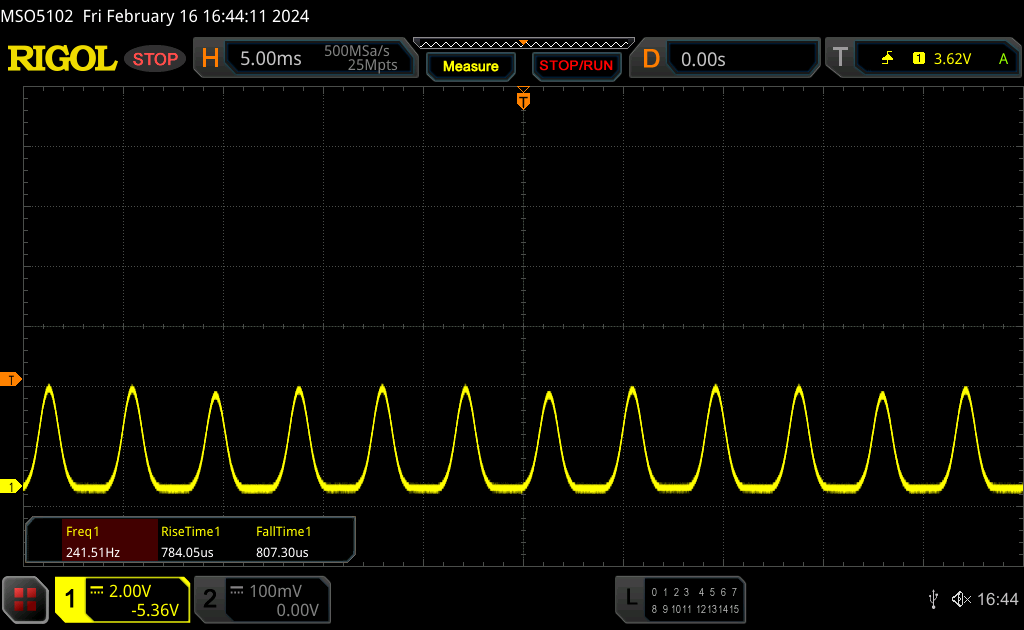
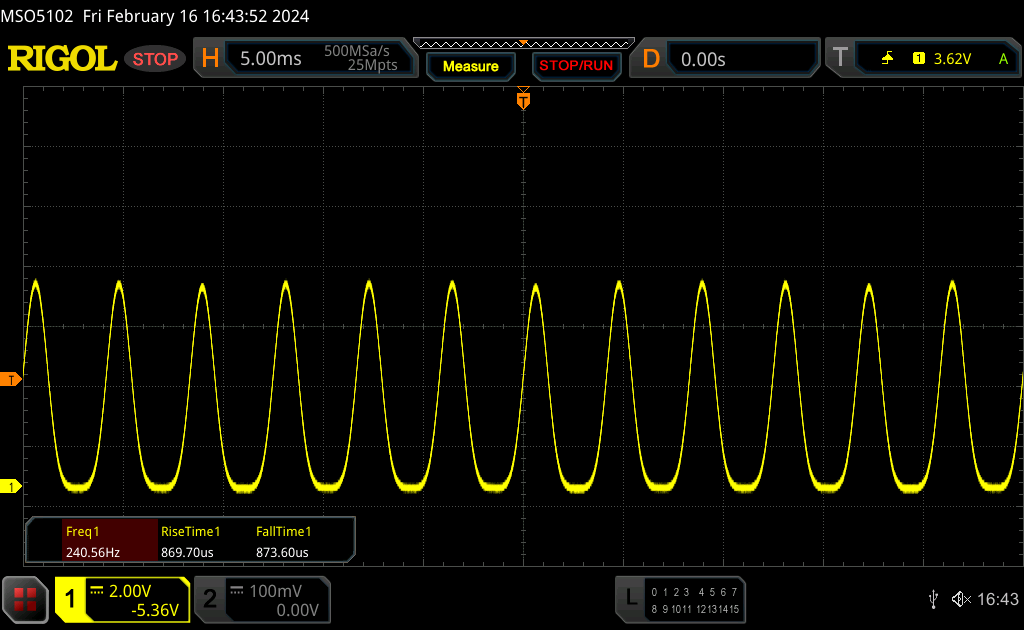
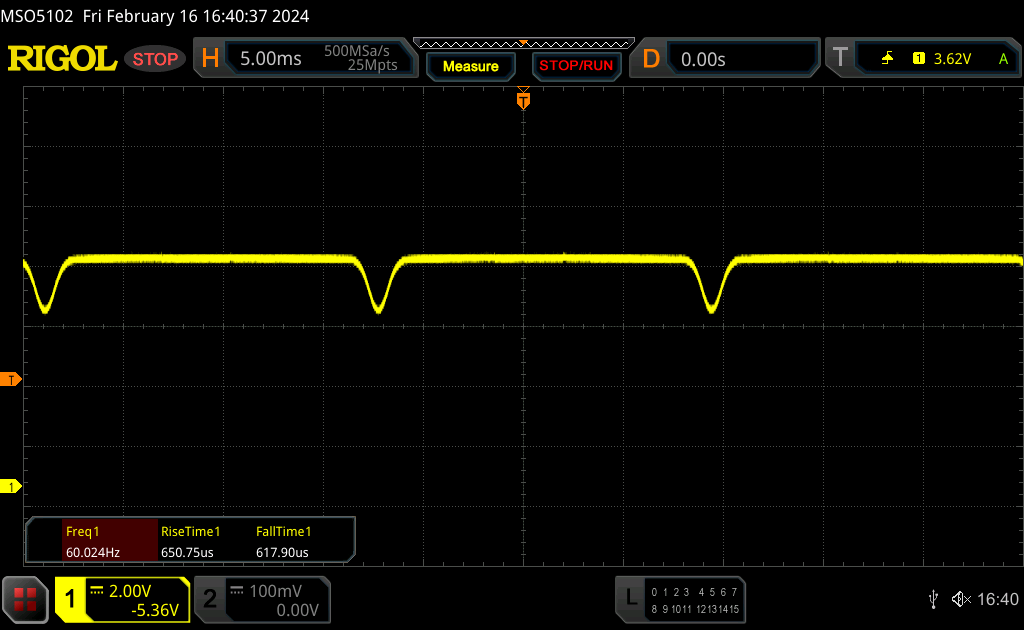
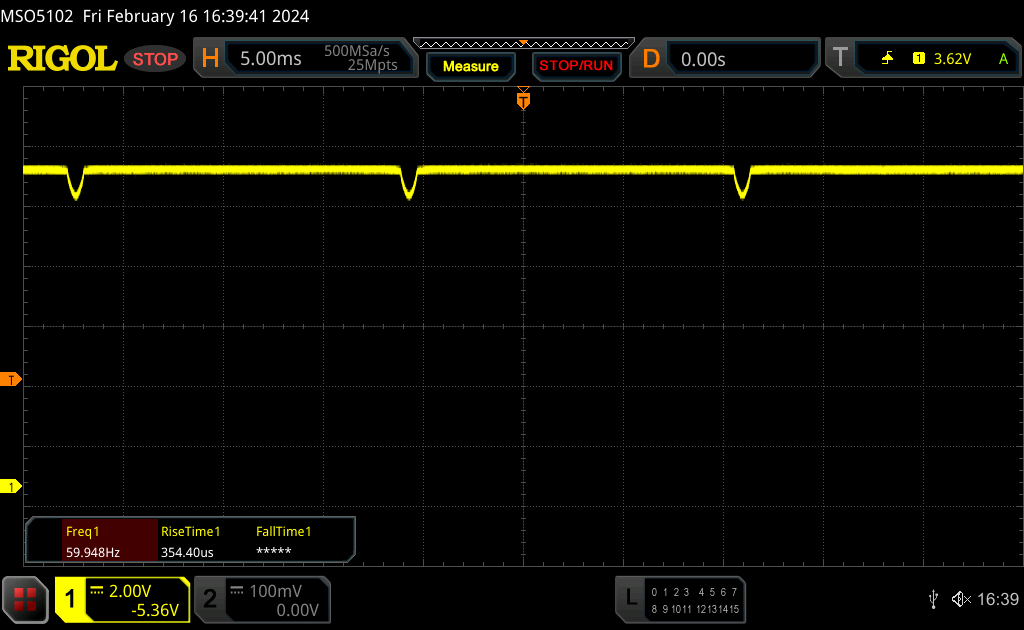
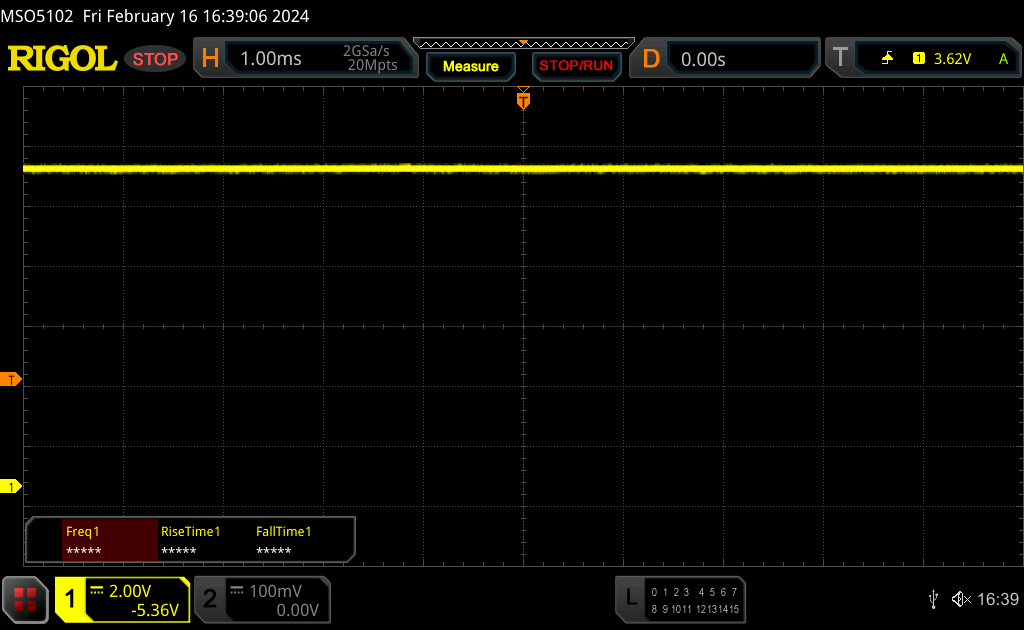
Con il PWM utilizzato, abbiamo misurato l'oscuramento DC a 60 Hz nell'intervallo di luminosità 43-84 %; al 42 % o meno, entra in gioco lo sfarfallio PWM potenzialmente più dannoso a 240 Hz.
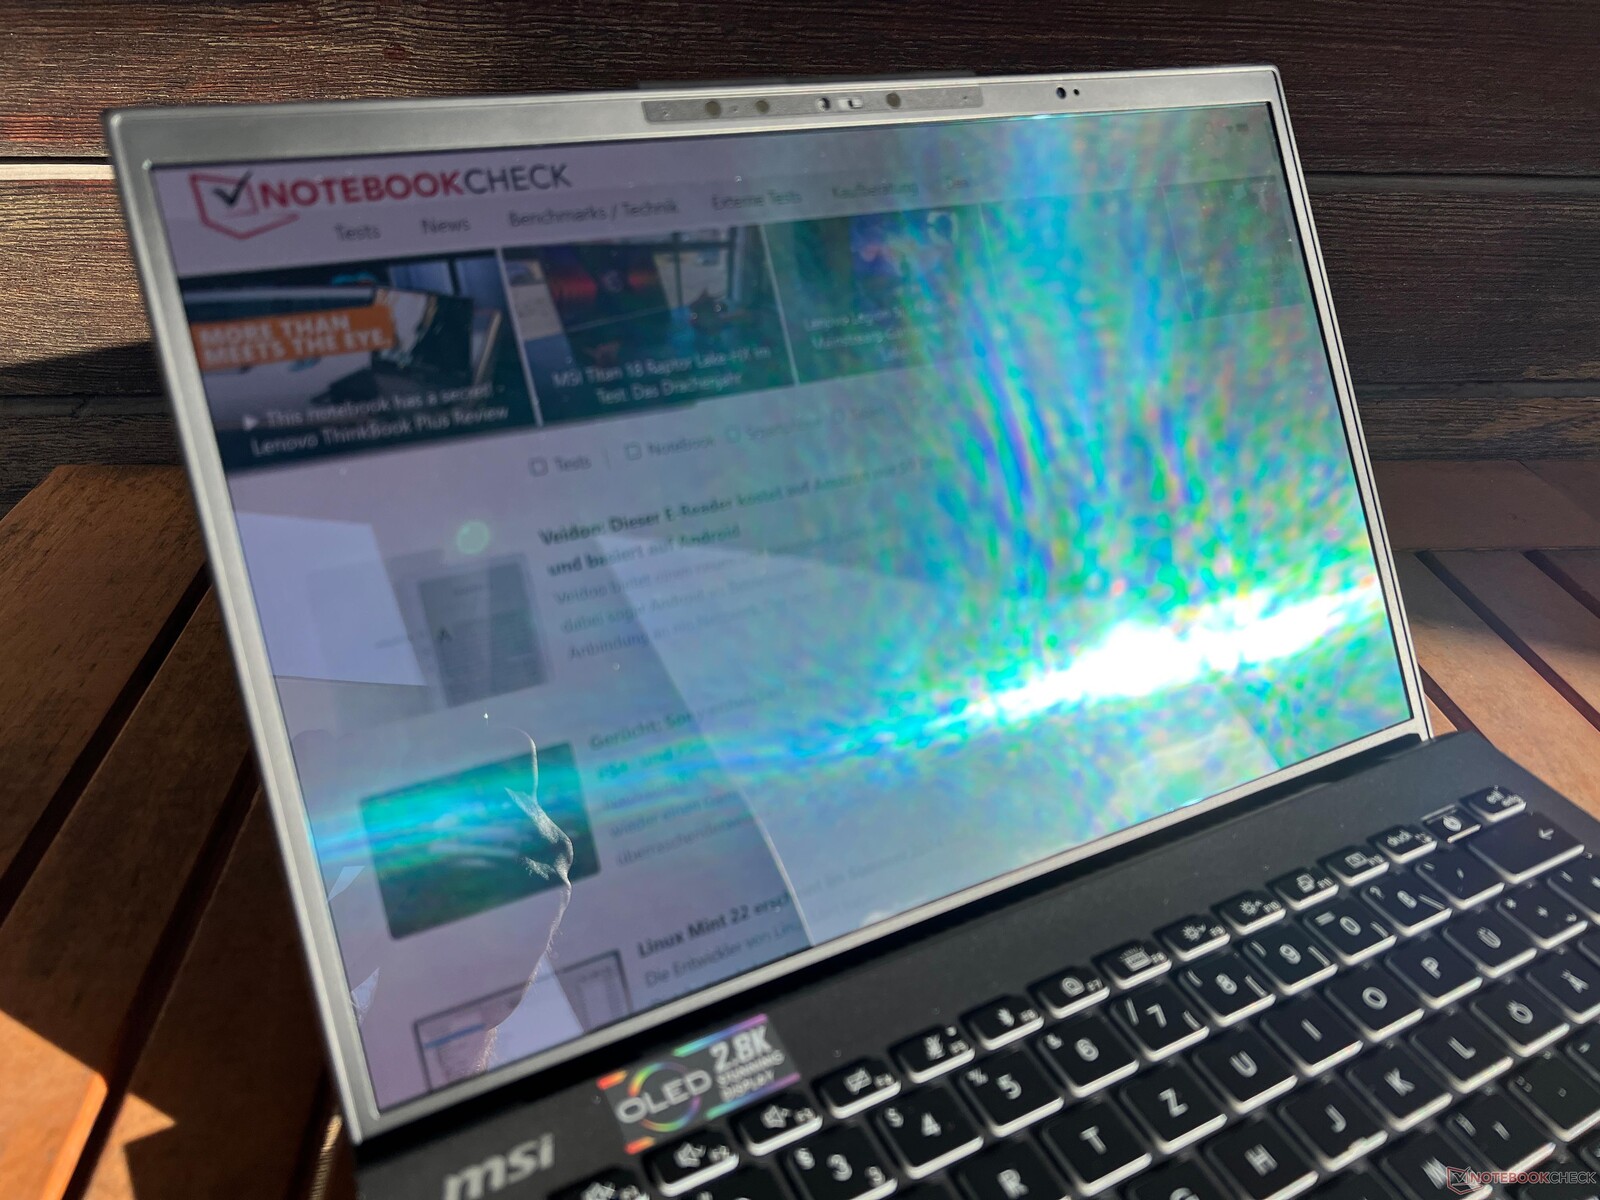
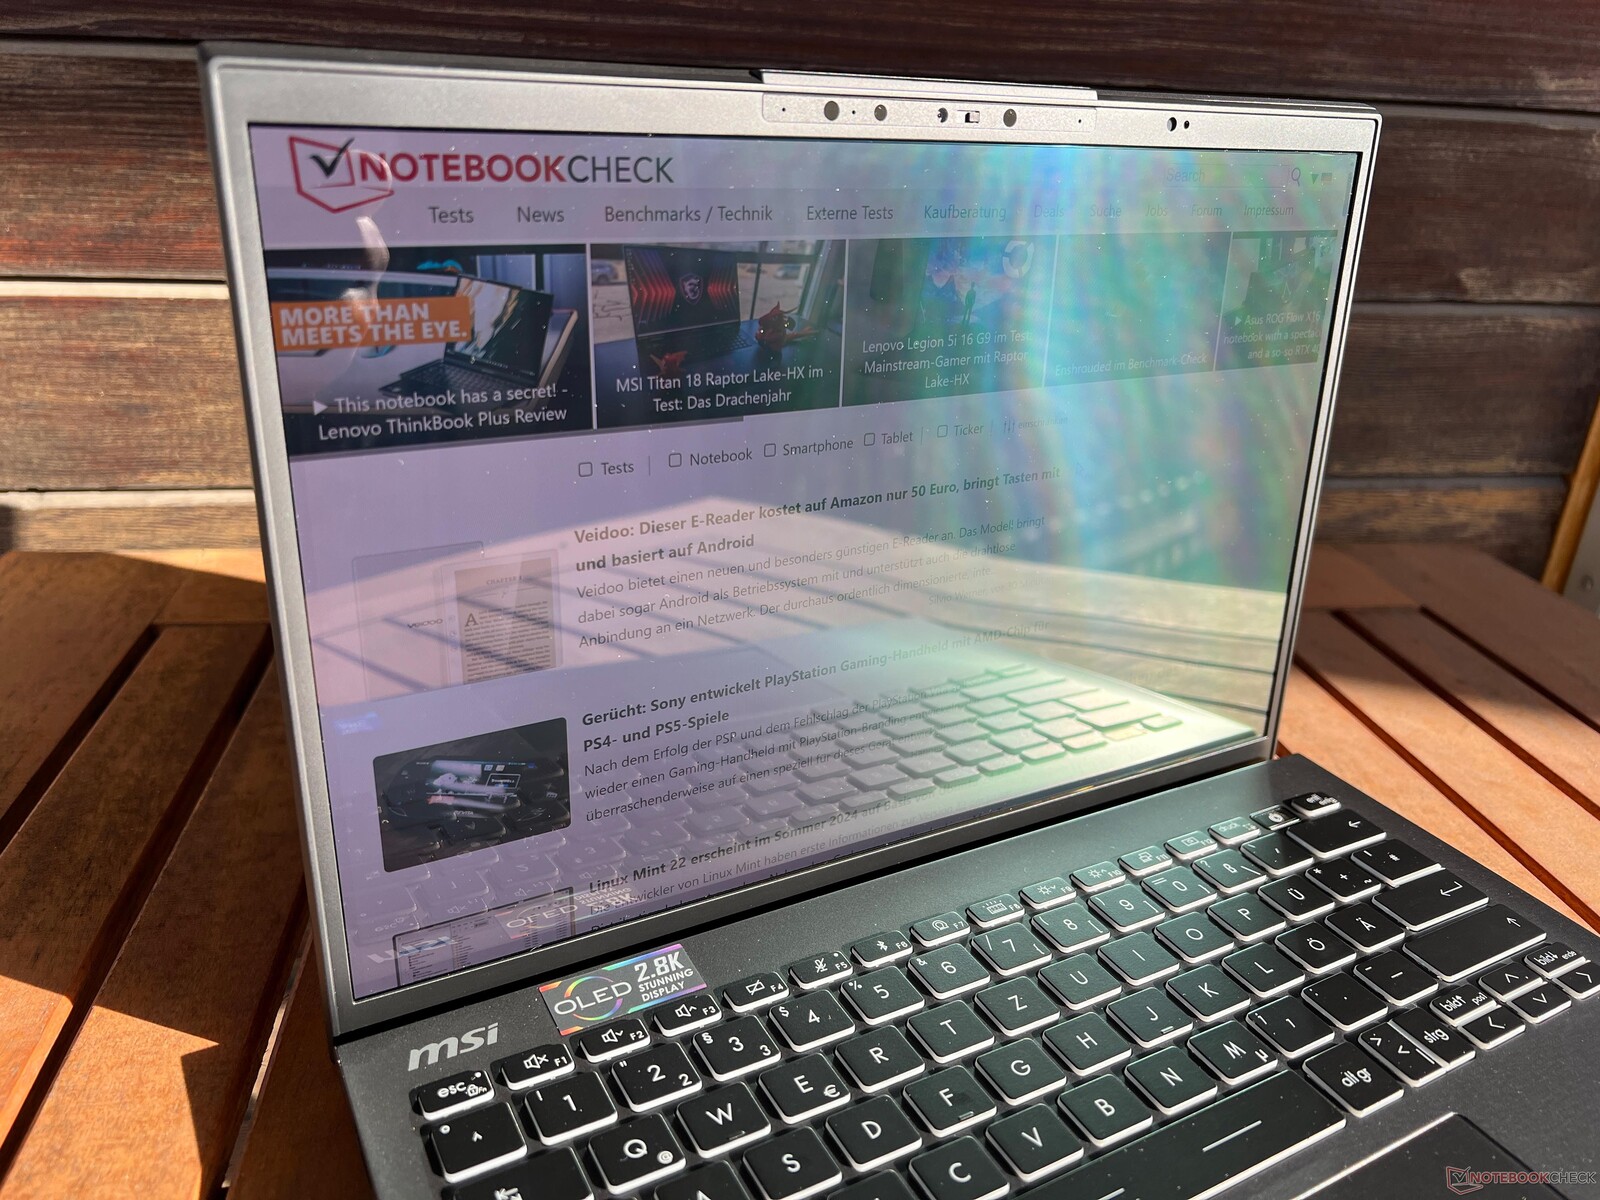

In ambienti luminosi, i riflessi diventano rapidamente un problema sul display lucido. La stabilità dell'angolo di visione è ottima, solo gli angoli estremi provocano il tipico luccichio blu dell'OLED.

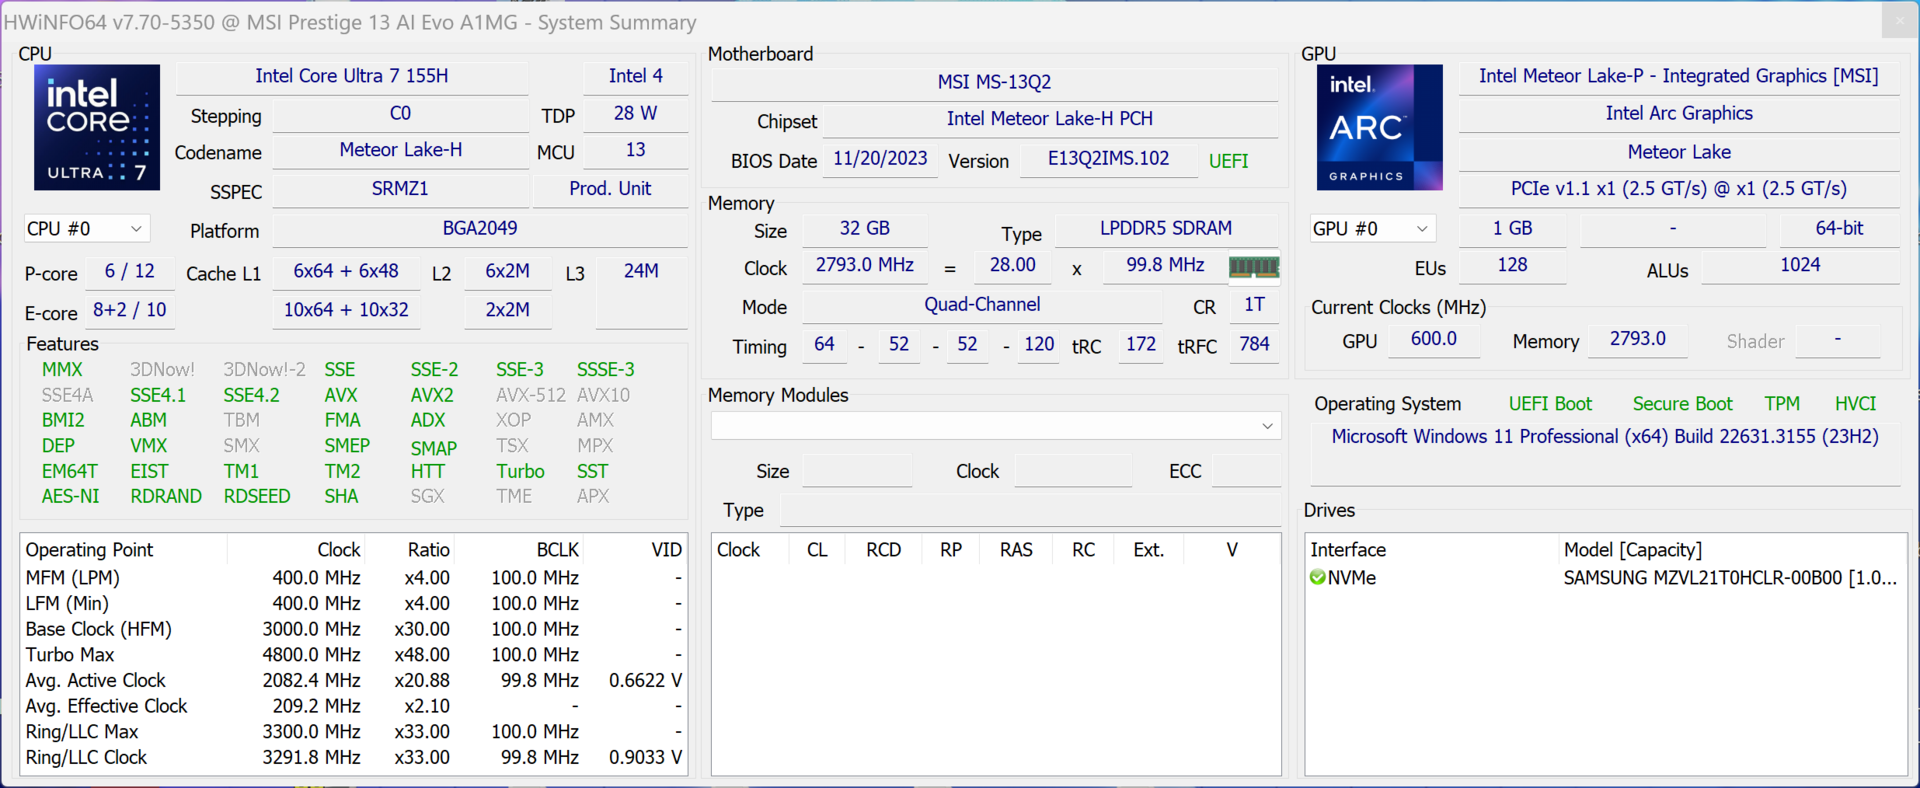
Prestazioni - Meteor Lake-H a 20 watt
Condizioni di test
L'MSI Center preinstallato offre diversi profili energetici, per cui non abbiamo notato grandi differenze tra i singoli profili (ad eccezione della modalità silenziosa ). Successivamente, abbiamo eseguito i seguenti benchmark e misurazioni utilizzando la modalità MSI AI Engine, che è anche impostata come standard.
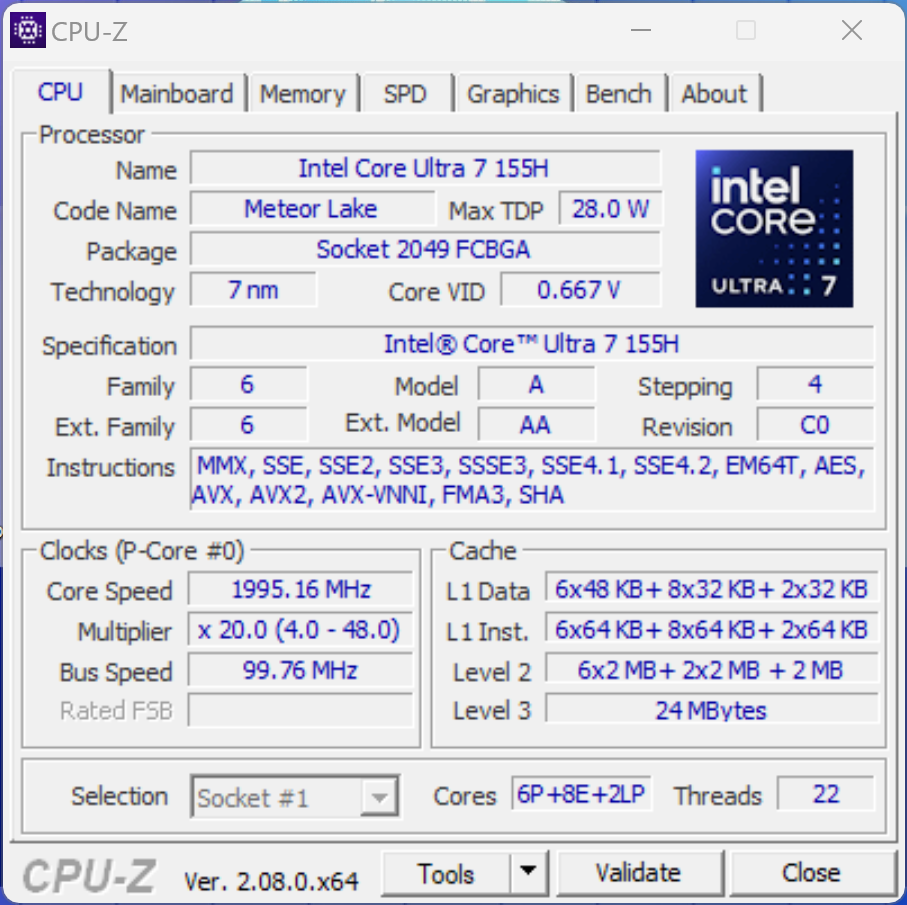
Processore - Core Ultra 7 155H
MSI ha equipaggiato il portatile con il nuovo Meteor-Lake Core Ultra 7 155H di Intel, che può essere utilizzato con un TDP compreso tra 28 e 115 watt. Nel caso del Prestige 13, abbiamo notato un massimo di 64 watt per circa 30 secondi quando il dispositivo era freddo, dopodiché il consumo è sceso a 20 watt. Un processore della serie U sarebbe stato probabilmente una scelta migliore, ma poiché queste CPU dispongono solo di 2 veloci core P, le loro prestazioni sono piuttosto modeste. Sotto carico a breve termine (cosa molto più probabile in un subnotebook), le sue prestazioni multi-core sono ovviamente molto buone. Le prestazioni single-core sono buone, ma in questo aspetto le CPU Meteor-Lake non mostrano alcun vantaggio rispetto ai vecchi modelli Raptor-Lake. Nell'uso della batteria, le prestazioni della CPU rimangono costanti. Ulteriori benchmark della CPU sono disponibili qui.
Cinebench R15 Multi continuous test
Cinebench R23: Multi Core | Single Core
Cinebench R20: CPU (Multi Core) | CPU (Single Core)
Cinebench R15: CPU Multi 64Bit | CPU Single 64Bit
Blender: v2.79 BMW27 CPU
7-Zip 18.03: 7z b 4 | 7z b 4 -mmt1
Geekbench 6.7: Multi-Core | Single-Core
Geekbench 5.5: Multi-Core | Single-Core
HWBOT x265 Benchmark v2.2: 4k Preset
LibreOffice : 20 Documents To PDF
R Benchmark 2.5: Overall mean
| CPU Performance rating | |
| Media Intel Core Ultra 7 155H | |
| Media della classe Subnotebook | |
| MSI Prestige 13 AI Evo | |
| Lenovo ThinkPad X1 Nano Gen 3 | |
| HP Dragonfly G4 -2! | |
| Asus ZenBook S13 OLED UX5304 -2! | |
| Dell Latitude 13 7340 i5-1345U -2! | |
| Cinebench R23 / Multi Core | |
| Media Intel Core Ultra 7 155H (9769 - 19007, n=52) | |
| Media della classe Subnotebook (1555 - 21812, n=62, ultimi 2 anni) | |
| MSI Prestige 13 AI Evo | |
| Lenovo ThinkPad X1 Nano Gen 3 | |
| Dell Latitude 13 7340 i5-1345U | |
| HP Dragonfly G4 | |
| Asus ZenBook S13 OLED UX5304 | |
| Cinebench R23 / Single Core | |
| HP Dragonfly G4 | |
| Asus ZenBook S13 OLED UX5304 | |
| Media Intel Core Ultra 7 155H (1496 - 1815, n=52) | |
| Dell Latitude 13 7340 i5-1345U | |
| Media della classe Subnotebook (358 - 2213, n=63, ultimi 2 anni) | |
| Lenovo ThinkPad X1 Nano Gen 3 | |
| MSI Prestige 13 AI Evo | |
| Cinebench R20 / CPU (Multi Core) | |
| Media Intel Core Ultra 7 155H (3798 - 7409, n=50) | |
| Media della classe Subnotebook (579 - 8541, n=59, ultimi 2 anni) | |
| MSI Prestige 13 AI Evo | |
| Lenovo ThinkPad X1 Nano Gen 3 | |
| Dell Latitude 13 7340 i5-1345U | |
| HP Dragonfly G4 | |
| Asus ZenBook S13 OLED UX5304 | |
| Cinebench R20 / CPU (Single Core) | |
| HP Dragonfly G4 | |
| Asus ZenBook S13 OLED UX5304 | |
| Lenovo ThinkPad X1 Nano Gen 3 | |
| Media Intel Core Ultra 7 155H (601 - 696, n=50) | |
| Dell Latitude 13 7340 i5-1345U | |
| Media della classe Subnotebook (128 - 832, n=59, ultimi 2 anni) | |
| MSI Prestige 13 AI Evo | |
| Cinebench R15 / CPU Multi 64Bit | |
| Media Intel Core Ultra 7 155H (1932 - 2880, n=56) | |
| MSI Prestige 13 AI Evo | |
| Media della classe Subnotebook (327 - 3345, n=59, ultimi 2 anni) | |
| Lenovo ThinkPad X1 Nano Gen 3 | |
| Asus ZenBook S13 OLED UX5304 | |
| HP Dragonfly G4 | |
| Dell Latitude 13 7340 i5-1345U | |
| Cinebench R15 / CPU Single 64Bit | |
| HP Dragonfly G4 | |
| Media della classe Subnotebook (72.4 - 322, n=59, ultimi 2 anni) | |
| Media Intel Core Ultra 7 155H (99.6 - 268, n=52) | |
| Asus ZenBook S13 OLED UX5304 | |
| MSI Prestige 13 AI Evo | |
| Dell Latitude 13 7340 i5-1345U | |
| Lenovo ThinkPad X1 Nano Gen 3 | |
| Blender / v2.79 BMW27 CPU | |
| Dell Latitude 13 7340 i5-1345U | |
| Asus ZenBook S13 OLED UX5304 | |
| Asus ZenBook S13 OLED UX5304 | |
| HP Dragonfly G4 | |
| Lenovo ThinkPad X1 Nano Gen 3 | |
| Media della classe Subnotebook (159 - 2271, n=60, ultimi 2 anni) | |
| MSI Prestige 13 AI Evo | |
| Media Intel Core Ultra 7 155H (175 - 381, n=47) | |
| 7-Zip 18.03 / 7z b 4 | |
| Media Intel Core Ultra 7 155H (41739 - 70254, n=50) | |
| Media della classe Subnotebook (11668 - 77867, n=59, ultimi 2 anni) | |
| MSI Prestige 13 AI Evo | |
| HP Dragonfly G4 | |
| Lenovo ThinkPad X1 Nano Gen 3 | |
| Asus ZenBook S13 OLED UX5304 | |
| Dell Latitude 13 7340 i5-1345U | |
| 7-Zip 18.03 / 7z b 4 -mmt1 | |
| HP Dragonfly G4 | |
| Lenovo ThinkPad X1 Nano Gen 3 | |
| Asus ZenBook S13 OLED UX5304 | |
| Media della classe Subnotebook (2643 - 6699, n=61, ultimi 2 anni) | |
| MSI Prestige 13 AI Evo | |
| Media Intel Core Ultra 7 155H (4594 - 5621, n=50) | |
| Dell Latitude 13 7340 i5-1345U | |
| Geekbench 6.7 / Multi-Core | |
| Media della classe Subnotebook (2244 - 20325, n=65, ultimi 2 anni) | |
| Media Intel Core Ultra 7 155H (7732 - 13656, n=55) | |
| Lenovo ThinkPad X1 Nano Gen 3 | |
| MSI Prestige 13 AI Evo | |
| Geekbench 6.7 / Single-Core | |
| Media della classe Subnotebook (960 - 4195, n=64, ultimi 2 anni) | |
| Lenovo ThinkPad X1 Nano Gen 3 | |
| MSI Prestige 13 AI Evo | |
| Media Intel Core Ultra 7 155H (1901 - 2473, n=52) | |
| Geekbench 5.5 / Multi-Core | |
| Media Intel Core Ultra 7 155H (10017 - 13556, n=52) | |
| Media della classe Subnotebook (2557 - 17218, n=50, ultimi 2 anni) | |
| MSI Prestige 13 AI Evo | |
| Lenovo ThinkPad X1 Nano Gen 3 | |
| HP Dragonfly G4 | |
| Asus ZenBook S13 OLED UX5304 | |
| Dell Latitude 13 7340 i5-1345U | |
| Geekbench 5.5 / Single-Core | |
| HP Dragonfly G4 | |
| Media della classe Subnotebook (726 - 2224, n=50, ultimi 2 anni) | |
| Lenovo ThinkPad X1 Nano Gen 3 | |
| Asus ZenBook S13 OLED UX5304 | |
| MSI Prestige 13 AI Evo | |
| Media Intel Core Ultra 7 155H (1462 - 1824, n=52) | |
| Dell Latitude 13 7340 i5-1345U | |
| HWBOT x265 Benchmark v2.2 / 4k Preset | |
| Media Intel Core Ultra 7 155H (9.93 - 21.2, n=50) | |
| Media della classe Subnotebook (0.97 - 25.1, n=59, ultimi 2 anni) | |
| MSI Prestige 13 AI Evo | |
| Lenovo ThinkPad X1 Nano Gen 3 | |
| HP Dragonfly G4 | |
| Asus ZenBook S13 OLED UX5304 | |
| Dell Latitude 13 7340 i5-1345U | |
| LibreOffice / 20 Documents To PDF | |
| Media della classe Subnotebook (39.9 - 220, n=58, ultimi 2 anni) | |
| Lenovo ThinkPad X1 Nano Gen 3 | |
| Media Intel Core Ultra 7 155H (37.5 - 79.2, n=49) | |
| Asus ZenBook S13 OLED UX5304 | |
| HP Dragonfly G4 | |
| MSI Prestige 13 AI Evo | |
| Dell Latitude 13 7340 i5-1345U | |
| R Benchmark 2.5 / Overall mean | |
| Media della classe Subnotebook (0.4024 - 1.456, n=60, ultimi 2 anni) | |
| Dell Latitude 13 7340 i5-1345U | |
| Lenovo ThinkPad X1 Nano Gen 3 | |
| Media Intel Core Ultra 7 155H (0.4457 - 0.53, n=49) | |
| Asus ZenBook S13 OLED UX5304 | |
| MSI Prestige 13 AI Evo | |
| HP Dragonfly G4 | |
* ... Meglio usare valori piccoli
AIDA64: FP32 Ray-Trace | FPU Julia | CPU SHA3 | CPU Queen | FPU SinJulia | FPU Mandel | CPU AES | CPU ZLib | FP64 Ray-Trace | CPU PhotoWorxx
| Performance rating | |
| Media Intel Core Ultra 7 155H | |
| Media della classe Subnotebook | |
| MSI Prestige 13 AI Evo | |
| Lenovo ThinkPad X1 Nano Gen 3 | |
| HP Dragonfly G4 | |
| Asus ZenBook S13 OLED UX5304 | |
| Dell Latitude 13 7340 i5-1345U | |
| AIDA64 / FP32 Ray-Trace | |
| Media della classe Subnotebook (1135 - 32888, n=60, ultimi 2 anni) | |
| Media Intel Core Ultra 7 155H (6670 - 18470, n=50) | |
| Lenovo ThinkPad X1 Nano Gen 3 | |
| HP Dragonfly G4 | |
| MSI Prestige 13 AI Evo | |
| Asus ZenBook S13 OLED UX5304 | |
| Dell Latitude 13 7340 i5-1345U | |
| AIDA64 / FPU Julia | |
| Media Intel Core Ultra 7 155H (40905 - 93181, n=50) | |
| Media della classe Subnotebook (5218 - 123315, n=60, ultimi 2 anni) | |
| MSI Prestige 13 AI Evo | |
| Lenovo ThinkPad X1 Nano Gen 3 | |
| HP Dragonfly G4 | |
| Asus ZenBook S13 OLED UX5304 | |
| Dell Latitude 13 7340 i5-1345U | |
| AIDA64 / CPU SHA3 | |
| Media Intel Core Ultra 7 155H (1940 - 4436, n=50) | |
| Media della classe Subnotebook (444 - 5287, n=60, ultimi 2 anni) | |
| MSI Prestige 13 AI Evo | |
| Lenovo ThinkPad X1 Nano Gen 3 | |
| HP Dragonfly G4 | |
| Asus ZenBook S13 OLED UX5304 | |
| Dell Latitude 13 7340 i5-1345U | |
| AIDA64 / CPU Queen | |
| Lenovo ThinkPad X1 Nano Gen 3 | |
| Media Intel Core Ultra 7 155H (64698 - 94181, n=50) | |
| HP Dragonfly G4 | |
| Asus ZenBook S13 OLED UX5304 | |
| MSI Prestige 13 AI Evo | |
| Dell Latitude 13 7340 i5-1345U | |
| Media della classe Subnotebook (10579 - 95002, n=53, ultimi 2 anni) | |
| AIDA64 / FPU SinJulia | |
| Media Intel Core Ultra 7 155H (5639 - 10647, n=50) | |
| Media della classe Subnotebook (744 - 18418, n=60, ultimi 2 anni) | |
| MSI Prestige 13 AI Evo | |
| Lenovo ThinkPad X1 Nano Gen 3 | |
| HP Dragonfly G4 | |
| Asus ZenBook S13 OLED UX5304 | |
| Dell Latitude 13 7340 i5-1345U | |
| AIDA64 / FPU Mandel | |
| Media Intel Core Ultra 7 155H (18236 - 47685, n=50) | |
| Media della classe Subnotebook (3341 - 65433, n=60, ultimi 2 anni) | |
| MSI Prestige 13 AI Evo | |
| Lenovo ThinkPad X1 Nano Gen 3 | |
| HP Dragonfly G4 | |
| Asus ZenBook S13 OLED UX5304 | |
| Dell Latitude 13 7340 i5-1345U | |
| AIDA64 / CPU AES | |
| Media Intel Core Ultra 7 155H (45713 - 152179, n=50) | |
| Media della classe Subnotebook (638 - 96917, n=60, ultimi 2 anni) | |
| MSI Prestige 13 AI Evo | |
| Lenovo ThinkPad X1 Nano Gen 3 | |
| HP Dragonfly G4 | |
| Asus ZenBook S13 OLED UX5304 | |
| Dell Latitude 13 7340 i5-1345U | |
| AIDA64 / CPU ZLib | |
| Media Intel Core Ultra 7 155H (557 - 1250, n=50) | |
| Media della classe Subnotebook (164.9 - 1379, n=60, ultimi 2 anni) | |
| MSI Prestige 13 AI Evo | |
| Lenovo ThinkPad X1 Nano Gen 3 | |
| HP Dragonfly G4 | |
| Asus ZenBook S13 OLED UX5304 | |
| Dell Latitude 13 7340 i5-1345U | |
| AIDA64 / FP64 Ray-Trace | |
| Media della classe Subnotebook (610 - 17495, n=60, ultimi 2 anni) | |
| Media Intel Core Ultra 7 155H (3569 - 9802, n=50) | |
| Lenovo ThinkPad X1 Nano Gen 3 | |
| MSI Prestige 13 AI Evo | |
| HP Dragonfly G4 | |
| Asus ZenBook S13 OLED UX5304 | |
| Dell Latitude 13 7340 i5-1345U | |
| AIDA64 / CPU PhotoWorxx | |
| Media della classe Subnotebook (6569 - 85600, n=60, ultimi 2 anni) | |
| Media Intel Core Ultra 7 155H (32719 - 54223, n=50) | |
| Lenovo ThinkPad X1 Nano Gen 3 | |
| MSI Prestige 13 AI Evo | |
| Asus ZenBook S13 OLED UX5304 | |
| HP Dragonfly G4 | |
| Dell Latitude 13 7340 i5-1345U | |
Prestazioni del sistema
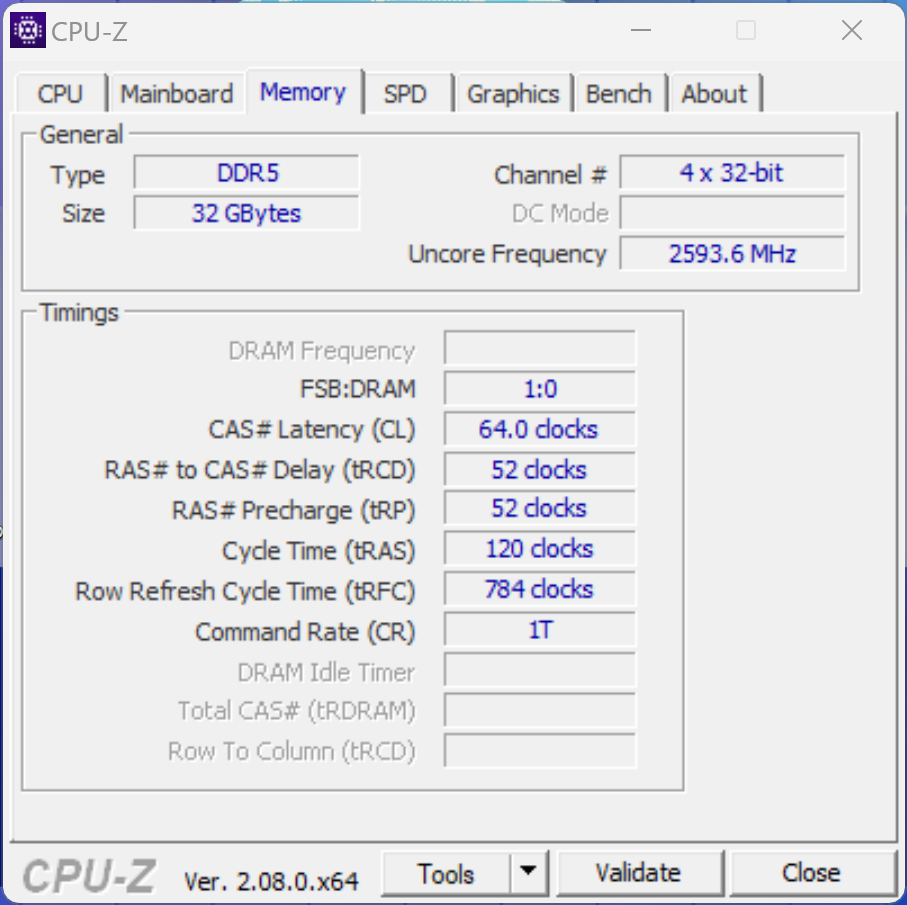
Nell'uso quotidiano, il Prestige 13 compatto è un compagno veloce e rapido, in parte grazie alla sua memoria SSD. La configurazione della RAM del nostro campione di prova è di 32 GB, che dovrebbe essere più che sufficiente per gli utenti dei prossimi anni. Durante i nostri test, non abbiamo mai avuto problemi di stabilità del sistema.
CrossMark: Overall | Productivity | Creativity | Responsiveness
WebXPRT 3: Overall
WebXPRT 4: Overall
Mozilla Kraken 1.1: Total
| PCMark 10 / Score | |
| Media della classe Subnotebook (4920 - 9939, n=45, ultimi 2 anni) | |
| Media Intel Core Ultra 7 155H, Intel Arc 8-Core iGPU (4809 - 7529, n=34) | |
| MSI Prestige 13 AI Evo | |
| Lenovo ThinkPad X1 Nano Gen 3 | |
| HP Dragonfly G4 | |
| Asus ZenBook S13 OLED UX5304 | |
| Dell Latitude 13 7340 i5-1345U | |
| PCMark 10 / Essentials | |
| HP Dragonfly G4 | |
| Lenovo ThinkPad X1 Nano Gen 3 | |
| Asus ZenBook S13 OLED UX5304 | |
| Media Intel Core Ultra 7 155H, Intel Arc 8-Core iGPU (7605 - 11289, n=34) | |
| Media della classe Subnotebook (8552 - 11646, n=45, ultimi 2 anni) | |
| Dell Latitude 13 7340 i5-1345U | |
| MSI Prestige 13 AI Evo | |
| PCMark 10 / Productivity | |
| Media della classe Subnotebook (5435 - 16606, n=45, ultimi 2 anni) | |
| Media Intel Core Ultra 7 155H, Intel Arc 8-Core iGPU (6042 - 10591, n=34) | |
| MSI Prestige 13 AI Evo | |
| Lenovo ThinkPad X1 Nano Gen 3 | |
| HP Dragonfly G4 | |
| Asus ZenBook S13 OLED UX5304 | |
| Dell Latitude 13 7340 i5-1345U | |
| PCMark 10 / Digital Content Creation | |
| Media della classe Subnotebook (5722 - 13779, n=45, ultimi 2 anni) | |
| Media Intel Core Ultra 7 155H, Intel Arc 8-Core iGPU (4985 - 10709, n=34) | |
| MSI Prestige 13 AI Evo | |
| Lenovo ThinkPad X1 Nano Gen 3 | |
| HP Dragonfly G4 | |
| Asus ZenBook S13 OLED UX5304 | |
| Dell Latitude 13 7340 i5-1345U | |
| CrossMark / Overall | |
| Lenovo ThinkPad X1 Nano Gen 3 | |
| Media Intel Core Ultra 7 155H, Intel Arc 8-Core iGPU (1366 - 1903, n=34) | |
| HP Dragonfly G4 | |
| Media della classe Subnotebook (365 - 2356, n=62, ultimi 2 anni) | |
| Asus ZenBook S13 OLED UX5304 | |
| Dell Latitude 13 7340 i5-1345U | |
| MSI Prestige 13 AI Evo | |
| CrossMark / Productivity | |
| Lenovo ThinkPad X1 Nano Gen 3 | |
| HP Dragonfly G4 | |
| Media Intel Core Ultra 7 155H, Intel Arc 8-Core iGPU (1291 - 1798, n=33) | |
| Asus ZenBook S13 OLED UX5304 | |
| Media della classe Subnotebook (364 - 2277, n=62, ultimi 2 anni) | |
| Dell Latitude 13 7340 i5-1345U | |
| MSI Prestige 13 AI Evo | |
| CrossMark / Creativity | |
| Lenovo ThinkPad X1 Nano Gen 3 | |
| Media della classe Subnotebook (372 - 2743, n=62, ultimi 2 anni) | |
| Media Intel Core Ultra 7 155H, Intel Arc 8-Core iGPU (1519 - 1929, n=33) | |
| HP Dragonfly G4 | |
| Asus ZenBook S13 OLED UX5304 | |
| Dell Latitude 13 7340 i5-1345U | |
| MSI Prestige 13 AI Evo | |
| CrossMark / Responsiveness | |
| Lenovo ThinkPad X1 Nano Gen 3 | |
| Media Intel Core Ultra 7 155H, Intel Arc 8-Core iGPU (939 - 1802, n=33) | |
| Asus ZenBook S13 OLED UX5304 | |
| HP Dragonfly G4 | |
| Media della classe Subnotebook (312 - 1854, n=62, ultimi 2 anni) | |
| Dell Latitude 13 7340 i5-1345U | |
| MSI Prestige 13 AI Evo | |
| WebXPRT 3 / Overall | |
| Media della classe Subnotebook (156 - 530, n=58, ultimi 2 anni) | |
| Lenovo ThinkPad X1 Nano Gen 3 | |
| HP Dragonfly G4 | |
| Asus ZenBook S13 OLED UX5304 | |
| Media Intel Core Ultra 7 155H, Intel Arc 8-Core iGPU (252 - 299, n=34) | |
| MSI Prestige 13 AI Evo | |
| WebXPRT 4 / Overall | |
| Media della classe Subnotebook (132 - 378, n=63, ultimi 2 anni) | |
| Lenovo ThinkPad X1 Nano Gen 3 | |
| HP Dragonfly G4 | |
| Asus ZenBook S13 OLED UX5304 | |
| Media Intel Core Ultra 7 155H, Intel Arc 8-Core iGPU (166.4 - 309, n=29) | |
| MSI Prestige 13 AI Evo | |
| Mozilla Kraken 1.1 / Total | |
| Dell Latitude 13 7340 i5-1345U | |
| MSI Prestige 13 AI Evo | |
| Media Intel Core Ultra 7 155H, Intel Arc 8-Core iGPU (517 - 614, n=35) | |
| Asus ZenBook S13 OLED UX5304 | |
| Lenovo ThinkPad X1 Nano Gen 3 | |
| HP Dragonfly G4 | |
| Media della classe Subnotebook (234 - 1104, n=63, ultimi 2 anni) | |
* ... Meglio usare valori piccoli
| PCMark 10 Score | 5952 punti | |
Aiuto | ||
| AIDA64 / Memory Copy | |
| Media della classe Subnotebook (14554 - 131023, n=60, ultimi 2 anni) | |
| Media Intel Core Ultra 7 155H (62397 - 96791, n=50) | |
| MSI Prestige 13 AI Evo | |
| Lenovo ThinkPad X1 Nano Gen 3 | |
| Asus ZenBook S13 OLED UX5304 | |
| HP Dragonfly G4 | |
| Dell Latitude 13 7340 i5-1345U | |
| AIDA64 / Memory Read | |
| Media della classe Subnotebook (15948 - 127174, n=60, ultimi 2 anni) | |
| Media Intel Core Ultra 7 155H (60544 - 90647, n=50) | |
| MSI Prestige 13 AI Evo | |
| Lenovo ThinkPad X1 Nano Gen 3 | |
| Asus ZenBook S13 OLED UX5304 | |
| HP Dragonfly G4 | |
| Dell Latitude 13 7340 i5-1345U | |
| AIDA64 / Memory Write | |
| Lenovo ThinkPad X1 Nano Gen 3 | |
| Media della classe Subnotebook (15709 - 135141, n=60, ultimi 2 anni) | |
| MSI Prestige 13 AI Evo | |
| Media Intel Core Ultra 7 155H (58692 - 93451, n=50) | |
| Asus ZenBook S13 OLED UX5304 | |
| Dell Latitude 13 7340 i5-1345U | |
| HP Dragonfly G4 | |
| AIDA64 / Memory Latency | |
| MSI Prestige 13 AI Evo | |
| Media Intel Core Ultra 7 155H (116.2 - 233, n=50) | |
| Dell Latitude 13 7340 i5-1345U | |
| Media della classe Subnotebook (6.1 - 159.9, n=58, ultimi 2 anni) | |
| Lenovo ThinkPad X1 Nano Gen 3 | |
| HP Dragonfly G4 | |
| Asus ZenBook S13 OLED UX5304 | |
* ... Meglio usare valori piccoli
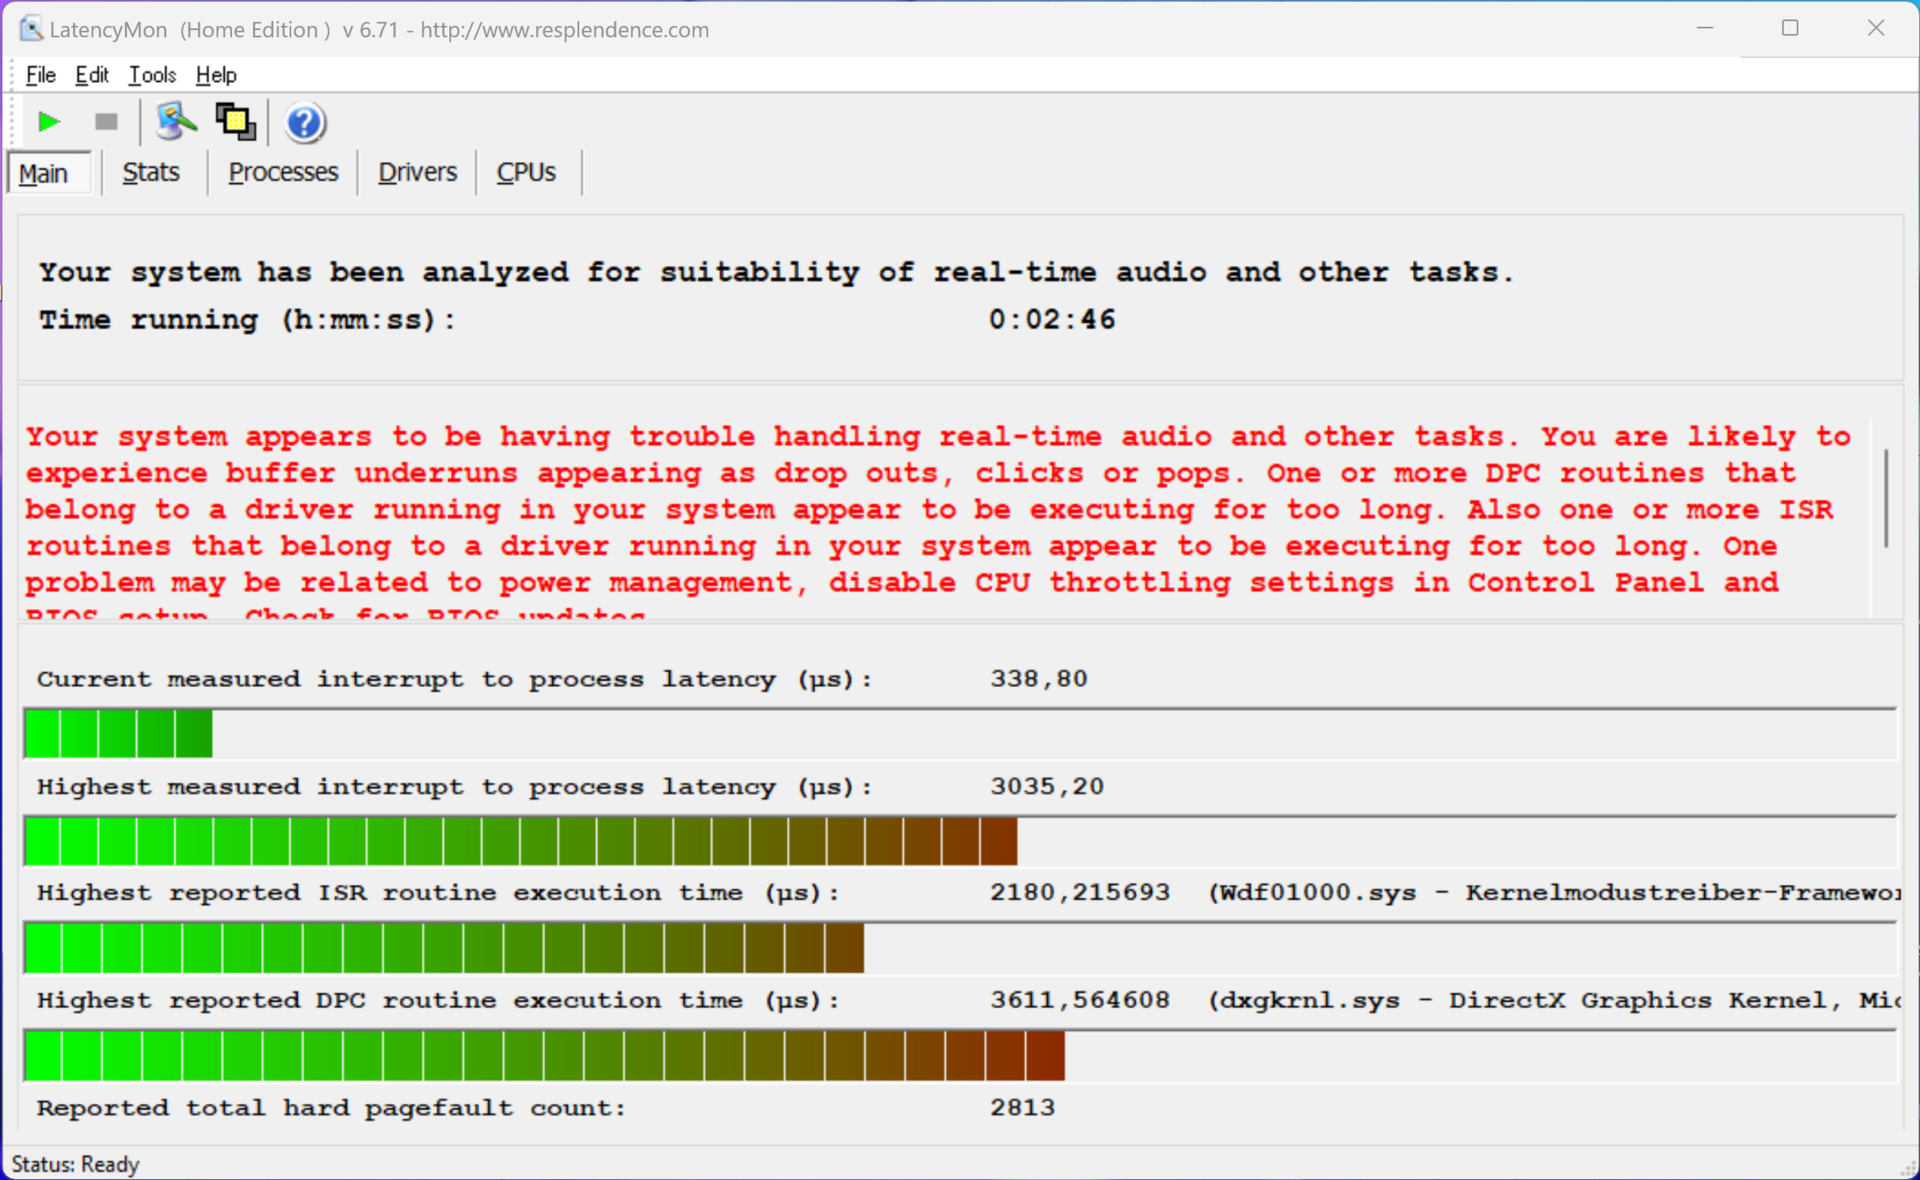
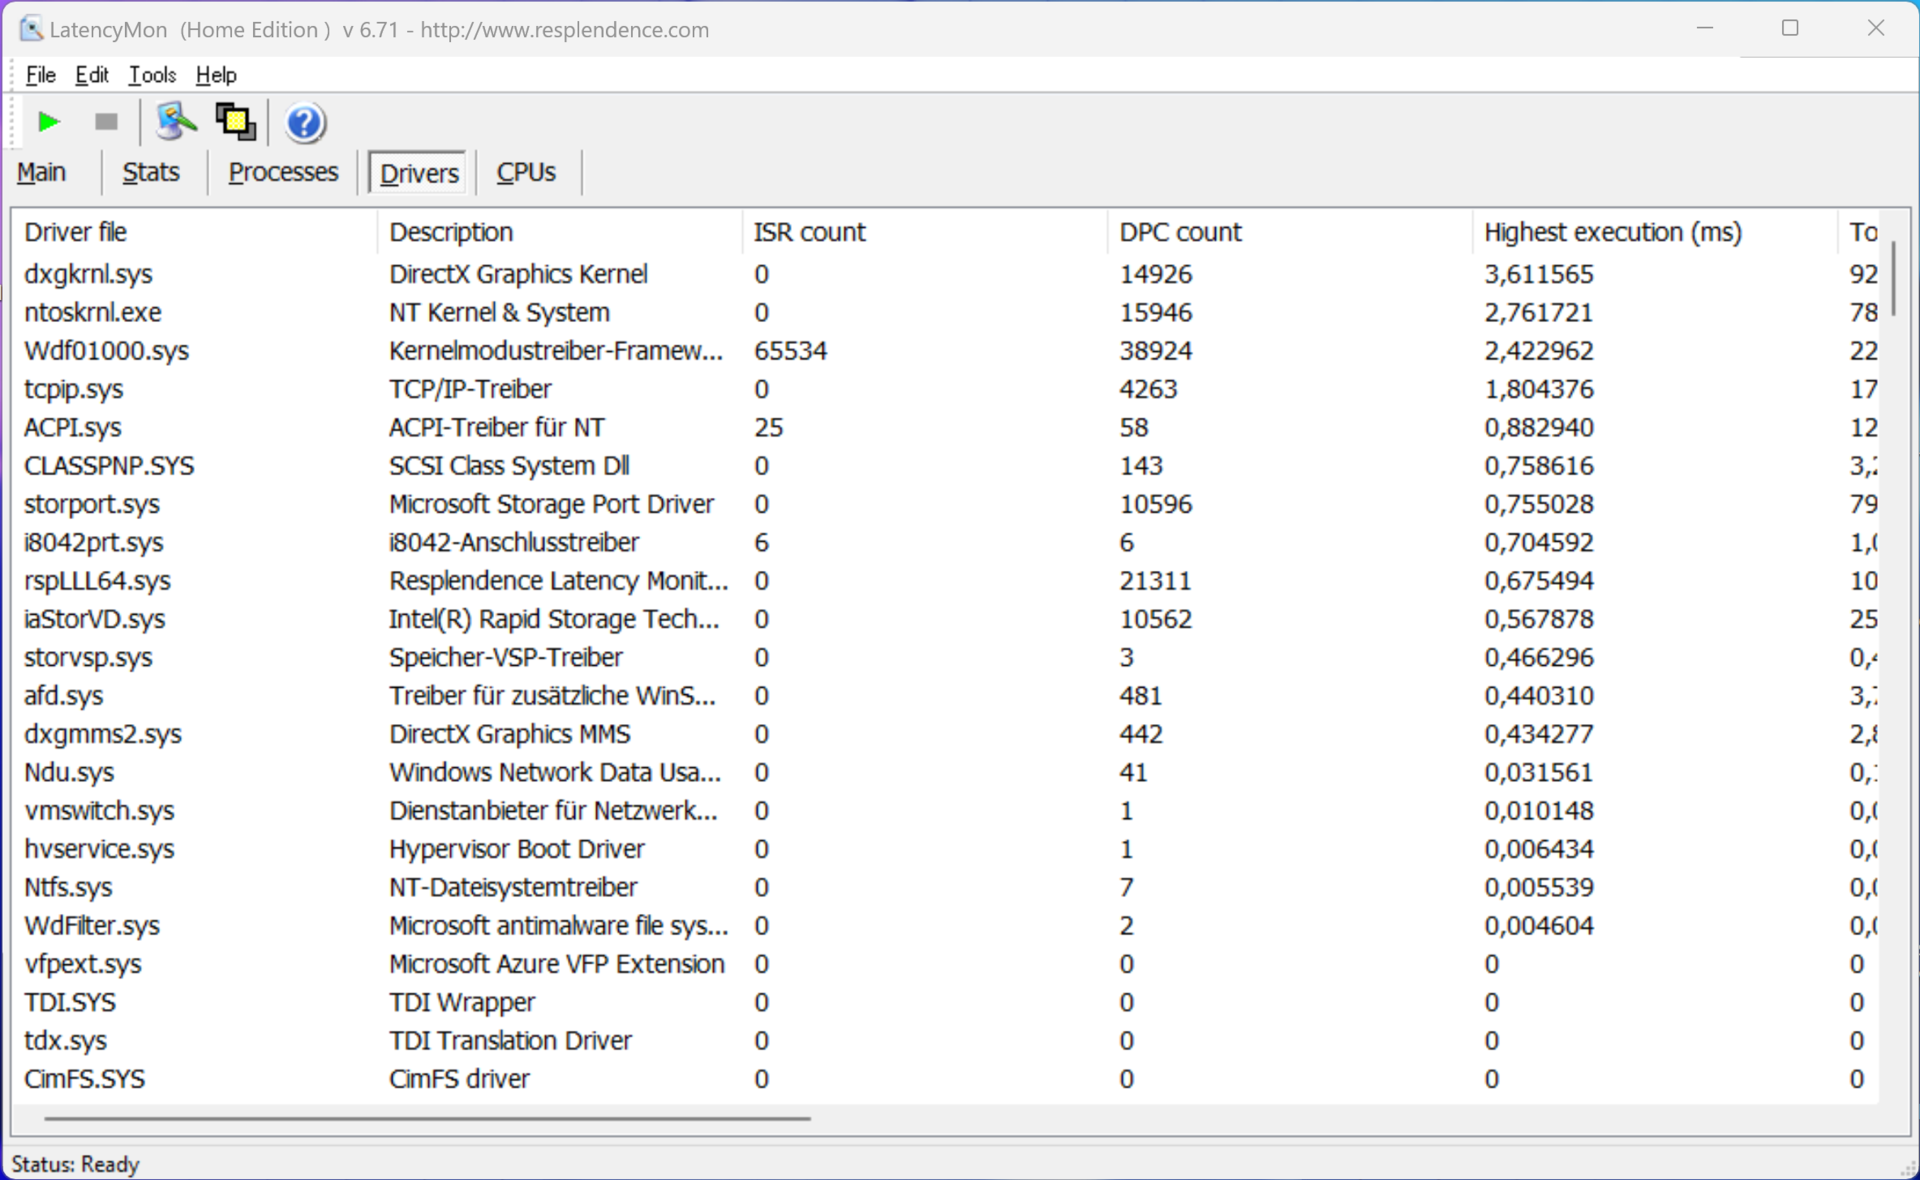
Latenza DPC
Nel nostro test di latenza standardizzato (navigazione web, riproduzione YouTube 4K, carico della CPU), il dispositivo di prova con l'attuale versione del BIOS ha mostrato alcune limitazioni quando si utilizzano applicazioni audio in tempo reale.
| DPC Latencies / LatencyMon - interrupt to process latency (max), Web, Youtube, Prime95 | |
| MSI Prestige 13 AI Evo | |
| Lenovo ThinkPad X1 Nano Gen 3 | |
| Dell Latitude 13 7340 i5-1345U | |
| Asus ZenBook S13 OLED UX5304 | |
| HP Dragonfly G4 | |
* ... Meglio usare valori piccoli
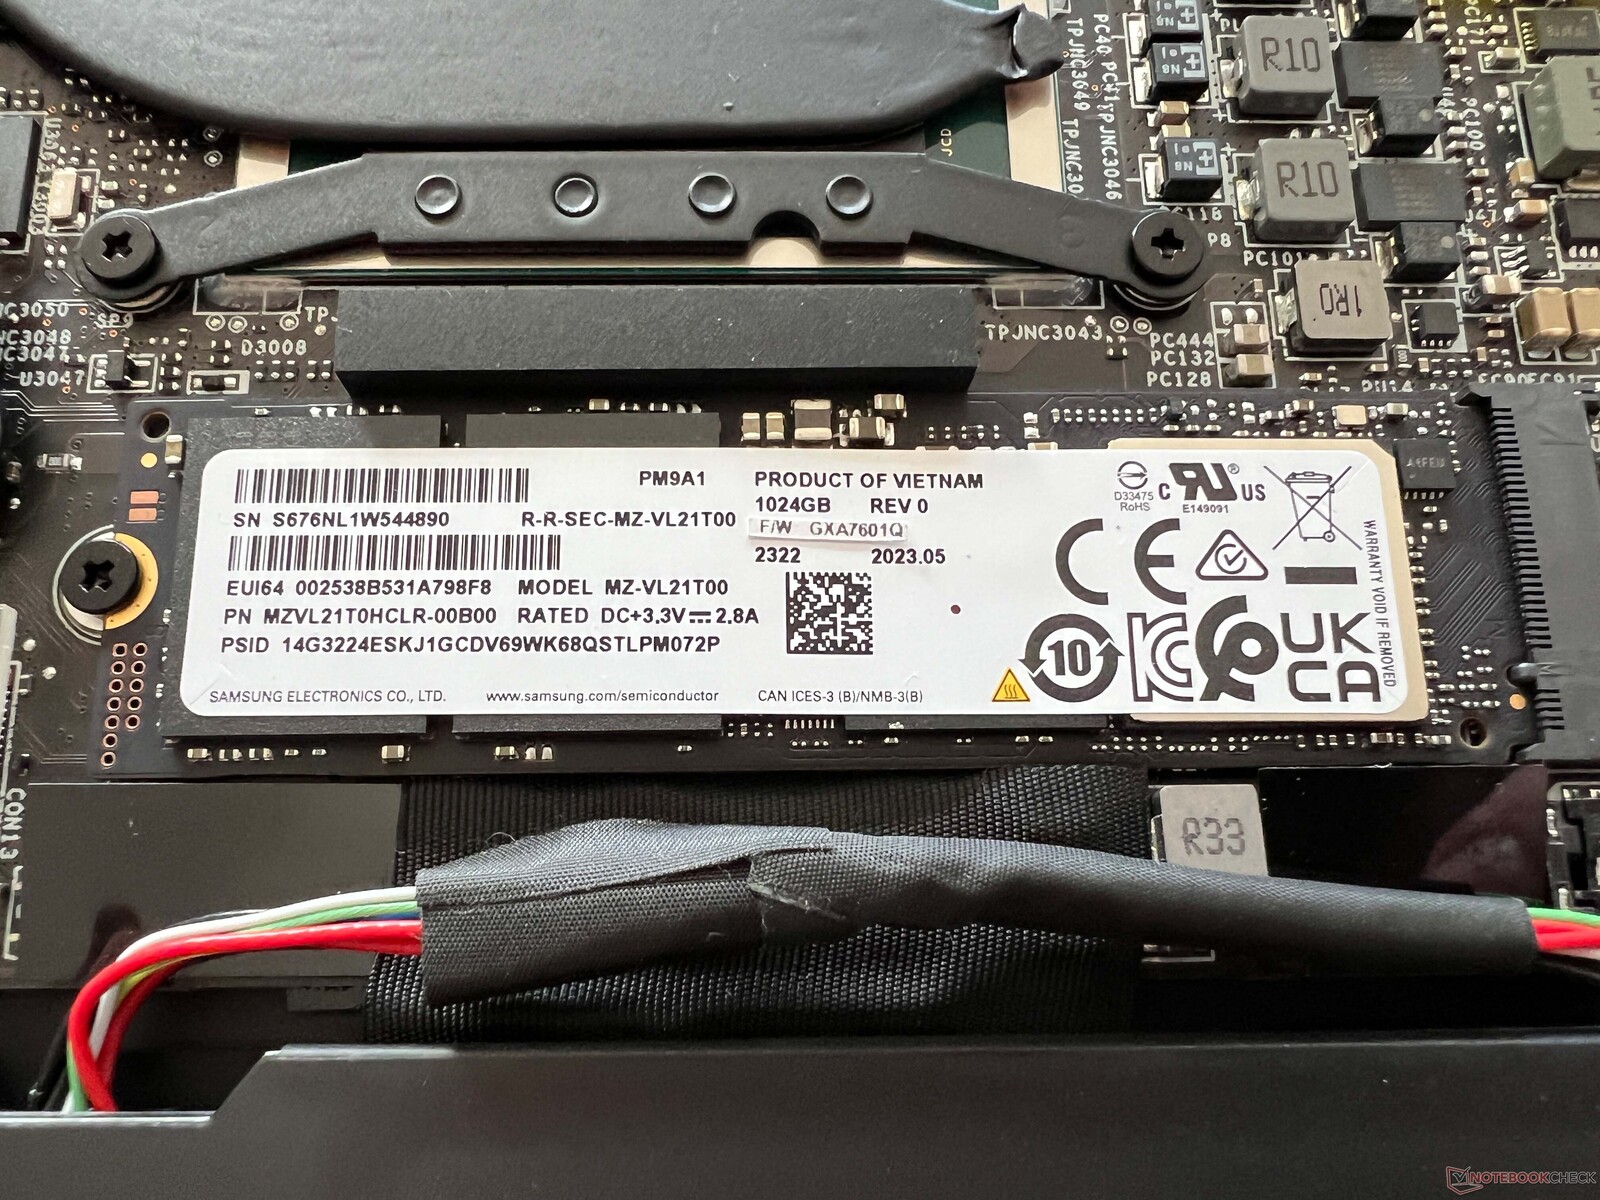
Dispositivi di archiviazione
Il nostro dispositivo di prova è dotato della versione da 1 TB di Samsung PM9A1 (versione OEM del 980 Pro), che è un dispositivo di archiviazione molto veloce. Tuttavia, le sue prestazioni non rimangono costanti sotto carico permanente, ma questo non dovrebbe creare problemi durante l'uso quotidiano. Dopo il primo avvio del dispositivo, gli utenti hanno 864 GB liberi da utilizzare. Ulteriori benchmark sull'SSD sono disponibili qui.

* ... Meglio usare valori piccoli
Reading continuous performance: DiskSpd Read Loop, Queue Depth 8
Scheda grafica
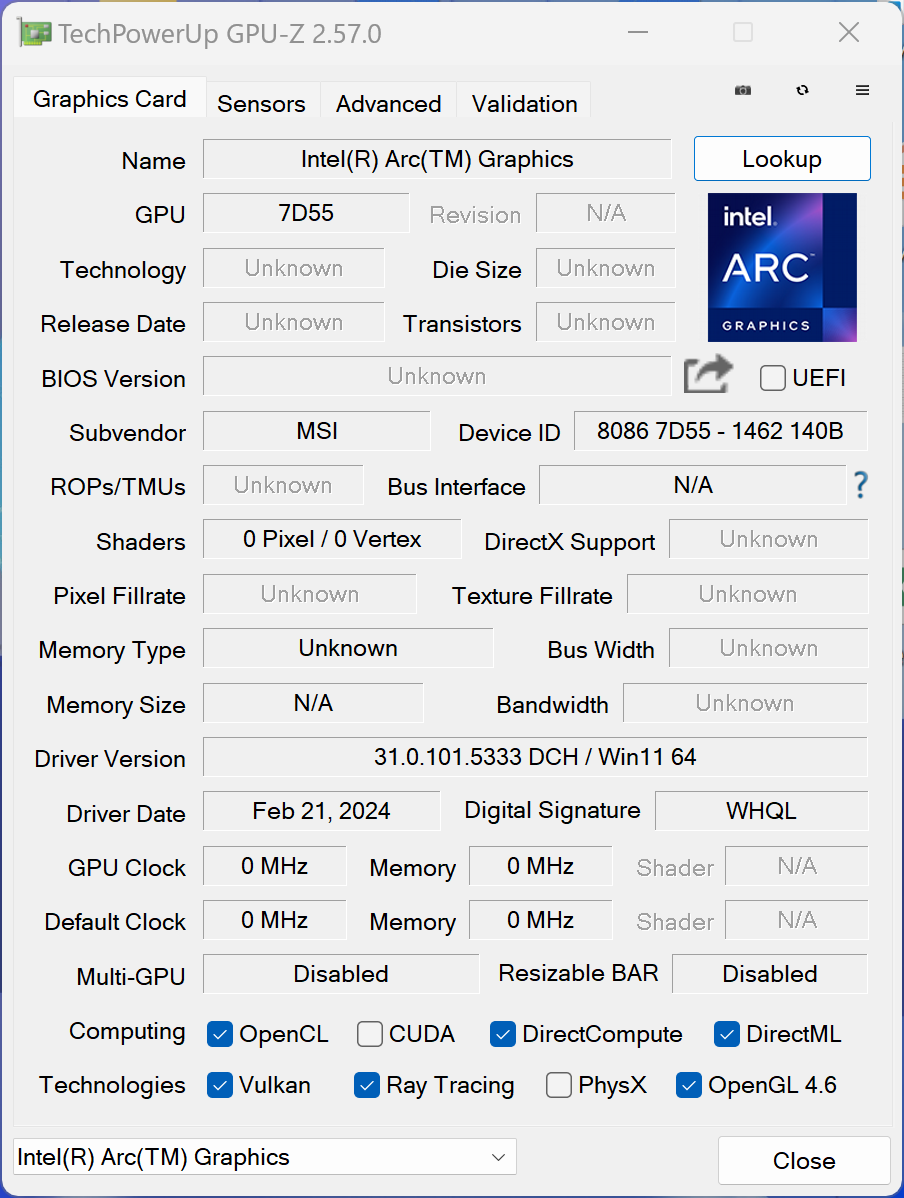
In combinazione con il Core Ultra 7 155Hla nuova Intel Arc Graphics offre 8 Xe-Core, tuttavia le prestazioni grafiche totali dell'MSI Prestige 13 sono state le peggiori di tutti i nuovi computer portatili Meteor-Lake che abbiamo testato finora (-32% rispetto alla media del nostro database). Anche durante i benchmark sintetici, l'MSI ha superato solo di poco la vecchia Iris Xe Graphics G7. Quando si tratta di attività quotidiane, come la riproduzione di video ad alta risoluzione, MSI non ha problemi, ma semplicemente non riesce a sfruttare la nuova iGPU al massimo del suo potenziale.
Vogliamo menzionare un aspetto positivo, ossia che MSI non ha subito gli stessi cali di frame durante i test di gioco come hanno fatto, ad esempio, lo Zenbook 14 o l'HP Spectre x360 14. Le sue prestazioni di gioco sono piuttosto basse in generale, ma almeno sono stabili. Anche nell'uso della batteria, le sue prestazioni rimangono costanti e ulteriori benchmark sono disponibili qui.
| 3DMark 11 Performance | 8505 punti | |
| 3DMark Fire Strike Score | 5203 punti | |
| 3DMark Time Spy Score | 2178 punti | |
Aiuto | ||
| Blender / v3.3 Classroom CPU | |
| Dell Latitude 13 7340 i5-1345U | |
| Asus ZenBook S13 OLED UX5304 | |
| HP Dragonfly G4 | |
| Lenovo ThinkPad X1 Nano Gen 3 | |
| MSI Prestige 13 AI Evo | |
| Media della classe Subnotebook (241 - 861, n=62, ultimi 2 anni) | |
| Media Intel Arc 8-Core iGPU (294 - 692, n=42) | |
* ... Meglio usare valori piccoli
| Performance rating - Percent | |
| Media della classe Subnotebook | |
| MSI Prestige 13 AI Evo | |
| HP Dragonfly G4 | |
| Lenovo ThinkPad X1 Nano Gen 3 -1! | |
| Asus ZenBook S13 OLED UX5304 | |
| Dell Latitude 13 7340 i5-1345U | |
| The Witcher 3 - 1920x1080 Ultra Graphics & Postprocessing (HBAO+) | |
| Media della classe Subnotebook (13.9 - 34.6, n=15, ultimi 2 anni) | |
| HP Dragonfly G4 | |
| MSI Prestige 13 AI Evo | |
| Lenovo ThinkPad X1 Nano Gen 3 | |
| Asus ZenBook S13 OLED UX5304 | |
| Dell Latitude 13 7340 i5-1345U | |
| GTA V - 1920x1080 Highest AA:4xMSAA + FX AF:16x | |
| Media della classe Subnotebook (10.7 - 43.7, n=56, ultimi 2 anni) | |
| HP Dragonfly G4 | |
| MSI Prestige 13 AI Evo | |
| Asus ZenBook S13 OLED UX5304 | |
| Dell Latitude 13 7340 i5-1345U | |
| Final Fantasy XV Benchmark - 1920x1080 High Quality | |
| Media della classe Subnotebook (11.6 - 54.5, n=56, ultimi 2 anni) | |
| MSI Prestige 13 AI Evo | |
| HP Dragonfly G4 | |
| Asus ZenBook S13 OLED UX5304 | |
| Lenovo ThinkPad X1 Nano Gen 3 | |
| Dell Latitude 13 7340 i5-1345U | |
| Strange Brigade - 1920x1080 ultra AA:ultra AF:16 | |
| Media della classe Subnotebook (19 - 101.3, n=52, ultimi 2 anni) | |
| MSI Prestige 13 AI Evo | |
| HP Dragonfly G4 | |
| Asus ZenBook S13 OLED UX5304 | |
| Dell Latitude 13 7340 i5-1345U | |
| Lenovo ThinkPad X1 Nano Gen 3 | |
| Dota 2 Reborn - 1920x1080 ultra (3/3) best looking | |
| Media della classe Subnotebook (13 - 97, n=63, ultimi 2 anni) | |
| HP Dragonfly G4 | |
| MSI Prestige 13 AI Evo | |
| Asus ZenBook S13 OLED UX5304 | |
| Dell Latitude 13 7340 i5-1345U | |
| Lenovo ThinkPad X1 Nano Gen 3 | |
| X-Plane 11.11 - 1920x1080 high (fps_test=3) | |
| Media della classe Subnotebook (20.7 - 50.5, n=52, ultimi 2 anni) | |
| MSI Prestige 13 AI Evo | |
| Lenovo ThinkPad X1 Nano Gen 3 | |
| HP Dragonfly G4 | |
| Asus ZenBook S13 OLED UX5304 | |
| Dell Latitude 13 7340 i5-1345U | |
Witcher 3 FPS diagram
| basso | medio | alto | ultra | |
|---|---|---|---|---|
| GTA V (2015) | 99.1 | 93.8 | 26.2 | 9.97 |
| The Witcher 3 (2015) | 92 | 59 | 36 | 14.5 |
| Dota 2 Reborn (2015) | 89.9 | 75.9 | 57.7 | 53.3 |
| Final Fantasy XV Benchmark (2018) | 43.8 | 28 | 17 | |
| X-Plane 11.11 (2018) | 47.4 | 37.7 | 32.1 | |
| Far Cry 5 (2018) | 47 | 33 | 31 | 28 |
| Strange Brigade (2018) | 121 | 53 | 41 | 32 |
| F1 2021 (2021) | 94.8 | 50.8 | 41.3 | 20.3 |
| F1 22 (2022) | 59.1 | 49.6 | 36.8 | 9.33 |
| F1 23 (2023) | 44.1 | 36.3 | 27.1 | 7.45 |
Emissioni - Altoparlanti deboli
Emissioni di rumore
Il portatile MSI è dotato di un'unità di raffreddamento composta da un tubo di calore e una ventola, che purtroppo funziona spesso a bassa velocità anche quando il dispositivo è al minimo. Sebbene il fruscio non sia fastidioso, si sente sicuramente in ambienti più silenziosi. Sotto carico, la ventola ha raggiunto rapidamente i 32 dB(A) e durante lo stress test abbiamo notato 40 dB(A). Questo è tutt'altro che silenzioso e, come si è scoperto, il nostro campione di prova era il più rumoroso nel campo di confronto. Utilizzando la funzione CoolerBooster, la piccola ventola ha raggiunto addirittura 51 dB(A). Non abbiamo notato alcun rumore elettronico aggiuntivo.
Rumorosità
| Idle |
| 23.4 / 26.9 / 26.9 dB(A) |
| Sotto carico |
| 32 / 40.3 dB(A) |
 | ||
30 dB silenzioso 40 dB(A) udibile 50 dB(A) rumoroso |
||
min: | ||
| MSI Prestige 13 AI Evo Arc 8-Core, Ultra 7 155H, Samsung PM9A1 MZVL21T0HCLR | Lenovo ThinkPad X1 Nano Gen 3 Iris Xe G7 96EUs, i7-1360P, Lenovo UMIS AM6A0 RPJTJ512MKP1QDQ | Dell Latitude 13 7340 i5-1345U Iris Xe G7 80EUs, i5-1345U, Kioxia BG5 KBG50ZNS512G | HP Dragonfly G4 Iris Xe G7 96EUs, i7-1365U, Micron 3400 MTFDKBA512TFH 512GB | Asus ZenBook S13 OLED UX5304 Iris Xe G7 96EUs, i7-1355U, Samsung PM9A1 MZVL21T0HCLR | |
|---|---|---|---|---|---|
| Noise | 3% | -1% | 6% | -2% | |
| off /ambiente * (dB) | 23.4 | 22.9 2% | 25.02 -7% | 23.3 -0% | 23.3 -0% |
| Idle Minimum * (dB) | 23.4 | 23 2% | 25.02 -7% | 23.5 -0% | 23.3 -0% |
| Idle Average * (dB) | 26.9 | 23 14% | 25.02 7% | 23.5 13% | 23.3 13% |
| Idle Maximum * (dB) | 26.9 | 23 14% | 25.02 7% | 26.8 -0% | 23.3 13% |
| Load Average * (dB) | 32 | 32.8 -2% | 35.07 -10% | 27.2 15% | 37.7 -18% |
| Witcher 3 ultra * (dB) | 32 | 36.9 -15% | 32.7 -2% | 40.1 -25% | |
| Load Maximum * (dB) | 40.3 | 36.9 8% | 38.2 5% | 35 13% | 40.1 -0% |
* ... Meglio usare valori piccoli
Temperatura
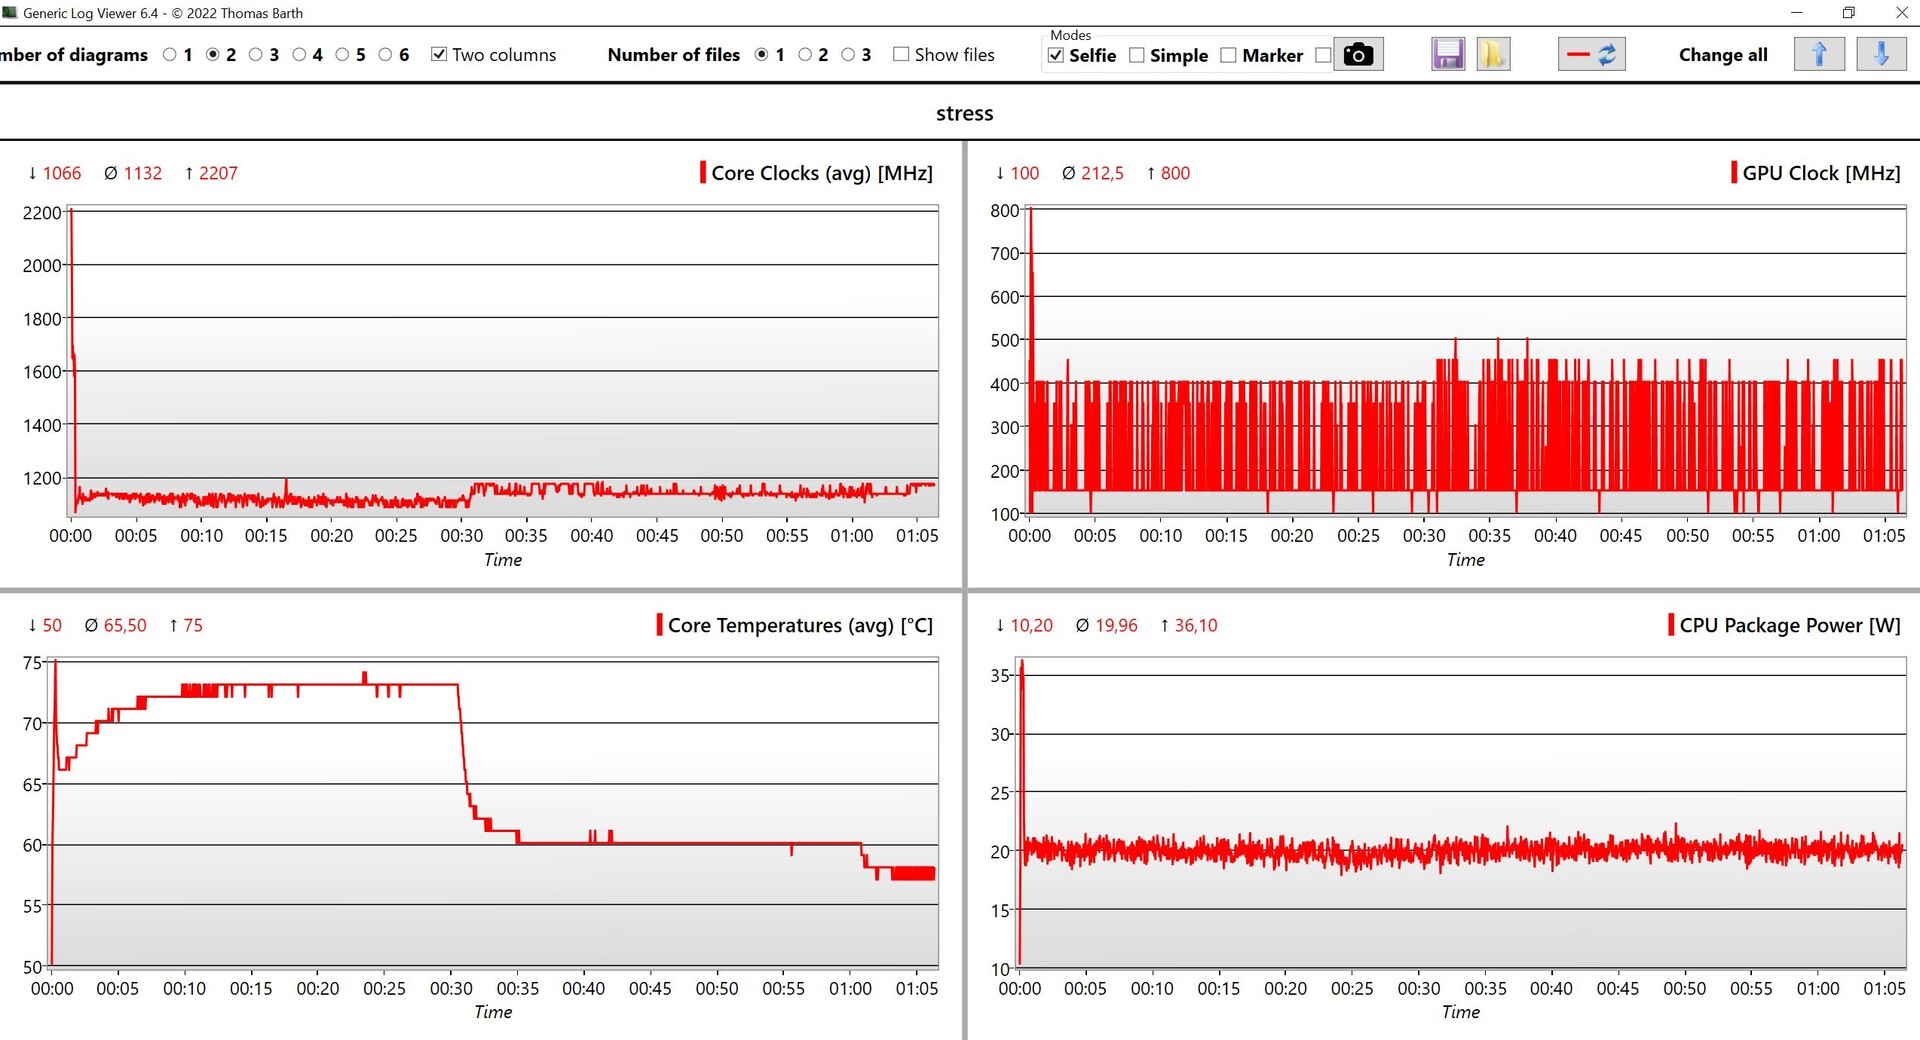
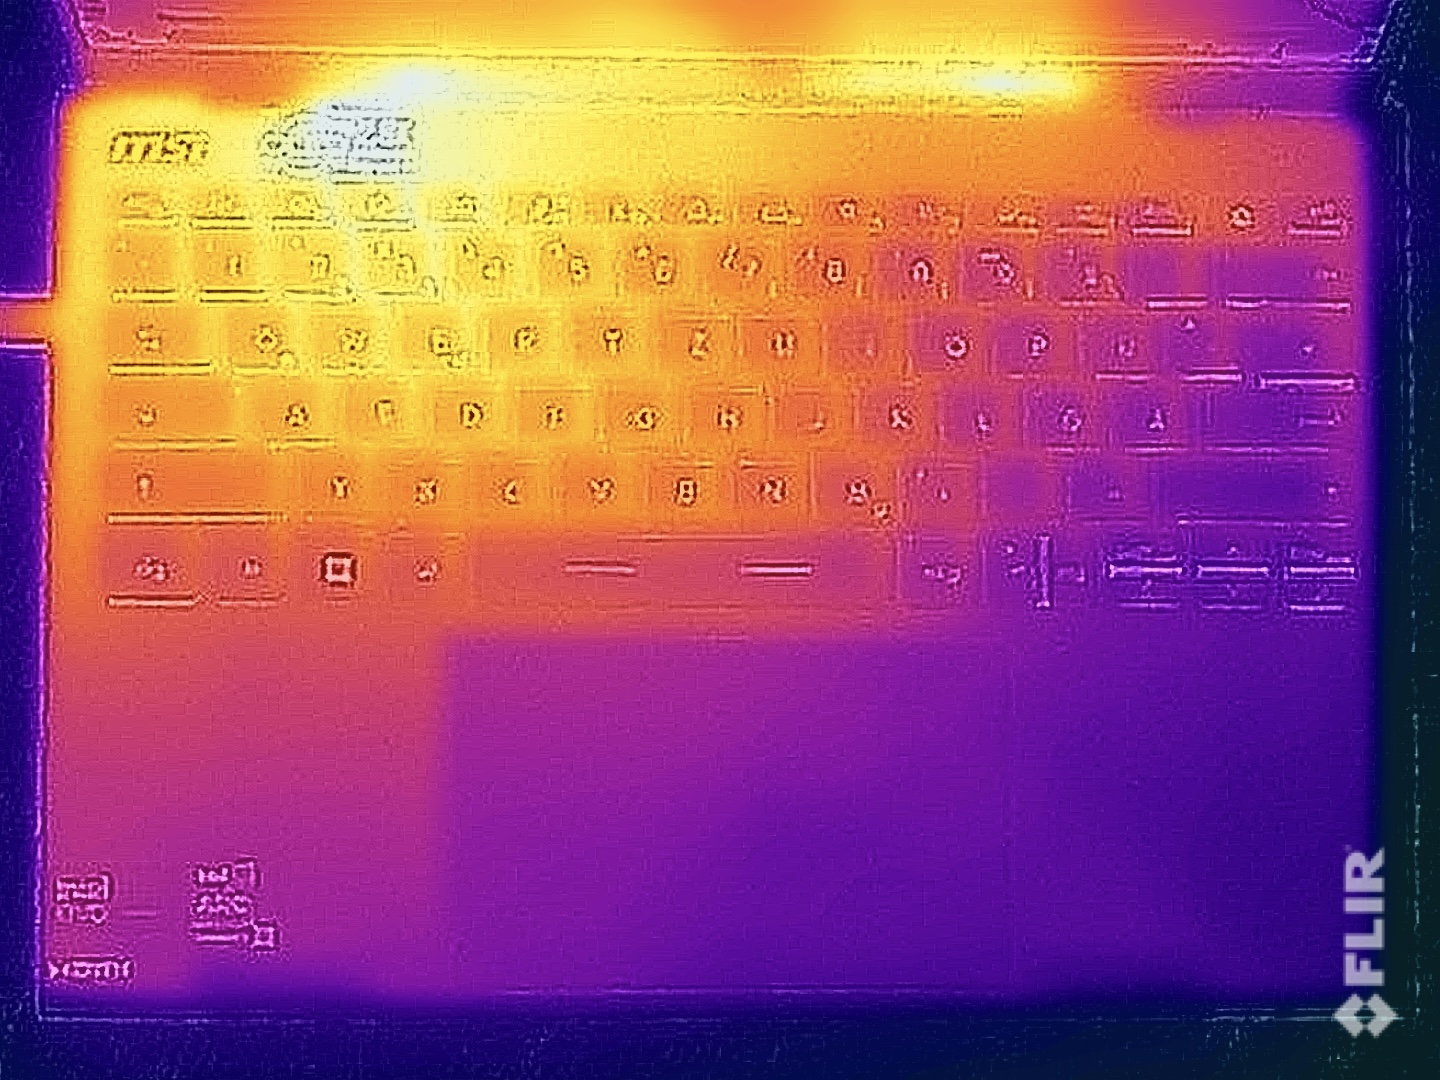
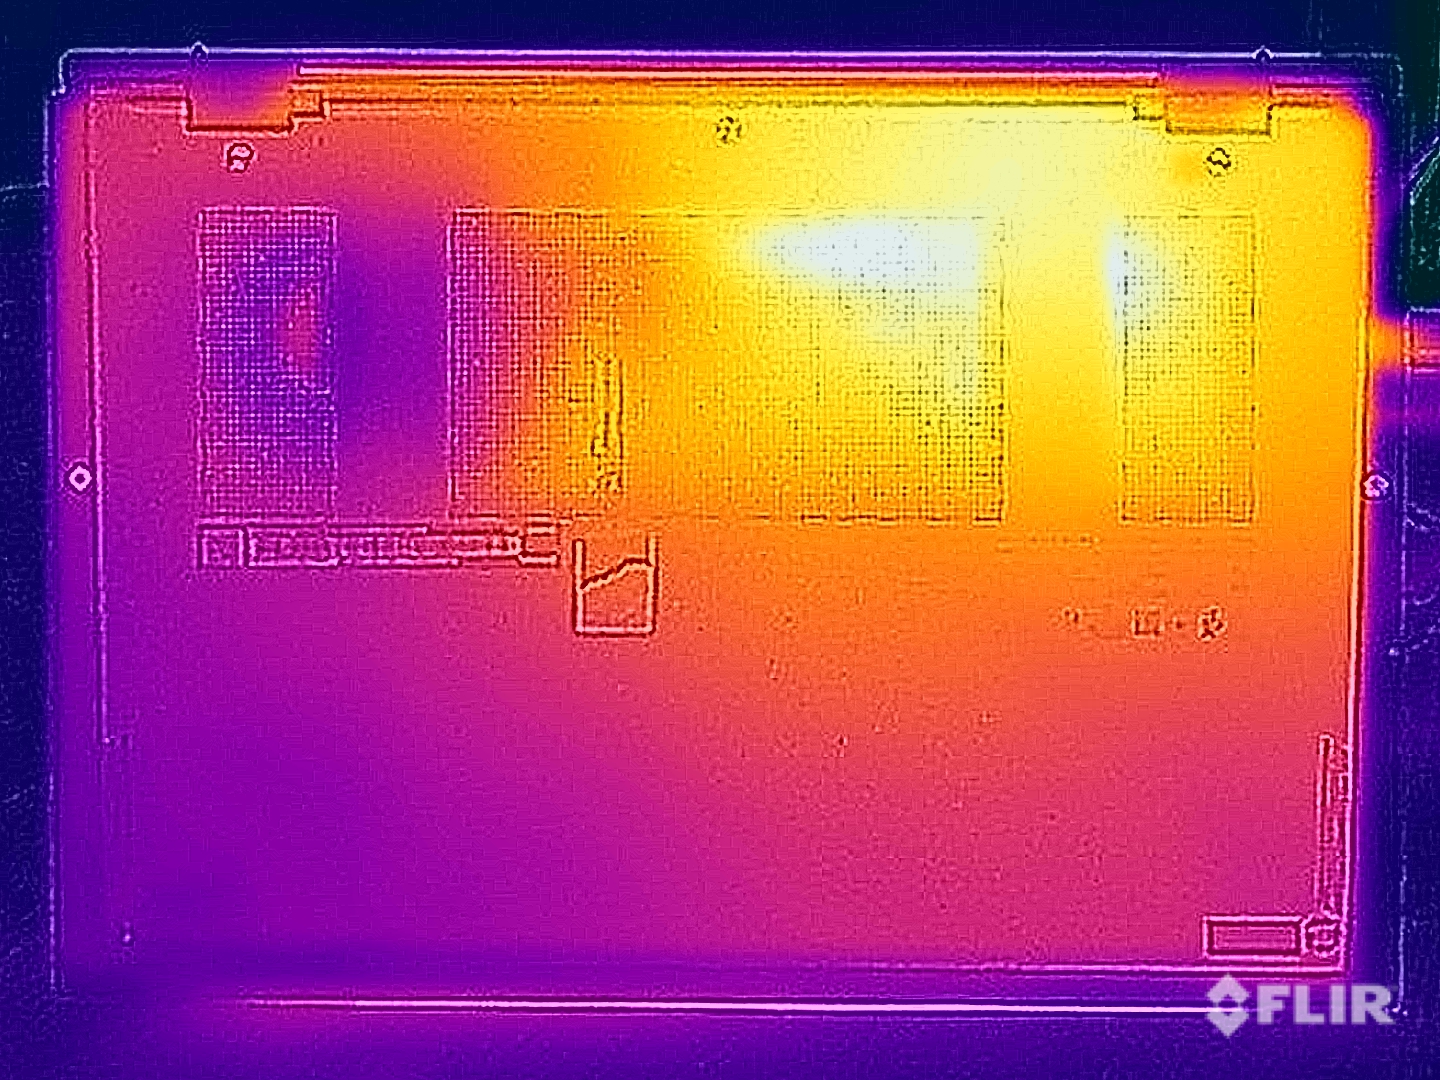
Nell'uso quotidiano, il Prestige 13 rimane per lo più fresco e anche durante lo stress test, abbiamo misurato un massimo di 40 °C sulla parte superiore e inferiore dell'unità base. Il radiatore è situato sul lato sinistro, motivo per cui quest'area si riscalda maggiormente. Durante lo stress test, il consumo energetico della CPU si è equilibrato rapidamente a 20 watt e poi è rimasto a questo livello.
(±) La temperatura massima sul lato superiore è di 40.9 °C / 106 F, rispetto alla media di 35.9 °C / 97 F, che varia da 21.4 a 59 °C per questa classe Subnotebook.
(±) Il lato inferiore si riscalda fino ad un massimo di 40.4 °C / 105 F, rispetto alla media di 39.2 °C / 103 F
(+) In idle, la temperatura media del lato superiore è di 23.3 °C / 74 F, rispetto alla media deld ispositivo di 30.8 °C / 87 F.
(+) Riproducendo The Witcher 3, la temperatura media per il lato superiore e' di 30.9 °C / 88 F, rispetto alla media del dispositivo di 30.8 °C / 87 F.
(+) I poggiapolsi e il touchpad sono piu' freddi della temperatura della pelle con un massimo di 27.9 °C / 82.2 F e sono quindi freddi al tatto.
(±) La temperatura media della zona del palmo della mano di dispositivi simili e'stata di 28.2 °C / 82.8 F (+0.3 °C / 0.6 F).
| MSI Prestige 13 AI Evo Intel Core Ultra 7 155H, Intel Arc 8-Core iGPU | Lenovo ThinkPad X1 Nano Gen 3 Intel Core i7-1360P, Intel Iris Xe Graphics G7 96EUs | Dell Latitude 13 7340 i5-1345U Intel Core i5-1345U, Intel Iris Xe Graphics G7 80EUs | HP Dragonfly G4 Intel Core i7-1365U, Intel Iris Xe Graphics G7 96EUs | Asus ZenBook S13 OLED UX5304 Intel Core i7-1355U, Intel Iris Xe Graphics G7 96EUs | |
|---|---|---|---|---|---|
| Heat | -4% | -1% | -5% | -9% | |
| Maximum Upper Side * (°C) | 40.9 | 44 -8% | 34.3 16% | 38.6 6% | 43.1 -5% |
| Maximum Bottom * (°C) | 40.4 | 43.2 -7% | 37.6 7% | 40.4 -0% | 45 -11% |
| Idle Upper Side * (°C) | 25 | 25.6 -2% | 28.4 -14% | 28.2 -13% | 27.3 -9% |
| Idle Bottom * (°C) | 25.5 | 25.6 -0% | 28.8 -13% | 29 -14% | 27.8 -9% |
* ... Meglio usare valori piccoli
Altoparlanti
Gli altoparlanti stereo appartengono agli aspetti più deboli del subnotebook compatto. Il loro volume massimo può essere decente, ma il suono in sé non ha molta dimensione e manca chiaramente di ciò che molti concorrenti del dispositivo sono in grado di offrire.
MSI Prestige 13 AI Evo analisi audio
(±) | potenza degli altiparlanti media ma buona (81.8 dB)
Bassi 100 - 315 Hz
(-) | quasi nessun basso - in media 20.5% inferiori alla media
(±) | la linearità dei bassi è media (8.4% delta rispetto alla precedente frequenza)
Medi 400 - 2000 Hz
(±) | medi elevati - circa 6.1% superiore alla media
(+) | medi lineari (5.9% delta rispetto alla precedente frequenza)
Alti 2 - 16 kHz
(+) | Alti bilanciati - appena 4.7% dalla media
(+) | alti lineari (5.4% delta rispetto alla precedente frequenza)
Nel complesso 100 - 16.000 Hz
(±) | la linearità complessiva del suono è media (19% di differenza rispetto alla media
Rispetto alla stessa classe
» 58% di tutti i dispositivi testati in questa classe è stato migliore, 6% simile, 36% peggiore
» Il migliore ha avuto un delta di 5%, medio di 18%, peggiore di 53%
Rispetto a tutti i dispositivi testati
» 45% di tutti i dispositivi testati in questa classe è stato migliore, 7% similare, 48% peggiore
» Il migliore ha avuto un delta di 4%, medio di 24%, peggiore di 134%
Dell Latitude 13 7340 i5-1345U analisi audio
(+) | gli altoparlanti sono relativamente potenti (83 dB)
Bassi 100 - 315 Hz
(±) | bassi ridotti - in media 6.2% inferiori alla media
(±) | la linearità dei bassi è media (9.6% delta rispetto alla precedente frequenza)
Medi 400 - 2000 Hz
(+) | medi bilanciati - solo only 2.3% rispetto alla media
(+) | medi lineari (5.1% delta rispetto alla precedente frequenza)
Alti 2 - 16 kHz
(±) | alti elevati - circa 5.6% superiori alla media
(±) | la linearità degli alti è media (7.9% delta rispetto alla precedente frequenza)
Nel complesso 100 - 16.000 Hz
(+) | suono nel complesso lineare (9% differenza dalla media)
Rispetto alla stessa classe
» 4% di tutti i dispositivi testati in questa classe è stato migliore, 1% simile, 95% peggiore
» Il migliore ha avuto un delta di 5%, medio di 18%, peggiore di 53%
Rispetto a tutti i dispositivi testati
» 3% di tutti i dispositivi testati in questa classe è stato migliore, 1% similare, 96% peggiore
» Il migliore ha avuto un delta di 4%, medio di 24%, peggiore di 134%
HP Dragonfly G4 analisi audio
(+) | gli altoparlanti sono relativamente potenti (84.4 dB)
Bassi 100 - 315 Hz
(±) | bassi ridotti - in media 8.4% inferiori alla media
(±) | la linearità dei bassi è media (11.6% delta rispetto alla precedente frequenza)
Medi 400 - 2000 Hz
(+) | medi bilanciati - solo only 2.3% rispetto alla media
(+) | medi lineari (4.8% delta rispetto alla precedente frequenza)
Alti 2 - 16 kHz
(+) | Alti bilanciati - appena 3.2% dalla media
(+) | alti lineari (4.6% delta rispetto alla precedente frequenza)
Nel complesso 100 - 16.000 Hz
(+) | suono nel complesso lineare (9.1% differenza dalla media)
Rispetto alla stessa classe
» 4% di tutti i dispositivi testati in questa classe è stato migliore, 1% simile, 95% peggiore
» Il migliore ha avuto un delta di 5%, medio di 18%, peggiore di 53%
Rispetto a tutti i dispositivi testati
» 3% di tutti i dispositivi testati in questa classe è stato migliore, 1% similare, 96% peggiore
» Il migliore ha avuto un delta di 4%, medio di 24%, peggiore di 134%
Gestione dell'energia - Buona resistenza con una batteria da 75 Wh
Consumo di energia
Durante le misurazioni dei consumi, non abbiamo notato alcuna incongruenza e il consumo massimo del laptop in modalità idle è di circa 9 watt. Come nel caso di tutti i pannelli OLED, dovrebbe assicurarsi di impostare immagini di sfondo più scure e di utilizzare la modalità scura di Windows per ridurre al minimo il consumo energetico. Sotto carico, l'alimentatore raggiunge il suo limite di 65 watt per un breve periodo, poi si bilancia rapidamente a 33 watt e durante lo stress test è rimasto a questo livello.
| Off / Standby | |
| Idle | |
| Sotto carico |
|
Leggenda:
min: | |
| MSI Prestige 13 AI Evo Ultra 7 155H, Arc 8-Core, Samsung PM9A1 MZVL21T0HCLR, OLED, 2880x1800, 13.3" | Lenovo ThinkPad X1 Nano Gen 3 i7-1360P, Iris Xe G7 96EUs, Lenovo UMIS AM6A0 RPJTJ512MKP1QDQ, IPS, 2160x1350, 13" | Dell Latitude 13 7340 i5-1345U i5-1345U, Iris Xe G7 80EUs, Kioxia BG5 KBG50ZNS512G, IPS, 1920x1200, 13.3" | HP Dragonfly G4 i7-1365U, Iris Xe G7 96EUs, Micron 3400 MTFDKBA512TFH 512GB, IPS, 1920x1280, 13.5" | Asus ZenBook S13 OLED UX5304 i7-1355U, Iris Xe G7 96EUs, Samsung PM9A1 MZVL21T0HCLR, OLED, 2880x1800, 13.3" | Media Intel Arc 8-Core iGPU | Media della classe Subnotebook | |
|---|---|---|---|---|---|---|---|
| Power Consumption | 6% | 3% | -1% | -3% | -28% | 6% | |
| Idle Minimum * (Watt) | 4.5 | 3.3 27% | 2.37 47% | 4.1 9% | 5.8 -29% | 5.36 ? -19% | 3.77 ? 16% |
| Idle Average * (Watt) | 8 | 6.5 19% | 6.19 23% | 7.5 6% | 8.5 -6% | 8.53 ? -7% | 6.56 ? 18% |
| Idle Maximum * (Watt) | 8.7 | 7.1 18% | 14.1 -62% | 8.2 6% | 8.8 -1% | 11.8 ? -36% | 7.9 ? 9% |
| Load Average * (Watt) | 36.1 | 40.7 -13% | 36.3 -1% | 35.5 2% | 35.1 3% | 53.7 ? -49% | 41.5 ? -15% |
| Witcher 3 ultra * (Watt) | 29.7 | 37 -25% | 24.9 16% | 37.5 -26% | 27.6 7% | ||
| Load Maximum * (Watt) | 65 | 58.6 10% | 69.13 -6% | 66.5 -2% | 59.5 8% | 84.4 ? -30% | 64.1 ? 1% |
* ... Meglio usare valori piccoli
Power consumption Witcher 3 / stress test
Power consumption with external monitor
Tempi di esecuzione
Nonostante il peso ridotto, MSI ha installato una batteria da 75 Wh, che offre una buona autonomia nonostante il pannello OLED del portatile. Sebbene le sue controparti IPS in genere funzionino ancora più a lungo, è riuscito a battere di poco lo Zenbook S13 OLED di Asus. Durante il nostro test WLAN a 150 cd/m² (57% della luminosità massima SDR del dispositivo), l'esemplare di prova ha funzionato per ~11,5 ore, e alla massima luminosità per ~7,5 ore. È possibile riprodurre video per 16,5 ore (150 cd/m²), mentre un video HDR alla massima luminosità può essere eseguito per 6 ore. Una carica completa richiede 220 minuti con il dispositivo acceso, mentre l'80% della sua capacità è disponibile dopo 114 minuti.
| MSI Prestige 13 AI Evo Ultra 7 155H, Arc 8-Core, 75 Wh | Lenovo ThinkPad X1 Nano Gen 3 i7-1360P, Iris Xe G7 96EUs, 49.5 Wh | Dell Latitude 13 7340 i5-1345U i5-1345U, Iris Xe G7 80EUs, 57 Wh | HP Dragonfly G4 i7-1365U, Iris Xe G7 96EUs, 68 Wh | Asus ZenBook S13 OLED UX5304 i7-1355U, Iris Xe G7 96EUs, 63 Wh | Media della classe Subnotebook | |
|---|---|---|---|---|---|---|
| Autonomia della batteria | -33% | 17% | 26% | -11% | -5% | |
| H.264 (h) | 16.7 | 13.8 -17% | 15.6 ? -7% | |||
| WiFi v1.3 (h) | 11.6 | 7.8 -33% | 15 29% | 15.9 37% | 11.3 -3% | 14 ? 21% |
| Load (h) | 2.8 | 2.9 4% | 3.2 14% | 2.4 -14% | 1.951 ? -30% |
Pro
Contro
Verdetto - MSI Prestige 13 convince per il suo peso ridotto e il pannello OLED

Il focus del nuovo MSI Prestige 13 AI Evo è chiaramente la portabilità e in questo aspetto, il nostro dispositivo di prova, con la sua struttura leggera e i buoni tempi di esecuzione, si dimostra un successo. Inoltre, il suo pannello OLED offre un'eccezionale qualità dell'immagine, con alcuni vantaggi rispetto a molti modelli IPS; tuttavia, non è affatto perfetto se il suo obiettivo è l'editing di foto. Se lavora spesso in movimento, i riflessi del pannello lucido potrebbero ostacolarla.
I suoi dati tecnici, sotto forma del nuovo Core Ultra 7 155H, promettono molte prestazioni, ma in realtà questo è il modello Meteor-Lake-H più lento che abbiamo testato finora. Per l'uso quotidiano, dovrebbe essere sufficiente in molti casi, ma non bisogna dimenticare quanto il dispositivo rimanga lontano dal suo reale potenziale di prestazioni (CPU e GPU). La sua RAM non può essere aggiornata, ma anche così, 32 GB dovrebbero essere più che sufficienti per la maggior parte degli utenti (dopo tutto, non si tratta di una workstation).
MSI Prestige 13 AI Evo pesa meno di 1 chilogrammo e, nonostante ciò, non deve rinunciare a tempi di esecuzione eccellenti, molte porte e un pannello OLED. Nonostante il processore Meteor Lake, le prestazioni del dispositivo non sono ancora le migliori; inoltre, il radiatore è quasi sempre attivo nell'uso quotidiano.
Per quanto riguarda le porte e la connettività del portatile, tra cui il Wi-Fi 7 e un lettore di schede veloce, non abbiamo molto di cui lamentarci, anche se il suo case compatto richiede alcuni compromessi. Tra questi, l'unità di raffreddamento composta da una sola ventola che è quasi sempre attiva, il che rende un dispositivo veramente silenzioso una rarità. Inoltre, la sua tastiera sembra un po' angusta, anche se la meccanica in sé è buona. Infine, i suoi deboli altoparlanti lasciano a desiderare e la concorrenza offre alcuni chiari vantaggi in questo senso.
Il HP Dragonfly G4 è probabilmente il principale concorrente del Prestige 13 e, a parte gli altoparlanti migliori, presenta anche una tastiera migliore e tempi di esecuzione più lunghi, ma a sua volta ha un pannello IPS (senza PWM) con una risoluzione inferiore e una qualità dell'immagine soggettivamente peggiore. Il suo MRSP è più alto, ma a questo punto potrebbe essere in grado di trovarlo a un prezzo inferiore online.
Prezzo e disponibilità
MSI Prestige 13 AI Evo si trova attualmente su Amazon a 1.280,71 dollari.
MSI Prestige 13 AI Evo
- 03/06/2024 v7 (old)
Andreas Osthoff
Transparency
La selezione dei dispositivi da recensire viene effettuata dalla nostra redazione. Il campione di prova è stato fornito all'autore come prestito dal produttore o dal rivenditore ai fini di questa recensione. L'istituto di credito non ha avuto alcuna influenza su questa recensione, né il produttore ne ha ricevuto una copia prima della pubblicazione. Non vi era alcun obbligo di pubblicare questa recensione. In quanto società mediatica indipendente, Notebookcheck non è soggetta all'autorità di produttori, rivenditori o editori.
Ecco come Notebookcheck esegue i test
Ogni anno, Notebookcheck esamina in modo indipendente centinaia di laptop e smartphone utilizzando procedure standardizzate per garantire che tutti i risultati siano comparabili. Da circa 20 anni sviluppiamo continuamente i nostri metodi di prova e nel frattempo stabiliamo gli standard di settore. Nei nostri laboratori di prova, tecnici ed editori esperti utilizzano apparecchiature di misurazione di alta qualità. Questi test comportano un processo di validazione in più fasi. Il nostro complesso sistema di valutazione si basa su centinaia di misurazioni e parametri di riferimento ben fondati, che mantengono l'obiettività.Price comparison

