Recensione del portatile HP Dragonfly G4: Piccoli aggiornamenti rispetto al già eccellente Dragonfly G3

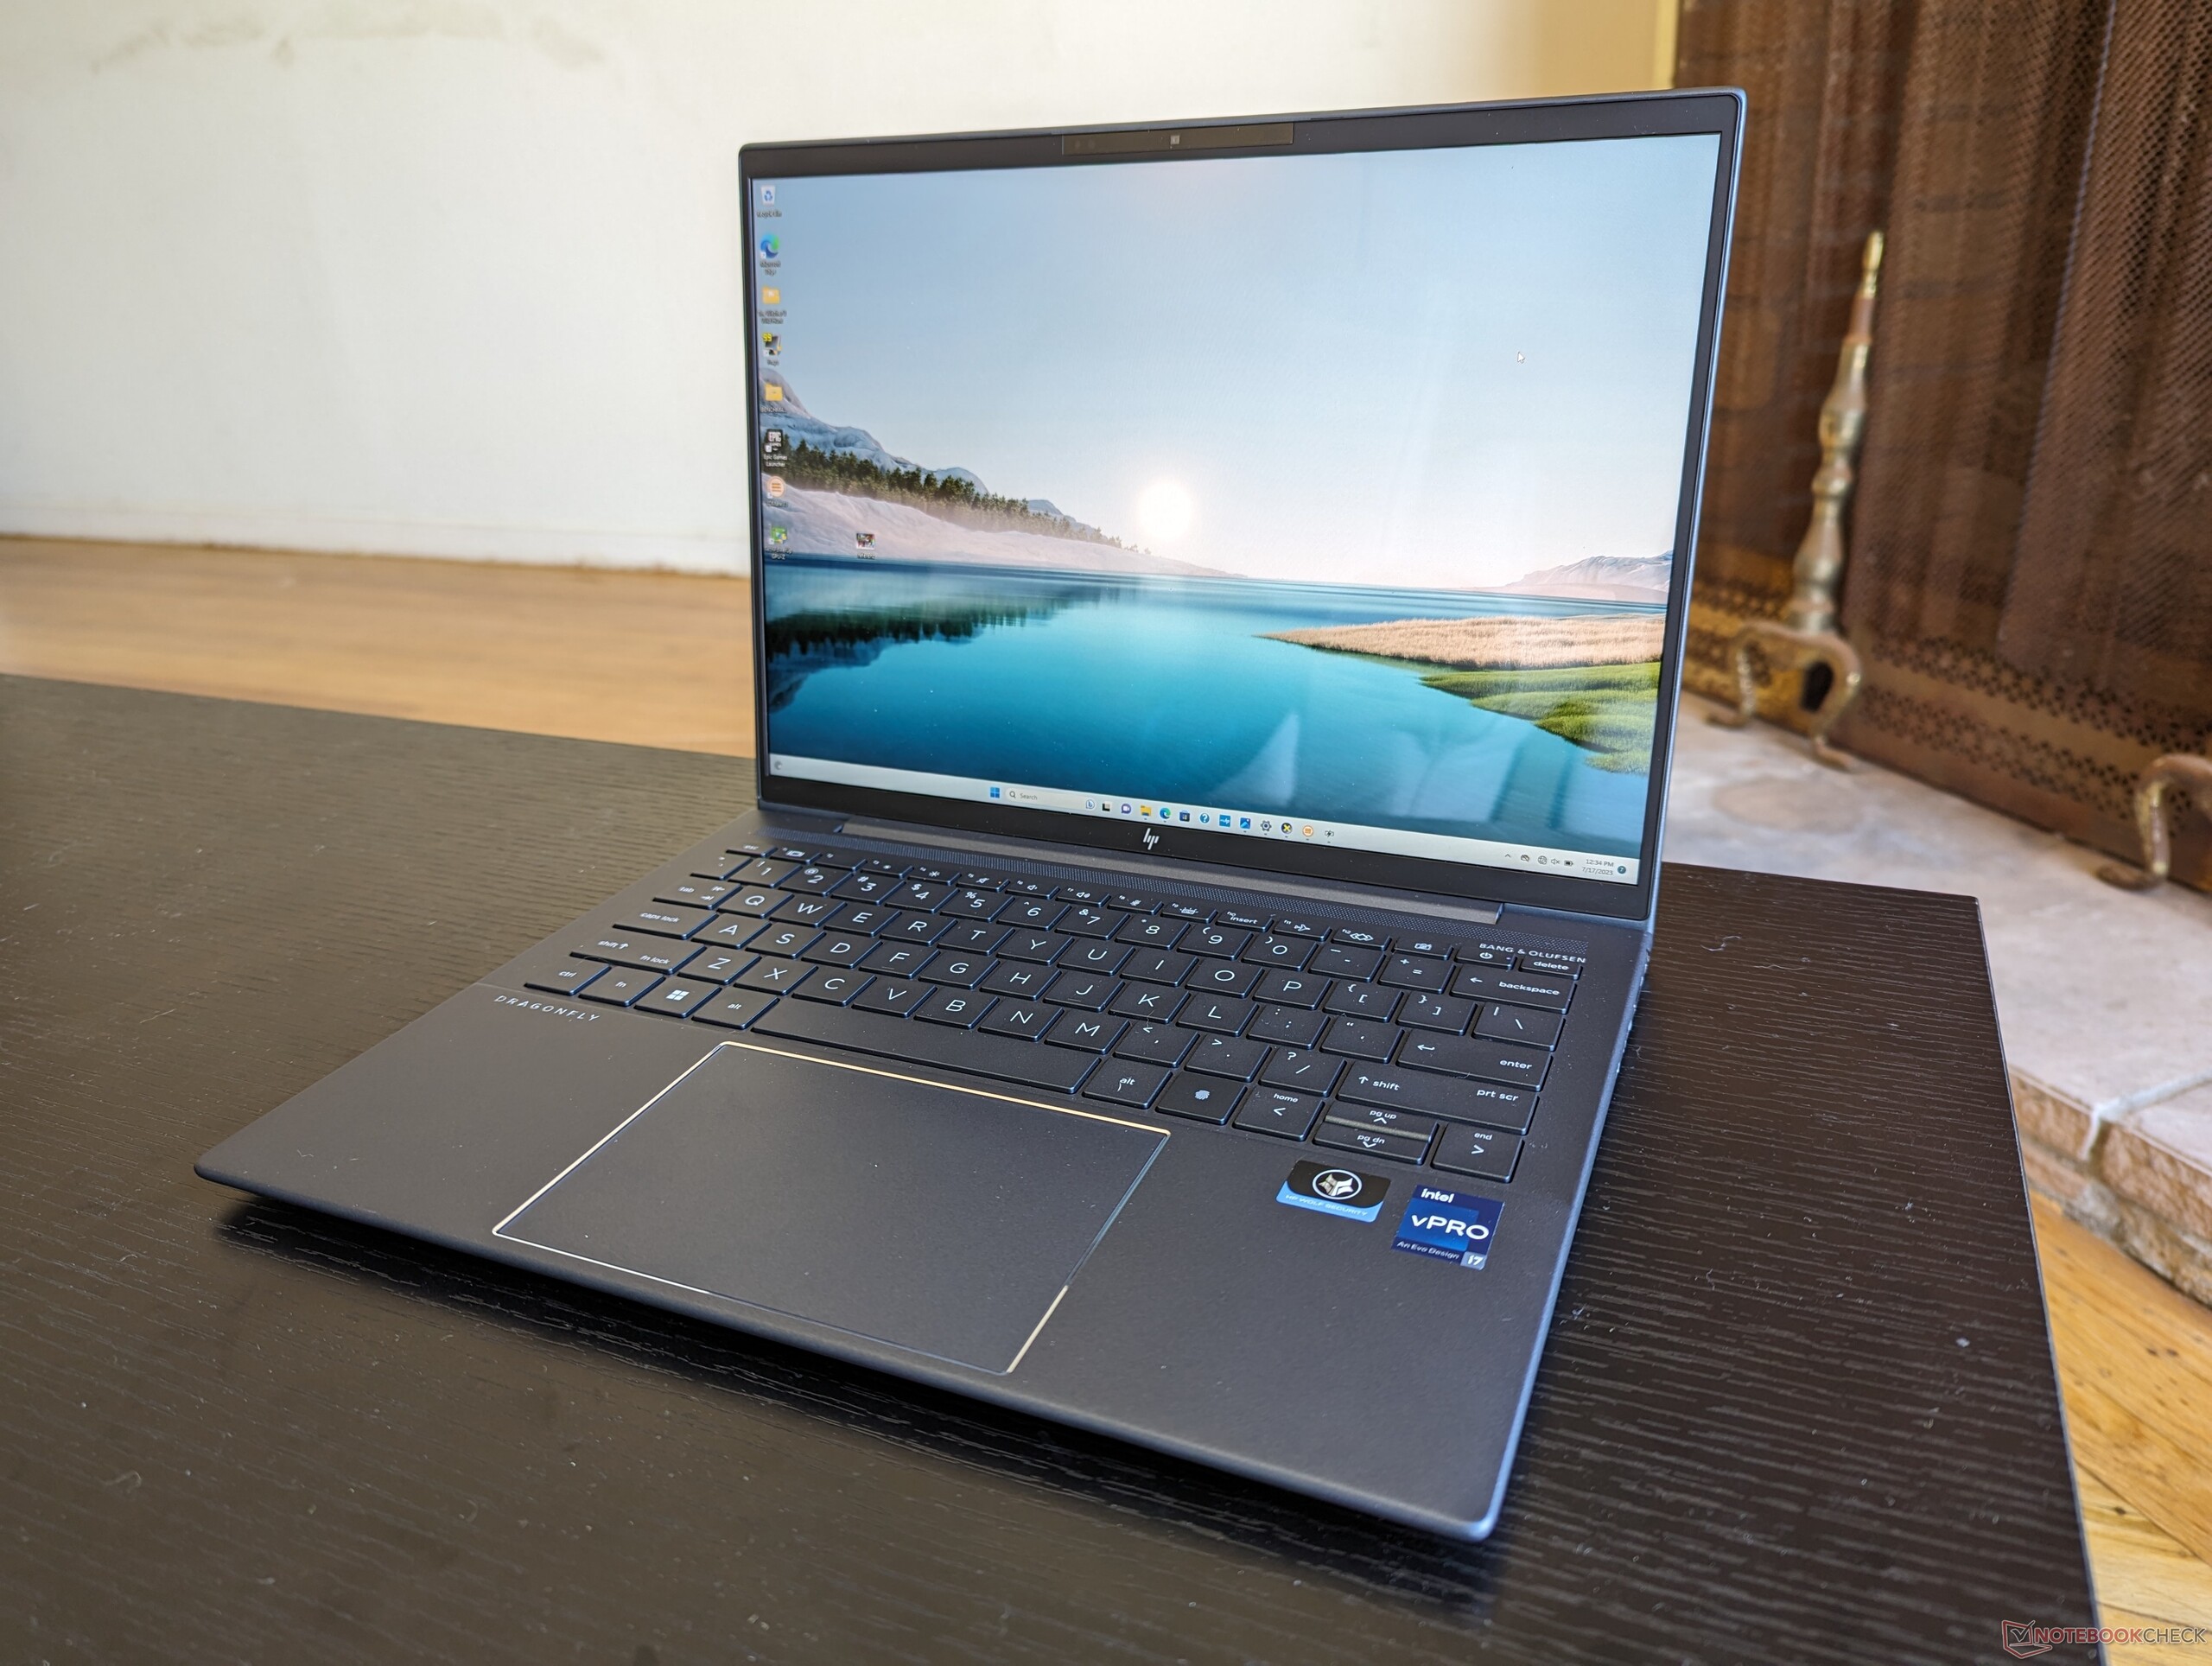
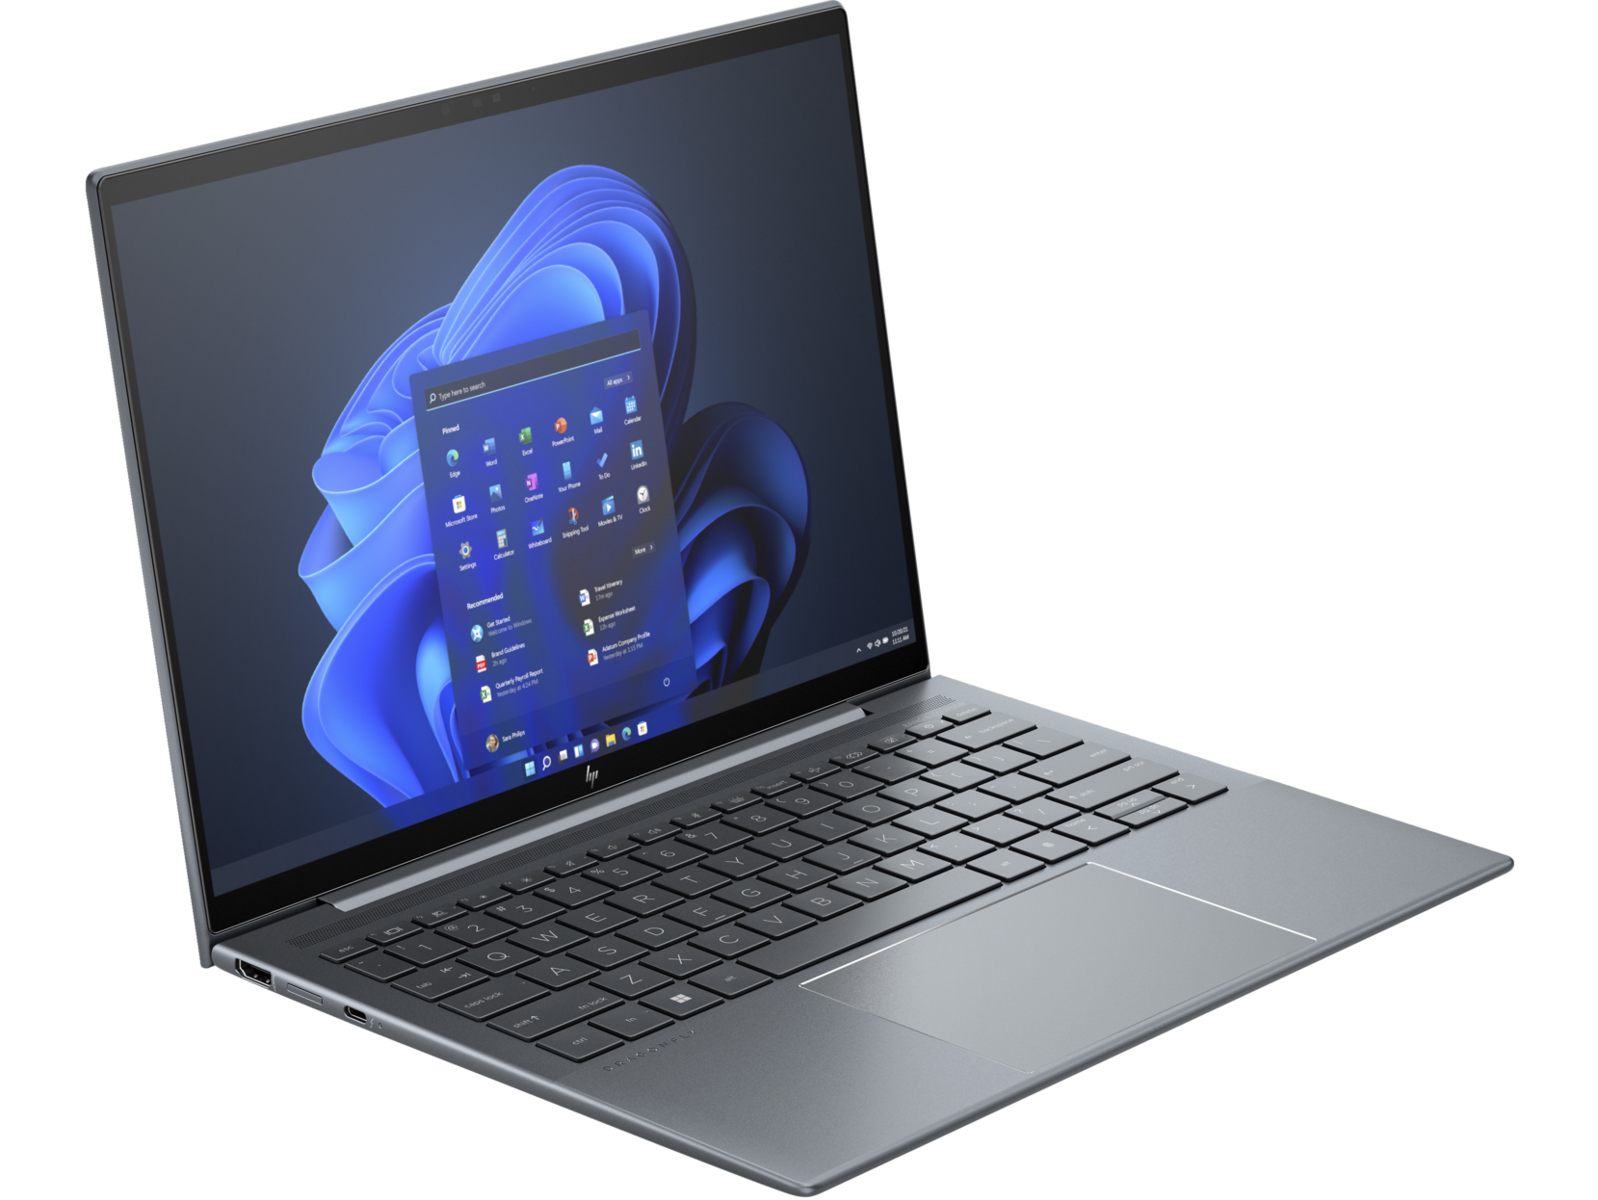
Il Dragonfly G4 succede direttamente all'Elite Dragonfly G3 dello scorso anno, abbandonando ufficialmente il moniker "Elite" e sostituendo le opzioni Alder Lake-U di 12a generazione con Raptor Lake-U di 13a generazione. A parte questo, lo chassis esterno rimane identico rispetto all'anno precedente e quindi vi consigliamo di consultare la la nostra recensione del Dragonfly G3 Elite per saperne di più sulle caratteristiche fisiche del portatile.
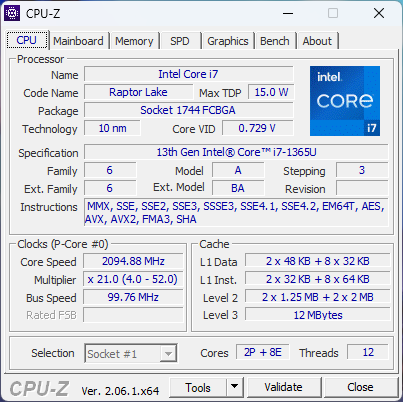
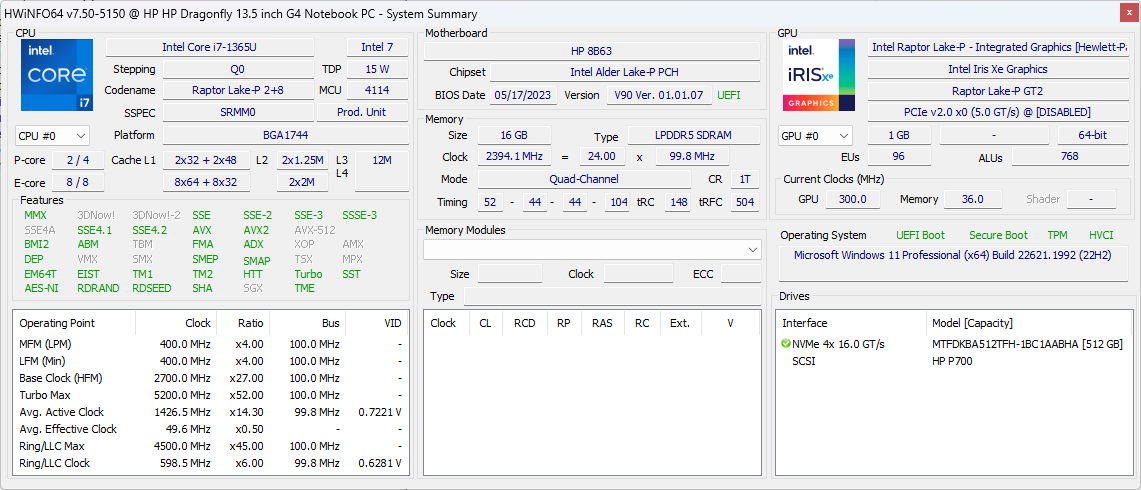
L'unità da noi recensita è una configurazione di fascia media con CPU Core i7-1365U e display IPS non-touch da 1280p a 400 nit, al prezzo di circa 1.700 dollari. Le altre SKU vanno dal Core i5-1335U fino all'OLED 3000 x 2000 a partire da 1300 dollari fino a quasi 2400 dollari a seconda della RAM e dello storage.
Il Dragonfly G4 compete direttamente con altri computer portatili ultrasottili di fascia alta per il settore prosumer o business come il Lenovo ThinkPad X13 G3, Dell Latitude 9330, Microsoft Surfaceo il Asus ZenBook S 13.
Altre recensioni di HP:
Potenziali concorrenti a confronto
Punteggio | Data | Modello | Peso | Altezza | Dimensione | Risoluzione | Prezzo |
|---|---|---|---|---|---|---|---|
| 91.9 % v7 (old) | 07/2023 | HP Dragonfly G4 i7-1365U, Iris Xe G7 96EUs | 1.1 kg | 16.3 mm | 13.50" | 1920x1280 | |
| 91 % v7 (old) | 08/2022 | HP Elite Dragonfly G3 i7-1265U, Iris Xe G7 96EUs | 1.2 kg | 16.3 mm | 13.50" | 1920x1280 | |
| 86.2 % v7 (old) | 05/2023 | Framework Laptop 13.5 13th Gen Intel i7-1370P, Iris Xe G7 96EUs | 1.3 kg | 15.85 mm | 13.50" | 2256x1504 | |
| 90.6 % v7 (old) | 06/2023 | Lenovo ThinkPad X13 G3 21CM002UGE R5 PRO 6650U, Radeon 660M | 1.3 kg | 18.1 mm | 13.30" | 1920x1200 | |
| 89 % v7 (old) | 11/2022 | Dell Latitude 9330 i7-1260U, Iris Xe G7 96EUs | 1.2 kg | 14.1 mm | 13.30" | 2560x1600 | |
| 92.3 % v7 (old) | 07/2022 | Apple MacBook Air M2 Entry M2, M2 8-Core GPU | 1.2 kg | 11.3 mm | 13.60" | 2560x1664 |
Caso: in parte prosumer, in parte business
Comunicazione
Webcam
I laptop HP Spectre, EliteBook e Dragonfly continuano a essere dotati di webcam da 5 MP o superiori, per immagini sensibilmente più nitide rispetto alle webcam della maggior parte degli altri laptop, dove i sensori da 1 MP e 2 MP sono ancora comuni. Sia l'IR che l'otturatore per la privacy sono di serie.
Il software della fotocamera HP ora supporta la correzione trapezoidale per ritagliare o appiattire un feed video per la condivisione di lavagne o fogli, la funzione AI Auto Camera per tenere gli occhi puntati sulla fotocamera invece che sullo schermo e il supporto multi-camera per lo streaming di due feed video contemporaneamente.


Manutenzione
A differenza della maggior parte degli altri produttori, HP carica video molto utili su come riparare o smontare molti dei suoi portatili, compreso il Dragonfly G4. Consigliamo a di dare un'occhiata al videoqui sotto per il teardown completo.
Display
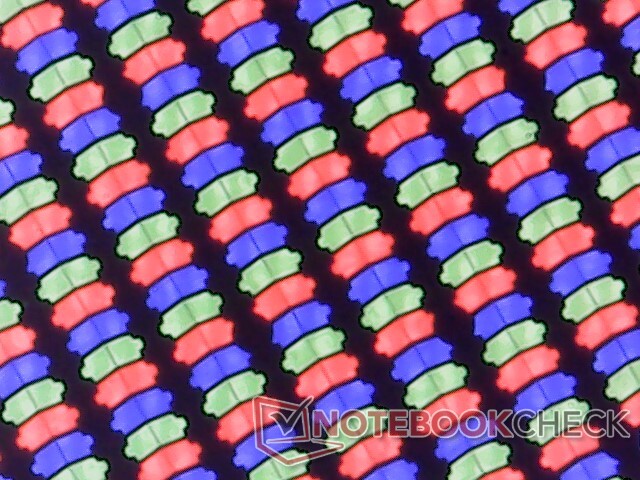
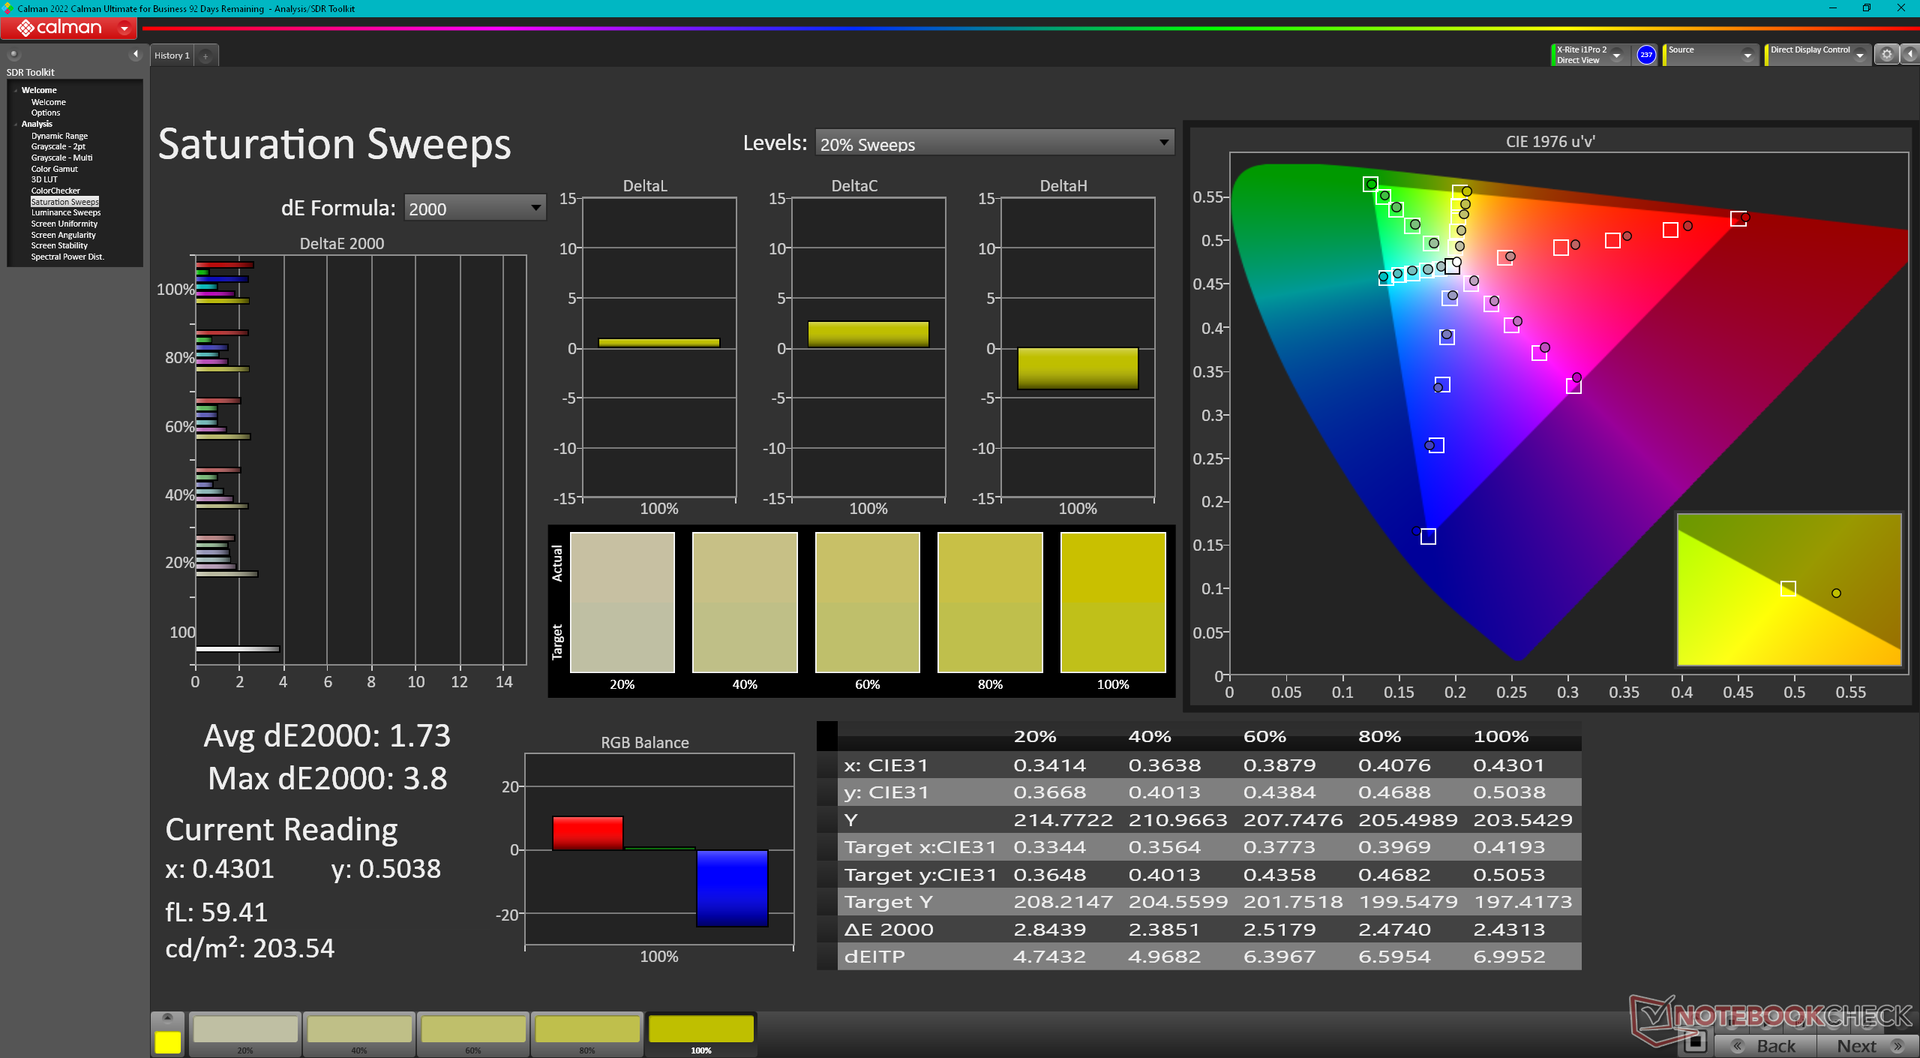
Il modello offre sei opzioni di visualizzazione che vanno da 1280p IPS a 2000p OLED. Sono disponibili anche le opzioni Touchscreen, Sure View e 1000-nit, ma solo per alcune configurazioni IPS a 1280p. La nostra unità di prova viene fornita con il pannello base Chi Mei CMN13C0 da 1280p e 400 nit, identico a quello offerto da HP sul modello Dragonfly G3 dello scorso anno Dragonfly G3 dello scorso anno. Pertanto, l'esperienza visiva anno dopo anno rimane identica.
| |||||||||||||||||||||||||
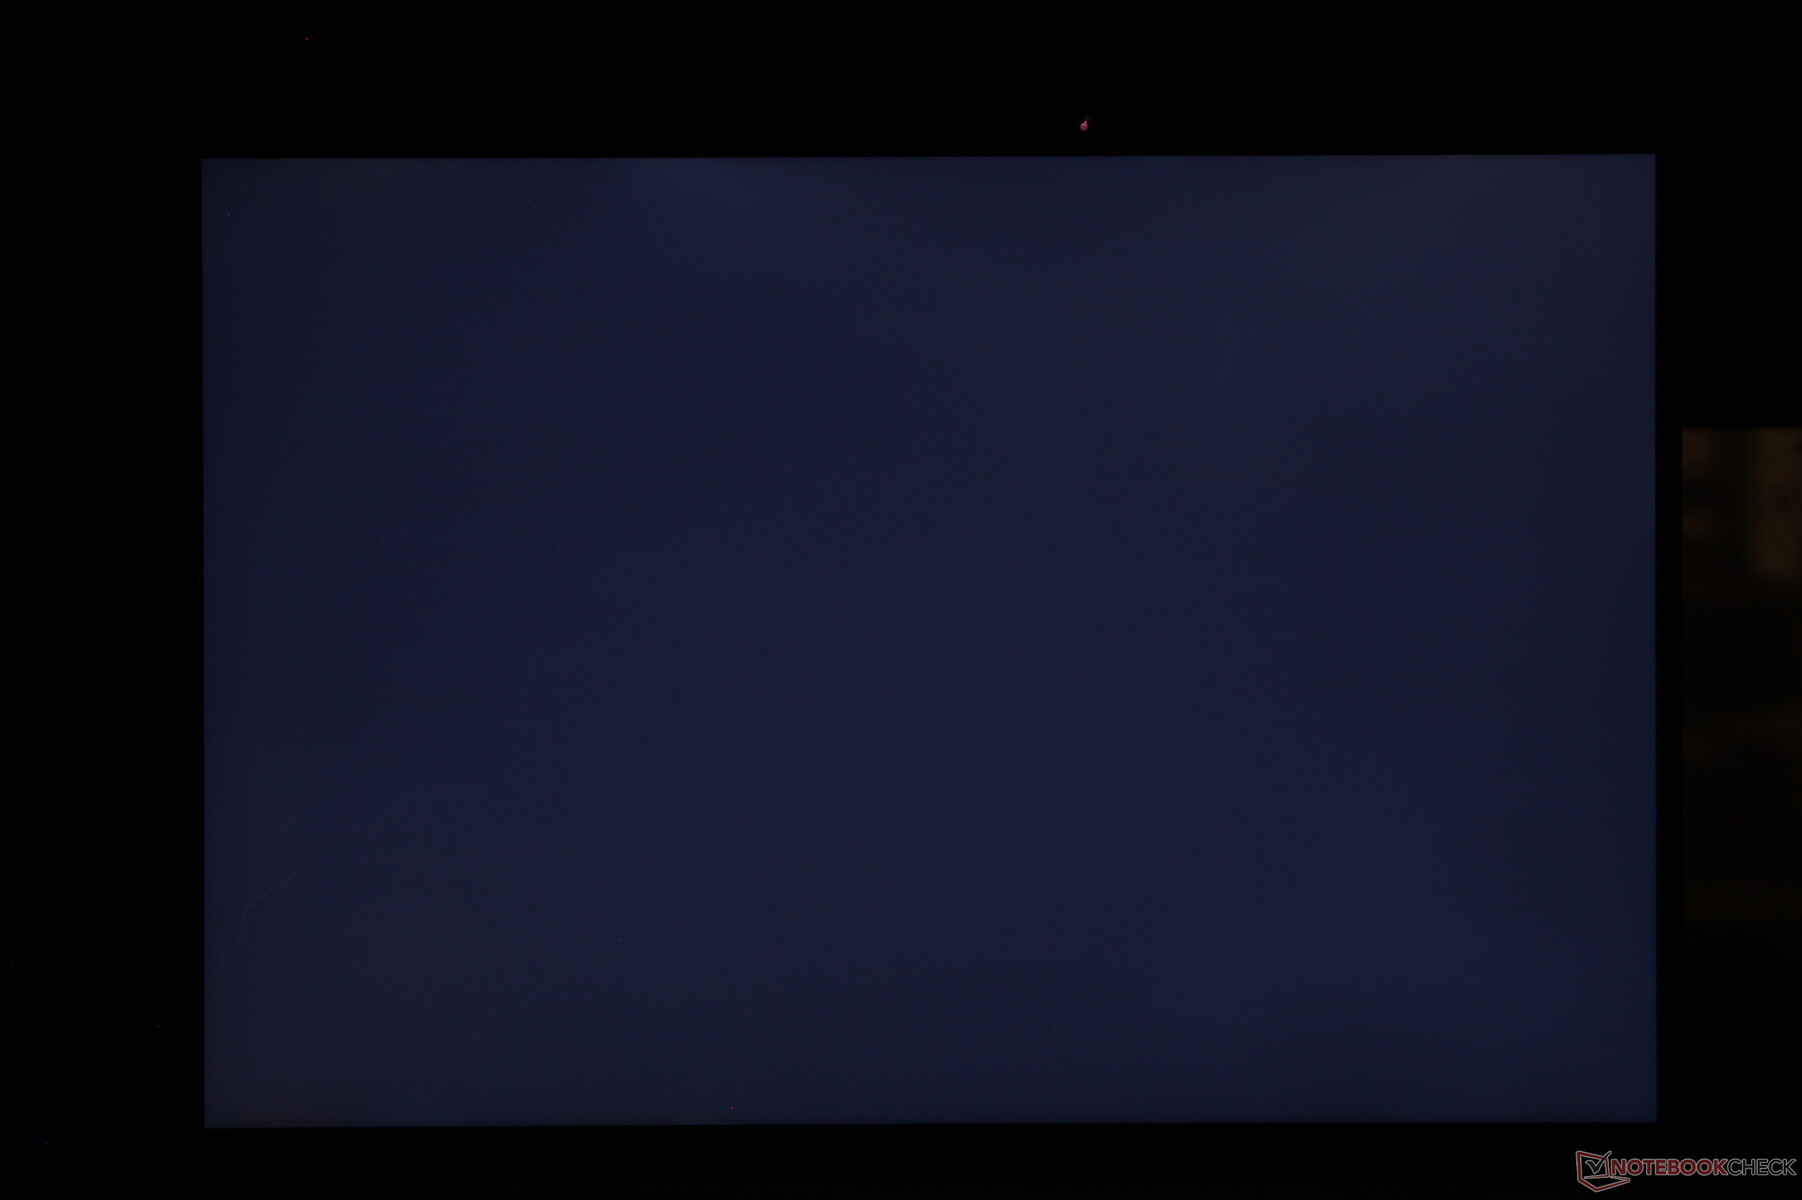
Distribuzione della luminosità: 90 %
Al centro con la batteria: 408.8 cd/m²
Contrasto: 1278:1 (Nero: 0.32 cd/m²)
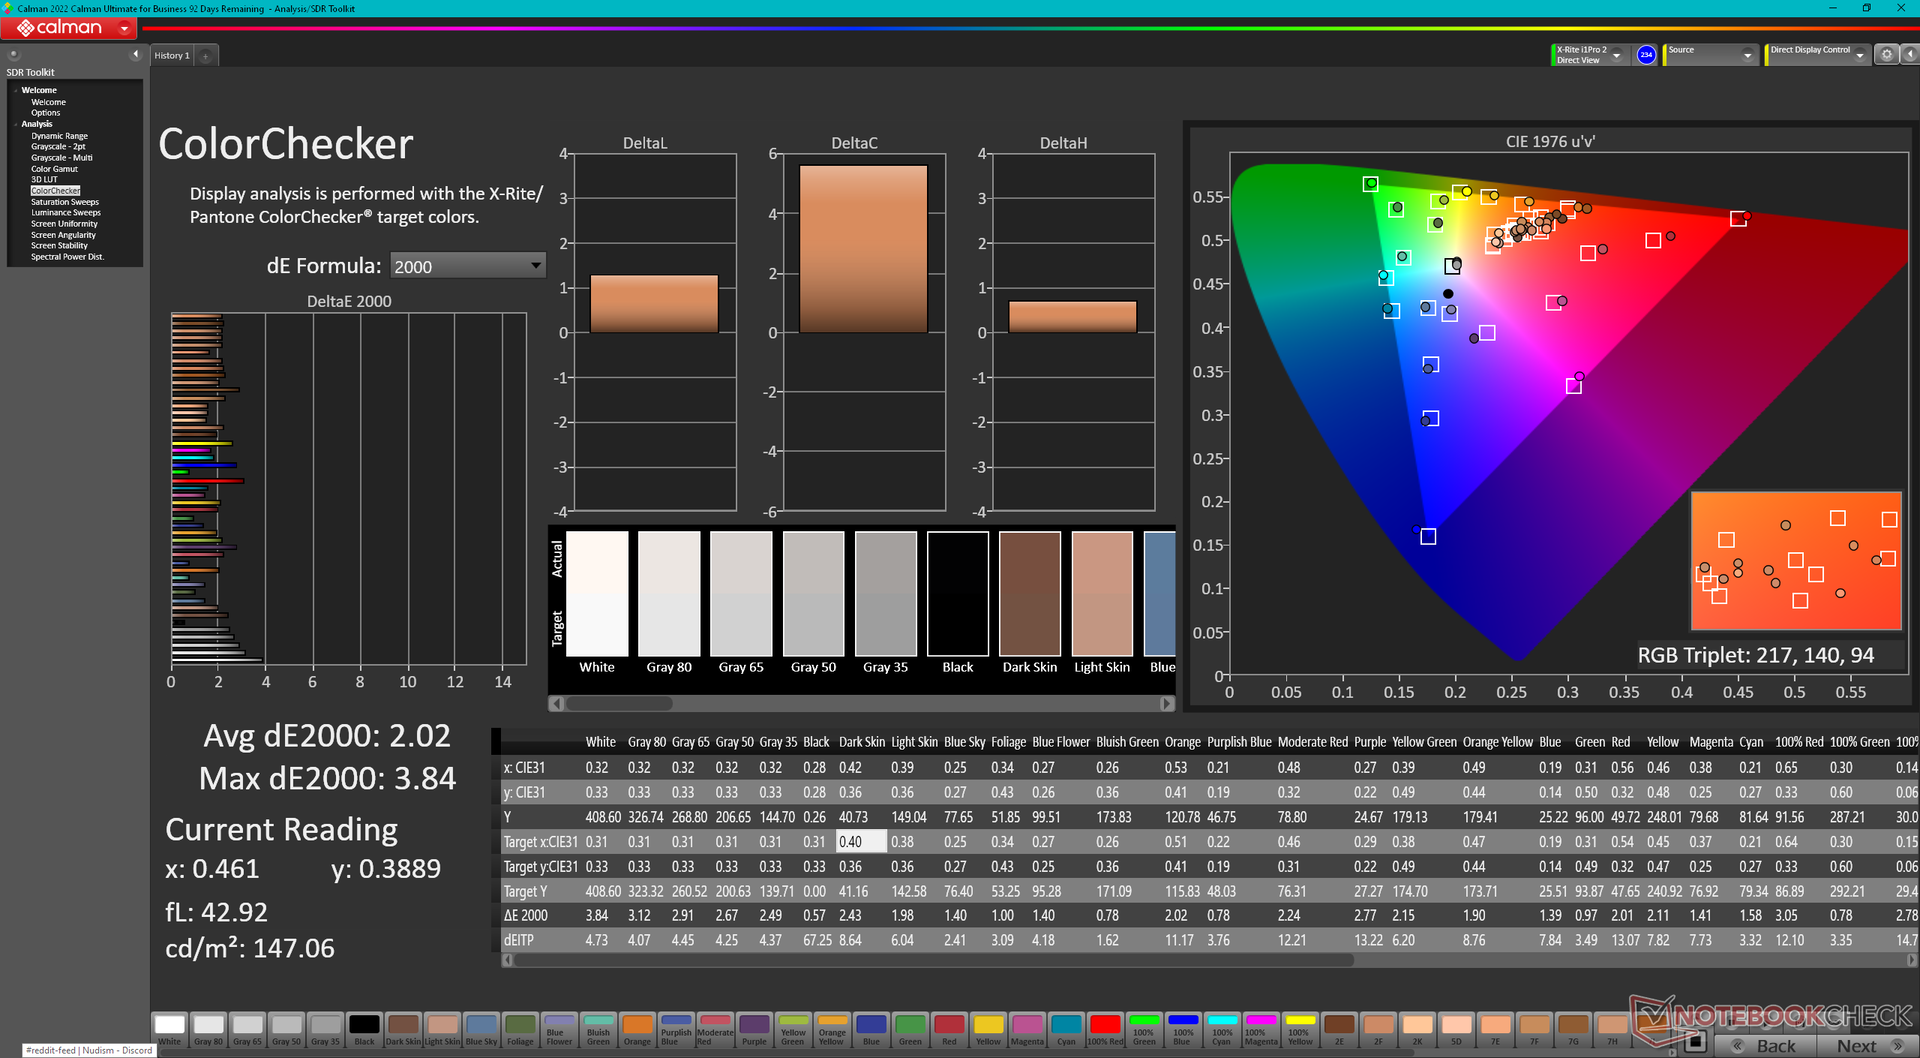
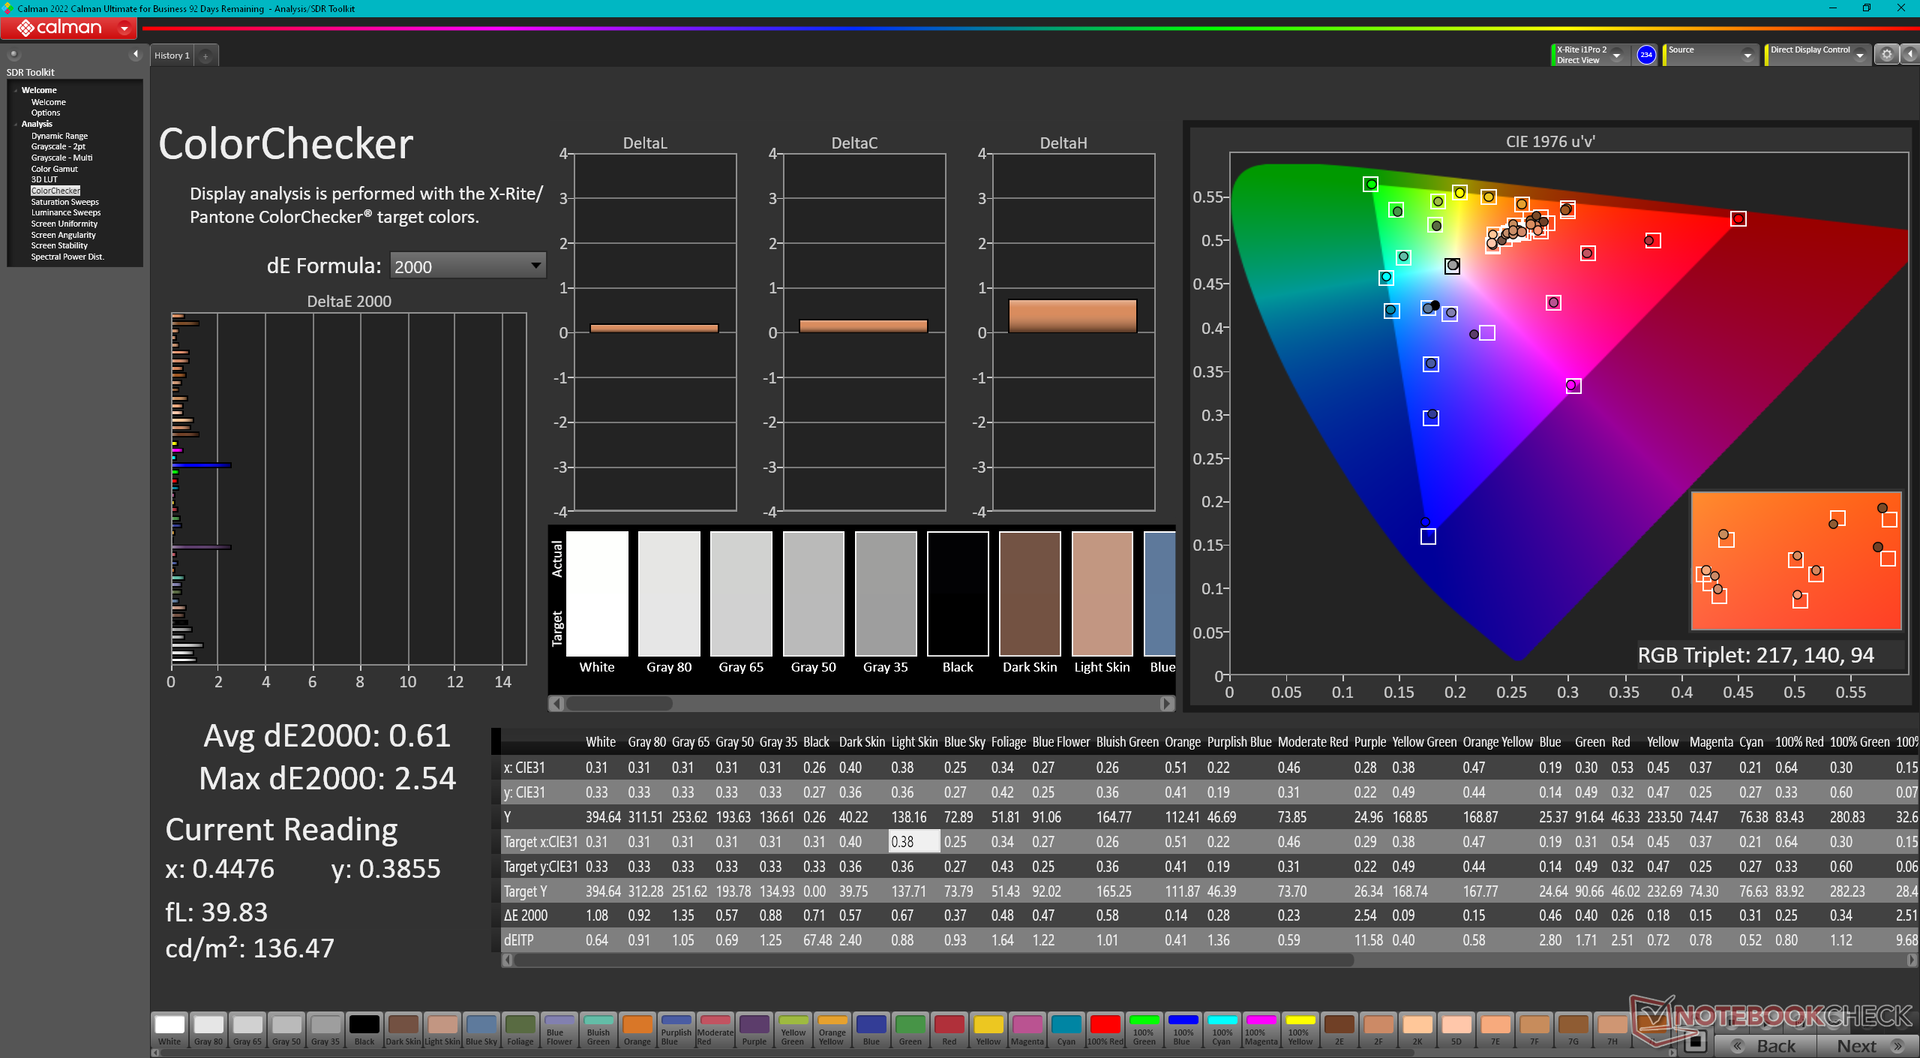
ΔE ColorChecker Calman: 2.02 | ∀{0.5-29.43 Ø4.71}
calibrated: 0.61
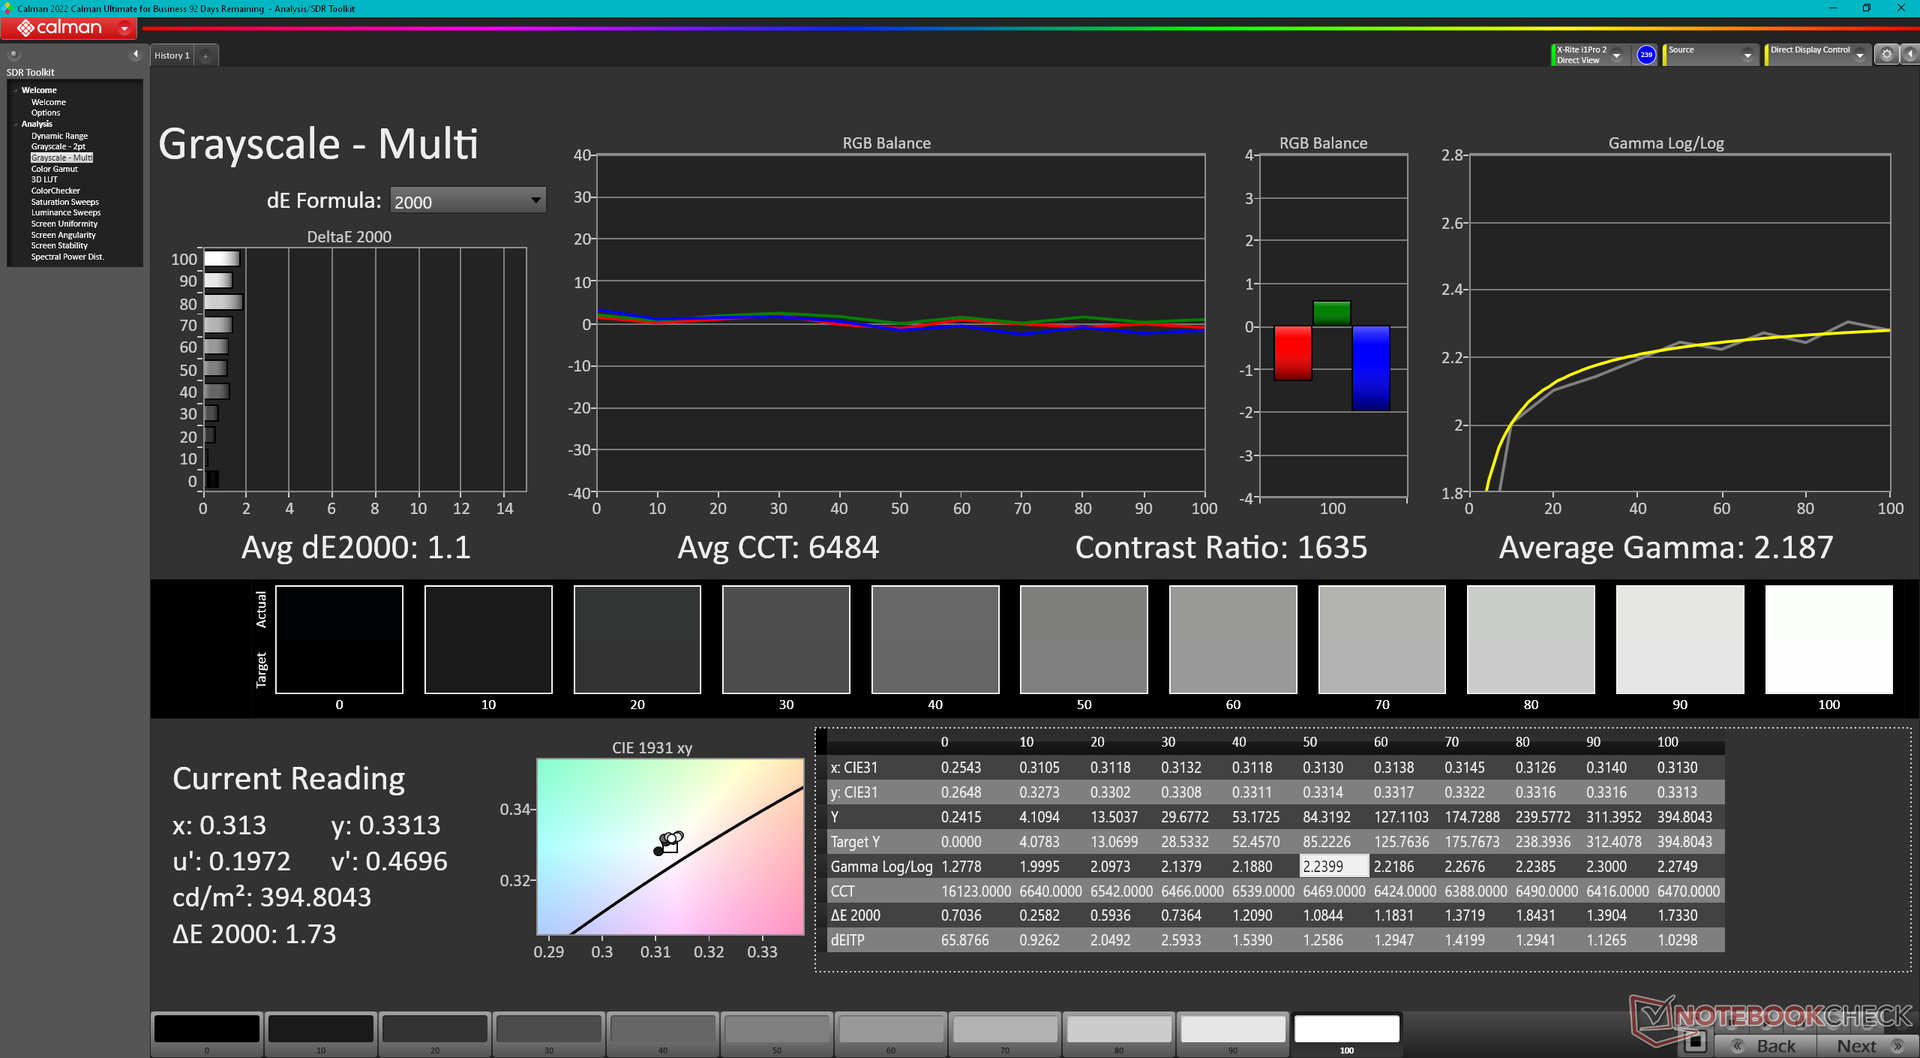
ΔE Greyscale Calman: 2.3 | ∀{0.09-98 Ø4.96}
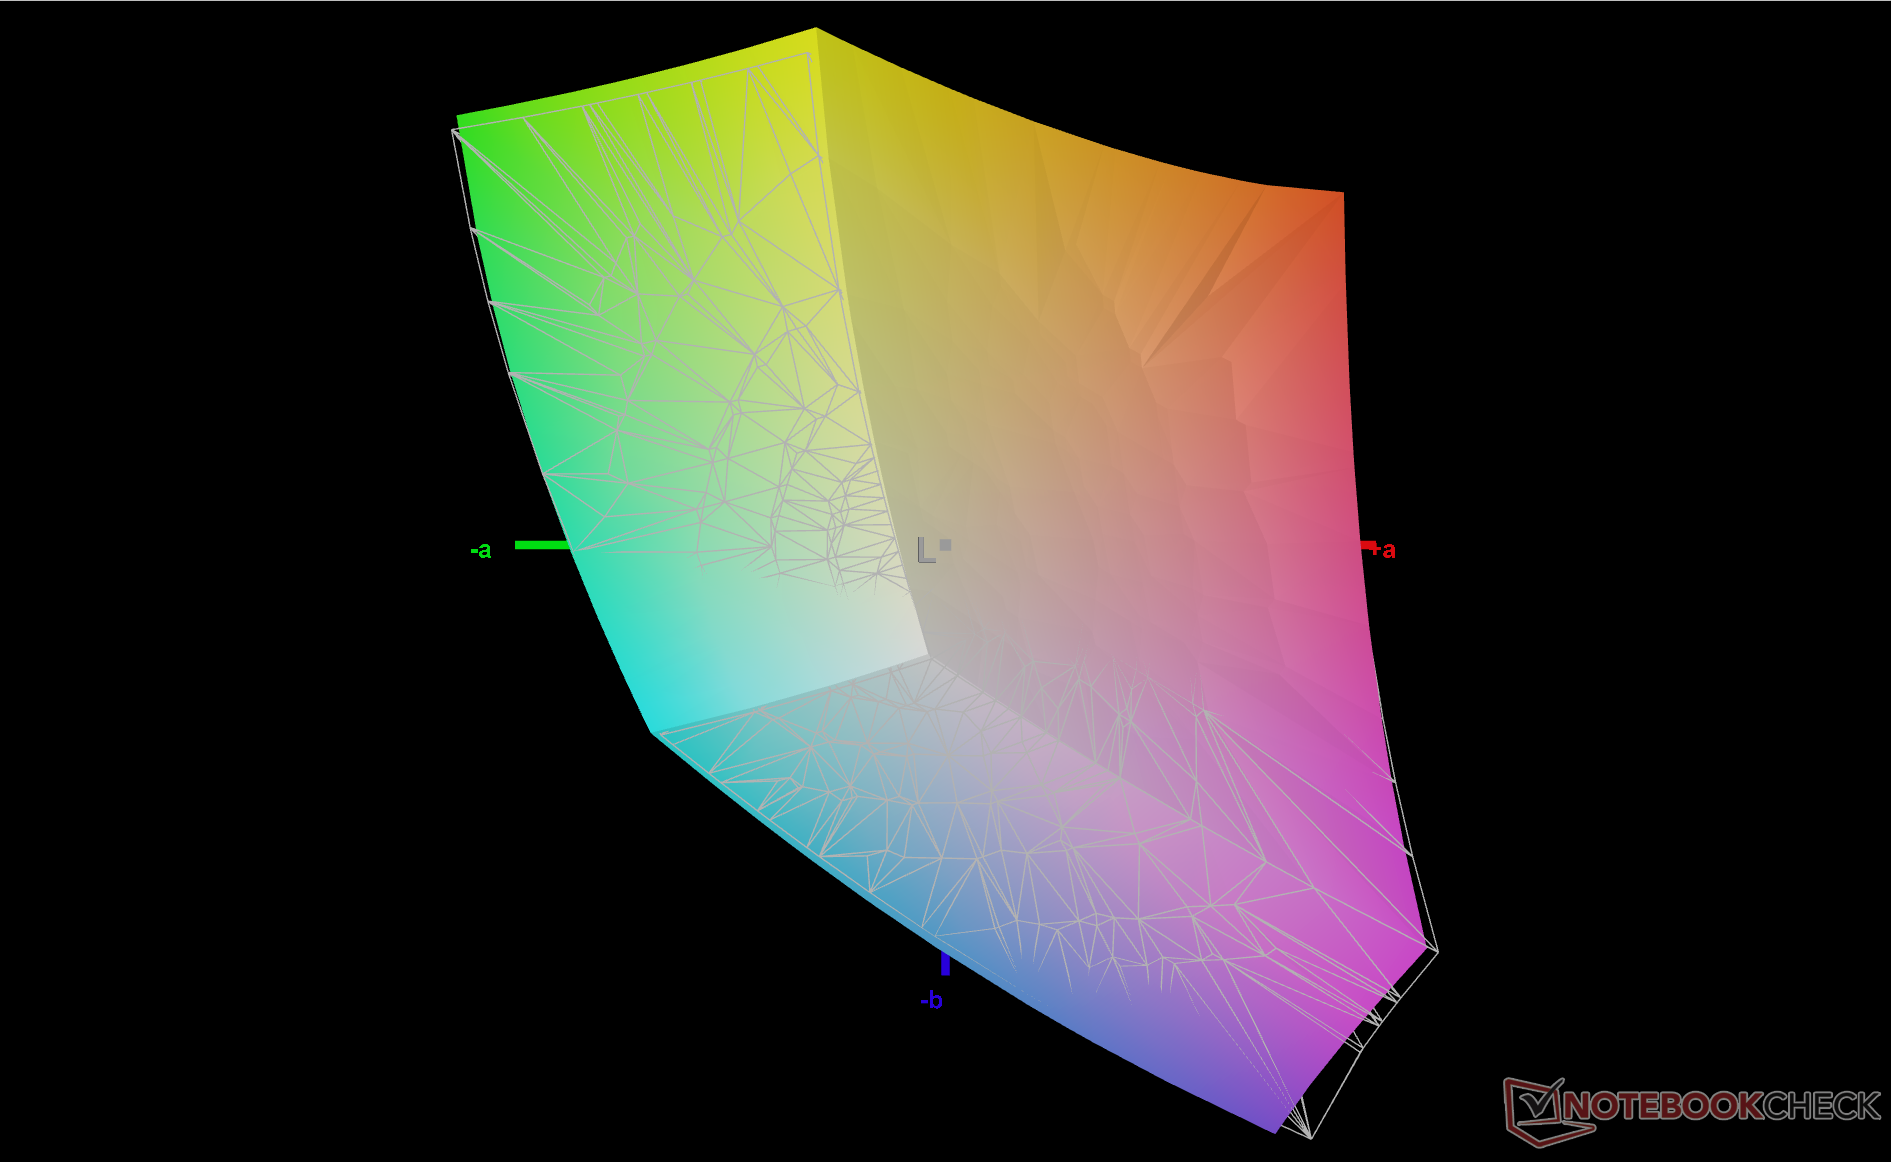
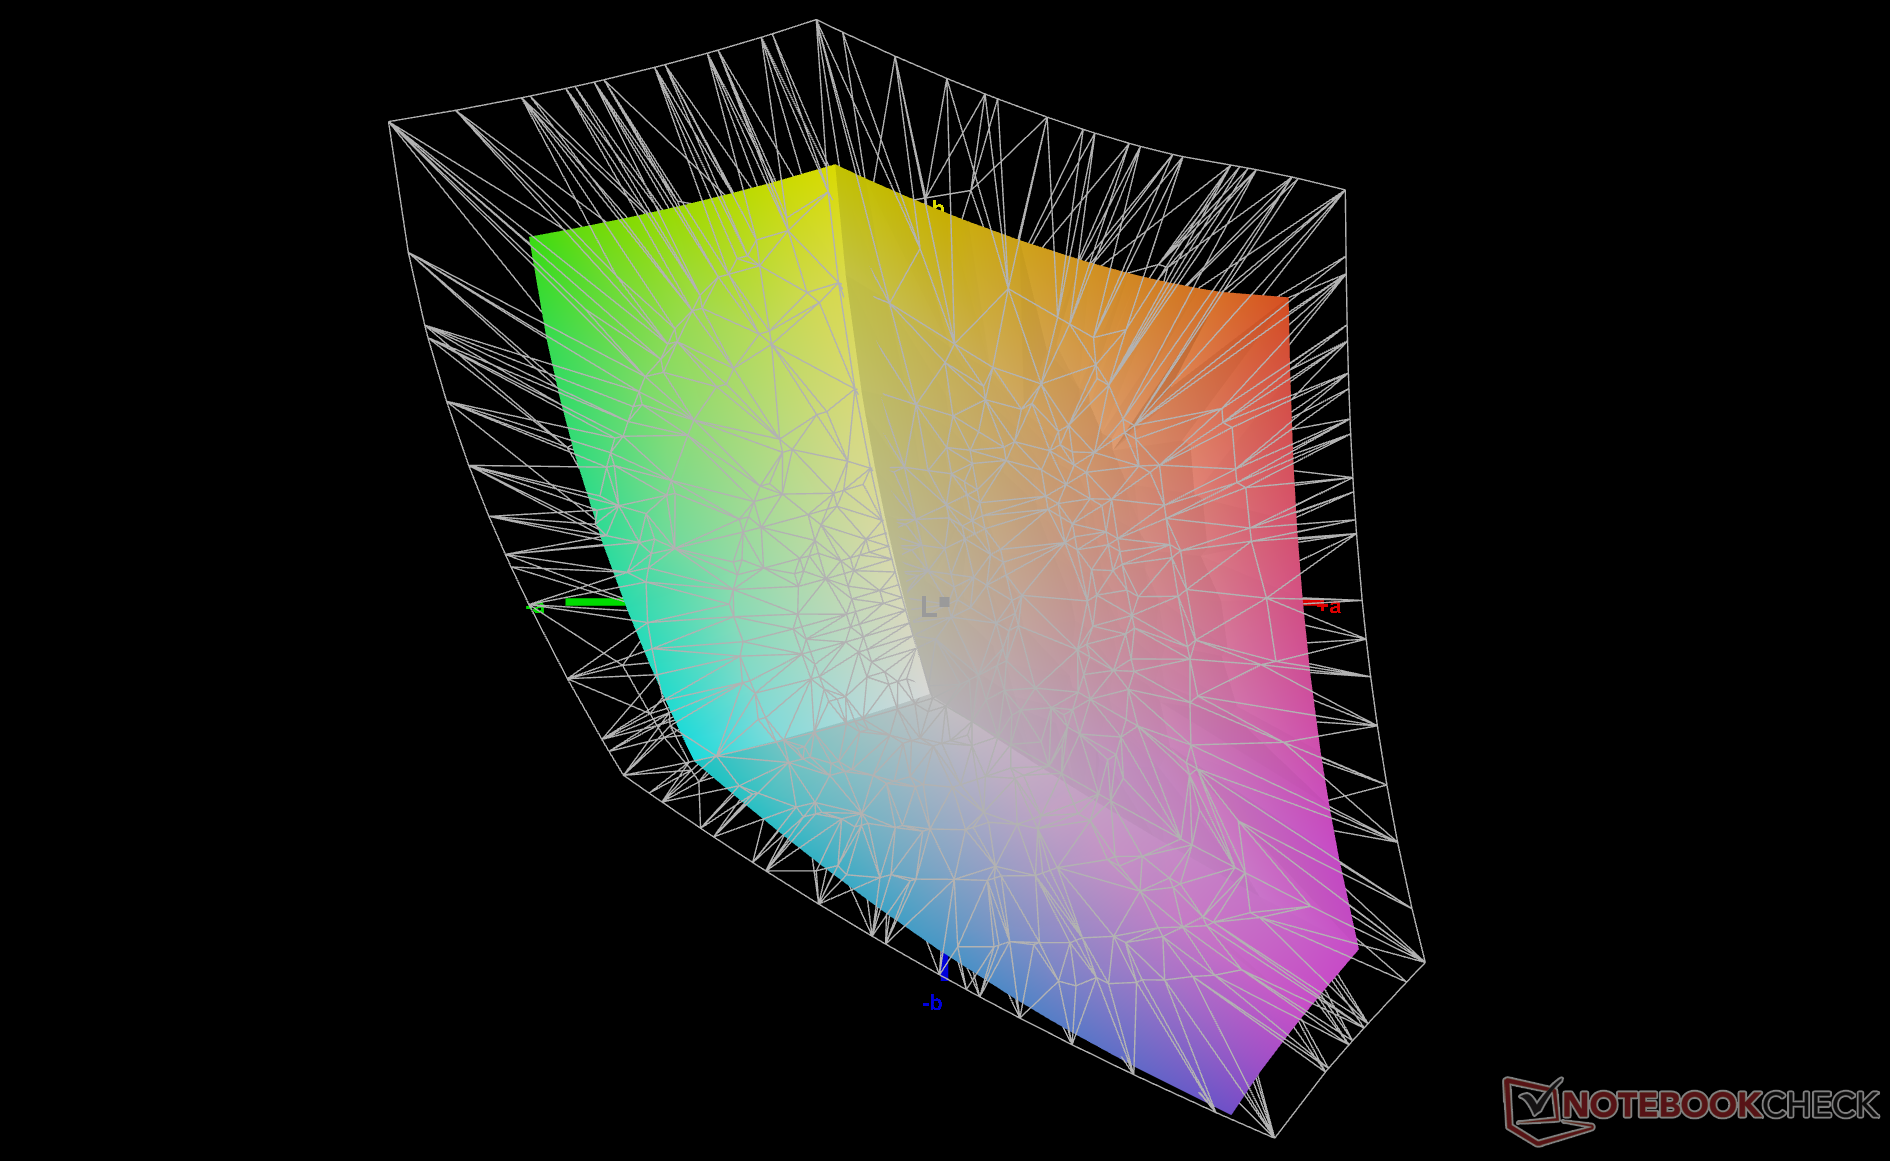
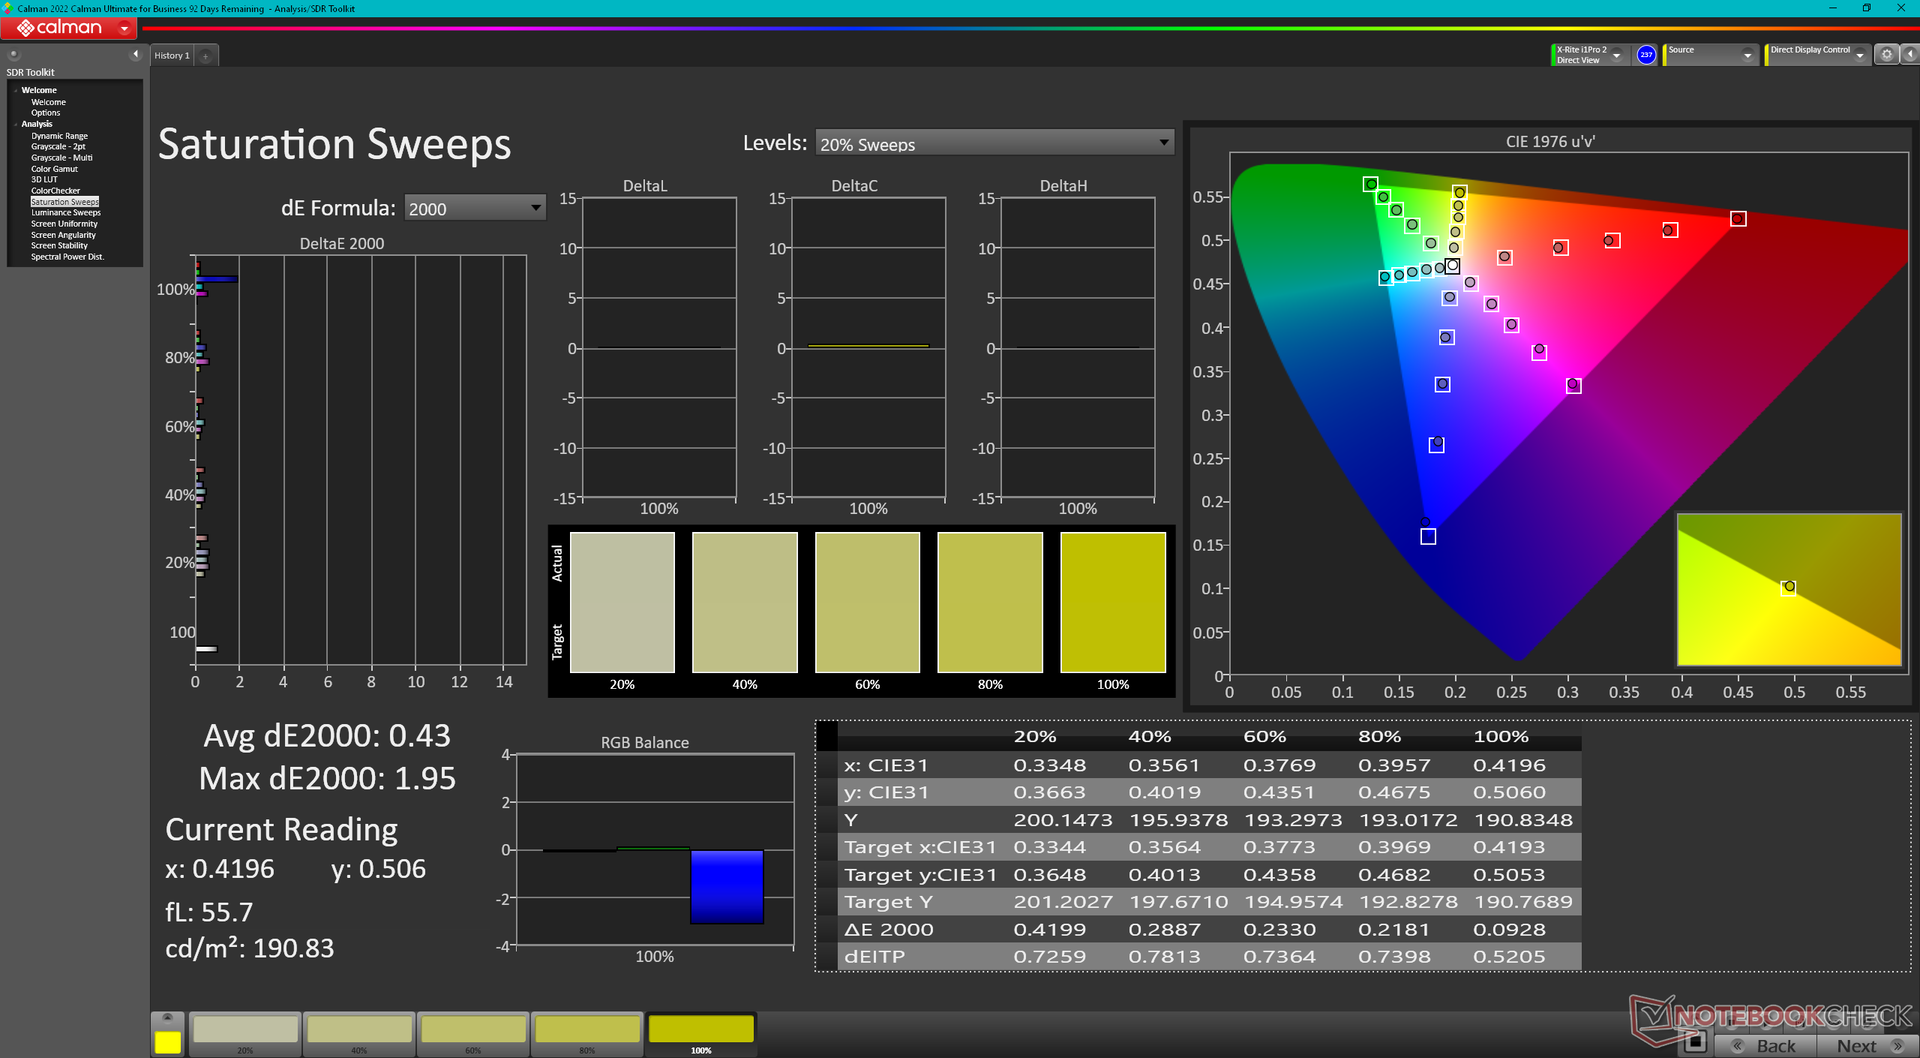
70.4% AdobeRGB 1998 (Argyll 3D)
98.3% sRGB (Argyll 3D)
68.4% Display P3 (Argyll 3D)
Gamma: 2.2
CCT: 6203 K
| HP Dragonfly G4 Chi Mei CMN13C0, IPS, 1920x1280, 13.5" | HP Elite Dragonfly G3 Chi Mei CMN13C0, IPS, 1920x1280, 13.5" | Framework Laptop 13.5 13th Gen Intel BOE CQ NE135FBM-N41, IPS, 2256x1504, 13.5" | Lenovo ThinkPad X13 G3 21CM002UGE M133NW4J R3, IPS LED, 1920x1200, 13.3" | Dell Latitude 9330 AU Optronics B133QAA, IPS, 2560x1600, 13.3" | Apple MacBook Air M2 Entry IPS, 2560x1664, 13.6" | |
|---|---|---|---|---|---|---|
| Display | -1% | 0% | 0% | 9% | 23% | |
| Display P3 Coverage (%) | 68.4 | 68 -1% | 68.9 1% | 69 1% | 77.8 14% | 98.4 44% |
| sRGB Coverage (%) | 98.3 | 98.3 0% | 97.5 -1% | 98.4 0% | 99.9 2% | 99.9 2% |
| AdobeRGB 1998 Coverage (%) | 70.4 | 69.9 -1% | 71.1 1% | 70.3 0% | 77.5 10% | 87.6 24% |
| Response Times | -8% | -10% | 10% | -50% | 27% | |
| Response Time Grey 50% / Grey 80% * (ms) | 48.8 ? | 50.8 ? -4% | 54.9 ? -13% | 44.2 ? 9% | 67.6 ? -39% | 32.9 ? 33% |
| Response Time Black / White * (ms) | 31.3 ? | 35.2 ? -12% | 33.5 ? -7% | 28.1 ? 10% | 50.4 ? -61% | 24.9 ? 20% |
| PWM Frequency (Hz) | ||||||
| Screen | -7% | -36% | 0% | -12% | 11% | |
| Brightness middle (cd/m²) | 408.8 | 387.2 -5% | 503 23% | 348 -15% | 542.3 33% | 526 29% |
| Brightness (cd/m²) | 399 | 360 -10% | 472 18% | 321 -20% | 516 29% | 486 22% |
| Brightness Distribution (%) | 90 | 80 -11% | 87 -3% | 85 -6% | 85 -6% | 87 -3% |
| Black Level * (cd/m²) | 0.32 | 0.26 19% | 0.36 -13% | 0.34 -6% | 0.38 -19% | 0.38 -19% |
| Contrast (:1) | 1278 | 1489 17% | 1397 9% | 1024 -20% | 1427 12% | 1384 8% |
| Colorchecker dE 2000 * | 2.02 | 2.36 -17% | 3.38 -67% | 1.3 36% | 3.18 -57% | 1.3 36% |
| Colorchecker dE 2000 max. * | 3.84 | 4.79 -25% | 7.08 -84% | 2.5 35% | 6.05 -58% | 2.7 30% |
| Colorchecker dE 2000 calibrated * | 0.61 | 0.63 -3% | 1.21 -98% | 1 -64% | 0.67 -10% | 0.7 -15% |
| Greyscale dE 2000 * | 2.3 | 3 -30% | 4.8 -109% | 0.9 61% | 3.1 -35% | 2 13% |
| Gamma | 2.2 100% | 2.17 101% | 2.13 103% | 2.16 102% | 2.08 106% | 2.25 98% |
| CCT | 6203 105% | 6137 106% | 6235 104% | 6431 101% | 6140 106% | 6858 95% |
| Media totale (Programma / Settaggio) | -5% /
-6% | -15% /
-25% | 3% /
2% | -18% /
-13% | 20% /
16% |
* ... Meglio usare valori piccoli
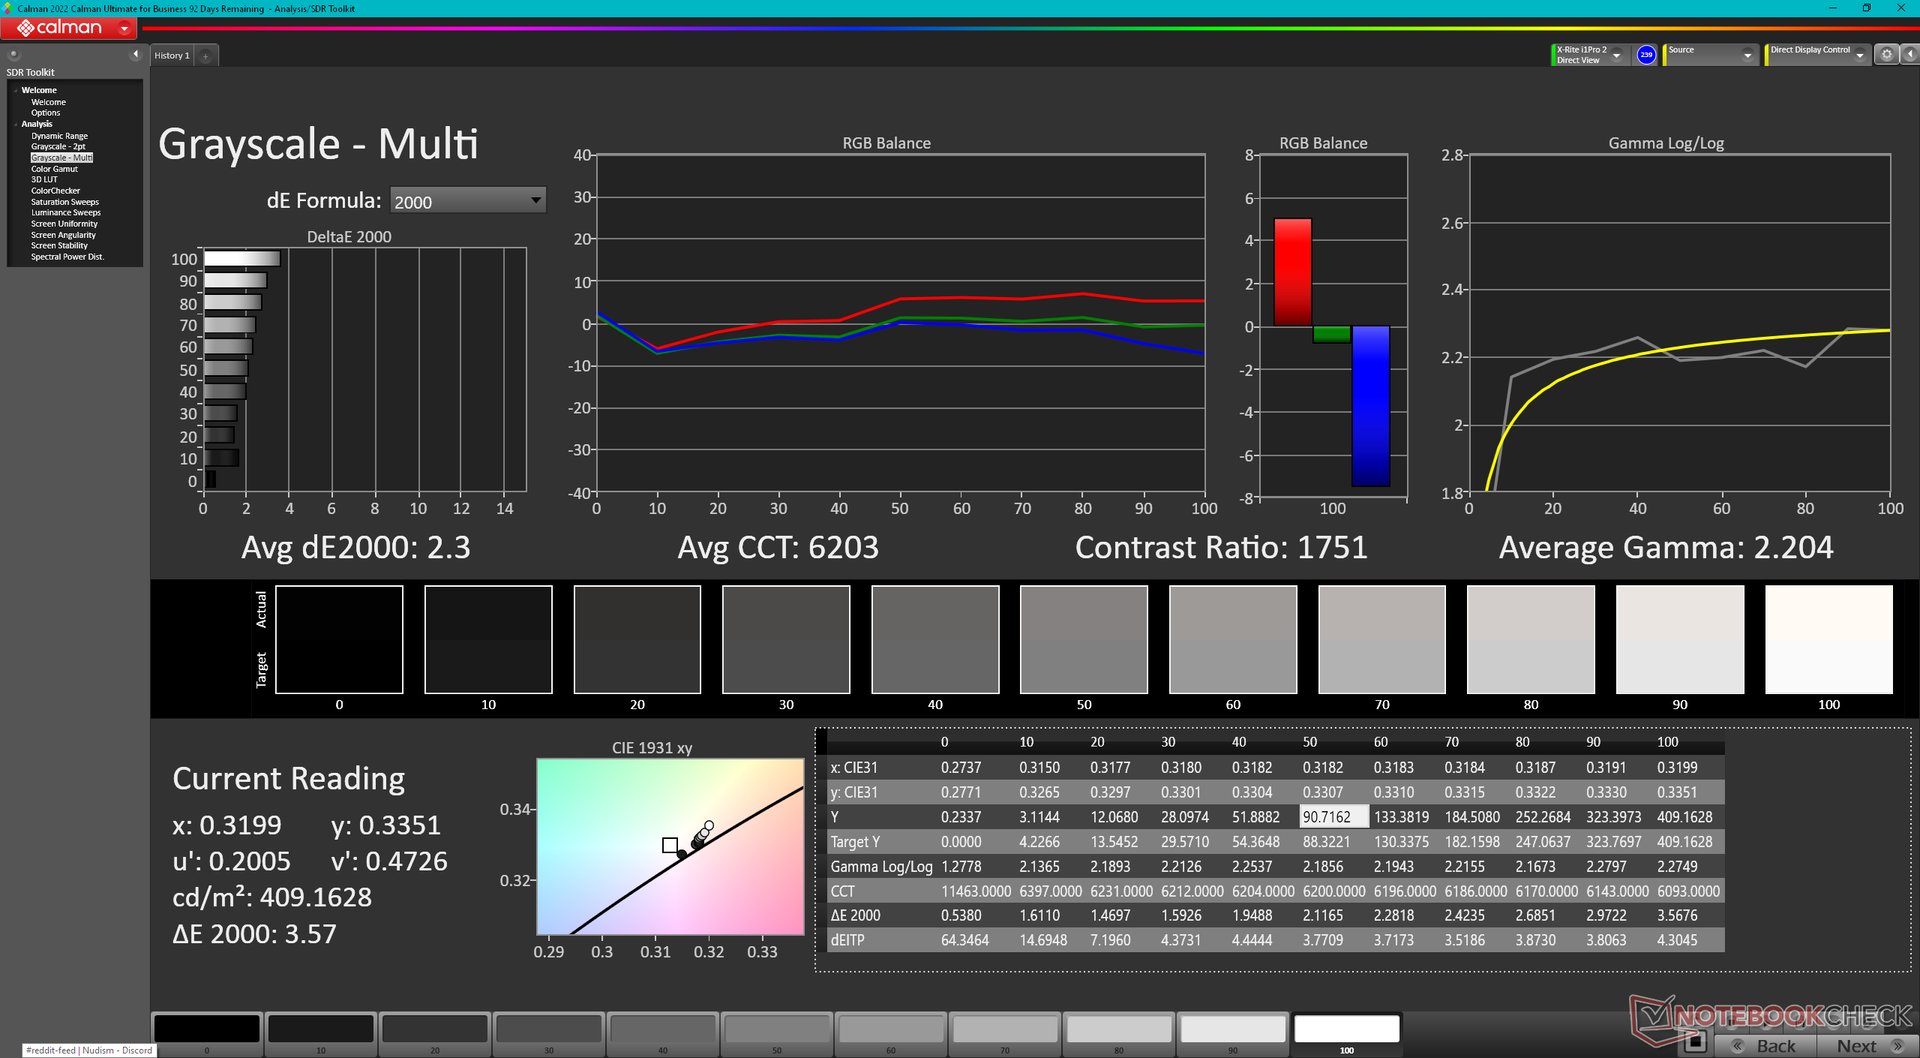
Il display viene fornito ben calibrato, anche se HP non pubblicizza la calibrazione di fabbrica. La calibrazione del pannello con un colorimetro X-Rite migliorerebbe ulteriormente i valori medi deltaE della scala di grigi e del colore, che passerebbero da 2,3 e 2,02 a soli 1,1 e 0,61, rispettivamente. Gli utenti possono scaricare e applicare il nostro profilo ICM calibrato qui sopra.
Tempi di risposta del Display
| ↔ Tempi di risposta dal Nero al Bianco | ||
|---|---|---|
| 31.3 ms ... aumenta ↗ e diminuisce ↘ combinato | ↗ 16.3 ms Incremento | 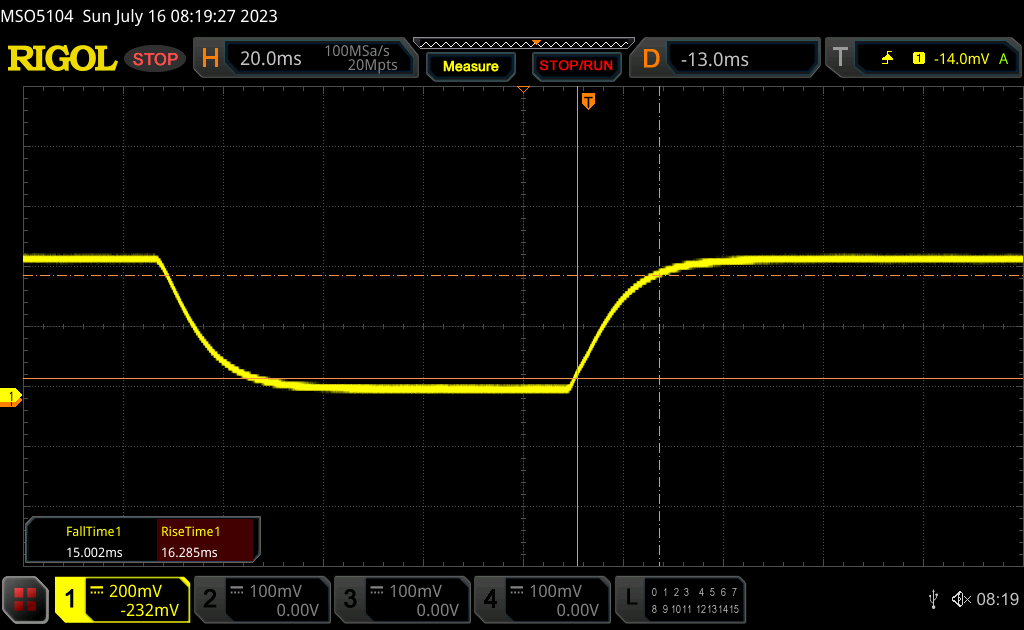 |
| ↘ 15 ms Calo | ||
| Lo schermo mostra tempi di risposta lenti nei nostri tests e sarà insoddisfacente per i gamers. In confronto, tutti i dispositivi di test variano da 0.1 (minimo) a 240 (massimo) ms. » 85 % di tutti i dispositivi è migliore. Questo significa che i tempi di risposta rilevati sono peggiori rispetto alla media di tutti i dispositivi testati (19.8 ms). | ||
| ↔ Tempo di risposta dal 50% Grigio all'80% Grigio | ||
| 48.8 ms ... aumenta ↗ e diminuisce ↘ combinato | ↗ 22.9 ms Incremento | 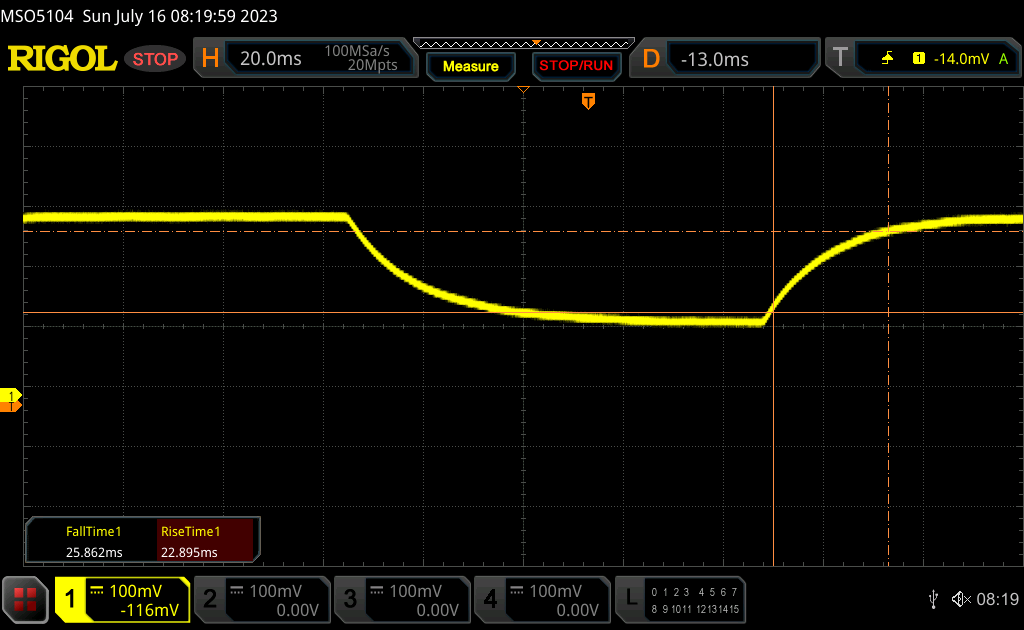 |
| ↘ 25.9 ms Calo | ||
| Lo schermo mostra tempi di risposta lenti nei nostri tests e sarà insoddisfacente per i gamers. In confronto, tutti i dispositivi di test variano da 0.165 (minimo) a 636 (massimo) ms. » 84 % di tutti i dispositivi è migliore. Questo significa che i tempi di risposta rilevati sono peggiori rispetto alla media di tutti i dispositivi testati (31 ms). | ||
Sfarfallio dello schermo / PWM (Pulse-Width Modulation)
| flickering dello schermo / PWM non rilevato | 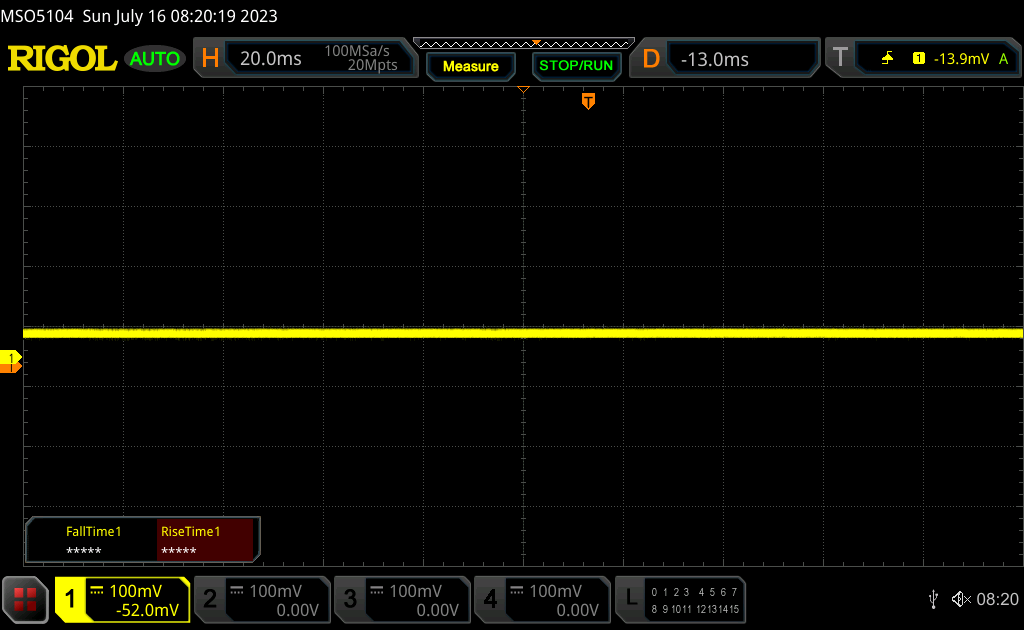 | ||
In confronto: 52 % di tutti i dispositivi testati non utilizza PWM per ridurre la luminosita' del display. Se è rilevato PWM, una media di 7747 (minimo: 5 - massimo: 343500) Hz è stata rilevata. | |||
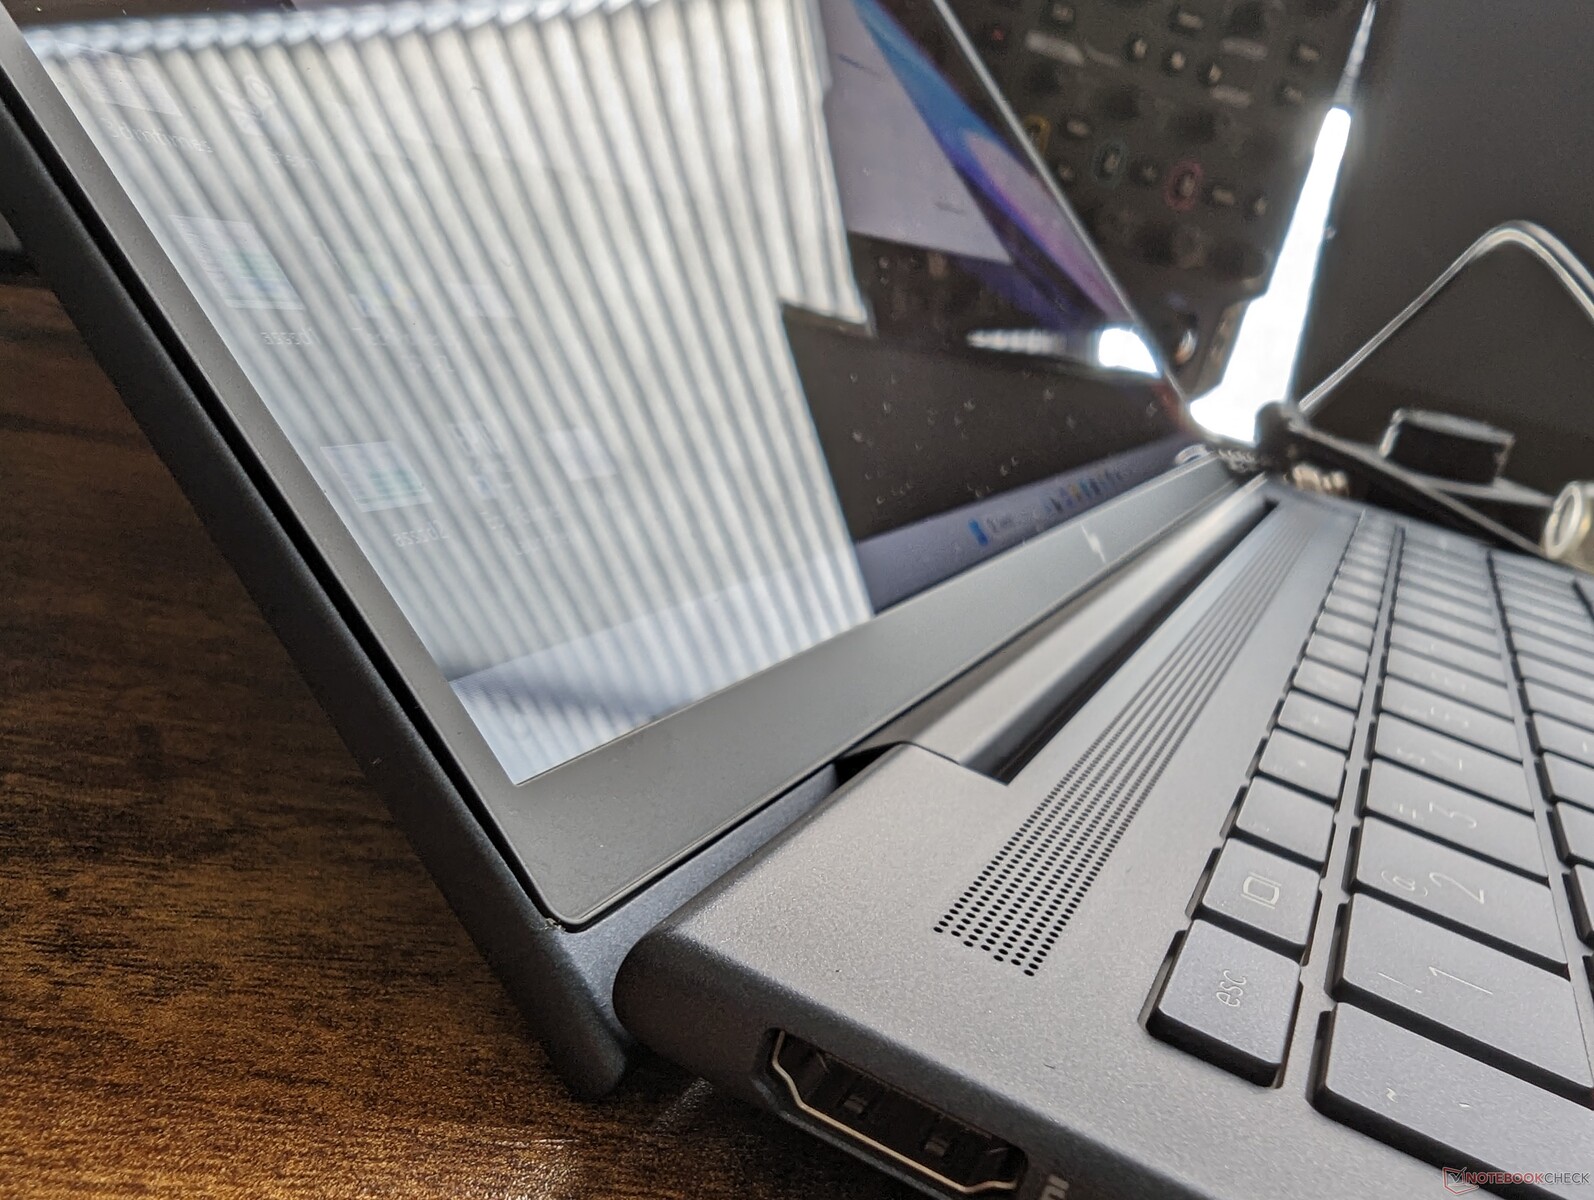
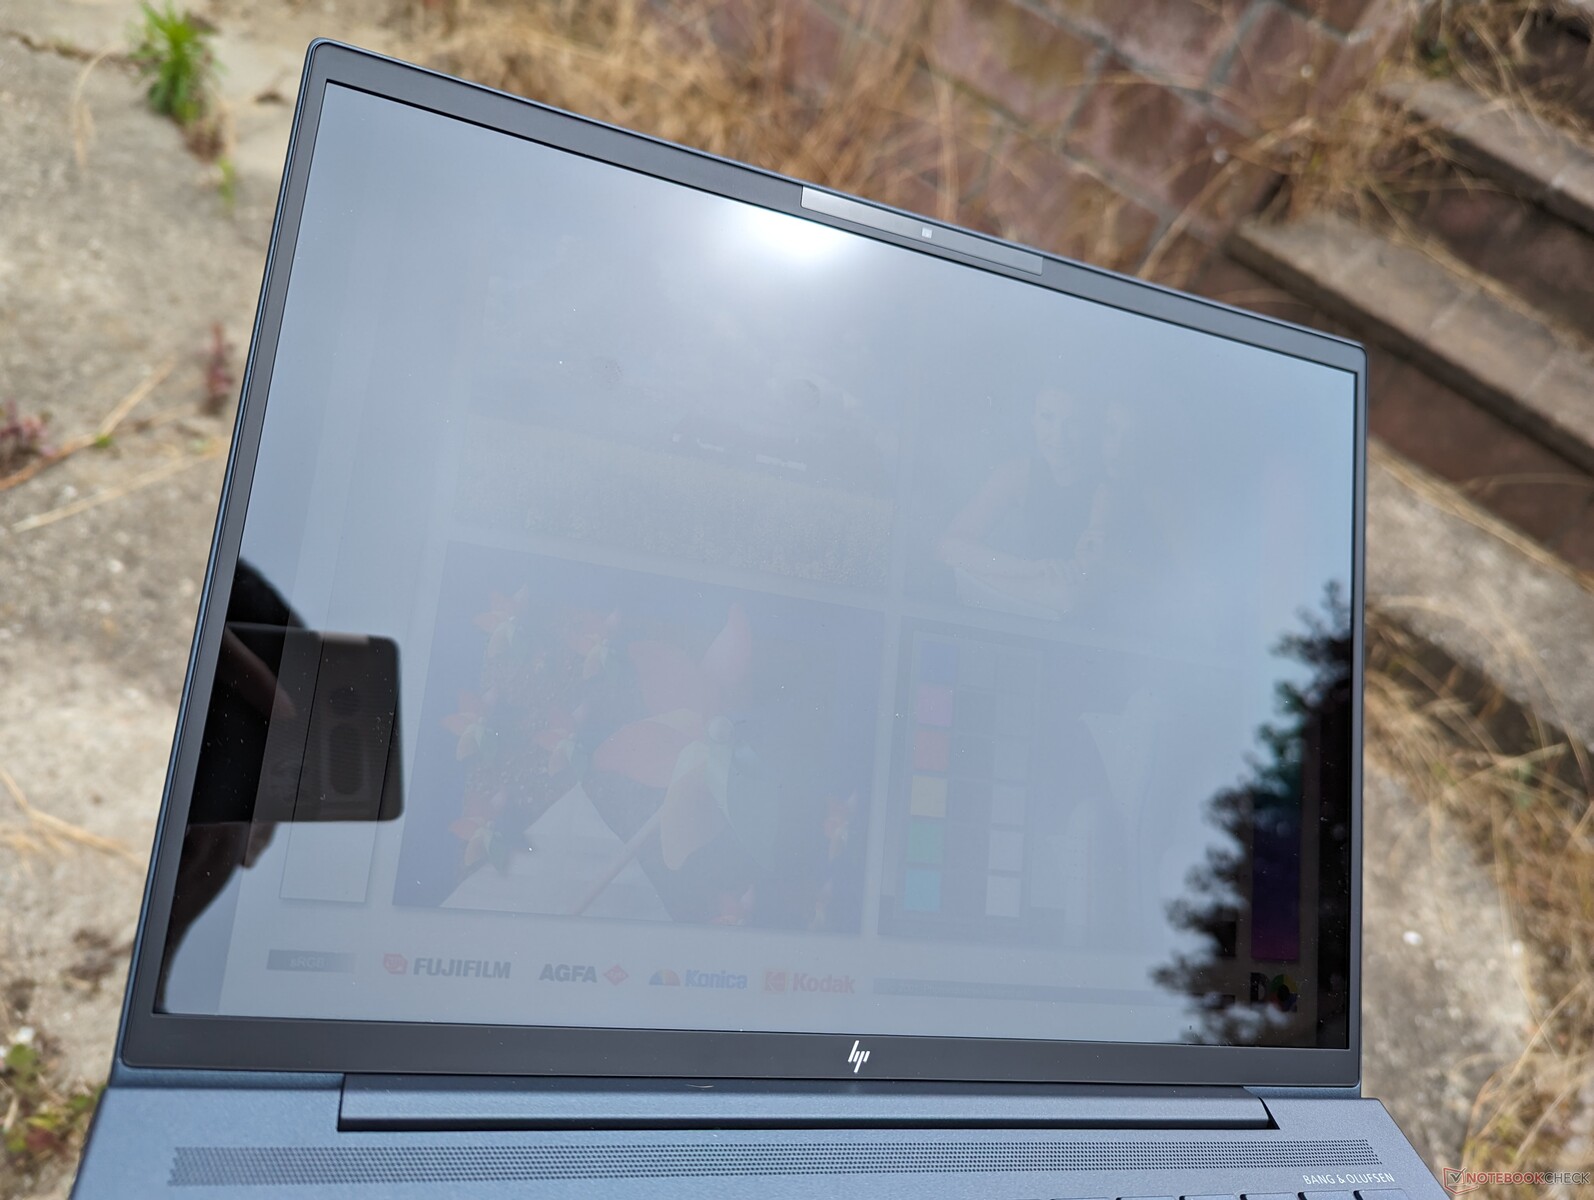
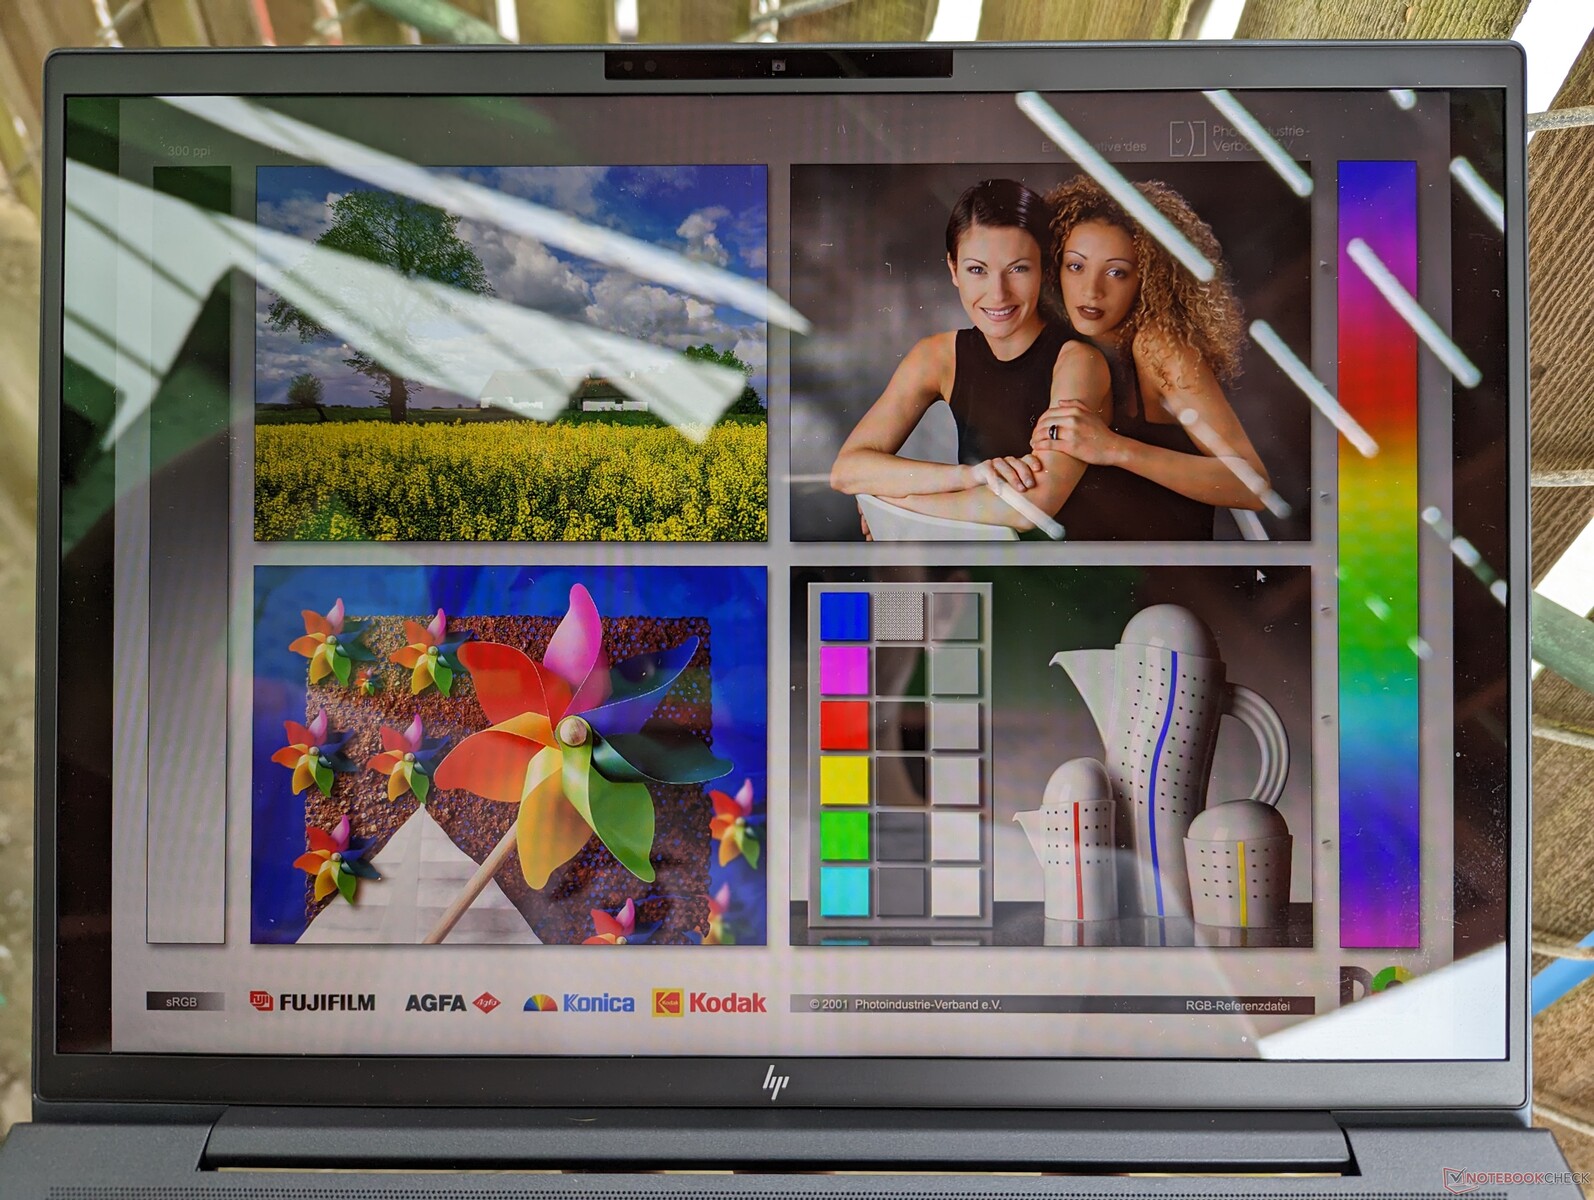
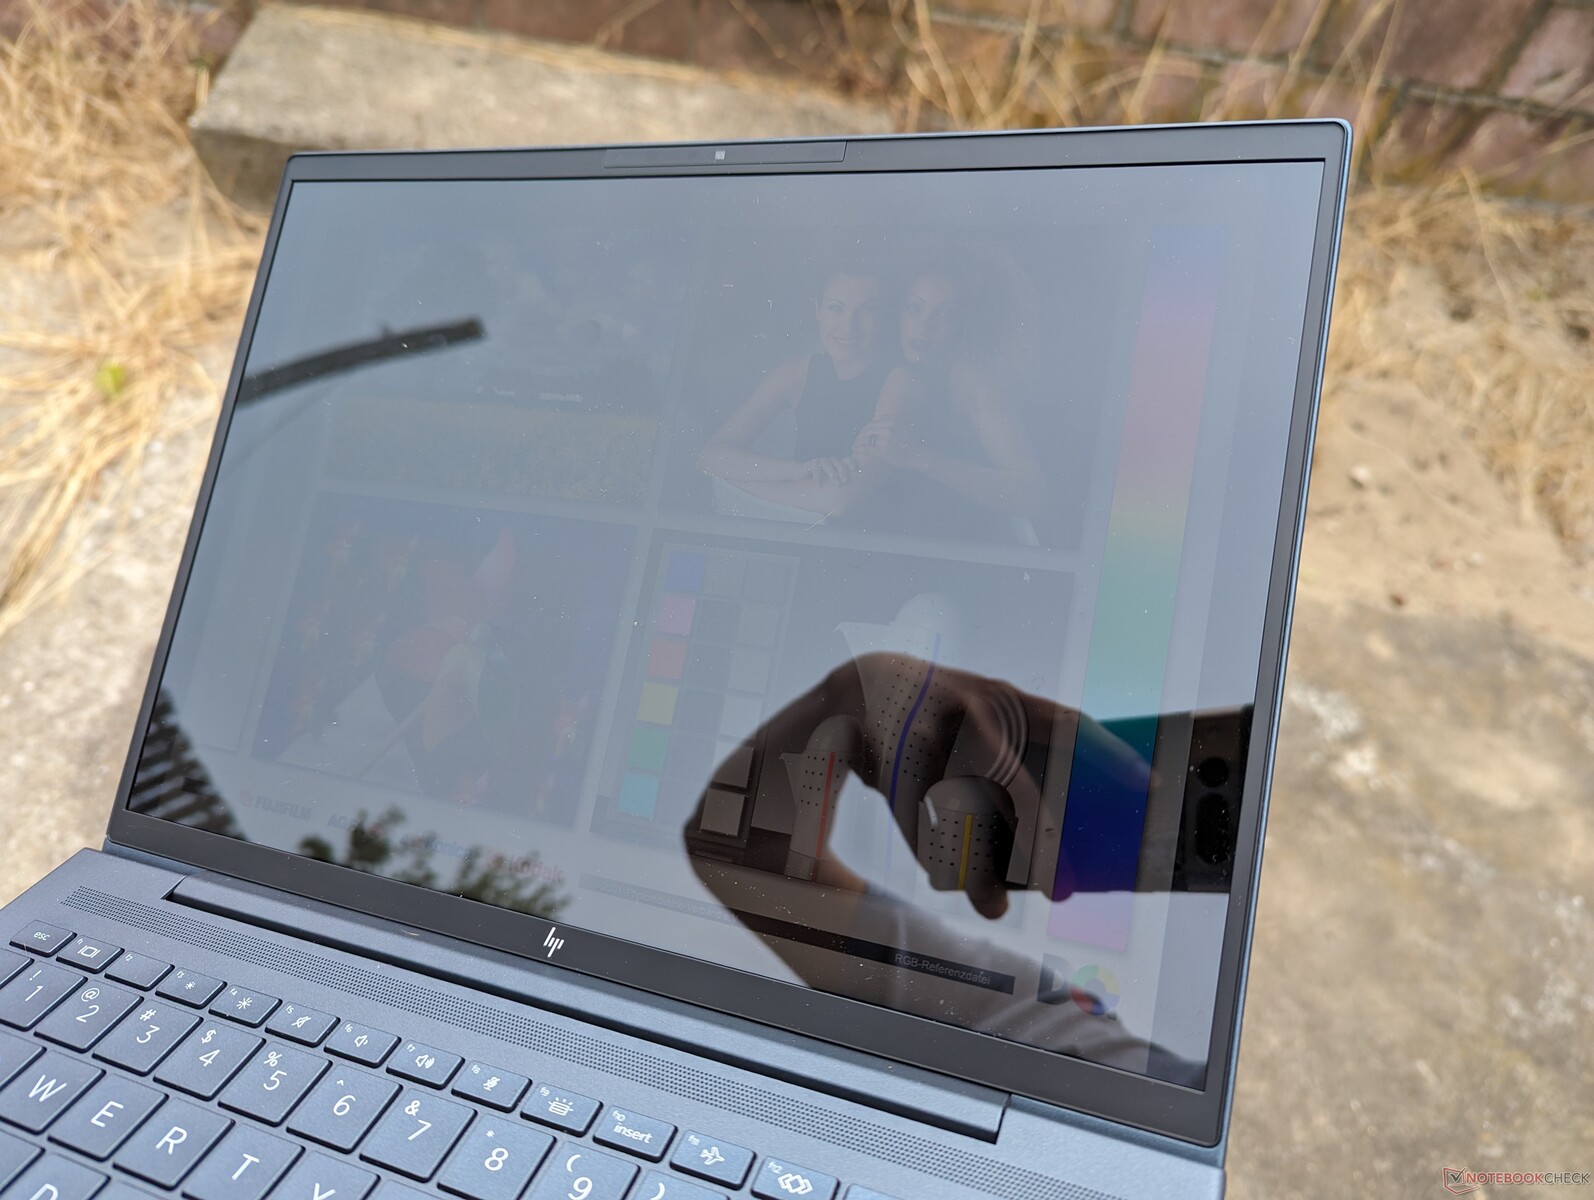
L'overlay super-lucido e il conseguente bagliore ostacolano la visibilità all'aperto. Fortunatamente, HP continua a essere uno degli unici produttori importanti a offrire pannelli a 1000 nit, fino a due volte più luminosi della maggior parte dei subnotebook aziendali.
Prestazioni
Condizioni di test
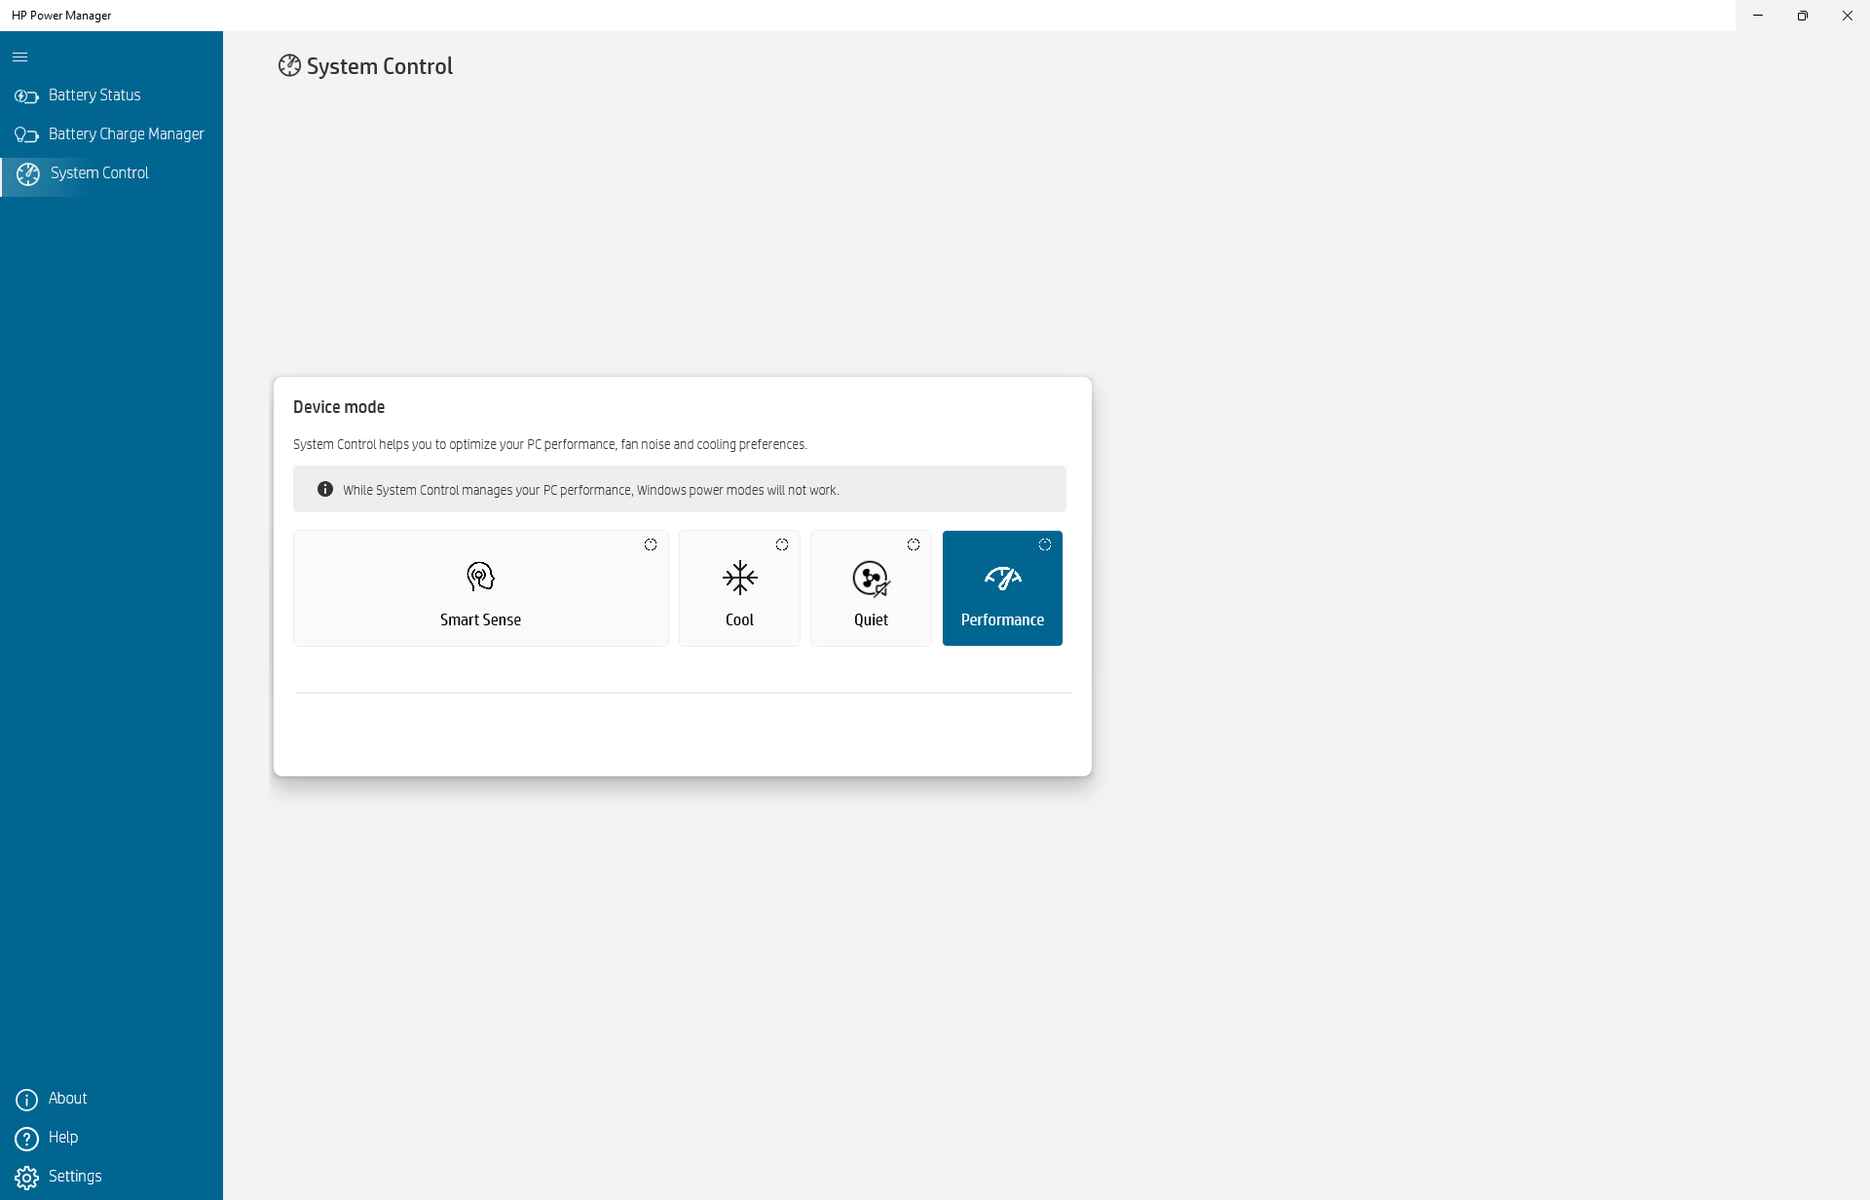
Abbiamo impostato la nostra unità in modalità Performance tramite HP Power Manager prima di eseguire i benchmark qui sotto. Il software Power Manager è una novità di quest'anno per la serie, e dichiara opportunamente che le impostazioni dei profili energetici sovrascrivono i profili energetici predefiniti di Windows, come mostra lo screenshot qui sotto.

Processore
Le prestazioni multi-thread grezze sono fino al 20% più veloci rispetto al Core i7-1265U di 12a generazione Core i7-1265U del Dragonfly G3 dello scorso anno. Una volta che il Turbo Boost si è stabilizzato, tuttavia, il vantaggio prestazionale tra l' i7-1365U e l'i7-1265U si riduce ad appena il 10%, come dimostrano i risultati del test CineBench R15 xT di seguito. La nuova CPU è generalmente considerata un aggiornamento o un rebrand minore delle opzioni Alder Lake-U dello scorso anno.
Le prestazioni complessive sono più lente rispetto alla maggior parte degli altri portatili dotati dello stesso processore Core i7-1365U di circa il 15%. Infatti, ilSamsung Galaxy Book3 15che viene fornito con il più economico Core i5-1335Uè in grado di superare costantemente la nostra unità Core i7 Dragonfly G4 nei carichi di lavoro multi-thread. HP ha l'abitudine di far funzionare le CPU della serie Dragonfly un po' più lentamente rispetto alla concorrenza.
È un peccato che la serie non offra alcuna opzione Core-P, come il Core i7-1370P avrebbe aumentato le prestazioni multi-thread in modo significativo, fino al 75 percento, in base a quanto abbiamo provato con il Framework 13.5.
Cinebench R15 Multi Loop
Cinebench R23: Multi Core | Single Core
Cinebench R20: CPU (Multi Core) | CPU (Single Core)
Cinebench R15: CPU Multi 64Bit | CPU Single 64Bit
Blender: v2.79 BMW27 CPU
7-Zip 18.03: 7z b 4 | 7z b 4 -mmt1
Geekbench 5.5: Multi-Core | Single-Core
HWBOT x265 Benchmark v2.2: 4k Preset
LibreOffice : 20 Documents To PDF
R Benchmark 2.5: Overall mean
| CPU Performance rating | |
| Framework Laptop 13.5 13th Gen Intel | |
| Dell XPS 13 Plus 9320 i7-1280P OLED | |
| Media Intel Core i7-1365U | |
| Asus Zenbook S 13 OLED | |
| HP Dragonfly G4 | |
| Samsung Galaxy Book3 15, Core i5-1335U | |
| Lenovo ThinkBook 13s G3 20YA0005GE | |
| Apple MacBook Air M2 Entry -5! | |
| Dell Latitude 9330 | |
| Lenovo ThinkPad X13 G3 21CM002UGE | |
| HP Elite Dragonfly G3 | |
| Lenovo Yoga 6 13ALC6 -2! | |
| Dell XPS 13 7390 Core i7-10710U -6! | |
| Dell Inspiron 13 7306-6TYH5 | |
| Cinebench R23 / Multi Core | |
| Framework Laptop 13.5 13th Gen Intel | |
| Dell XPS 13 Plus 9320 i7-1280P OLED | |
| Asus Zenbook S 13 OLED | |
| Samsung Galaxy Book3 15, Core i5-1335U | |
| Media Intel Core i7-1365U (7532 - 9576, n=4) | |
| Apple MacBook Air M2 Entry | |
| Lenovo ThinkBook 13s G3 20YA0005GE | |
| Lenovo ThinkPad X13 G3 21CM002UGE | |
| HP Dragonfly G4 | |
| Lenovo Yoga 6 13ALC6 | |
| Dell Latitude 9330 | |
| HP Elite Dragonfly G3 | |
| Dell Inspiron 13 7306-6TYH5 | |
| Cinebench R23 / Single Core | |
| Framework Laptop 13.5 13th Gen Intel | |
| HP Dragonfly G4 | |
| Media Intel Core i7-1365U (1877 - 1891, n=4) | |
| Samsung Galaxy Book3 15, Core i5-1335U | |
| Dell XPS 13 Plus 9320 i7-1280P OLED | |
| Apple MacBook Air M2 Entry | |
| Dell Latitude 9330 | |
| HP Elite Dragonfly G3 | |
| Asus Zenbook S 13 OLED | |
| Dell Inspiron 13 7306-6TYH5 | |
| Lenovo ThinkPad X13 G3 21CM002UGE | |
| Lenovo ThinkBook 13s G3 20YA0005GE | |
| Lenovo Yoga 6 13ALC6 | |
| Cinebench R20 / CPU (Multi Core) | |
| Framework Laptop 13.5 13th Gen Intel | |
| Dell XPS 13 Plus 9320 i7-1280P OLED | |
| Asus Zenbook S 13 OLED | |
| Samsung Galaxy Book3 15, Core i5-1335U | |
| Media Intel Core i7-1365U (2902 - 3669, n=4) | |
| Lenovo ThinkPad X13 G3 21CM002UGE | |
| Lenovo ThinkBook 13s G3 20YA0005GE | |
| Lenovo Yoga 6 13ALC6 | |
| HP Dragonfly G4 | |
| Dell Latitude 9330 | |
| Dell XPS 13 7390 Core i7-10710U | |
| HP Elite Dragonfly G3 | |
| Apple MacBook Air M2 Entry | |
| Dell Inspiron 13 7306-6TYH5 | |
| Cinebench R20 / CPU (Single Core) | |
| Framework Laptop 13.5 13th Gen Intel | |
| Media Intel Core i7-1365U (703 - 741, n=4) | |
| HP Dragonfly G4 | |
| Samsung Galaxy Book3 15, Core i5-1335U | |
| Dell XPS 13 Plus 9320 i7-1280P OLED | |
| Dell Latitude 9330 | |
| HP Elite Dragonfly G3 | |
| Dell Inspiron 13 7306-6TYH5 | |
| Asus Zenbook S 13 OLED | |
| Lenovo ThinkBook 13s G3 20YA0005GE | |
| Lenovo ThinkPad X13 G3 21CM002UGE | |
| Lenovo Yoga 6 13ALC6 | |
| Dell XPS 13 7390 Core i7-10710U | |
| Apple MacBook Air M2 Entry | |
| Cinebench R15 / CPU Multi 64Bit | |
| Framework Laptop 13.5 13th Gen Intel | |
| Lenovo ThinkBook 13s G3 20YA0005GE | |
| Lenovo ThinkBook 13s G3 20YA0005GE | |
| Dell XPS 13 Plus 9320 i7-1280P OLED | |
| Asus Zenbook S 13 OLED | |
| Samsung Galaxy Book3 15, Core i5-1335U | |
| Media Intel Core i7-1365U (1348 - 1604, n=4) | |
| HP Dragonfly G4 | |
| Lenovo ThinkPad X13 G3 21CM002UGE | |
| Apple MacBook Air M2 Entry | |
| HP Elite Dragonfly G3 | |
| Lenovo Yoga 6 13ALC6 | |
| Dell Latitude 9330 | |
| Dell XPS 13 7390 Core i7-10710U | |
| Dell Inspiron 13 7306-6TYH5 | |
| Dell Inspiron 13 7306-6TYH5 | |
| Cinebench R15 / CPU Single 64Bit | |
| Framework Laptop 13.5 13th Gen Intel | |
| Media Intel Core i7-1365U (261 - 268, n=4) | |
| HP Dragonfly G4 | |
| Samsung Galaxy Book3 15, Core i5-1335U | |
| Asus Zenbook S 13 OLED | |
| Lenovo ThinkPad X13 G3 21CM002UGE | |
| Lenovo ThinkBook 13s G3 20YA0005GE | |
| Dell XPS 13 Plus 9320 i7-1280P OLED | |
| Dell Inspiron 13 7306-6TYH5 | |
| Dell Inspiron 13 7306-6TYH5 | |
| HP Elite Dragonfly G3 | |
| Apple MacBook Air M2 Entry | |
| Dell Latitude 9330 | |
| Lenovo Yoga 6 13ALC6 | |
| Dell XPS 13 7390 Core i7-10710U | |
| 7-Zip 18.03 / 7z b 4 | |
| Framework Laptop 13.5 13th Gen Intel | |
| Dell XPS 13 Plus 9320 i7-1280P OLED | |
| Asus Zenbook S 13 OLED | |
| Lenovo ThinkBook 13s G3 20YA0005GE | |
| Lenovo Yoga 6 13ALC6 | |
| Samsung Galaxy Book3 15, Core i5-1335U | |
| Media Intel Core i7-1365U (33476 - 40424, n=4) | |
| Lenovo ThinkPad X13 G3 21CM002UGE | |
| HP Dragonfly G4 | |
| Dell Latitude 9330 | |
| HP Elite Dragonfly G3 | |
| Dell XPS 13 7390 Core i7-10710U | |
| Dell Inspiron 13 7306-6TYH5 | |
| 7-Zip 18.03 / 7z b 4 -mmt1 | |
| Framework Laptop 13.5 13th Gen Intel | |
| Media Intel Core i7-1365U (5722 - 5941, n=4) | |
| HP Dragonfly G4 | |
| Asus Zenbook S 13 OLED | |
| Lenovo ThinkBook 13s G3 20YA0005GE | |
| Samsung Galaxy Book3 15, Core i5-1335U | |
| Lenovo ThinkPad X13 G3 21CM002UGE | |
| Dell Inspiron 13 7306-6TYH5 | |
| Dell XPS 13 Plus 9320 i7-1280P OLED | |
| HP Elite Dragonfly G3 | |
| Dell Latitude 9330 | |
| Lenovo Yoga 6 13ALC6 | |
| Dell XPS 13 7390 Core i7-10710U | |
| Geekbench 5.5 / Multi-Core | |
| Framework Laptop 13.5 13th Gen Intel | |
| Dell XPS 13 Plus 9320 i7-1280P OLED | |
| Apple MacBook Air M2 Entry | |
| HP Dragonfly G4 | |
| Media Intel Core i7-1365U (8272 - 8778, n=4) | |
| HP Elite Dragonfly G3 | |
| Samsung Galaxy Book3 15, Core i5-1335U | |
| Asus Zenbook S 13 OLED | |
| Dell Latitude 9330 | |
| Lenovo ThinkBook 13s G3 20YA0005GE | |
| Lenovo ThinkPad X13 G3 21CM002UGE | |
| Dell Inspiron 13 7306-6TYH5 | |
| Geekbench 5.5 / Single-Core | |
| Framework Laptop 13.5 13th Gen Intel | |
| Apple MacBook Air M2 Entry | |
| HP Dragonfly G4 | |
| Media Intel Core i7-1365U (1841 - 1938, n=4) | |
| Dell XPS 13 Plus 9320 i7-1280P OLED | |
| Samsung Galaxy Book3 15, Core i5-1335U | |
| Dell Latitude 9330 | |
| Dell Inspiron 13 7306-6TYH5 | |
| HP Elite Dragonfly G3 | |
| Asus Zenbook S 13 OLED | |
| Lenovo ThinkBook 13s G3 20YA0005GE | |
| Lenovo ThinkPad X13 G3 21CM002UGE | |
| HWBOT x265 Benchmark v2.2 / 4k Preset | |
| Framework Laptop 13.5 13th Gen Intel | |
| Dell XPS 13 Plus 9320 i7-1280P OLED | |
| Asus Zenbook S 13 OLED | |
| Samsung Galaxy Book3 15, Core i5-1335U | |
| Lenovo ThinkBook 13s G3 20YA0005GE | |
| Media Intel Core i7-1365U (8.61 - 10.3, n=4) | |
| Lenovo ThinkPad X13 G3 21CM002UGE | |
| Lenovo Yoga 6 13ALC6 | |
| HP Dragonfly G4 | |
| Dell Latitude 9330 | |
| HP Elite Dragonfly G3 | |
| Dell XPS 13 7390 Core i7-10710U | |
| Dell Inspiron 13 7306-6TYH5 | |
| LibreOffice / 20 Documents To PDF | |
| Lenovo ThinkPad X13 G3 21CM002UGE | |
| Lenovo Yoga 6 13ALC6 | |
| HP Elite Dragonfly G3 | |
| Asus Zenbook S 13 OLED | |
| Dell Latitude 9330 | |
| Lenovo ThinkBook 13s G3 20YA0005GE | |
| Dell XPS 13 Plus 9320 i7-1280P OLED | |
| Samsung Galaxy Book3 15, Core i5-1335U | |
| Dell Inspiron 13 7306-6TYH5 | |
| HP Dragonfly G4 | |
| Media Intel Core i7-1365U (42.2 - 47.5, n=4) | |
| Framework Laptop 13.5 13th Gen Intel | |
| R Benchmark 2.5 / Overall mean | |
| Lenovo ThinkPad X13 G3 21CM002UGE | |
| Lenovo Yoga 6 13ALC6 | |
| Dell Inspiron 13 7306-6TYH5 | |
| Lenovo ThinkBook 13s G3 20YA0005GE | |
| HP Elite Dragonfly G3 | |
| Dell Latitude 9330 | |
| Asus Zenbook S 13 OLED | |
| Samsung Galaxy Book3 15, Core i5-1335U | |
| Dell XPS 13 Plus 9320 i7-1280P OLED | |
| HP Dragonfly G4 | |
| Media Intel Core i7-1365U (0.4504 - 0.4586, n=4) | |
| Framework Laptop 13.5 13th Gen Intel | |
Cinebench R23: Multi Core | Single Core
Cinebench R20: CPU (Multi Core) | CPU (Single Core)
Cinebench R15: CPU Multi 64Bit | CPU Single 64Bit
Blender: v2.79 BMW27 CPU
7-Zip 18.03: 7z b 4 | 7z b 4 -mmt1
Geekbench 5.5: Multi-Core | Single-Core
HWBOT x265 Benchmark v2.2: 4k Preset
LibreOffice : 20 Documents To PDF
R Benchmark 2.5: Overall mean
* ... Meglio usare valori piccoli
AIDA64: FP32 Ray-Trace | FPU Julia | CPU SHA3 | CPU Queen | FPU SinJulia | FPU Mandel | CPU AES | CPU ZLib | FP64 Ray-Trace | CPU PhotoWorxx
| Performance rating | |
| Framework Laptop 13.5 13th Gen Intel | |
| Lenovo ThinkPad X13 G3 21CM002UGE | |
| Media Intel Core i7-1365U | |
| HP Dragonfly G4 | |
| Dell Latitude 9330 | |
| HP Elite Dragonfly G3 | |
| AIDA64 / FP32 Ray-Trace | |
| Framework Laptop 13.5 13th Gen Intel | |
| Lenovo ThinkPad X13 G3 21CM002UGE | |
| Media Intel Core i7-1365U (6720 - 8270, n=4) | |
| HP Dragonfly G4 | |
| Dell Latitude 9330 | |
| HP Elite Dragonfly G3 | |
| AIDA64 / FPU Julia | |
| Framework Laptop 13.5 13th Gen Intel | |
| Lenovo ThinkPad X13 G3 21CM002UGE | |
| Media Intel Core i7-1365U (33777 - 41487, n=4) | |
| Dell Latitude 9330 | |
| HP Dragonfly G4 | |
| HP Elite Dragonfly G3 | |
| AIDA64 / CPU SHA3 | |
| Framework Laptop 13.5 13th Gen Intel | |
| Media Intel Core i7-1365U (1754 - 2216, n=4) | |
| Lenovo ThinkPad X13 G3 21CM002UGE | |
| Dell Latitude 9330 | |
| HP Dragonfly G4 | |
| HP Elite Dragonfly G3 | |
| AIDA64 / CPU Queen | |
| Framework Laptop 13.5 13th Gen Intel | |
| HP Dragonfly G4 | |
| Lenovo ThinkPad X13 G3 21CM002UGE | |
| Media Intel Core i7-1365U (67557 - 69991, n=4) | |
| HP Elite Dragonfly G3 | |
| Dell Latitude 9330 | |
| AIDA64 / FPU SinJulia | |
| Framework Laptop 13.5 13th Gen Intel | |
| Lenovo ThinkPad X13 G3 21CM002UGE | |
| Media Intel Core i7-1365U (4589 - 5145, n=4) | |
| HP Dragonfly G4 | |
| HP Elite Dragonfly G3 | |
| Dell Latitude 9330 | |
| AIDA64 / FPU Mandel | |
| Lenovo ThinkPad X13 G3 21CM002UGE | |
| Framework Laptop 13.5 13th Gen Intel | |
| Media Intel Core i7-1365U (16808 - 20668, n=4) | |
| Dell Latitude 9330 | |
| HP Dragonfly G4 | |
| HP Elite Dragonfly G3 | |
| AIDA64 / CPU AES | |
| Framework Laptop 13.5 13th Gen Intel | |
| Media Intel Core i7-1365U (34968 - 41413, n=4) | |
| Lenovo ThinkPad X13 G3 21CM002UGE | |
| HP Dragonfly G4 | |
| Dell Latitude 9330 | |
| HP Elite Dragonfly G3 | |
| AIDA64 / CPU ZLib | |
| Framework Laptop 13.5 13th Gen Intel | |
| Media Intel Core i7-1365U (519 - 650, n=4) | |
| HP Dragonfly G4 | |
| Dell Latitude 9330 | |
| Lenovo ThinkPad X13 G3 21CM002UGE | |
| HP Elite Dragonfly G3 | |
| AIDA64 / FP64 Ray-Trace | |
| Framework Laptop 13.5 13th Gen Intel | |
| Lenovo ThinkPad X13 G3 21CM002UGE | |
| Media Intel Core i7-1365U (3513 - 4367, n=4) | |
| Dell Latitude 9330 | |
| HP Dragonfly G4 | |
| HP Elite Dragonfly G3 | |
| AIDA64 / CPU PhotoWorxx | |
| Media Intel Core i7-1365U (37846 - 43780, n=4) | |
| HP Elite Dragonfly G3 | |
| HP Dragonfly G4 | |
| Dell Latitude 9330 | |
| Framework Laptop 13.5 13th Gen Intel | |
| Lenovo ThinkPad X13 G3 21CM002UGE | |
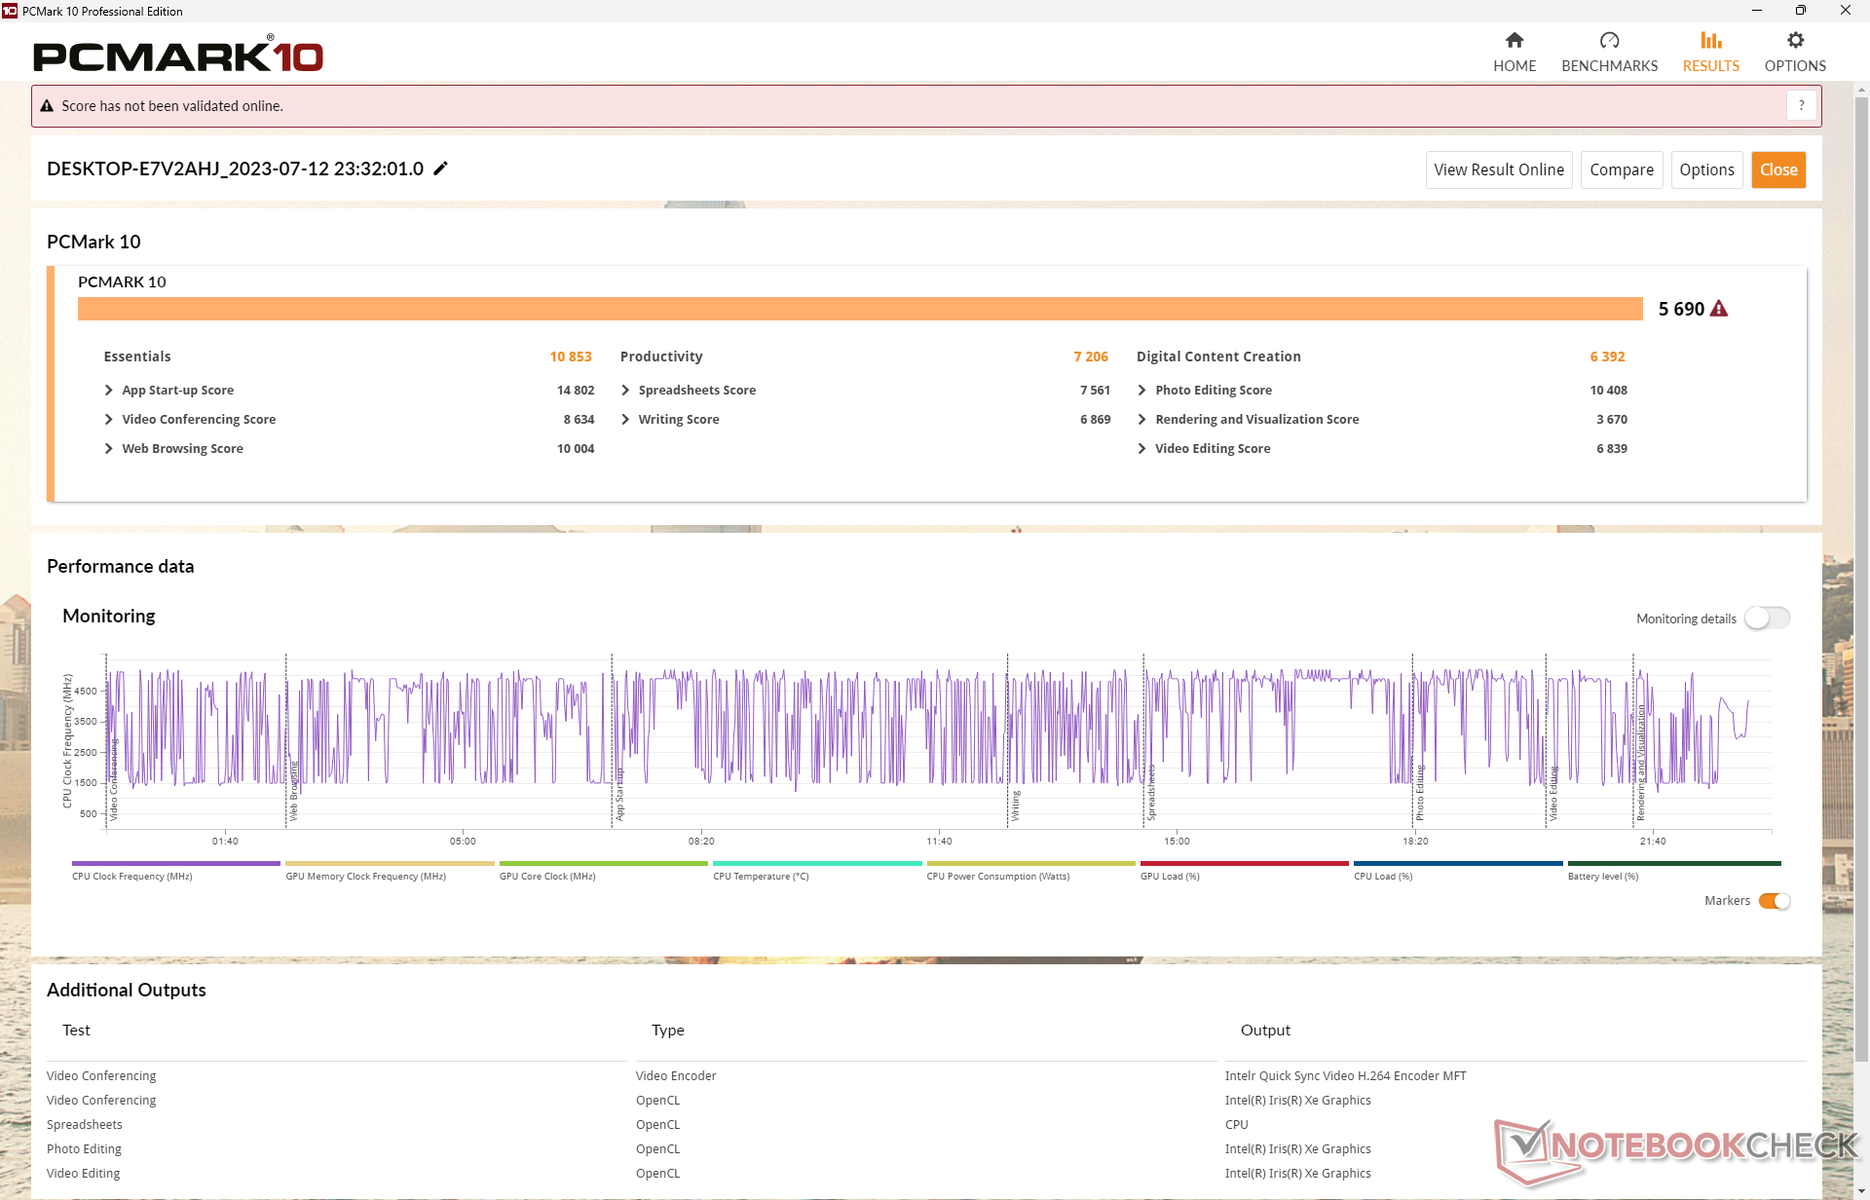
Prestazioni del sistema
I punteggi di PCMark sono costantemente superiori a quelli del modello dello scorso anno, pur essendo appena inferiori a quelli del Framework 13.5 e della sua CPU Core-P più veloce. I risultati sono paragonabili a quelli delDell Latitude 9440 2-in-1 che monta la stessa CPU Core i7-1365U.
CrossMark: Overall | Productivity | Creativity | Responsiveness
| PCMark 10 / Score | |
| Framework Laptop 13.5 13th Gen Intel | |
| Media Intel Core i7-1365U, Intel Iris Xe Graphics G7 96EUs (5690 - 5980, n=4) | |
| HP Dragonfly G4 | |
| Lenovo ThinkPad X13 G3 21CM002UGE | |
| Dell Latitude 9330 | |
| HP Elite Dragonfly G3 | |
| PCMark 10 / Essentials | |
| Framework Laptop 13.5 13th Gen Intel | |
| Media Intel Core i7-1365U, Intel Iris Xe Graphics G7 96EUs (10635 - 11827, n=4) | |
| HP Dragonfly G4 | |
| Dell Latitude 9330 | |
| Lenovo ThinkPad X13 G3 21CM002UGE | |
| HP Elite Dragonfly G3 | |
| PCMark 10 / Productivity | |
| Lenovo ThinkPad X13 G3 21CM002UGE | |
| Framework Laptop 13.5 13th Gen Intel | |
| Media Intel Core i7-1365U, Intel Iris Xe Graphics G7 96EUs (7206 - 7708, n=4) | |
| HP Dragonfly G4 | |
| Dell Latitude 9330 | |
| HP Elite Dragonfly G3 | |
| PCMark 10 / Digital Content Creation | |
| Framework Laptop 13.5 13th Gen Intel | |
| Media Intel Core i7-1365U, Intel Iris Xe Graphics G7 96EUs (6392 - 6735, n=4) | |
| HP Dragonfly G4 | |
| Lenovo ThinkPad X13 G3 21CM002UGE | |
| HP Elite Dragonfly G3 | |
| Dell Latitude 9330 | |
| CrossMark / Overall | |
| Framework Laptop 13.5 13th Gen Intel | |
| Media Intel Core i7-1365U, Intel Iris Xe Graphics G7 96EUs (1605 - 1675, n=4) | |
| HP Dragonfly G4 | |
| Apple MacBook Air M2 Entry | |
| HP Elite Dragonfly G3 | |
| Lenovo ThinkPad X13 G3 21CM002UGE | |
| CrossMark / Productivity | |
| Framework Laptop 13.5 13th Gen Intel | |
| HP Dragonfly G4 | |
| Media Intel Core i7-1365U, Intel Iris Xe Graphics G7 96EUs (1582 - 1650, n=4) | |
| HP Elite Dragonfly G3 | |
| Apple MacBook Air M2 Entry | |
| Lenovo ThinkPad X13 G3 21CM002UGE | |
| CrossMark / Creativity | |
| Framework Laptop 13.5 13th Gen Intel | |
| Apple MacBook Air M2 Entry | |
| Media Intel Core i7-1365U, Intel Iris Xe Graphics G7 96EUs (1713 - 1797, n=4) | |
| HP Dragonfly G4 | |
| HP Elite Dragonfly G3 | |
| Lenovo ThinkPad X13 G3 21CM002UGE | |
| CrossMark / Responsiveness | |
| Framework Laptop 13.5 13th Gen Intel | |
| Media Intel Core i7-1365U, Intel Iris Xe Graphics G7 96EUs (1373 - 1427, n=4) | |
| HP Dragonfly G4 | |
| HP Elite Dragonfly G3 | |
| Lenovo ThinkPad X13 G3 21CM002UGE | |
| Apple MacBook Air M2 Entry | |
| PCMark 10 Score | 5690 punti | |
Aiuto | ||
| AIDA64 / Memory Copy | |
| Dell Latitude 9330 | |
| HP Elite Dragonfly G3 | |
| Media Intel Core i7-1365U (57654 - 69736, n=4) | |
| HP Dragonfly G4 | |
| Lenovo ThinkPad X13 G3 21CM002UGE | |
| Framework Laptop 13.5 13th Gen Intel | |
| AIDA64 / Memory Read | |
| HP Elite Dragonfly G3 | |
| Dell Latitude 9330 | |
| Media Intel Core i7-1365U (49203 - 54068, n=4) | |
| Framework Laptop 13.5 13th Gen Intel | |
| HP Dragonfly G4 | |
| Lenovo ThinkPad X13 G3 21CM002UGE | |
| AIDA64 / Memory Write | |
| Media Intel Core i7-1365U (70434 - 85570, n=4) | |
| HP Dragonfly G4 | |
| Dell Latitude 9330 | |
| HP Elite Dragonfly G3 | |
| Lenovo ThinkPad X13 G3 21CM002UGE | |
| Framework Laptop 13.5 13th Gen Intel | |
| AIDA64 / Memory Latency | |
| Lenovo ThinkPad X13 G3 21CM002UGE | |
| Dell Latitude 9330 | |
| HP Elite Dragonfly G3 | |
| Media Intel Core i7-1365U (90.2 - 102.2, n=4) | |
| HP Dragonfly G4 | |
| Framework Laptop 13.5 13th Gen Intel | |
* ... Meglio usare valori piccoli
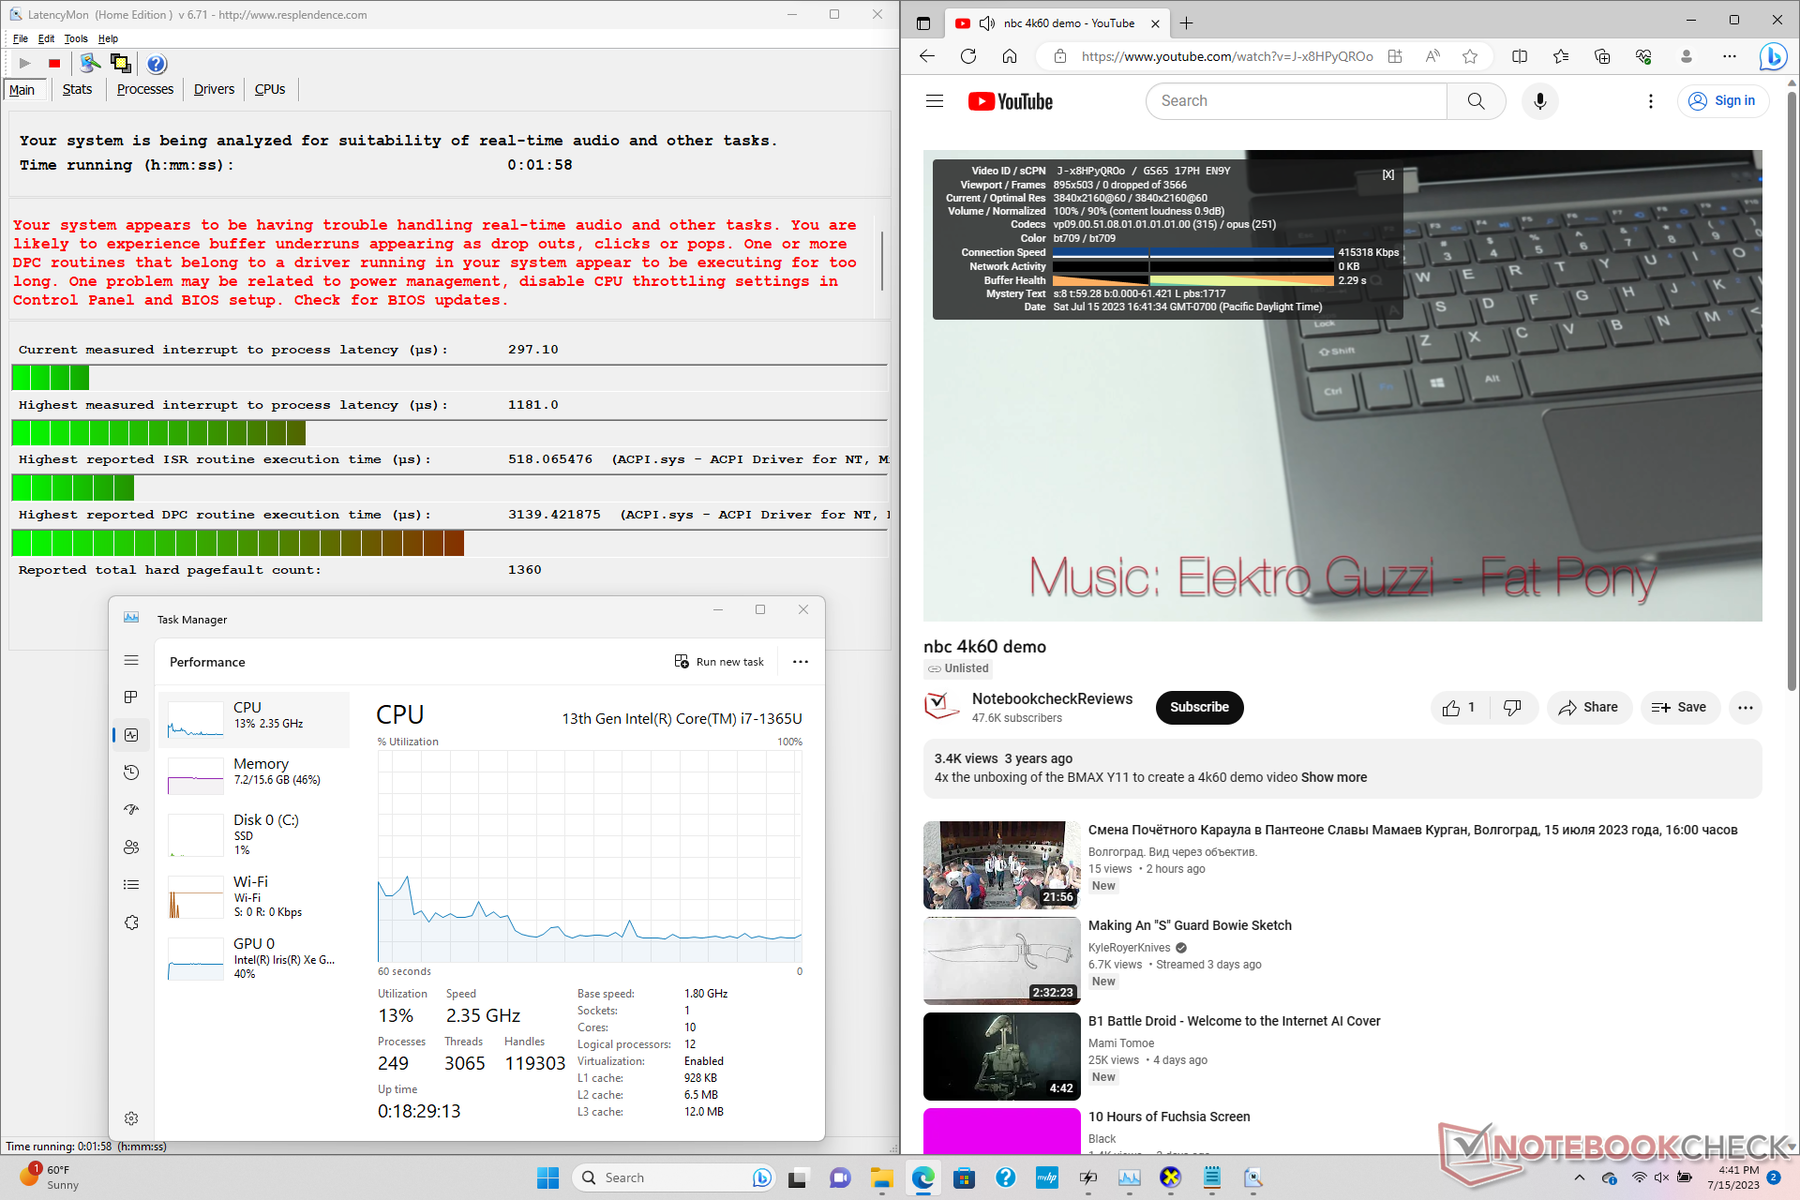
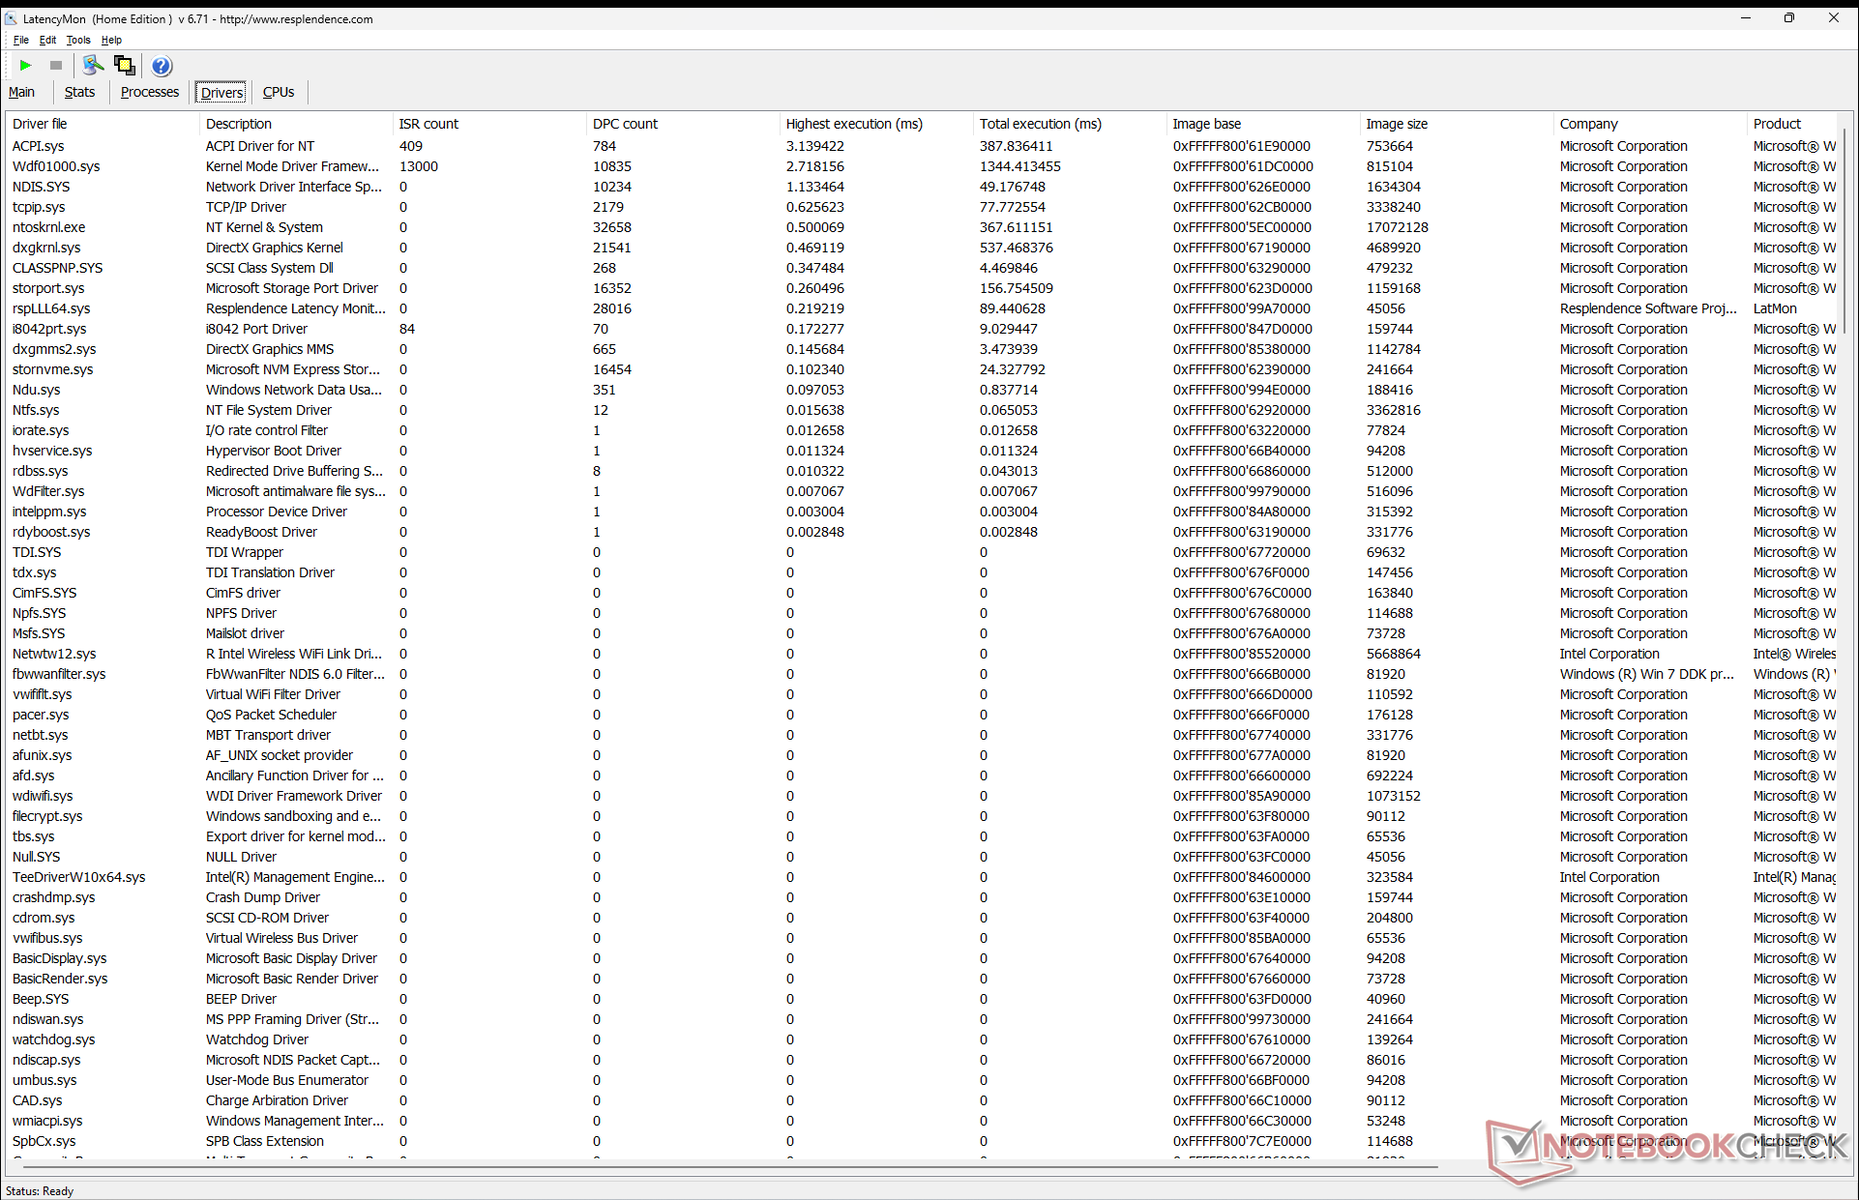
Latenza DPC
LatencyMon mostra solo lievi problemi di DPC quando si aprono più schede del browser della nostra homepage. la riproduzione di video 4K a 60 FPS è invece perfetta, senza cadute di fotogrammi.
| DPC Latencies / LatencyMon - interrupt to process latency (max), Web, Youtube, Prime95 | |
| Dell Latitude 9330 | |
| HP Dragonfly G4 | |
| HP Elite Dragonfly G3 | |
| Lenovo ThinkPad X13 G3 21CM002UGE | |
| Framework Laptop 13.5 13th Gen Intel | |
* ... Meglio usare valori piccoli
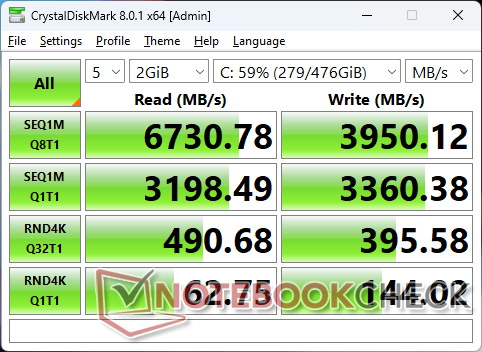
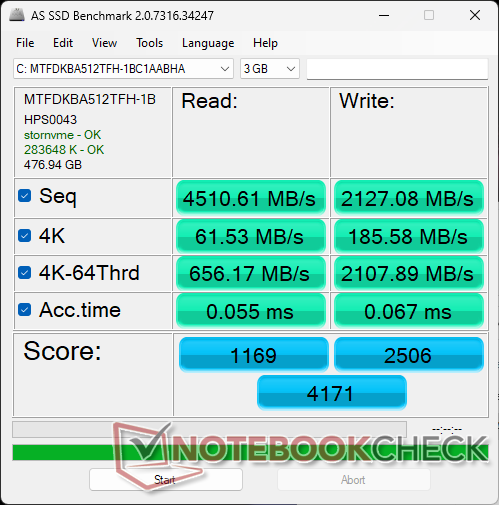
Dispositivi di archiviazione
HP si affida alle unità SSD Micron 3400 NVMe SSD per il secondo anno consecutivo, a differenza della serie Dell XPS 13 che può includere SSD di Samsung, Micron o Western Digital.

| Drive Performance rating - Percent | |
| Framework Laptop 13.5 13th Gen Intel | |
| HP Dragonfly G4 | |
| Lenovo ThinkPad X13 G3 21CM002UGE | |
| HP Elite Dragonfly G3 | |
| Dell Latitude 9330 | |
* ... Meglio usare valori piccoli
Disk Throttling: DiskSpd Read Loop, Queue Depth 8
Prestazioni della GPU
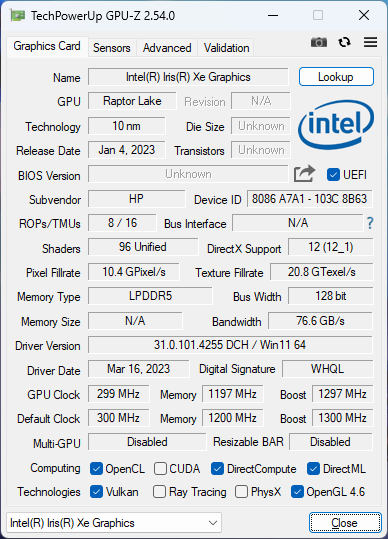
Le prestazioni grafiche sono leggermente superiori a quelle del Dragonfly G3 dello scorso anno, soprattutto grazie alla CPU leggermente più veloce. Per un incremento più significativo, gli acquirenti dovranno cercare altrove la AMD Radeon 680M o 780M come nel caso dell'Asus Zenbook S 13 o Lenovo Yoga Pro 7 14.
L'esecuzione del sistema in modalità Bilanciata invece che in modalità Prestazioni può ostacolare le prestazioni della CPU e della GPU rispettivamente del 12% e del 6%, come mostra la tabella di confronto 3DMark 11 qui sotto.
| Profilo energetico | Punteggio grafico | Punteggio Fisica | Punteggio combinato |
| Modalità bilanciata | 6061 (-6%) | 10145 (-12%) | 4879 (-16%) |
| Modalità Performance | 6440 | 11465 | 5780 |
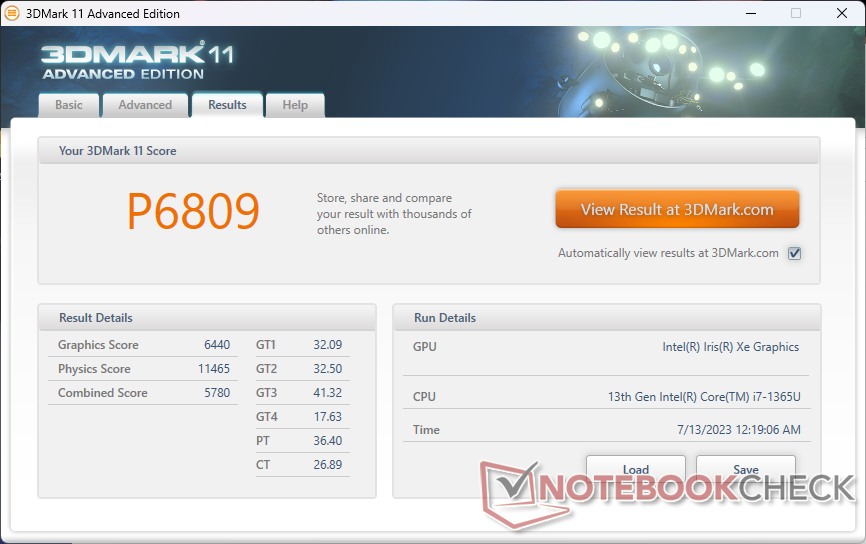
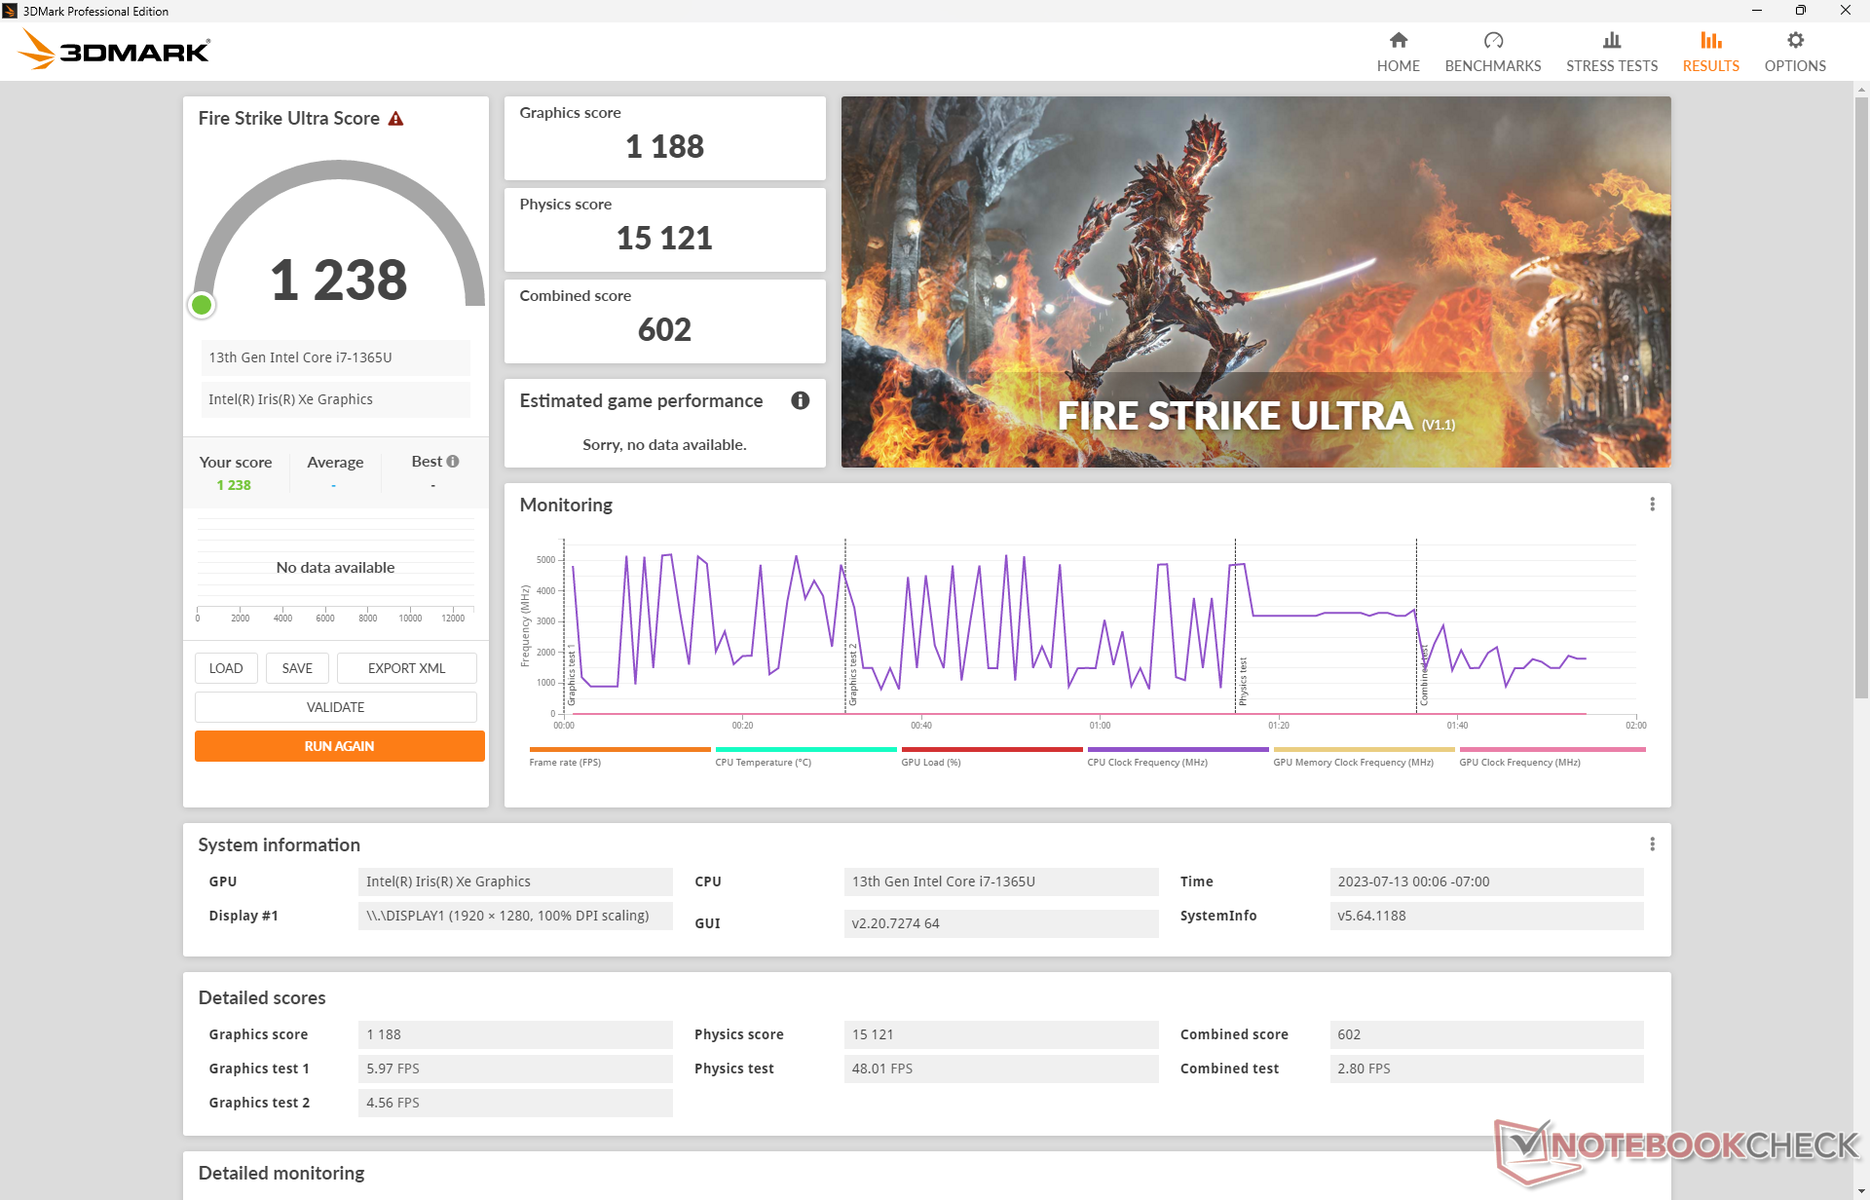
| 3DMark 11 Performance | 6809 punti | |
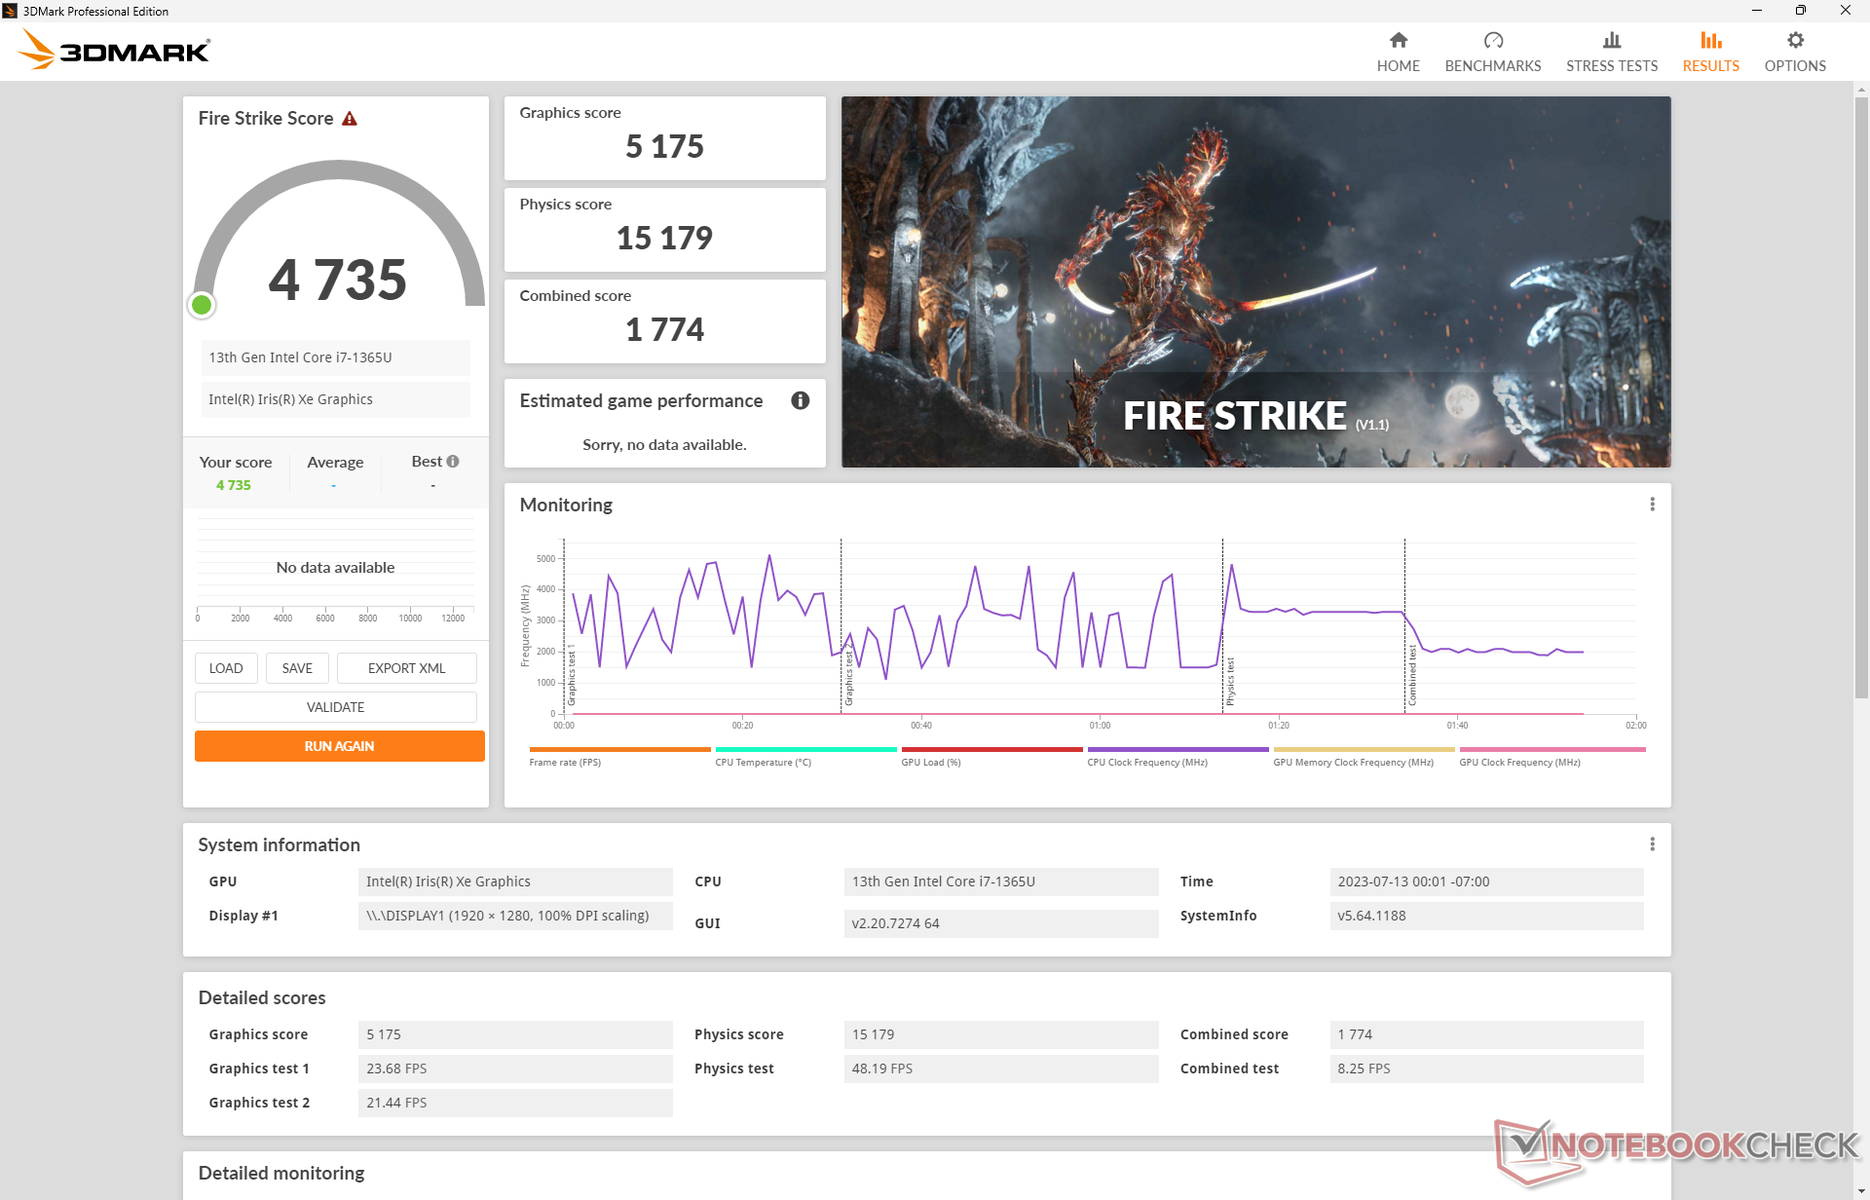
| 3DMark Fire Strike Score | 4735 punti | |
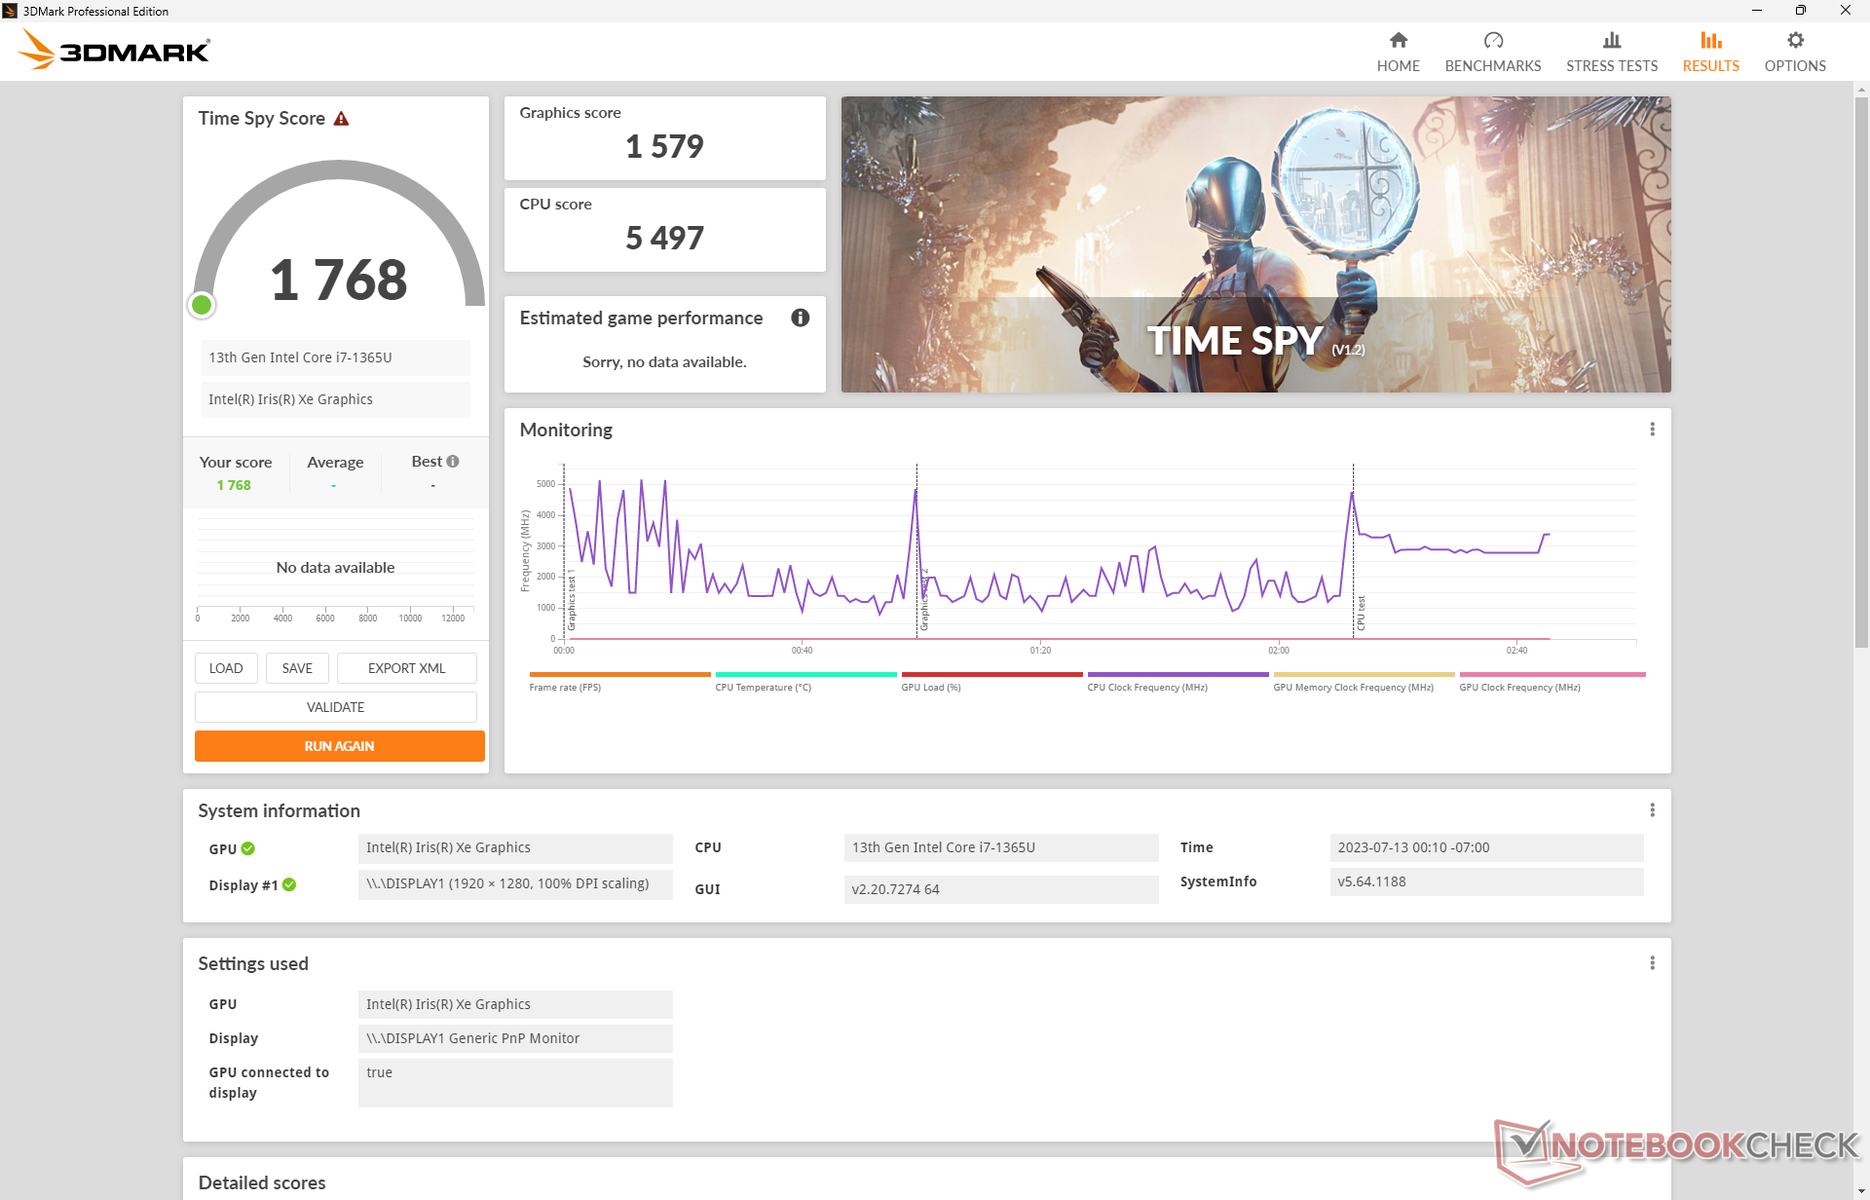
| 3DMark Time Spy Score | 1768 punti | |
Aiuto | ||
* ... Meglio usare valori piccoli
| Tiny Tina's Wonderlands | |
| 1280x720 Lowest Preset (DX12) | |
| HP Dragonfly G4 | |
| Media Intel Iris Xe Graphics G7 96EUs (25.9 - 67.3, n=32) | |
| 1920x1080 Low Preset (DX12) | |
| Framework Laptop 13.5 13th Gen Intel | |
| Media Intel Iris Xe Graphics G7 96EUs (22.3 - 53, n=32) | |
| HP Dragonfly G4 | |
| 1920x1080 Medium Preset (DX12) | |
| Framework Laptop 13.5 13th Gen Intel | |
| Media Intel Iris Xe Graphics G7 96EUs (17 - 40.1, n=30) | |
| HP Dragonfly G4 | |
| 1920x1080 High Preset (DX12) | |
| Framework Laptop 13.5 13th Gen Intel | |
| Media Intel Iris Xe Graphics G7 96EUs (10.6 - 24.1, n=29) | |
| HP Dragonfly G4 | |
| 1920x1080 Badass Preset (DX12) | |
| Framework Laptop 13.5 13th Gen Intel | |
| Media Intel Iris Xe Graphics G7 96EUs (8.4 - 18.4, n=26) | |
| HP Dragonfly G4 | |
| F1 22 | |
| 1280x720 Ultra Low Preset AA:T AF:16x | |
| Framework Laptop 13.5 13th Gen Intel | |
| Media Intel Iris Xe Graphics G7 96EUs (57.4 - 94.9, n=53) | |
| HP Dragonfly G4 | |
| Lenovo ThinkPad X13 G3 21CM002UGE | |
| 1920x1080 Low Preset AA:T AF:16x | |
| Framework Laptop 13.5 13th Gen Intel | |
| Media Intel Iris Xe Graphics G7 96EUs (33.3 - 57.2, n=58) | |
| HP Dragonfly G4 | |
| Lenovo ThinkPad X13 G3 21CM002UGE | |
| 1920x1080 Medium Preset AA:T AF:16x | |
| Framework Laptop 13.5 13th Gen Intel | |
| Media Intel Iris Xe Graphics G7 96EUs (28 - 52.3, n=58) | |
| HP Dragonfly G4 | |
| Lenovo ThinkPad X13 G3 21CM002UGE | |
| 1920x1080 High Preset AA:T AF:16x | |
| Framework Laptop 13.5 13th Gen Intel | |
| Media Intel Iris Xe Graphics G7 96EUs (21.7 - 37.1, n=58) | |
| HP Dragonfly G4 | |
| Lenovo ThinkPad X13 G3 21CM002UGE | |
| 1920x1080 Ultra High Preset AA:T AF:16x | |
| Framework Laptop 13.5 13th Gen Intel | |
| Media Intel Iris Xe Graphics G7 96EUs (16.1 - 28.2, n=49) | |
| HP Dragonfly G4 | |
| Lenovo ThinkPad X13 G3 21CM002UGE | |
Witcher 3 FPS Chart
| basso | medio | alto | ultra | |
|---|---|---|---|---|
| GTA V (2015) | 99.8 | 84.1 | 23.4 | 10.1 |
| The Witcher 3 (2015) | 78.9 | 54.2 | 31 | 14.7 |
| Dota 2 Reborn (2015) | 101.4 | 76.3 | 60.2 | 53.3 |
| Final Fantasy XV Benchmark (2018) | 40.9 | 23.2 | 16.4 | |
| X-Plane 11.11 (2018) | 37.6 | 31.8 | 29.1 | |
| Strange Brigade (2018) | 88.8 | 38.4 | 30.4 | 24.7 |
| Cyberpunk 2077 1.6 (2022) | 19.7 | 16.3 | 12.7 | 9.3 |
| Tiny Tina's Wonderlands (2022) | 25.9 | 21.2 | 14.1 | 11.1 |
| F1 22 (2022) | 43.6 | 39.4 | 27.4 | 22.2 |
Emissioni
Rumore del sistema
I laptop HP Dragonfly sono generalmente più silenziosi della maggior parte dei modelli concorrenti, al costo di una velocità di clock della CPU inferiore alla media. Siamo riusciti a misurare un massimo di soli 35 dB(A), rispetto agli oltre 40 dB(A) del modello 9330.Latitude 9330. Anche in questo caso, il massimo di 35 dB(A) è solo una breve esplosione prima di scendere e stabilizzarsi a circa 33 dB(A) quando si eseguono carichi impegnativi.
Rumorosità
| Idle |
| 23.5 / 23.5 / 26.8 dB(A) |
| Sotto carico |
| 27.2 / 35 dB(A) |
 | ||
30 dB silenzioso 40 dB(A) udibile 50 dB(A) rumoroso |
||
min: | ||
| HP Dragonfly G4 Iris Xe G7 96EUs, i7-1365U, Micron 3400 MTFDKBA512TFH 512GB | HP Elite Dragonfly G3 Iris Xe G7 96EUs, i7-1265U, Micron 3400 MTFDKBA512TFH 512GB | Framework Laptop 13.5 13th Gen Intel Iris Xe G7 96EUs, i7-1370P, WD PC SN740 SDDPNQD-1T00 | Lenovo ThinkPad X13 G3 21CM002UGE Radeon 660M, R5 PRO 6650U, Samsung PM9A1 MZVL2512HCJQ | Dell Latitude 9330 Iris Xe G7 96EUs, i7-1260U | |
|---|---|---|---|---|---|
| Noise | 4% | -20% | 0% | -8% | |
| off /ambiente * (dB) | 23.3 | 22.8 2% | 23.2 -0% | 23.1 1% | 23 1% |
| Idle Minimum * (dB) | 23.5 | 23.2 1% | 23.2 1% | 23.1 2% | 23 2% |
| Idle Average * (dB) | 23.5 | 23.2 1% | 23.2 1% | 23.1 2% | 23.1 2% |
| Idle Maximum * (dB) | 26.8 | 23.2 13% | 23.2 13% | 23.1 14% | 23.1 14% |
| Load Average * (dB) | 27.2 | 25.1 8% | 45.3 -67% | 27 1% | 37.1 -36% |
| Witcher 3 ultra * (dB) | 32.7 | 32 2% | 47.9 -46% | 38.7 -18% | 40.6 -24% |
| Load Maximum * (dB) | 35 | 35.2 -1% | 49.2 -41% | 35.5 -1% | 40.5 -16% |
* ... Meglio usare valori piccoli
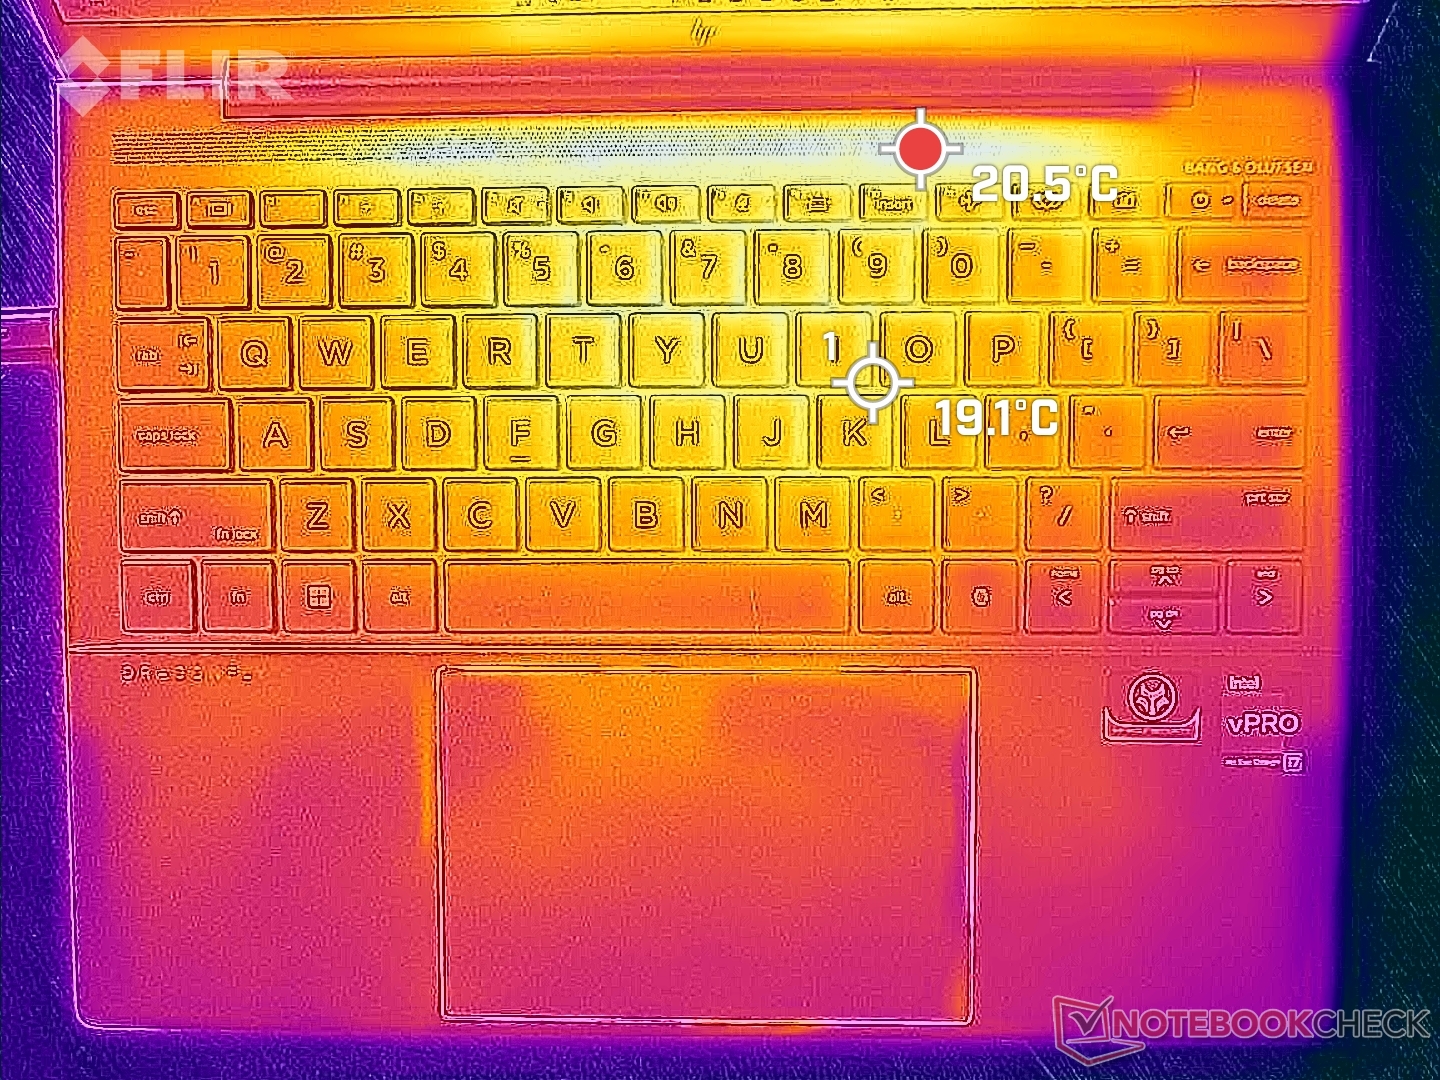
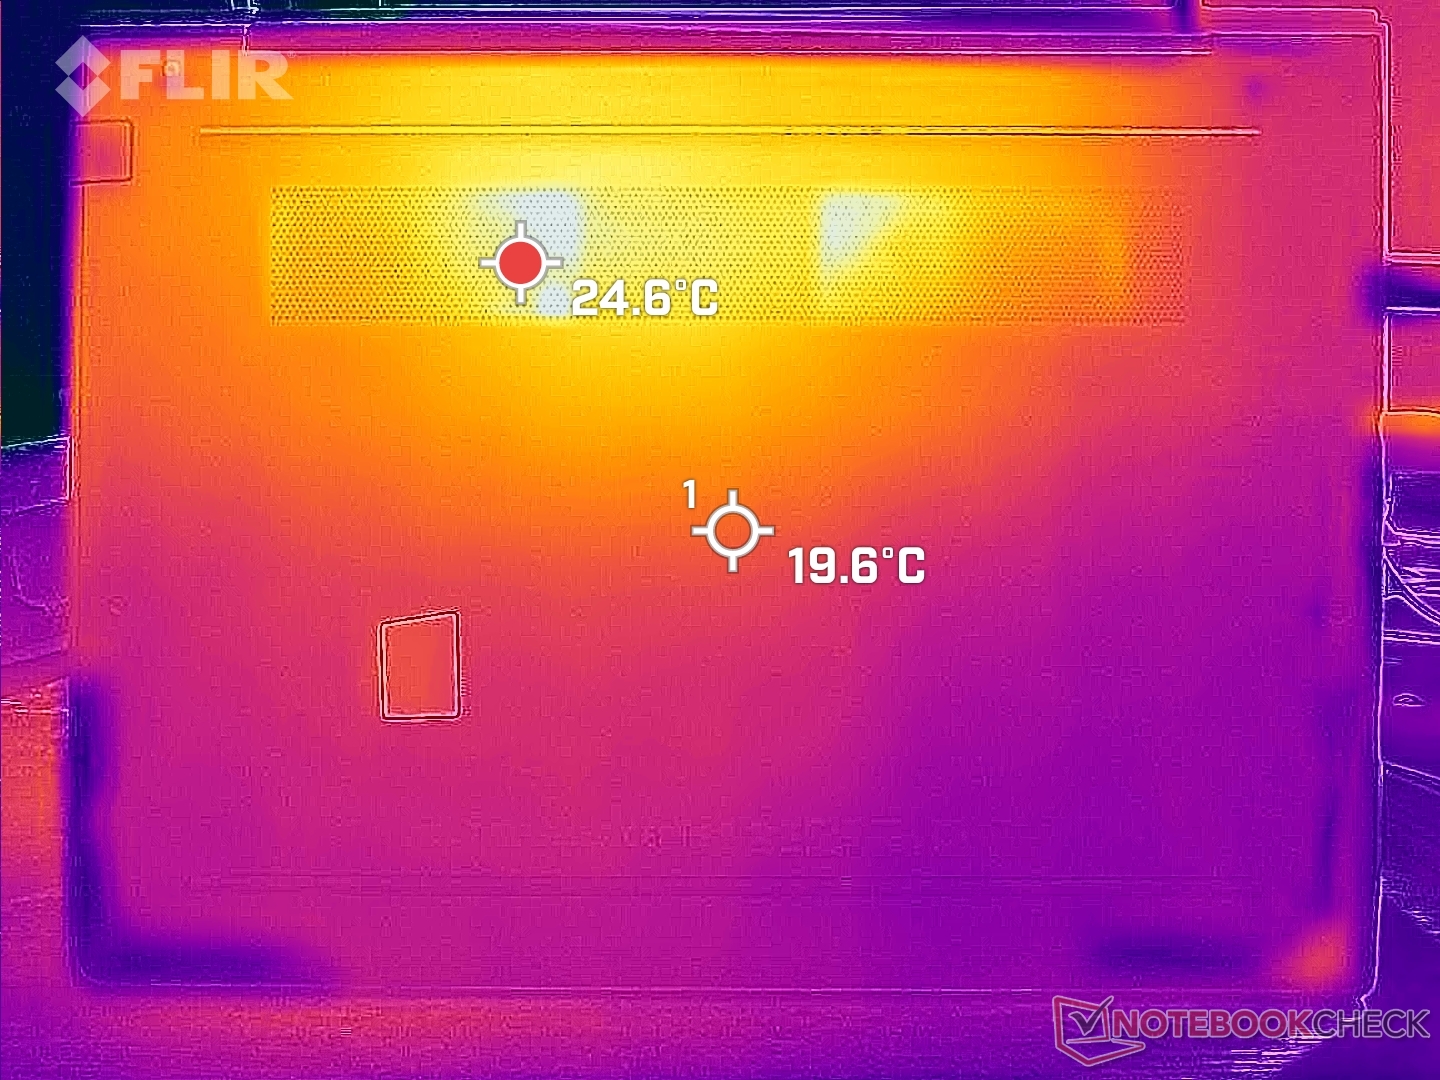
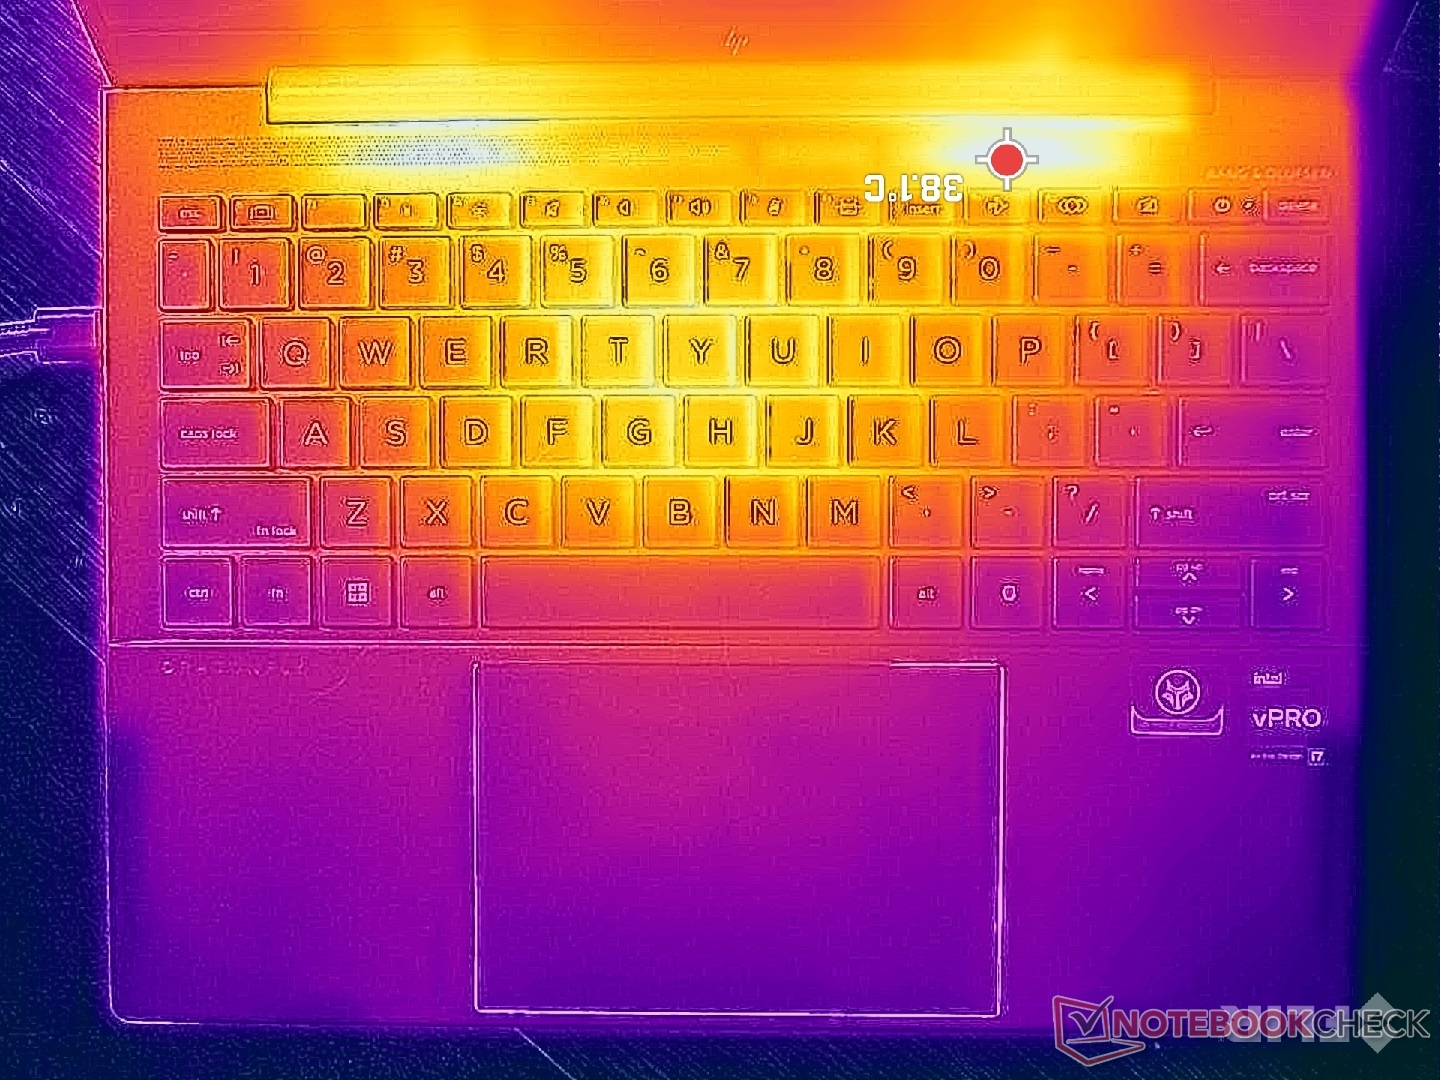
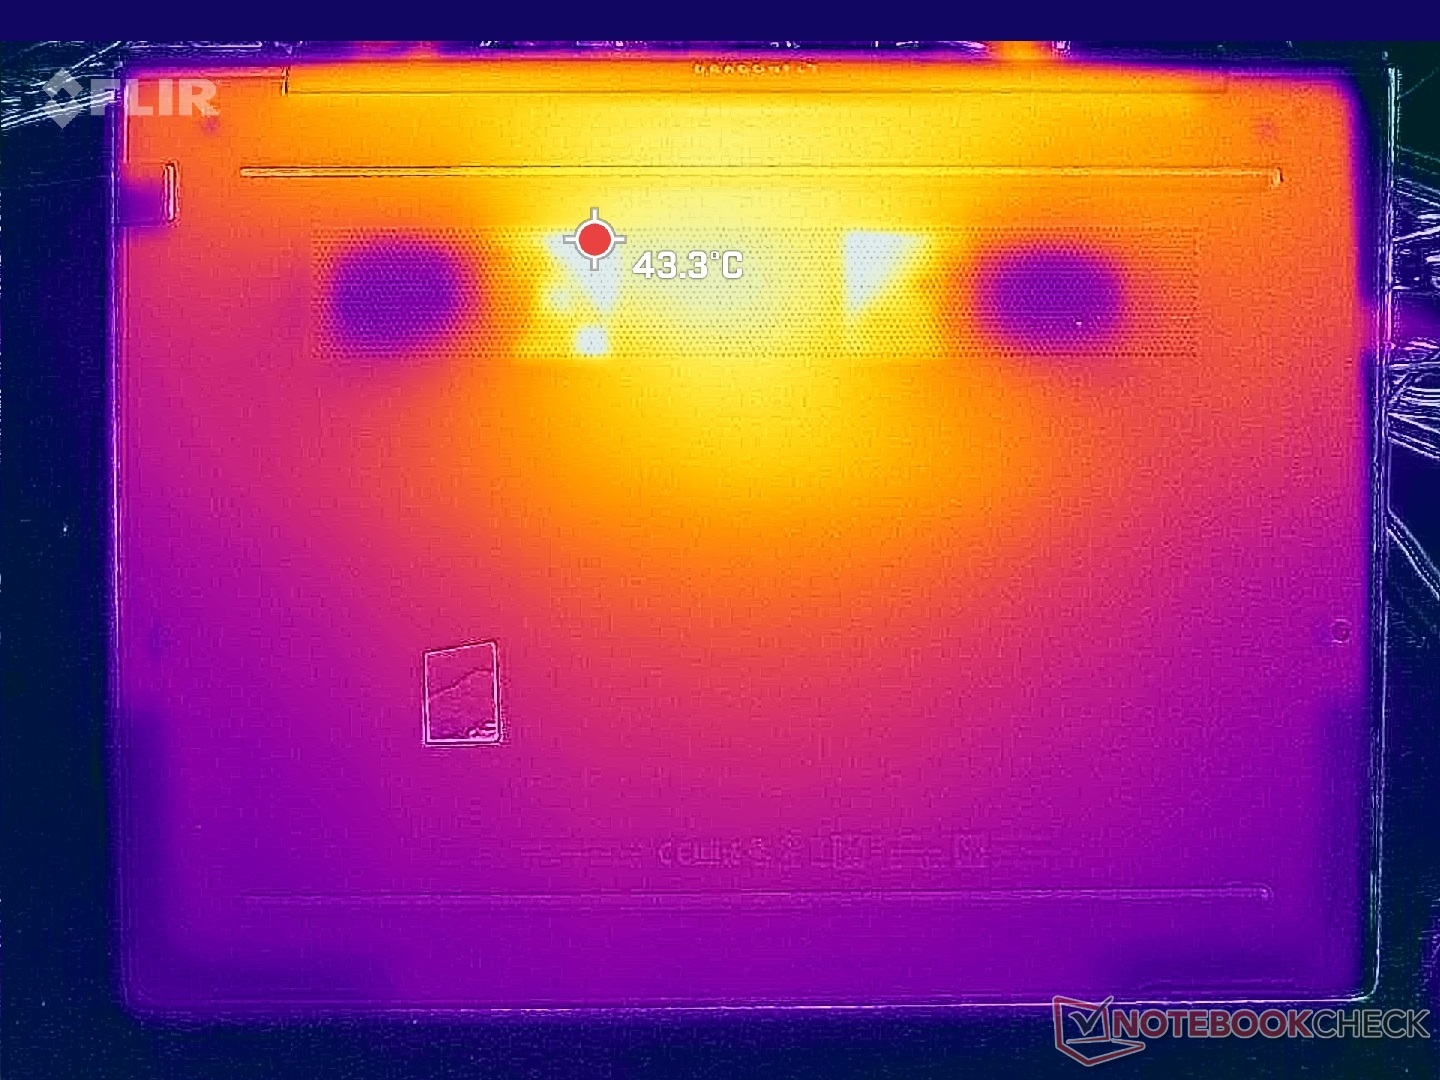
Temperatura
Le temperature della superficie possono raggiungere poco più di 40 C quando si è sottoposti a carichi pesanti, rispetto ai 45 C del più veloceXPS 13 Plus o addirittura 50 C sul modello Latitude 13 9330. I punti caldi si trovano sul lato posteriore dello chassis, lontano dai poggiapolsi e dal clickpad.
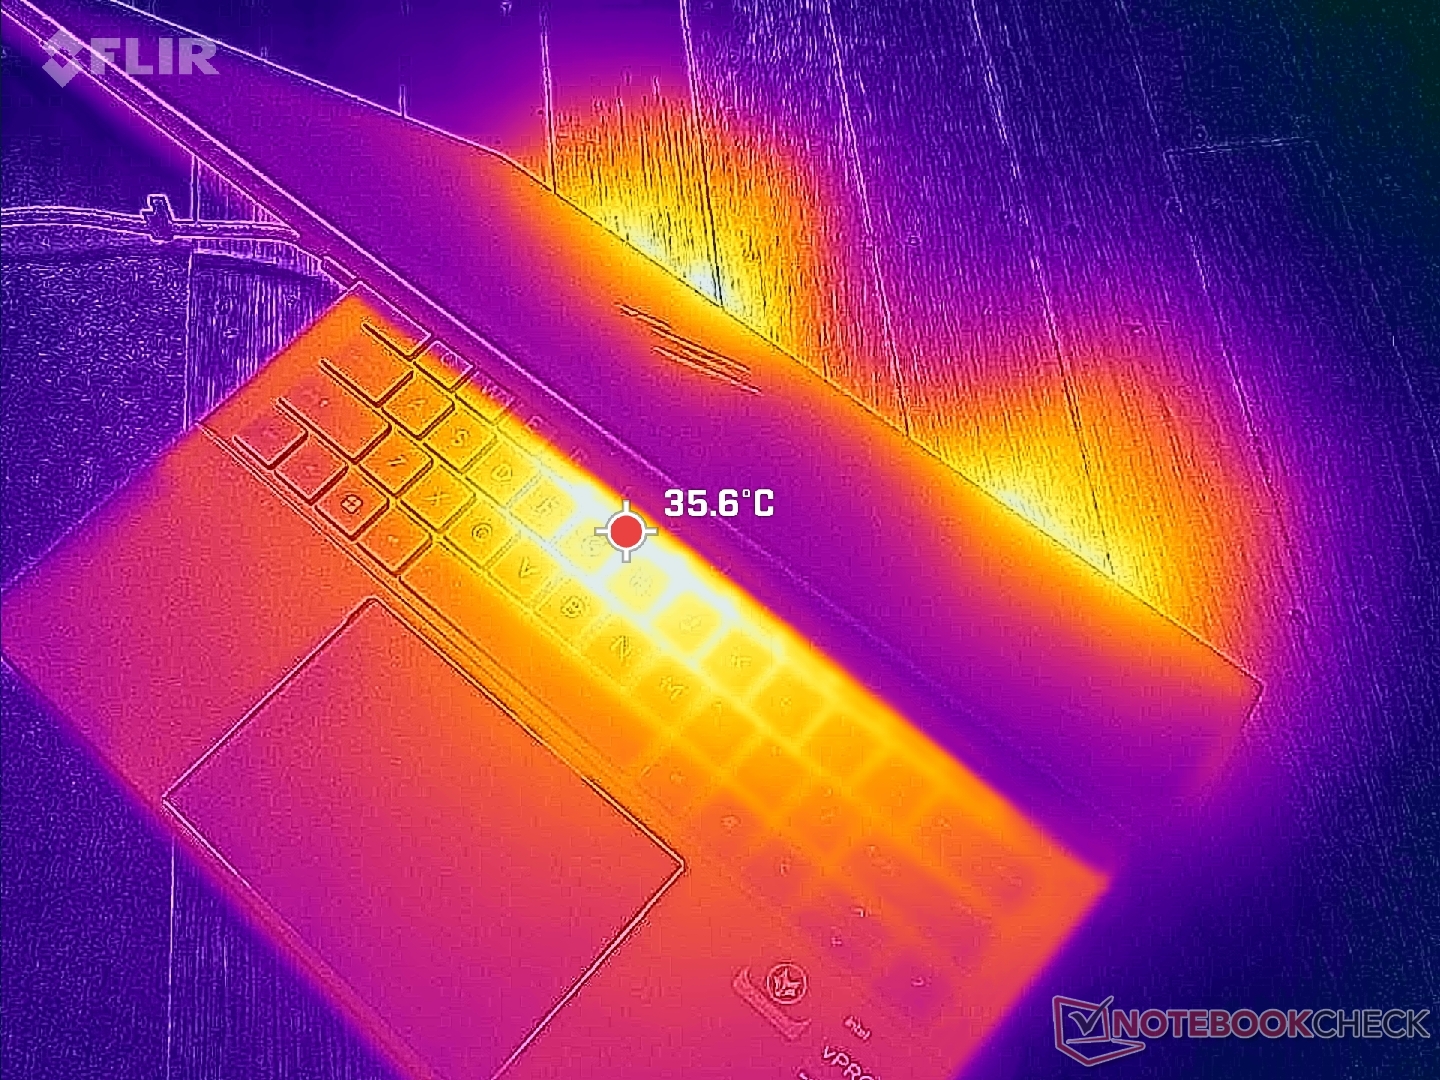
(+) La temperatura massima sul lato superiore è di 38.6 °C / 101 F, rispetto alla media di 35.9 °C / 97 F, che varia da 21.4 a 59 °C per questa classe Subnotebook.
(±) Il lato inferiore si riscalda fino ad un massimo di 40.4 °C / 105 F, rispetto alla media di 39.2 °C / 103 F
(+) In idle, la temperatura media del lato superiore è di 26.5 °C / 80 F, rispetto alla media deld ispositivo di 30.8 °C / 87 F.
(+) I poggiapolsi e il touchpad sono piu' freddi della temperatura della pelle con un massimo di 27 °C / 80.6 F e sono quindi freddi al tatto.
(±) La temperatura media della zona del palmo della mano di dispositivi simili e'stata di 28.2 °C / 82.8 F (+1.2 °C / 2.2 F).
| HP Dragonfly G4 Intel Core i7-1365U, Intel Iris Xe Graphics G7 96EUs | HP Elite Dragonfly G3 Intel Core i7-1265U, Intel Iris Xe Graphics G7 96EUs | Framework Laptop 13.5 13th Gen Intel Intel Core i7-1370P, Intel Iris Xe Graphics G7 96EUs | Lenovo ThinkPad X13 G3 21CM002UGE AMD Ryzen 5 PRO 6650U, AMD Radeon 660M | Dell Latitude 9330 Intel Core i7-1260U, Intel Iris Xe Graphics G7 96EUs | Apple MacBook Air M2 Entry Apple M2, Apple M2 8-Core GPU | |
|---|---|---|---|---|---|---|
| Heat | 1% | 3% | -8% | -3% | 2% | |
| Maximum Upper Side * (°C) | 38.6 | 39 -1% | 38.2 1% | 38.1 1% | 40.6 -5% | 44.5 -15% |
| Maximum Bottom * (°C) | 40.4 | 42.2 -4% | 41.4 -2% | 40.1 1% | 50.2 -24% | 44.4 -10% |
| Idle Upper Side * (°C) | 28.2 | 26.8 5% | 25.8 9% | 33.6 -19% | 25 11% | 23.9 15% |
| Idle Bottom * (°C) | 29 | 28.2 3% | 27.6 5% | 33.4 -15% | 27.6 5% | 23.6 19% |
* ... Meglio usare valori piccoli
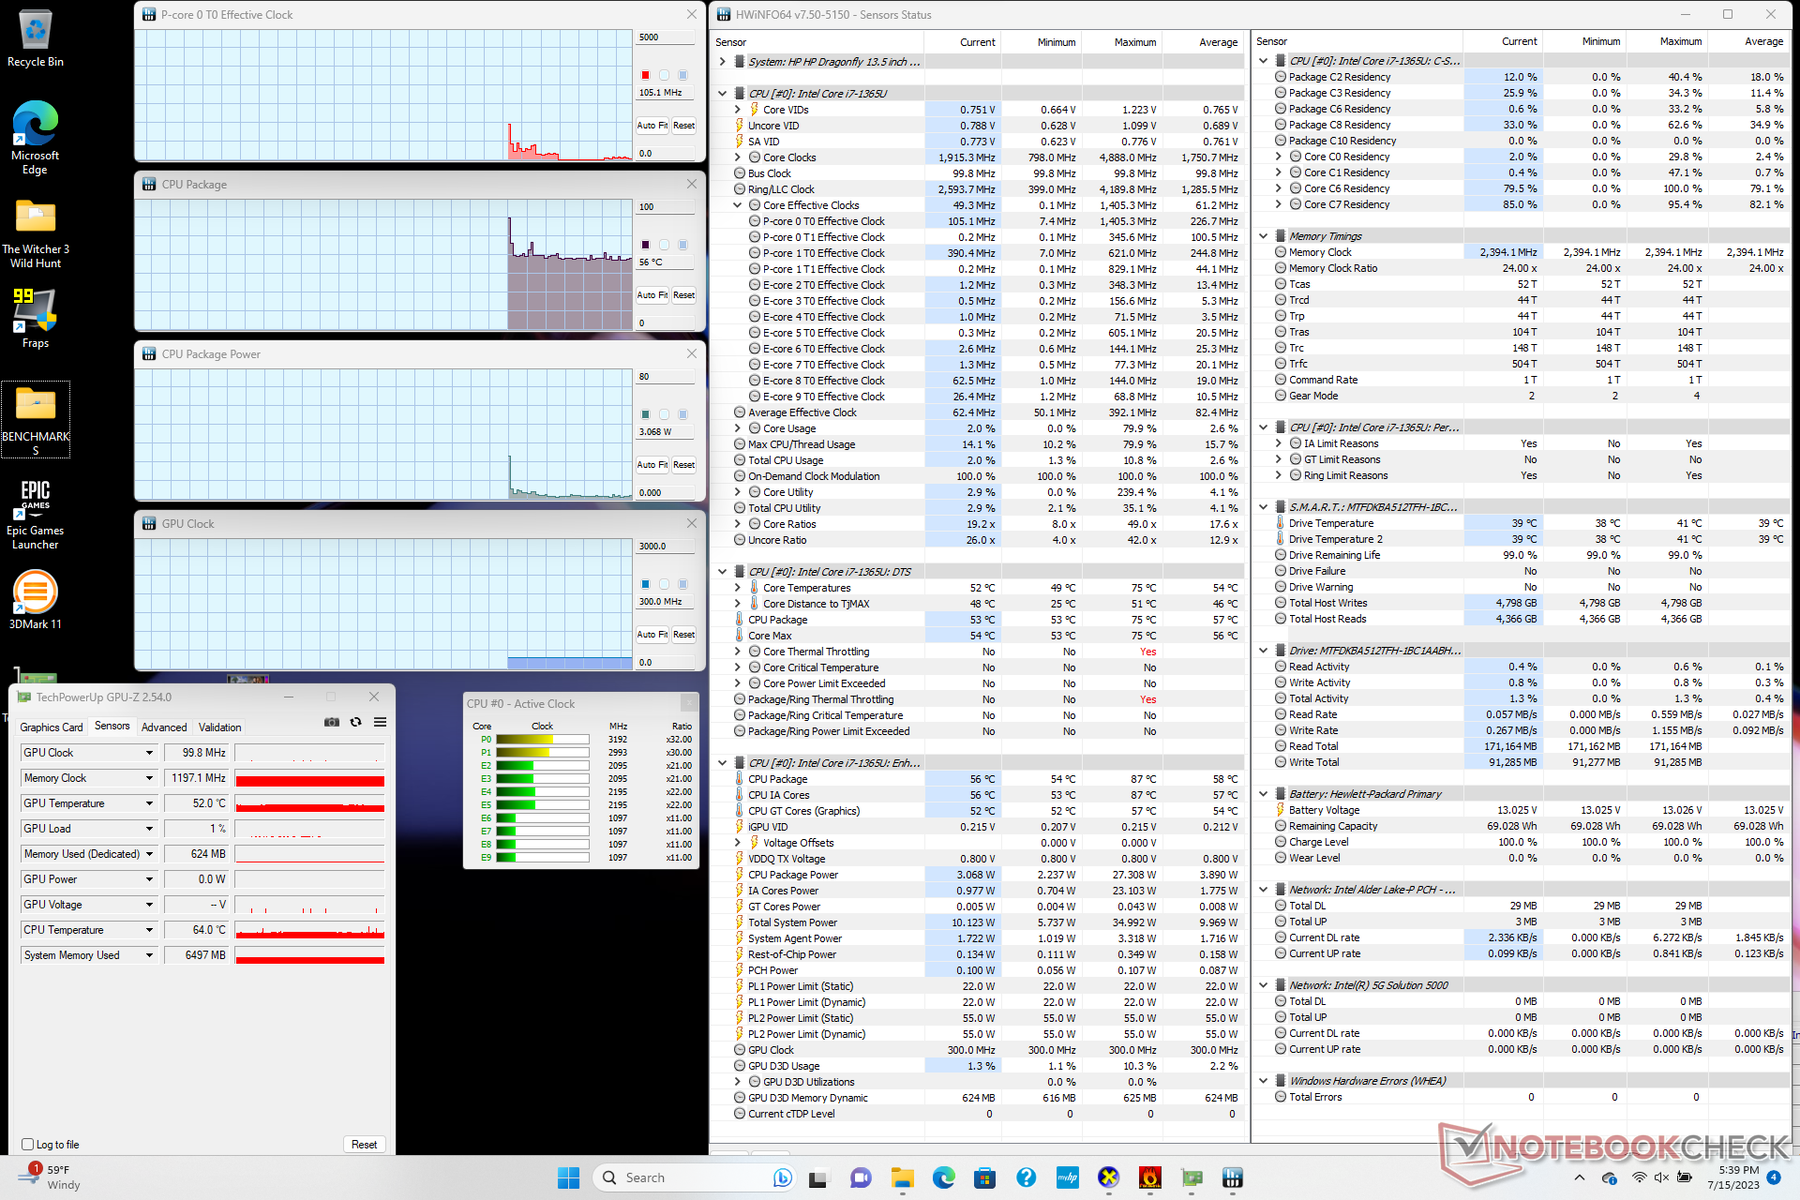
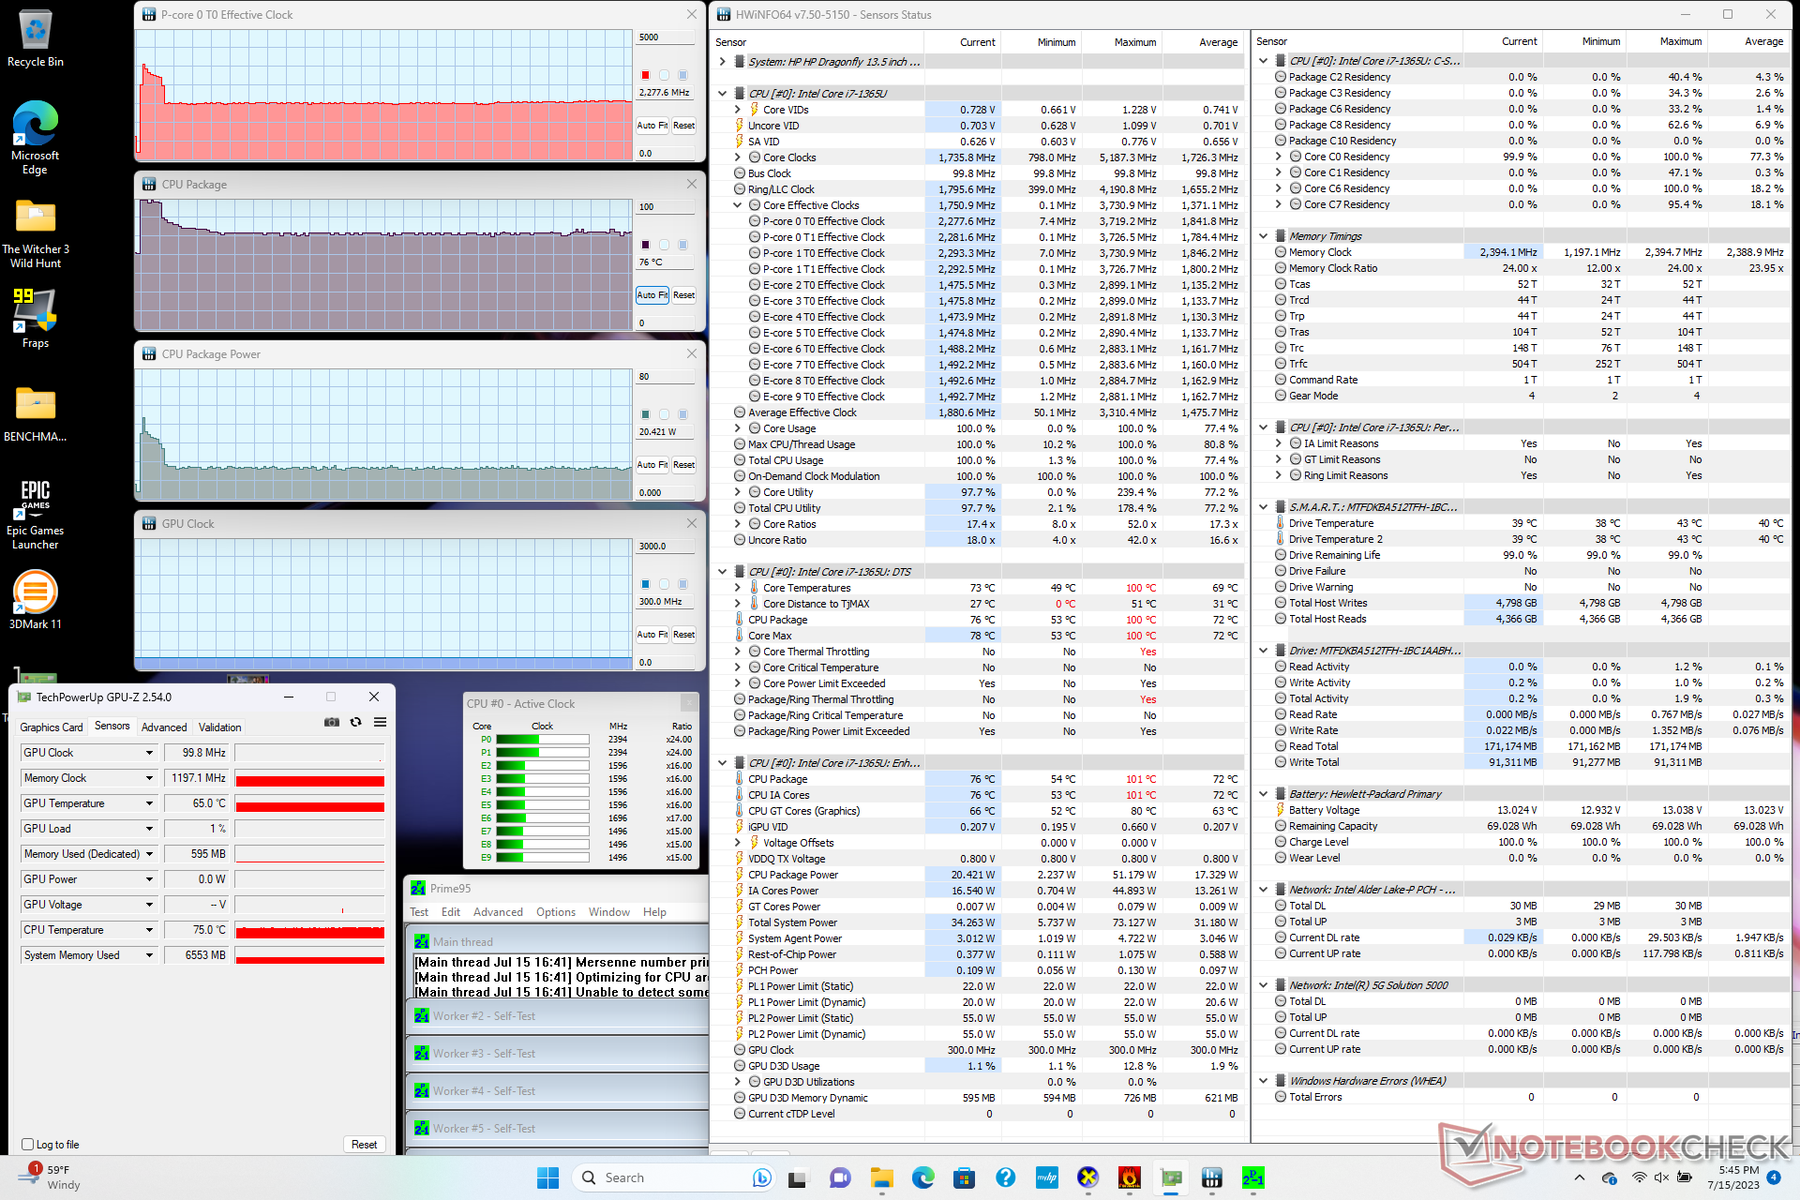
Stress test
Quando si esegue Prime95 per stressare la CPU, le frequenze di clock e l'assorbimento di potenza della scheda raggiungono rispettivamente 3,7 GHz e 51 W, oltre a una temperatura del core di 100 C. Una temperatura del genere non è ideale per la longevità del processore e quindi le frequenze di clock e l'assorbimento di potenza della scheda scendono rapidamente a 2,3 GHz e 20 W per mantenere una temperatura del core più ragionevole, pari a 76 C.
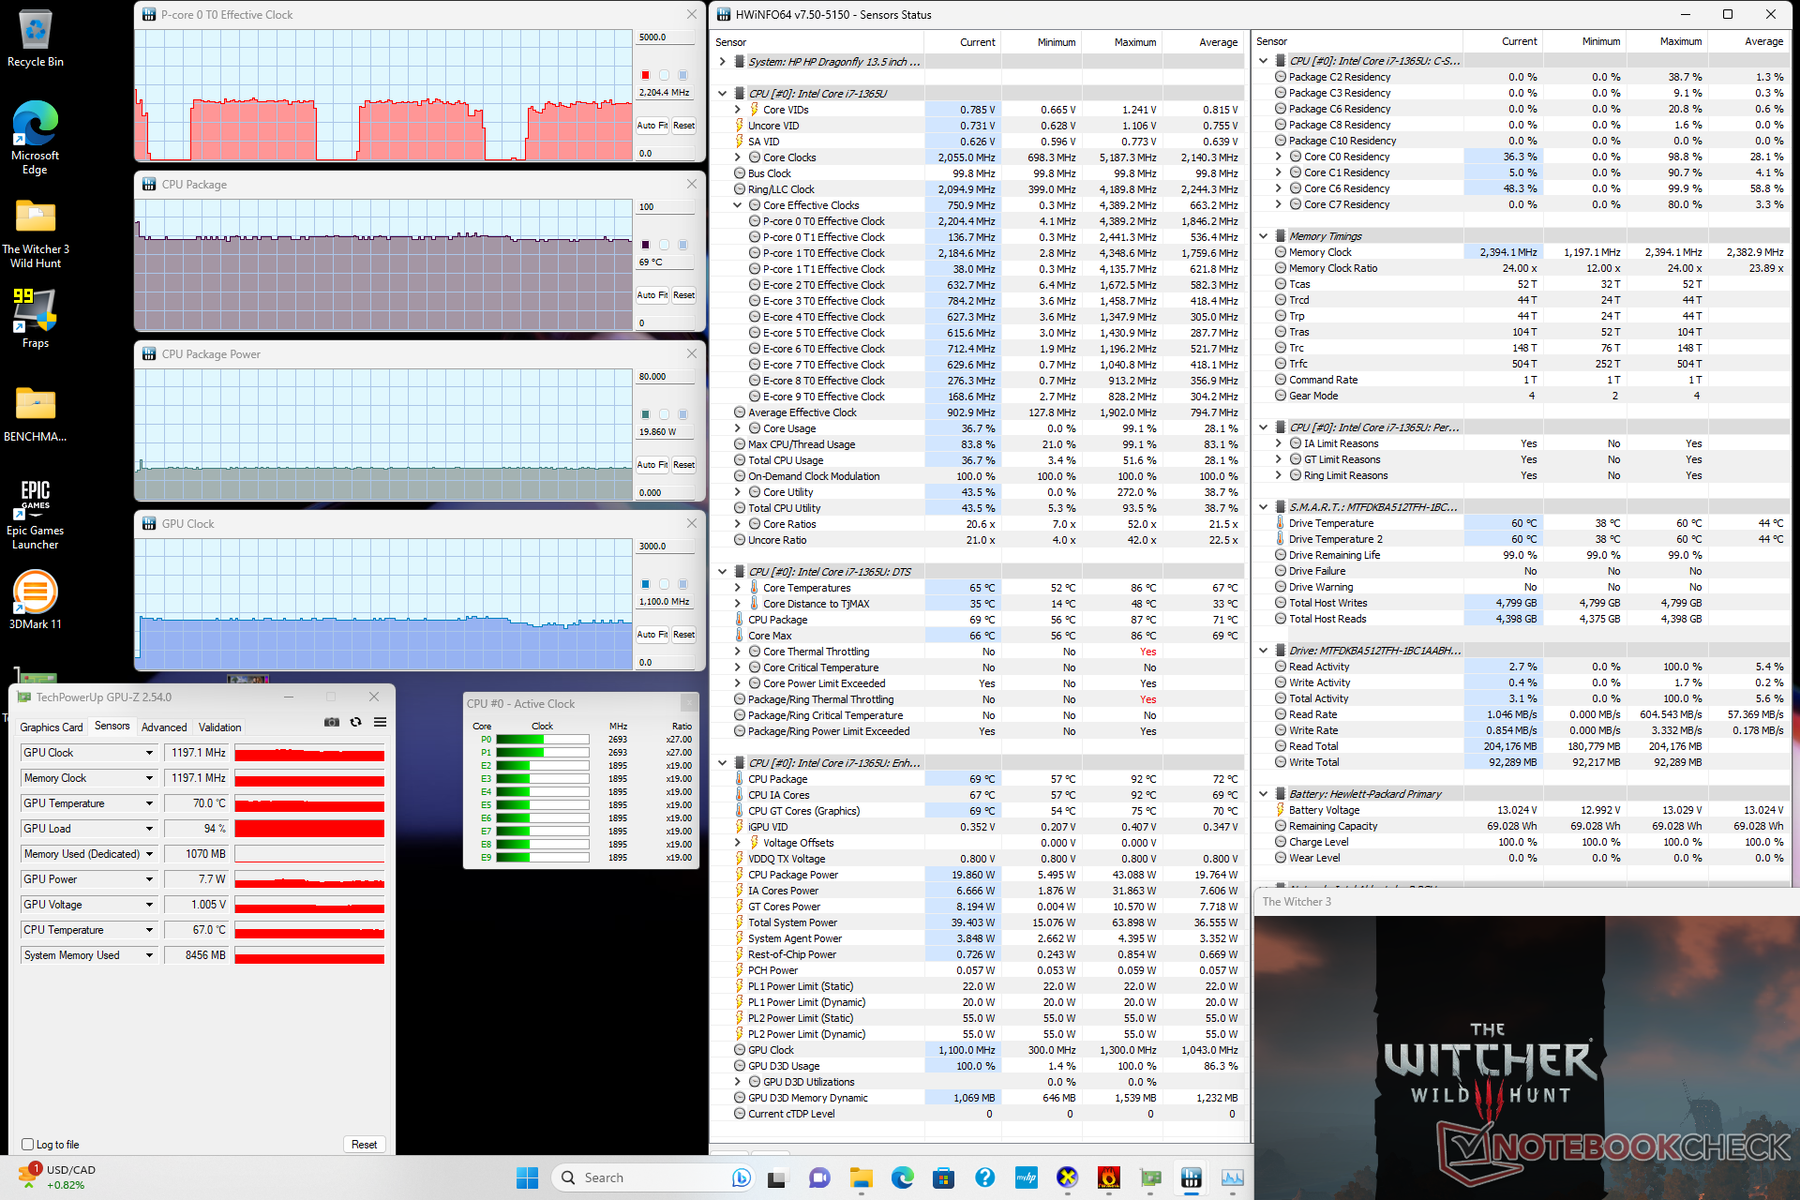
La frequenza di clock e la temperatura della GPU, quando Witcher 3 per rappresentare un carico elevato e costante si stabilizzerebbero rispettivamente a 1200 MHz e 69 C, un valore simile a quello registrato sul recente Dell Latitude 7440.
Il funzionamento a batteria riduce leggermente le prestazioni della CPU. Un test 3DMark 11 a batteria restituirebbe punteggi di Fisica e Grafica rispettivamente di 10619 e 5959 punti, rispetto a 11465 e 5780 punti con alimentazione a rete.
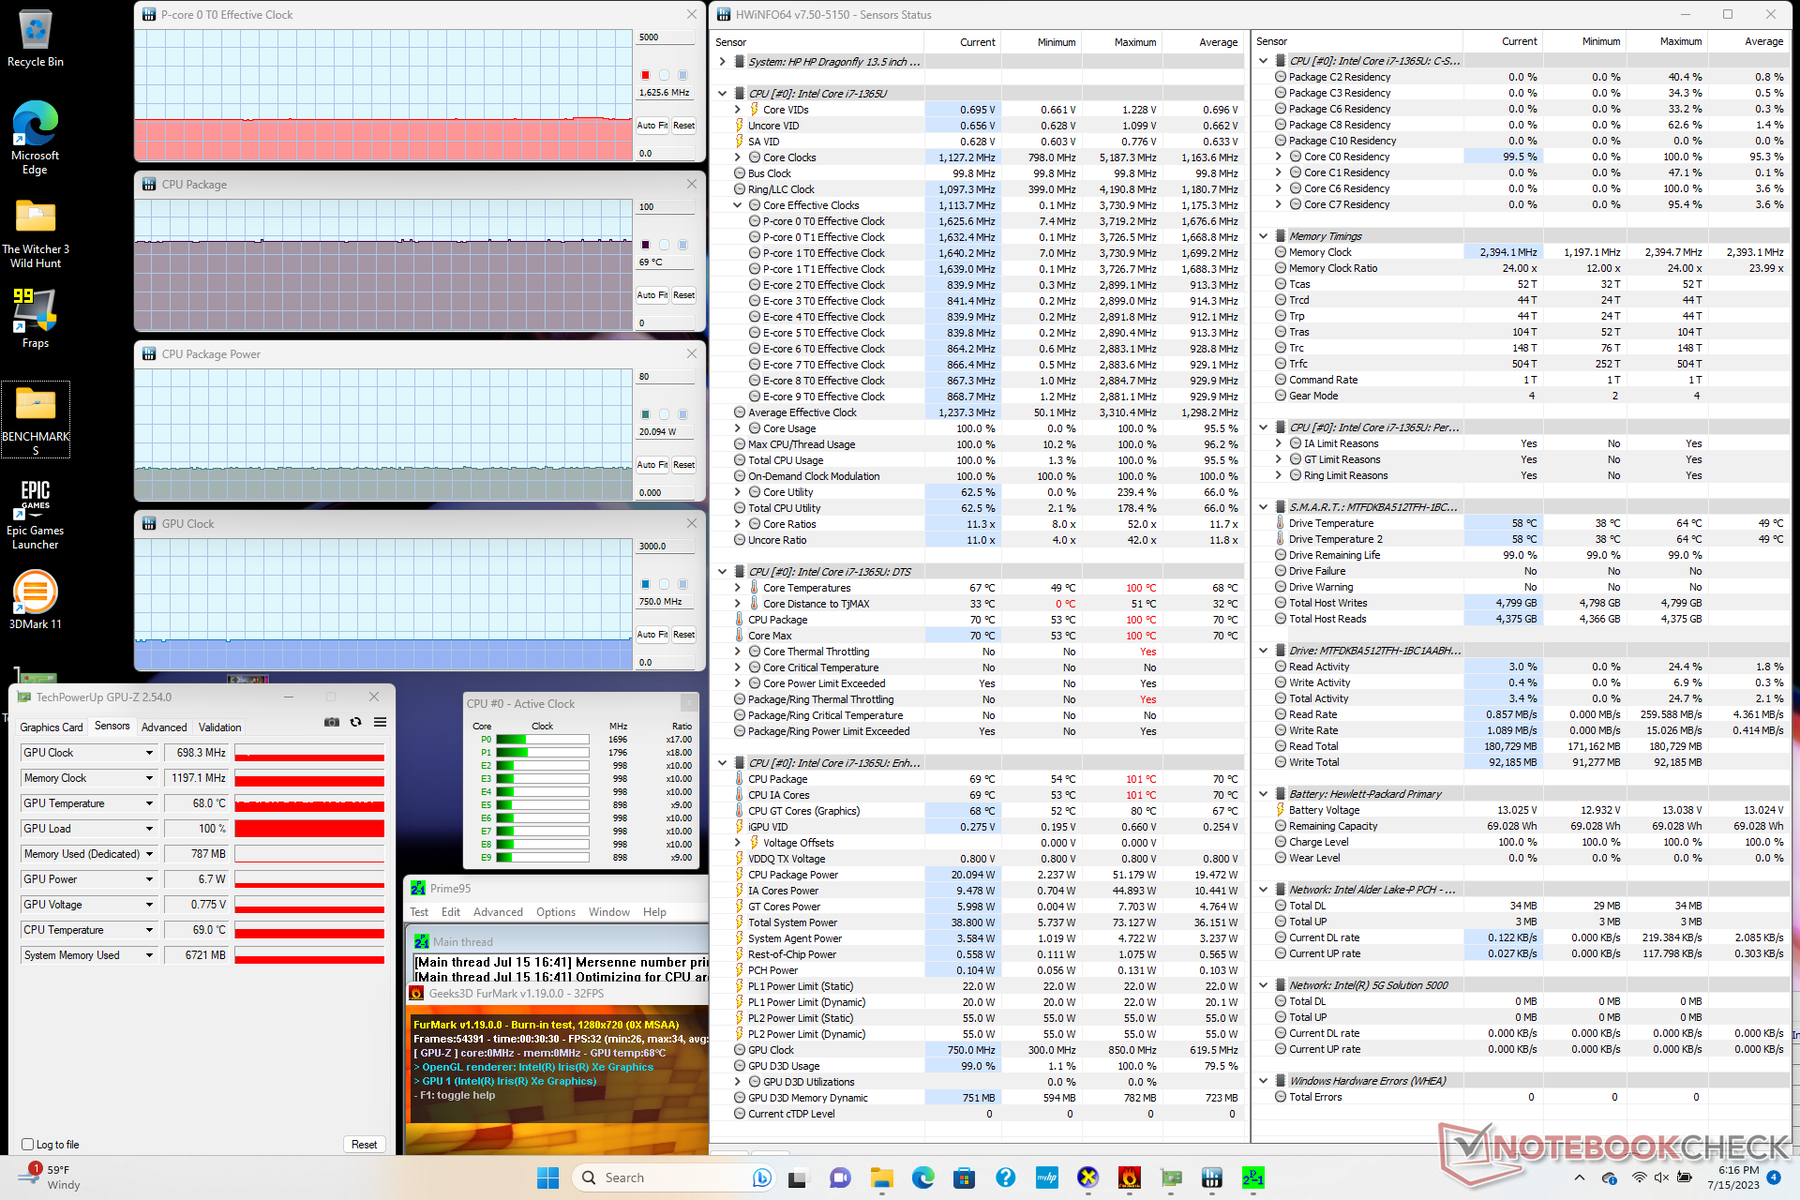
| Clock della CPU (GHz) | Clock della GPU (MHz) | Temperatura media della CPU (°C) | |
| Sistema inattivo | -- | -- | 56 |
| Stress Prime95 | 2,3 | -- | 76 |
| Prime95 + FurMark Stress | 1,6 | 698 | 69 |
| Witcher 3 Stress | ~2,2 | 1197 | 69 |
Altoparlanti
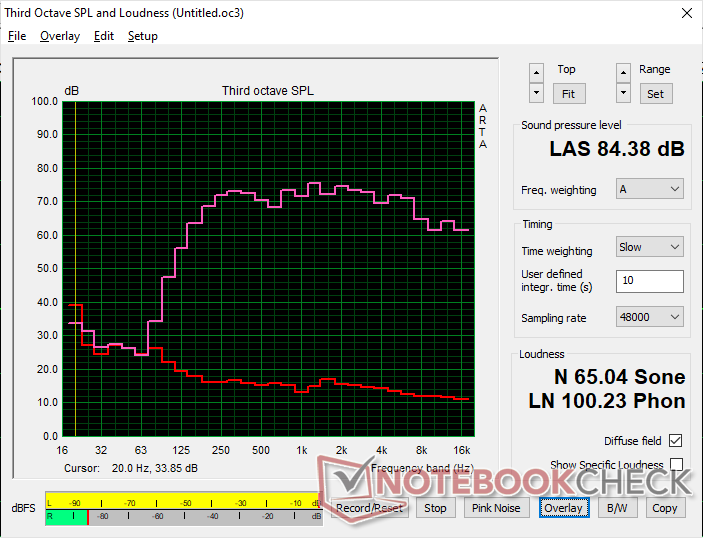
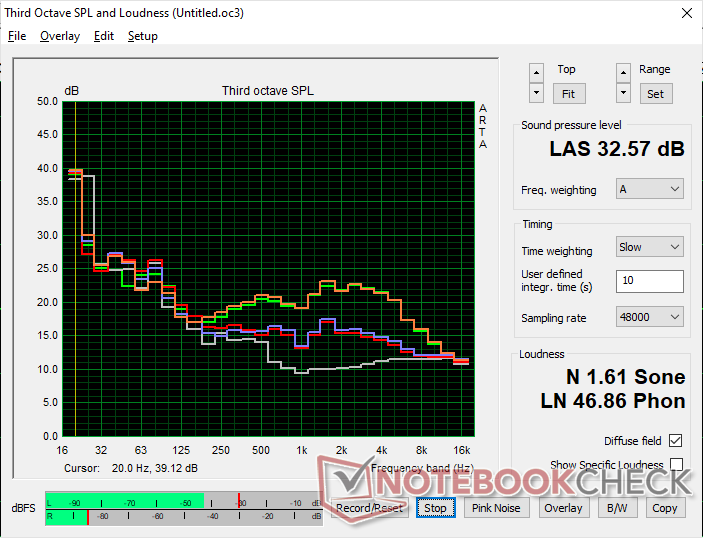
HP Dragonfly G4 analisi audio
(+) | gli altoparlanti sono relativamente potenti (84.4 dB)
Bassi 100 - 315 Hz
(±) | bassi ridotti - in media 8.4% inferiori alla media
(±) | la linearità dei bassi è media (11.6% delta rispetto alla precedente frequenza)
Medi 400 - 2000 Hz
(+) | medi bilanciati - solo only 2.3% rispetto alla media
(+) | medi lineari (4.8% delta rispetto alla precedente frequenza)
Alti 2 - 16 kHz
(+) | Alti bilanciati - appena 3.2% dalla media
(+) | alti lineari (4.6% delta rispetto alla precedente frequenza)
Nel complesso 100 - 16.000 Hz
(+) | suono nel complesso lineare (9.1% differenza dalla media)
Rispetto alla stessa classe
» 4% di tutti i dispositivi testati in questa classe è stato migliore, 1% simile, 95% peggiore
» Il migliore ha avuto un delta di 5%, medio di 18%, peggiore di 53%
Rispetto a tutti i dispositivi testati
» 3% di tutti i dispositivi testati in questa classe è stato migliore, 1% similare, 96% peggiore
» Il migliore ha avuto un delta di 4%, medio di 23%, peggiore di 134%
Apple MacBook Pro 16 2021 M1 Pro analisi audio
(+) | gli altoparlanti sono relativamente potenti (84.7 dB)
Bassi 100 - 315 Hz
(+) | bassi buoni - solo 3.8% dalla media
(+) | bassi in lineaa (5.2% delta rispetto alla precedente frequenza)
Medi 400 - 2000 Hz
(+) | medi bilanciati - solo only 1.3% rispetto alla media
(+) | medi lineari (2.1% delta rispetto alla precedente frequenza)
Alti 2 - 16 kHz
(+) | Alti bilanciati - appena 1.9% dalla media
(+) | alti lineari (2.7% delta rispetto alla precedente frequenza)
Nel complesso 100 - 16.000 Hz
(+) | suono nel complesso lineare (4.6% differenza dalla media)
Rispetto alla stessa classe
» 0% di tutti i dispositivi testati in questa classe è stato migliore, 0% simile, 100% peggiore
» Il migliore ha avuto un delta di 5%, medio di 17%, peggiore di 45%
Rispetto a tutti i dispositivi testati
» 0% di tutti i dispositivi testati in questa classe è stato migliore, 0% similare, 100% peggiore
» Il migliore ha avuto un delta di 4%, medio di 23%, peggiore di 134%
Gestione dell'energia
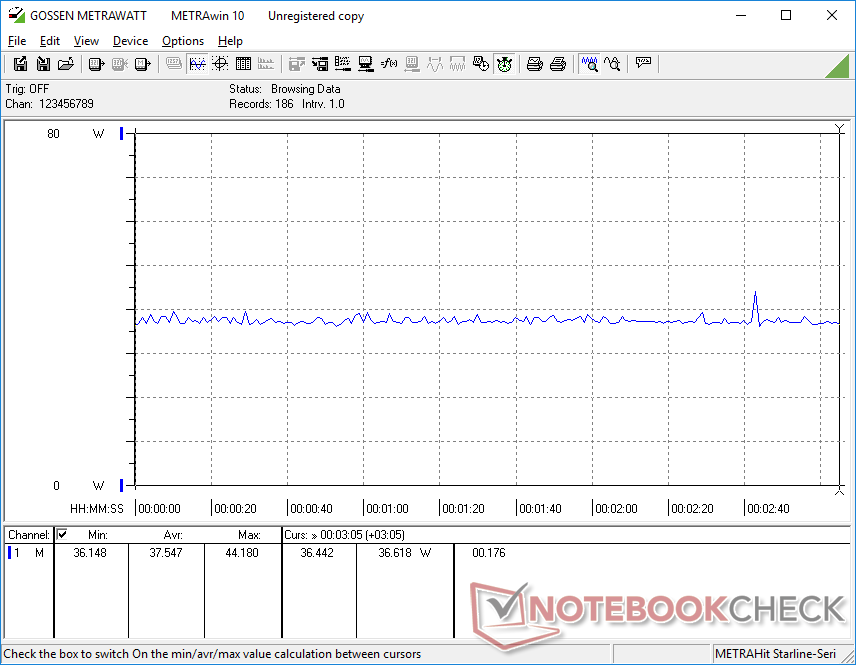
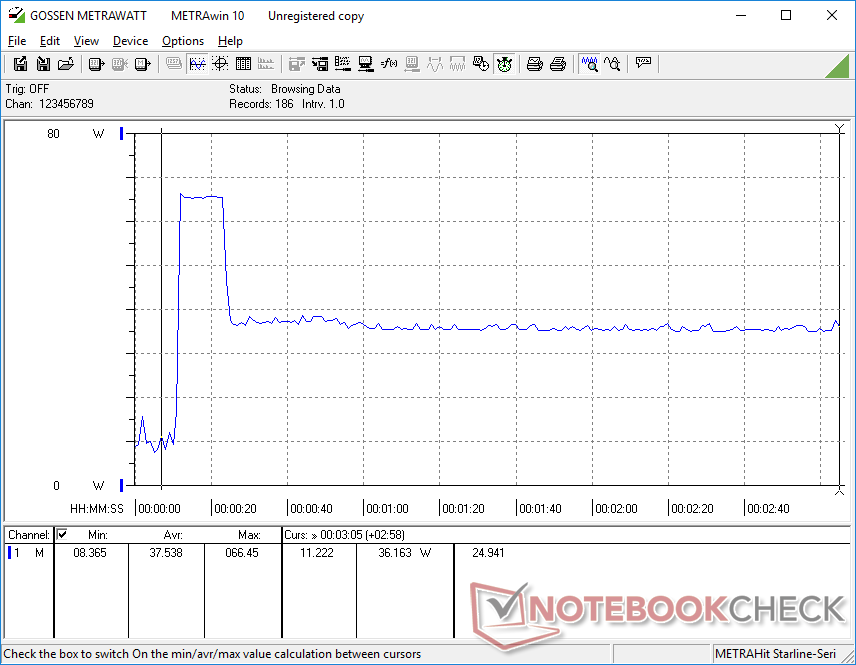
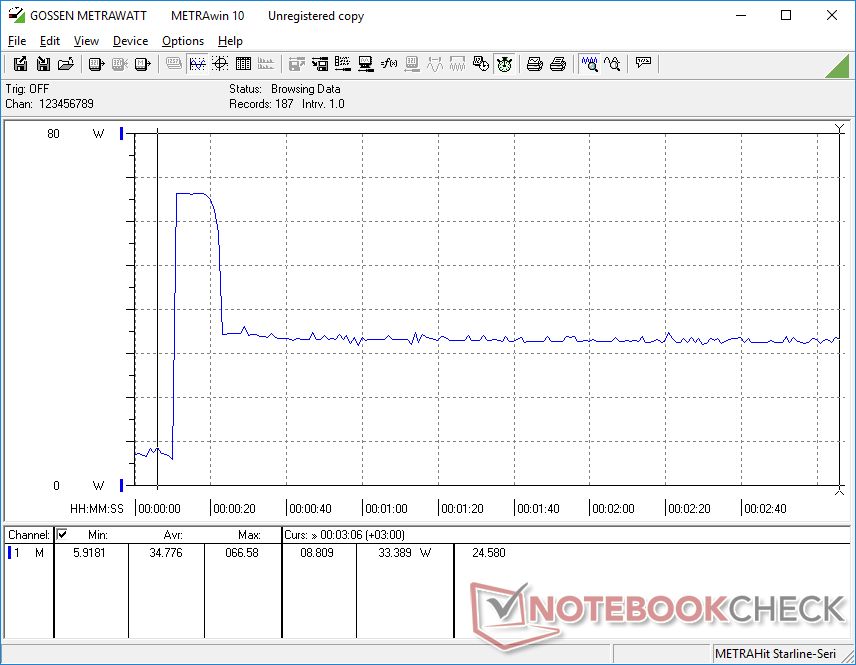
Consumo di energia
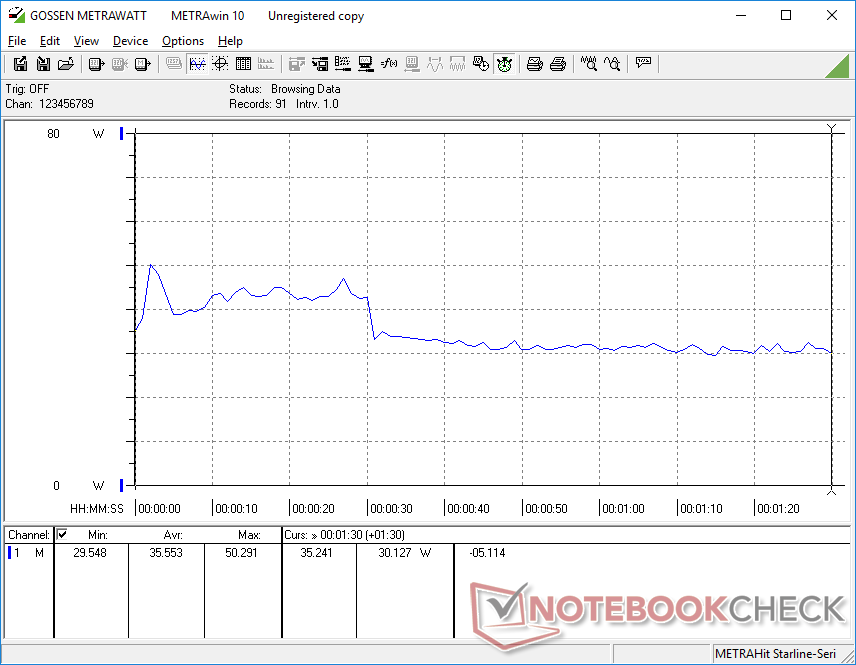
Il consumo energetico complessivo è quasi uguale a quello del Dragonfly G3, come prevedibile dato che entrambi i modelli condividono lo stesso display, SSD, chassis e persino gli obiettivi PL2 e PL1 secondo i risultati del nostro stress test di cui sopra. Le prestazioni per watt sono quindi più o meno le stesse, se non leggermente migliori, quando si passa dal Core i7-1265U al Core i7-1365U. I computer portatili con la Radeon 680M della concorrenza, come l' Acer Swift Edge SFE16 consumano più energia sotto carico, ma sono in grado di offrire prestazioni della GPU molto più veloci per compensare.
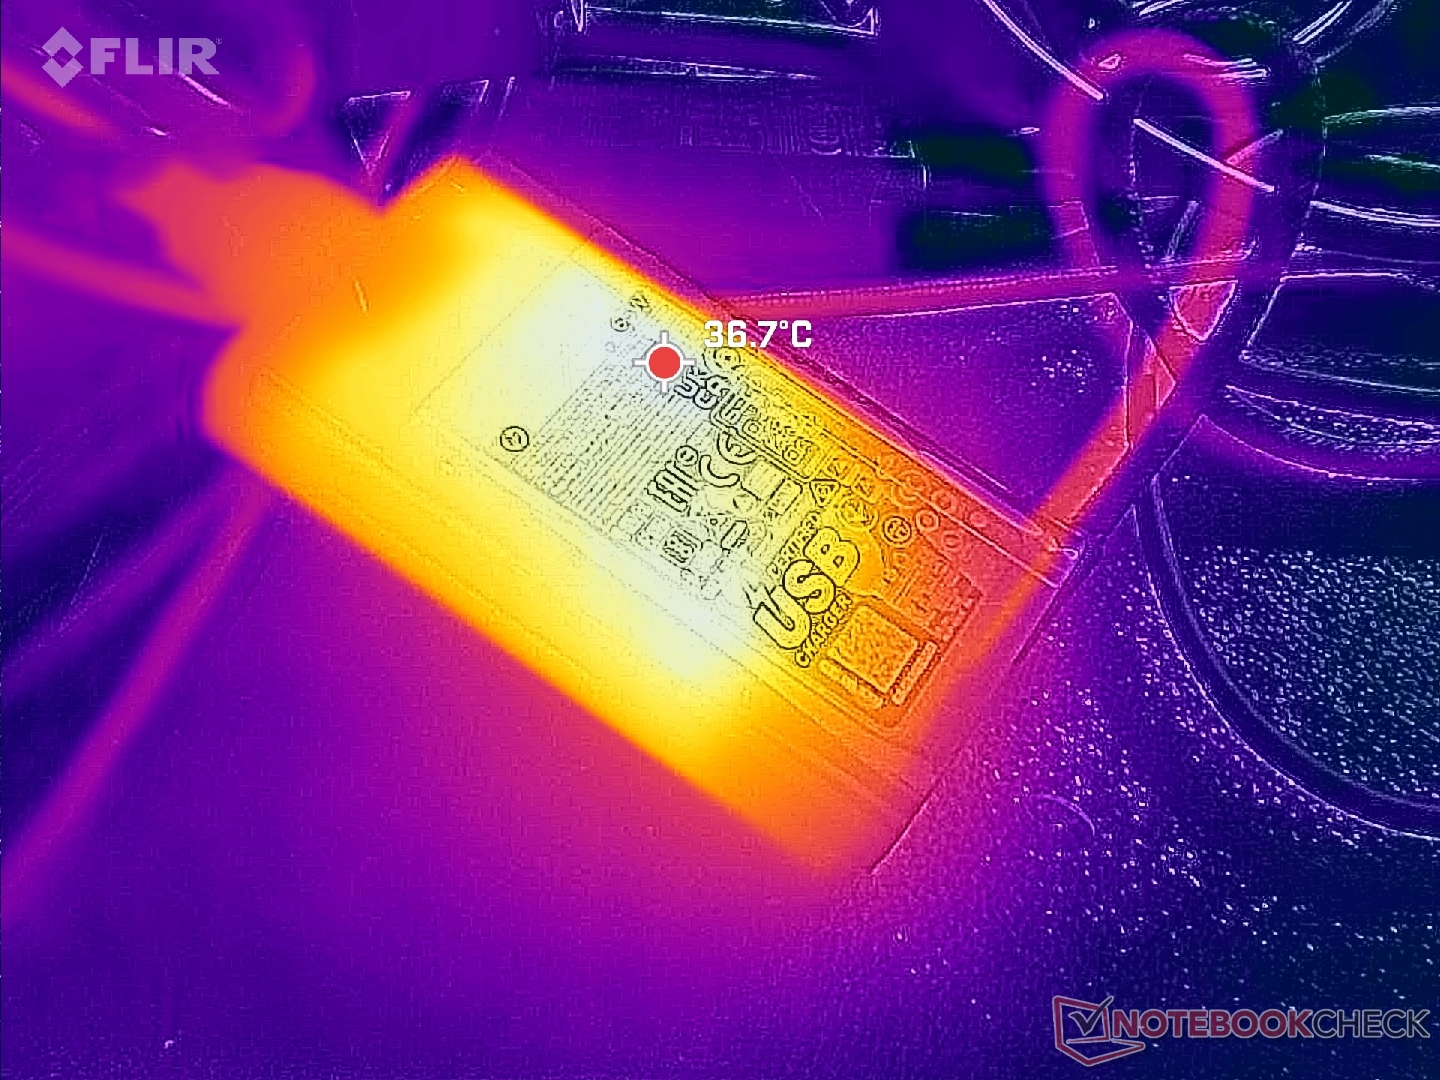
Siamo riusciti a misurare un assorbimento massimo temporaneo di 67 W dal piccolo (~9,8 x 5,3 x 2 cm) adattatore CA USB-C da 65 W.
| Off / Standby | |
| Idle | |
| Sotto carico |
|
Leggenda:
min: | |
| HP Dragonfly G4 i7-1365U, Iris Xe G7 96EUs, Micron 3400 MTFDKBA512TFH 512GB, IPS, 1920x1280, 13.5" | HP Elite Dragonfly G3 i7-1265U, Iris Xe G7 96EUs, Micron 3400 MTFDKBA512TFH 512GB, IPS, 1920x1280, 13.5" | Framework Laptop 13.5 13th Gen Intel i7-1370P, Iris Xe G7 96EUs, WD PC SN740 SDDPNQD-1T00, IPS, 2256x1504, 13.5" | Lenovo ThinkPad X13 G3 21CM002UGE R5 PRO 6650U, Radeon 660M, Samsung PM9A1 MZVL2512HCJQ, IPS LED, 1920x1200, 13.3" | Dell Latitude 9330 i7-1260U, Iris Xe G7 96EUs, , IPS, 2560x1600, 13.3" | Apple MacBook Air M2 Entry M2, M2 8-Core GPU, Apple SSD AP0256Z, IPS, 2560x1664, 13.6" | |
|---|---|---|---|---|---|---|
| Power Consumption | 5% | -13% | 18% | 2% | 20% | |
| Idle Minimum * (Watt) | 4.1 | 3.4 17% | 2.9 29% | 3.2 22% | 4.7 -15% | 1.87 54% |
| Idle Average * (Watt) | 7.5 | 5.6 25% | 6.3 16% | 5.2 31% | 8.2 -9% | 9.2 -23% |
| Idle Maximum * (Watt) | 8.2 | 8.4 -2% | 9.9 -21% | 6.1 26% | 8.4 -2% | 9.3 -13% |
| Load Average * (Watt) | 35.5 | 40.8 -15% | 56.2 -58% | 33.6 5% | 36.8 -4% | 28.5 20% |
| Witcher 3 ultra * (Watt) | 37.5 | 35.5 5% | 56.6 -51% | 39.3 -5% | 30.4 19% | 27.4 27% |
| Load Maximum * (Watt) | 66.5 | 68.4 -3% | 60.8 9% | 49.1 26% | 49.9 25% | 31 53% |
* ... Meglio usare valori piccoli
Power Consumption Witcher 3 / Stresstest
Power Consumption external Monitor
Durata della batteria
La capacità della batteria rimane la stessa del Dragonfly G3 con 68 Wh. Il tempo di funzionamento della WLAN, tuttavia, è più lungo per il nuovo modello, per un totale di quasi 16 ore prima dello spegnimento automatico. Si tratta di diverse ore in più rispetto alla maggior parte degli altri portatili Windows ed è paragonabile a quella del MacBook Air M2.
La ricarica da vuoto a pieno regime richiede circa 90 minuti.
| HP Dragonfly G4 i7-1365U, Iris Xe G7 96EUs, 68 Wh | HP Elite Dragonfly G3 i7-1265U, Iris Xe G7 96EUs, 68 Wh | Framework Laptop 13.5 13th Gen Intel i7-1370P, Iris Xe G7 96EUs, 61 Wh | Lenovo ThinkPad X13 G3 21CM002UGE R5 PRO 6650U, Radeon 660M, 54.7 Wh | Dell Latitude 9330 i7-1260U, Iris Xe G7 96EUs, 50 Wh | Apple MacBook Air M2 Entry M2, M2 8-Core GPU, 52.6 Wh | |
|---|---|---|---|---|---|---|
| Autonomia della batteria | -9% | -45% | -37% | -44% | -15% | |
| Reader / Idle (h) | 42.5 | 37.8 -11% | 15.4 -64% | |||
| WiFi v1.3 (h) | 15.9 | 11.8 -26% | 8.8 -45% | 12.5 -21% | 9.4 -41% | 15.2 -4% |
| Load (h) | 3.2 | 3.5 9% | 1.5 -53% | 2.3 -28% | 2.4 -25% | |
| H.264 (h) | 16.5 |
Pro
Contro
Verdetto - Solo un piccolo incremento da parte di Intel di 13a generazione
Proprio come i nostri risultati per il 2023 Dell XPS 13 Plusil Dragonfly G4 del 2023 è solo un aggiornamento minore rispetto all'Elite Dragonfly G3 dello scorso anno Elite Dragonfly G3. Così piccolo, infatti, che la maggior parte degli utenti difficilmente noterà il piccolo salto di prestazioni tra le CPU di 12a generazione del Dragonfly G3 e le opzioni di 13a generazione del Dragonfly G4. Altri aspetti del modello, come le opzioni di visualizzazione, non sono cambiati, mentre il nuovo software Power Manager non è una novità assoluta.
Il Dragonfly G4 è un aggiornamento minore del già eccellente Dragonfly G3. Tuttavia, se la nuova CPU non è interessante, il Dragonfly G3 può offrire essenzialmente la stessa esperienza.
I piccoli aggiornamenti di quest'anno non sono inaspettati, dato che il Dragonfly G3 era già stato completamente riprogettato e ha appena un anno. Abbiamo lodato il Dragonfly G3 per la sua funzionalità, le sue caratteristiche e il suo aspetto e il Dragonfly G4 non fa che rafforzare questi punti di forza. Gli acquirenti interessati potrebbero quindi prendere in considerazione il meno costoso Dragonfly G3 del 2022, dato che il Dragonfly G4 del 2023 non offre molto di più. Per un maggiore incremento delle prestazioni, gli utenti potrebbero prendere in considerazione il modelloFramework 13.5 oAsus Zenbook S 13 ognuno dei quali offre opzioni di CPU che vanno oltre la serie Core-U.
Prezzo e disponibilità
HP distribuisce il Dragonfly G4 a partire da 1300 dollari per la configurazione base con Core i5 e 1280p, fino a 2400 dollari per la configurazione completa.
HP Dragonfly G4
- 07/18/2023 v7 (old)
Allen Ngo
Transparency
La selezione dei dispositivi da recensire viene effettuata dalla nostra redazione. Il campione di prova è stato fornito all'autore come prestito dal produttore o dal rivenditore ai fini di questa recensione. L'istituto di credito non ha avuto alcuna influenza su questa recensione, né il produttore ne ha ricevuto una copia prima della pubblicazione. Non vi era alcun obbligo di pubblicare questa recensione. In quanto società mediatica indipendente, Notebookcheck non è soggetta all'autorità di produttori, rivenditori o editori.
Ecco come Notebookcheck esegue i test
Ogni anno, Notebookcheck esamina in modo indipendente centinaia di laptop e smartphone utilizzando procedure standardizzate per garantire che tutti i risultati siano comparabili. Da circa 20 anni sviluppiamo continuamente i nostri metodi di prova e nel frattempo stabiliamo gli standard di settore. Nei nostri laboratori di prova, tecnici ed editori esperti utilizzano apparecchiature di misurazione di alta qualità. Questi test comportano un processo di validazione in più fasi. Il nostro complesso sistema di valutazione si basa su centinaia di misurazioni e parametri di riferimento ben fondati, che mantengono l'obiettività.Price comparison

