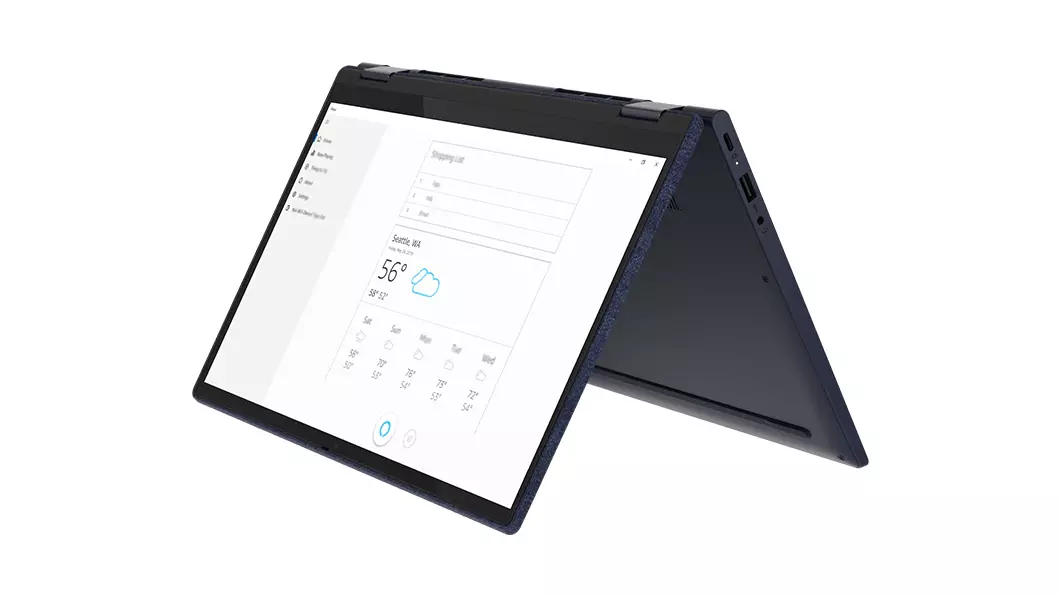
AMD Ryzen 7 5700U contro Ryzen 5 5500U: Recensione del convertibile Lenovo Yoga 6 13
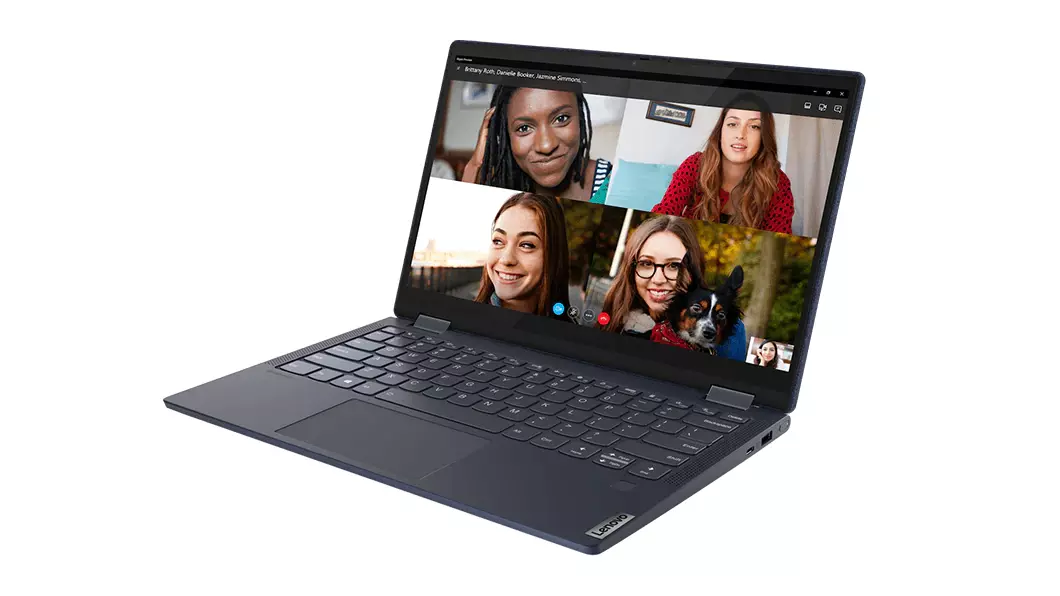
Quando abbiamo recensito il Lenovo Yoga 6 13 un paio di mesi fa, abbiamo trovato che offriva prestazioni migliori della media e un ottimo touchscreen 1080p per la sua categoria di fascia media. La nostra unità di prova era la configurazione di fascia più bassa, tuttavia, con "solo" la CPU Ryzen 5 5500U, 8 GB di RAM e 256 GB NVMe SSD per circa 800 dollari. Questa volta, abbiamo voluto controllare la configurazione di fascia più alta da 1000 dollari con la CPU Ryzen 7 5700U, 16 GB di RAM e 1 TB NVMe SSD per vedere cosa possono aspettarsi gli utenti se decidono di pagare un piccolo extra.
Raccomandiamo di controllare la nostra recensione esistente sul Ryzen 5 Yoga 6 13 in quanto tutti i nostri commenti sulla tastiera, il telaio e altre caratteristiche fisiche del modello si applicano ancora al Ryzen 7 Yoga 6 13. La serie media Yoga 6 si colloca tra il più economico budget IdeaPad Flex 3 serie e l'ammiraglia più costosa Serie Yoga 9.
Altre recensioni di Lenovo:
potential competitors in comparison
Punteggio | Data | Modello | Peso | Altezza | Dimensione | Risoluzione | Prezzo |
|---|---|---|---|---|---|---|---|
| 85 % v7 (old) | 10/2021 | Lenovo Yoga 6 13ALC6 R7 5700U, Vega 8 | 1.3 kg | 18.2 mm | 13.30" | 1920x1080 | |
| 84.7 % v7 (old) | 07/2021 | Lenovo Yoga 6 13 82ND0009US R5 5500U, Vega 7 | 1.3 kg | 18.2 mm | 13.30" | 1920x1080 | |
| 86.7 % v7 (old) | 10/2021 | Dell XPS 13 9310 2-in-1 i7-1165G7, Iris Xe G7 96EUs | 1.3 kg | 14.35 mm | 13.40" | 1920x1200 | |
| 85.7 % v7 (old) | 06/2021 | Acer Spin 3 SP313-51N-56YV i5-1135G7, Iris Xe G7 80EUs | 1.4 kg | 16 mm | 13.30" | 2560x1600 | |
| 83.7 % v7 (old) | 05/2021 | Lenovo IdeaPad Flex 5 CB 13IML05 82B80010GE i5-10210U, UHD Graphics 620 | 1.4 kg | 17.95 mm | 13.30" | 1920x1080 | |
| 85.5 % v7 (old) | 06/2020 | HP Envy x360 13-ay0010nr R5 4500U, Vega 6 | 1.3 kg | 16.4 mm | 13.30" | 1920x1080 |
Caso
Comunicazione
Webcam


Manutenzione
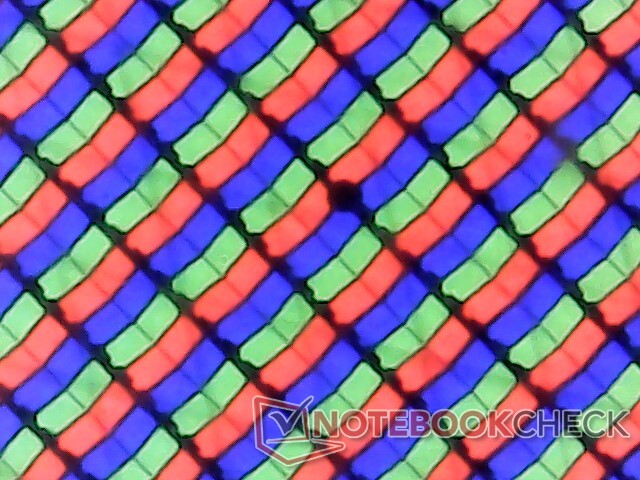
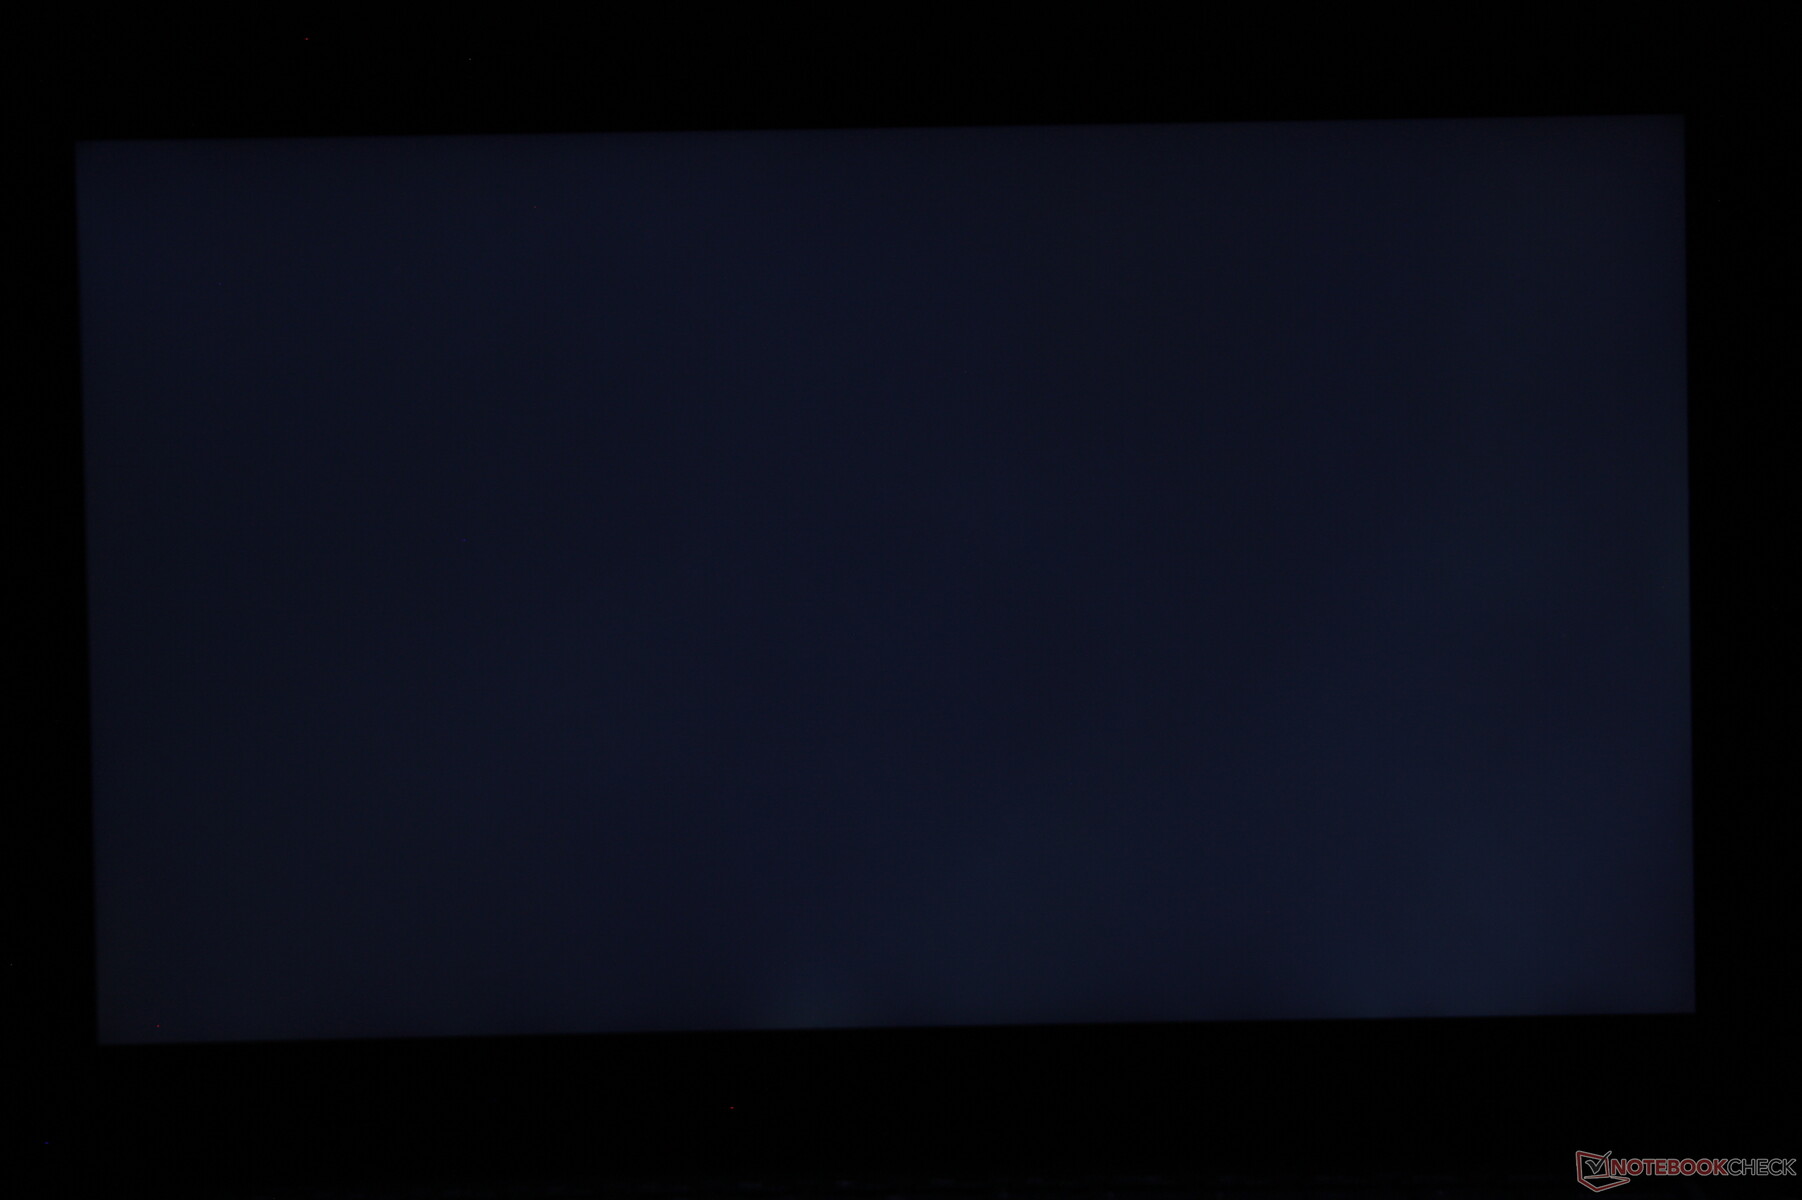
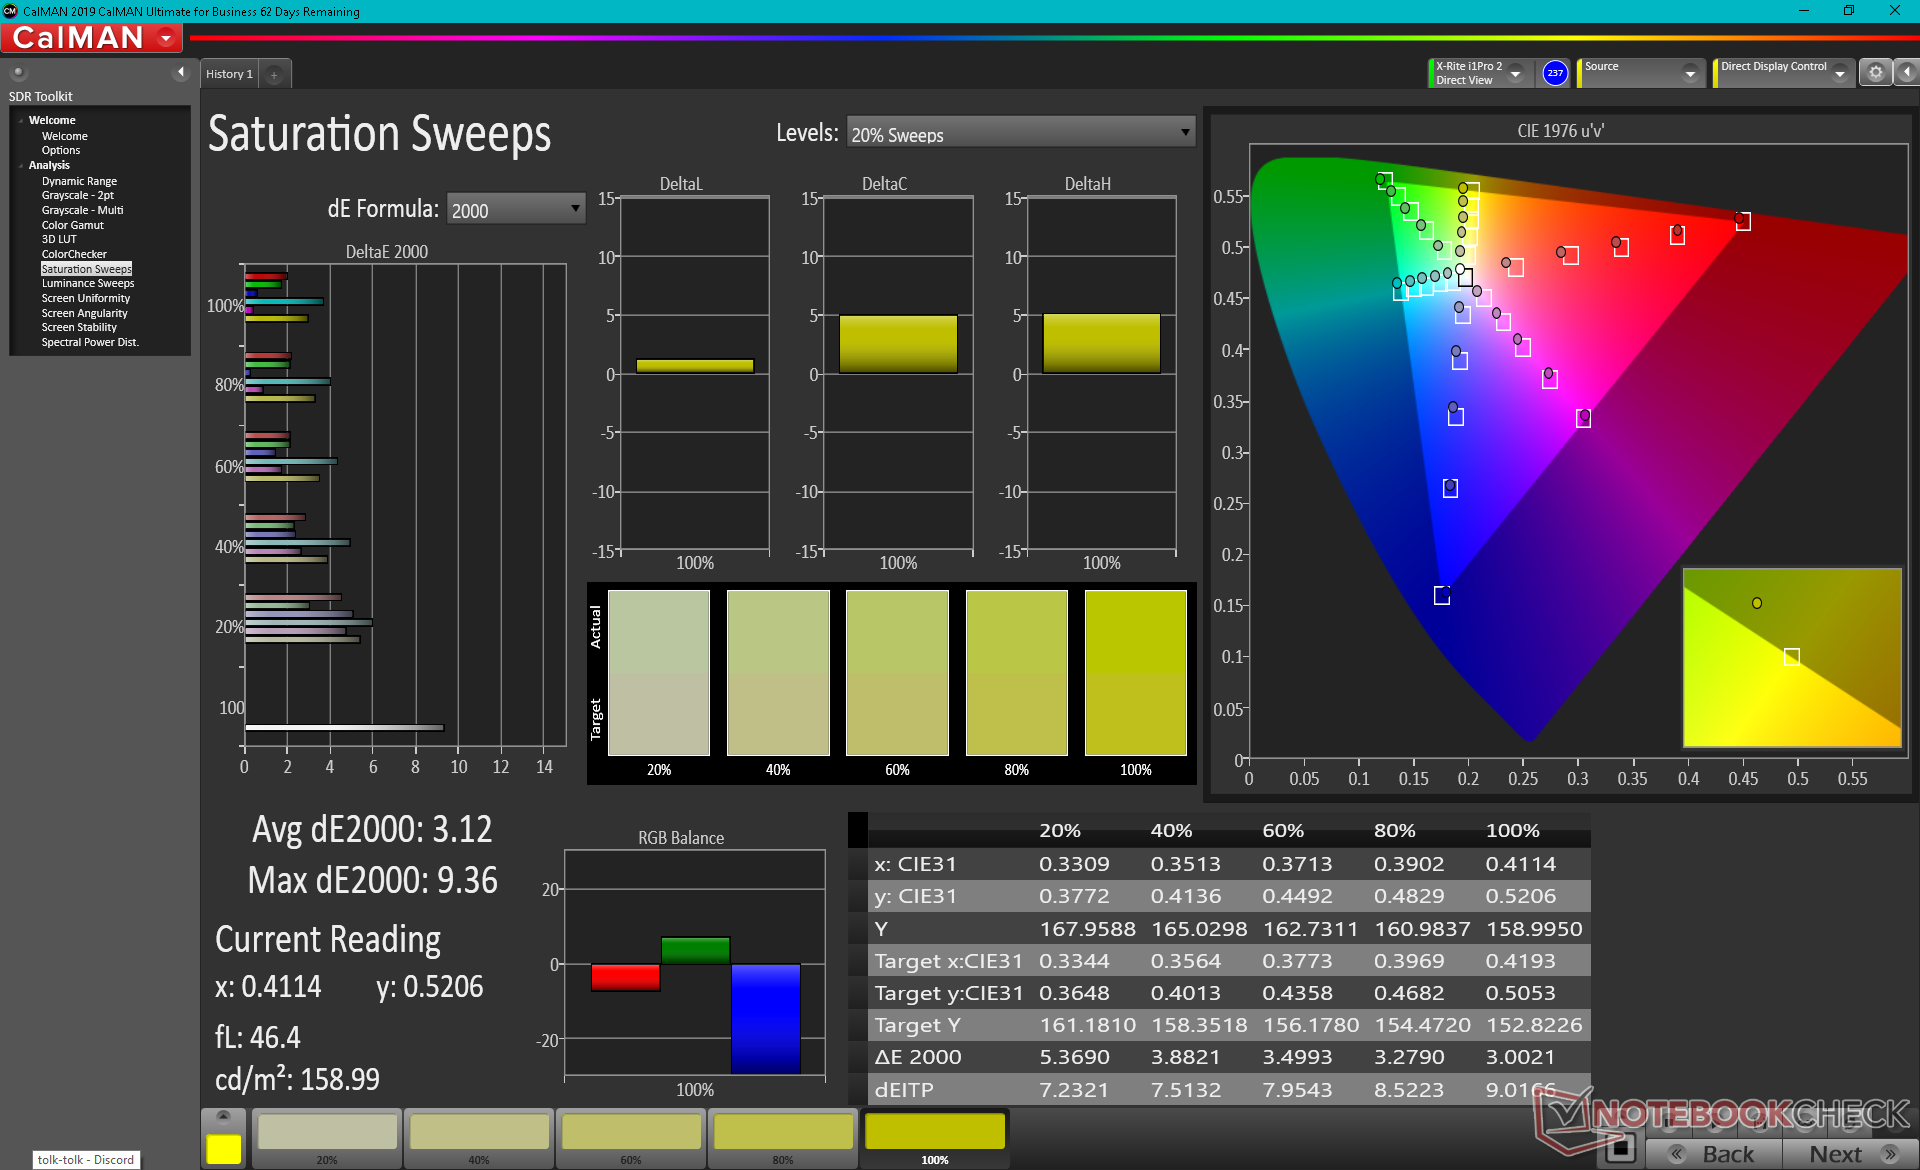
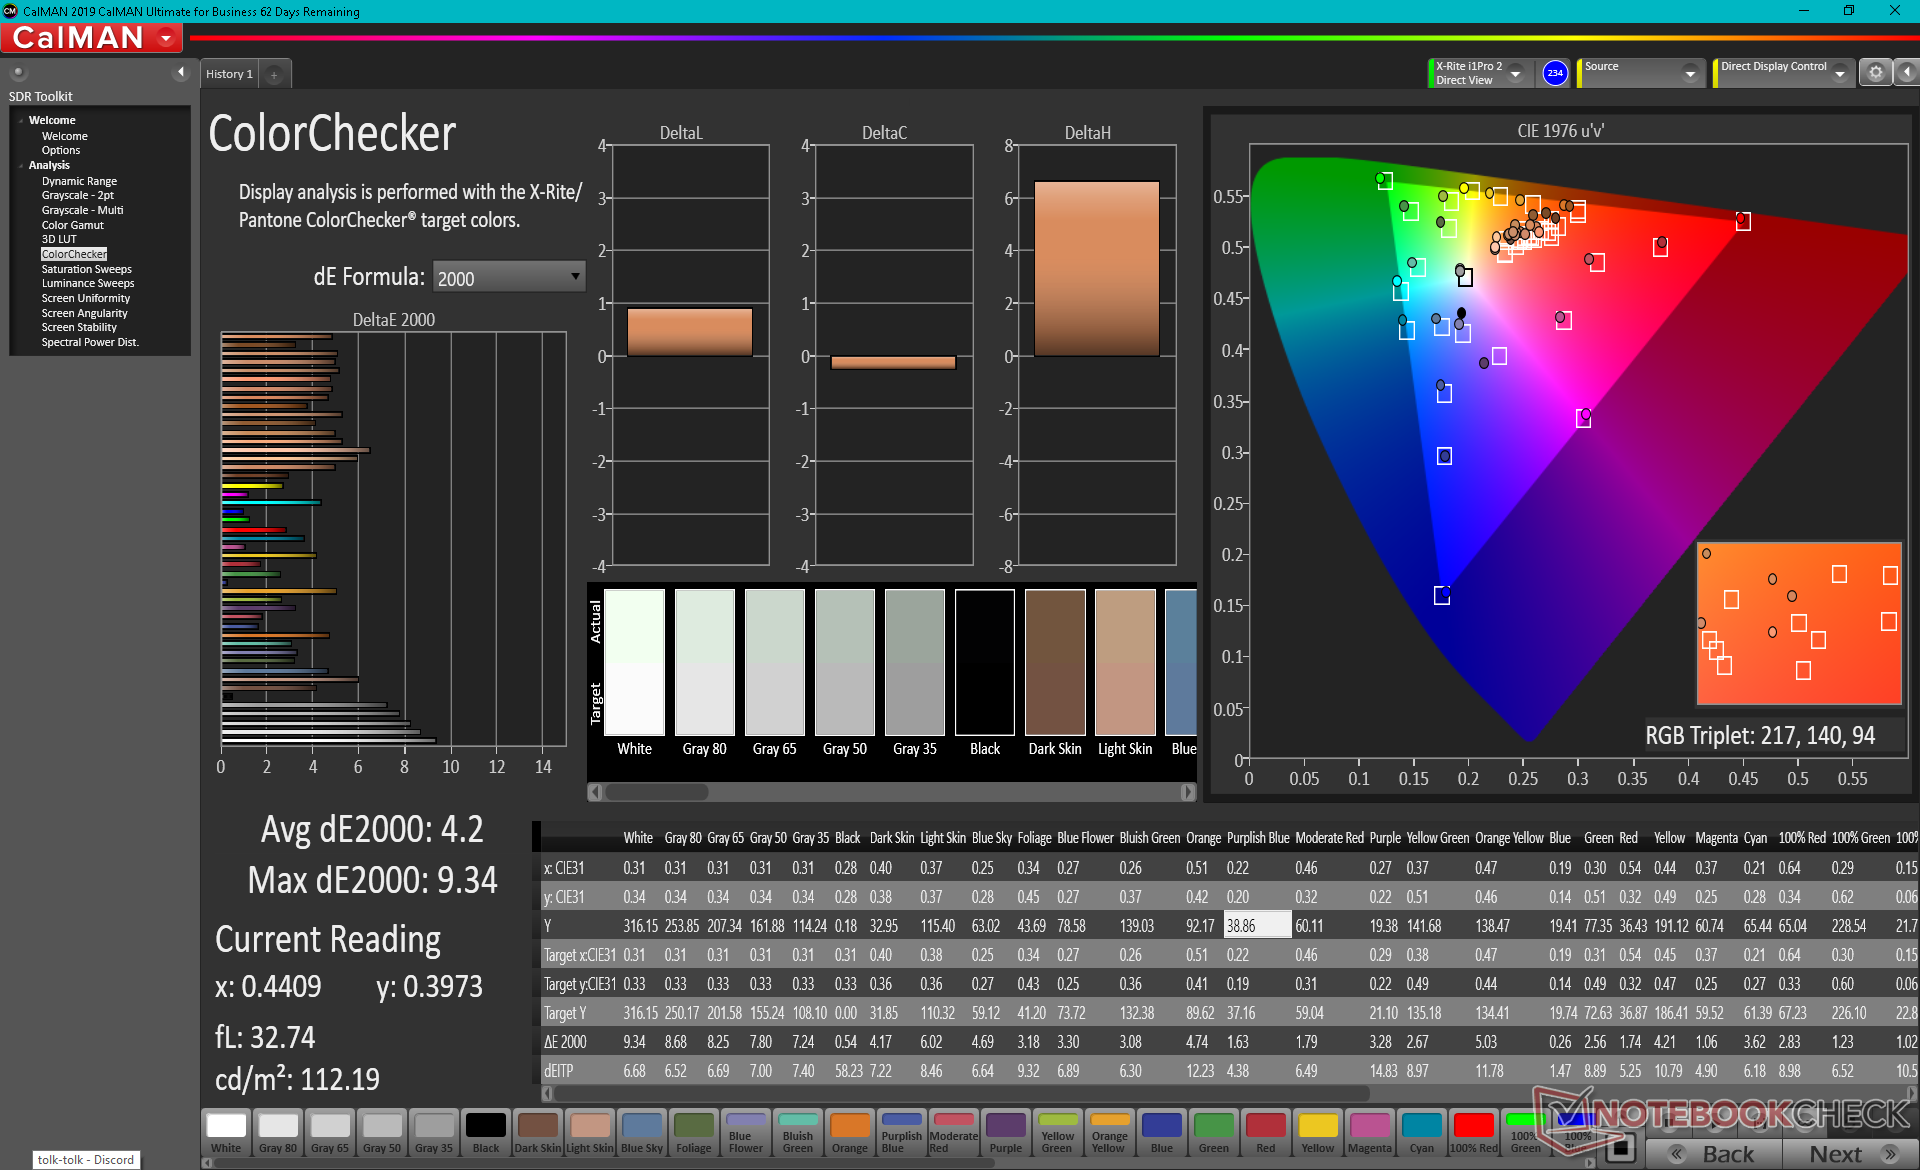
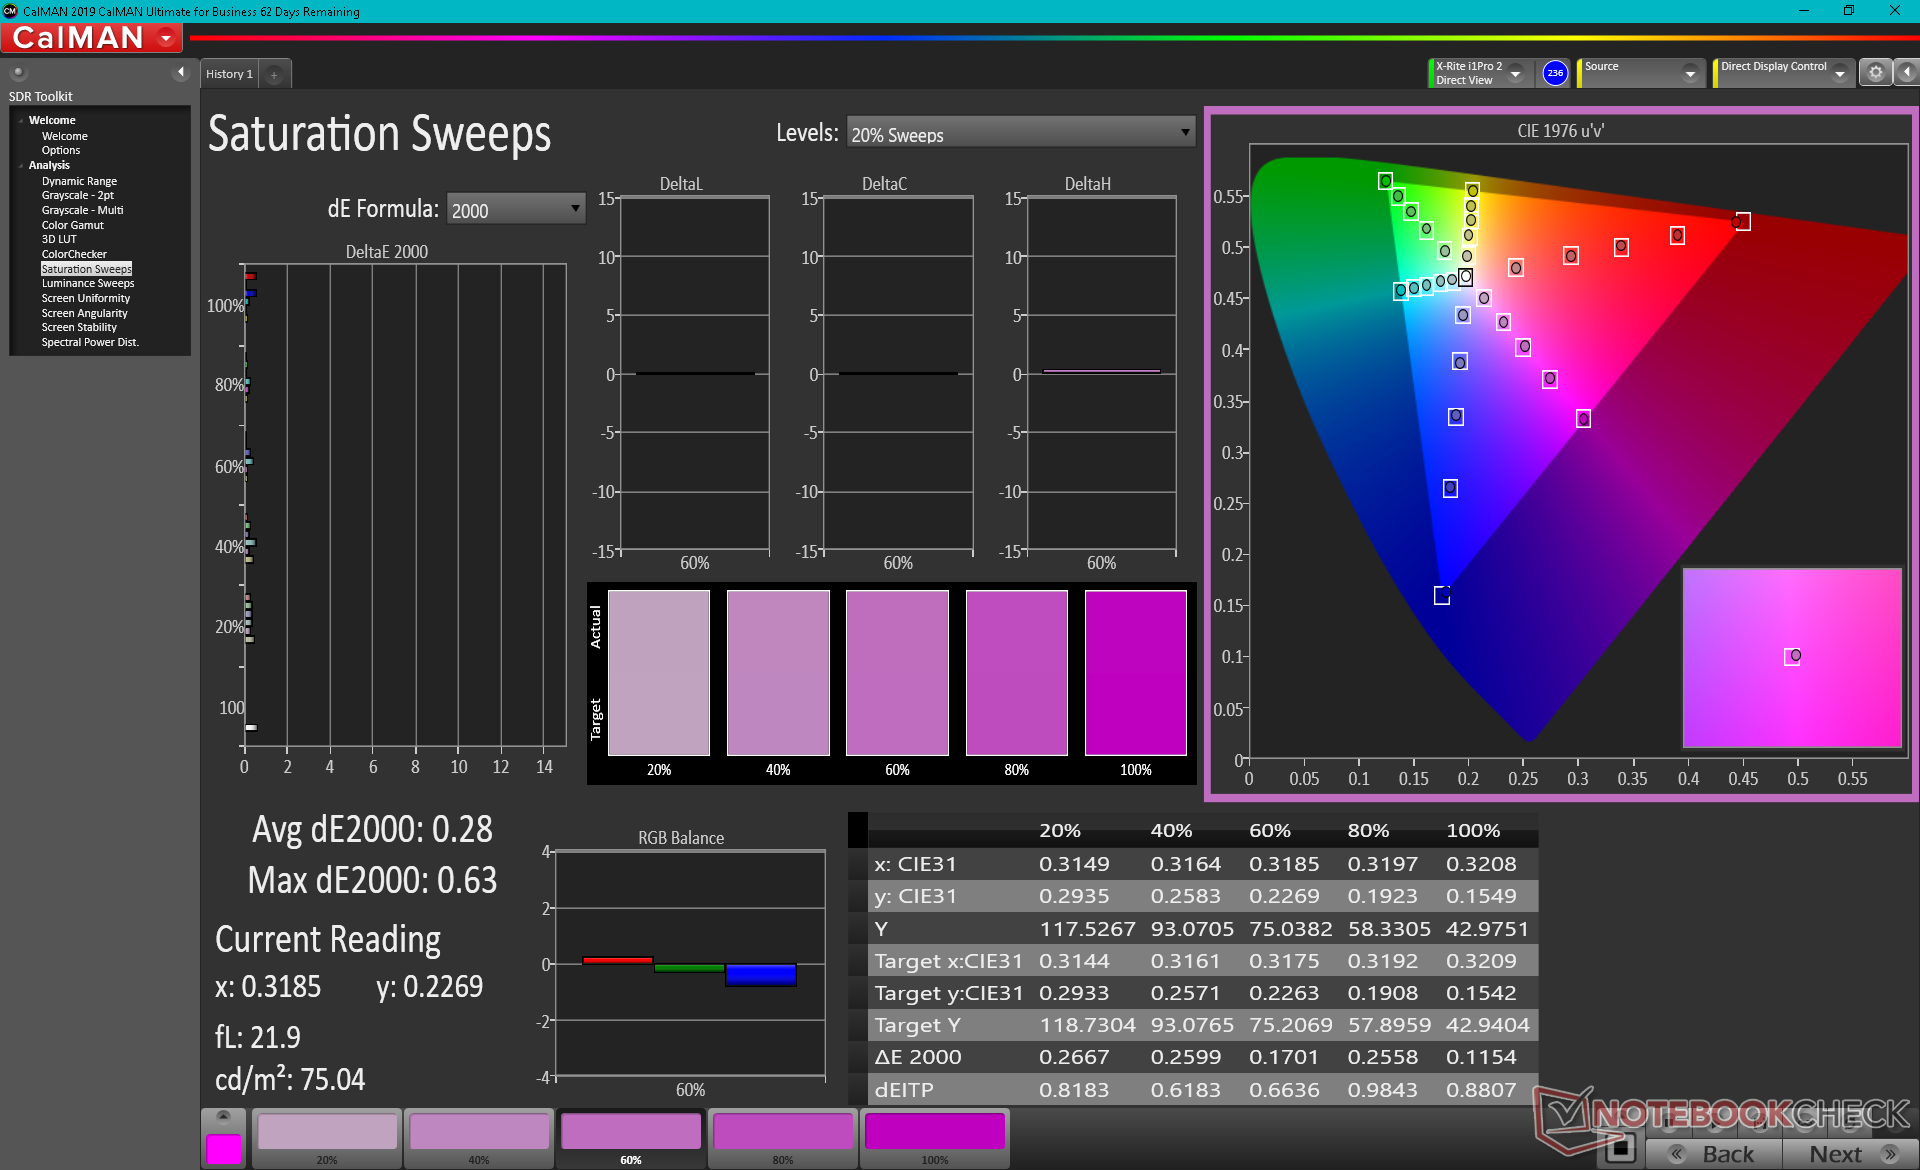
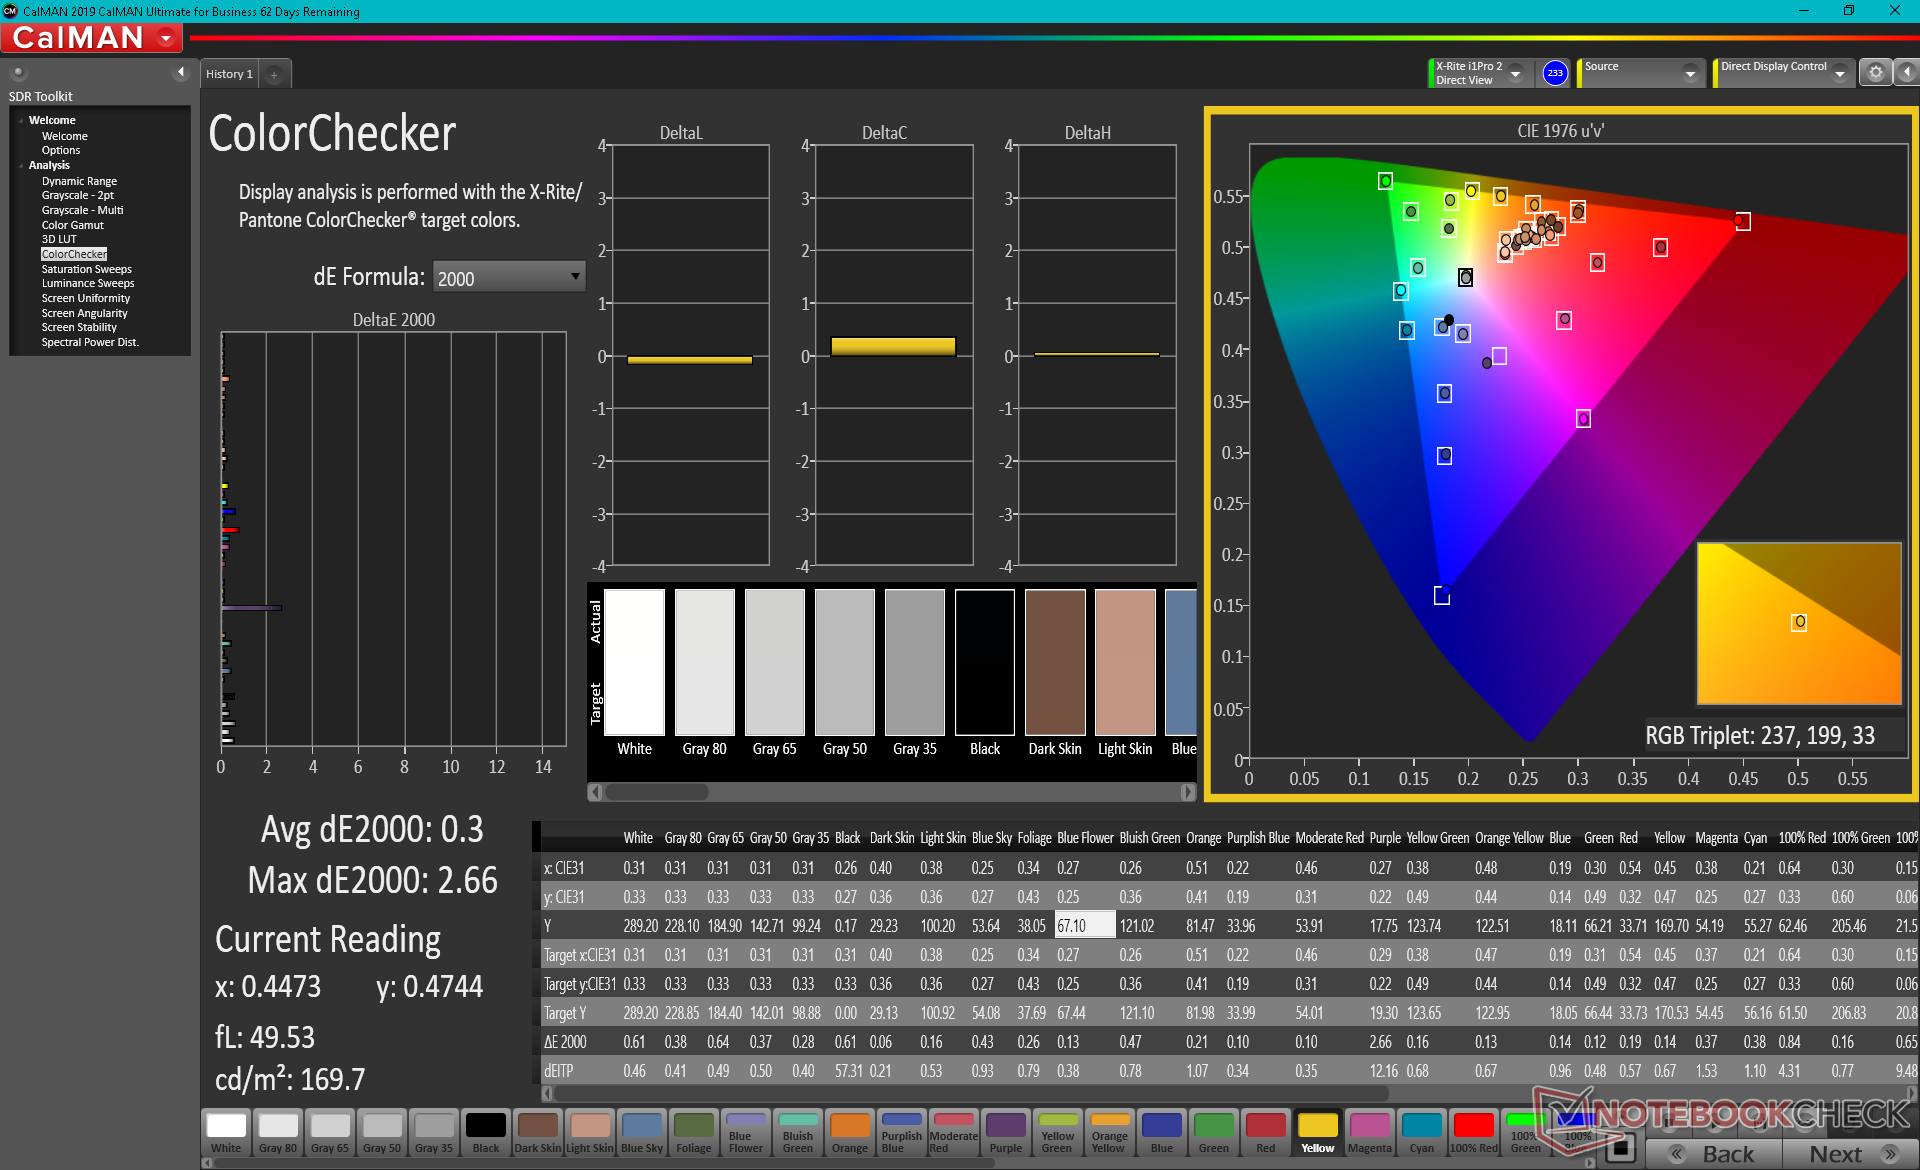
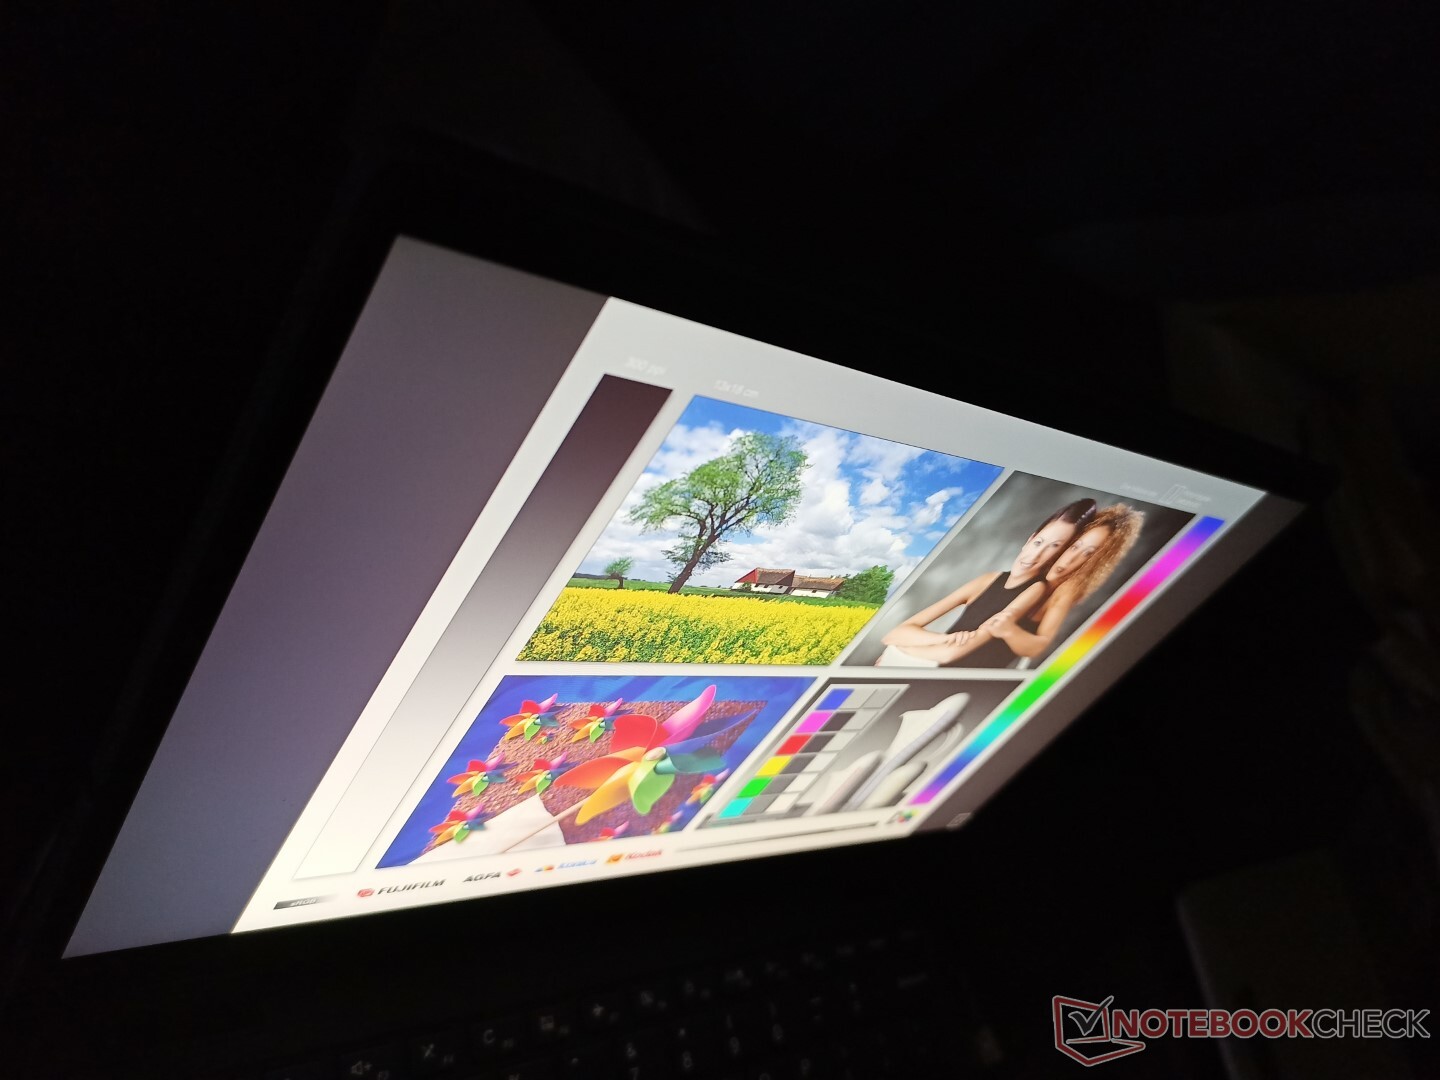
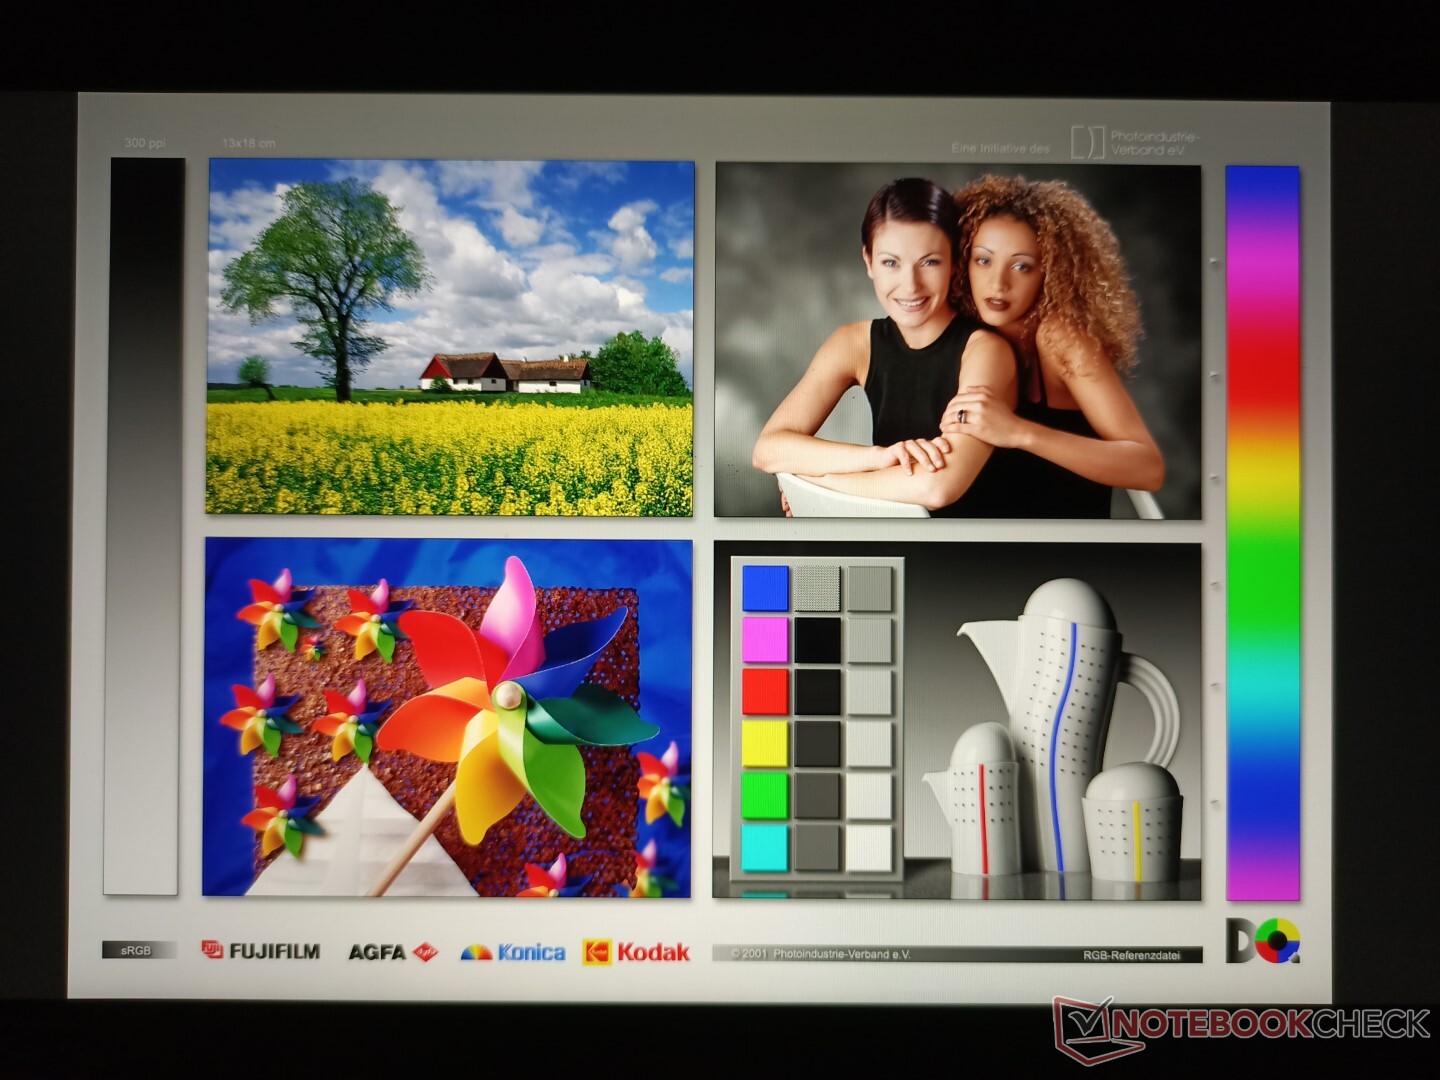
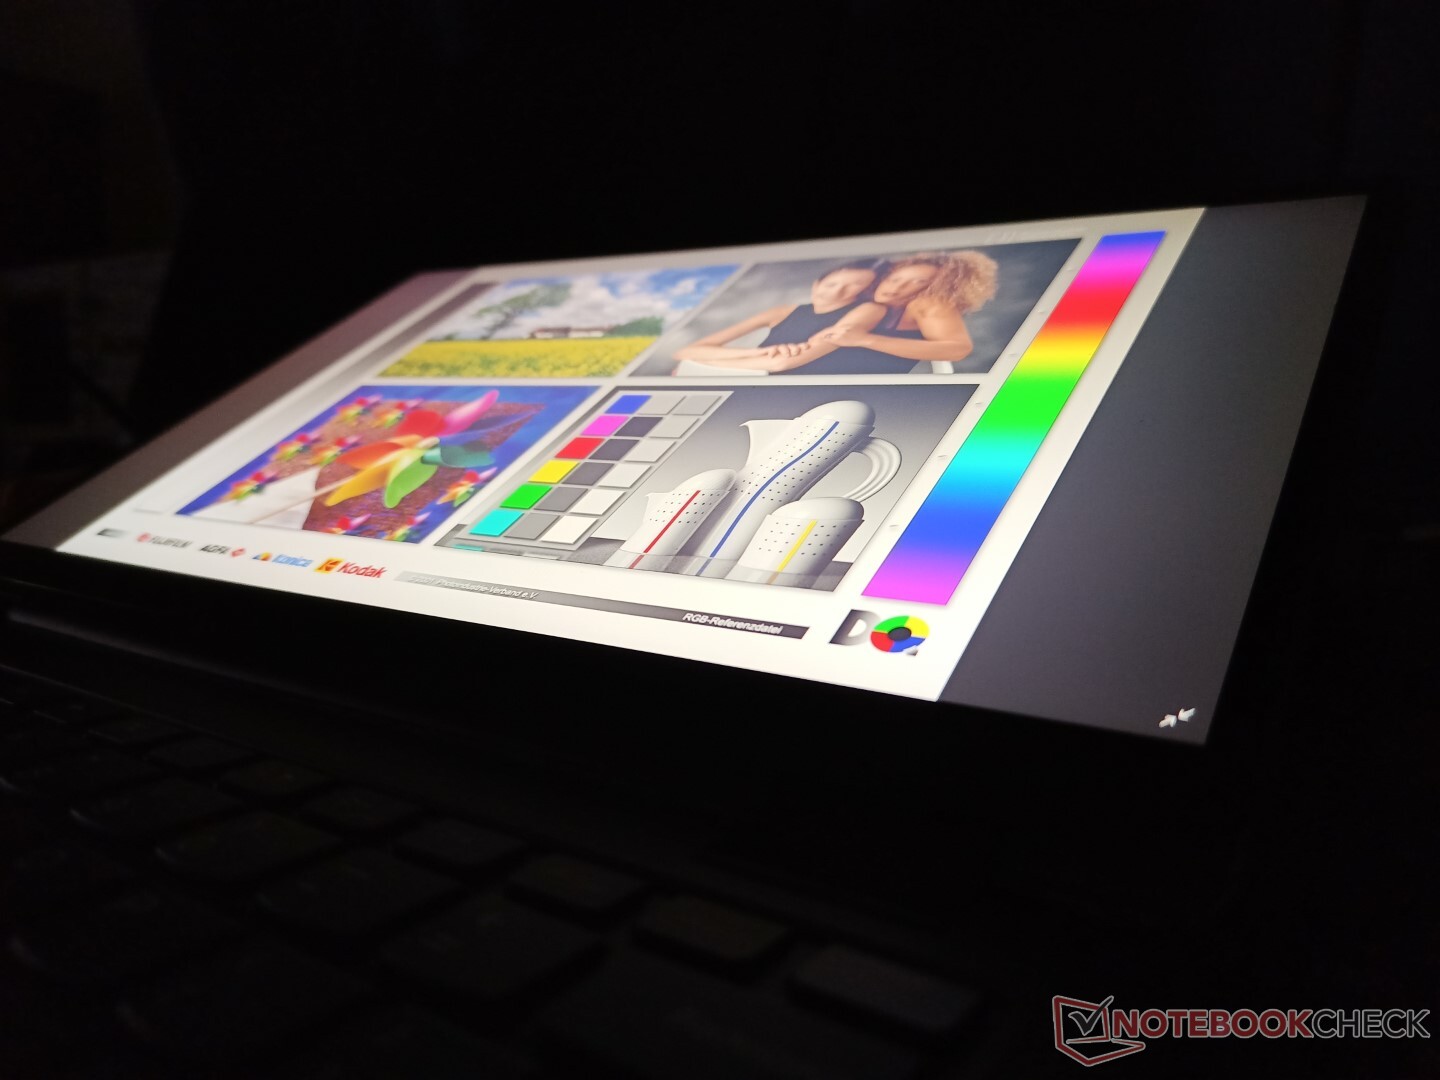
Display - Sharp con copertura completa sRGB
Lenovo usa lo stesso AU Optronics B133HAN05.F 1080p IPS touchscreen per tutte le sue attuali SKU Yoga 6 13. Sia la copertura del colore (>99 per cento sRGB) che il contrasto (~1500:1) sono eccellenti e migliori del previsto per un convertibile di fascia media, ma i tempi di risposta sono relativamente lenti per un ghosting evidente soprattutto se si gioca. La luminosità massima di circa 300 nits è decente per il prezzo mentre alternative più costose come l XPS 13 9310 2-in-1 o HP Envy x360 13 sono notevolmente più luminosi per una visione esterna più confortevole.
| |||||||||||||||||||||||||
Distribuzione della luminosità: 95 %
Al centro con la batteria: 319.6 cd/m²
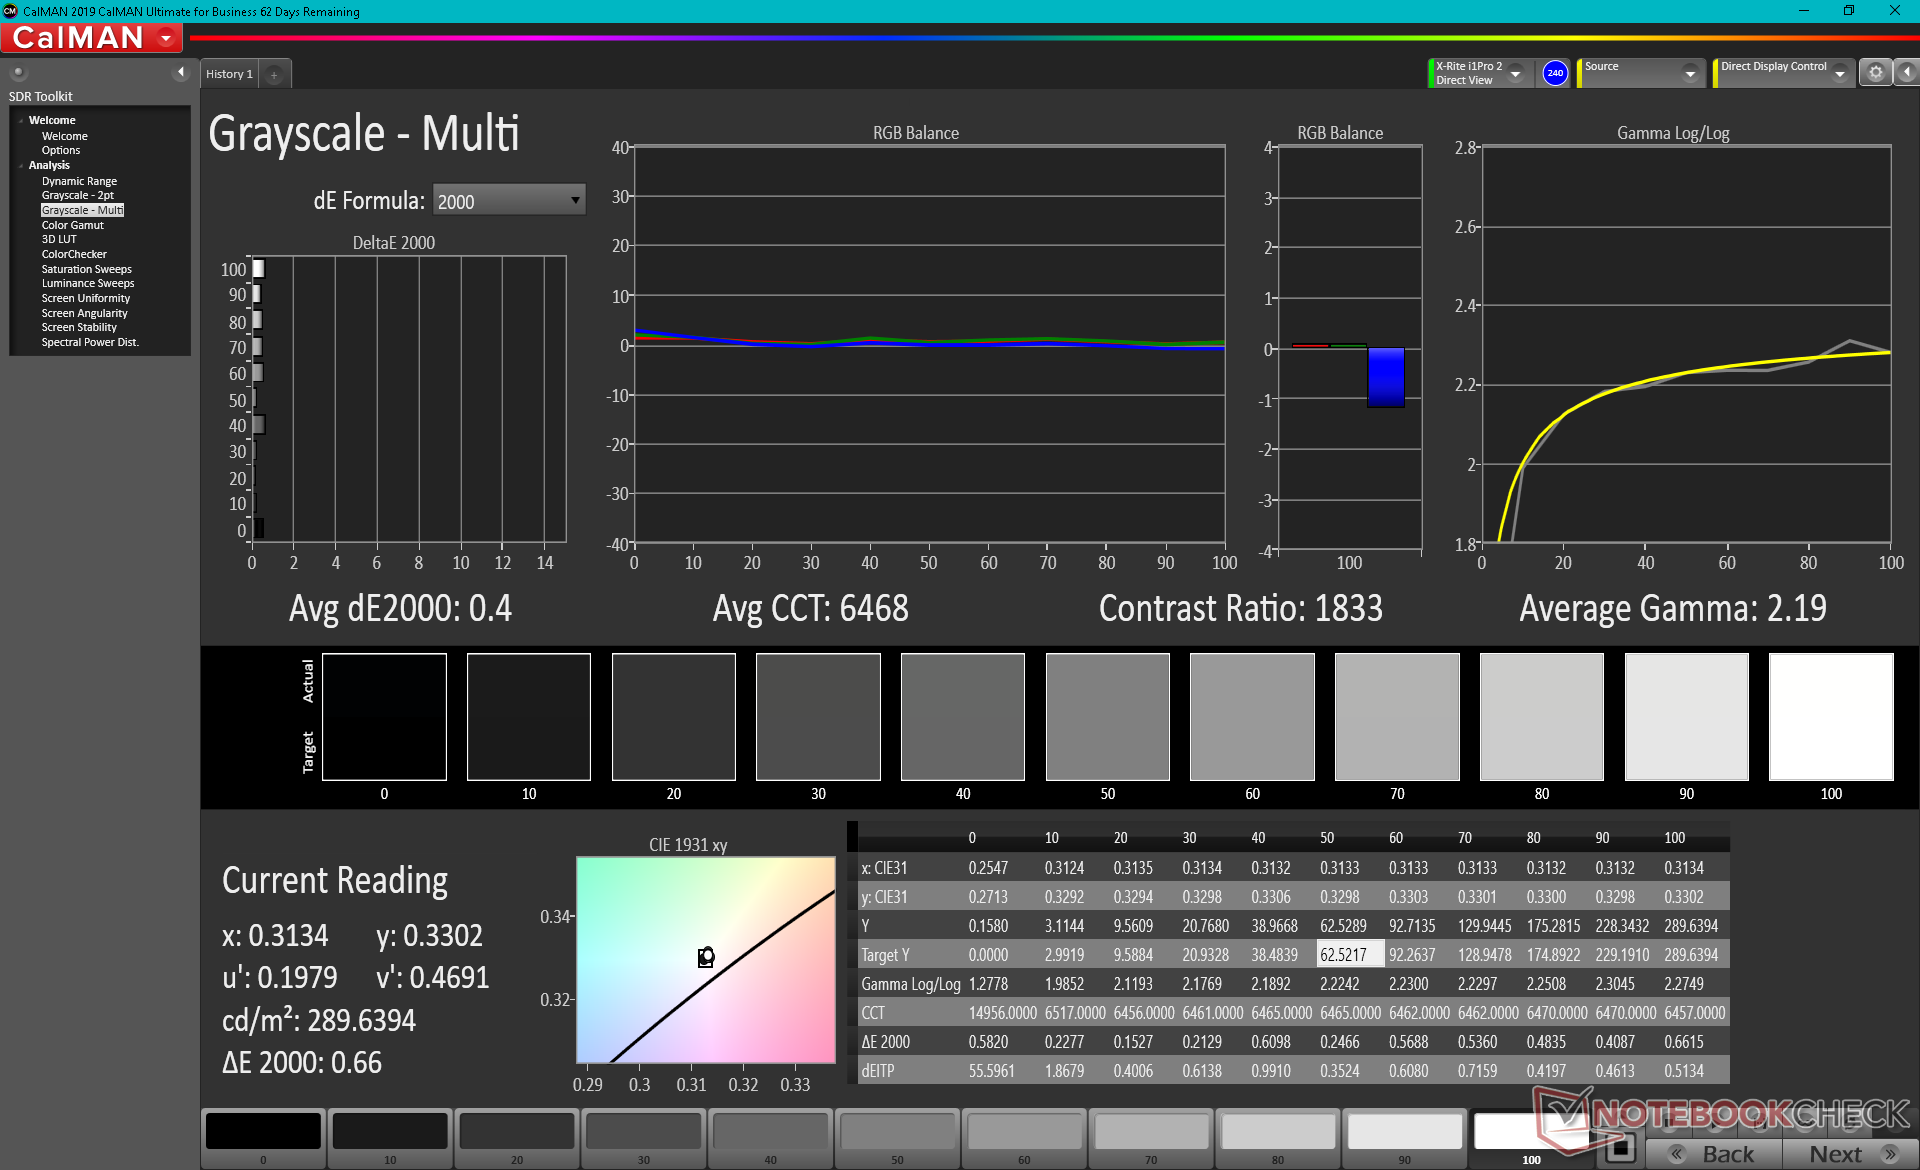
Contrasto: 1598:1 (Nero: 0.2 cd/m²)
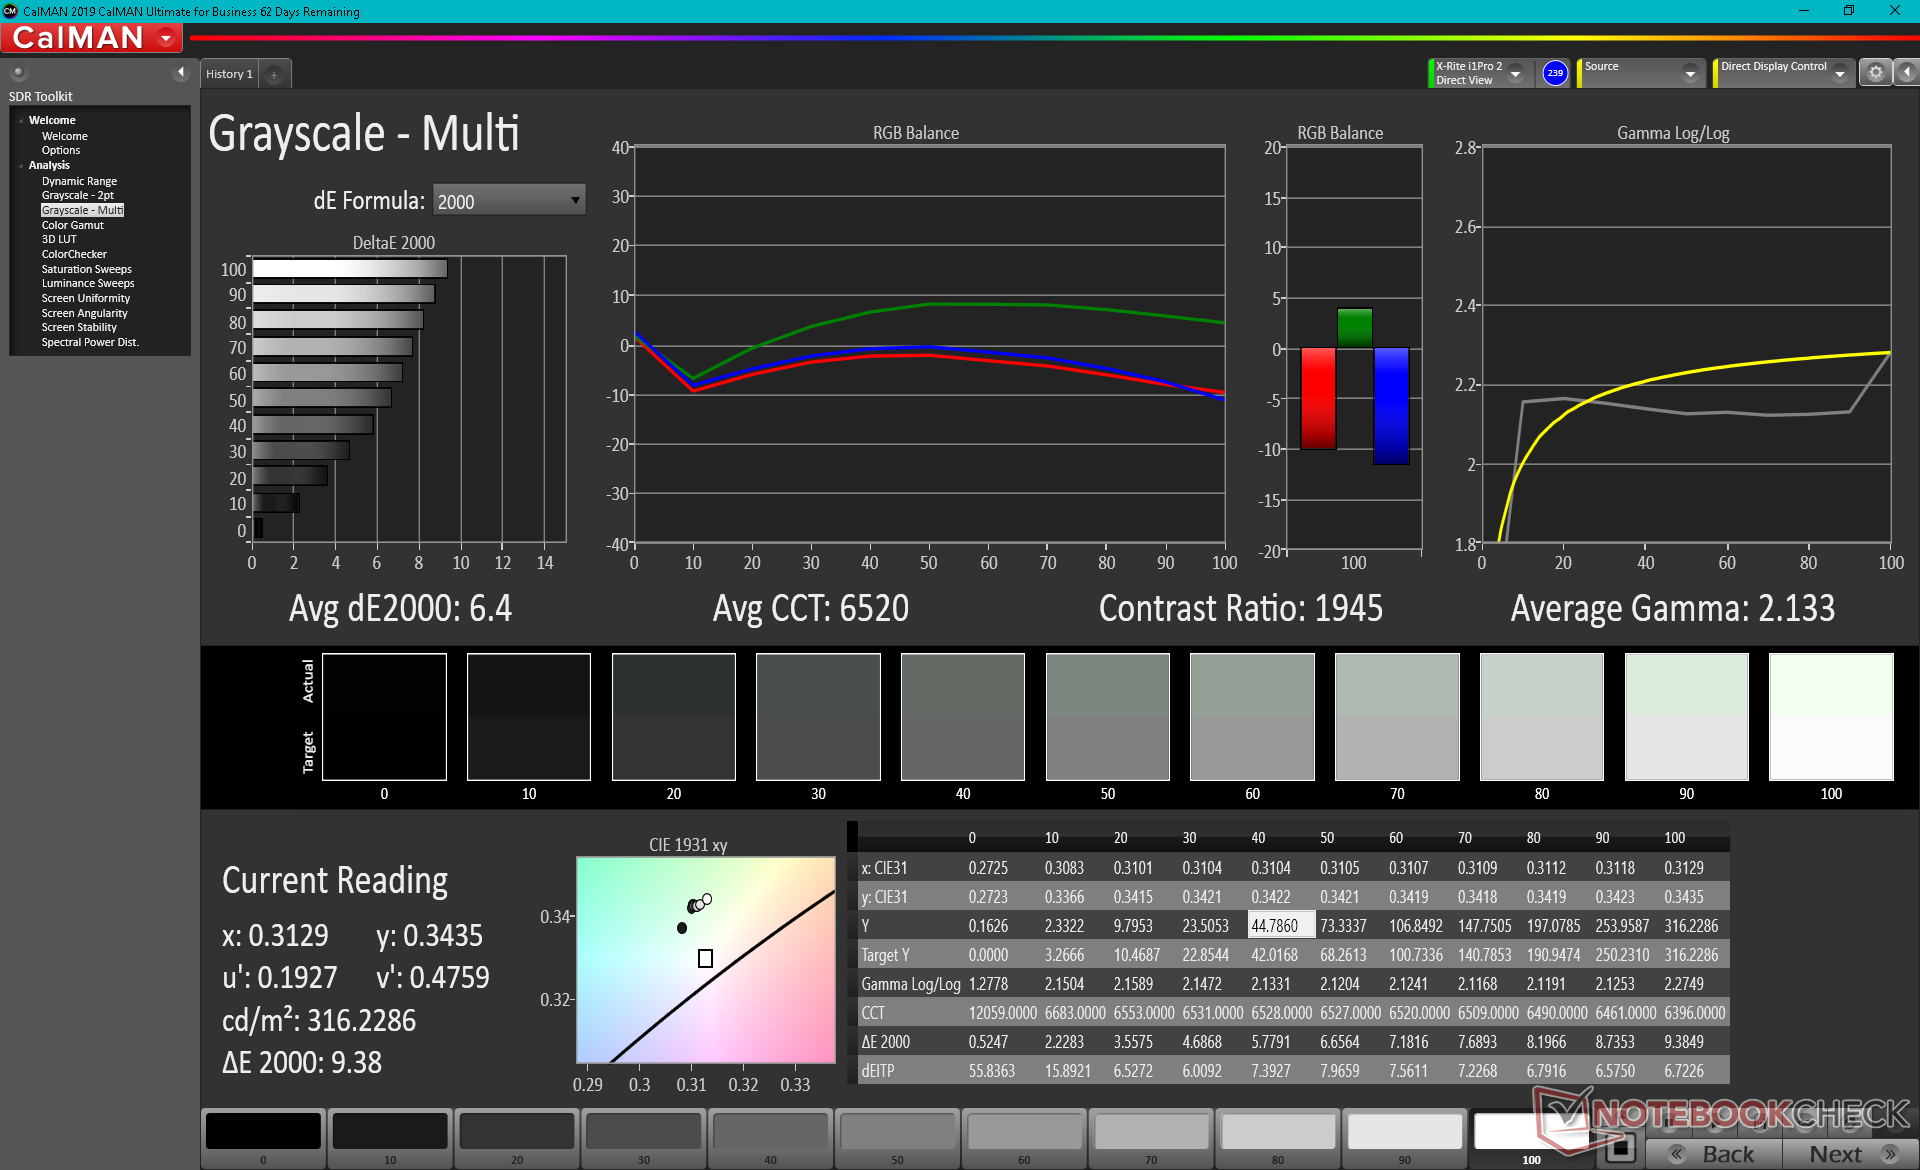
ΔE ColorChecker Calman: 4.2 | ∀{0.5-29.43 Ø4.73}
calibrated: 0.3
ΔE Greyscale Calman: 6.4 | ∀{0.09-98 Ø4.97}
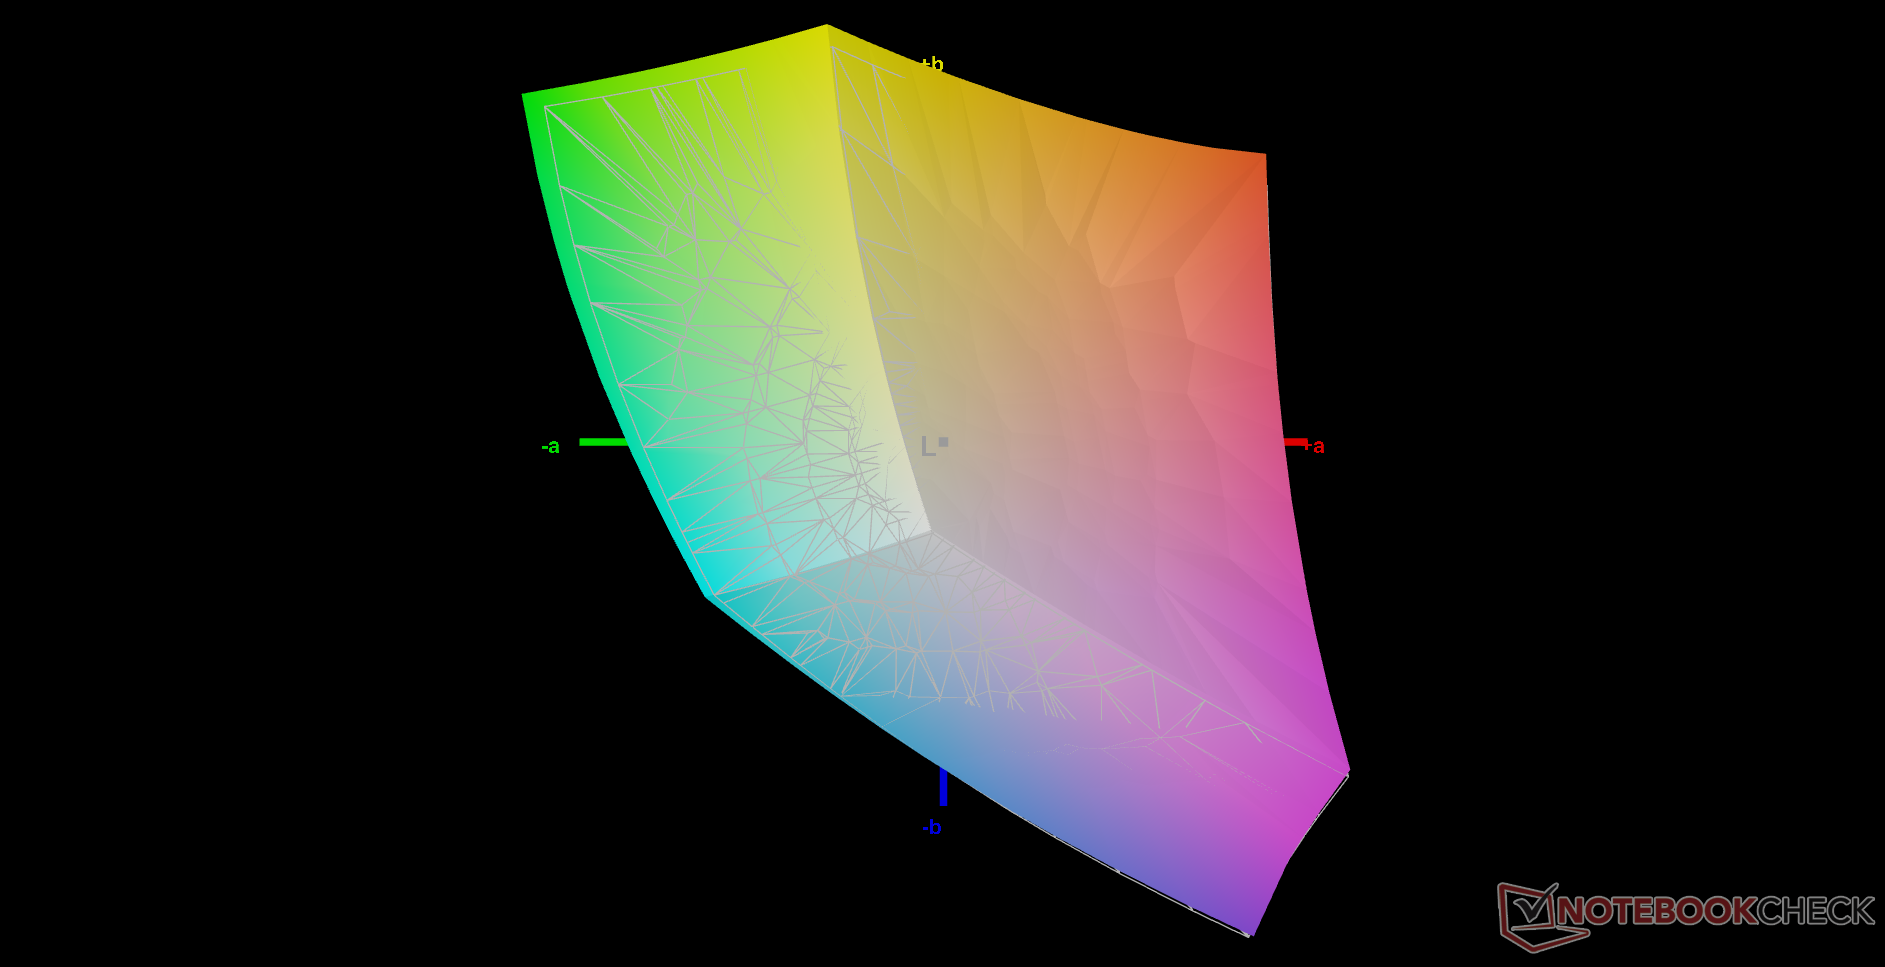
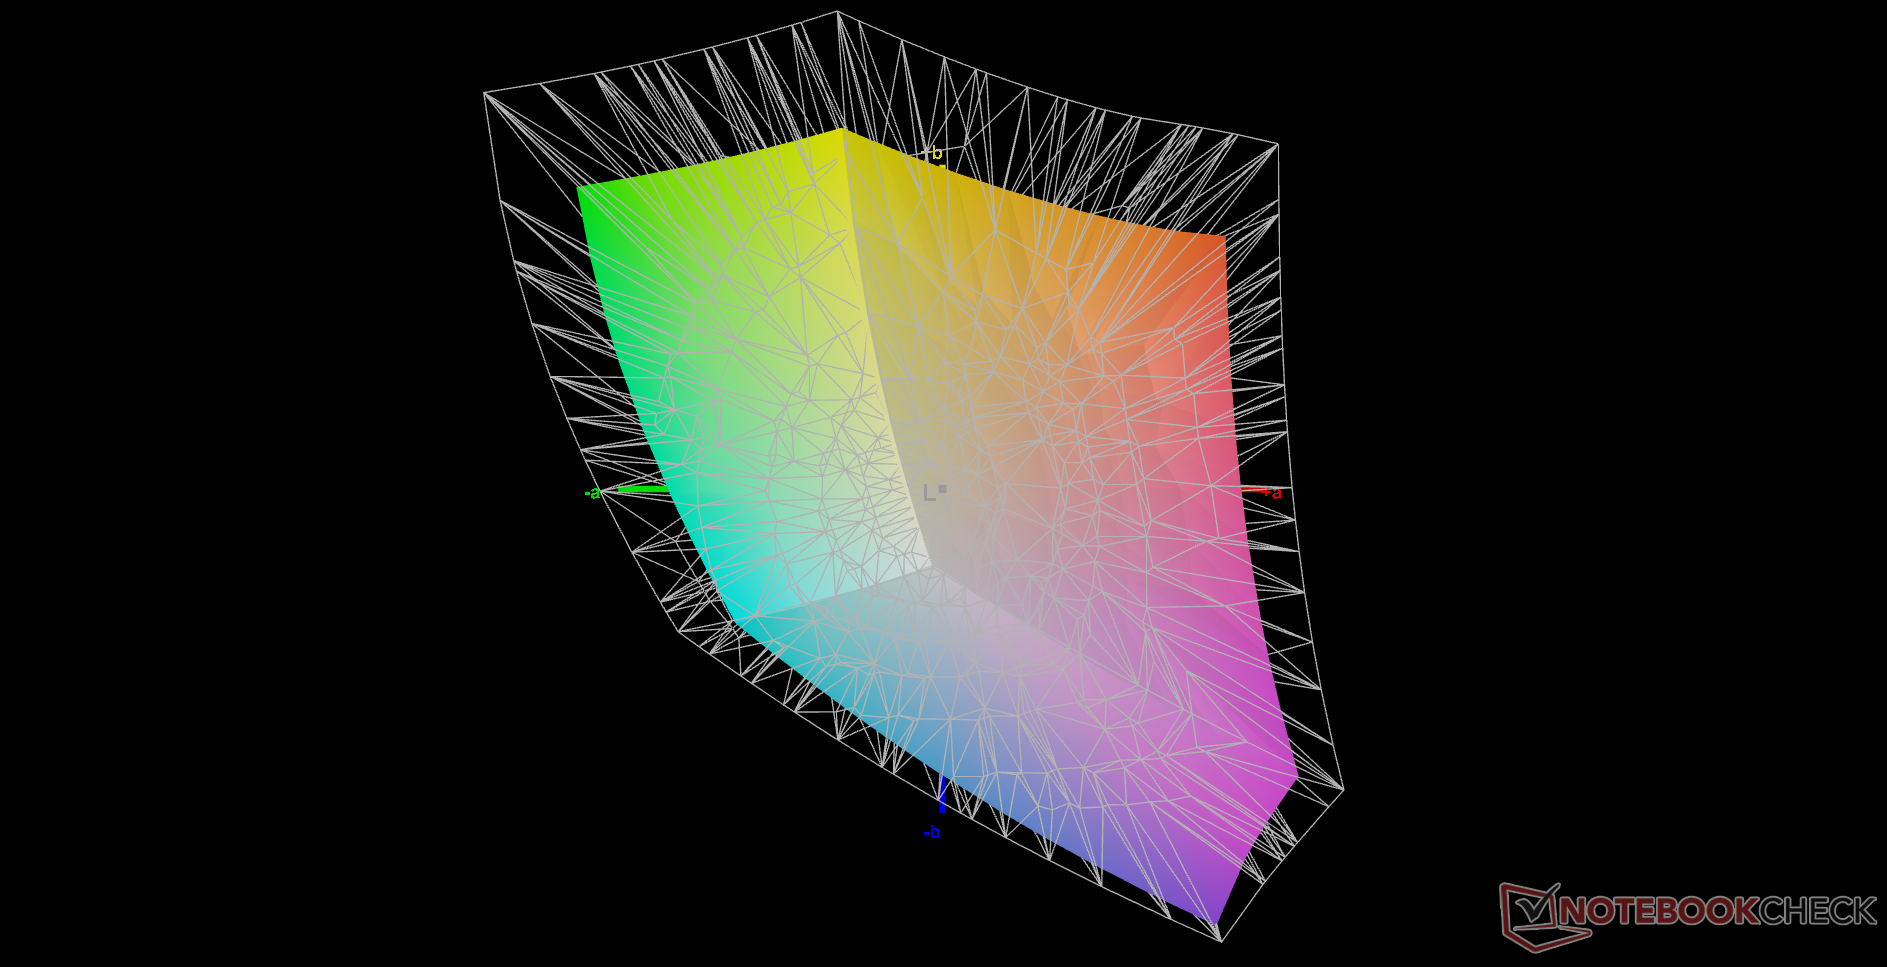
72% AdobeRGB 1998 (Argyll 3D)
99.1% sRGB (Argyll 3D)
69.9% Display P3 (Argyll 3D)
Gamma: 2.13
CCT: 6520 K
| Lenovo Yoga 6 13ALC6 AU Optronics B133HAN05.F, IPS, 13.3", 1920x1080 | Lenovo Yoga 6 13 82ND0009US AU Optronics B133HAN05.F, IPS, 13.3", 1920x1080 | Dell XPS 13 9310 2-in-1 Sharp LQ134N1, IPS, 13.4", 1920x1200 | Acer Spin 3 SP313-51N-56YV AU Optronics AUOB493, IPS, 13.3", 2560x1600 | Lenovo IdeaPad Flex 5 CB 13IML05 82B80010GE IPS, 13.3", 1920x1080 | HP Envy x360 13-ay0010nr IPS, 13.3", 1920x1080 | |
|---|---|---|---|---|---|---|
| Display | -0% | 0% | 7% | -5% | ||
| Display P3 Coverage (%) | 69.9 | 69.7 0% | 69.7 0% | 78.8 13% | 65.9 -6% | |
| sRGB Coverage (%) | 99.1 | 99.2 0% | 99 0% | 99.8 1% | 97.4 -2% | |
| AdobeRGB 1998 Coverage (%) | 72 | 71.4 -1% | 71.7 0% | 77.6 8% | 67.8 -6% | |
| Response Times | 21% | -2% | 7% | 19% | 15% | |
| Response Time Grey 50% / Grey 80% * (ms) | 52 ? | 46.8 ? 10% | 55.6 ? -7% | 52 ? -0% | 47 ? 10% | 47.6 ? 8% |
| Response Time Black / White * (ms) | 41.6 ? | 28.8 ? 31% | 40.4 ? 3% | 36 ? 13% | 30 ? 28% | 32.4 ? 22% |
| PWM Frequency (Hz) | 2500 ? | 25000 ? | ||||
| Screen | -28% | -10% | -60% | 10% | -18% | |
| Brightness middle (cd/m²) | 319.6 | 291.5 -9% | 555.7 74% | 338 6% | 242 -24% | 452.6 42% |
| Brightness (cd/m²) | 316 | 294 -7% | 528 67% | 307 -3% | 232 -27% | 438 39% |
| Brightness Distribution (%) | 95 | 93 -2% | 90 -5% | 83 -13% | 85 -11% | 93 -2% |
| Black Level * (cd/m²) | 0.2 | 0.19 5% | 0.35 -75% | 0.27 -35% | 0.235 -17% | 0.29 -45% |
| Contrast (:1) | 1598 | 1534 -4% | 1588 -1% | 1252 -22% | 1030 -36% | 1561 -2% |
| Colorchecker dE 2000 * | 4.2 | 3.83 9% | 4.83 -15% | 4.63 -10% | 1.99 53% | 2.67 36% |
| Colorchecker dE 2000 max. * | 9.34 | 8.43 10% | 8.46 9% | 9.99 -7% | 2.77 70% | 4.11 56% |
| Colorchecker dE 2000 calibrated * | 0.3 | 1.07 -257% | 0.76 -153% | 1.64 -447% | 1.36 -353% | |
| Greyscale dE 2000 * | 6.4 | 6.2 3% | 6.1 5% | 6.76 -6% | 1.78 72% | 2.1 67% |
| Gamma | 2.13 103% | 2.2 100% | 1.98 111% | 2.37 93% | 2.31 95% | 2.01 109% |
| CCT | 6520 100% | 6469 100% | 6686 97% | 5934 110% | 6567 99% | 6505 100% |
| Color Space (Percent of AdobeRGB 1998) (%) | 68 | 62.2 | ||||
| Color Space (Percent of sRGB) (%) | 98 | 97.6 | ||||
| Media totale (Programma / Settaggio) | -2% /
-15% | -4% /
-7% | -15% /
-36% | 15% /
12% | -3% /
-10% |
* ... Meglio usare valori piccoli
Tempi di risposta del Display
| ↔ Tempi di risposta dal Nero al Bianco | ||
|---|---|---|
| 41.6 ms ... aumenta ↗ e diminuisce ↘ combinato | ↗ 22 ms Incremento | 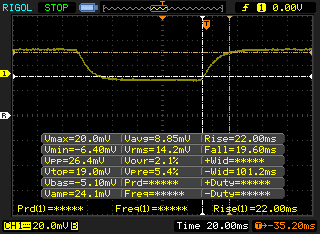 |
| ↘ 19.6 ms Calo | ||
| Lo schermo mostra tempi di risposta lenti nei nostri tests e sarà insoddisfacente per i gamers. In confronto, tutti i dispositivi di test variano da 0.1 (minimo) a 240 (massimo) ms. » 98 % di tutti i dispositivi è migliore. Questo significa che i tempi di risposta rilevati sono peggiori rispetto alla media di tutti i dispositivi testati (19.9 ms). | ||
| ↔ Tempo di risposta dal 50% Grigio all'80% Grigio | ||
| 52 ms ... aumenta ↗ e diminuisce ↘ combinato | ↗ 25.2 ms Incremento | 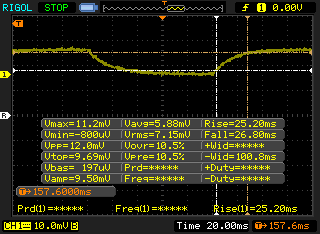 |
| ↘ 26.8 ms Calo | ||
| Lo schermo mostra tempi di risposta lenti nei nostri tests e sarà insoddisfacente per i gamers. In confronto, tutti i dispositivi di test variano da 0.165 (minimo) a 636 (massimo) ms. » 88 % di tutti i dispositivi è migliore. Questo significa che i tempi di risposta rilevati sono peggiori rispetto alla media di tutti i dispositivi testati (31.1 ms). | ||
Sfarfallio dello schermo / PWM (Pulse-Width Modulation)
| flickering dello schermo / PWM non rilevato | 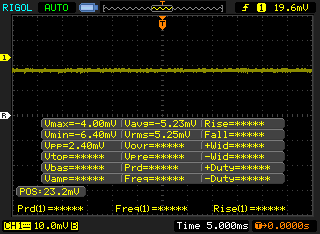 | ||
In confronto: 52 % di tutti i dispositivi testati non utilizza PWM per ridurre la luminosita' del display. Se è rilevato PWM, una media di 7798 (minimo: 5 - massimo: 343500) Hz è stata rilevata. | |||
Prestazioni - Octa-Core per meno
| Specifiche | Ryzen 5 5500U Zen 2 | Ryzen 7 5700U Zen 2 |
|---|---|---|
| Core | 6 (12 thread) | 8 (16 thread) |
| Tasso di clock (GHz) | 2.1 - 4.0 | 1.8 - 4.3 |
| Cache L1/L2/L3 | 0.384/3/8 MB | 0.512/4/8 MB |
| GPU integrata | Radeon Vega 7 4000 Raven Ridge | Radeon Vega 8 4000 Raven Ridge |
| Pipeline | 448 Unificato | 512 unificate |
| Frequenza di clock della GPU (MHz) | Fino a 1600 | Fino a 1750 |
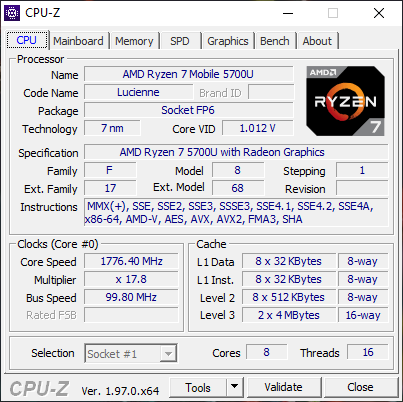
Processore
Le prestazioni multi-thread grezze sono circa il 15-20% più veloci del Ryzen 5 5500U secondo i benchmark CineBench dovuti in parte al nostro Ryzen 7 5700U che ha due core aggiuntivi. Le prestazioni single-thread sono anche leggermente più veloci di qualche punto percentuale. Entrambe le opzioni saranno più veloci del concorrente Intel Core i7-1165G7 nei carichi di lavoro multi-thread
La sostenibilità delle prestazioni è eccellente, specialmente per un convertibile dove i tassi di clock Turbo Boost tendono ad essere di breve durata. L'esecuzione di CineBench R15 xT in un ciclo mostra punteggi coerenti dall'inizio alla fine, mentre il Core i7-1165G7 nell XPS 13 9310 2-in-1 si spegneva pesantemente.
Cinebench R15 Multi Loop
Cinebench R23: Multi Core | Single Core
Cinebench R15: CPU Multi 64Bit | CPU Single 64Bit
Blender: v2.79 BMW27 CPU
7-Zip 18.03: 7z b 4 -mmt1 | 7z b 4
Geekbench 5.5: Single-Core | Multi-Core
HWBOT x265 Benchmark v2.2: 4k Preset
LibreOffice : 20 Documents To PDF
R Benchmark 2.5: Overall mean
| Cinebench R23 / Multi Core | |
| Lenovo Yoga Slim 7-14ARE | |
| Media AMD Ryzen 7 5700U (4861 - 10139, n=20) | |
| HP Pavilion Aero 13 be0097nr | |
| Lenovo Yoga 6 13ALC6 | |
| Lenovo Yoga 6 13 82ND0009US | |
| Dell XPS 13 9310 2-in-1 | |
| Asus VivoBook S13 S333JA-DS51 | |
| Dell Inspiron 13 5301-0D0XN | |
| Cinebench R23 / Single Core | |
| HP Pavilion Aero 13 be0097nr | |
| Dell XPS 13 9310 2-in-1 | |
| Dell Inspiron 13 5301-0D0XN | |
| Lenovo Yoga 6 13ALC6 | |
| Media AMD Ryzen 7 5700U (1177 - 1268, n=20) | |
| Lenovo Yoga Slim 7-14ARE | |
| Lenovo Yoga 6 13 82ND0009US | |
| Asus VivoBook S13 S333JA-DS51 | |
| Geekbench 5.5 / Single-Core | |
| Dell Inspiron 13 5301-0D0XN | |
| Asus ZenBook 13 UX325JA | |
| Media AMD Ryzen 7 5700U (1105 - 1205, n=19) | |
| Asus VivoBook Flip 14 TM420IA | |
| Lenovo Yoga Slim 7-14ARE | |
| Lenovo Yoga Slim 7-14ARE | |
| Asus VivoBook S13 S333JA-DS51 | |
| Geekbench 5.5 / Multi-Core | |
| Lenovo Yoga Slim 7-14ARE | |
| Lenovo Yoga Slim 7-14ARE | |
| Media AMD Ryzen 7 5700U (4254 - 7635, n=19) | |
| Asus VivoBook Flip 14 TM420IA | |
| Dell Inspiron 13 5301-0D0XN | |
| Asus ZenBook 13 UX325JA | |
| Asus VivoBook S13 S333JA-DS51 | |
| LibreOffice / 20 Documents To PDF | |
| Lenovo Yoga 6 13 82ND0009US | |
| Media AMD Ryzen 7 5700U (52.4 - 75.5, n=20) | |
| Lenovo Yoga 6 13ALC6 | |
| Asus VivoBook S13 S333JA-DS51 | |
| Lenovo Yoga Slim 7-14ARE | |
| Asus VivoBook Flip 14 TM420IA | |
| HP Pavilion Aero 13 be0097nr | |
| Dell Inspiron 13 5301-0D0XN | |
| Asus ZenBook 13 UX325JA | |
Cinebench R23: Multi Core | Single Core
Cinebench R15: CPU Multi 64Bit | CPU Single 64Bit
Blender: v2.79 BMW27 CPU
7-Zip 18.03: 7z b 4 -mmt1 | 7z b 4
Geekbench 5.5: Single-Core | Multi-Core
HWBOT x265 Benchmark v2.2: 4k Preset
LibreOffice : 20 Documents To PDF
R Benchmark 2.5: Overall mean
* ... Meglio usare valori piccoli
Prestazioni del sistema
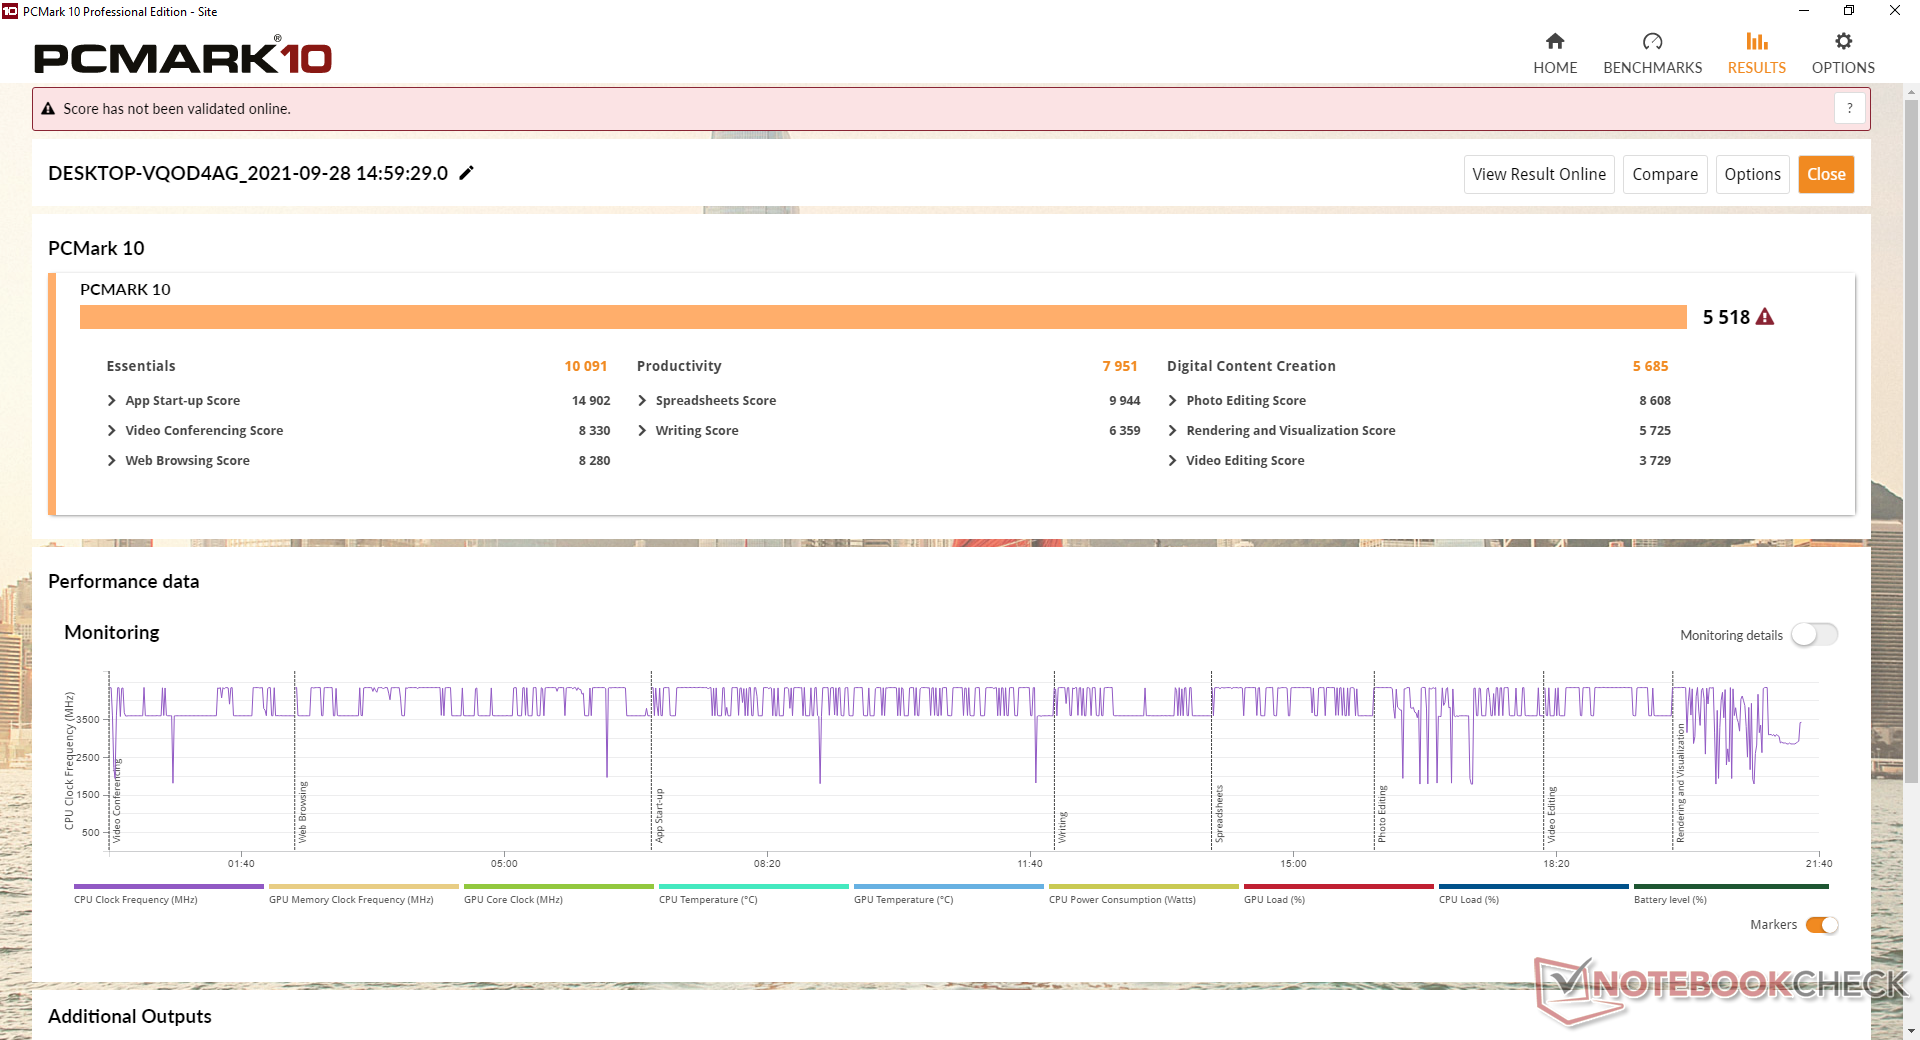
I benchmark PCMark 10 sono costantemente superiori a quelli che abbiamo registrato sulla SKU Ryzen 5, anche se con margini percentuali a una sola cifra. I punteggi complessivi sono paragonabili al più costoso Dell XPS 13 9310 2-in-1 alimentato da Intel.
| PCMark 10 / Score | |
| Lenovo Yoga 6 13ALC6 | |
| Lenovo Yoga 6 13 82ND0009US | |
| Dell XPS 13 9310 2-in-1 | |
| Media AMD Ryzen 7 5700U, AMD Radeon RX Vega 8 (Ryzen 4000/5000) (4325 - 5518, n=15) | |
| HP Envy x360 13-ay0010nr | |
| Acer Spin 3 SP313-51N-56YV | |
| PCMark 10 / Essentials | |
| Dell XPS 13 9310 2-in-1 | |
| Lenovo Yoga 6 13ALC6 | |
| Lenovo Yoga 6 13 82ND0009US | |
| Acer Spin 3 SP313-51N-56YV | |
| HP Envy x360 13-ay0010nr | |
| Media AMD Ryzen 7 5700U, AMD Radeon RX Vega 8 (Ryzen 4000/5000) (8025 - 10091, n=15) | |
| PCMark 10 / Productivity | |
| Lenovo Yoga 6 13ALC6 | |
| Media AMD Ryzen 7 5700U, AMD Radeon RX Vega 8 (Ryzen 4000/5000) (7001 - 8457, n=15) | |
| HP Envy x360 13-ay0010nr | |
| Lenovo Yoga 6 13 82ND0009US | |
| Dell XPS 13 9310 2-in-1 | |
| Acer Spin 3 SP313-51N-56YV | |
| PCMark 10 / Digital Content Creation | |
| Lenovo Yoga 6 13ALC6 | |
| Media AMD Ryzen 7 5700U, AMD Radeon RX Vega 8 (Ryzen 4000/5000) (3738 - 5964, n=15) | |
| Lenovo Yoga 6 13 82ND0009US | |
| Dell XPS 13 9310 2-in-1 | |
| Acer Spin 3 SP313-51N-56YV | |
| HP Envy x360 13-ay0010nr | |
| PCMark 10 Score | 5518 punti | |
Aiuto | ||
Latenza DPC
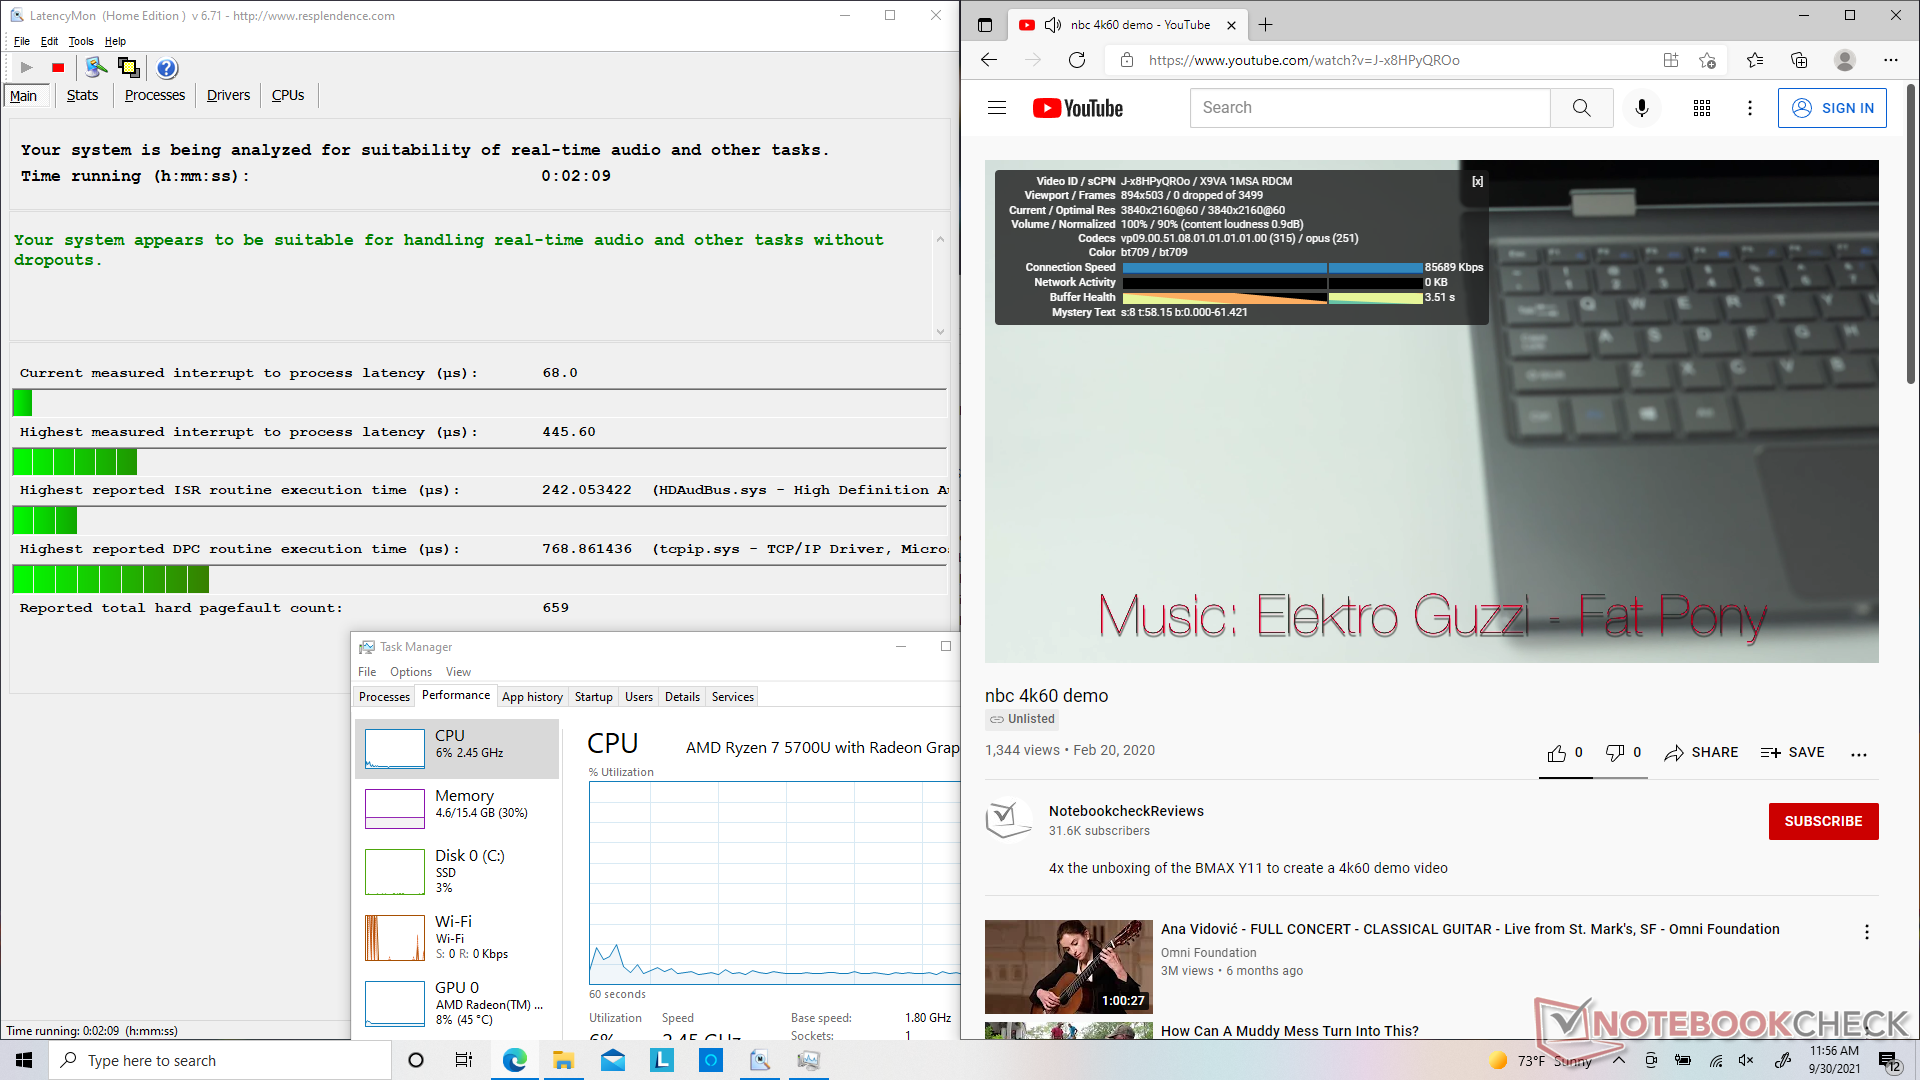
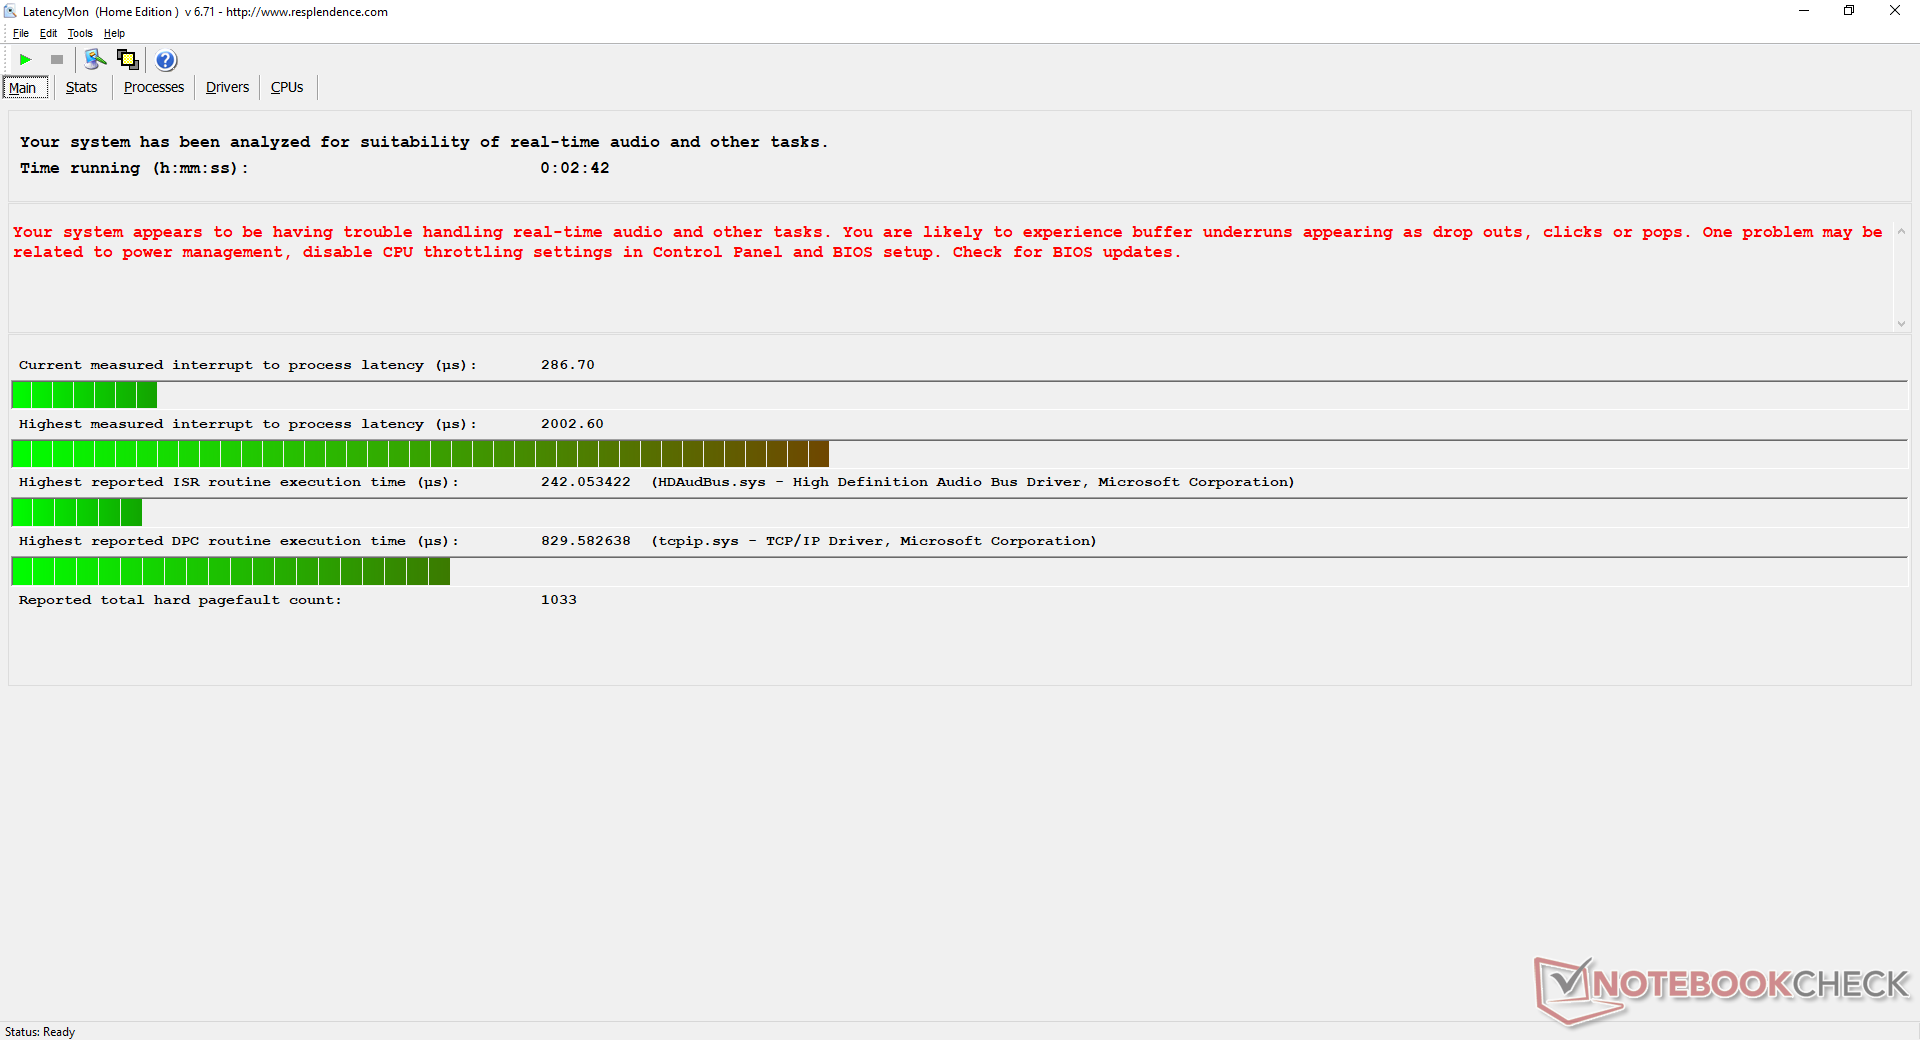
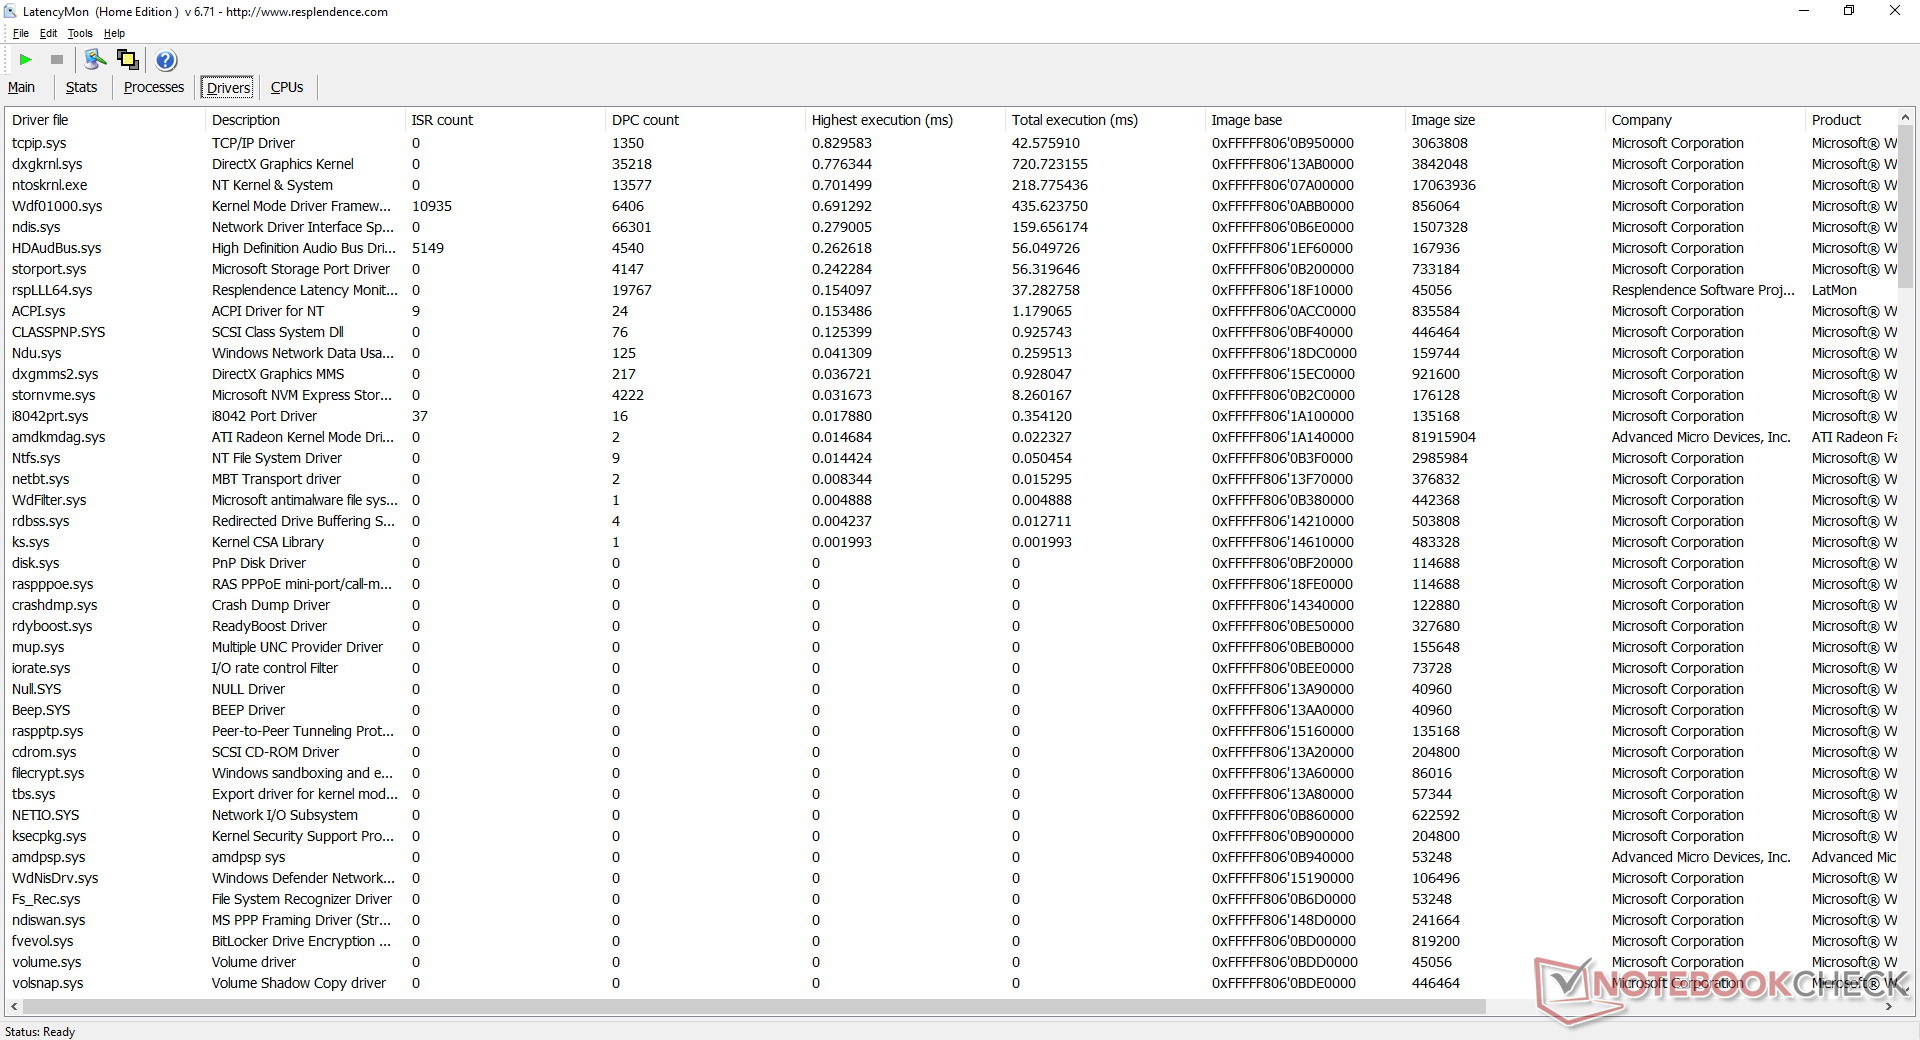
LatencyMon non mostra problemi di latenza DPC quando si aprono più schede del browser sulla nostra homepage o quando si riproducono video 4K a 60 FPS. Tuttavia, la latenza salta bruscamente quando si esegue Prime95 stress che è molto simile a quello che abbiamo osservato sul nostro Ryzen 5 SKU.
| DPC Latencies / LatencyMon - interrupt to process latency (max), Web, Youtube, Prime95 | |
| Lenovo Yoga 6 13ALC6 | |
| Lenovo Yoga 6 13 82ND0009US | |
| HP Envy x360 13-ay0010nr | |
| Acer Spin 3 SP313-51N-56YV | |
| Dell XPS 13 9310 2-in-1 | |
* ... Meglio usare valori piccoli
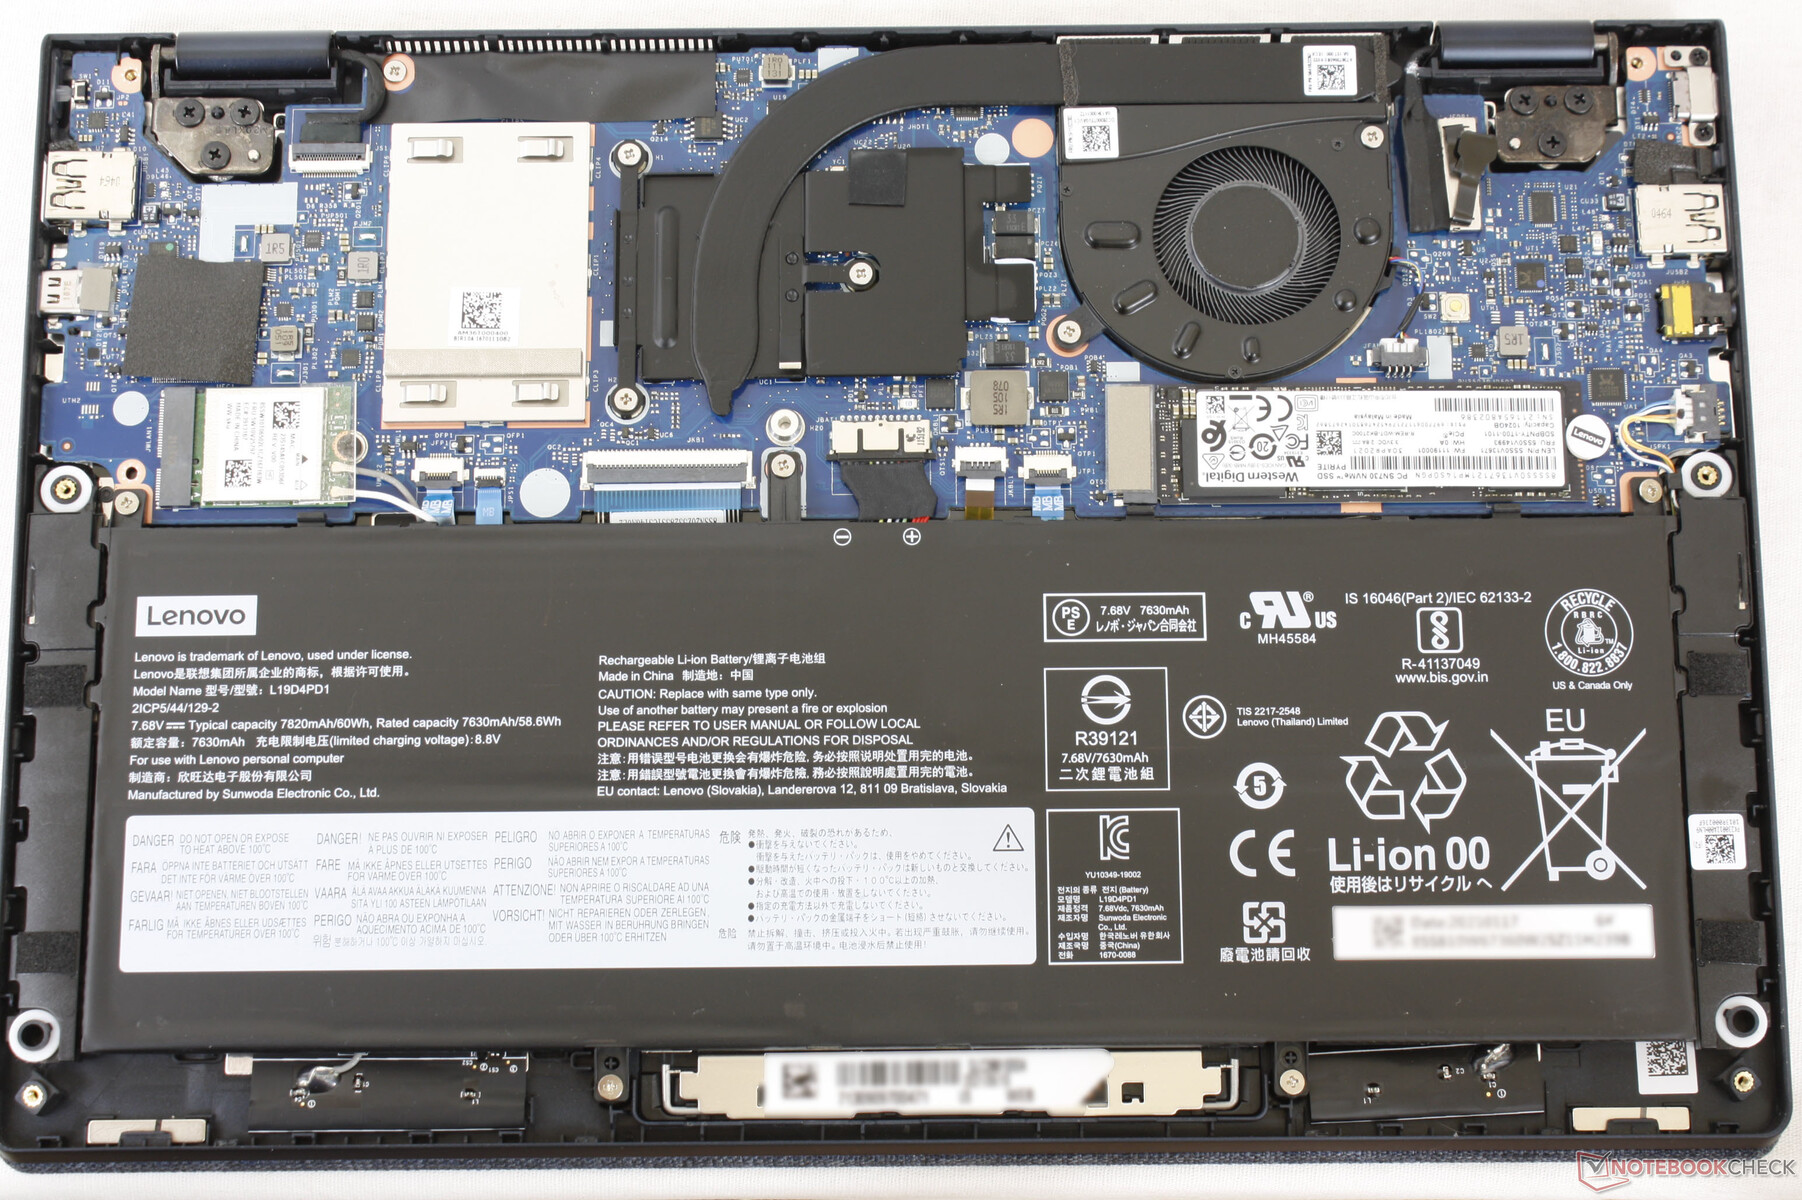
Dispositivi di archiviazione
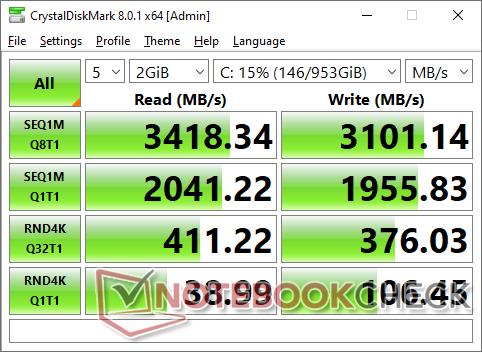
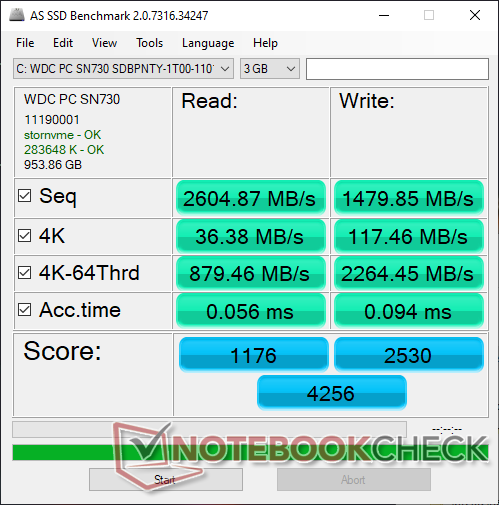
La nostra unità Ryzen 7 è configurata con un Western Digital SN730 da 1 TB di fascia alta invece dei 256 GB SN530 della nostra unità Ryzen 5 originale. Le velocità di trasferimento sono significativamente più veloci, soprattutto quando si scrivono i dati con velocità che si avvicinano a 3100 MB/s.
| Lenovo Yoga 6 13ALC6 WDC PC SN730 SDBPNTY-1T00 | Lenovo Yoga 6 13 82ND0009US WDC PC SN530 SDBPMPZ-265G | Dell XPS 13 9310 2-in-1 Toshiba BG4 KBG40ZPZ512G | Acer Spin 3 SP313-51N-56YV Kingston OM8PCP3512F-AB | HP Envy x360 13-ay0010nr Toshiba KBG30ZMV256G | |
|---|---|---|---|---|---|
| AS SSD | -51% | -46% | -33% | -79% | |
| Seq Read (MB/s) | 2605 | 1860 -29% | 2031 -22% | 1748 -33% | 1135 -56% |
| Seq Write (MB/s) | 1480 | 500 -66% | 776 -48% | 941 -36% | 628 -58% |
| 4K Read (MB/s) | 36.38 | 36.26 0% | 49.55 36% | 44.06 21% | 42.49 17% |
| 4K Write (MB/s) | 117.5 | 118.6 1% | 112.2 -5% | 77.7 -34% | 96.9 -18% |
| 4K-64 Read (MB/s) | 879 | 419 -52% | 1058 20% | 451.1 -49% | 614 -30% |
| 4K-64 Write (MB/s) | 2264 | 219 -90% | 328.9 -85% | 926 -59% | 256.4 -89% |
| Access Time Read * (ms) | 0.056 | 0.102 -82% | 0.072 -29% | 0.188 -236% | 0.162 -189% |
| Access Time Write * (ms) | 0.094 | 0.17 -81% | 0.518 -451% | 0.043 54% | 0.592 -530% |
| Score Read (Points) | 1176 | 641 -45% | 1311 11% | 670 -43% | 770 -35% |
| Score Write (Points) | 2530 | 388 -85% | 519 -79% | 1098 -57% | 416 -84% |
| Score Total (Points) | 4256 | 1300 -69% | 2447 -43% | 2084 -51% | 1567 -63% |
| Copy ISO MB/s (MB/s) | 1210 | 880 -27% | 1103 -9% | 969 -20% | 843 -30% |
| Copy Program MB/s (MB/s) | 238.4 | 185.3 -22% | 331.7 39% | 609 155% | 367.9 54% |
| Copy Game MB/s (MB/s) | 715 | 212.7 -70% | 828 16% | 232.4 -67% | 727 2% |
| CrystalDiskMark 5.2 / 6 | -28% | -9% | 3% | -36% | |
| Write 4K (MB/s) | 113.8 | 89.2 -22% | 129.6 14% | 286.1 151% | 94.8 -17% |
| Read 4K (MB/s) | 39.64 | 33.09 -17% | 52.2 32% | 48.89 23% | 45.5 15% |
| Write Seq (MB/s) | 1921 | 988 -49% | 1310 -32% | 982 -49% | 732 -62% |
| Read Seq (MB/s) | 2025 | 1322 -35% | 1726 -15% | 1301 -36% | 959 -53% |
| Write 4K Q32T1 (MB/s) | 339.3 | 332.6 -2% | 334.7 -1% | 625 84% | 224.6 -34% |
| Read 4K Q32T1 (MB/s) | 407.6 | 389.3 -4% | 447.6 10% | 301 -26% | 365.2 -10% |
| Write Seq Q32T1 (MB/s) | 3089 | 984 -68% | 1410 -54% | 981 -68% | 864 -72% |
| Read Seq Q32T1 (MB/s) | 3386 | 2461 -27% | 2390 -29% | 1631 -52% | 1580 -53% |
| Media totale (Programma / Settaggio) | -40% /
-43% | -28% /
-33% | -15% /
-19% | -58% /
-63% |
* ... Meglio usare valori piccoli

Disk Throttling: DiskSpd Read Loop, Queue Depth 8
Prestazioni della GPU - Vicino, ma non abbastanza Iris Xe
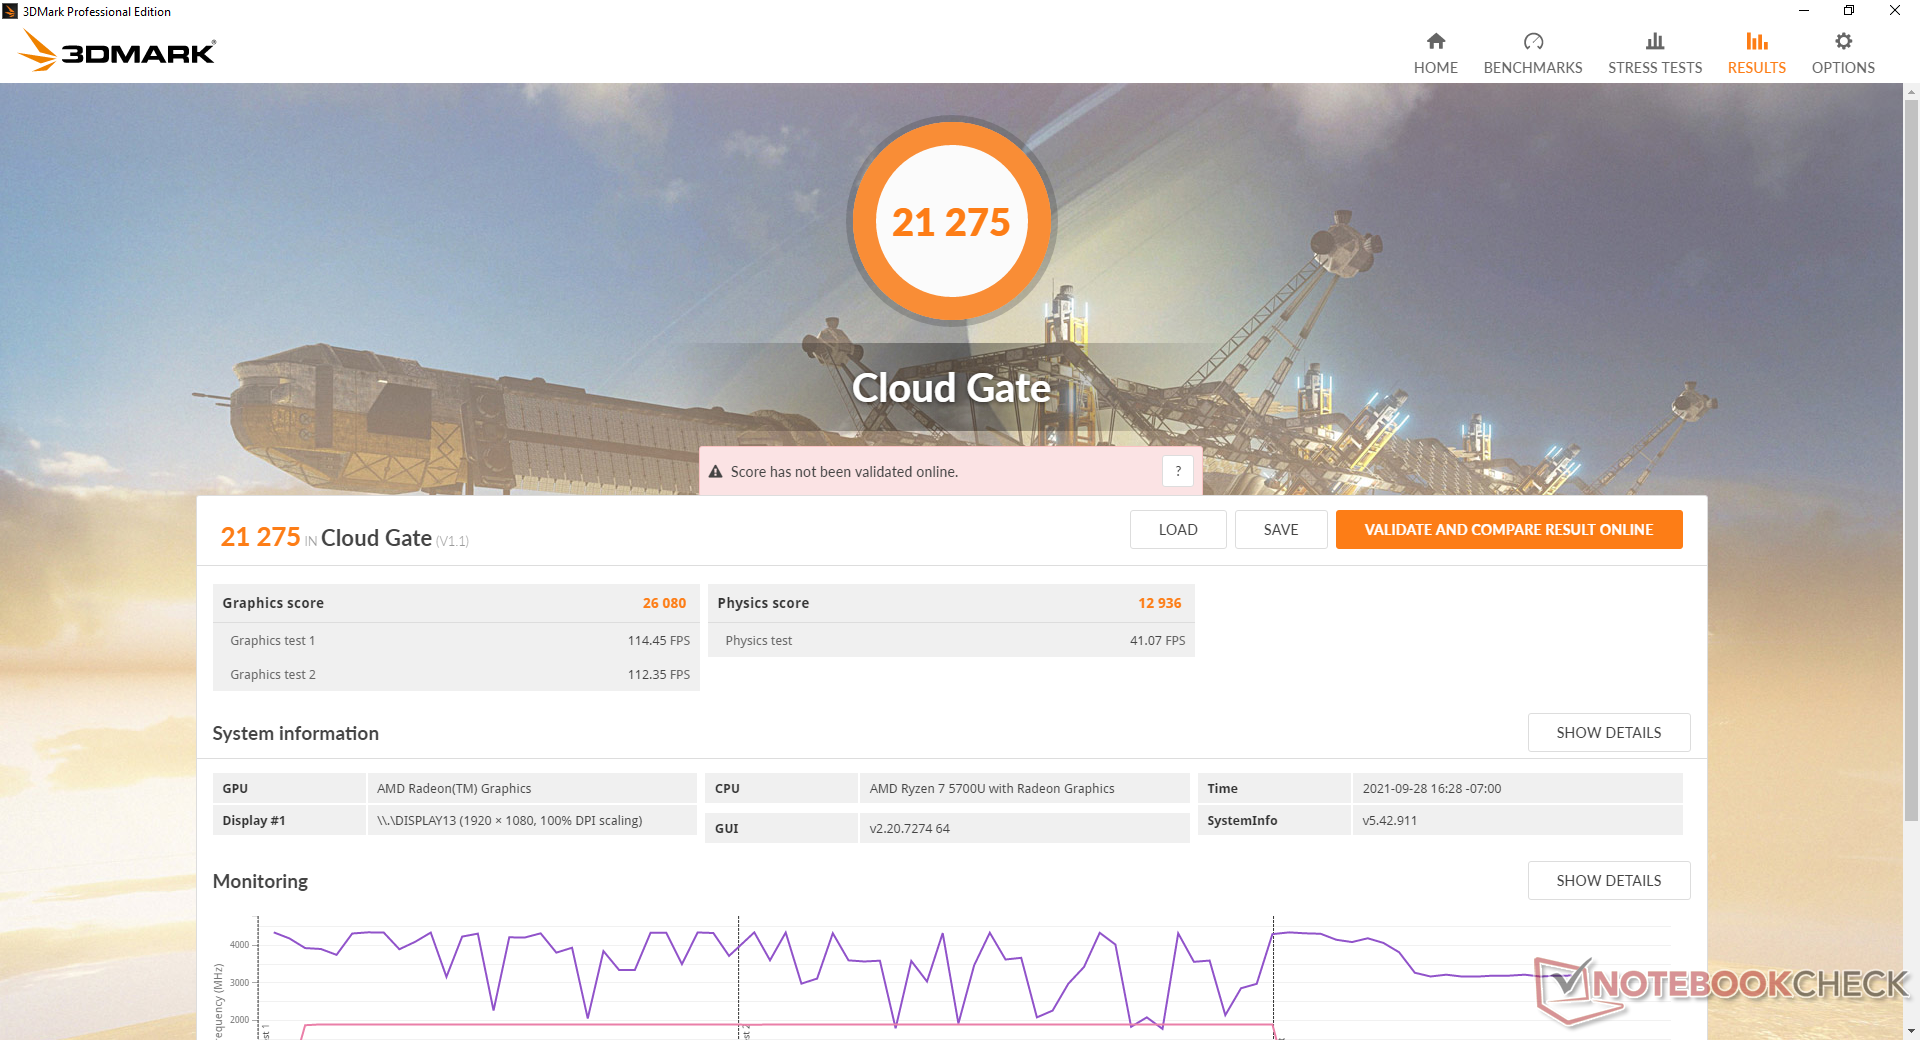
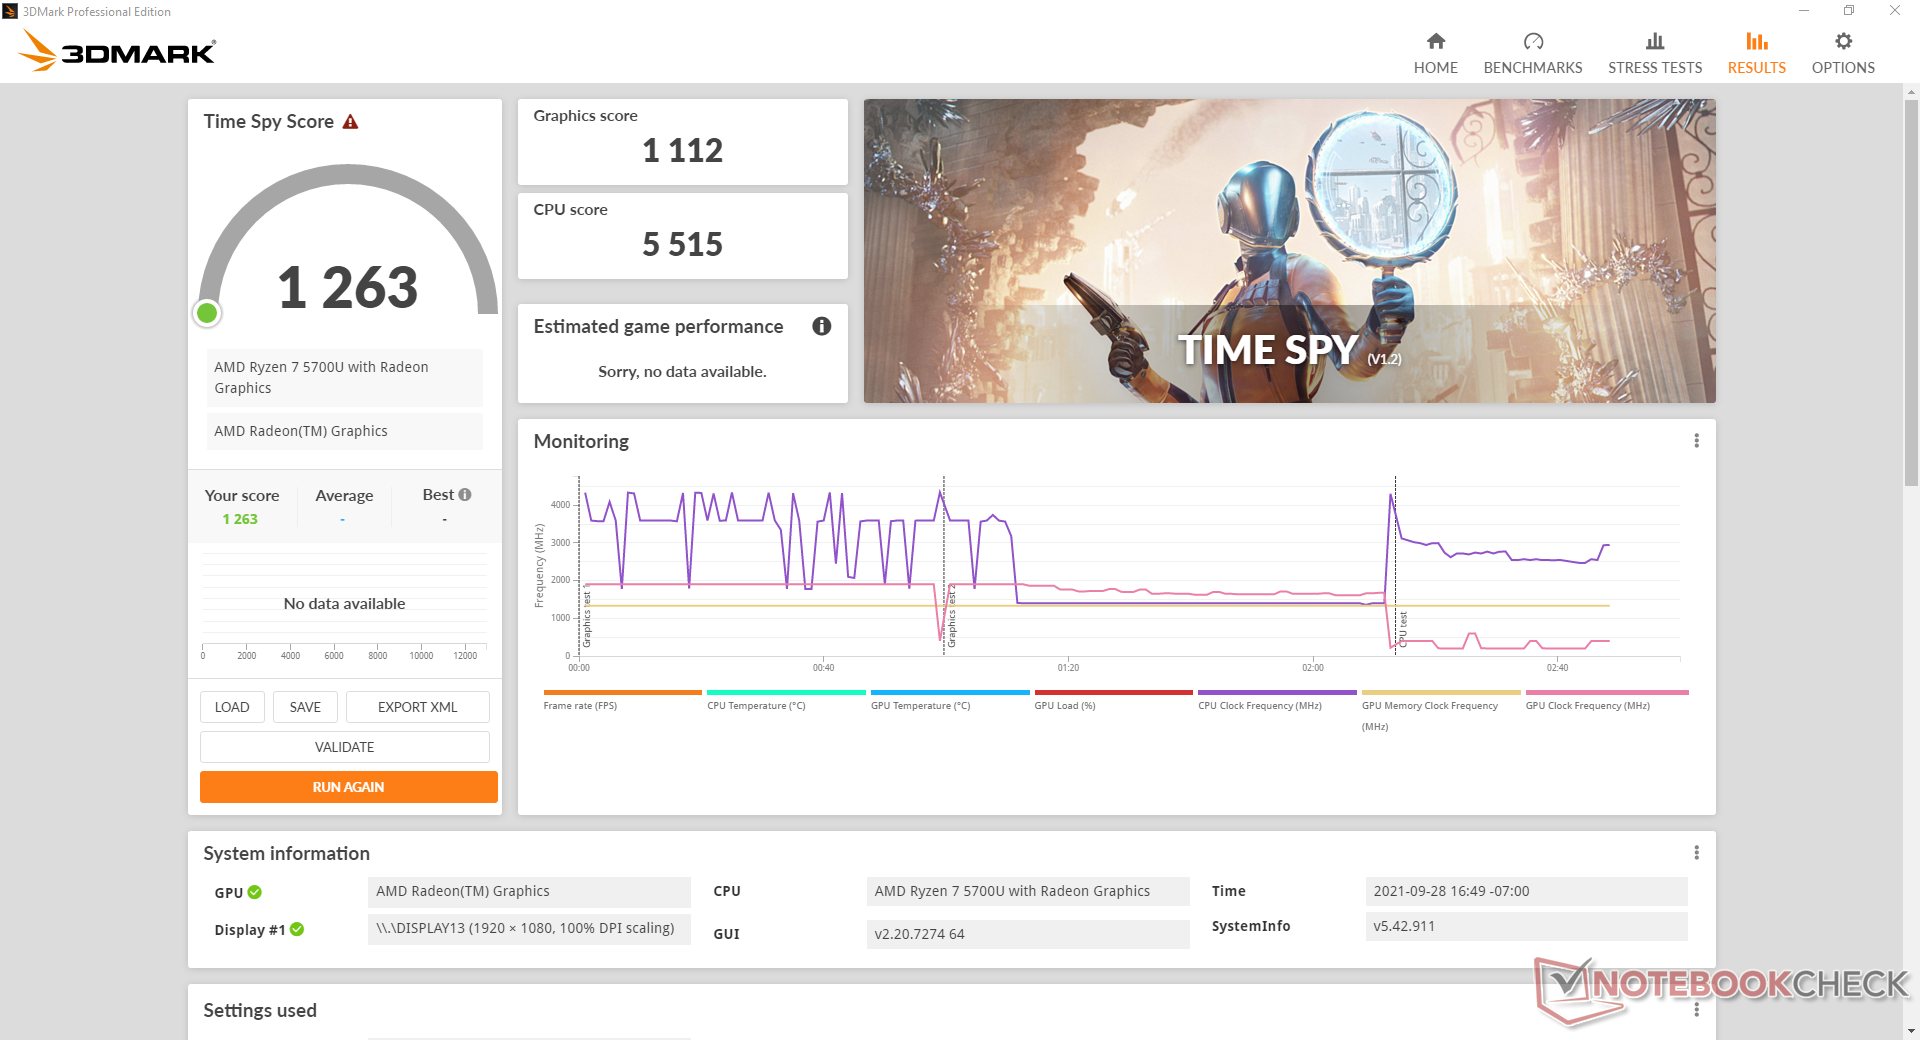
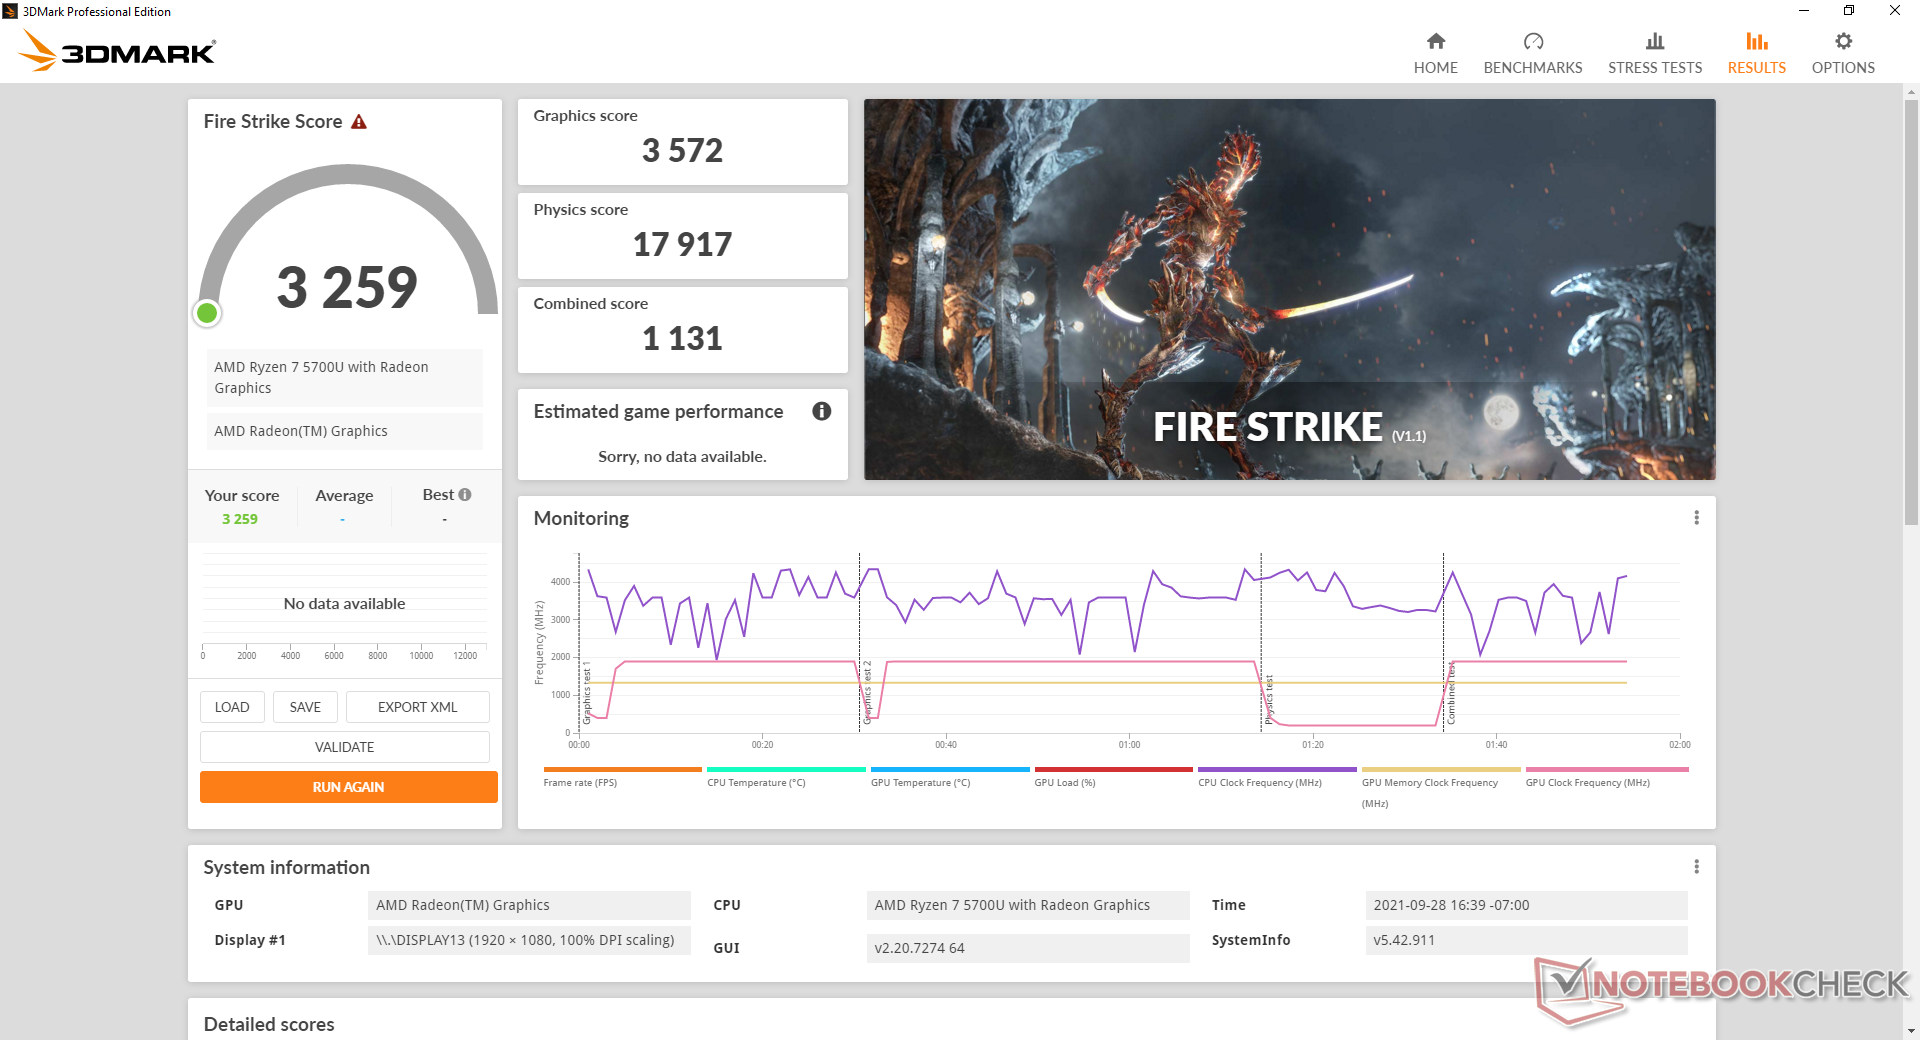
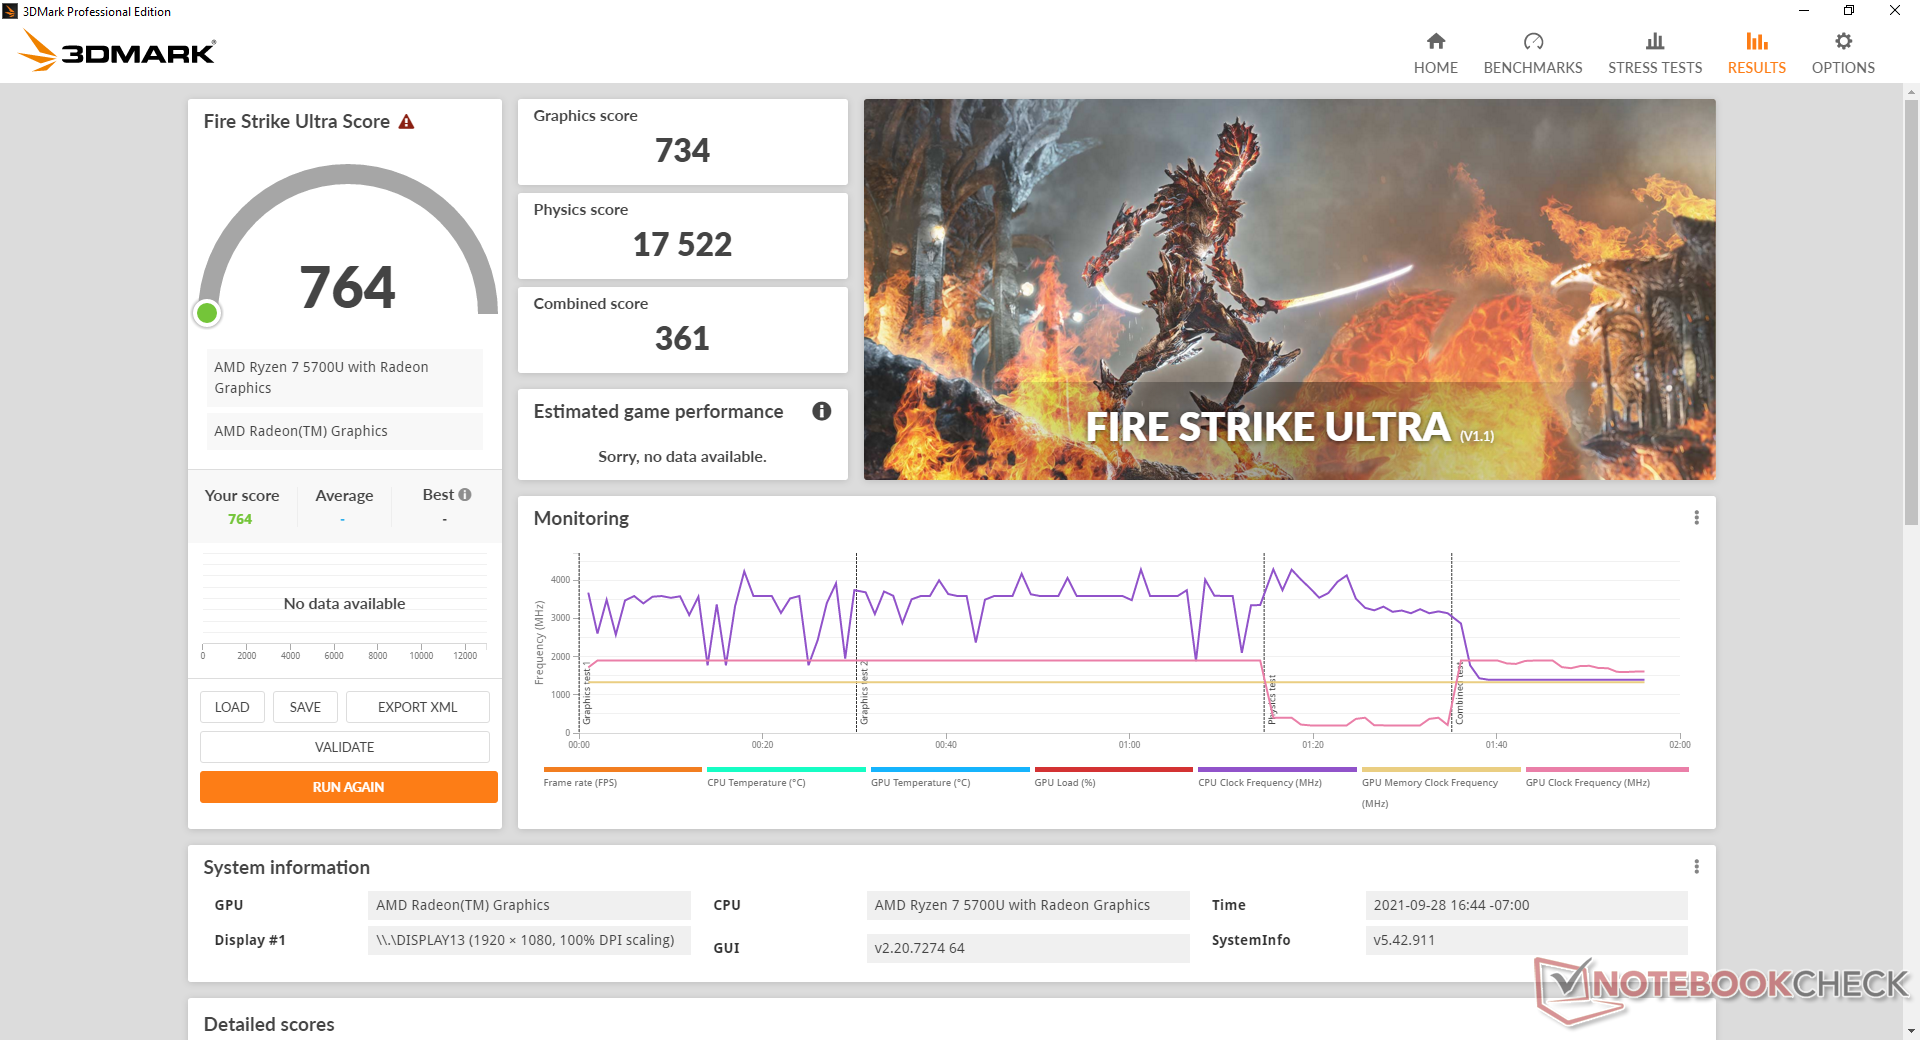
I benchmark di 3DMark mostrano che la nostra Radeon RX Vega 8 nel Ryzen 7 5700U è circa il 10-15% più veloce della Radeon RX Vega 7 nel Ryzen 5 5500U. Nei giochi reali, tuttavia, il nostro Vega 8 sarebbe solo circa 5 a 10 per cento più veloce nonostante il fatto che la nostra unità di test Ryzen 8 viene fornito con il doppio della RAM e core aggiuntivi. È chiaro che il collo di bottiglia coinvolge il chip grafico nella maggior parte degli scenari di gioco.
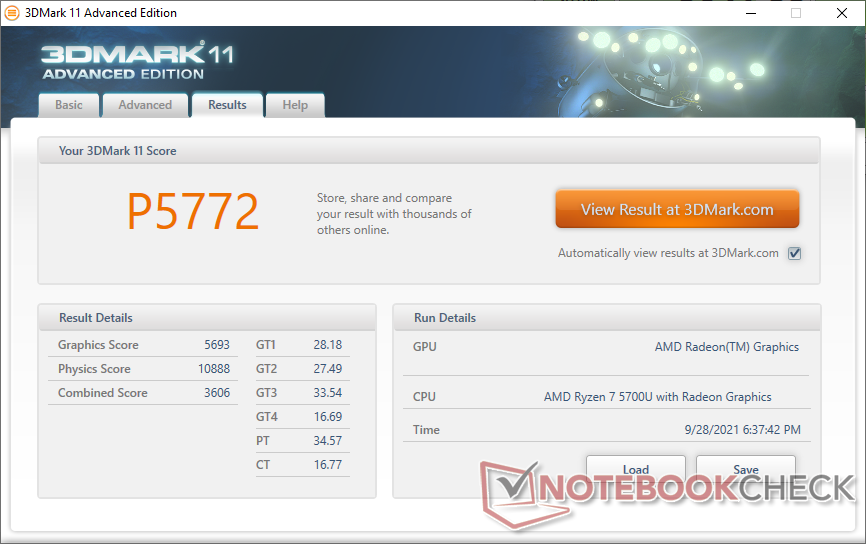
| 3DMark 11 Performance | 5772 punti | |
| 3DMark Cloud Gate Standard Score | 21275 punti | |
| 3DMark Fire Strike Score | 3259 punti | |
| 3DMark Time Spy Score | 1263 punti | |
Aiuto | ||
Witcher 3 FPS Chart
| basso | medio | alto | ultra | |
|---|---|---|---|---|
| GTA V (2015) | 88.7 | 24.5 | 9.82 | |
| The Witcher 3 (2015) | 70.7 | 23.3 | 15.2 | |
| Dota 2 Reborn (2015) | 93.7 | 73.7 | 45.7 | 43.4 |
| Final Fantasy XV Benchmark (2018) | 31.7 | 16.6 | 11.2 | |
| X-Plane 11.11 (2018) | 38.2 | 30.8 | 27 | |
| Far Cry 5 (2018) | 39 | 18 | 17 | 16 |
| Strange Brigade (2018) | 74.1 | 28.9 | 24.3 | 20.7 |
Emissions — Quiet Under Certain Power Profiles
Rumore di sistema
Il rumore della ventola è simile a quello che abbiamo osservato sulla SKU Ryzen 5 poiché i sistemi operano sotto livelli di TDP simili. Quando si imposta la modalità Extreme Performance tramite il software Lenovo Vantage, il rumore della ventola pulsa più frequentemente e raggiunge i massimi RPM più rapidamente. Gli utenti vorranno impostare il sistema su Intelligent Cooling o Battery Saver durante la navigazione o lo streaming video per un rumore della ventola più costante e tollerabile di 27 dB(A).
La nostra unità presenterebbe un piccolo rumore elettronico o un fruscio della bobina che fortunatamente è udibile solo quando si mette un orecchio vicino ai tasti della tastiera
| Lenovo Yoga 6 13ALC6 Vega 8, R7 5700U, WDC PC SN730 SDBPNTY-1T00 | Lenovo Yoga 6 13 82ND0009US Vega 7, R5 5500U, WDC PC SN530 SDBPMPZ-265G | Dell XPS 13 9310 2-in-1 Iris Xe G7 96EUs, i7-1165G7, Toshiba BG4 KBG40ZPZ512G | Acer Spin 3 SP313-51N-56YV Iris Xe G7 80EUs, i5-1135G7, Kingston OM8PCP3512F-AB | Lenovo IdeaPad Flex 5 CB 13IML05 82B80010GE UHD Graphics 620, i5-10210U, Samsung PM991 MZALQ128HBHQ-000L2 | HP Envy x360 13-ay0010nr Vega 6, R5 4500U, Toshiba KBG30ZMV256G | |
|---|---|---|---|---|---|---|
| Noise | -1% | 0% | 1% | 0% | -12% | |
| off /ambiente * (dB) | 24.3 | 25.1 -3% | 24.3 -0% | 25.5 -5% | 26.5 -9% | 28 -15% |
| Idle Minimum * (dB) | 25.2 | 25.1 -0% | 24.8 2% | 25.5 -1% | 26.5 -5% | 28 -11% |
| Idle Average * (dB) | 25.2 | 25.1 -0% | 24.8 2% | 25.5 -1% | 26.5 -5% | 28 -11% |
| Idle Maximum * (dB) | 25.2 | 25.1 -0% | 24.8 2% | 25.5 -1% | 26.5 -5% | 28.5 -13% |
| Load Average * (dB) | 38.6 | 41 -6% | 38 2% | 34.5 11% | 32.6 16% | 41.1 -6% |
| Witcher 3 ultra * (dB) | 38.1 | 38.6 -1% | 38 -0% | |||
| Load Maximum * (dB) | 38.6 | 38.7 -0% | 41.5 -8% | 38.7 -0% | 35.5 8% | 43.5 -13% |
* ... Meglio usare valori piccoli
Rumorosità
| Idle |
| 25.2 / 25.2 / 25.2 dB(A) |
| Sotto carico |
| 38.6 / 38.6 dB(A) |
 | ||
30 dB silenzioso 40 dB(A) udibile 50 dB(A) rumoroso |
||
min: | ||
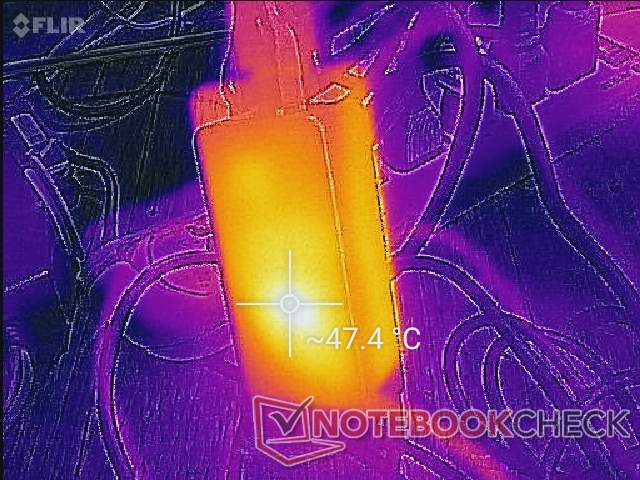
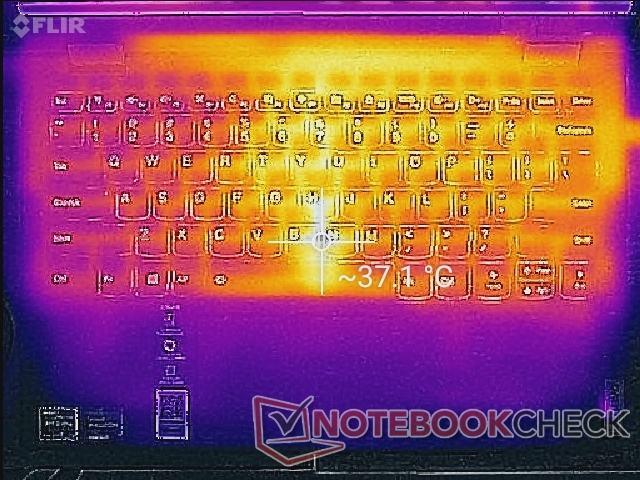
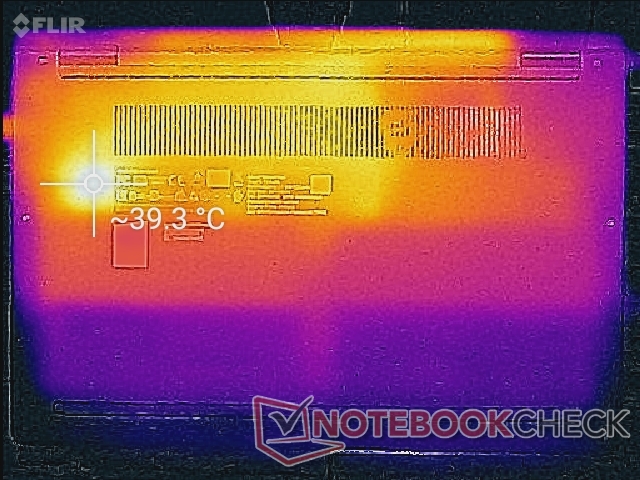
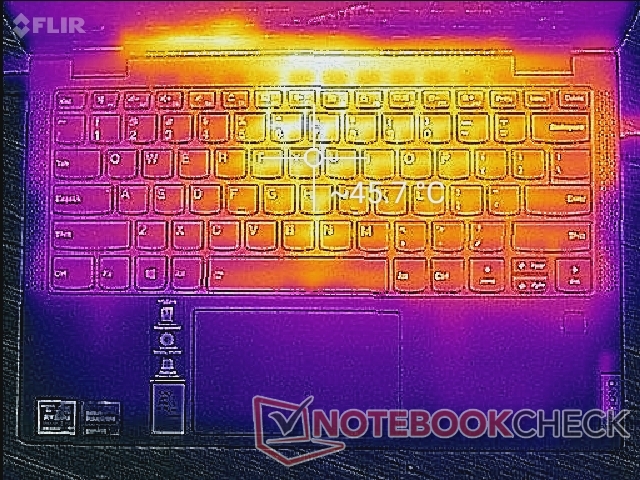
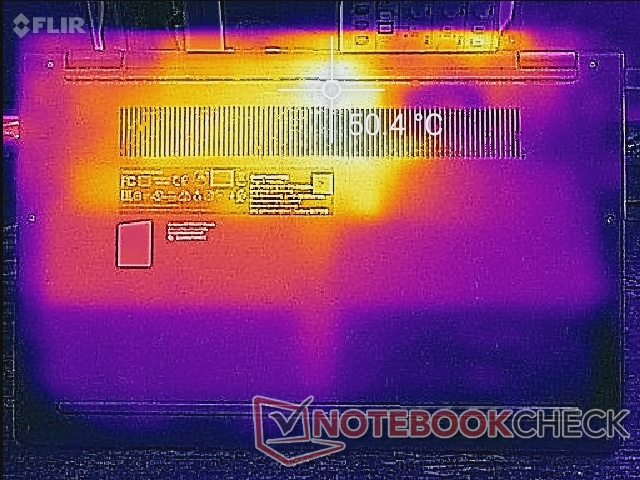
Temperatura
Le temperature di superficie quando sono sotto carico possono essere fino a 45-50 C vicino al centro della tastiera e sul retro, simili a quelle che abbiamo registrato sull'XPS 13 9310 2-in-1. È interessante notare che il modulo WLAN può diventare abbastanza caldo anche quando è semplicemente inattivo sul desktop, come mostrato dalle nostre immagini qui sotto, forse a causa dei download di software in background.
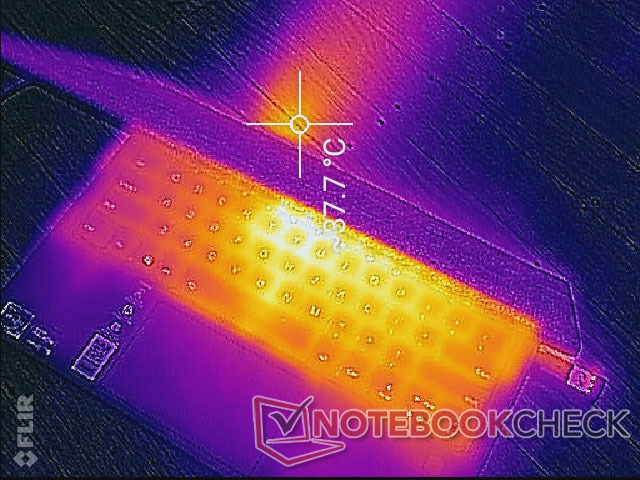
(-) La temperatura massima sul lato superiore è di 45.2 °C / 113 F, rispetto alla media di 35.4 °C / 96 F, che varia da 19.6 a 60 °C per questa classe Convertible.
(-) Il lato inferiore si riscalda fino ad un massimo di 50.6 °C / 123 F, rispetto alla media di 36.9 °C / 98 F
(+) In idle, la temperatura media del lato superiore è di 30 °C / 86 F, rispetto alla media deld ispositivo di 30.3 °C / 87 F.
(+) I poggiapolsi e il touchpad sono piu' freddi della temperatura della pelle con un massimo di 26 °C / 78.8 F e sono quindi freddi al tatto.
(±) La temperatura media della zona del palmo della mano di dispositivi simili e'stata di 28 °C / 82.4 F (+2 °C / 3.6 F).
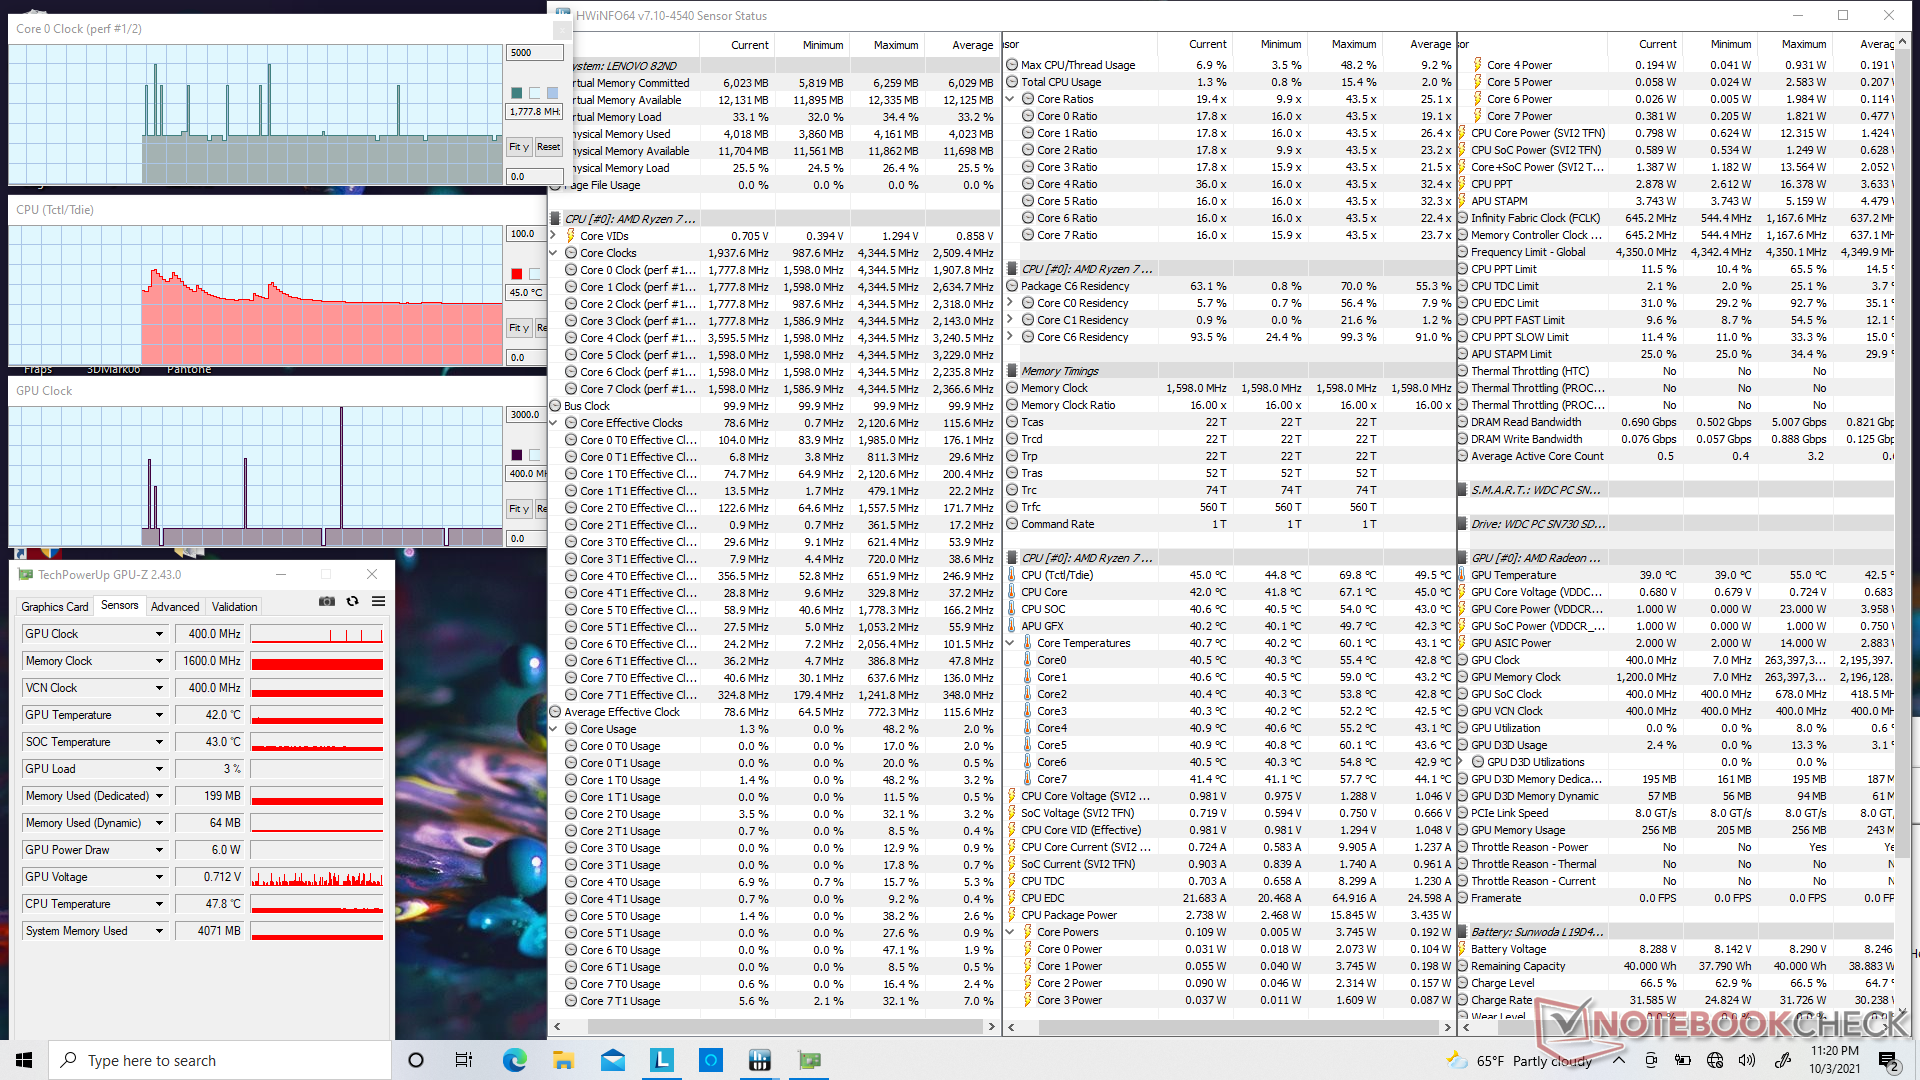
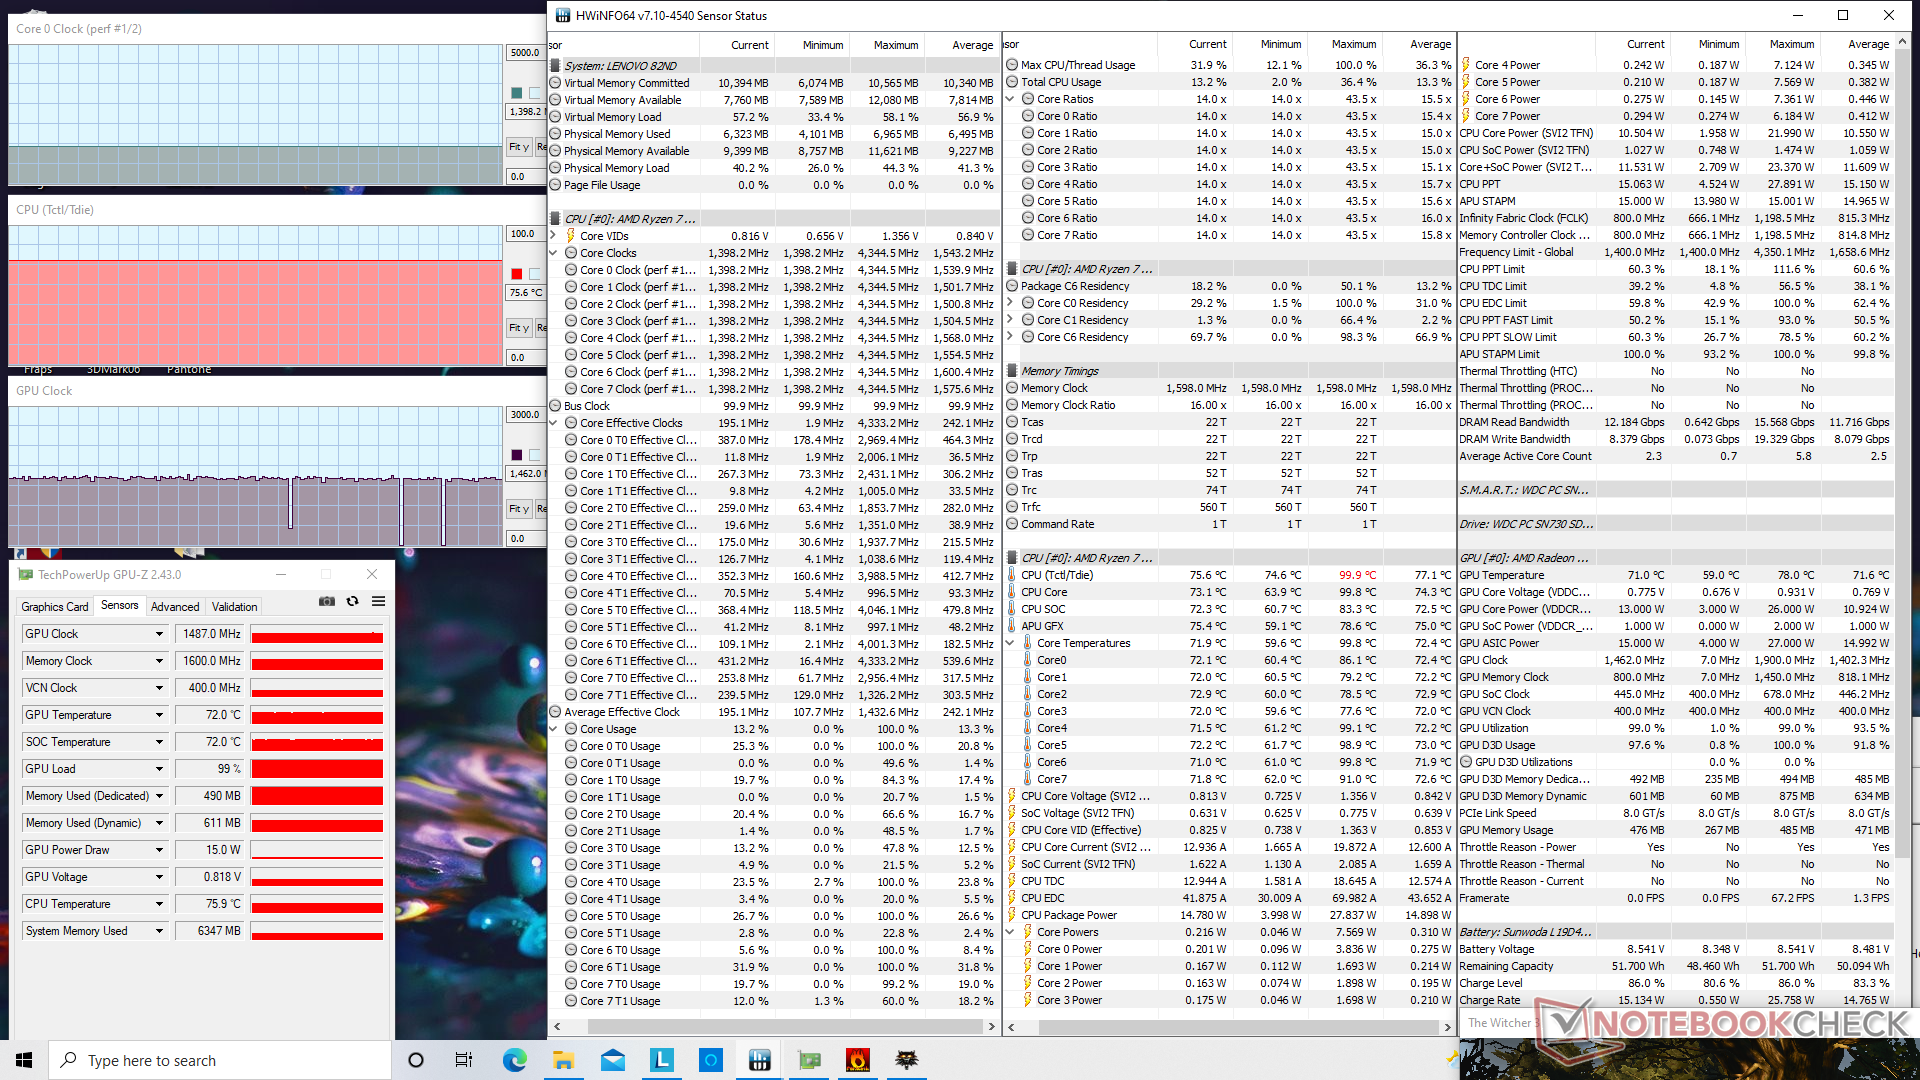
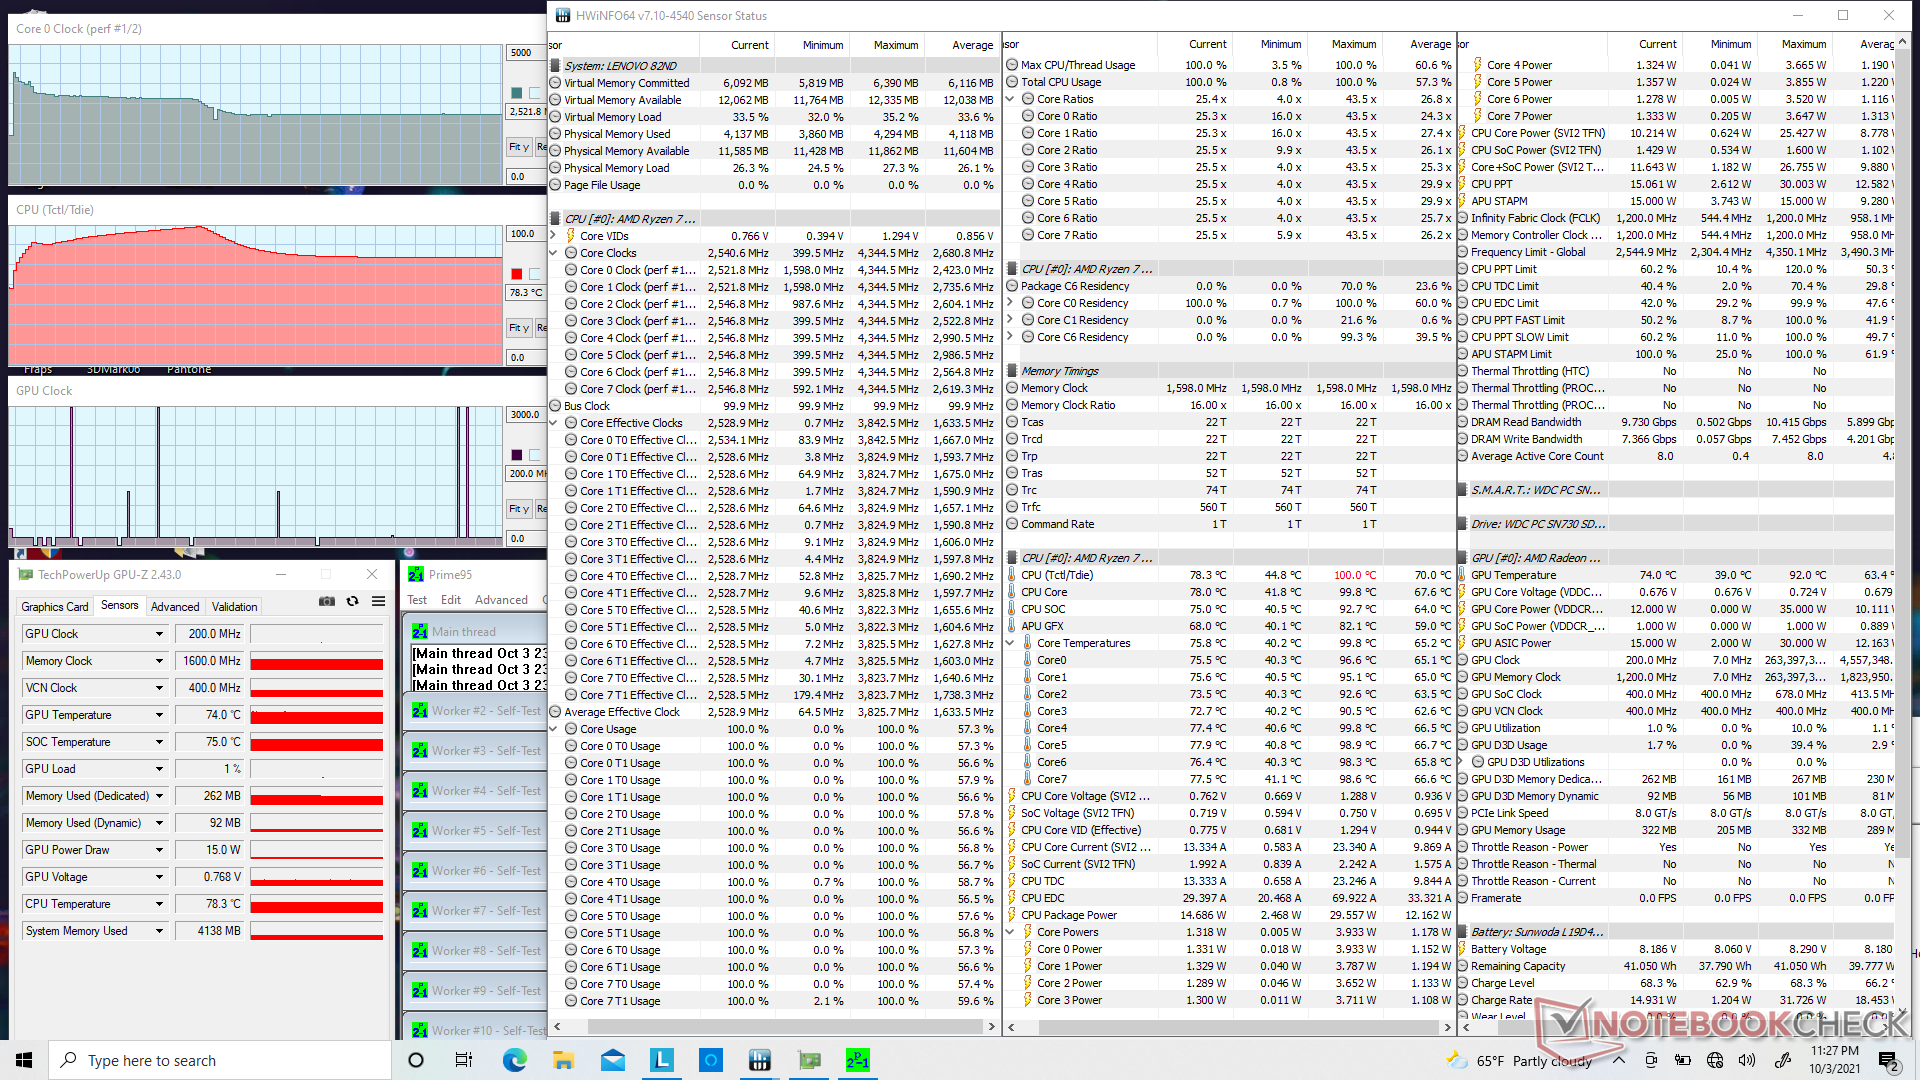
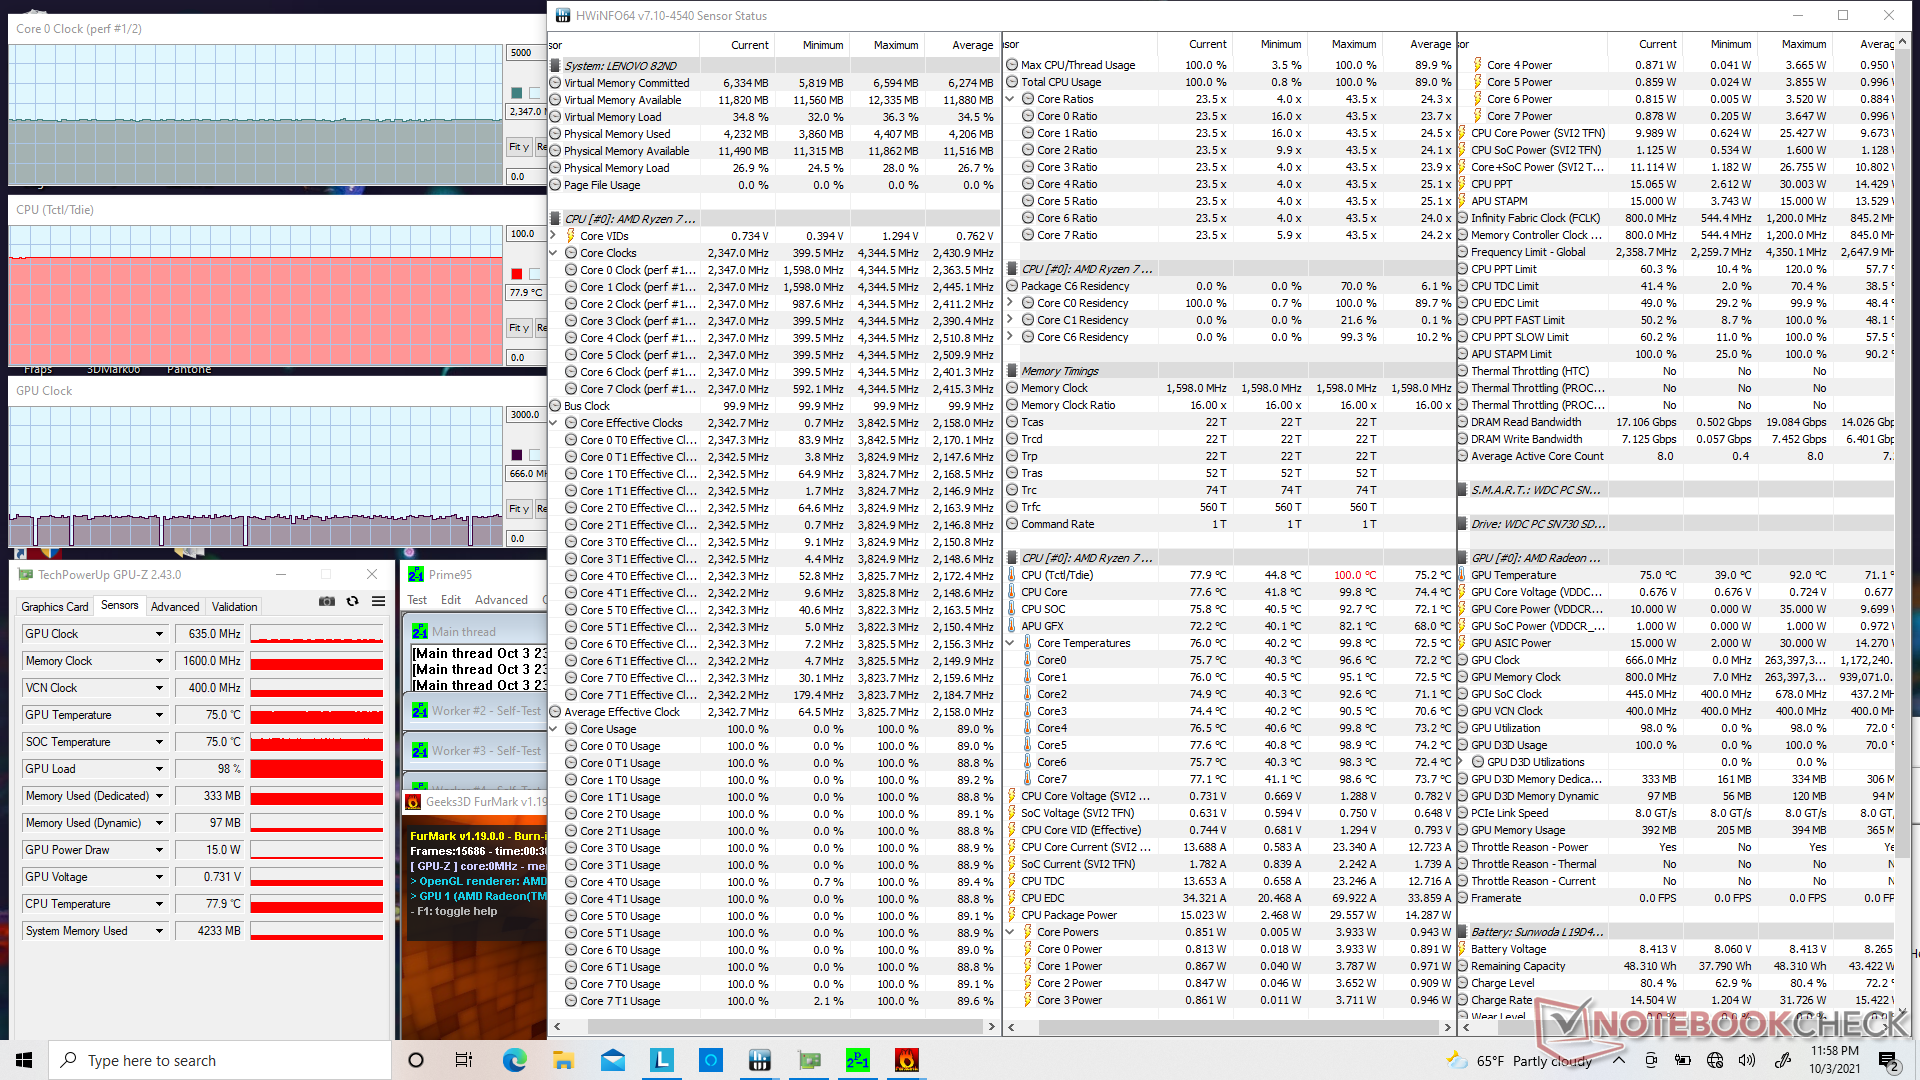
Stress test - solo leggermente più caldo
Quando si esegue Prime95, la CPU aumenterebbe a 3,9 GHz solo per i primi secondi fino a raggiungere una temperatura del core di 89 C. In seguito, le frequenze di clock scenderebbero a 3,1 - 3,2 GHz per il prossimo paio di minuti prima di stabilizzarsi finalmente a 2,5 GHz e 78 C. Osserveremmo risultati simili ma leggermente più freddi sulla SKU Ryzen 5 dove le frequenze di clock della CPU e la temperatura si stabilizzerebbero invece a 2,6 GHz e 72 C
Quando si esegue Witcher 3, la frequenza di clock della GPU, il clock della memoria e la temperatura si stabilizzerebbero a 1487 MHz, 1600 MHz e 72 C rispetto a 1400 MHz, 1333 MHz e 66 C sulla SKU Ryzen 5. Gli utenti vedranno prestazioni di gioco più veloci dalla SKU Ryzen 7, anche se con temperature del core leggermente più alte
L'esecuzione con la batteria avrà un impatto sulle prestazioni solo leggermente. Un test 3DMark 11 a batteria restituirebbe punteggi di fisica e grafica di 10889 e 5526 punti, rispettivamente, rispetto a 10888 e 5693 punti quando è in funzione.
| Clock della CPU (GHz)Clock della GPU(MHz)Temperaturamedia dellaCPU (°C) |
| Sistema inattivo |
| Stress Prime95 |
| Prime95 + FurMark Stress |
| Witcher 3 Stress |
Altoparlanti

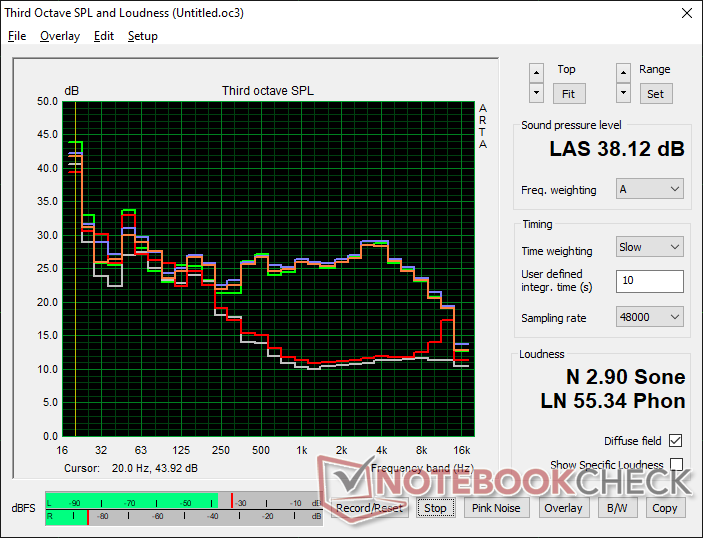
Lenovo Yoga 6 13ALC6 analisi audio
(±) | potenza degli altiparlanti media ma buona (77.7 dB)
Bassi 100 - 315 Hz
(-) | quasi nessun basso - in media 17% inferiori alla media
(±) | la linearità dei bassi è media (9.6% delta rispetto alla precedente frequenza)
Medi 400 - 2000 Hz
(+) | medi bilanciati - solo only 3.7% rispetto alla media
(+) | medi lineari (3.1% delta rispetto alla precedente frequenza)
Alti 2 - 16 kHz
(+) | Alti bilanciati - appena 3.9% dalla media
(+) | alti lineari (5.1% delta rispetto alla precedente frequenza)
Nel complesso 100 - 16.000 Hz
(±) | la linearità complessiva del suono è media (17.2% di differenza rispetto alla media
Rispetto alla stessa classe
» 32% di tutti i dispositivi testati in questa classe è stato migliore, 8% simile, 59% peggiore
» Il migliore ha avuto un delta di 6%, medio di 20%, peggiore di 57%
Rispetto a tutti i dispositivi testati
» 32% di tutti i dispositivi testati in questa classe è stato migliore, 8% similare, 60% peggiore
» Il migliore ha avuto un delta di 4%, medio di 24%, peggiore di 134%
Apple MacBook 12 (Early 2016) 1.1 GHz analisi audio
(+) | gli altoparlanti sono relativamente potenti (83.6 dB)
Bassi 100 - 315 Hz
(±) | bassi ridotti - in media 11.3% inferiori alla media
(±) | la linearità dei bassi è media (14.2% delta rispetto alla precedente frequenza)
Medi 400 - 2000 Hz
(+) | medi bilanciati - solo only 2.4% rispetto alla media
(+) | medi lineari (5.5% delta rispetto alla precedente frequenza)
Alti 2 - 16 kHz
(+) | Alti bilanciati - appena 2% dalla media
(+) | alti lineari (4.5% delta rispetto alla precedente frequenza)
Nel complesso 100 - 16.000 Hz
(+) | suono nel complesso lineare (10.2% differenza dalla media)
Rispetto alla stessa classe
» 7% di tutti i dispositivi testati in questa classe è stato migliore, 2% simile, 91% peggiore
» Il migliore ha avuto un delta di 5%, medio di 18%, peggiore di 53%
Rispetto a tutti i dispositivi testati
» 5% di tutti i dispositivi testati in questa classe è stato migliore, 1% similare, 94% peggiore
» Il migliore ha avuto un delta di 4%, medio di 24%, peggiore di 134%
Gestione energetica
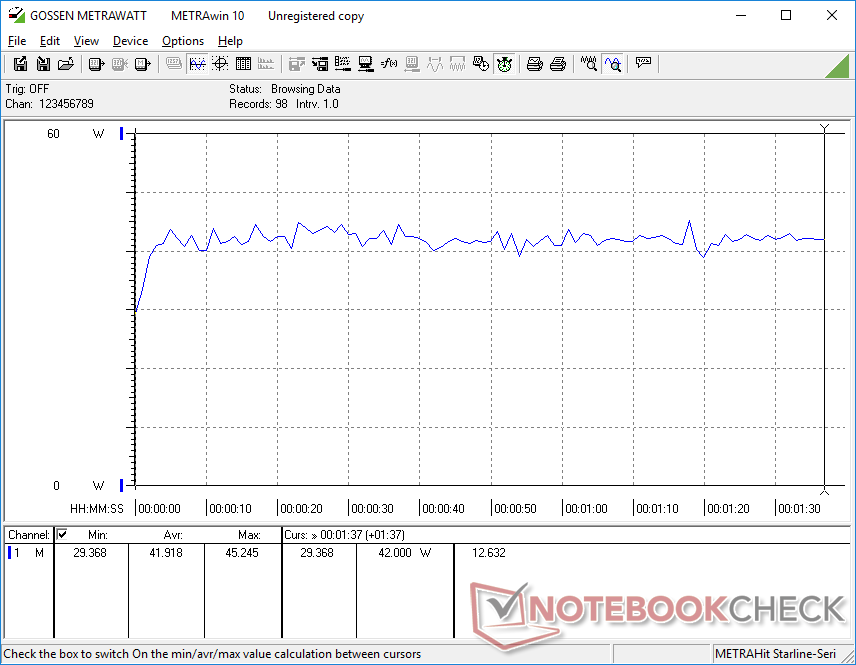
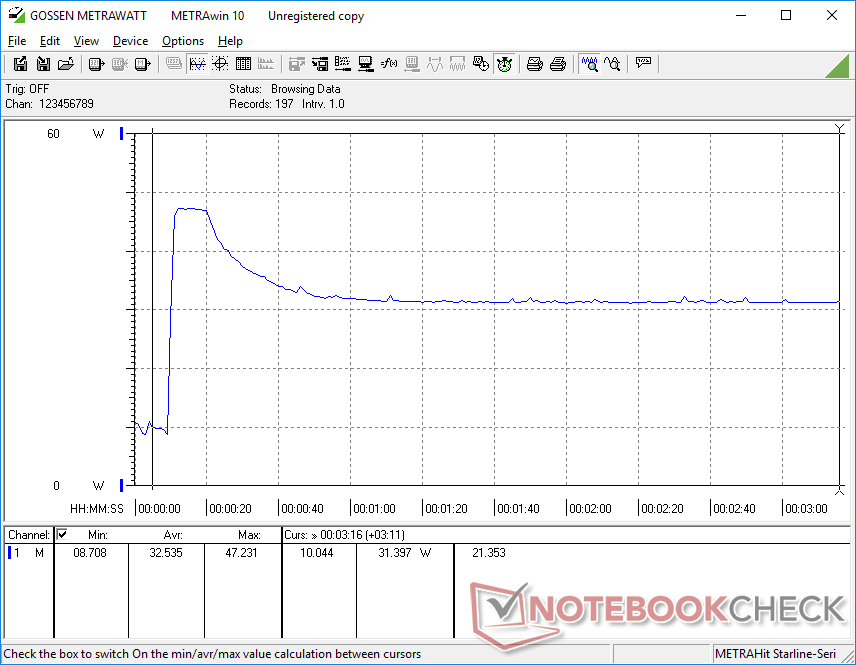
Consumo di energia
Il consumo di energia è solo marginalmente superiore alla configurazione Ryzen 5 5500U di solo uno o due watt al massimo. In generale, il sistema è più affamato di energia di un Tiger Lake-U Core i5 o Core i7 Ultrabook come l Acer Spin 3 SP313 mentre offre sia prestazioni grafiche leggermente più lente che prestazioni CPU multi-thread più elevate.
| Off / Standby | |
| Idle | |
| Sotto carico |
|
Leggenda:
min: | |
| Lenovo Yoga 6 13ALC6 R7 5700U, Vega 8, WDC PC SN730 SDBPNTY-1T00, IPS, 1920x1080, 13.3" | Lenovo Yoga 6 13 82ND0009US R5 5500U, Vega 7, WDC PC SN530 SDBPMPZ-265G, IPS, 1920x1080, 13.3" | Dell XPS 13 9310 2-in-1 i7-1165G7, Iris Xe G7 96EUs, Toshiba BG4 KBG40ZPZ512G, IPS, 1920x1200, 13.4" | Acer Spin 3 SP313-51N-56YV i5-1135G7, Iris Xe G7 80EUs, Kingston OM8PCP3512F-AB, IPS, 2560x1600, 13.3" | Lenovo IdeaPad Flex 5 CB 13IML05 82B80010GE i5-10210U, UHD Graphics 620, Samsung PM991 MZALQ128HBHQ-000L2, IPS, 1920x1080, 13.3" | HP Envy x360 13-ay0010nr R5 4500U, Vega 6, Toshiba KBG30ZMV256G, IPS, 1920x1080, 13.3" | |
|---|---|---|---|---|---|---|
| Power Consumption | 4% | 14% | 13% | 26% | 10% | |
| Idle Minimum * (Watt) | 4.9 | 5 -2% | 2.6 47% | 3.5 29% | 3.7 24% | 3.9 20% |
| Idle Average * (Watt) | 6.6 | 6.3 5% | 6.4 3% | 6.6 -0% | 5.5 17% | 5.8 12% |
| Idle Maximum * (Watt) | 7.8 | 6.9 12% | 7.7 1% | 8.5 -9% | 6.5 17% | 6 23% |
| Load Average * (Watt) | 41.9 | 41.5 1% | 29.9 29% | 32.2 23% | 27 36% | 41.5 1% |
| Witcher 3 ultra * (Watt) | 34.1 | 33.2 3% | 32.2 6% | 32.5 5% | ||
| Load Maximum * (Watt) | 47.3 | 46.5 2% | 47.5 -0% | 34.5 27% | 30.6 35% | 50.4 -7% |
* ... Meglio usare valori piccoli
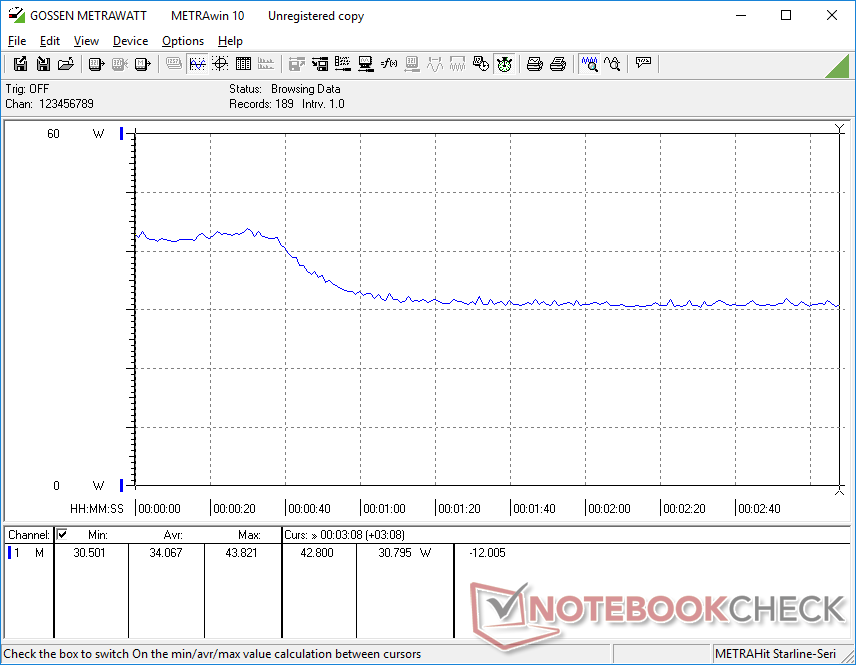
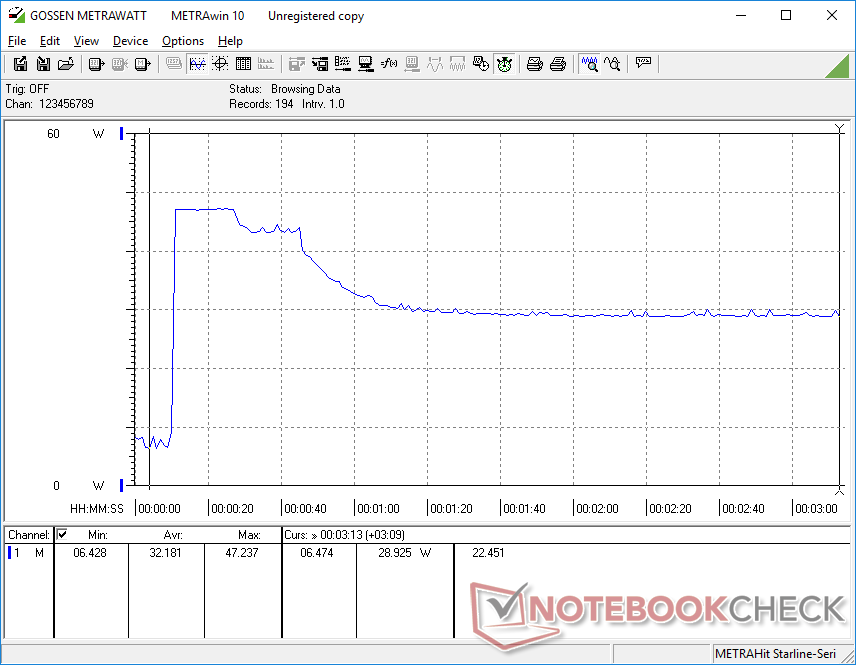
Consumo energetico The Witcher 3 / Stresstest
Durata della batteria - Abbastanza per una giornata di lavoro
La durata della batteria WLAN è di circa un'ora inferiore a quella che abbiamo registrato sulla SKU Ryzen 5. Anche così, l'autonomia di 12 ore sarà più che sufficiente per la maggior parte degli utenti
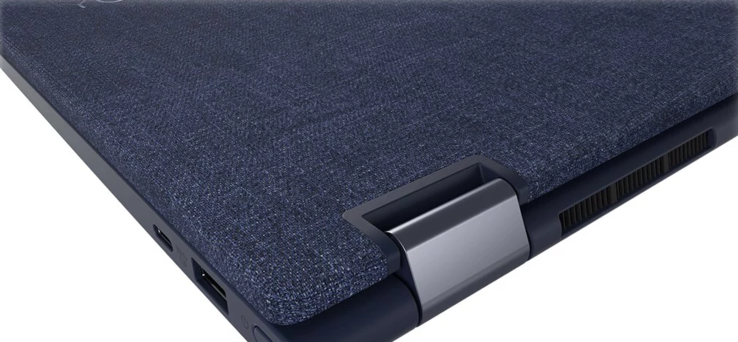
La ricarica da vuoto a piena capacità richiede circa 2 ore. Tenete a mente che solo la porta USB-C sinistra supporta la ricarica.
| Lenovo Yoga 6 13ALC6 R7 5700U, Vega 8, 60 Wh | Lenovo Yoga 6 13 82ND0009US R5 5500U, Vega 7, 60 Wh | Dell XPS 13 9310 2-in-1 i7-1165G7, Iris Xe G7 96EUs, 51 Wh | Acer Spin 3 SP313-51N-56YV i5-1135G7, Iris Xe G7 80EUs, 48 Wh | Lenovo IdeaPad Flex 5 CB 13IML05 82B80010GE i5-10210U, UHD Graphics 620, 51 Wh | HP Envy x360 13-ay0010nr R5 4500U, Vega 6, 51 Wh | |
|---|---|---|---|---|---|---|
| Autonomia della batteria | 9% | -12% | -33% | -37% | -2% | |
| WiFi v1.3 (h) | 12.1 | 13.2 9% | 10.7 -12% | 8.1 -33% | 7.6 -37% | 11.8 -2% |
| Reader / Idle (h) | 17.5 | 25.4 | 31.9 | |||
| Load (h) | 2 | 3.4 | 1.8 | 1.9 |
Pro
Contro
Valutazione complessiva - Processore molto veloce per un convertibile da 13 pollici
Passando alla configurazione Ryzen 7 5700U dal Ryzen 5 5500U gli utenti otterranno dal 15 al 20 per cento di prestazioni multi-thread più veloci e dal 10 al 15 per cento di prestazioni grafiche più veloci al costo di temperature del nucleo leggermente più calde e un'ora di durata della batteria più breve. Se si desidera spremere quanta più potenza possibile dal Lenovo Yoga 6 13, allora la configurazione Ryzen 7 può valere la pena considerare soprattutto perché è in vendita per soli $50 in più al momento.
Alte prestazioni con colori sRGB completi e un prezzo economico rendono il Lenovo Yoga 6 13 convertibile, visivamente unico, un acquisto attraente. La RAM saldata, tuttavia, è difficile da ignorare soprattutto quando la maggior parte delle vendite include solo 8 GB.
Per quanto riguarda il sistema Lenovo stesso, rimane uno dei convertibili più veloci nella sua categoria da 13 pollici in termini di prestazioni della CPU simile a quello che abbiamo concluso con il 14 pollici IdeaPad Flex 5 14. Il suo tessuto esterno ha i suoi pro e controrispetto al solito alluminio, mentre la RAM saldata può essere un problema per alcuni. Se queste caratteristiche sono importanti per voi, allora l'economico AMD-powered Asus VivoBook Flip 14 può offrire prestazioni simili, anche se con un touchscreen più debole e meno colorato.
Prezzo e disponibilità
Lenovo Yoga 6 13ALC6
- 10/04/2021 v7 (old)
Allen Ngo
Price comparison

