Recensione del Dell XPS 13 9310 2-in-1: Meglio dell'XPS 13 7390 2-in-1 in un modo specifico
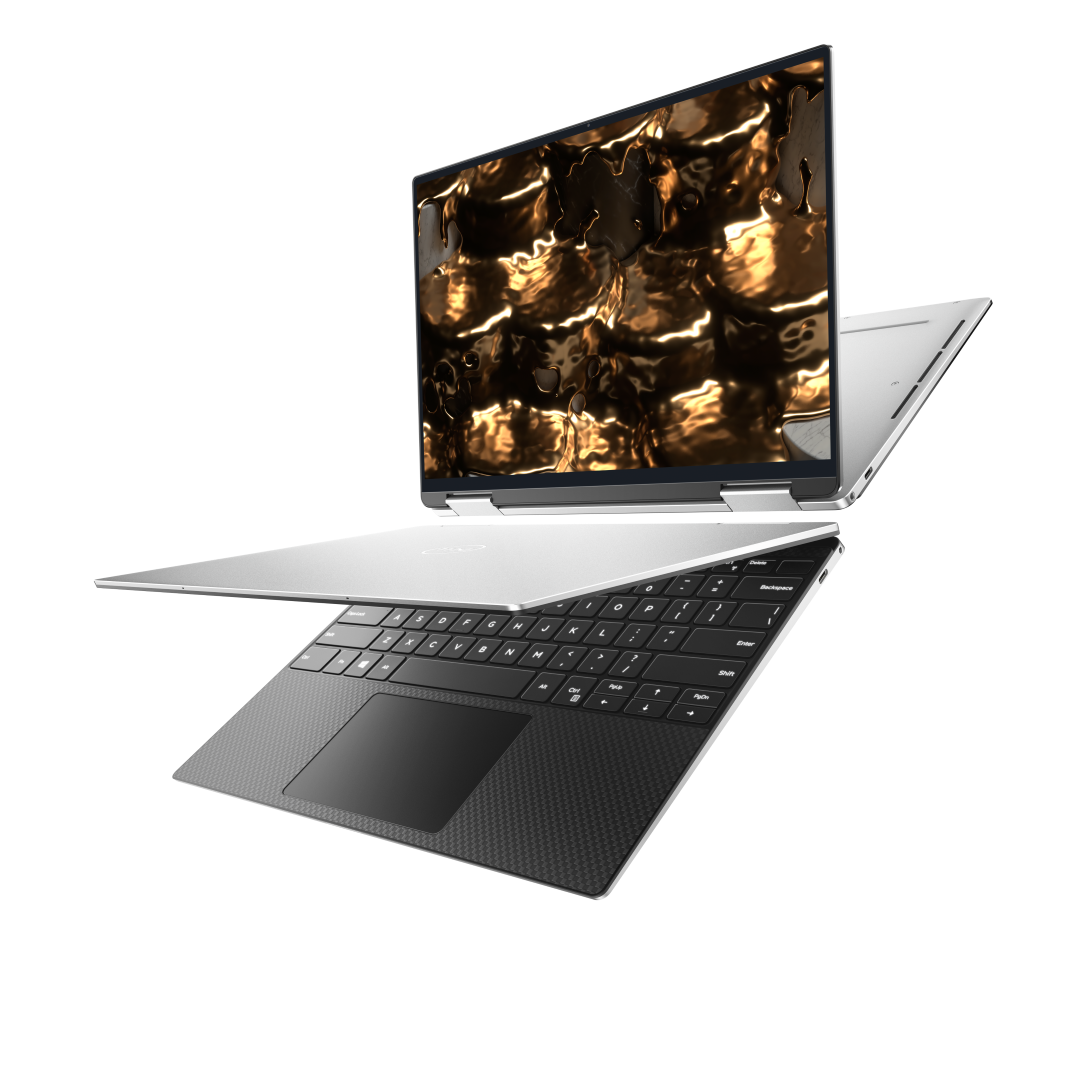
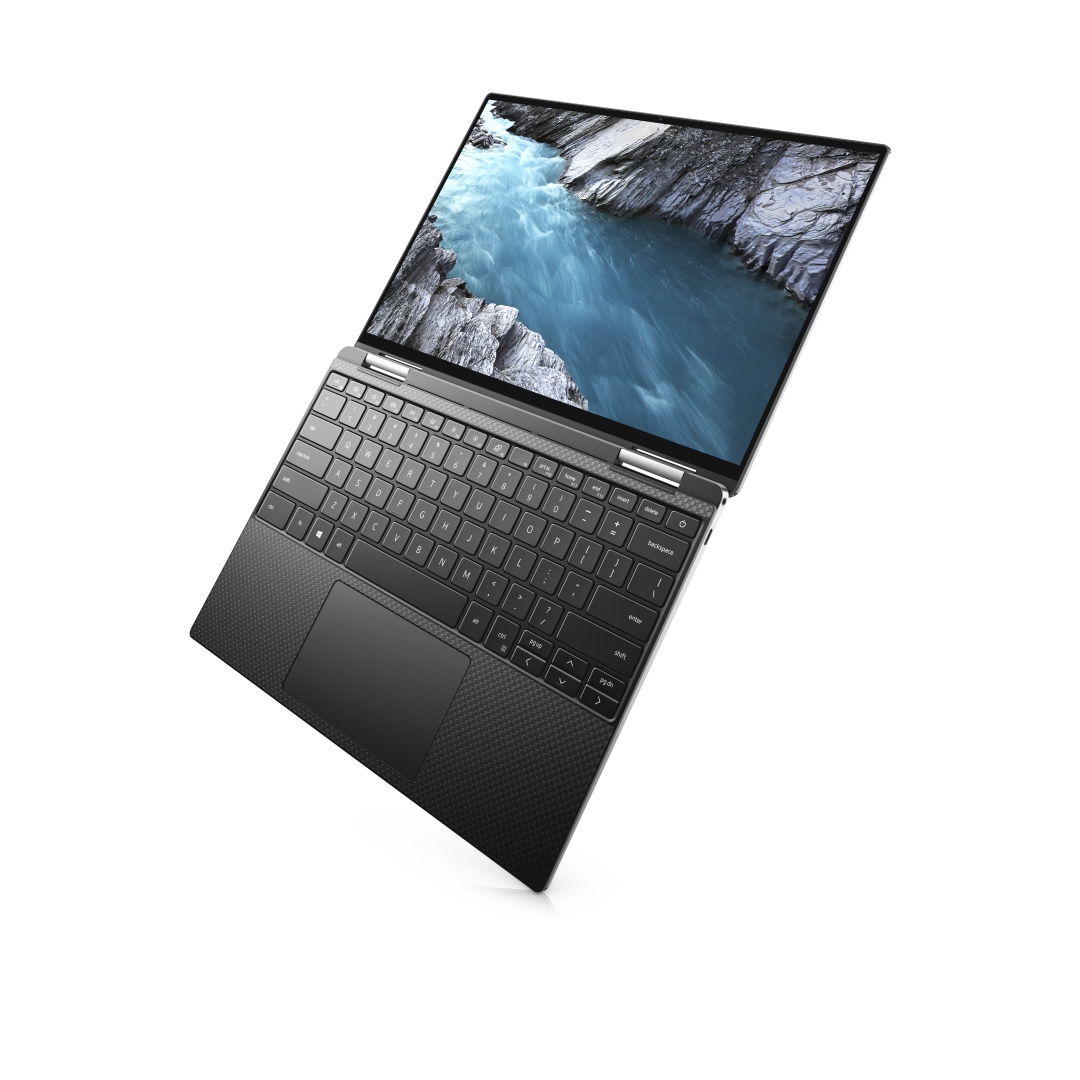
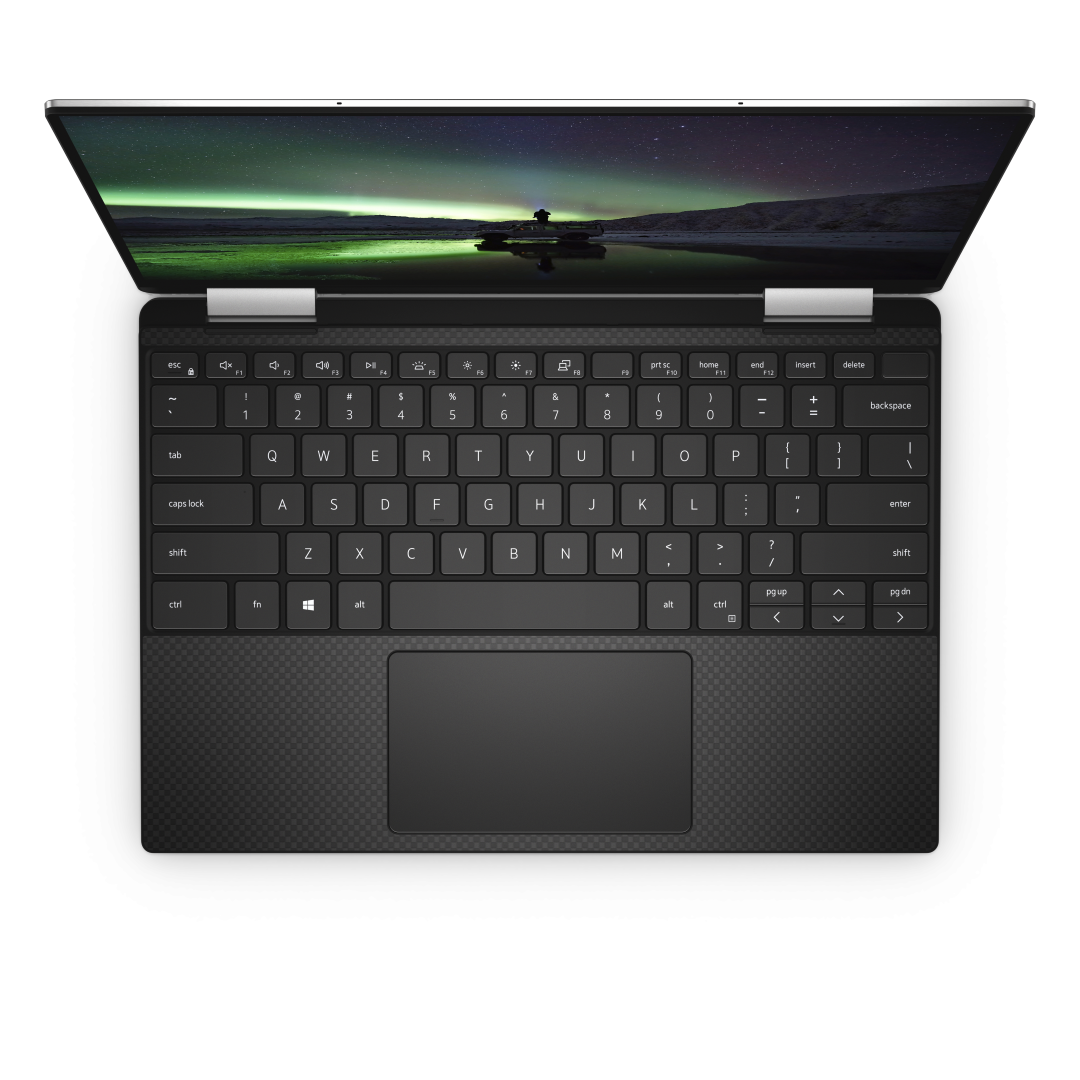
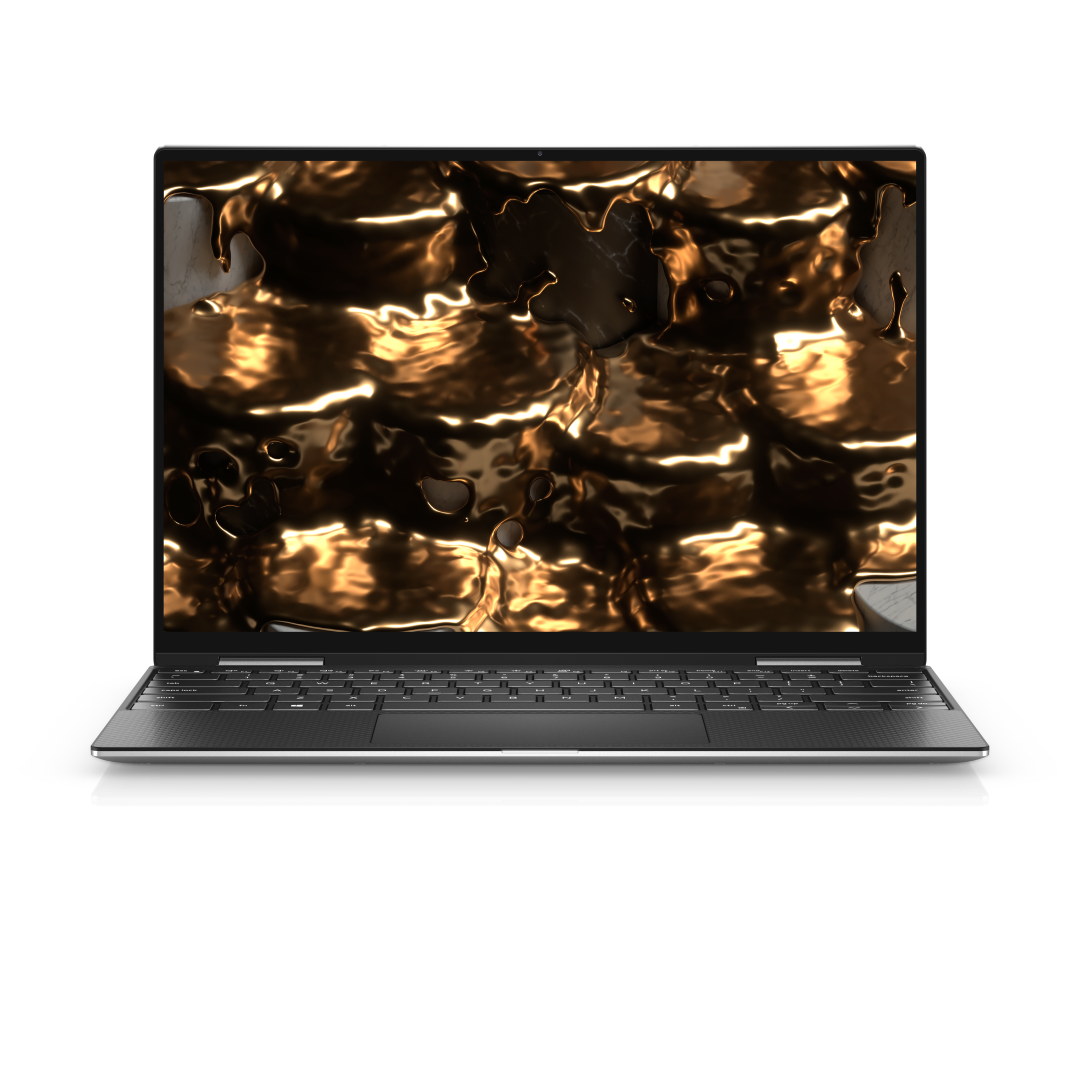
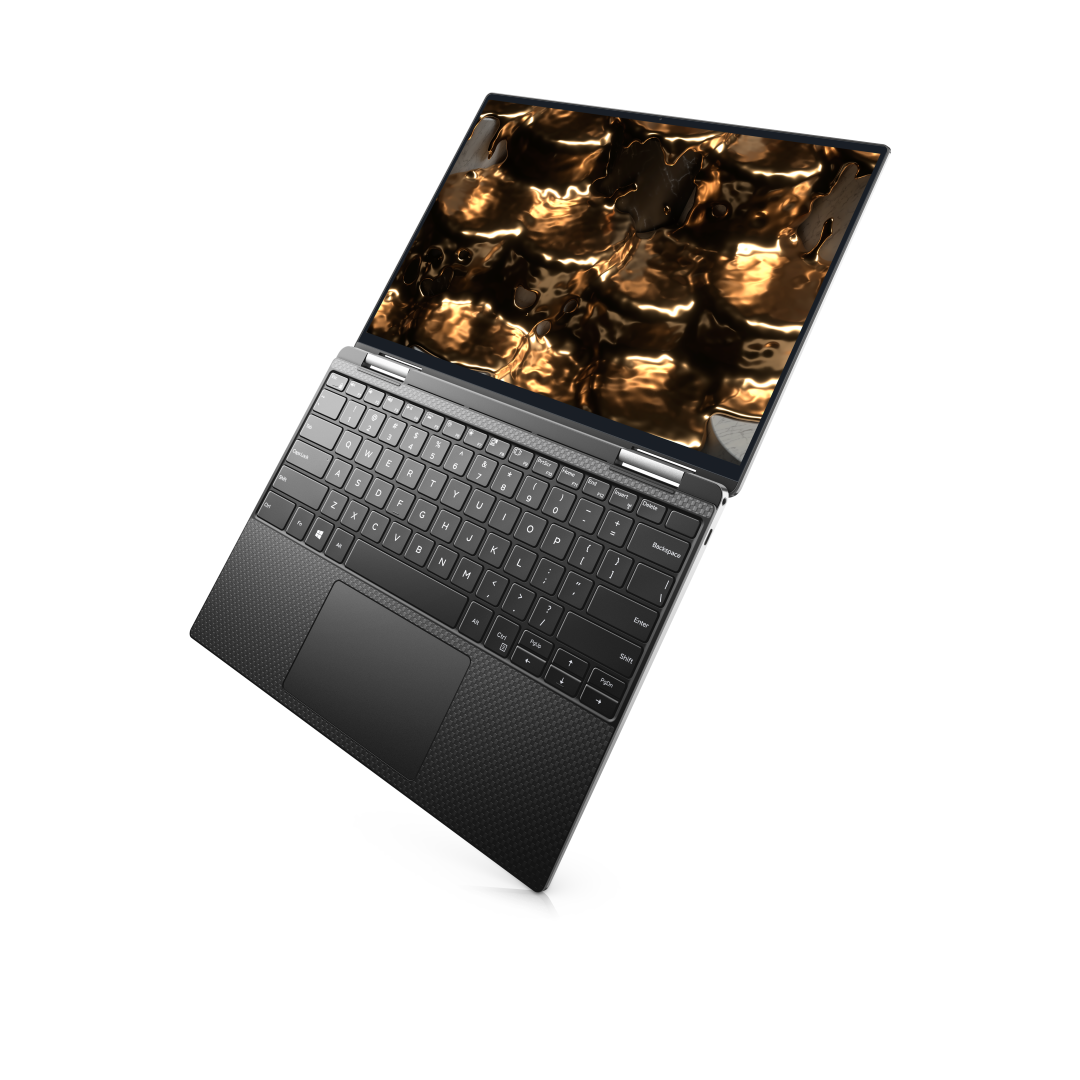
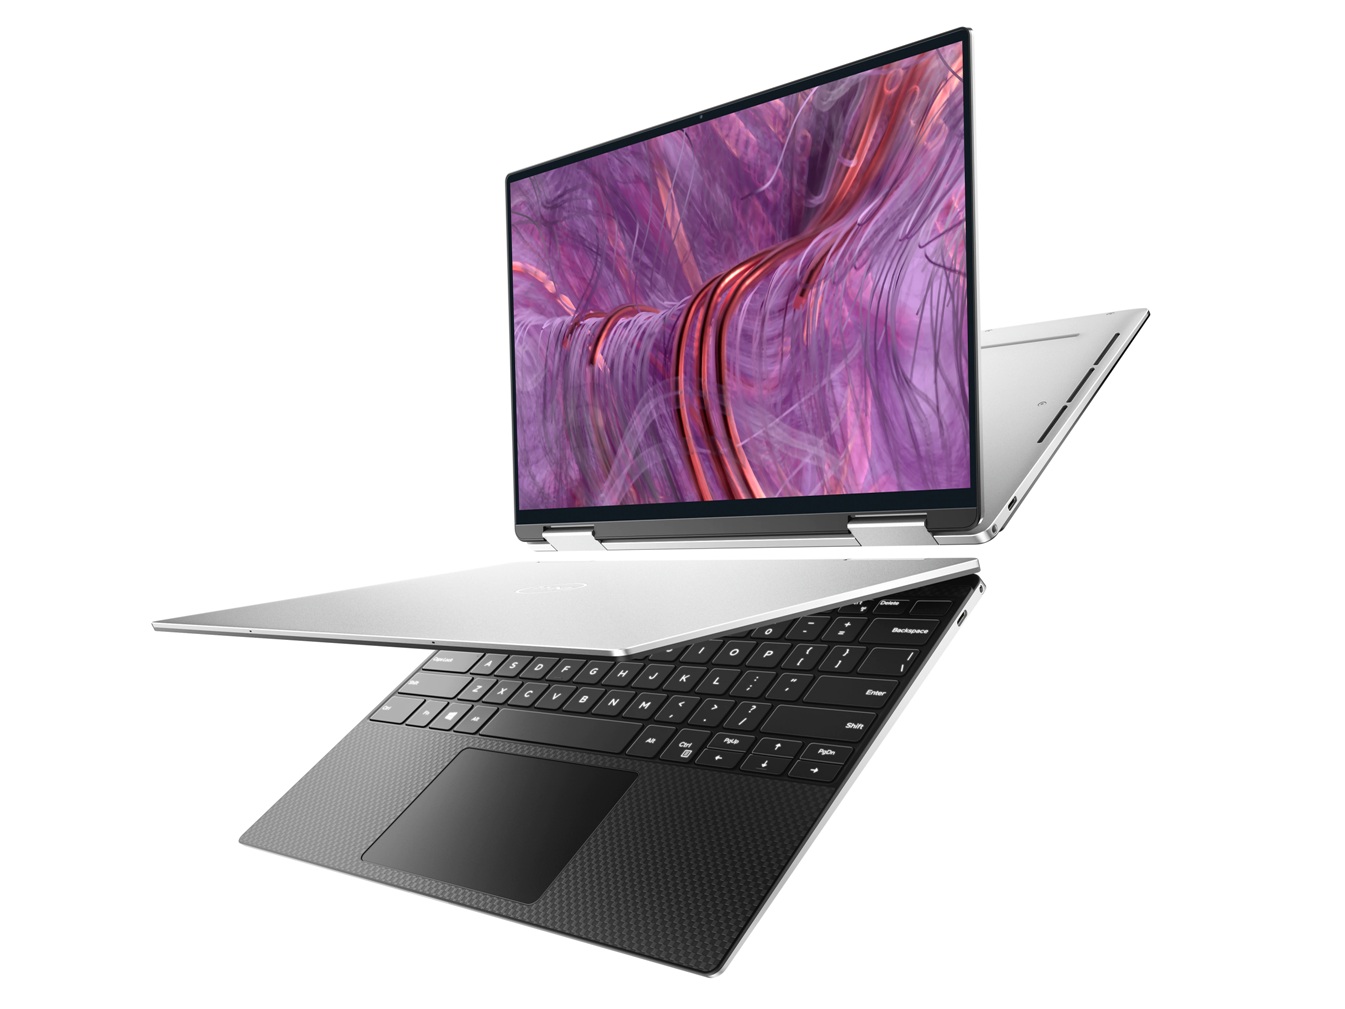
Il Dell XPS 13 9310 2-in-1 condivide lo stesso telaio dell'XPS 13 7390 2-in-1 del 2019 ma con le nuove opzioni Tiger Lake-U 11th gen Intel per sostituire le vecchie opzioni Ice Lake 10th gen. Quindi, le caratteristiche chiave del 7390 2-in-1 rimangono tutte intatte sul 9310 2-in-1, compresi i tasti della tastiera MagLev, il dispositivo di raffreddamento della camera di vapore, il touchscreen da 13,4 pollici 16:10 e la webcam posizionata correttamente.
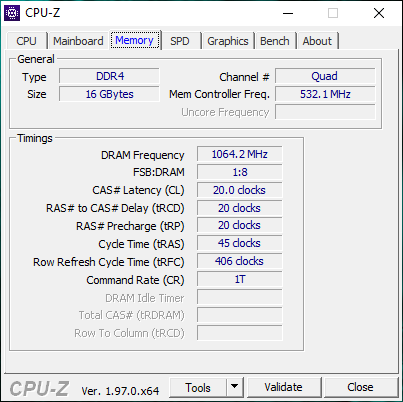
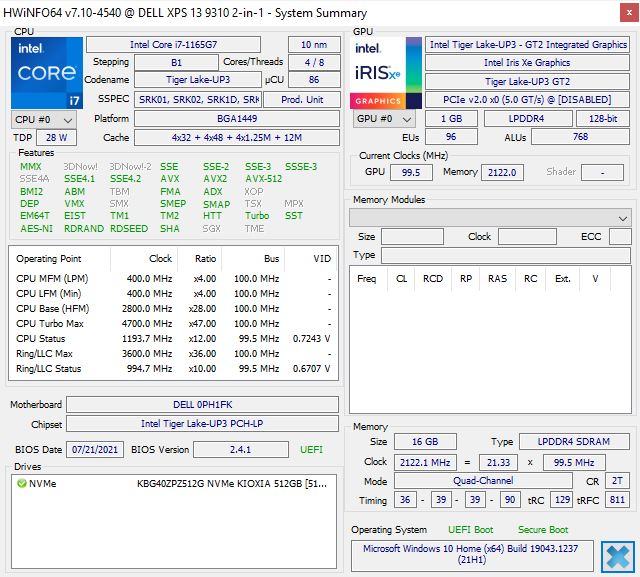
La nostra unità di test è stata configurata con la CPU Core i7-1165G7, 16 GB LPDDR4x 4267 MHz RAM, e 1920 x 1200 touchscreen per circa $1600 USD. Altre opzioni includono una CPU Core i5-1135G7 con metà della RAM o un display a più alta risoluzione 3840 x 2400. Nessuna opzione OLED è disponibile a differenza dell'XPS 13 9310 clamshell.
Raccomandiamo di controllare la nostra recensione esistente sull'XPS 13 7390 2-in-1 per saperne di più sulle caratteristiche fisiche dello chassis, dato che tutti i nostri commenti valgono anche per il 9310 2-in-1. Questa recensione si concentrerà sulle prestazioni dell'XPS 13 9310 2-in-1 e su ciò che gli utenti possono aspettarsi di guadagnare rispetto al più vecchio ma visivamente identico 7390 2-in-1.
I concorrenti in questo spazio includono altri convertibili subnotebook da 13 pollici come il Lenovo Yoga 6 13, Asus ZenBook Flip 13, Samsung Galaxy Book Pro 360 13, o MSI vertice E13 Flip. Una versione a conchiglia dell'XPS 13 9310 2-in-1 è anche disponibile semplicemente chiamata XPS 13 9310.
Altre recensioni di Dell
potential competitors in comparison
Punteggio | Data | Modello | Peso | Altezza | Dimensione | Risoluzione | Prezzo |
|---|---|---|---|---|---|---|---|
| 86.7 % v7 (old) | 10/2021 | Dell XPS 13 9310 2-in-1 i7-1165G7, Iris Xe G7 96EUs | 1.3 kg | 14.35 mm | 13.40" | 1920x1200 | |
| 88.1 % v7 (old) | 10/2020 | Dell XPS 13 9310 Core i7 FHD i7-1165G7, Iris Xe G7 96EUs | 1.3 kg | 14.8 mm | 13.40" | 1920x1200 | |
| 86.3 % v7 (old) | 10/2019 | Dell XPS 13 7390 2-in-1 Core i7 i7-1065G7, Iris Plus Graphics G7 (Ice Lake 64 EU) | 1.3 kg | 13 mm | 13.40" | 1920x1200 | |
| 84.7 % v7 (old) | 07/2021 | Lenovo Yoga 6 13 82ND0009US R5 5500U, Vega 7 | 1.3 kg | 18.2 mm | 13.30" | 1920x1080 | |
| 86.3 % v7 (old) | 07/2021 | Asus ZenBook Flip 13 UX363EA-HP069T i7-1165G7, Iris Xe G7 96EUs | 1.2 kg | 13 mm | 13.30" | 1920x1080 | |
| 85.4 % v7 (old) | 06/2021 | Samsung Galaxy Book Pro 360 13 i5-1135G7, Iris Xe G7 80EUs | 1.1 kg | 13 mm | 13.20" | 1920x1080 |
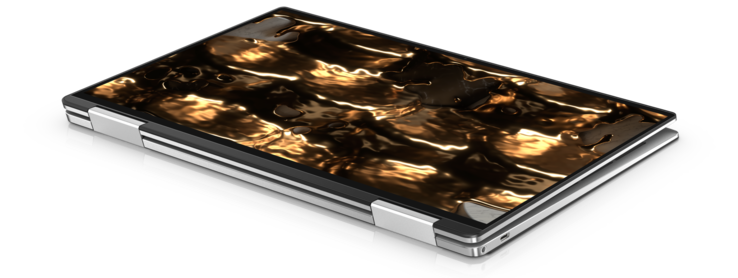
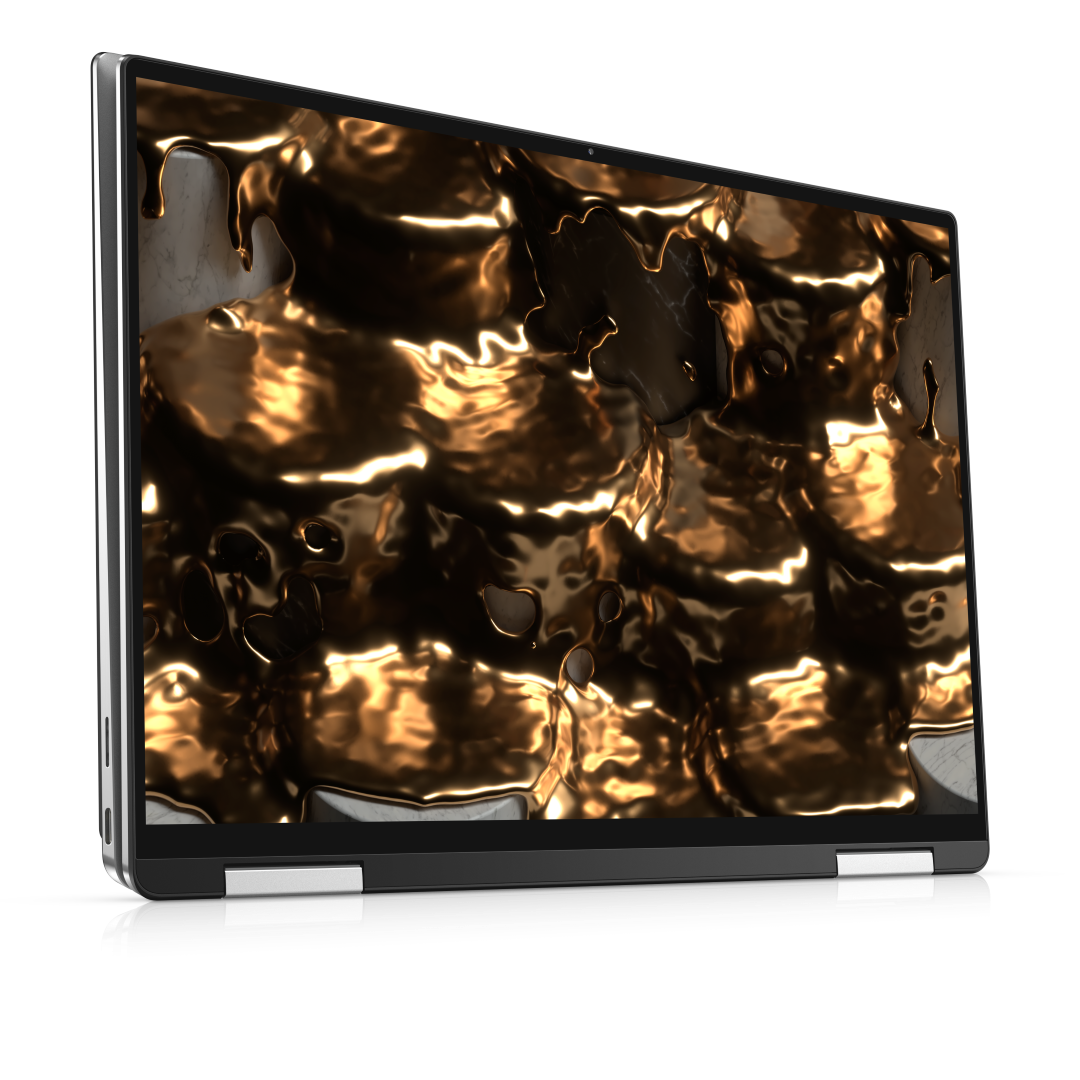
Case - Ancora il convertibile più elegante in circolazione
Il telaio rimane identico a quello dell'XPS 13 7390 2-in-1. Tuttavia, il modo in cui Dell misura le dimensioni è cambiato da allora e quindi le misure ufficiali sono ora 14.35 x 297 x 207 mm invece di 13 x 296 x 207 mm sul vecchio 7390 2-in-1.

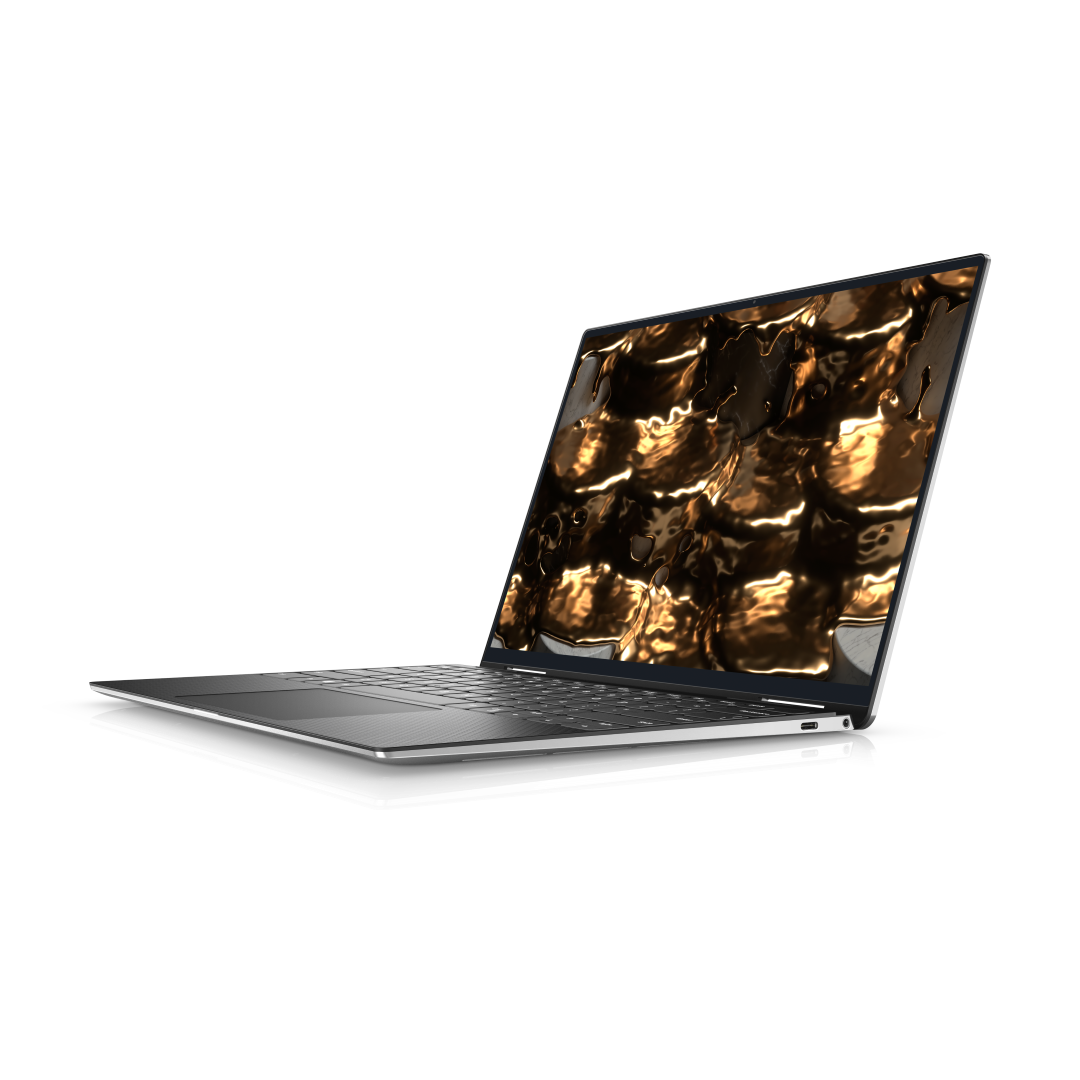


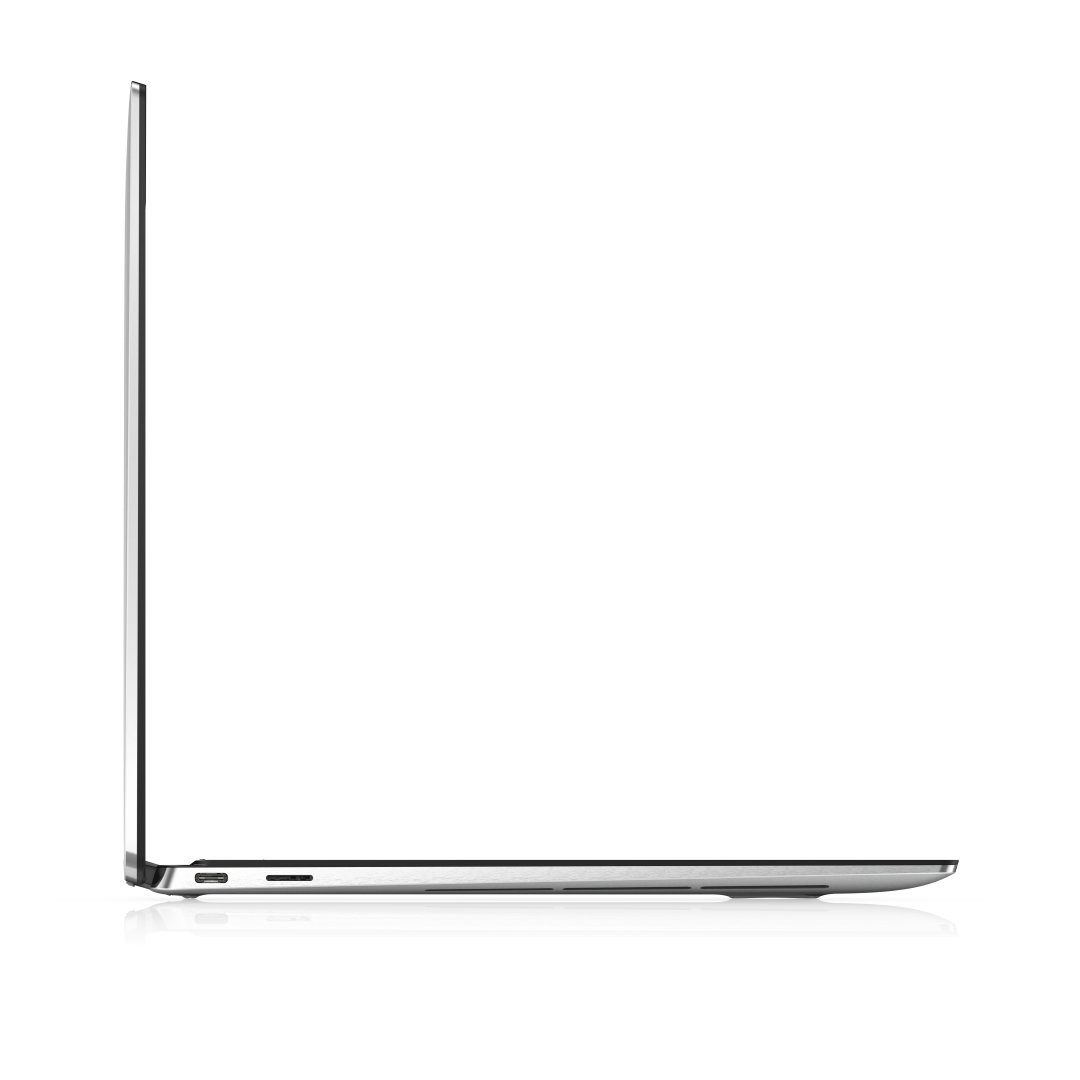
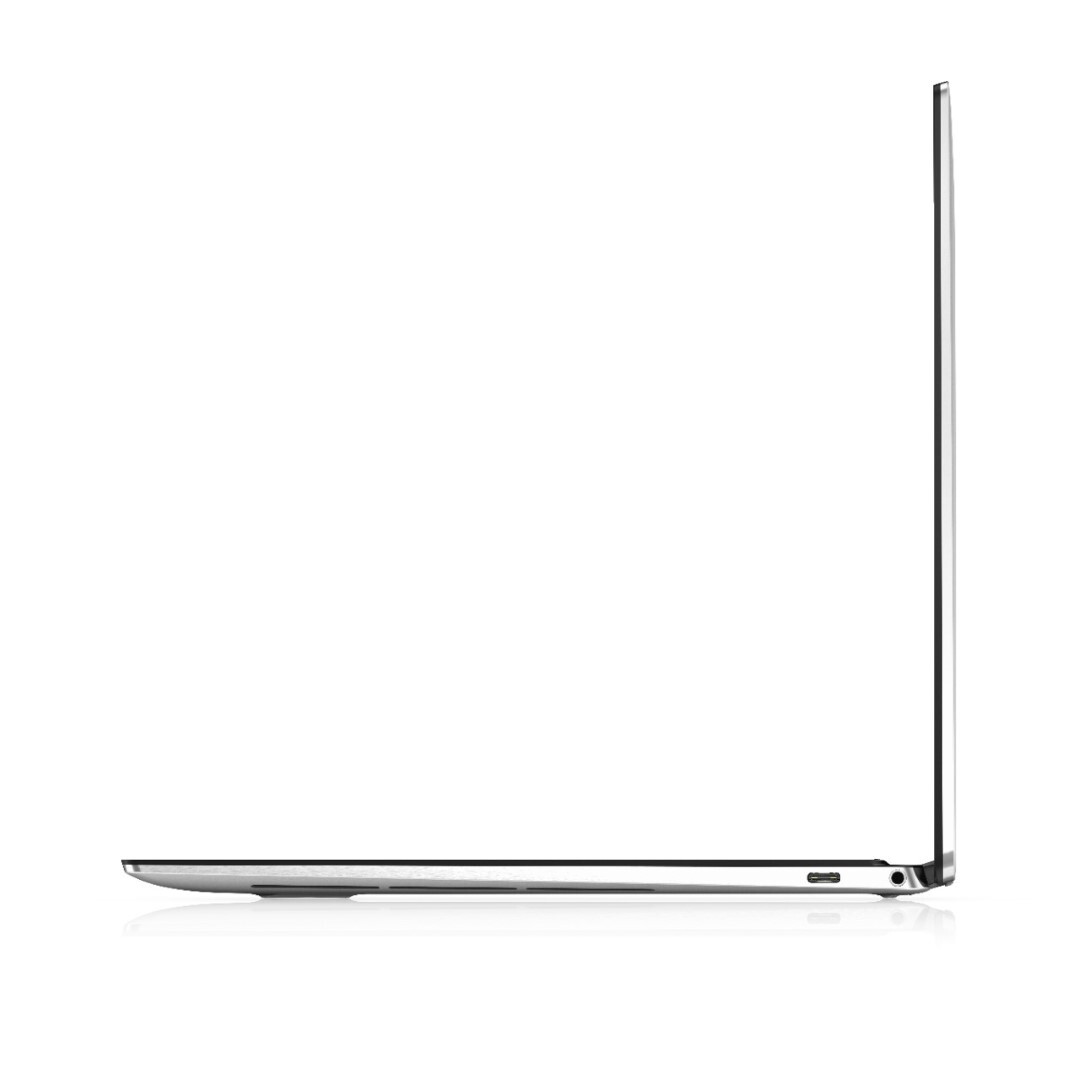
Connettività - Ora con Thunderbolt 4
Le due porte Thunderbolt 3 del modello precedente sono state aggiornate a Thunderbolt 4. Questo non farà la differenza per la maggior parte degli utenti, tranne per coloro che intendono collegare una grafica esterna.
Lettore di schede SD
| SD Card Reader | |
| average JPG Copy Test (av. of 3 runs) | |
| Dell XPS 13 9310 Core i7 FHD (Toshiba Exceria Pro M501 64 GB UHS-II) | |
| Dell XPS 13 9310 2-in-1 (AV Pro V60) | |
| Dell XPS 13 7390 2-in-1 Core i7 (Toshiba Exceria Pro M501 64 GB UHS-II) | |
| Samsung Galaxy Book Pro 360 13 | |
| maximum AS SSD Seq Read Test (1GB) | |
| Dell XPS 13 9310 Core i7 FHD (Toshiba Exceria Pro M501 64 GB UHS-II) | |
| Dell XPS 13 9310 2-in-1 (AV Pro V60) | |
| Dell XPS 13 7390 2-in-1 Core i7 (Toshiba Exceria Pro M501 64 GB UHS-II) | |
| Samsung Galaxy Book Pro 360 13 | |
Comunicazione
Webcam
La webcam a bassa risoluzione 720p rimane invariata, il che è un vero peccato. Il ultimo portatile Razer Blade ha aggiornato la sua webcam da 720p a 1080p senza altre modifiche allo chassis e quindi sarebbe stato bello vedere qualcosa di simile su questo XPS 13 refresh.


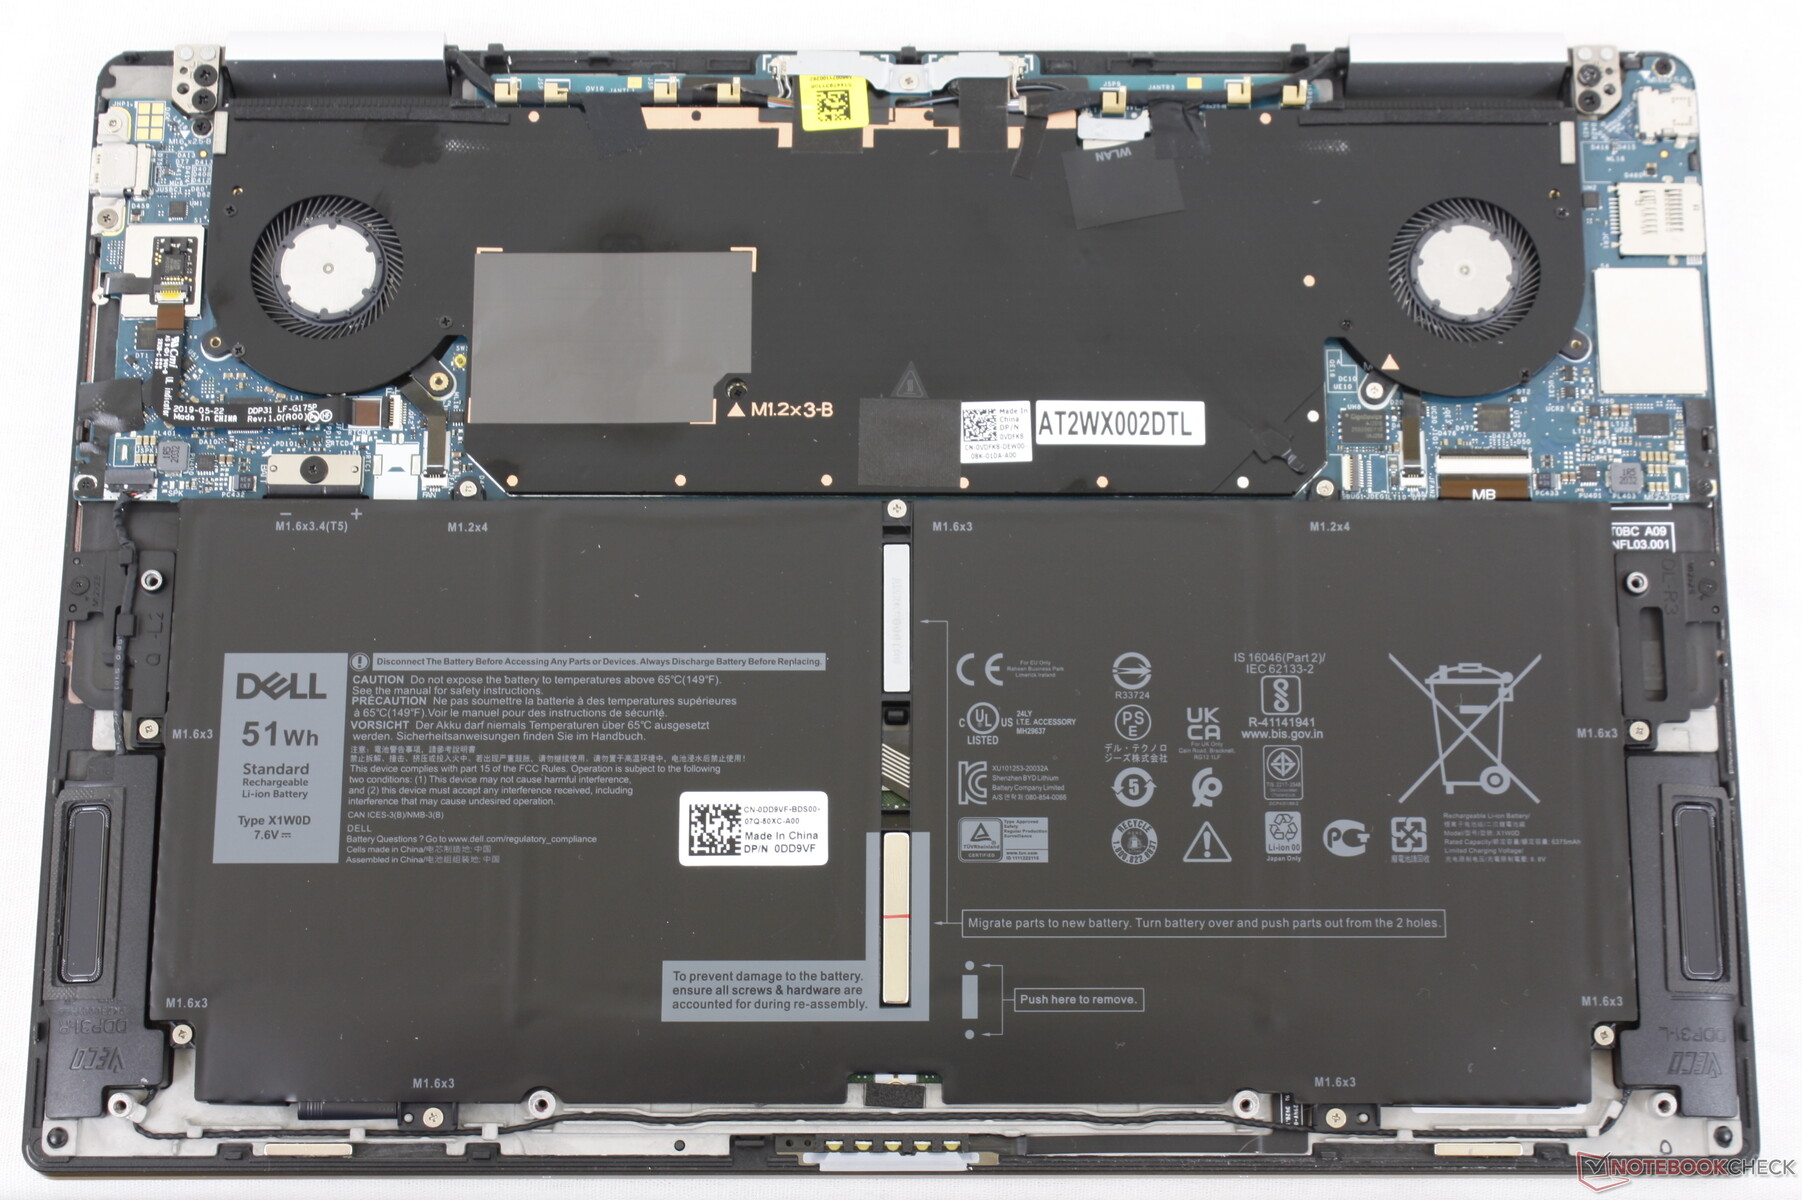
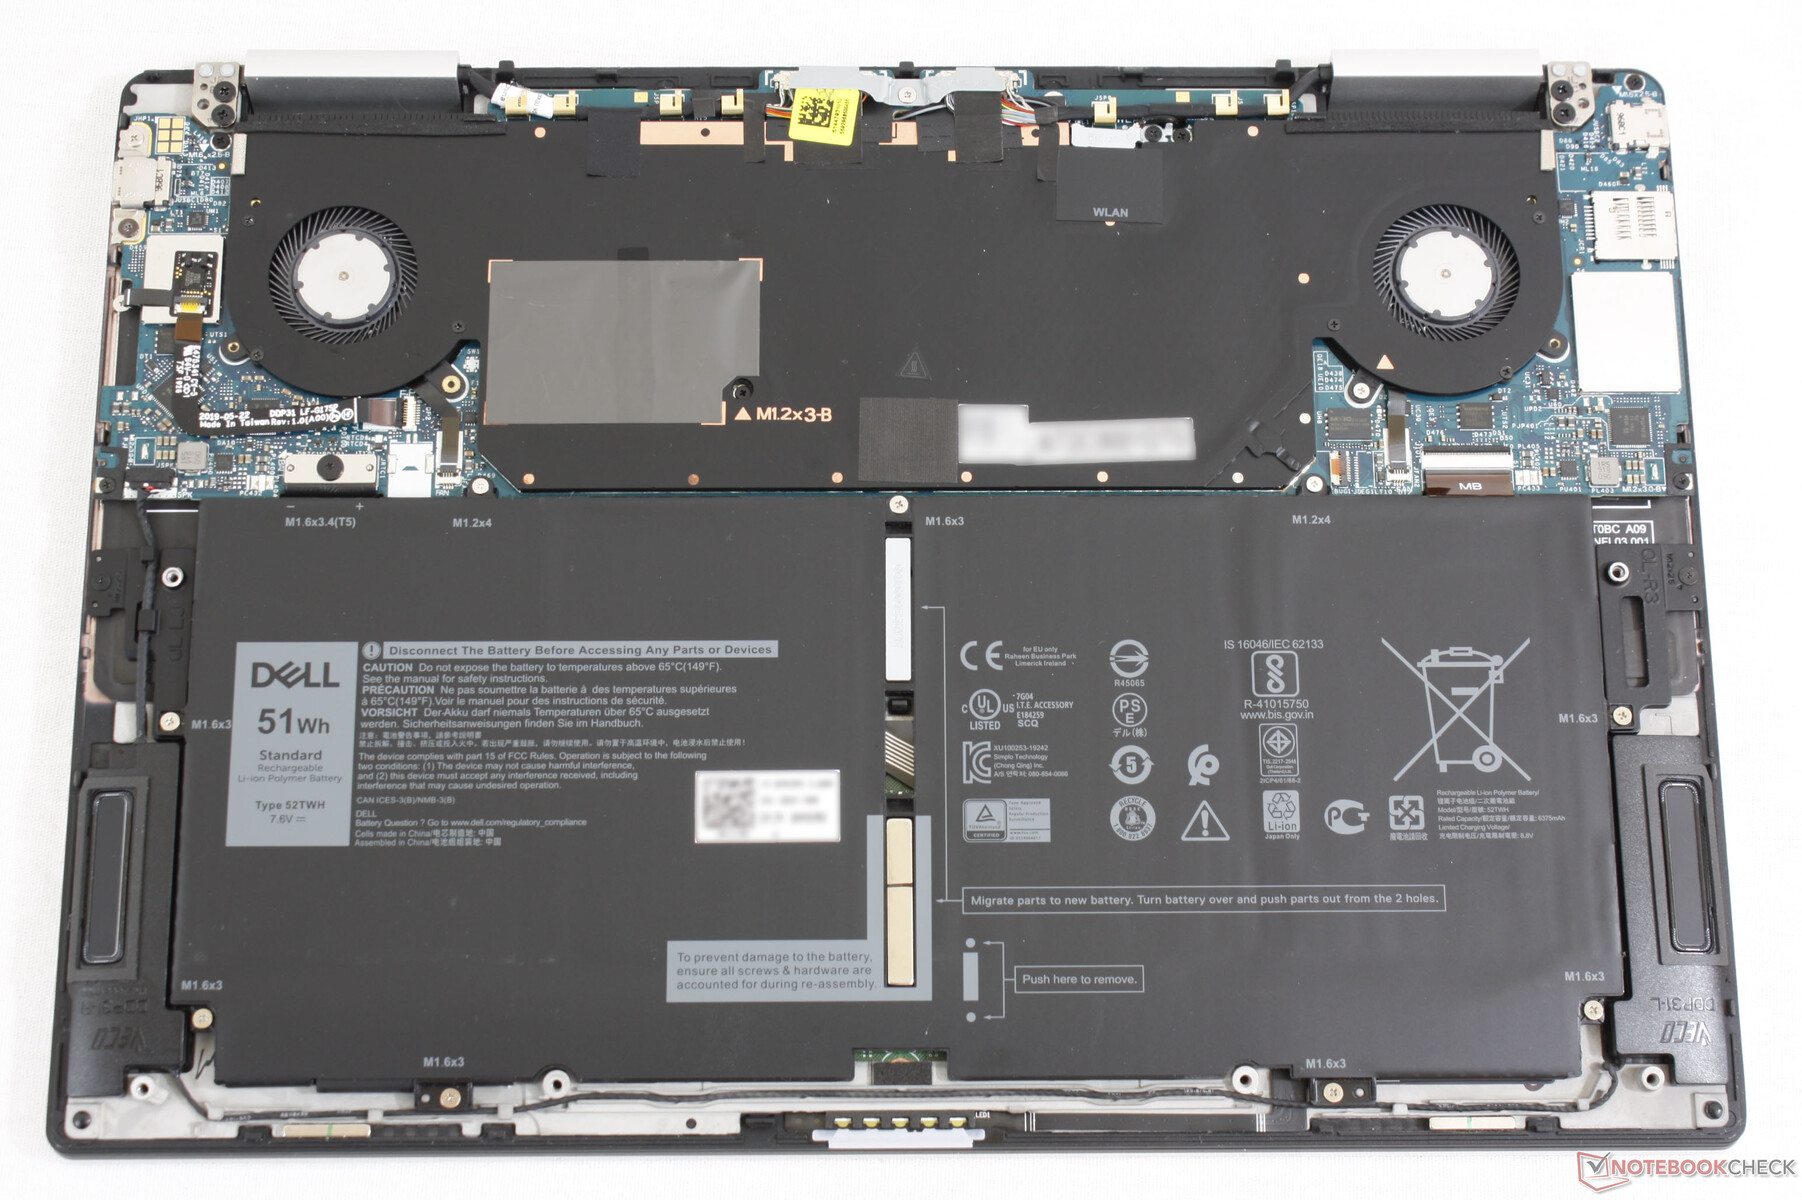
Manutenzione
Accessori e garanzia
Gli extra includono un adattatore da USB-C a USB-A, dato che il sistema non integra porte USB-A full-size. L'imballaggio è anche fatto completamente con materiali riciclati e il 25 per cento di plastiche legate all'oceano, che sono bei tocchi ecologici
La garanzia limitata standard di un anno si applica con molte opzioni di estensione se acquistato direttamente da Dell.
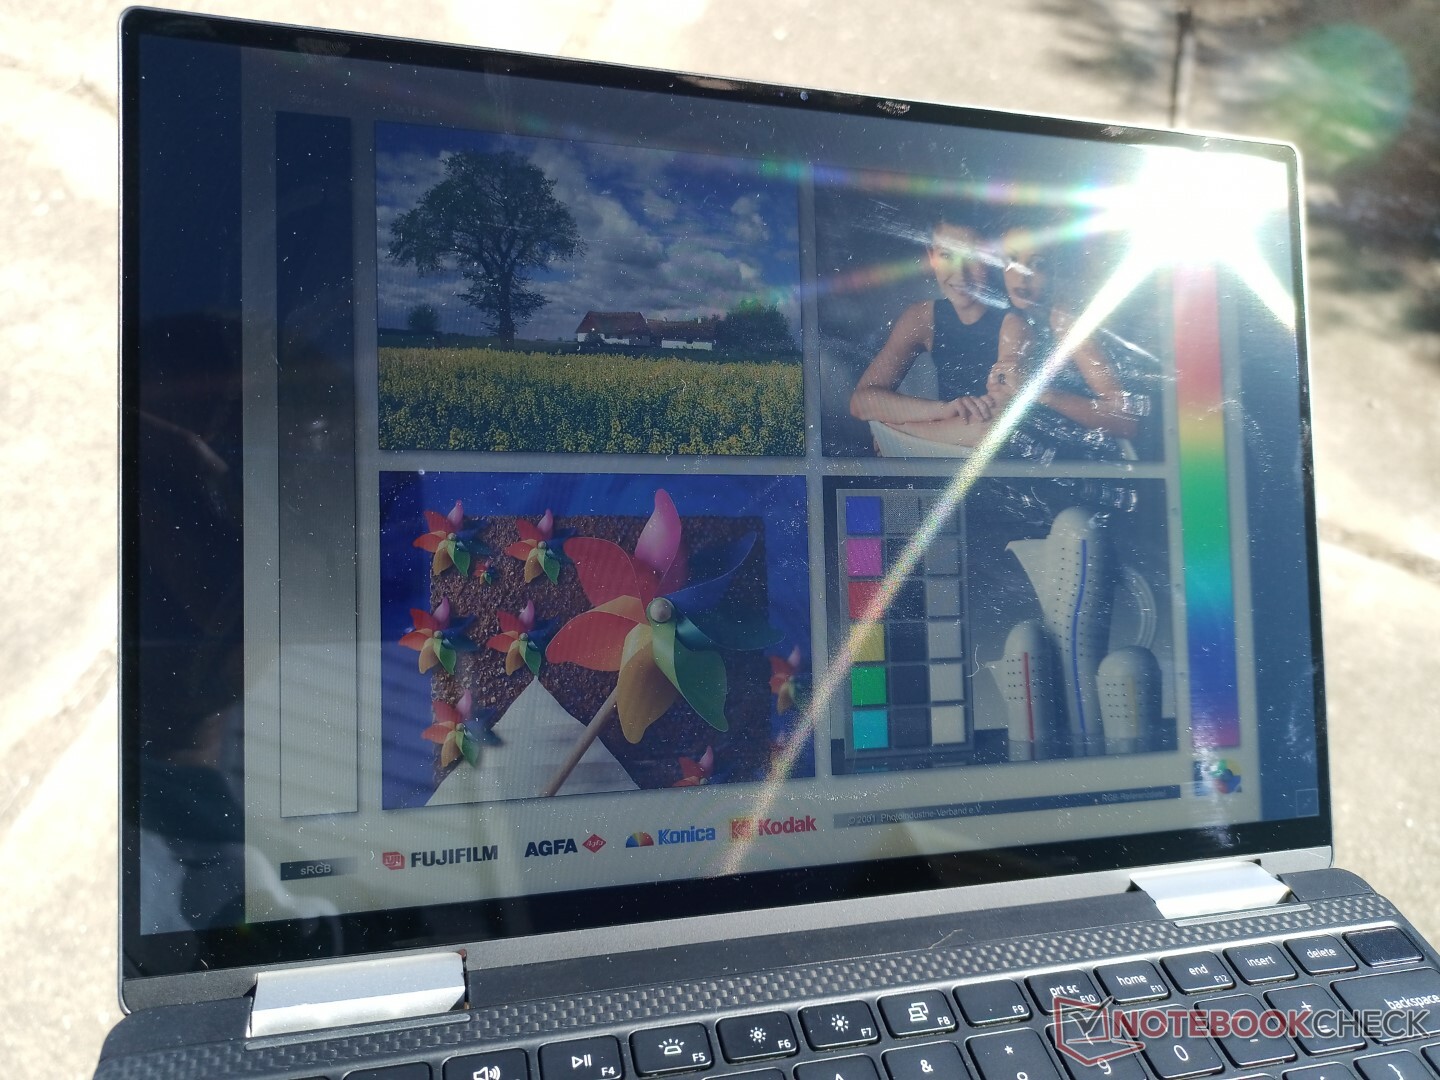
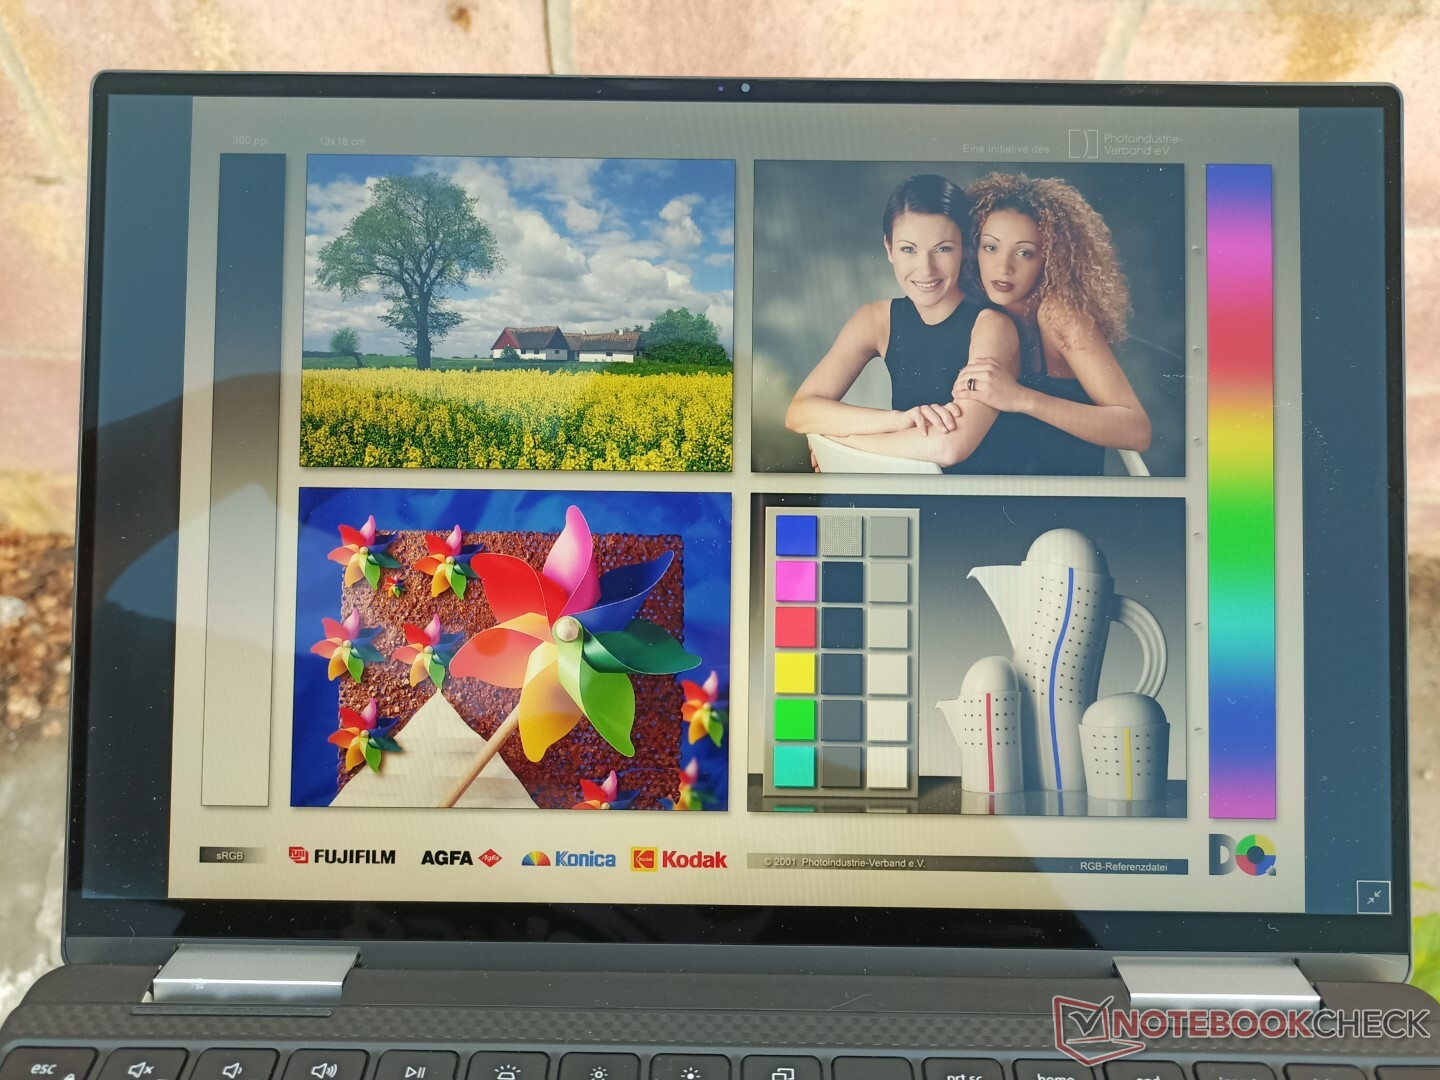
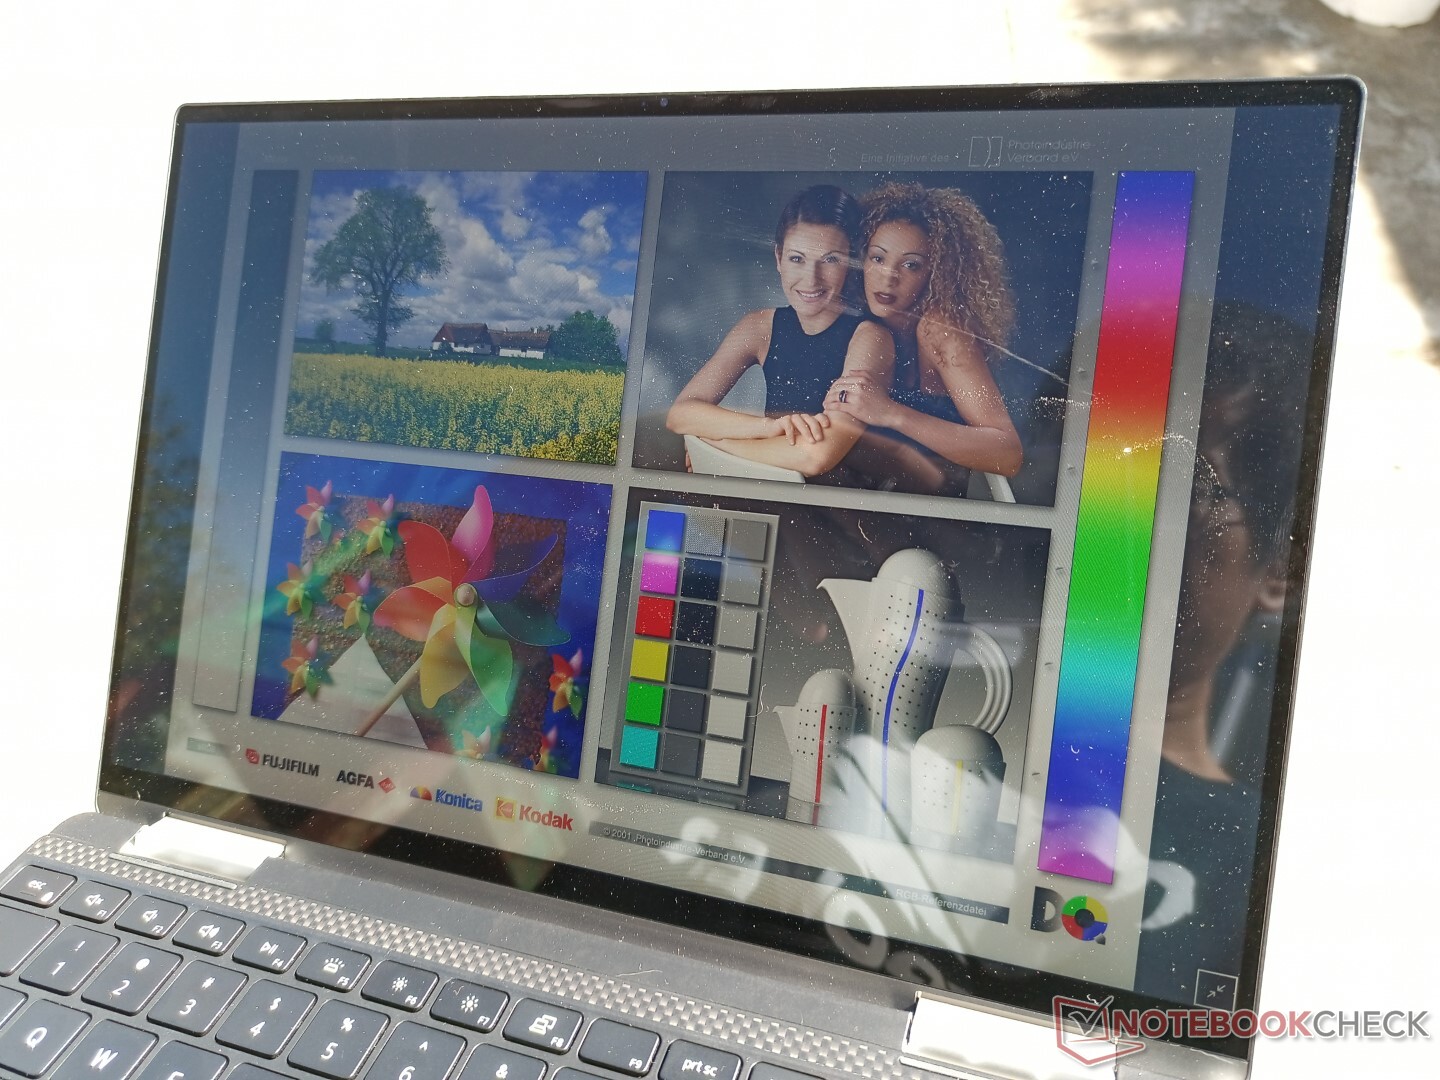
Display - L'abbiamo già visto
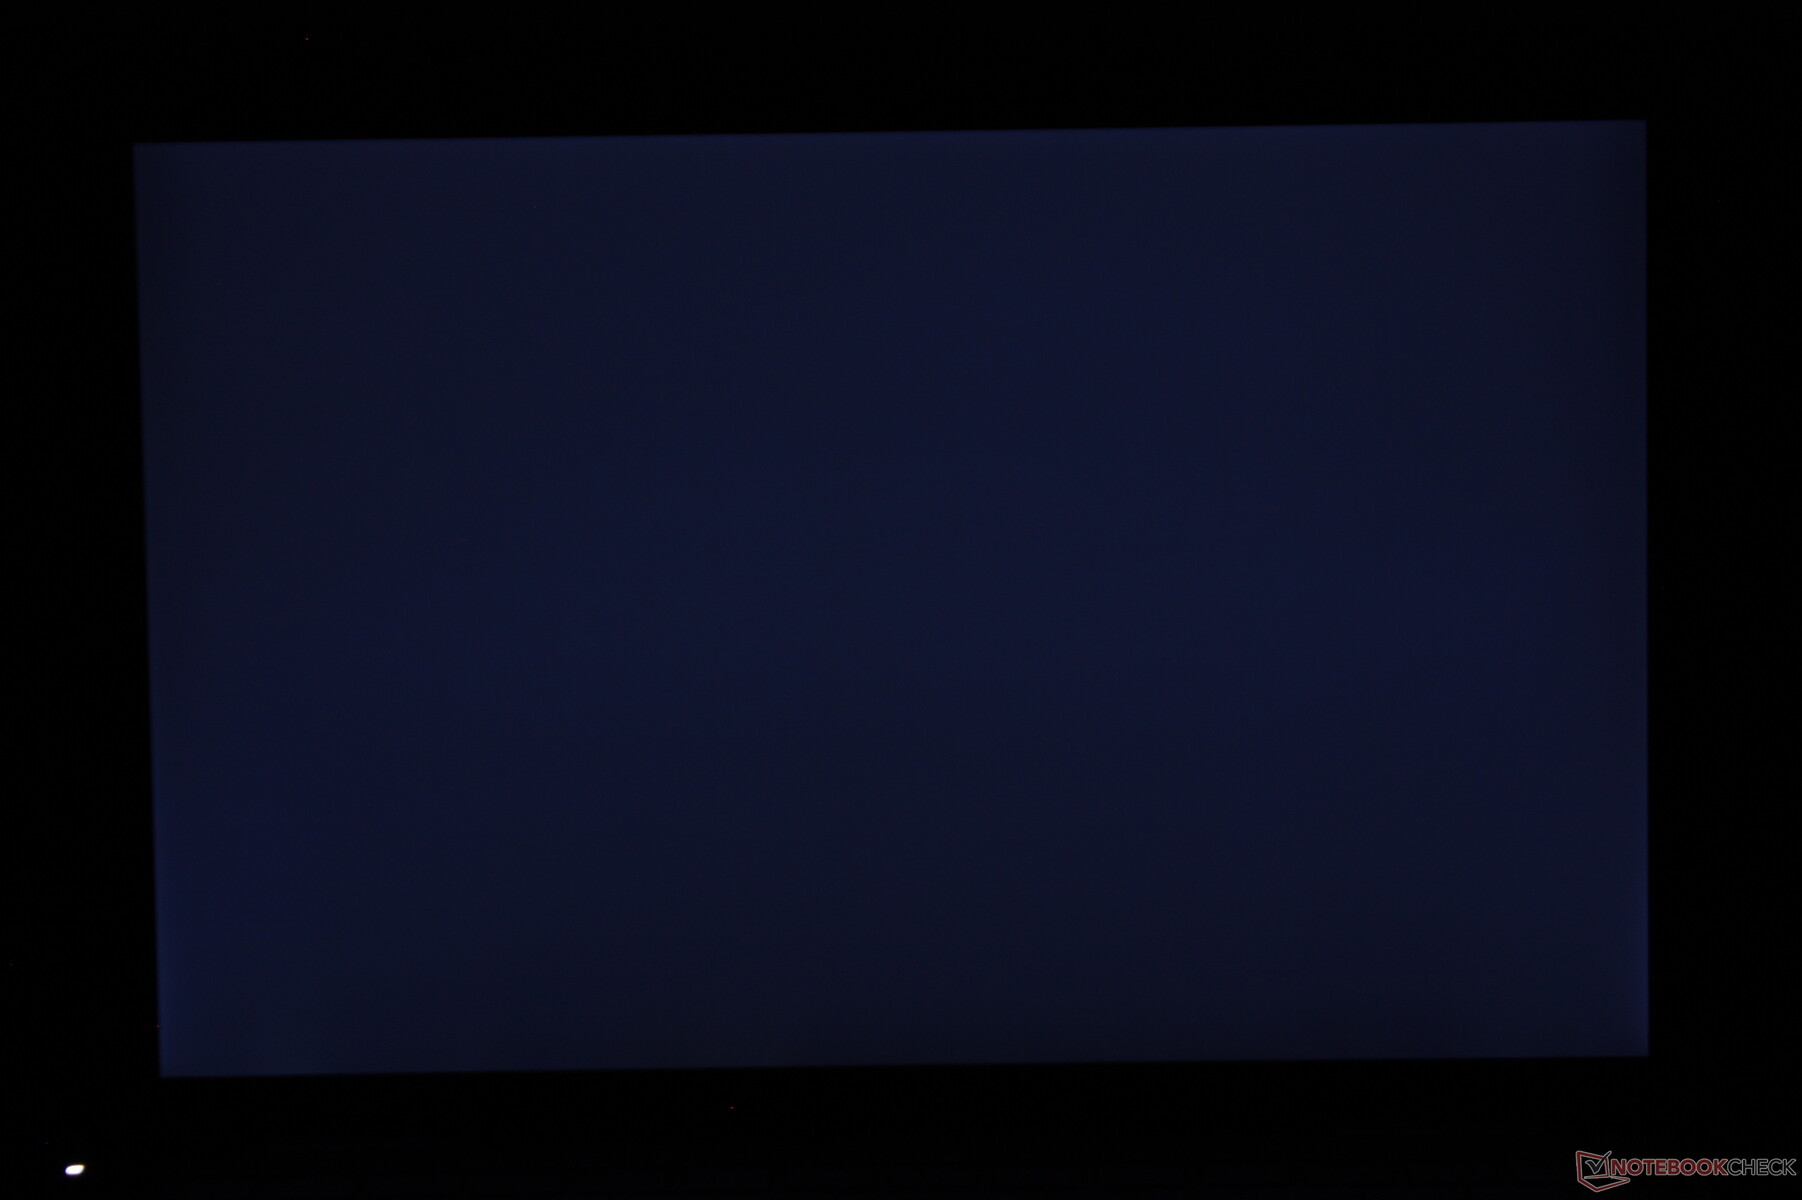
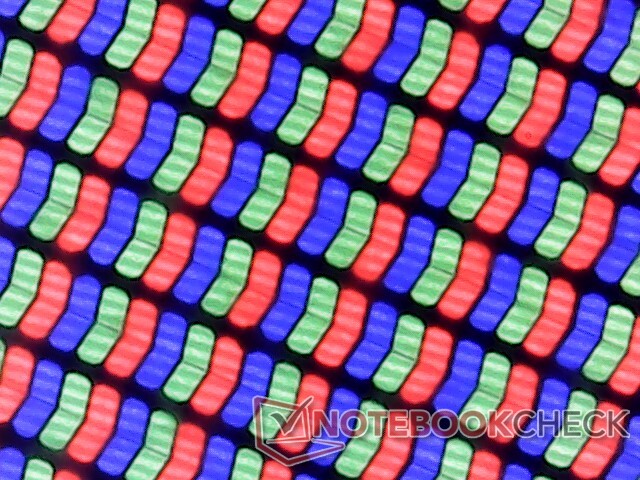
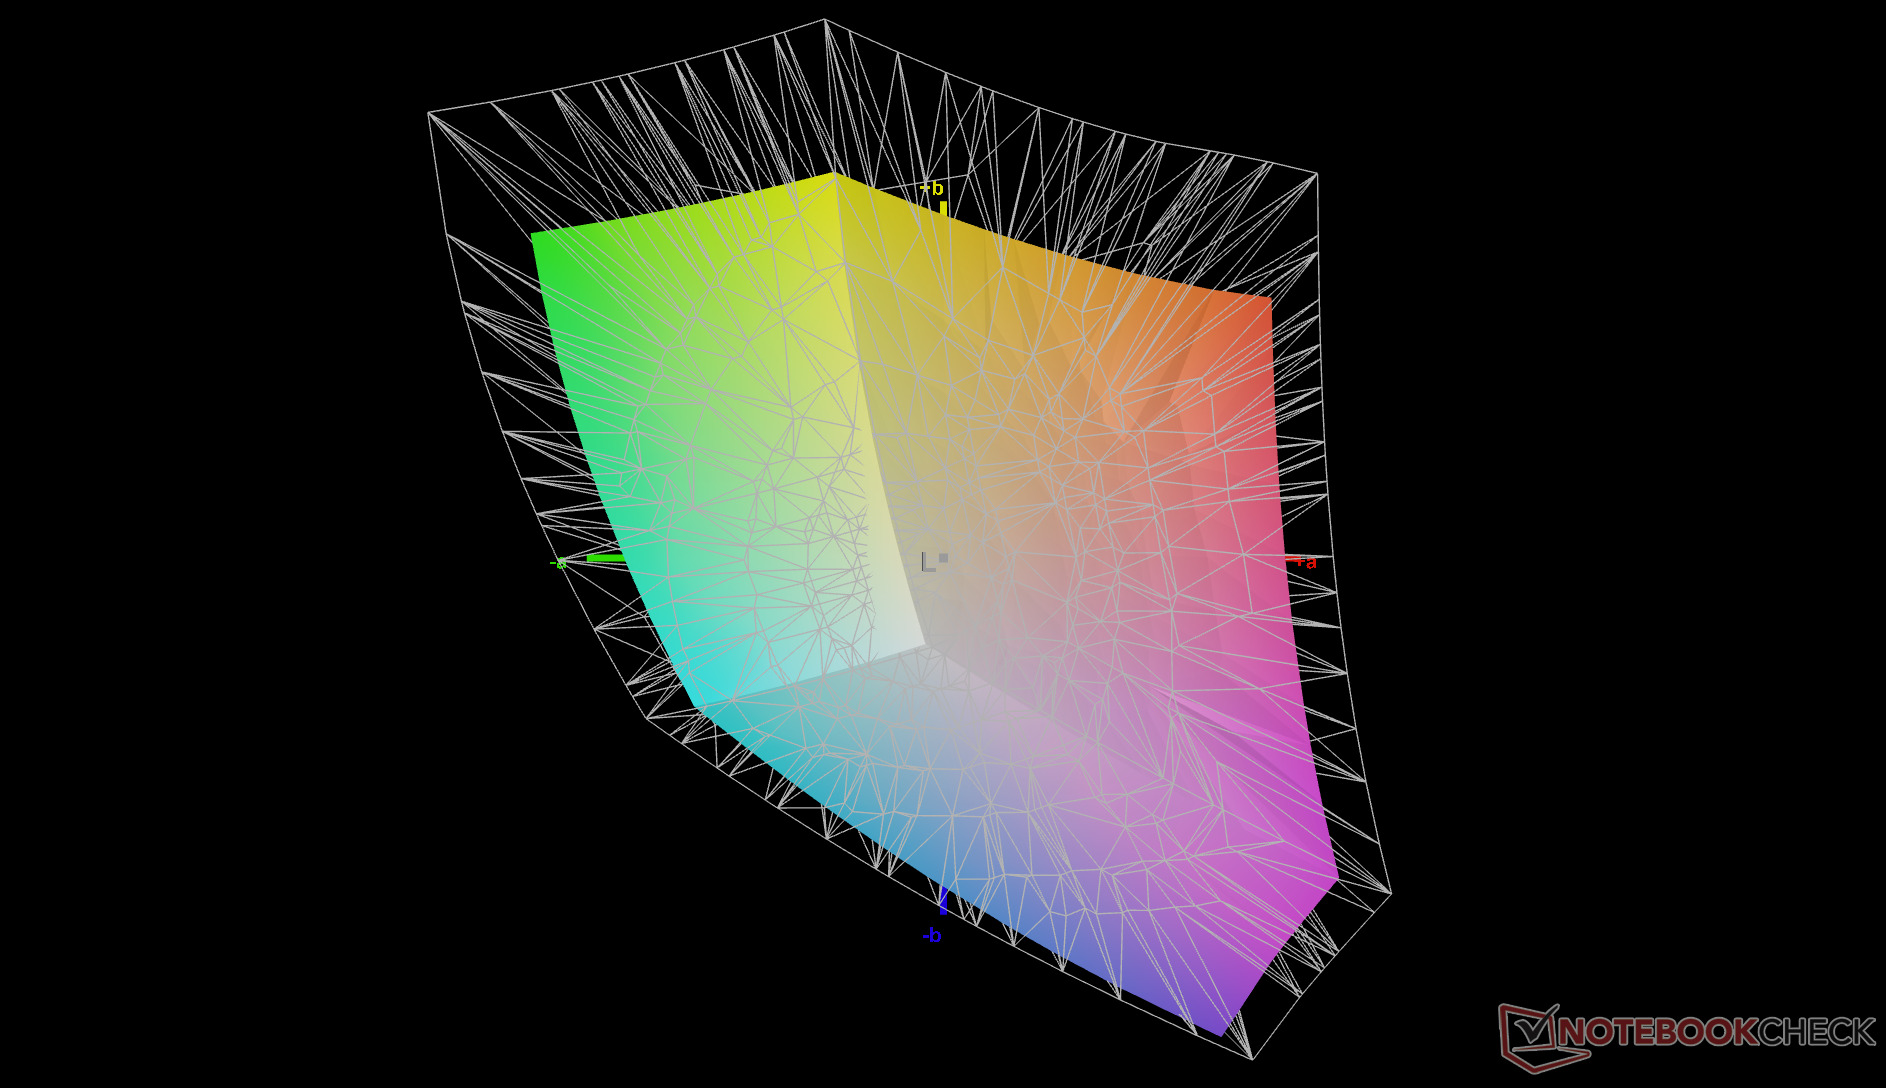
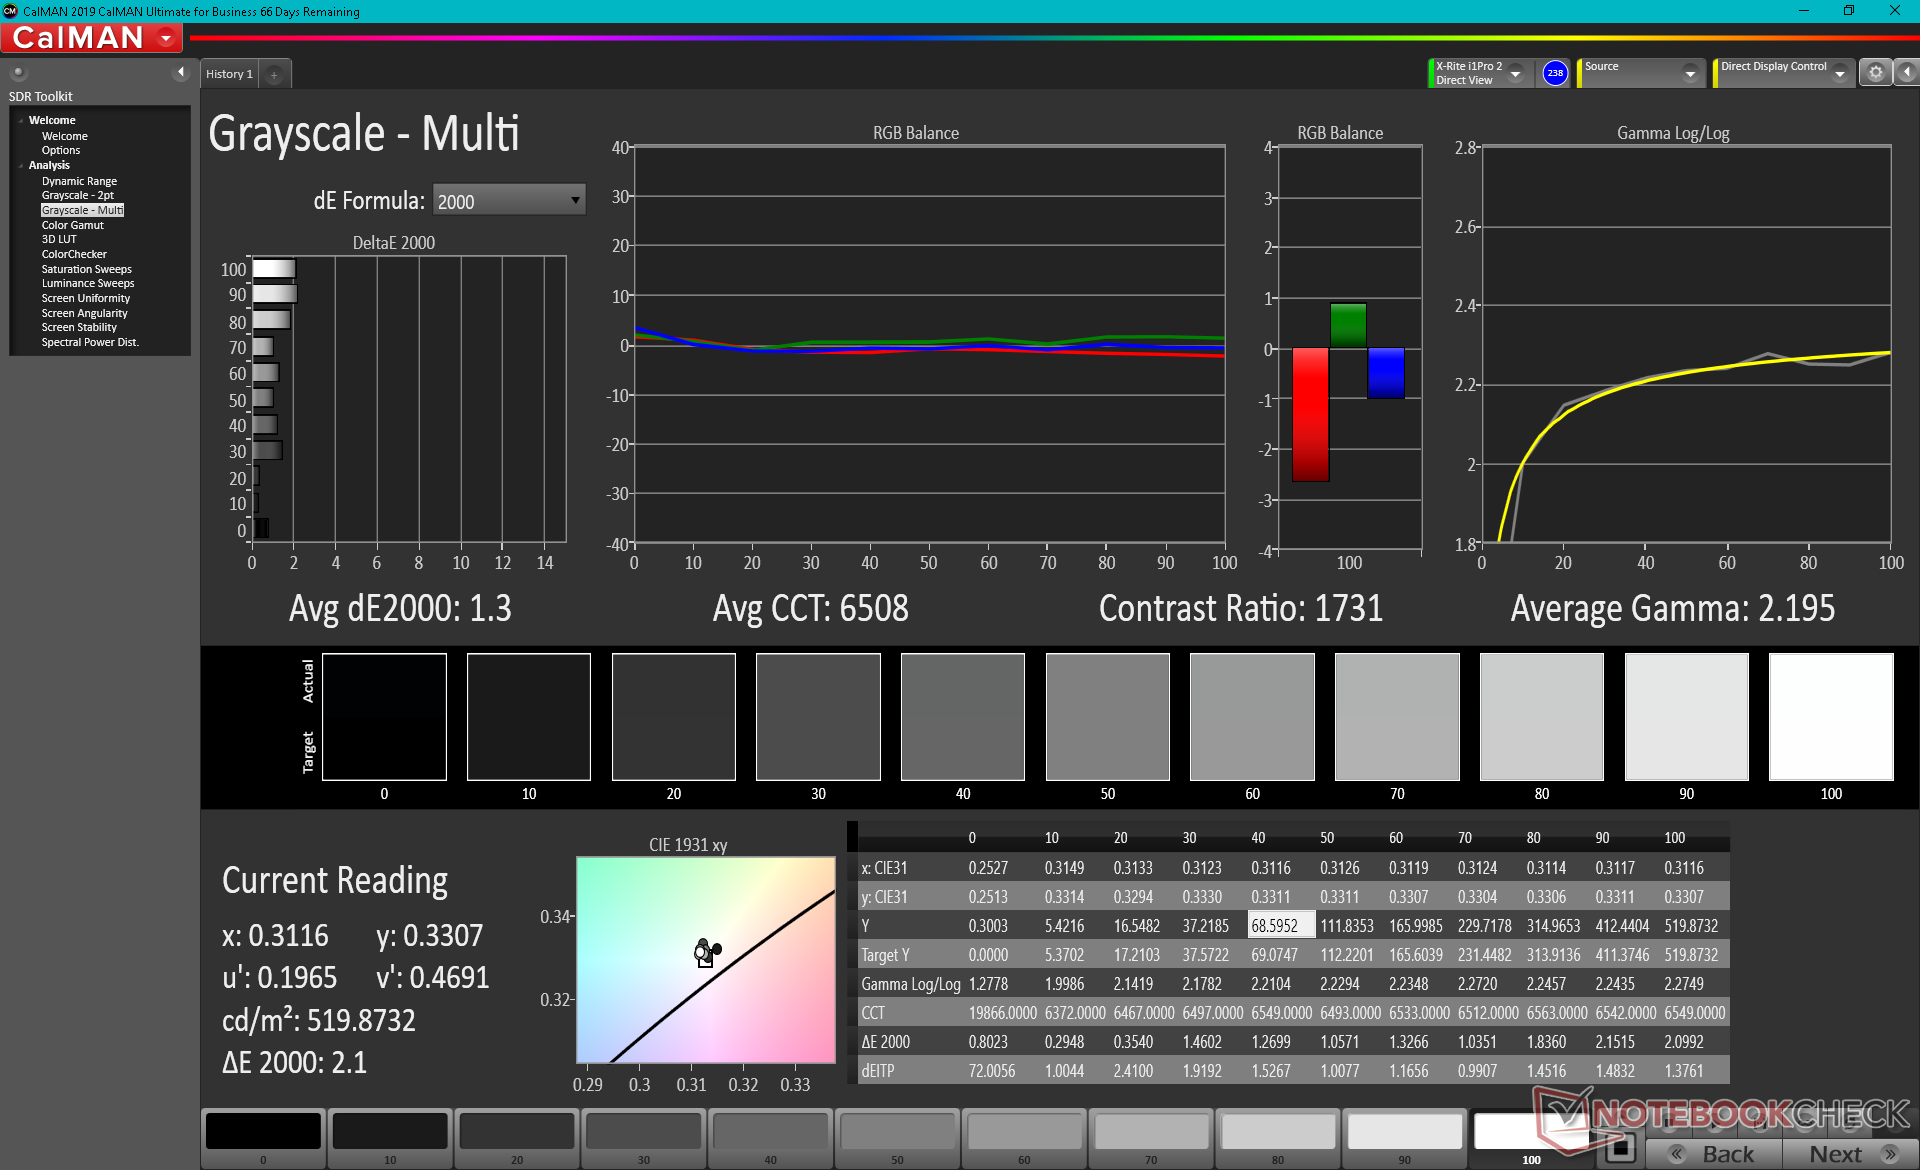
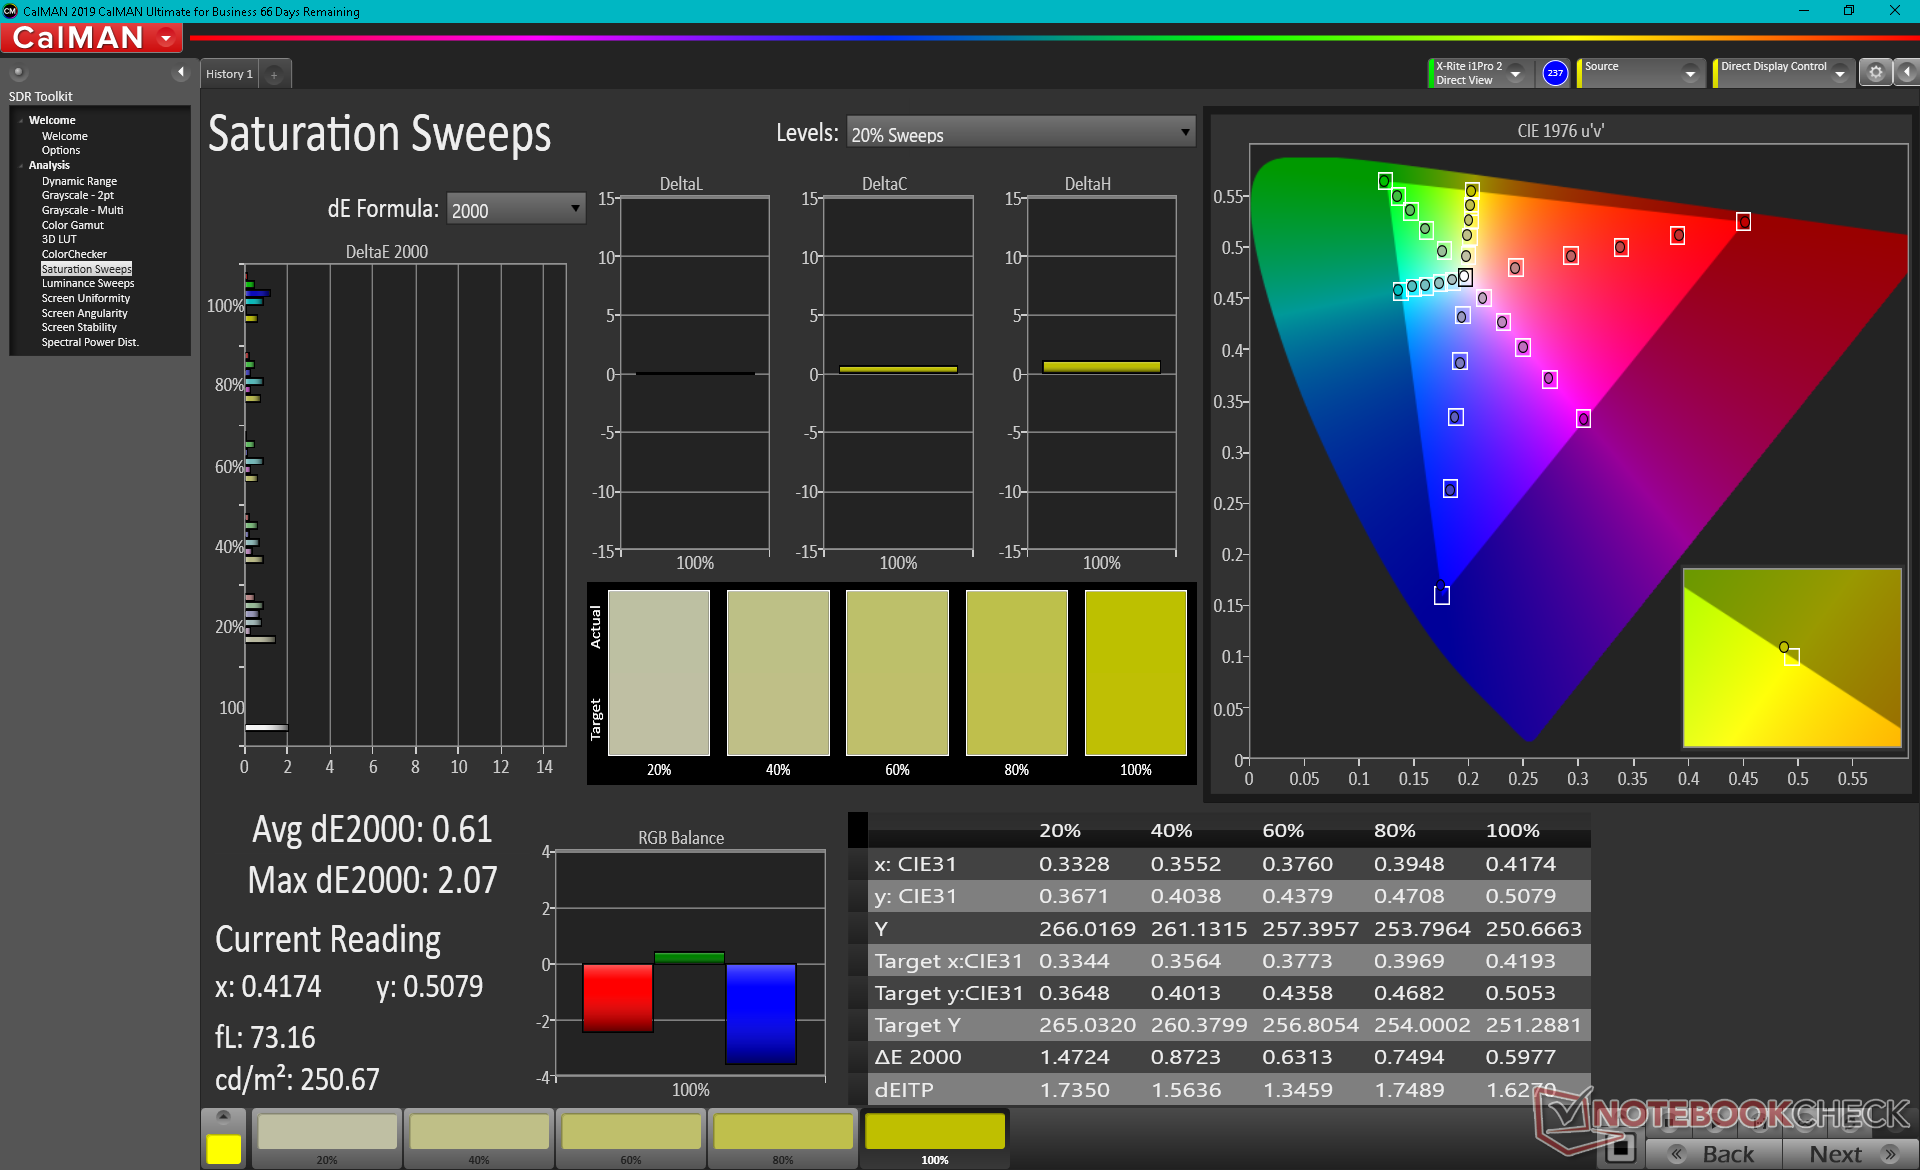
Dell sta usando lo stesso pannello IPS Sharp LQ134N1 a 1200p in tutti i suoi portatili XPS 13 16:10, tra cui l'XPS 13 7390 2-in-1, XPS 13 9300 clamshell, XPS 13 9310 clamshell, e il nostro XPS 13 9310 2-in-1. Questa non è necessariamente una cosa negativa, in quanto continua ad essere un pannello da 13,4 pollici luminoso e di alta qualità con un'eccellente copertura dei colori (>99 per cento sRGB), contrasto elevato e pixel nitidi senza alcun problema di granulosità. I lenti tempi di risposta in bianco e nero sono ancora un punto debole, il che significa che il ghosting è molto evidente soprattutto se si gioca.
Una risoluzione più alta UHD+ (3840 x 2400) è disponibile che sospettiamo essere lo stesso pannello Sharp LQ134R1 IPS che si trova sul XPS 13 9300.
| |||||||||||||||||||||||||
Distribuzione della luminosità: 90 %
Al centro con la batteria: 555.7 cd/m²
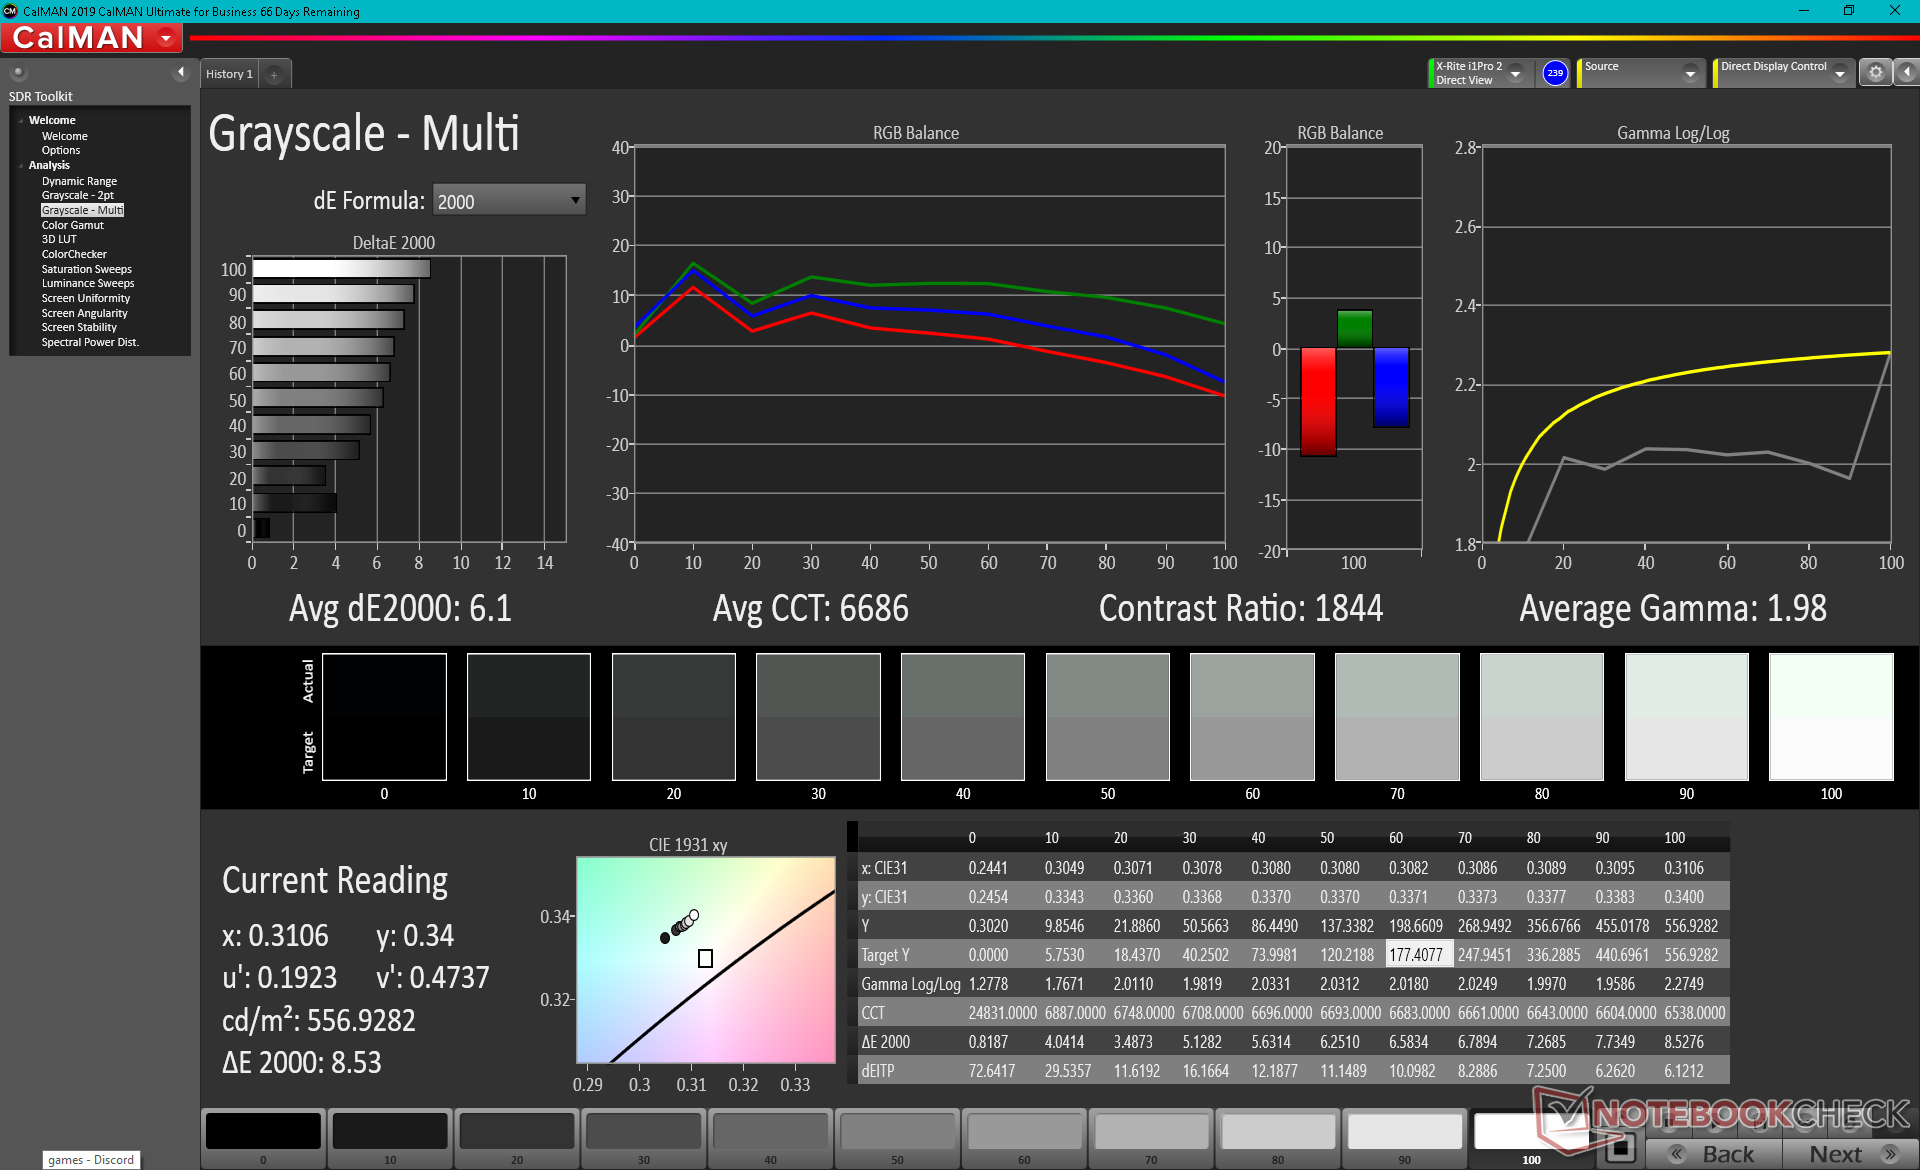
Contrasto: 1588:1 (Nero: 0.35 cd/m²)
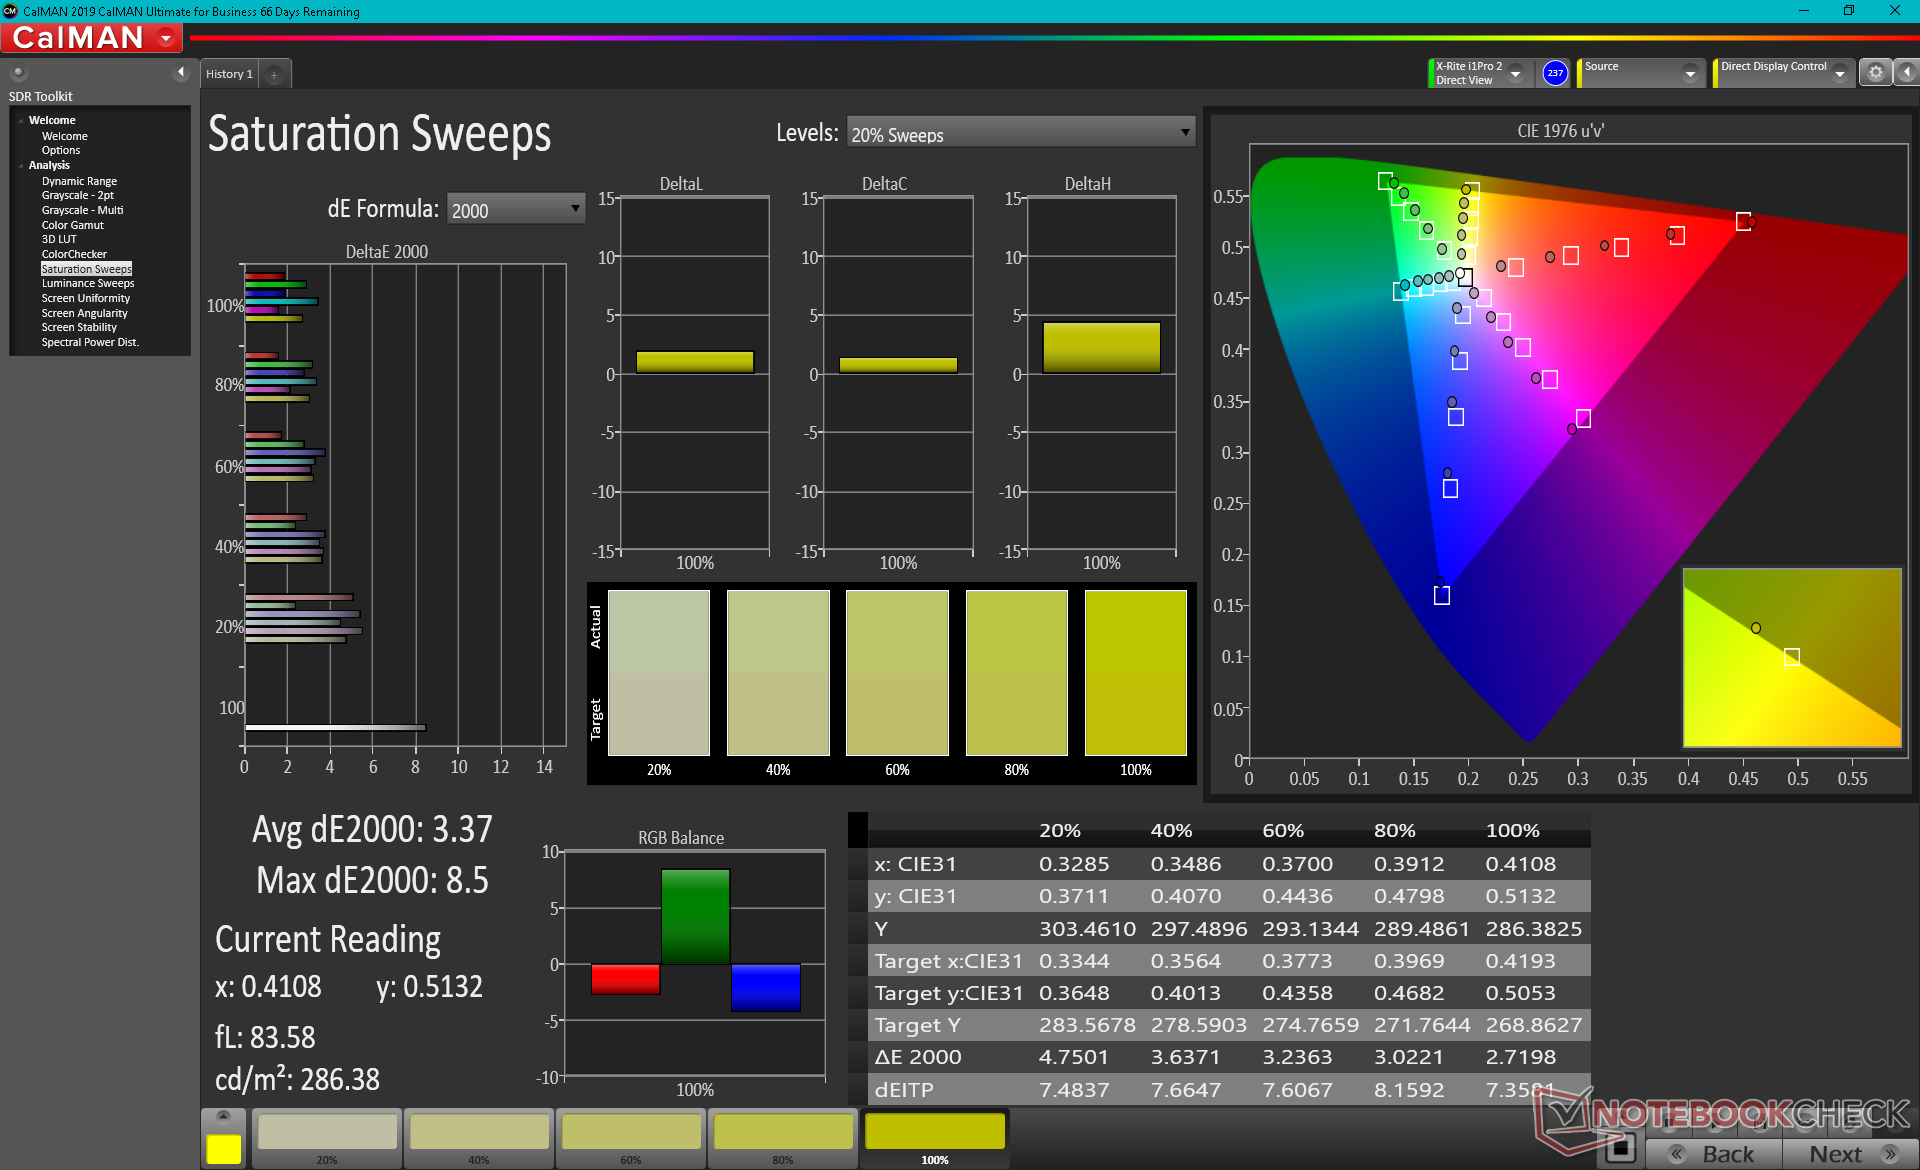
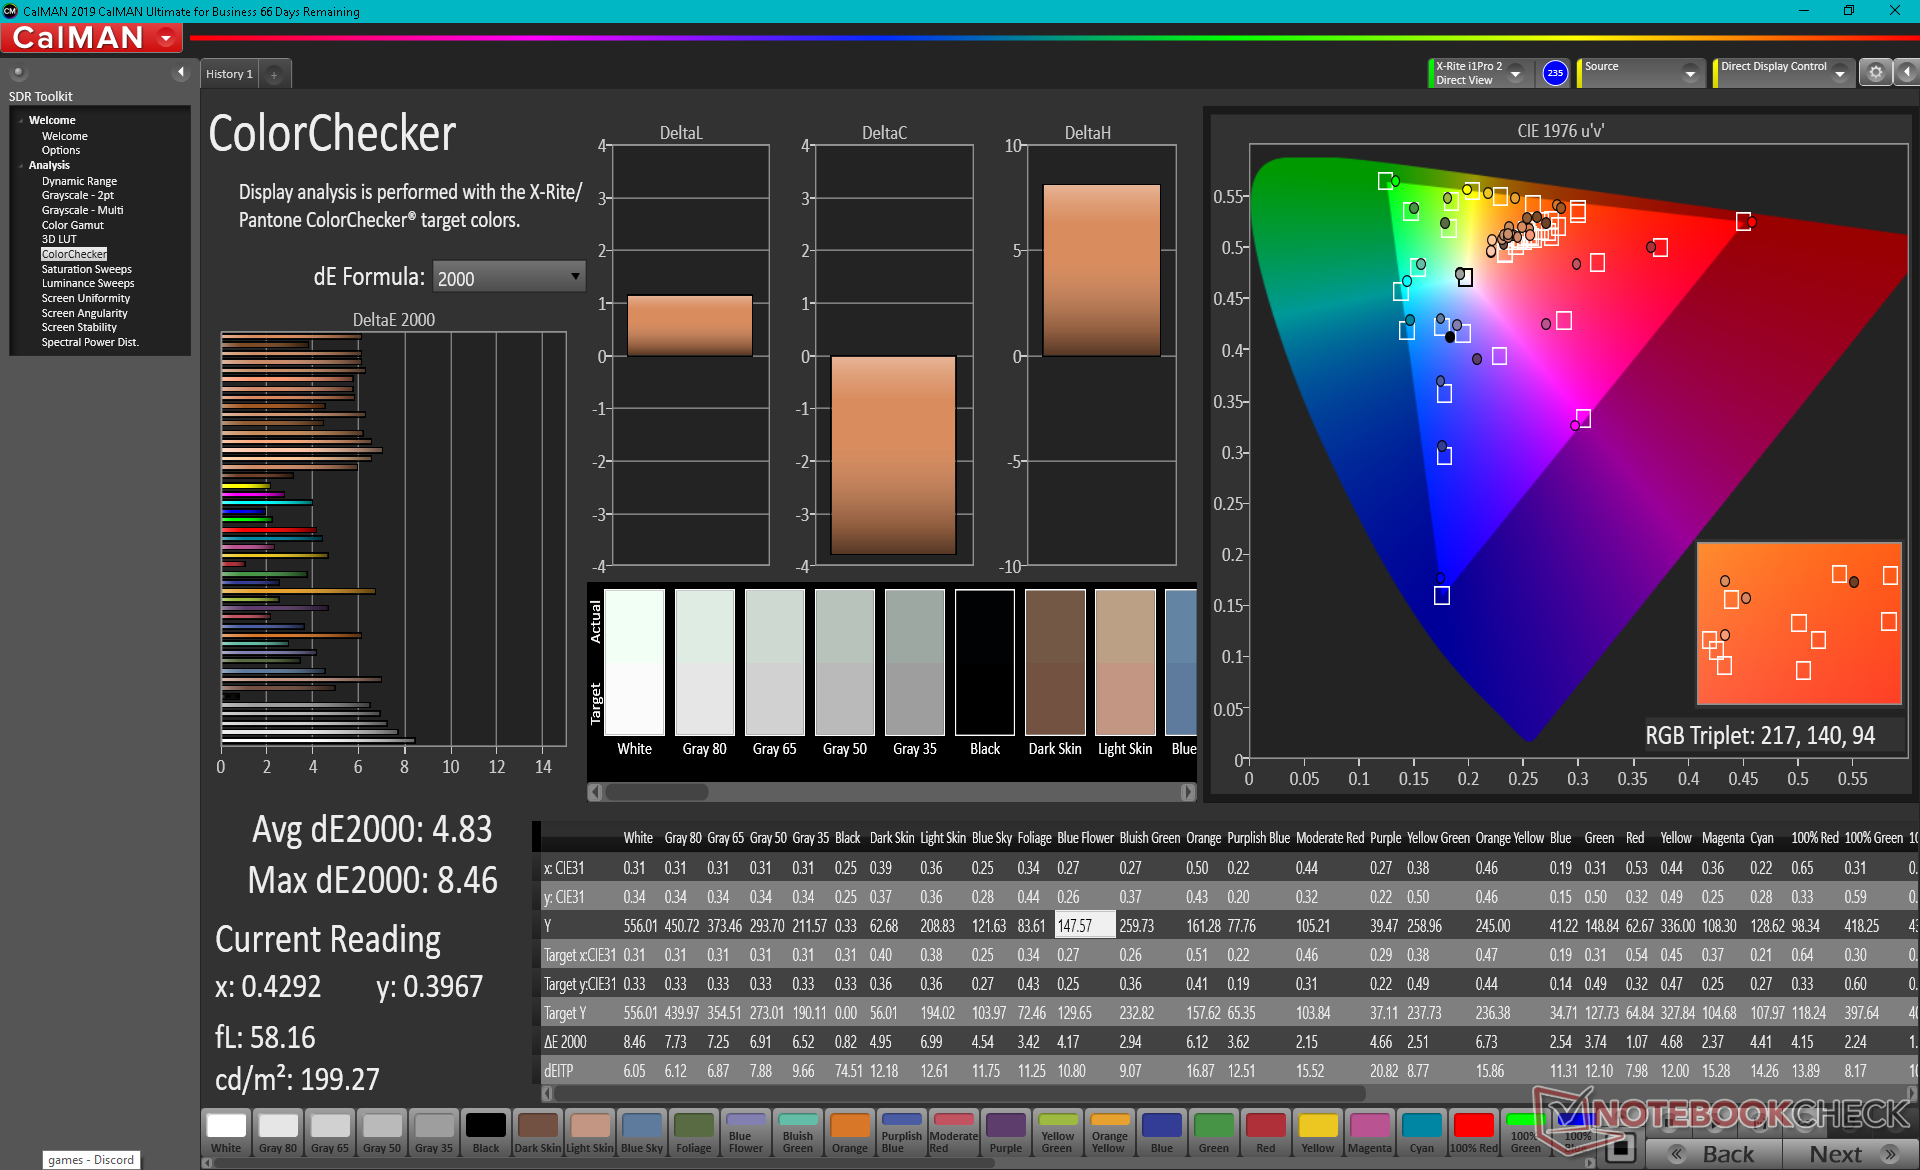
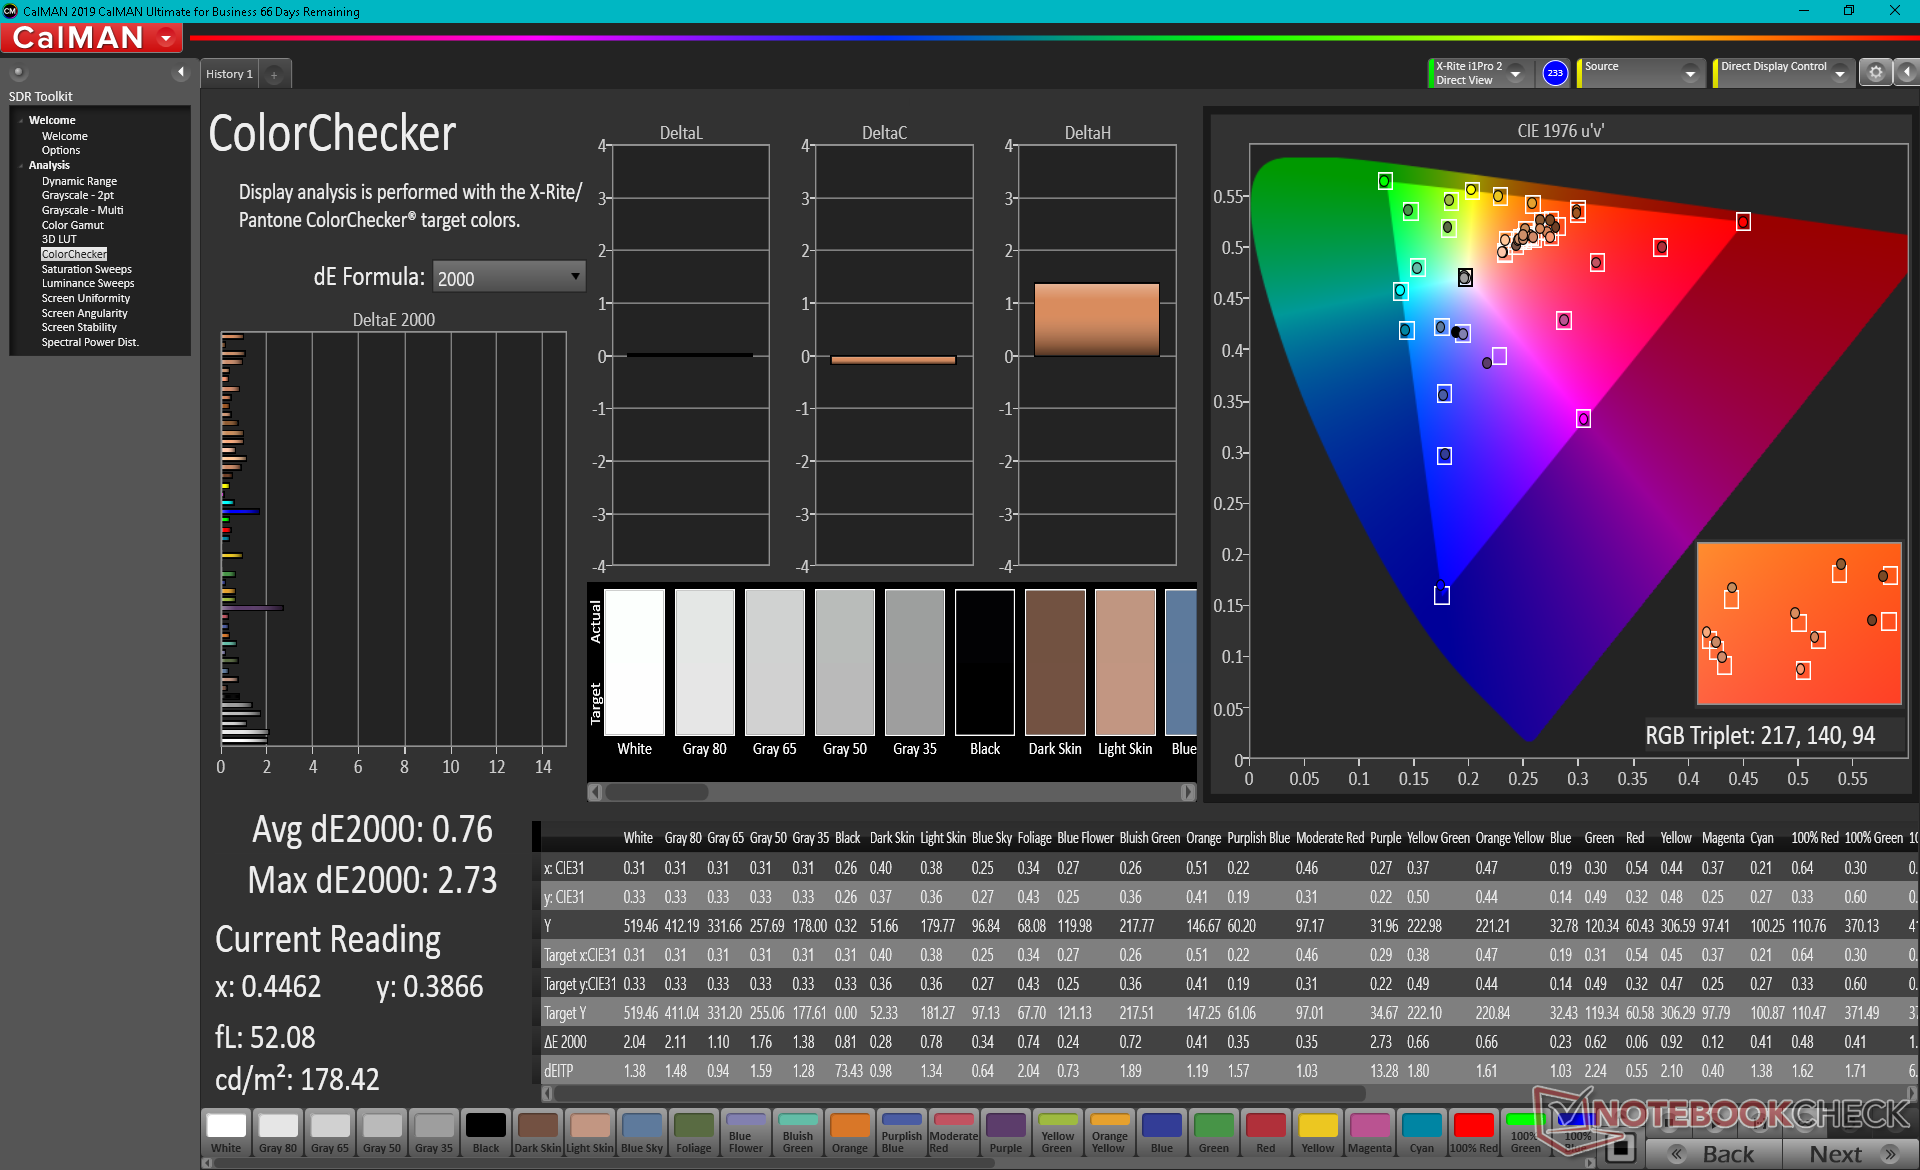
ΔE ColorChecker Calman: 4.83 | ∀{0.5-29.43 Ø4.71}
calibrated: 0.76
ΔE Greyscale Calman: 6.1 | ∀{0.09-98 Ø4.96}
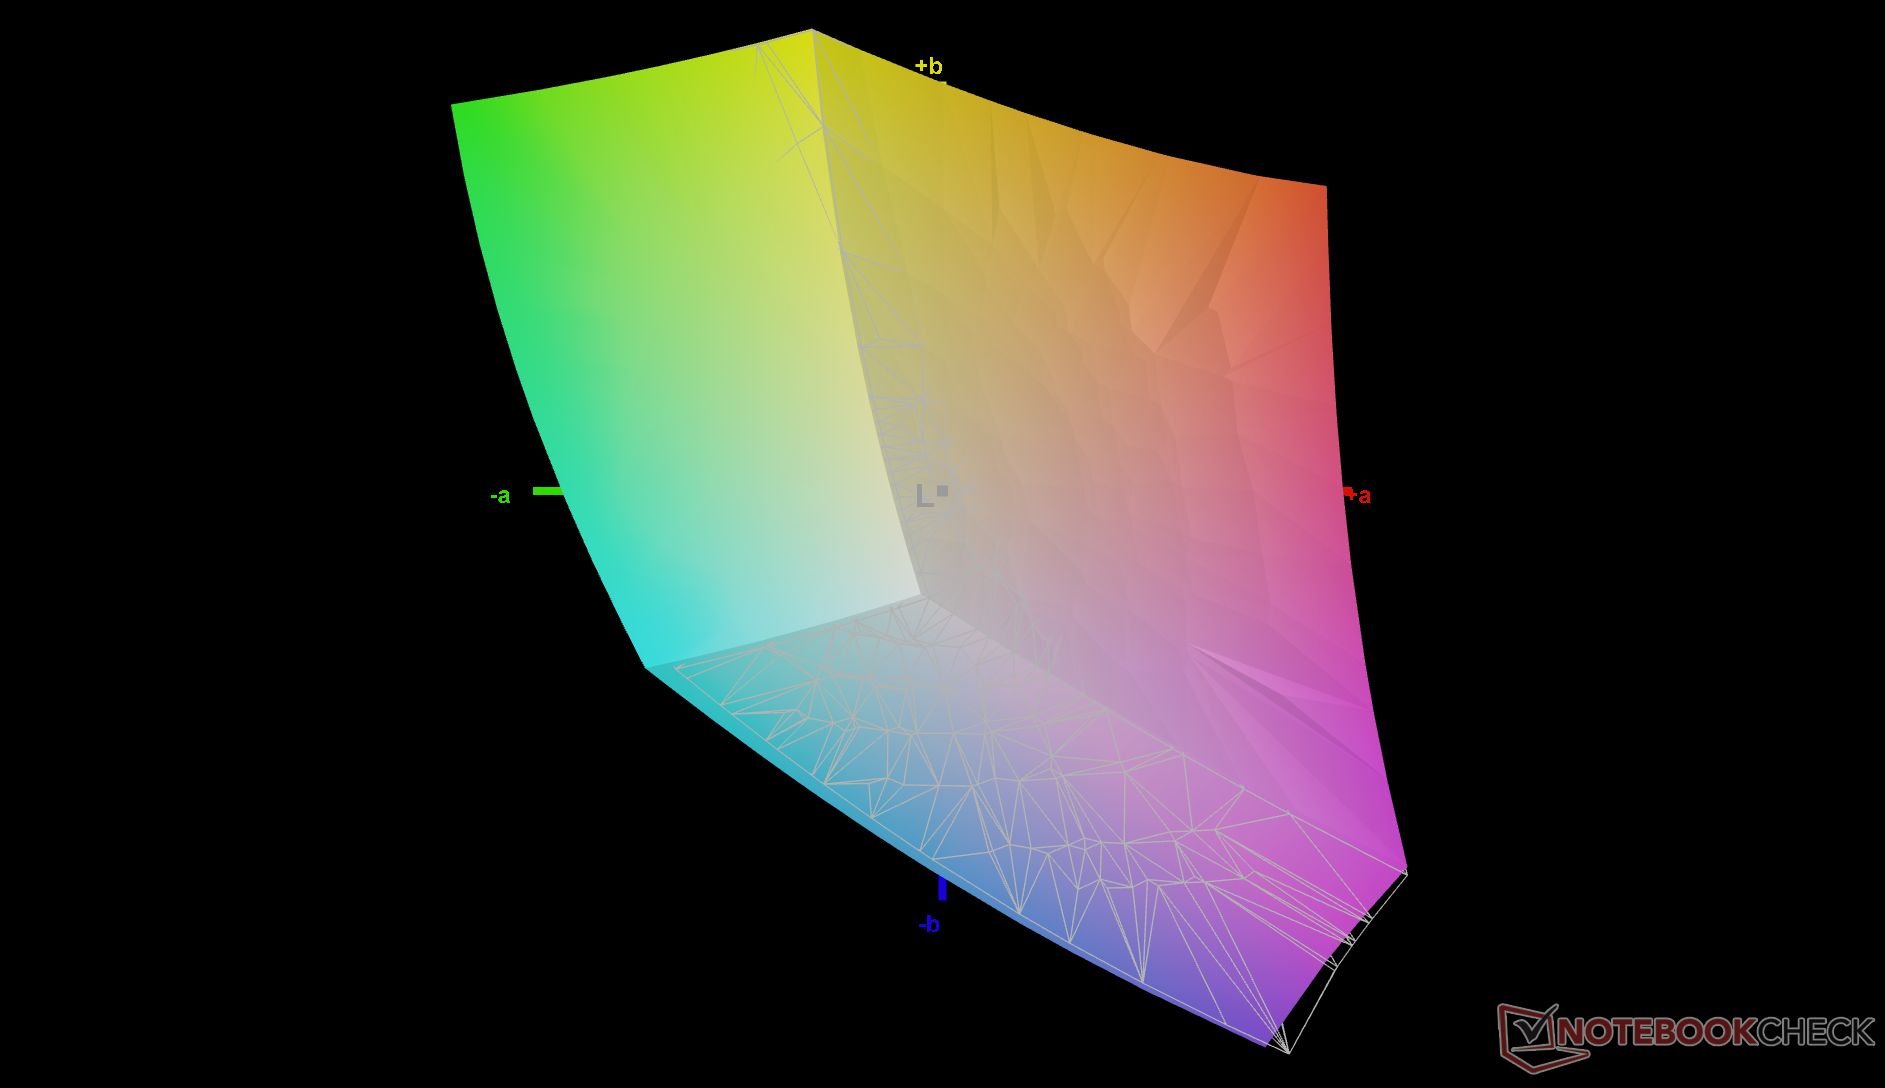
71.7% AdobeRGB 1998 (Argyll 3D)
99% sRGB (Argyll 3D)
69.7% Display P3 (Argyll 3D)
Gamma: 1.98
CCT: 6686 K
| Dell XPS 13 9310 2-in-1 Sharp LQ134N1, IPS, 13.4", 1920x1200 | Dell XPS 13 9310 Core i7 FHD Sharp LQ134N1, IPS, 13.4", 1920x1200 | Dell XPS 13 7390 2-in-1 Core i7 Sharp LQ134N1, IPS, 13.4", 1920x1200 | Lenovo Yoga 6 13 82ND0009US AU Optronics B133HAN05.F, IPS, 13.3", 1920x1080 | Asus ZenBook Flip 13 UX363EA-HP069T Samsung, SDC414A, OLED, 13.3", 1920x1080 | Samsung Galaxy Book Pro 360 13 AMOLED, 13.2", 1920x1080 | |
|---|---|---|---|---|---|---|
| Display | 1% | 0% | 0% | 26% | ||
| Display P3 Coverage (%) | 69.7 | 70.9 2% | 69.9 0% | 69.7 0% | 99.4 43% | |
| sRGB Coverage (%) | 99 | 99.1 0% | 99.2 0% | 99.2 0% | 100 1% | |
| AdobeRGB 1998 Coverage (%) | 71.7 | 72.9 2% | 71.5 0% | 71.4 0% | 96 34% | |
| Response Times | 12% | 21% | 23% | 96% | 96% | |
| Response Time Grey 50% / Grey 80% * (ms) | 55.6 ? | 52 ? 6% | 47.6 ? 14% | 46.8 ? 16% | 2 ? 96% | 2 ? 96% |
| Response Time Black / White * (ms) | 40.4 ? | 33.2 ? 18% | 29.2 ? 28% | 28.8 ? 29% | 2 ? 95% | 2 ? 95% |
| PWM Frequency (Hz) | 2500 ? | 2475 ? | 2500 ? | 60 | 60 ? | |
| Screen | -2% | 7% | -8% | -38% | 235% | |
| Brightness middle (cd/m²) | 555.7 | 543.3 -2% | 549.8 -1% | 291.5 -48% | 353 -36% | 287 -48% |
| Brightness (cd/m²) | 528 | 524 -1% | 520 -2% | 294 -44% | 359 -32% | 289 -45% |
| Brightness Distribution (%) | 90 | 92 2% | 86 -4% | 93 3% | 95 6% | 96 7% |
| Black Level * (cd/m²) | 0.35 | 0.38 -9% | 0.39 -11% | 0.19 46% | 0.1 71% | 0.01 97% |
| Contrast (:1) | 1588 | 1430 -10% | 1410 -11% | 1534 -3% | 3530 122% | 28700 1707% |
| Colorchecker dE 2000 * | 4.83 | 3.02 37% | 2.12 56% | 3.83 21% | 3.98 18% | 2.24 54% |
| Colorchecker dE 2000 max. * | 8.46 | 7.61 10% | 3.66 57% | 8.43 -0% | 53.07 -527% | 3.69 56% |
| Colorchecker dE 2000 calibrated * | 0.76 | 1.23 -62% | 1.37 -80% | 1.07 -41% | ||
| Greyscale dE 2000 * | 6.1 | 5 18% | 2.6 57% | 6.2 -2% | 1.41 77% | 2.73 55% |
| Gamma | 1.98 111% | 2.02 109% | 2.3 96% | 2.2 100% | 2.39 92% | 2.46 89% |
| CCT | 6686 97% | 6550 99% | 6884 94% | 6469 100% | 6346 102% | 6523 100% |
| Color Space (Percent of AdobeRGB 1998) (%) | 66.8 | 65.4 | ||||
| Color Space (Percent of sRGB) (%) | 99.6 | 99.7 | ||||
| Media totale (Programma / Settaggio) | 4% /
1% | 9% /
7% | 5% /
-2% | 29% /
-11% | 119% /
166% |
* ... Meglio usare valori piccoli
Tempi di risposta del Display
| ↔ Tempi di risposta dal Nero al Bianco | ||
|---|---|---|
| 40.4 ms ... aumenta ↗ e diminuisce ↘ combinato | ↗ 22 ms Incremento | 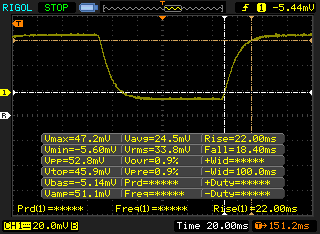 |
| ↘ 18.4 ms Calo | ||
| Lo schermo mostra tempi di risposta lenti nei nostri tests e sarà insoddisfacente per i gamers. In confronto, tutti i dispositivi di test variano da 0.1 (minimo) a 240 (massimo) ms. » 98 % di tutti i dispositivi è migliore. Questo significa che i tempi di risposta rilevati sono peggiori rispetto alla media di tutti i dispositivi testati (19.8 ms). | ||
| ↔ Tempo di risposta dal 50% Grigio all'80% Grigio | ||
| 55.6 ms ... aumenta ↗ e diminuisce ↘ combinato | ↗ 27.6 ms Incremento | 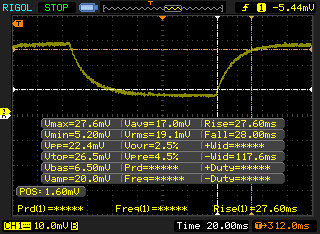 |
| ↘ 28 ms Calo | ||
| Lo schermo mostra tempi di risposta lenti nei nostri tests e sarà insoddisfacente per i gamers. In confronto, tutti i dispositivi di test variano da 0.165 (minimo) a 636 (massimo) ms. » 92 % di tutti i dispositivi è migliore. Questo significa che i tempi di risposta rilevati sono peggiori rispetto alla media di tutti i dispositivi testati (31 ms). | ||
Sfarfallio dello schermo / PWM (Pulse-Width Modulation)
| flickering dello schermo / PWM rilevato | 2500 Hz | ≤ 25 % settaggio luminosita' | 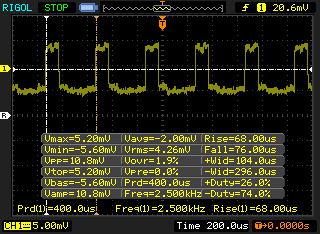 |
Il display sfarfalla a 2500 Hz (Probabilmente a causa dell'uso di PWM) Flickering rilevato ad una luminosita' di 25 % o inferiore. Non dovrebbe verificarsi flickering o PWM sopra questo valore di luminosita'. La frequenza di 2500 Hz è abbastanza alta, quindi la maggioranza degli utenti sensibili al PWM non dovrebbero notare alcun flickering. In confronto: 52 % di tutti i dispositivi testati non utilizza PWM per ridurre la luminosita' del display. Se è rilevato PWM, una media di 7754 (minimo: 5 - massimo: 343500) Hz è stata rilevata. | |||

Prestazioni - Intel Tiger Lake-U al salvataggio
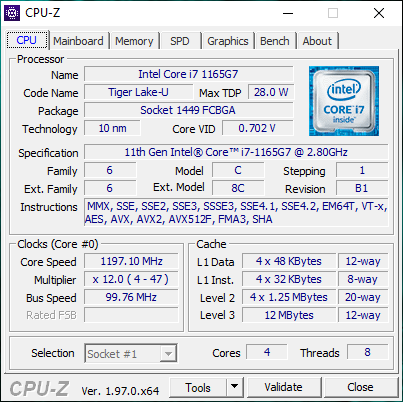
Processore - Sottoperformante
Le prestazioni della CPU fluttuano pesantemente, proprio come quello che abbiamo osservato sul clamshell XPS 9310 equipaggiato con lo stesso Core i7-1165G7 processore. I punteggi CineBench R15 xT possono variare da 480 a 750 punti, rispettivamente, rispetto alle frequenze di clock più consistenti dell'XPS 13 7390 2-in-1 o ZenBook Flip 13. Le prestazioni del processore possono quindi essere più lente rispetto all'ultima generazione Core i7-1065G7 a volte.
La nostra unità è stata impostata in modalità Ultra Performance tramite il software Dell Power Manager prima di eseguire qualsiasi benchmark per ottenere i migliori punteggi possibili.
Cinebench R15 Multi Loop
Cinebench R23: Multi Core | Single Core
Cinebench R15: CPU Multi 64Bit | CPU Single 64Bit
Blender: v2.79 BMW27 CPU
7-Zip 18.03: 7z b 4 -mmt1 | 7z b 4
Geekbench 5.5: Single-Core | Multi-Core
HWBOT x265 Benchmark v2.2: 4k Preset
LibreOffice : 20 Documents To PDF
R Benchmark 2.5: Overall mean
| Cinebench R23 / Multi Core | |
| Lenovo Yoga Slim 7-14ARE | |
| Asus ZenBook 13 OLED UM325UA | |
| Lenovo Yoga 6 13 82ND0009US | |
| Media Intel Core i7-1165G7 (2525 - 6862, n=64) | |
| Dell XPS 13 9310 OLED | |
| Dell XPS 13 9310 2-in-1 | |
| HP Spectre x360 13-aw2003dx | |
| Asus VivoBook S13 S333JA-DS51 | |
| Cinebench R23 / Single Core | |
| Dell XPS 13 9310 OLED | |
| Media Intel Core i7-1165G7 (1110 - 1539, n=59) | |
| Dell XPS 13 9310 2-in-1 | |
| HP Spectre x360 13-aw2003dx | |
| Asus ZenBook 13 OLED UM325UA | |
| Lenovo Yoga Slim 7-14ARE | |
| Lenovo Yoga 6 13 82ND0009US | |
| Asus VivoBook S13 S333JA-DS51 | |
| Geekbench 5.5 / Single-Core | |
| Dell XPS 13 9310 OLED | |
| Media Intel Core i7-1165G7 (1302 - 1595, n=77) | |
| HP Spectre x360 13-aw2003dx | |
| Asus Zenbook S UX393JA | |
| HP Envy 13-ba0001ng | |
| Asus ZenBook 13 OLED UM325UA | |
| Lenovo Yoga Slim 7-14ARE | |
| Lenovo Yoga Slim 7-14ARE | |
| Asus VivoBook S13 S333JA-DS51 | |
| Geekbench 5.5 / Multi-Core | |
| Lenovo Yoga Slim 7-14ARE | |
| Lenovo Yoga Slim 7-14ARE | |
| Asus ZenBook 13 OLED UM325UA | |
| Dell XPS 13 9310 OLED | |
| HP Spectre x360 13-aw2003dx | |
| Media Intel Core i7-1165G7 (3078 - 5926, n=77) | |
| Asus Zenbook S UX393JA | |
| Asus VivoBook S13 S333JA-DS51 | |
| HP Envy 13-ba0001ng | |
| HWBOT x265 Benchmark v2.2 / 4k Preset | |
| Lenovo Yoga Slim 7-14ARE | |
| Asus ZenBook 13 OLED UM325UA | |
| Lenovo Yoga 6 13 82ND0009US | |
| Dell XPS 13 9310 OLED | |
| Dell XPS 13 9310 2-in-1 | |
| Media Intel Core i7-1165G7 (1.39 - 8.47, n=80) | |
| HP Spectre x360 13-aw2003dx | |
| Dell XPS 13 7390 Core i7-10710U | |
| Asus VivoBook S13 S333JA-DS51 | |
| Asus Zenbook S UX393JA | |
| HP Envy 13-ba0001ng | |
| LibreOffice / 20 Documents To PDF | |
| Lenovo Yoga 6 13 82ND0009US | |
| Asus VivoBook S13 S333JA-DS51 | |
| Asus ZenBook 13 OLED UM325UA | |
| Lenovo Yoga Slim 7-14ARE | |
| HP Envy 13-ba0001ng | |
| HP Spectre x360 13-aw2003dx | |
| Media Intel Core i7-1165G7 (21.5 - 88.1, n=78) | |
| Asus Zenbook S UX393JA | |
| Dell XPS 13 9310 OLED | |
| R Benchmark 2.5 / Overall mean | |
| Asus VivoBook S13 S333JA-DS51 | |
| Asus Zenbook S UX393JA | |
| HP Envy 13-ba0001ng | |
| HP Spectre x360 13-aw2003dx | |
| Lenovo Yoga 6 13 82ND0009US | |
| Lenovo Yoga Slim 7-14ARE | |
| Dell XPS 13 9310 2-in-1 | |
| Asus ZenBook 13 OLED UM325UA | |
| Dell XPS 13 9310 OLED | |
| Media Intel Core i7-1165G7 (0.552 - 1.002, n=80) | |
* ... Meglio usare valori piccoli
Prestazioni del sistema
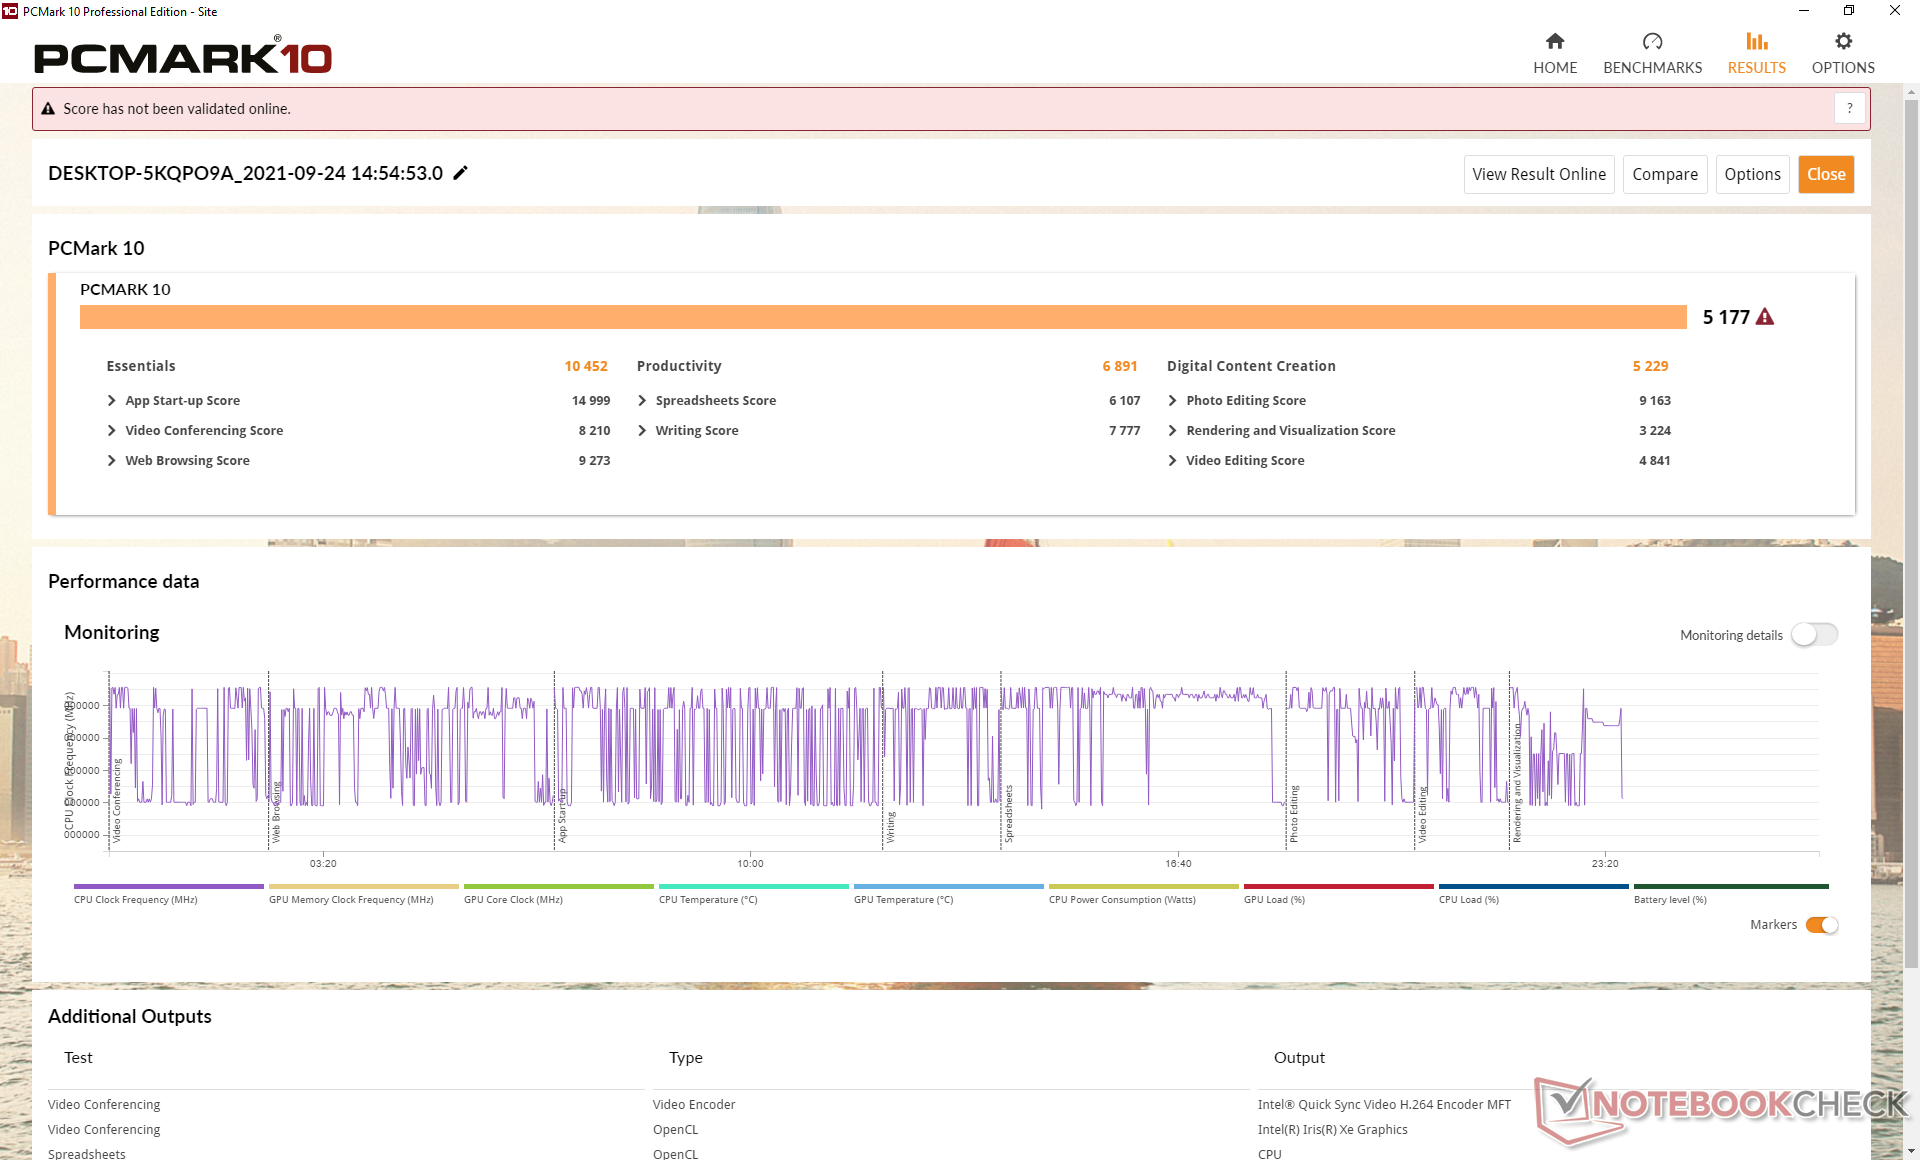
I punteggi PCMark 10 sono dove ci aspettiamo che siano rispetto ad altri portatili equipaggiati con la stessa CPU Core i7. Il più grande guadagno rispetto al vecchio XPS 13 7390 2-in-1 è nel benchmark Digital Content Creation, che richiede l'uso di GPU, dove il nostro Iris Xe riesce a superare l'Iris Plus G7.
| PCMark 10 / Score | |
| Lenovo Yoga 6 13 82ND0009US | |
| Dell XPS 13 9310 2-in-1 | |
| Media Intel Core i7-1165G7, Intel Iris Xe Graphics G7 96EUs (4531 - 5454, n=50) | |
| Dell XPS 13 9310 Core i7 FHD | |
| Asus ZenBook Flip 13 UX363EA-HP069T | |
| Dell XPS 13 7390 2-in-1 Core i7 | |
| Samsung Galaxy Book Pro 360 13 | |
| PCMark 10 / Essentials | |
| Dell XPS 13 9310 2-in-1 | |
| Asus ZenBook Flip 13 UX363EA-HP069T | |
| Media Intel Core i7-1165G7, Intel Iris Xe Graphics G7 96EUs (8997 - 11505, n=50) | |
| Lenovo Yoga 6 13 82ND0009US | |
| Dell XPS 13 9310 Core i7 FHD | |
| Dell XPS 13 7390 2-in-1 Core i7 | |
| Samsung Galaxy Book Pro 360 13 | |
| PCMark 10 / Productivity | |
| Lenovo Yoga 6 13 82ND0009US | |
| Dell XPS 13 7390 2-in-1 Core i7 | |
| Asus ZenBook Flip 13 UX363EA-HP069T | |
| Dell XPS 13 9310 2-in-1 | |
| Dell XPS 13 9310 Core i7 FHD | |
| Media Intel Core i7-1165G7, Intel Iris Xe Graphics G7 96EUs (5570 - 7136, n=50) | |
| Samsung Galaxy Book Pro 360 13 | |
| PCMark 10 / Digital Content Creation | |
| Lenovo Yoga 6 13 82ND0009US | |
| Dell XPS 13 9310 2-in-1 | |
| Media Intel Core i7-1165G7, Intel Iris Xe Graphics G7 96EUs (4083 - 5550, n=50) | |
| Dell XPS 13 9310 Core i7 FHD | |
| Samsung Galaxy Book Pro 360 13 | |
| Asus ZenBook Flip 13 UX363EA-HP069T | |
| Dell XPS 13 7390 2-in-1 Core i7 | |
| PCMark 10 Score | 5177 punti | |
Aiuto | ||
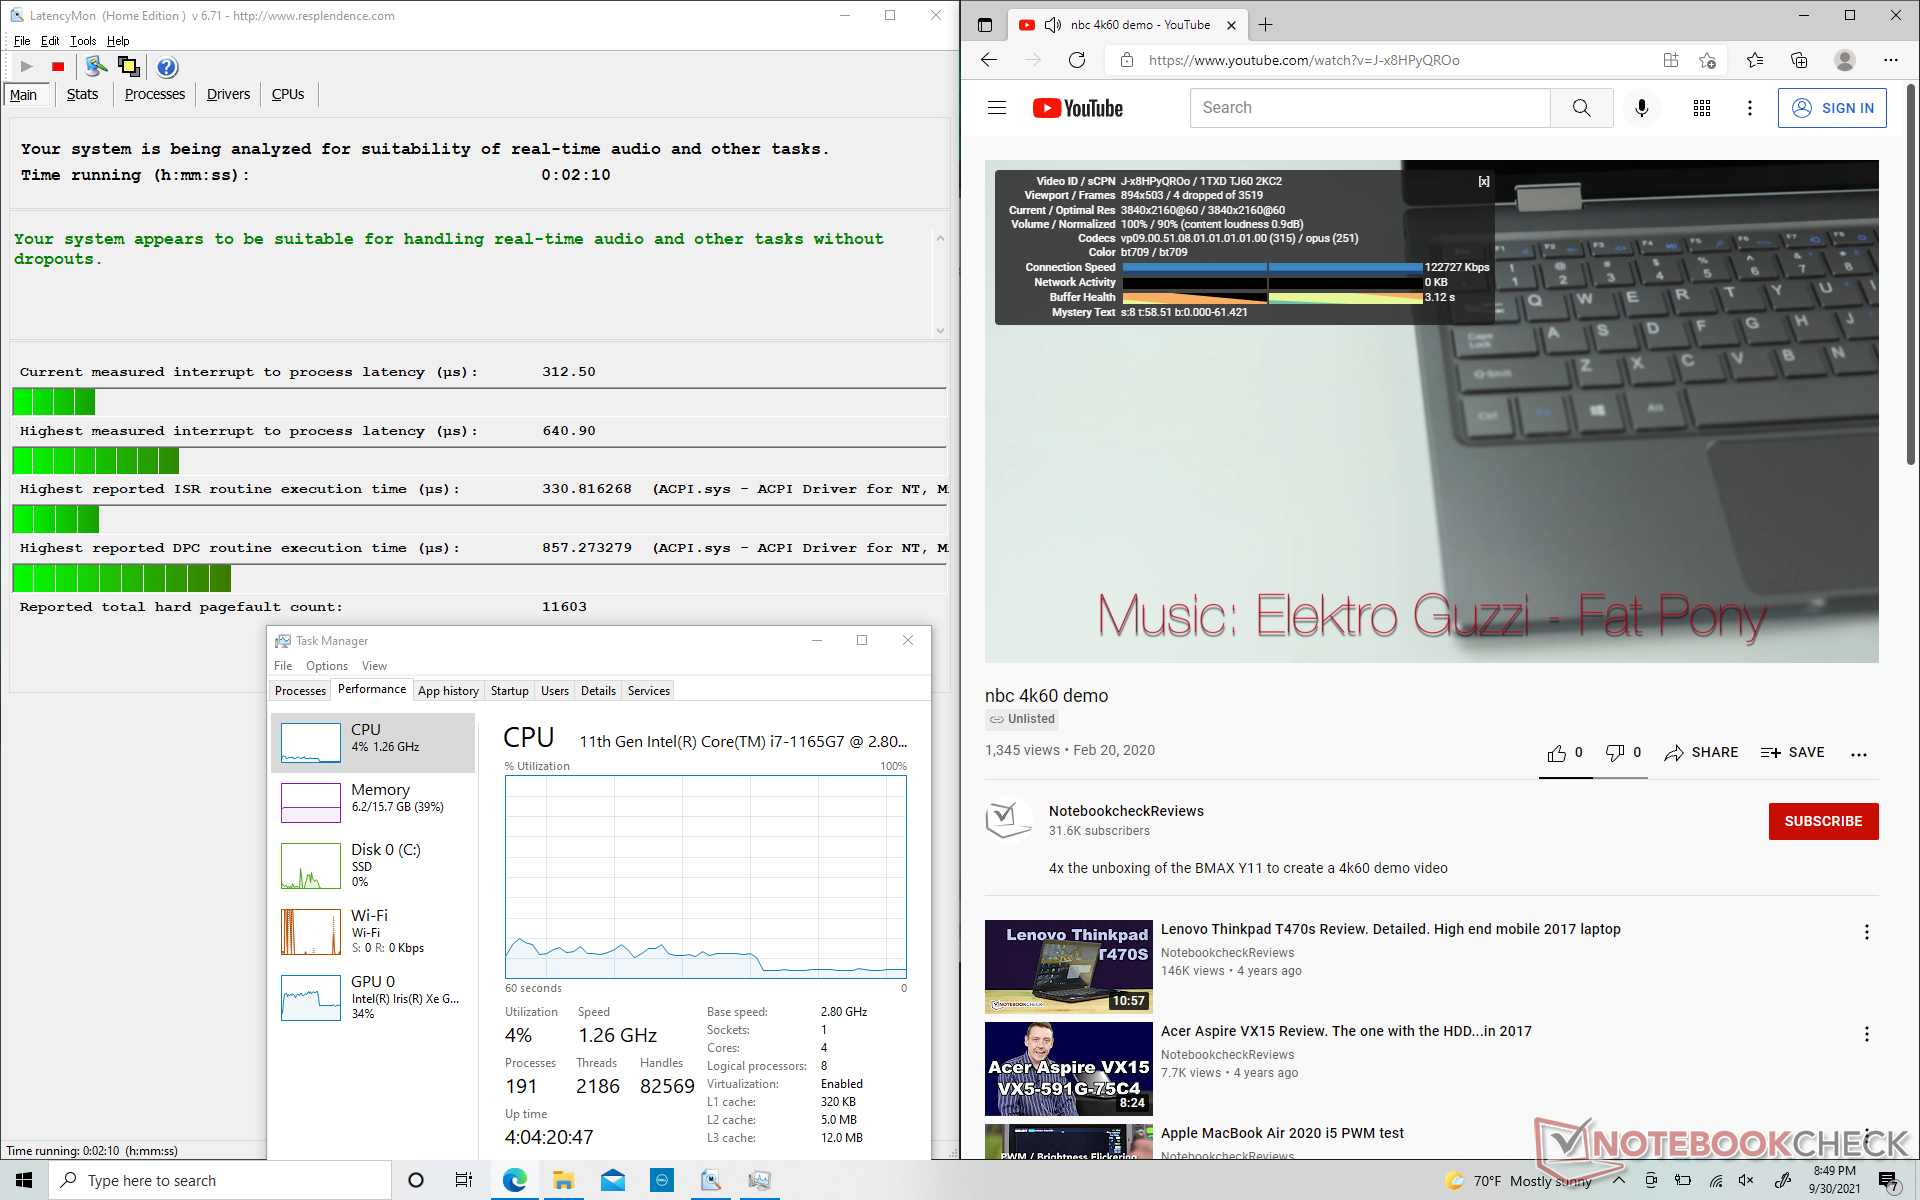
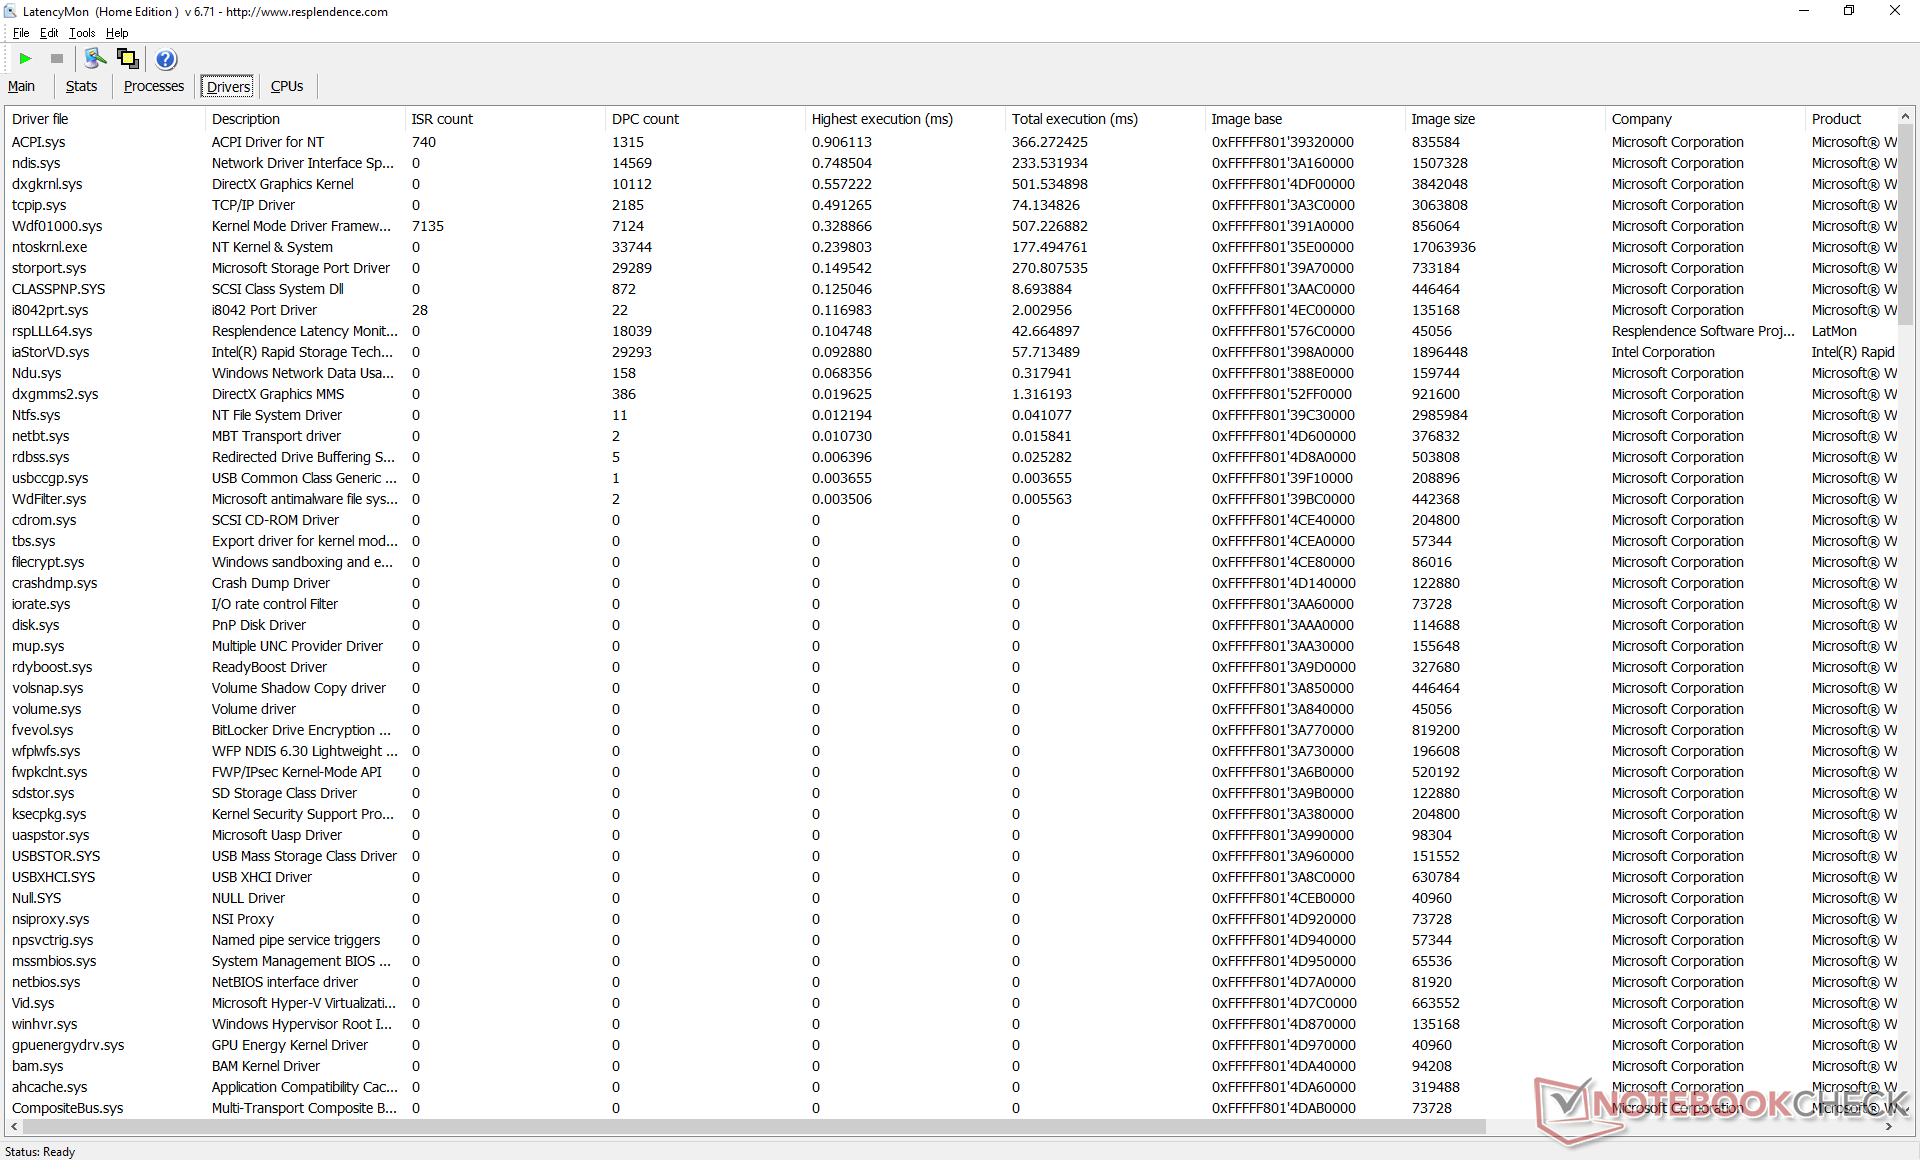
Latenza DPC
LatencyMon non mostra problemi di latenza quando si aprono più schede sulla nostra homepage o quando si esegue lo stress Prime95. Anche la riproduzione 4K UHD a 60 FPS è fluida.
| DPC Latencies / LatencyMon - interrupt to process latency (max), Web, Youtube, Prime95 | |
| Samsung Galaxy Book Pro 360 13 | |
| Asus ZenBook Flip 13 UX363EA-HP069T | |
| Lenovo Yoga 6 13 82ND0009US | |
| Dell XPS 13 9310 Core i7 FHD | |
| Dell XPS 13 9310 2-in-1 | |
* ... Meglio usare valori piccoli
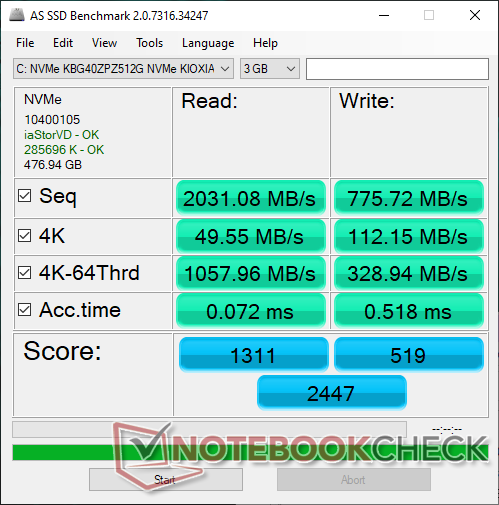
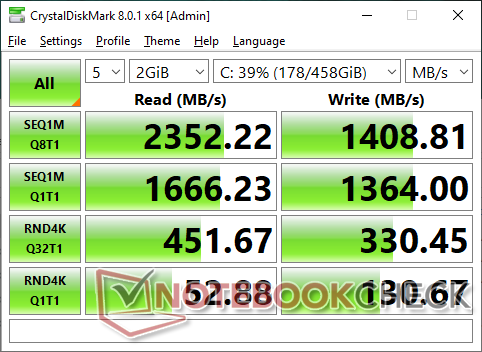
Dispositivi di archiviazione
La nostra unità di prova viene spedita con lo stessoSSD Toshiba BG4 PCIe3 NVMe che si trova sul vecchio XPS 13 7390 2-in-1. Tuttavia, non saremmo sorpresi di vedere alcune unità con SSD Micron. Non c'è supporto per le velocità PCIe4 a differenza del ultimo Vaio Z.
| Dell XPS 13 9310 2-in-1 Toshiba BG4 KBG40ZPZ512G | Dell XPS 13 9310 Core i7 FHD Micron 2300 512GB MTFDHBA512TDV | Dell XPS 13 7390 2-in-1 Core i7 Toshiba BG4 KBG40ZPZ512G | Lenovo Yoga 6 13 82ND0009US WDC PC SN530 SDBPMPZ-265G | Samsung Galaxy Book Pro 360 13 Samsung PM991 MZVLQ256HAJD | |
|---|---|---|---|---|---|
| AS SSD | 70% | 2% | -28% | 15% | |
| Seq Read (MB/s) | 2031 | 2091 3% | 1801 -11% | 1860 -8% | 1771 -13% |
| Seq Write (MB/s) | 776 | 1396 80% | 1125 45% | 500 -36% | 894 15% |
| 4K Read (MB/s) | 49.55 | 49.29 -1% | 39.7 -20% | 36.26 -27% | 53.5 8% |
| 4K Write (MB/s) | 112.2 | 104.2 -7% | 67 -40% | 118.6 6% | 157.8 41% |
| 4K-64 Read (MB/s) | 1058 | 827 -22% | 1253 18% | 419 -60% | 478.1 -55% |
| 4K-64 Write (MB/s) | 328.9 | 1636 397% | 209 -36% | 219 -33% | 741 125% |
| Access Time Read * (ms) | 0.072 | 0.066 8% | 0.069 4% | 0.102 -42% | 0.156 -117% |
| Access Time Write * (ms) | 0.518 | 0.365 30% | 0.625 -21% | 0.17 67% | 0.023 96% |
| Score Read (Points) | 1311 | 1086 -17% | 1472 12% | 641 -51% | 709 -46% |
| Score Write (Points) | 519 | 1880 262% | 388 -25% | 388 -25% | 988 90% |
| Score Total (Points) | 2447 | 3499 43% | 2583 6% | 1300 -47% | 2034 -17% |
| Copy ISO MB/s (MB/s) | 1103 | 1544 40% | 1293 17% | 880 -20% | 960 -13% |
| Copy Program MB/s (MB/s) | 331.7 | 613 85% | 560 69% | 185.3 -44% | 648 95% |
| Copy Game MB/s (MB/s) | 828 | 1451 75% | 927 12% | 212.7 -74% | 882 7% |
| CrystalDiskMark 5.2 / 6 | 24% | -3% | -20% | -12% | |
| Write 4K (MB/s) | 129.6 | 97.5 -25% | 106.7 -18% | 89.2 -31% | 170.6 32% |
| Read 4K (MB/s) | 52.2 | 50.9 -2% | 49.94 -4% | 33.09 -37% | 44.51 -15% |
| Write Seq (MB/s) | 1310 | 1811 38% | 1223 -7% | 988 -25% | 872 -33% |
| Read Seq (MB/s) | 1726 | 1836 6% | 1801 4% | 1322 -23% | 1188 -31% |
| Write 4K Q32T1 (MB/s) | 334.7 | 521 56% | 325.3 -3% | 332.6 -1% | 483.1 44% |
| Read 4K Q32T1 (MB/s) | 447.6 | 357.5 -20% | 551 23% | 389.3 -13% | 284.3 -36% |
| Write Seq Q32T1 (MB/s) | 1410 | 2879 104% | 1224 -13% | 984 -30% | 950 -33% |
| Read Seq Q32T1 (MB/s) | 2390 | 3204 34% | 2350 -2% | 2461 3% | 1872 -22% |
| Media totale (Programma / Settaggio) | 47% /
53% | -1% /
0% | -24% /
-25% | 2% /
6% |
* ... Meglio usare valori piccoli

Disk Throttling: DiskSpd Read Loop, Queue Depth 8
Prestazioni della GPU - Enormi guadagni rispetto a Iris Plus G7
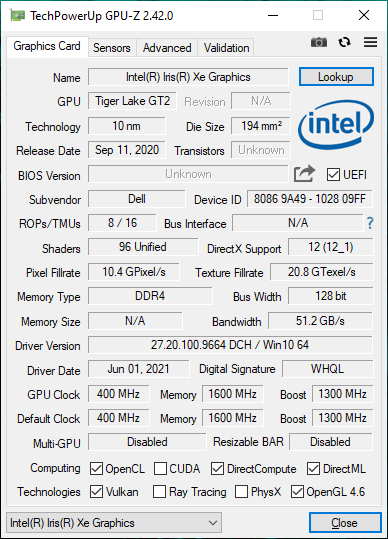
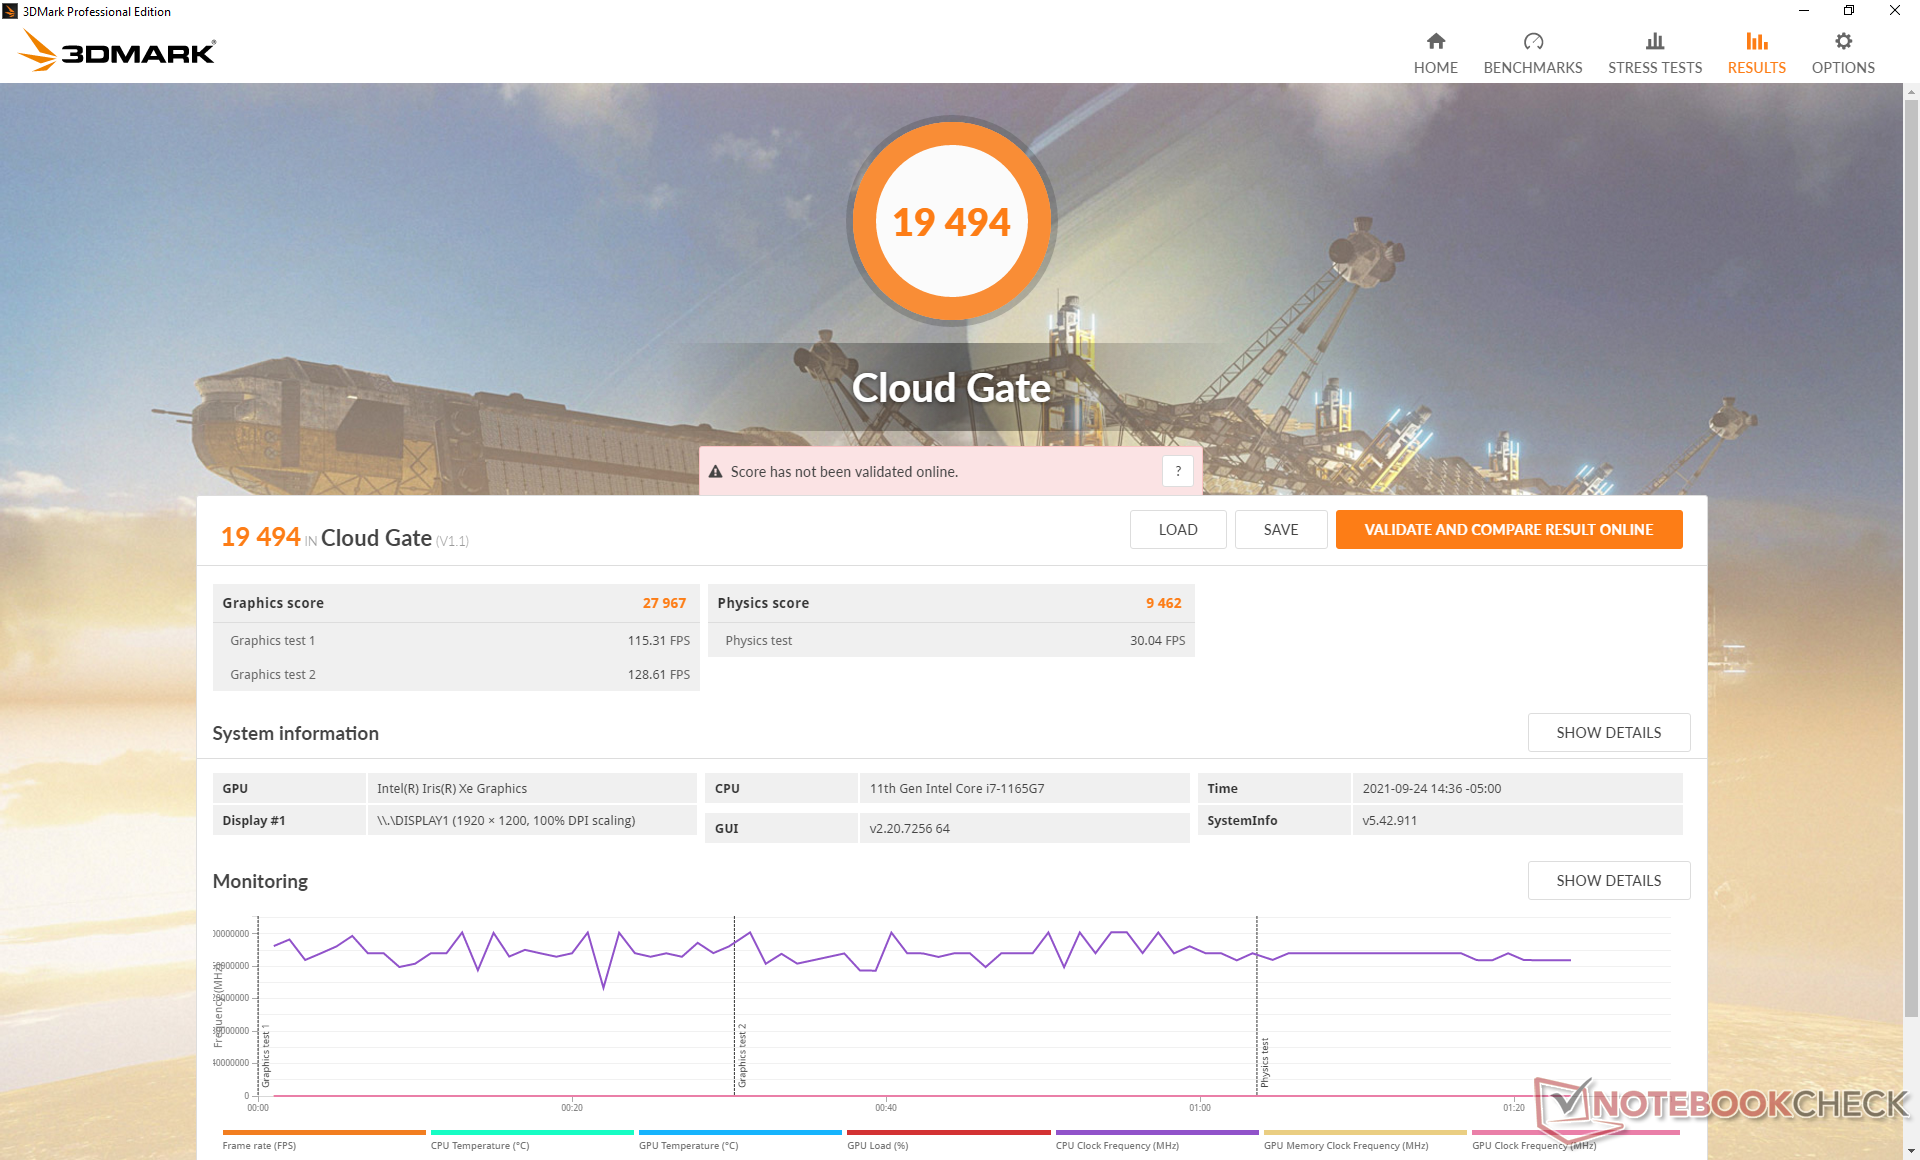
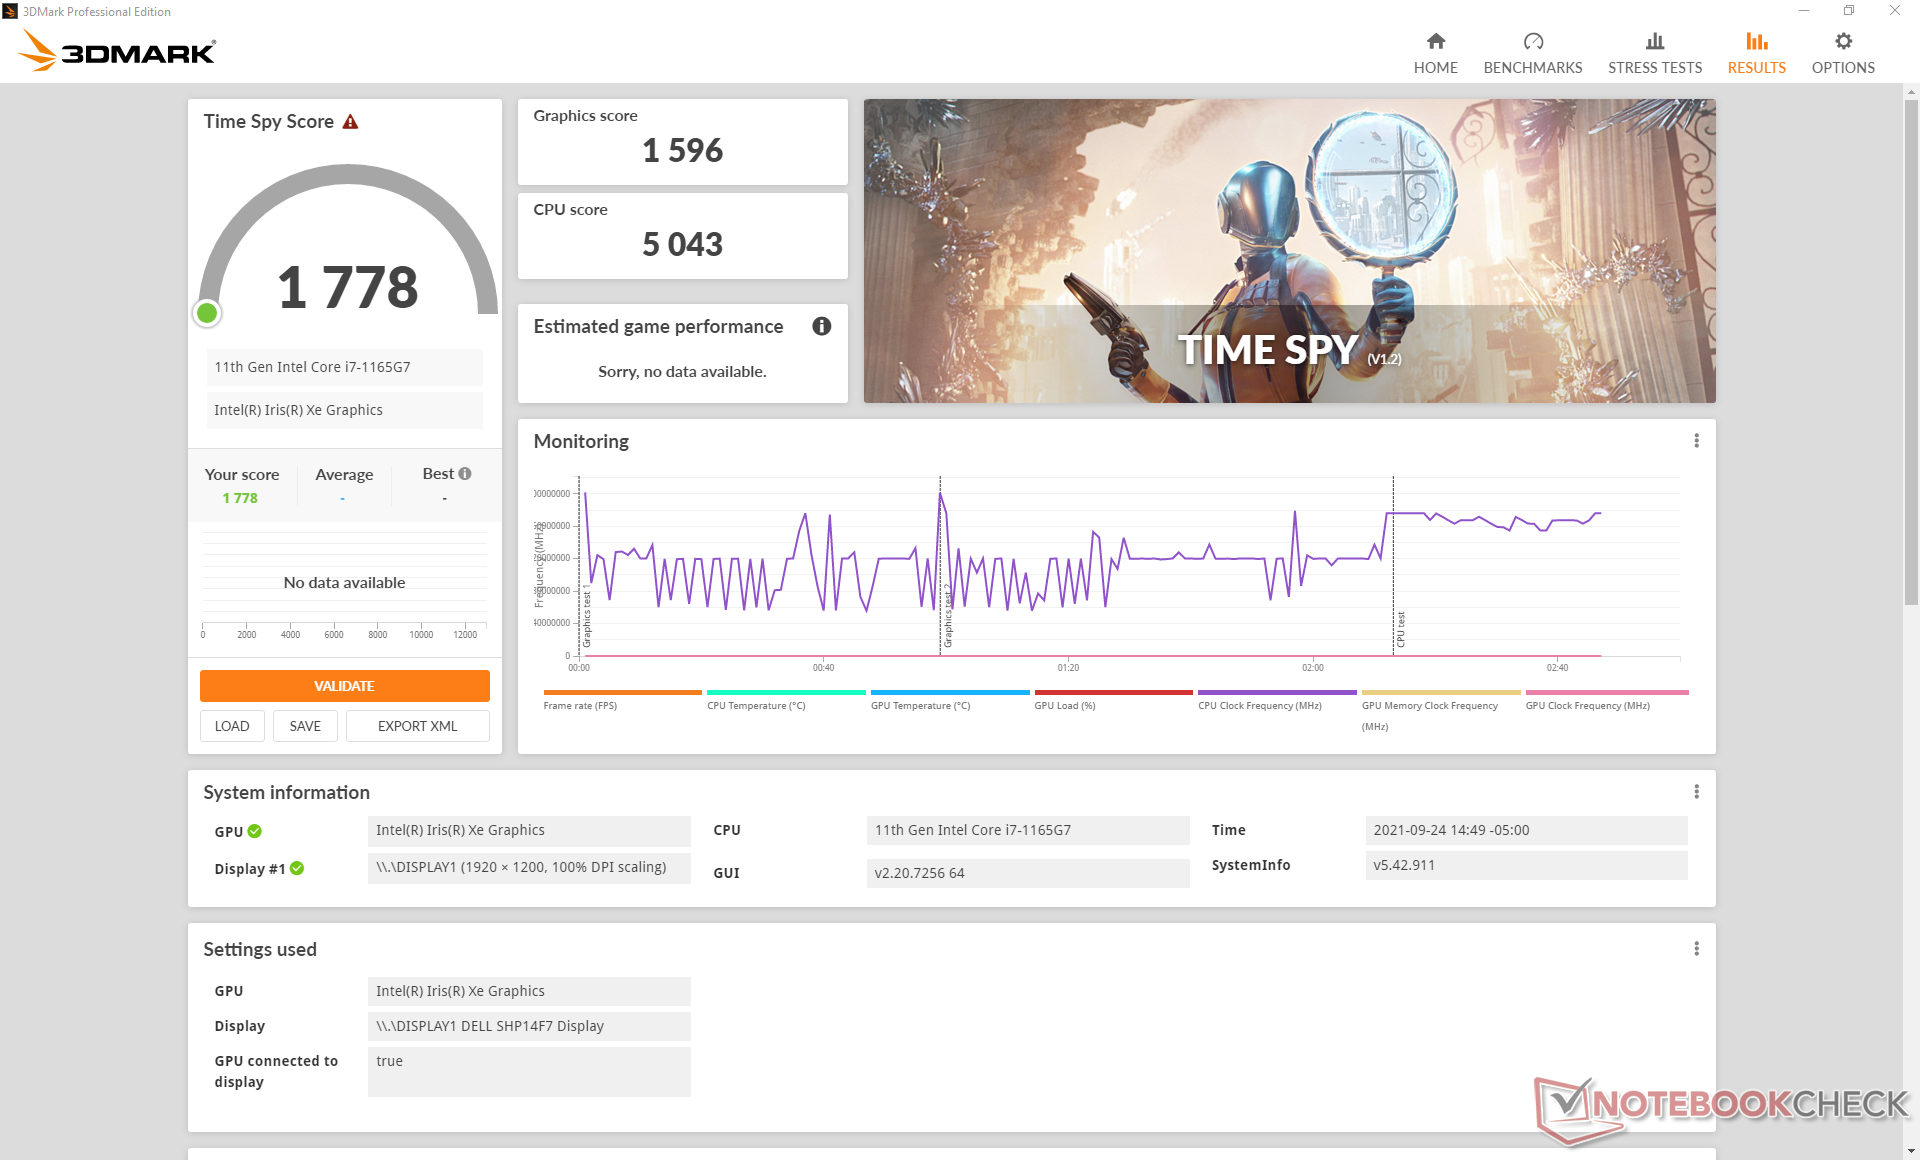
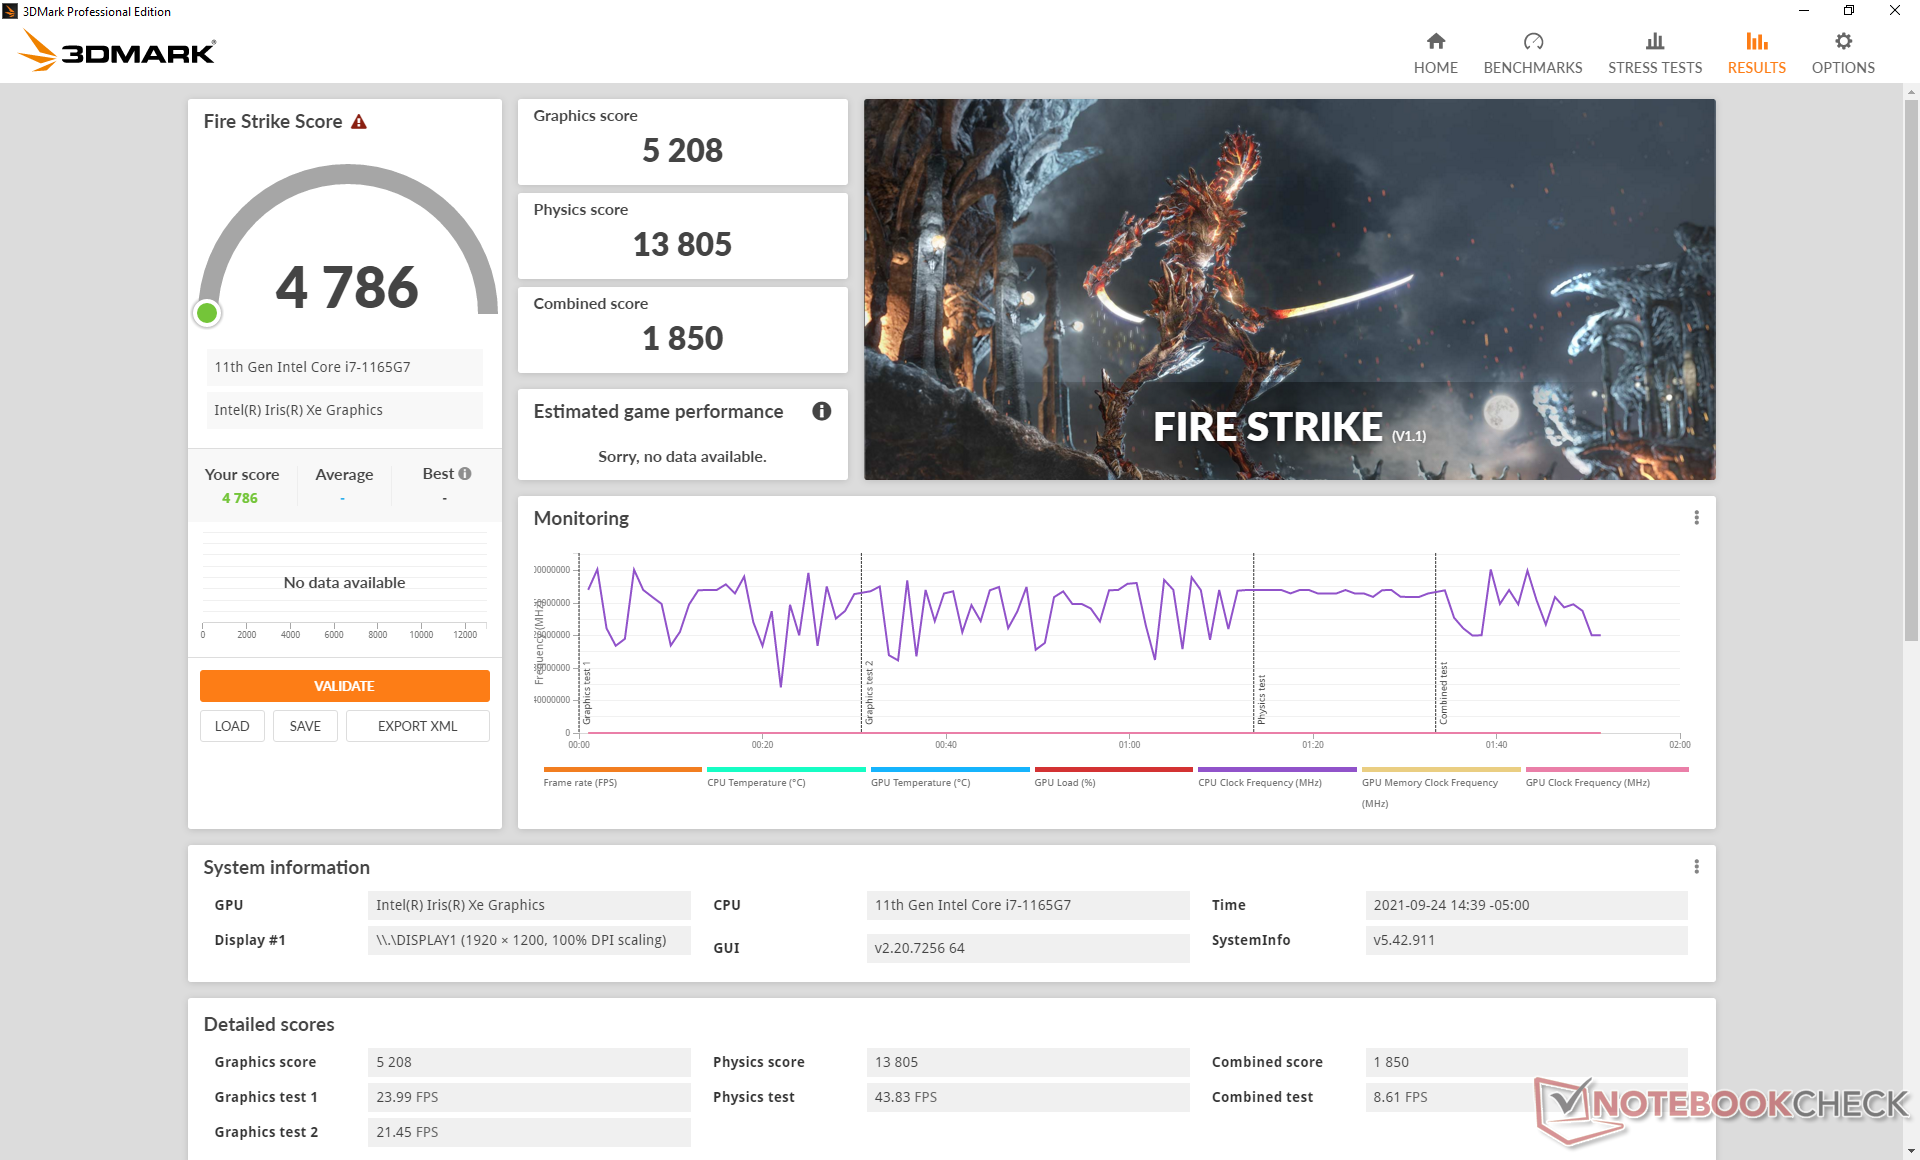
Iris Xe Le prestazioni grafiche sono un aggiornamento significativo rispetto alla Iris Plus G7 sull'XPS 13 7390 2-in-1 dell'anno scorso, dal 60 al 90% secondo i benchmark di 3DMark. Gli utenti dovrebbero vedere i maggiori salti per i titoli che supportano le DX12 rispetto alle DX11.
Le prestazioni non sono sempre costanti, tuttavia. Per esempio, semplicemente girando al minimo su Witcher 3 a impostazioni basse per un'ora, si otterrebbe un frame rate fluttuante tra 70 e 98 FPS. Quindi, mentre le prestazioni sono ottime in media, possono periodicamente scendere di un bel po'. Questo comportamento è qualcosa che abbiamo osservato anche sui modelli XPS 13 della generazione precedente.
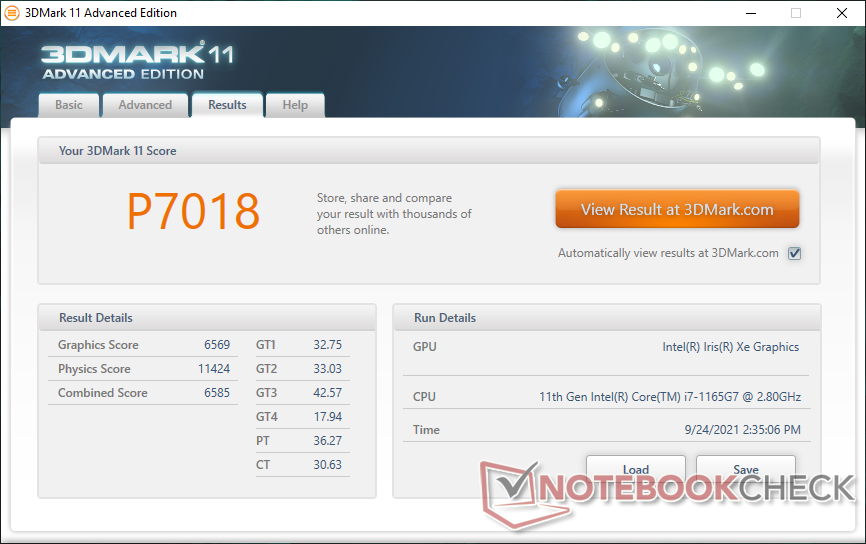
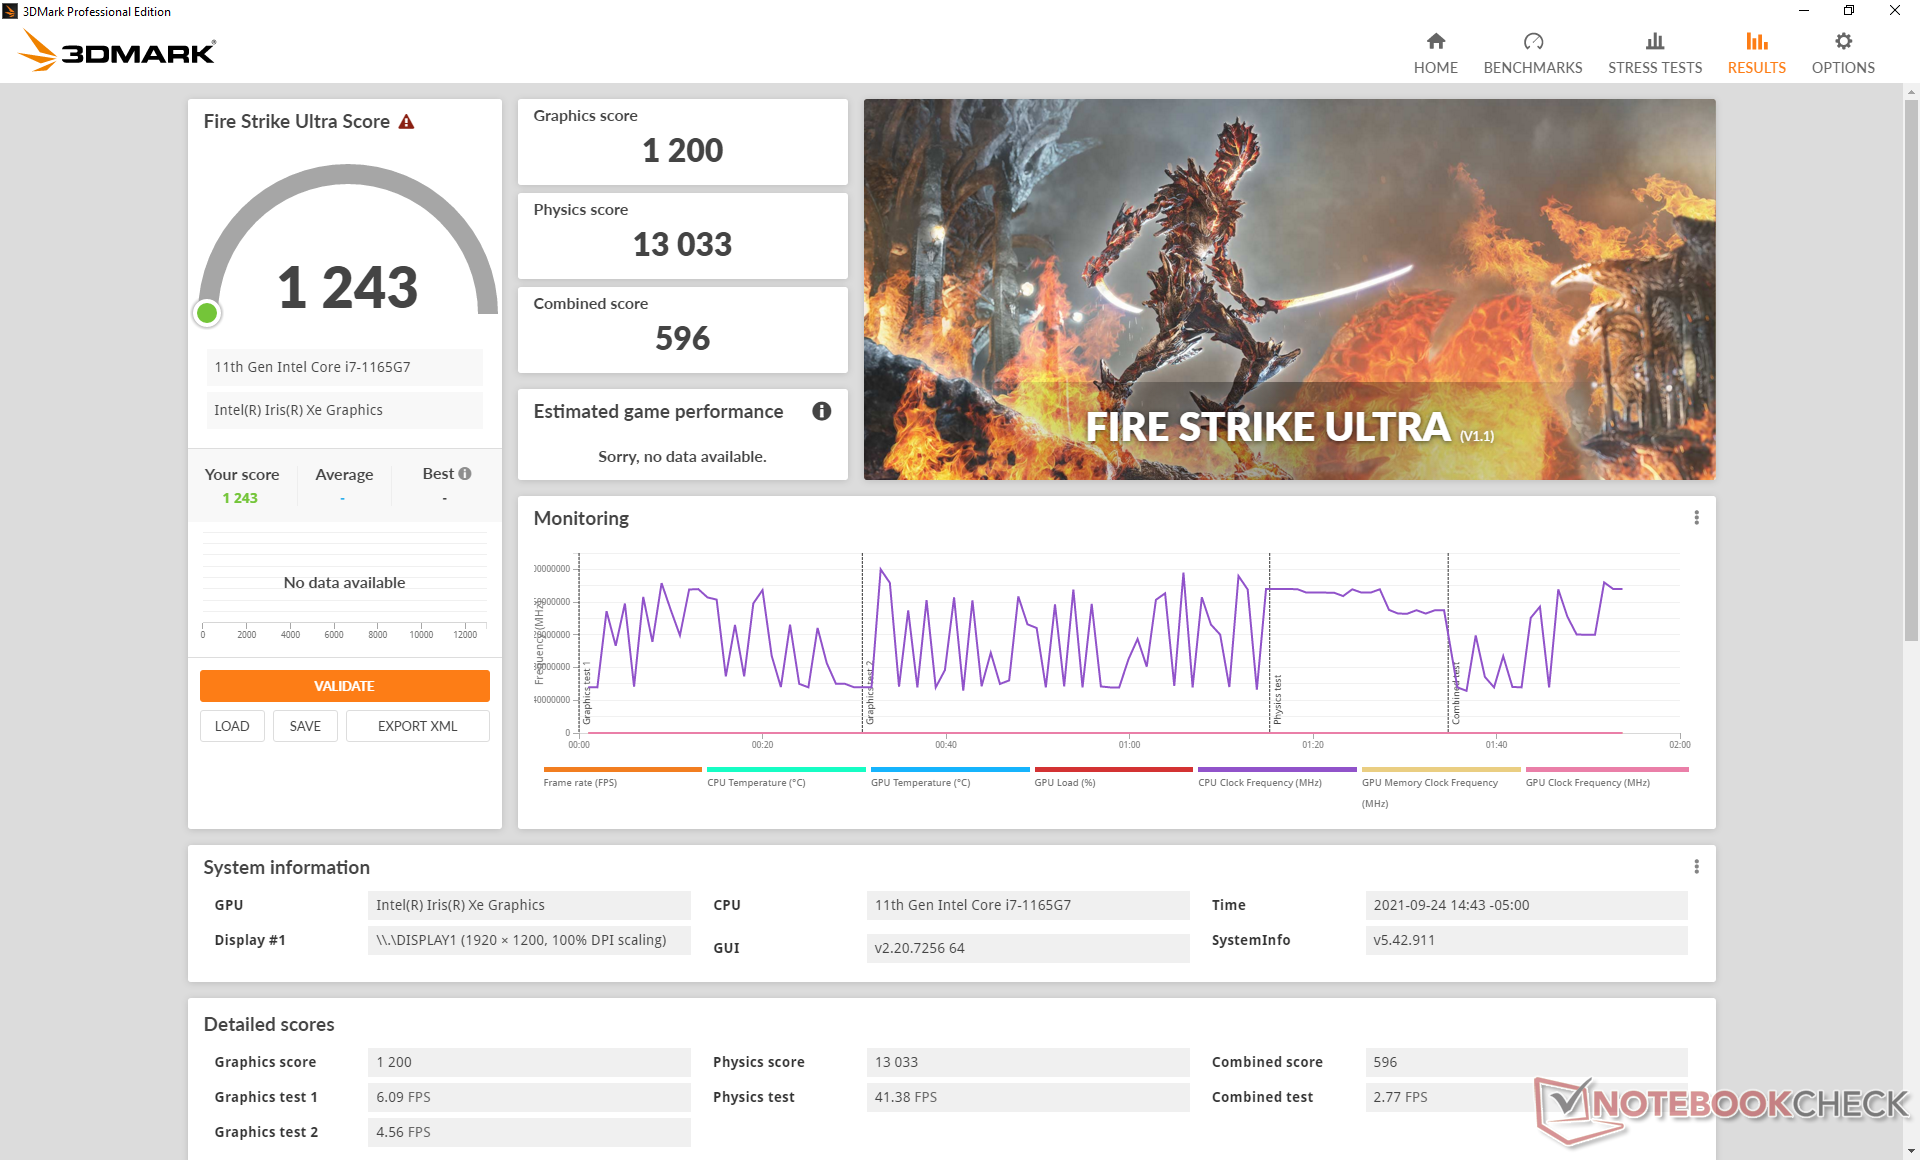
| 3DMark 11 Performance | 7018 punti | |
| 3DMark Cloud Gate Standard Score | 19494 punti | |
| 3DMark Fire Strike Score | 4786 punti | |
| 3DMark Time Spy Score | 1778 punti | |
Aiuto | ||
| GTA V | |
| 1024x768 Lowest Settings possible | |
| Lenovo Yoga Slim 7-14ARE | |
| Media Intel Iris Xe Graphics G7 96EUs (52 - 166.4, n=168) | |
| Dell XPS 13 9310 2-in-1 | |
| Lenovo Yoga 6 13 82ND0009US | |
| 1920x1080 Lowest Settings possible | |
| Dell XPS 13 9310 2-in-1 | |
| Media Intel Iris Xe Graphics G7 96EUs (34.7 - 132.1, n=141) | |
| Lenovo Yoga Slim 7-14ARE | |
| Lenovo Yoga 6 13 82ND0009US | |
| 1366x768 Normal/Off AF:4x | |
| Media Intel Iris Xe Graphics G7 96EUs (24.1 - 152.7, n=169) | |
| Dell XPS 13 9310 2-in-1 | |
| 1920x1080 Normal/Off AF:4x | |
| Dell XPS 13 9310 2-in-1 | |
| Lenovo Yoga Slim 7-14ARE | |
| Media Intel Iris Xe Graphics G7 96EUs (20 - 119.3, n=142) | |
| Lenovo Yoga 6 13 82ND0009US | |
| 1920x1080 High/On (Advanced Graphics Off) AA:2xMSAA + FX AF:8x | |
| Lenovo Yoga Slim 7-14ARE | |
| Dell XPS 13 9310 2-in-1 | |
| Media Intel Iris Xe Graphics G7 96EUs (9.39 - 51.6, n=162) | |
| Lenovo Yoga 6 13 82ND0009US | |
| 1920x1080 Highest AA:4xMSAA + FX AF:16x | |
| Lenovo Yoga Slim 7-14ARE | |
| Dell XPS 13 9310 2-in-1 | |
| Media Intel Iris Xe Graphics G7 96EUs (4.13 - 22.9, n=156) | |
| Lenovo Yoga 6 13 82ND0009US | |
| Far Cry 5 | |
| 1280x720 Low Preset AA:T | |
| Dell XPS 13 9310 2-in-1 | |
| Media Intel Iris Xe Graphics G7 96EUs (23 - 75, n=93) | |
| 1920x1080 Low Preset AA:T | |
| Media Intel Iris Xe Graphics G7 96EUs (15 - 48, n=41) | |
| Dell XPS 13 9310 2-in-1 | |
| 1920x1080 Medium Preset AA:T | |
| Media Intel Iris Xe Graphics G7 96EUs (14 - 39, n=91) | |
| Dell XPS 13 9310 2-in-1 | |
| 1920x1080 High Preset AA:T | |
| Media Intel Iris Xe Graphics G7 96EUs (10 - 35, n=89) | |
| Dell XPS 13 9310 2-in-1 | |
| 1920x1080 Ultra Preset AA:T | |
| Media Intel Iris Xe Graphics G7 96EUs (11 - 33, n=75) | |
| Dell XPS 13 9310 2-in-1 | |
Witcher 3 FPS Chart
| basso | medio | alto | ultra | |
|---|---|---|---|---|
| GTA V (2015) | 96.7 | 80.5 | 25.4 | 10 |
| The Witcher 3 (2015) | 86.2 | 54.3 | 29.9 | 14.7 |
| Dota 2 Reborn (2015) | 109 | 61.4 | 52.8 | 52.8 |
| Final Fantasy XV Benchmark (2018) | 36.8 | 21.8 | 15.9 | |
| X-Plane 11.11 (2018) | 23.5 | 31.9 | 31.3 | |
| Far Cry 5 (2018) | 49 | 23 | 22 | 22 |
| Strange Brigade (2018) | 78.1 | 36.8 | 29.4 | 24 |
Emissions
Rumore del sistema - Silenzioso sotto la maggior parte dei carichi medio-bassi
Il comportamento della ventola è quasi identico a quello che abbiamo osservato sull'XPS 13 7390 2-in-1. La differenza principale è che il rumore della ventola può aumentare prima quando si eseguono carichi elevati come 3DMark 06 forse a causa dei limiti più alti di Turbo Boost e PL2 di Tiger Lake-U rispetto a Ice Lake. Altrimenti, gli utenti possono aspettarsi un rumore della ventola tra i 38 e i 43 dB(A) quando si eseguono carichi impegnativi o fino a 27.2 dB(A) durante lo streaming video o la navigazione web contro uno sfondo silenzioso di 24.3 dB(A). Il nuovo Galaxy Book Pro 360 13 presenterebbe risultati simili.
| Dell XPS 13 9310 2-in-1 Iris Xe G7 96EUs, i7-1165G7, Toshiba BG4 KBG40ZPZ512G | Dell XPS 13 9310 Core i7 FHD Iris Xe G7 96EUs, i7-1165G7, Micron 2300 512GB MTFDHBA512TDV | Dell XPS 13 7390 2-in-1 Core i7 Iris Plus Graphics G7 (Ice Lake 64 EU), i7-1065G7, Toshiba BG4 KBG40ZPZ512G | Lenovo Yoga 6 13 82ND0009US Vega 7, R5 5500U, WDC PC SN530 SDBPMPZ-265G | Asus ZenBook Flip 13 UX363EA-HP069T Iris Xe G7 96EUs, i7-1165G7, WDC PC SN730 SDBPNTY-1T00 | Samsung Galaxy Book Pro 360 13 Iris Xe G7 80EUs, i5-1135G7, Samsung PM991 MZVLQ256HAJD | |
|---|---|---|---|---|---|---|
| Noise | 4% | -8% | -1% | -12% | -7% | |
| off /ambiente * (dB) | 24.3 | 25.7 -6% | 28.1 -16% | 25.1 -3% | 27 -11% | 27 -11% |
| Idle Minimum * (dB) | 24.8 | 25.7 -4% | 28.1 -13% | 25.1 -1% | 27 -9% | 27 -9% |
| Idle Average * (dB) | 24.8 | 25.7 -4% | 28.1 -13% | 25.1 -1% | 27 -9% | 27 -9% |
| Idle Maximum * (dB) | 24.8 | 25.9 -4% | 28.1 -13% | 25.1 -1% | 27 -9% | 27 -9% |
| Load Average * (dB) | 38 | 26.2 31% | 31.7 17% | 41 -8% | 46 -21% | 40.7 -7% |
| Witcher 3 ultra * (dB) | 38 | 36.5 4% | 43.4 -14% | 38.6 -2% | ||
| Load Maximum * (dB) | 41.5 | 36.6 12% | 43.4 -5% | 38.7 7% | 46.6 -12% | 40.7 2% |
* ... Meglio usare valori piccoli
Rumorosità
| Idle |
| 24.8 / 24.8 / 24.8 dB(A) |
| Sotto carico |
| 38 / 41.5 dB(A) |
 | ||
30 dB silenzioso 40 dB(A) udibile 50 dB(A) rumoroso |
||
min: | ||
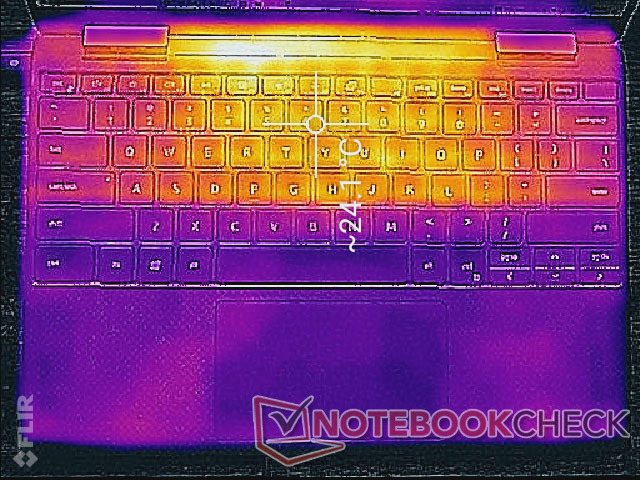
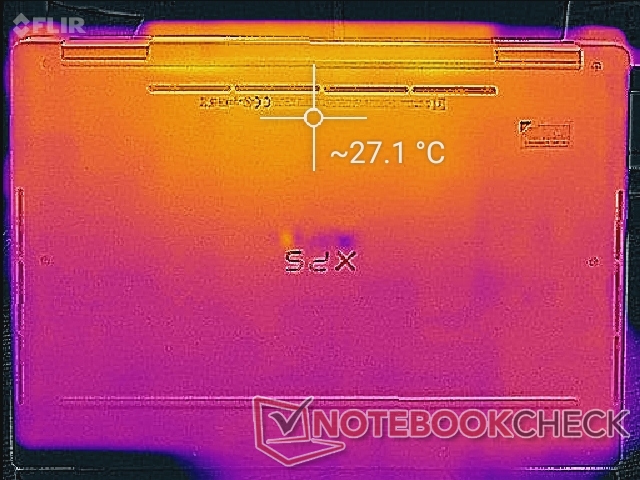
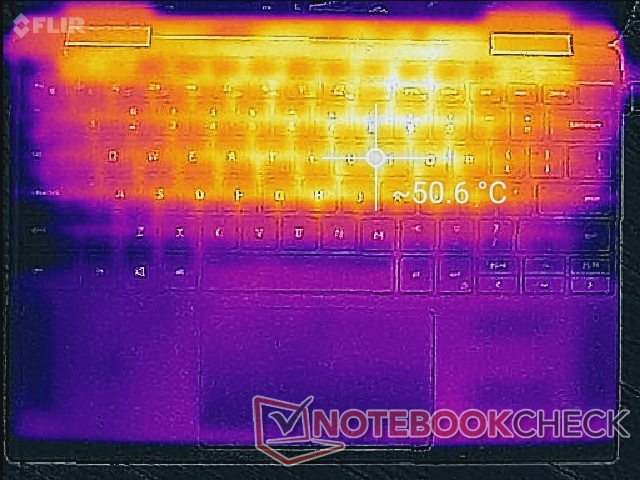
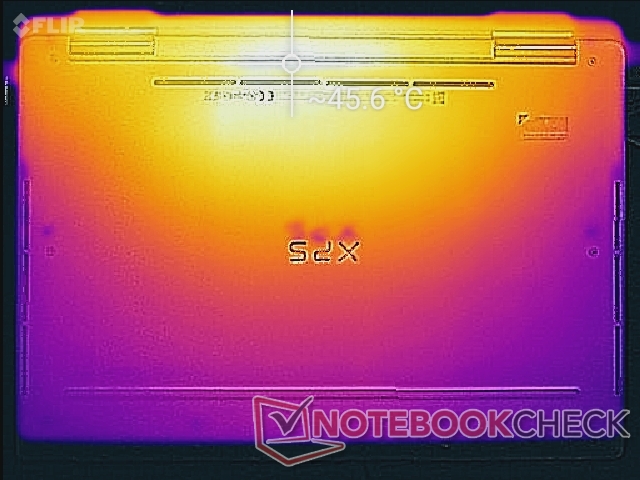
Temperatura - Palm Rests relativamente freddi
Le temperature di superficie sono quasi identiche a quelle che abbiamo osservato sul Ice Lake-powered XPS 13 7390 2-in-1 a circa 50 C e 57 C sui punti caldi superiore e inferiore, rispettivamente. La tastiera continua ad essere notevolmente più calda rispetto alla maggior parte degli altri subnotebook tra cui il nuovoSamsung Galaxy Book Pro 360.
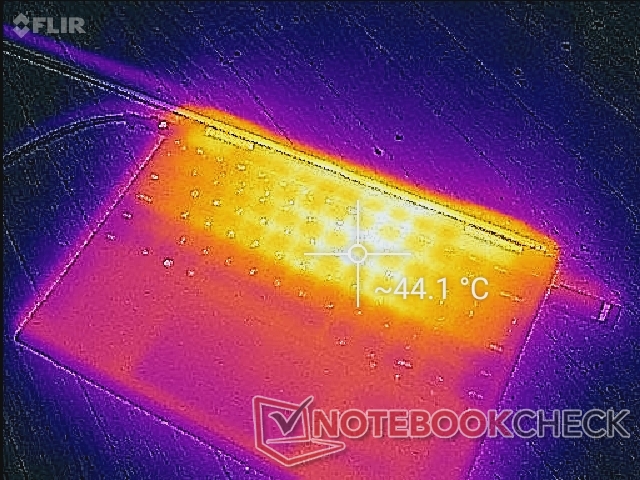
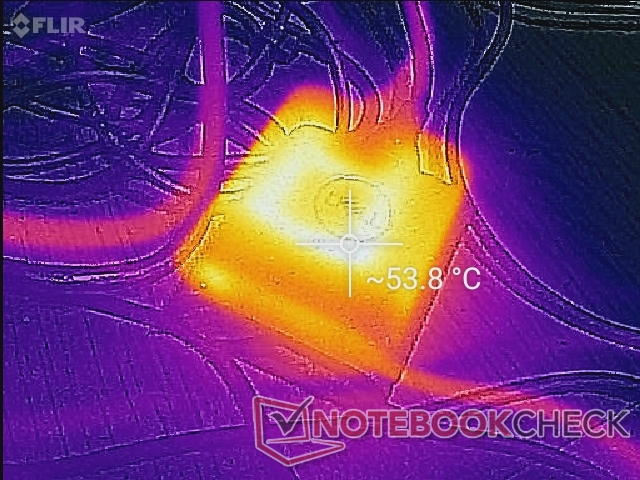
(-) La temperatura massima sul lato superiore è di 51 °C / 124 F, rispetto alla media di 35.4 °C / 96 F, che varia da 19.6 a 60 °C per questa classe Convertible.
(-) Il lato inferiore si riscalda fino ad un massimo di 45.4 °C / 114 F, rispetto alla media di 36.9 °C / 98 F
(+) In idle, la temperatura media del lato superiore è di 22.9 °C / 73 F, rispetto alla media deld ispositivo di 30.3 °C / 87 F.
(+) I poggiapolsi e il touchpad sono piu' freddi della temperatura della pelle con un massimo di 30.6 °C / 87.1 F e sono quindi freddi al tatto.
(-) La temperatura media della zona del palmo della mano di dispositivi simili e'stata di 28 °C / 82.4 F (-2.6 °C / -4.7 F).
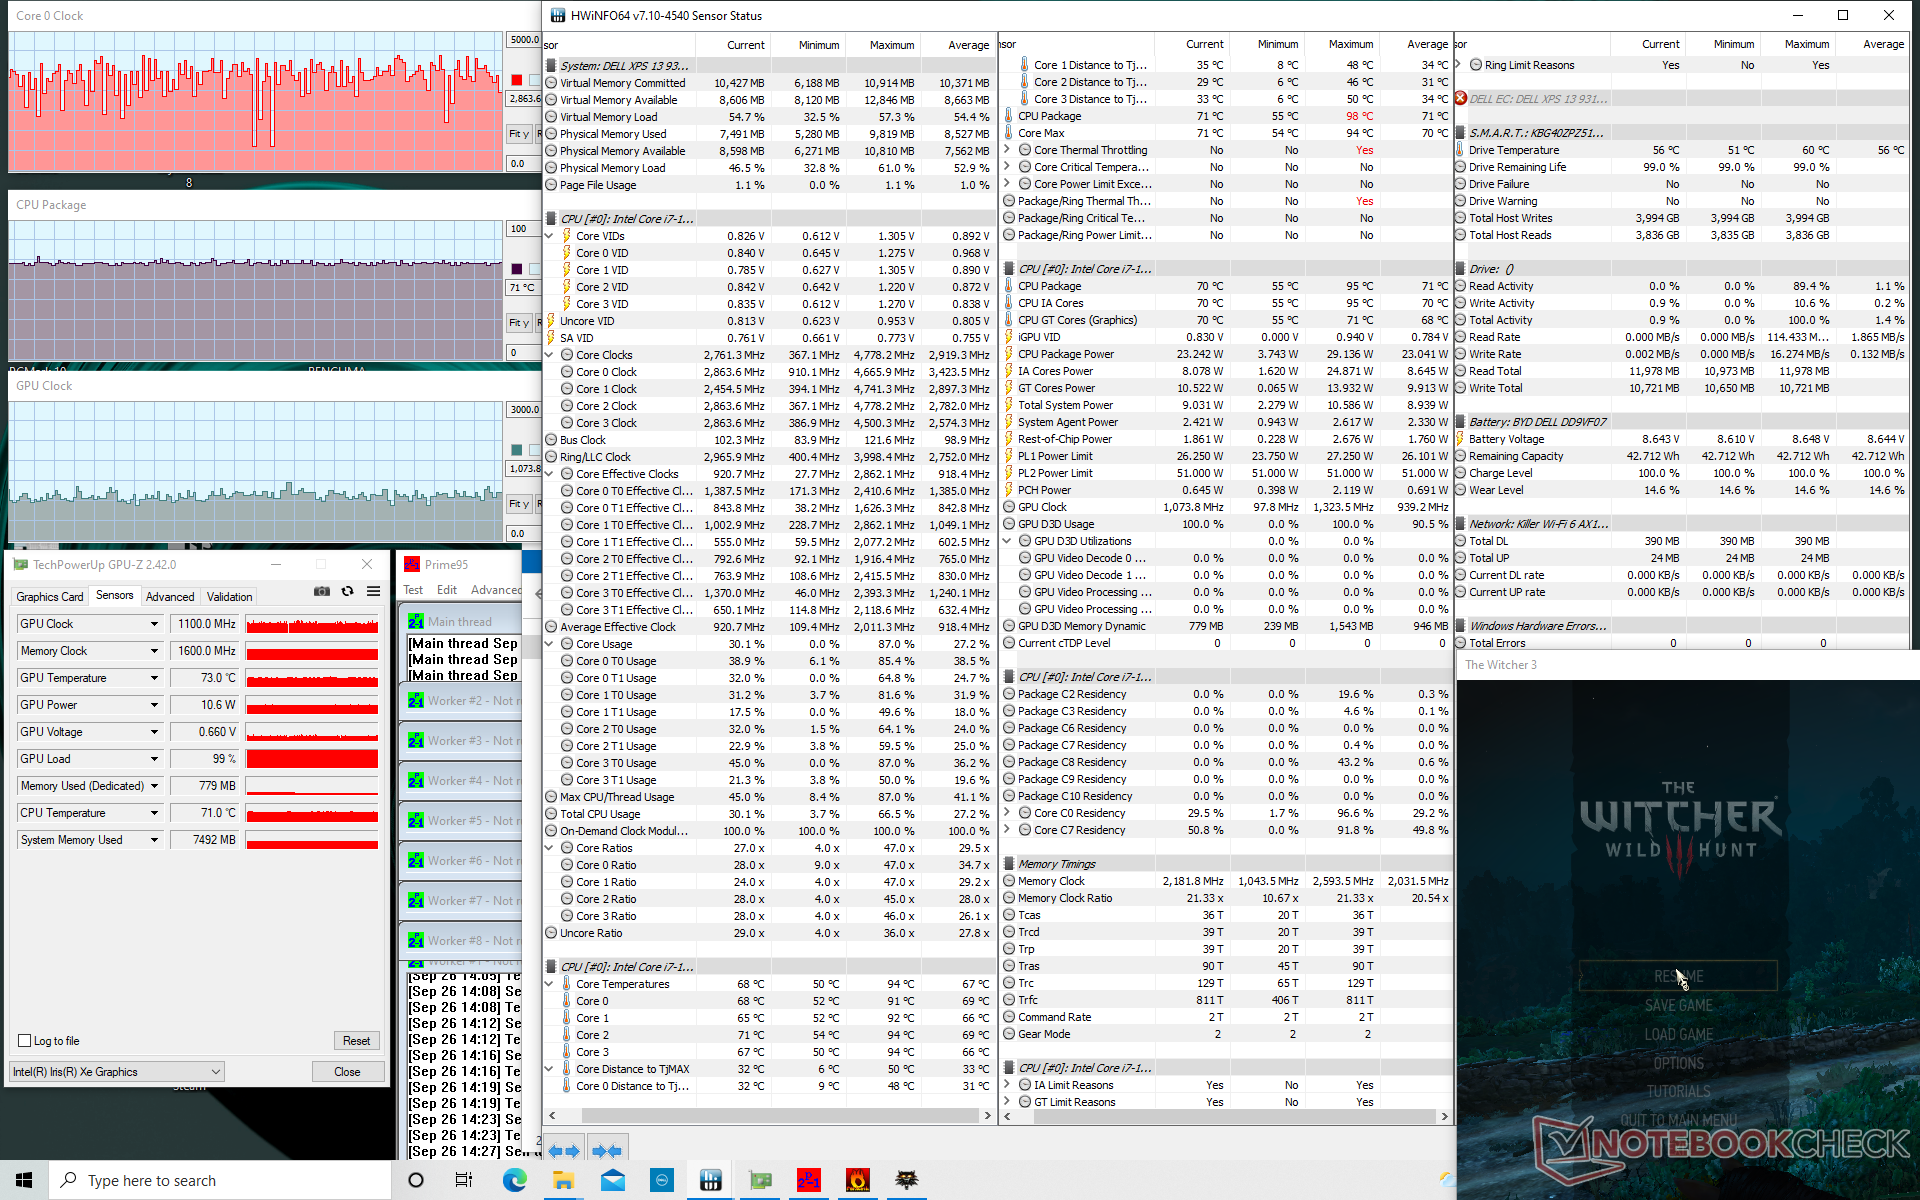
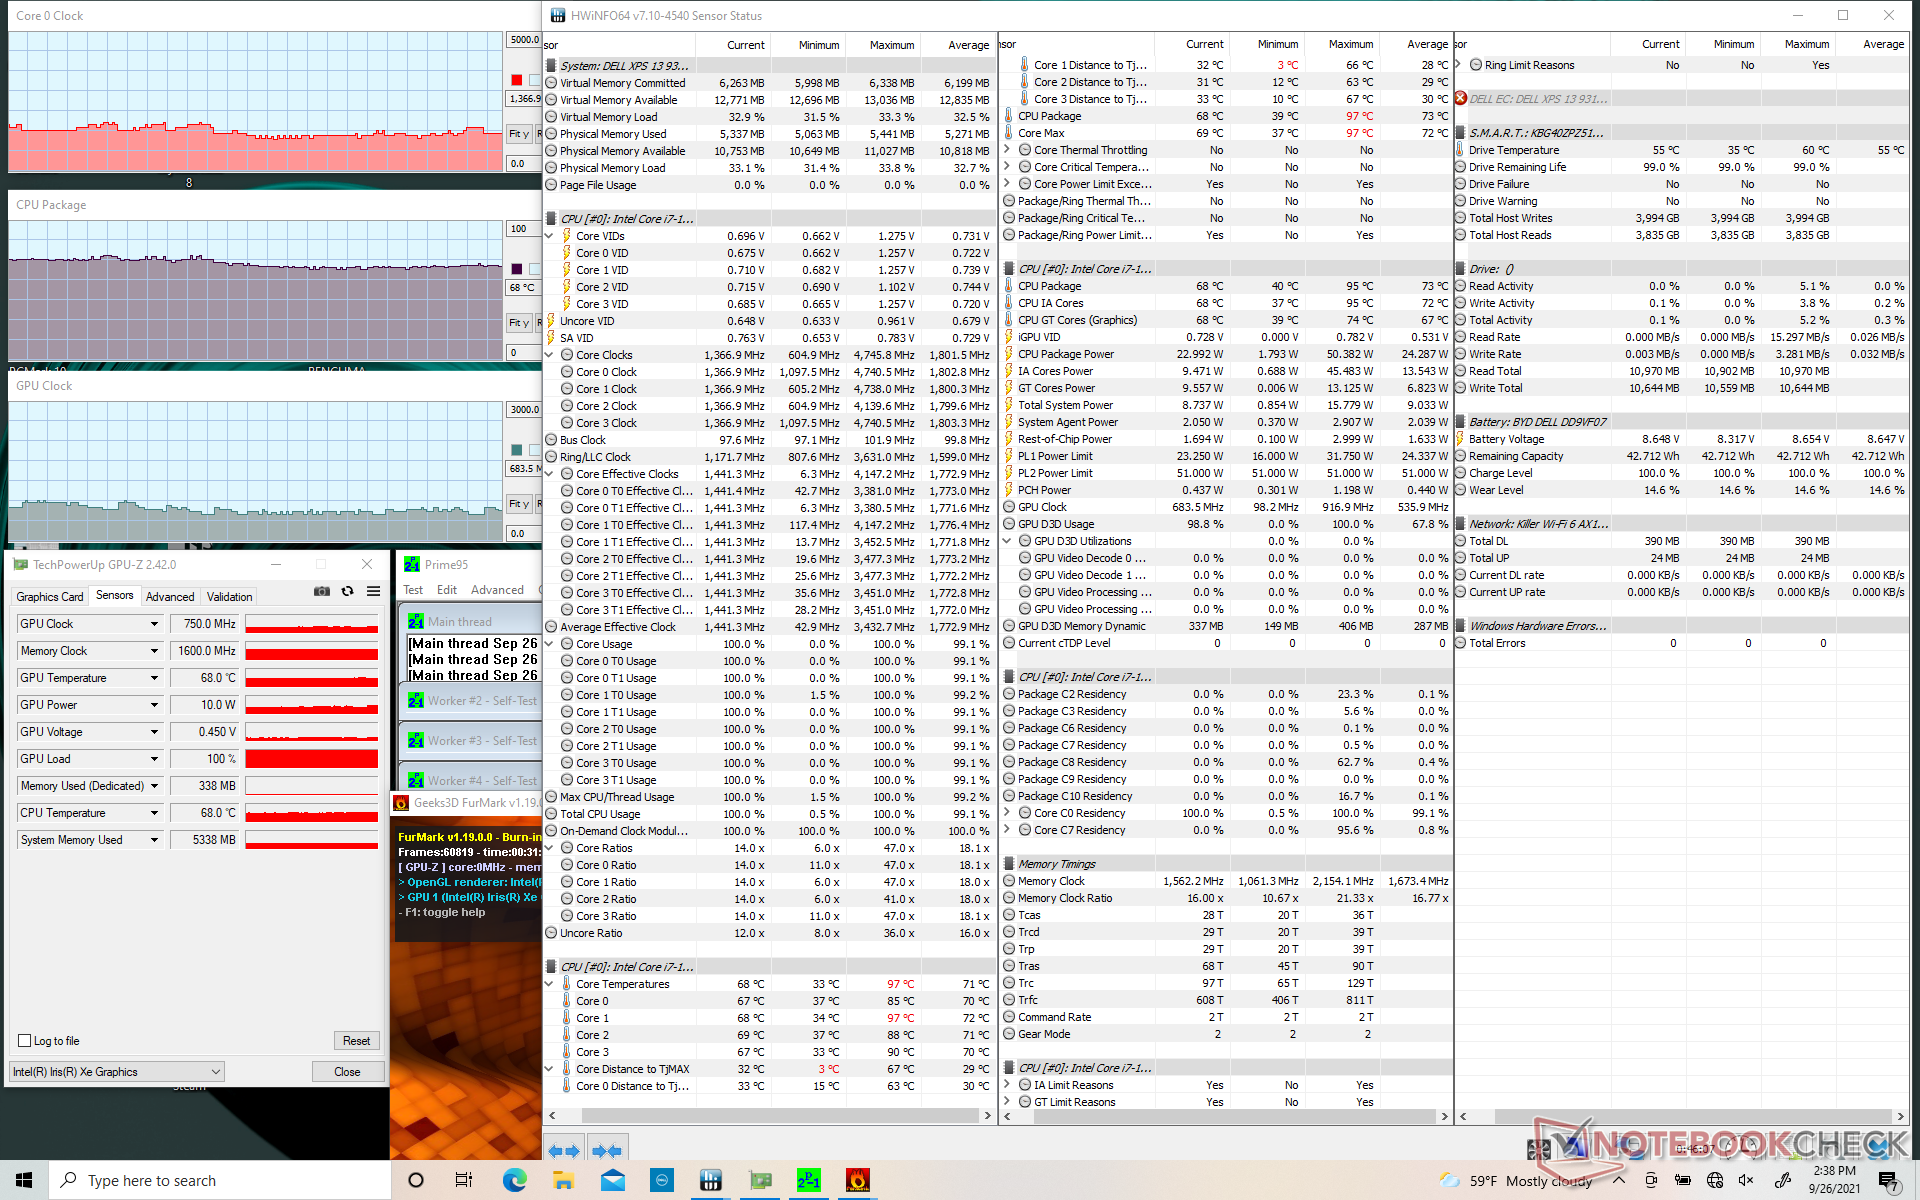
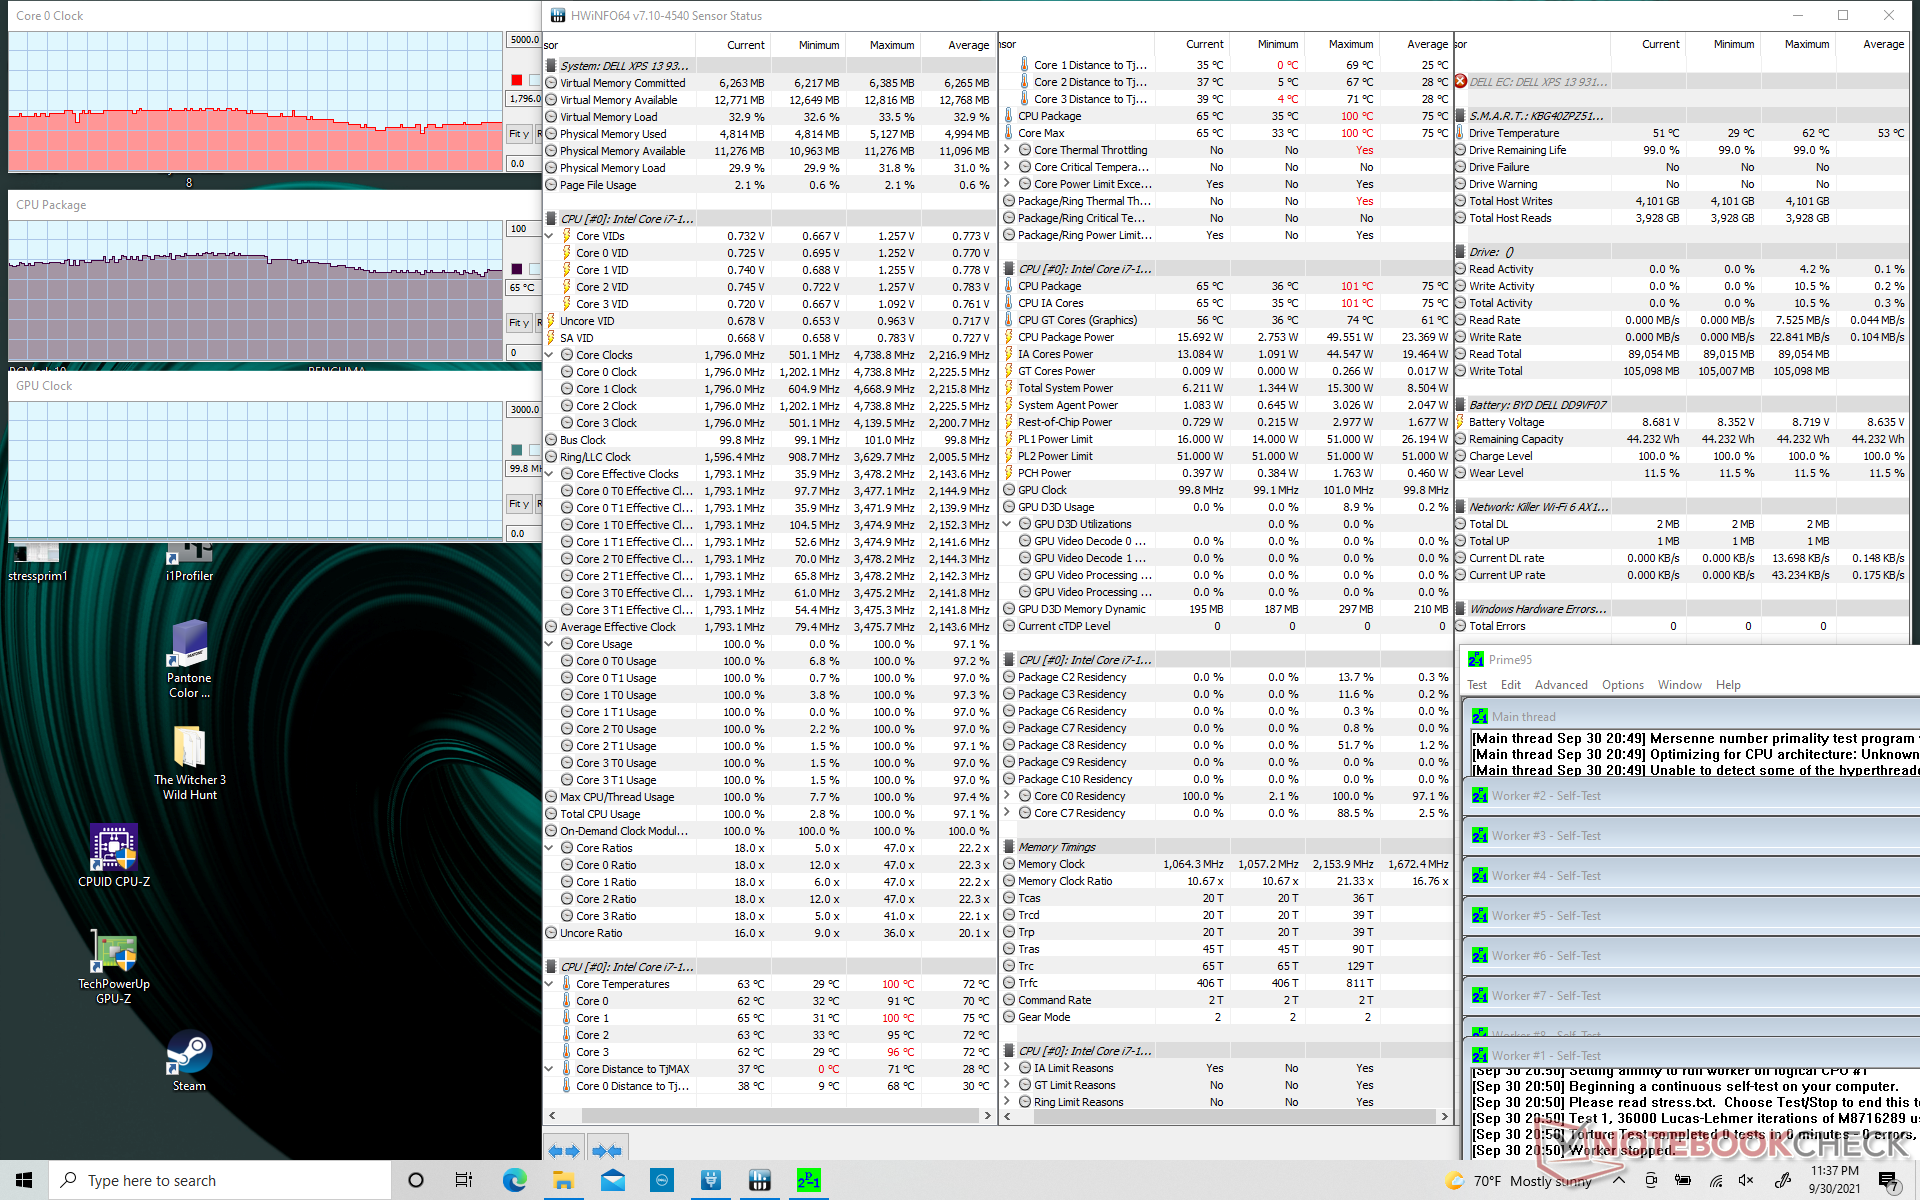
Stress Test - Velocità di clock e frame rate in bicicletta
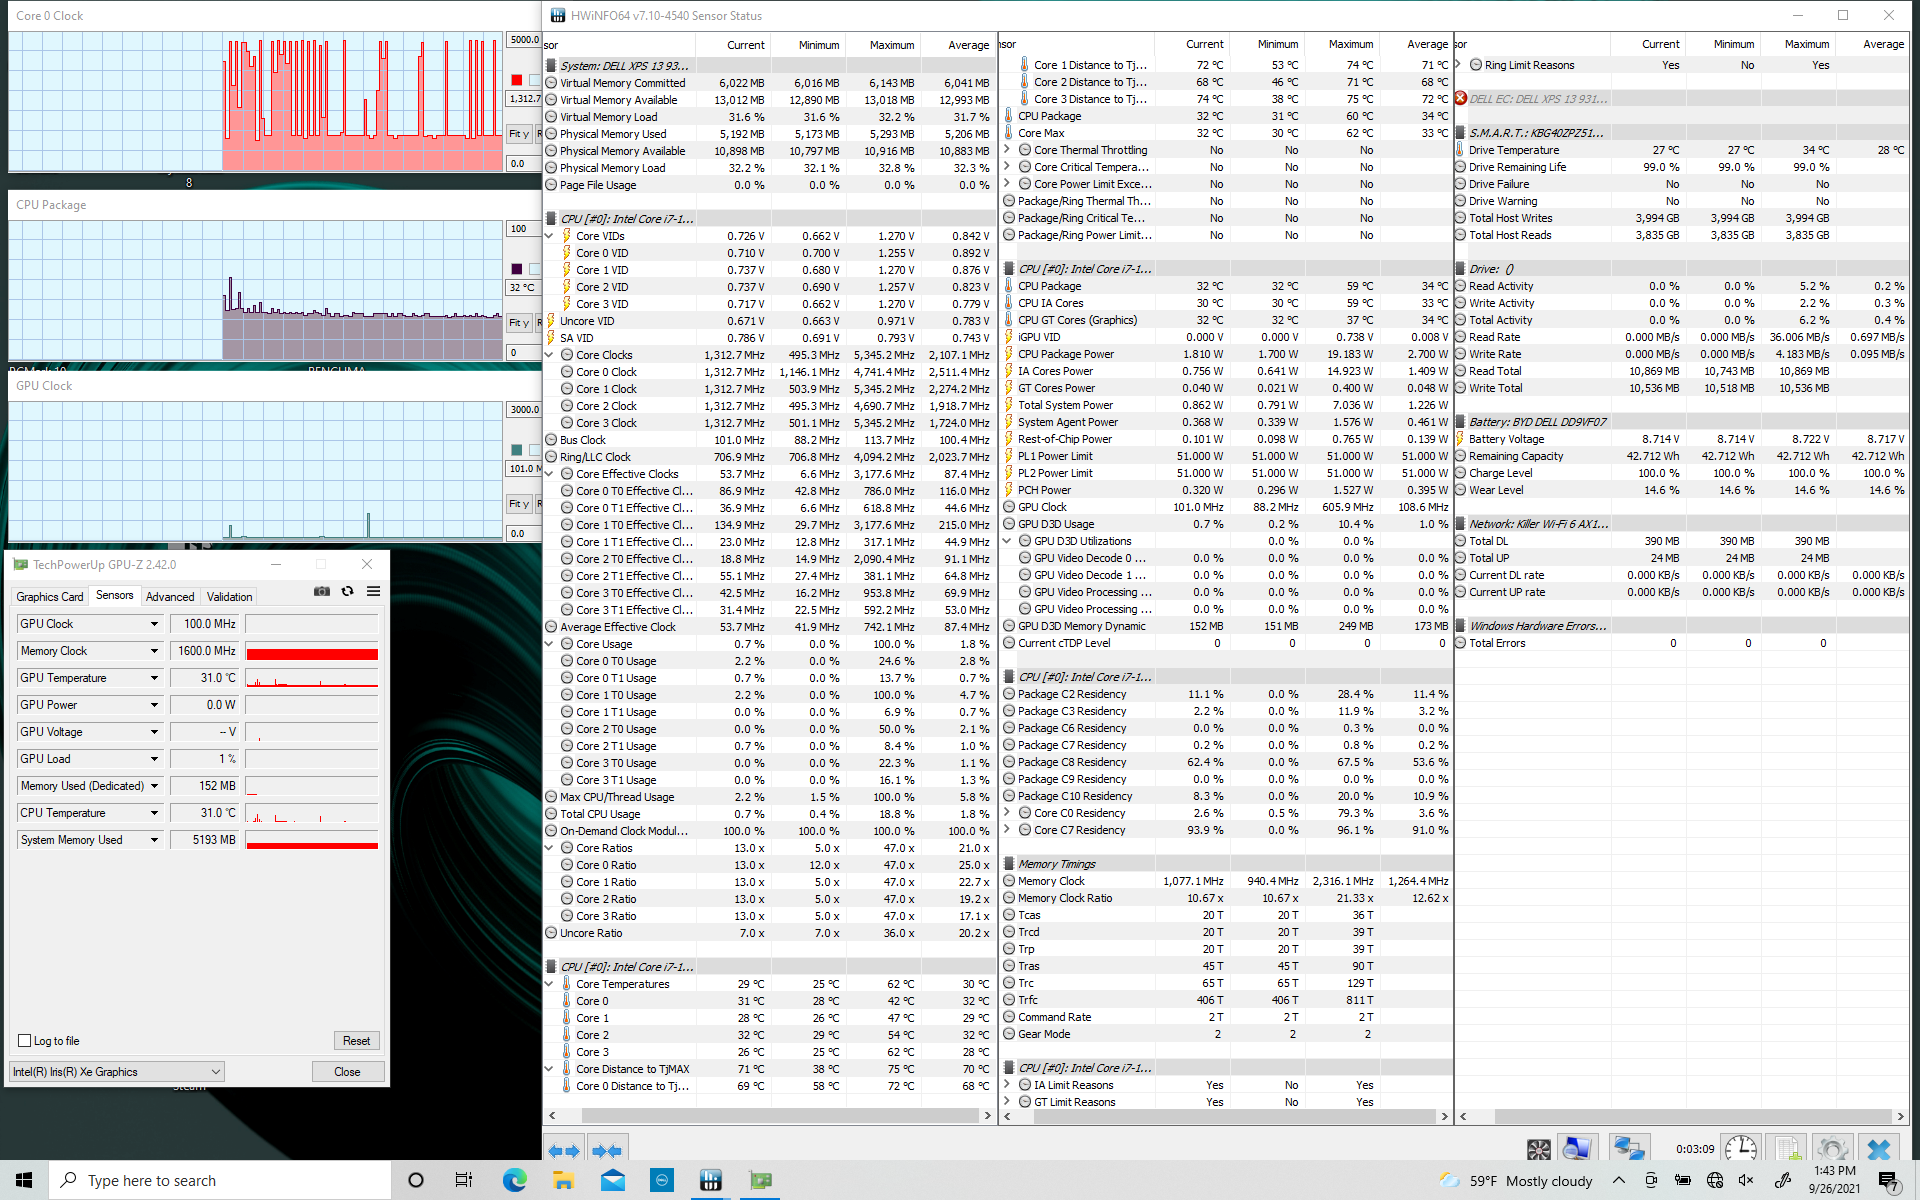
Quando si stressa con Prime95, le frequenze di clock della CPU e la temperatura raggiungono un picco e rimangono stabili fino a 2,9 GHz e 100 C per il primo paio di minuti. In seguito, le frequenze di clock e la temperatura scendevano e si stabilizzavano rispettivamente tra 1,8 e 2,2 GHz e tra 66 e 75 C, anche quando si impostava la modalità Ultra Performance tramite il software Dell Power Manager. In confronto, l'XPS 13 7390 2-in-1 alimentato da Ice Lake si stabilizzava a frequenze di clock del core e temperature più alte. Quindi, sembra che il più recente XPS 13 9310 2-in-1 stia puntando a temperature del core più basse, anche se al costo di maggiori prestazioni Turbo Boost. I tassi di clock ciclici sotto stress rispecchiano i nostri punteggi del ciclo CineBench R15 xT di cui sopra
Le frequenze di clock della GPU sono anche ciclicamente comprese tra 800 e 1280 MHz quando si esegue Witcher 3 che rispecchia anche i nostri frame rate ciclici di cui sopra. E' un peccato che non ci sia una "opzione a prestazioni costanti" disponibile sull'XPS 13 per gli utenti che potrebbero preferirla a questo comportamento ciclico
L'utilizzo della batteria limita le prestazioni. Un test 3DMark 11 a batterie restituirebbe punteggi di fisica e grafica di 9805 e 5106 punti, rispettivamente, rispetto a 11424 e 6569 punti quando è alimentato.

| Clock della CPU (GHz)Clock della GPU(MHz)Temperaturamedia dellaCPU (°C) |
| Sistema inattivo |
| Prime95 Stress |
| Prime95 + FurMark Stress |
| Witcher 3 Stress |
Altoparlanti

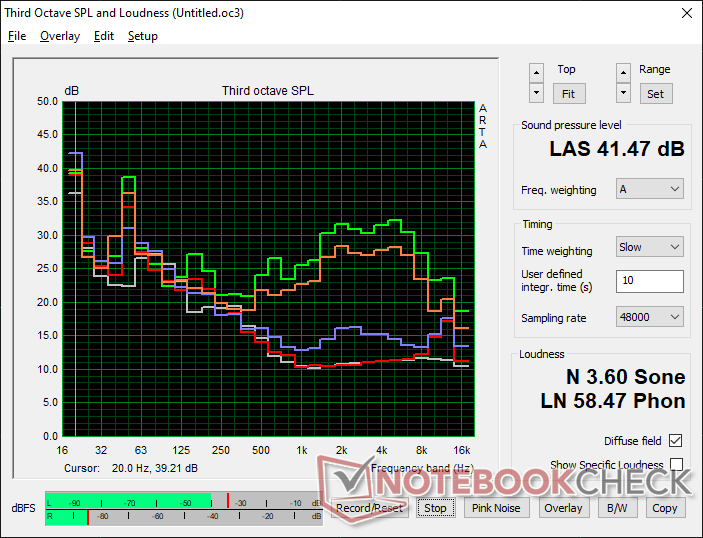
Dell XPS 13 9310 2-in-1 analisi audio
(±) | potenza degli altiparlanti media ma buona (80.7 dB)
Bassi 100 - 315 Hz
(±) | bassi ridotti - in media 11.7% inferiori alla media
(±) | la linearità dei bassi è media (10.6% delta rispetto alla precedente frequenza)
Medi 400 - 2000 Hz
(±) | medi elevati - circa 6.1% superiore alla media
(+) | medi lineari (4.1% delta rispetto alla precedente frequenza)
Alti 2 - 16 kHz
(+) | Alti bilanciati - appena 1.4% dalla media
(+) | alti lineari (3.6% delta rispetto alla precedente frequenza)
Nel complesso 100 - 16.000 Hz
(+) | suono nel complesso lineare (12.7% differenza dalla media)
Rispetto alla stessa classe
» 16% di tutti i dispositivi testati in questa classe è stato migliore, 2% simile, 82% peggiore
» Il migliore ha avuto un delta di 6%, medio di 20%, peggiore di 57%
Rispetto a tutti i dispositivi testati
» 12% di tutti i dispositivi testati in questa classe è stato migliore, 3% similare, 86% peggiore
» Il migliore ha avuto un delta di 4%, medio di 23%, peggiore di 134%
Apple MacBook 12 (Early 2016) 1.1 GHz analisi audio
(+) | gli altoparlanti sono relativamente potenti (83.6 dB)
Bassi 100 - 315 Hz
(±) | bassi ridotti - in media 11.3% inferiori alla media
(±) | la linearità dei bassi è media (14.2% delta rispetto alla precedente frequenza)
Medi 400 - 2000 Hz
(+) | medi bilanciati - solo only 2.4% rispetto alla media
(+) | medi lineari (5.5% delta rispetto alla precedente frequenza)
Alti 2 - 16 kHz
(+) | Alti bilanciati - appena 2% dalla media
(+) | alti lineari (4.5% delta rispetto alla precedente frequenza)
Nel complesso 100 - 16.000 Hz
(+) | suono nel complesso lineare (10.2% differenza dalla media)
Rispetto alla stessa classe
» 7% di tutti i dispositivi testati in questa classe è stato migliore, 2% simile, 90% peggiore
» Il migliore ha avuto un delta di 5%, medio di 18%, peggiore di 53%
Rispetto a tutti i dispositivi testati
» 5% di tutti i dispositivi testati in questa classe è stato migliore, 1% similare, 94% peggiore
» Il migliore ha avuto un delta di 4%, medio di 23%, peggiore di 134%
Consumo energetico
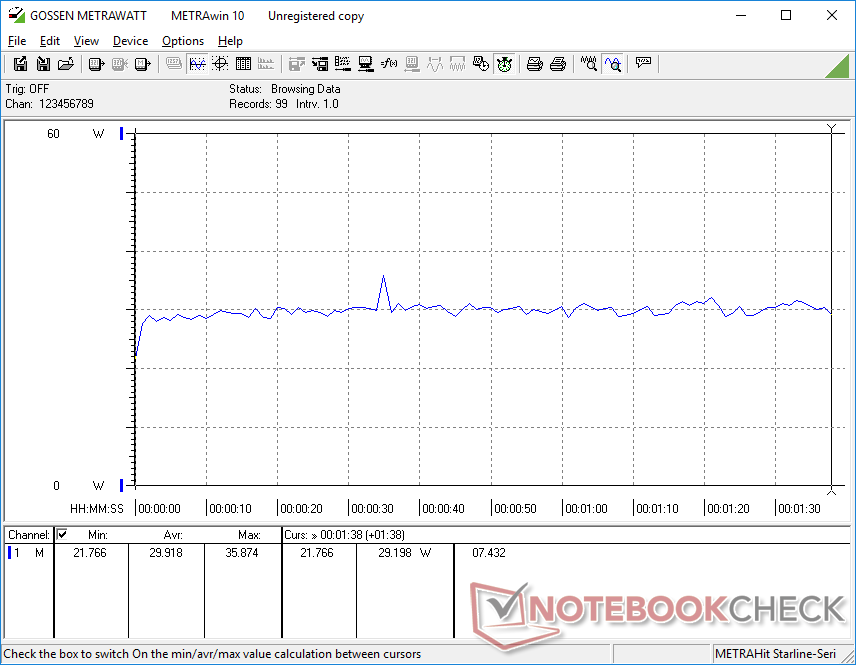
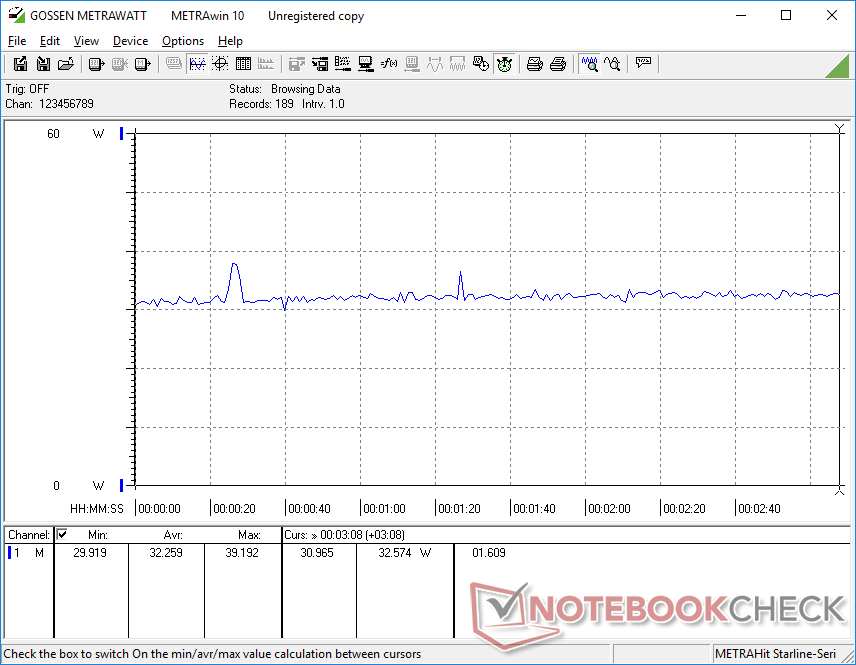
Consumo energetico - Molto più efficiente
Il sistema consuma meno energia quando gioca rispetto al vecchio XPS 13 7390 2-in-1 nonostante il sostanziale aumento delle prestazioni grafiche. Questo dimostra quanto possa essere un salto Iris Xe rispetto all'Iris Plus G7 sia in termini di efficienza energetica che di prestazioni.
| Off / Standby | |
| Idle | |
| Sotto carico |
|
Leggenda:
min: | |
| Dell XPS 13 9310 2-in-1 i7-1165G7, Iris Xe G7 96EUs, Toshiba BG4 KBG40ZPZ512G, IPS, 1920x1200, 13.4" | Dell XPS 13 9310 Core i7 FHD i7-1165G7, Iris Xe G7 96EUs, Micron 2300 512GB MTFDHBA512TDV, IPS, 1920x1200, 13.4" | Dell XPS 13 7390 2-in-1 Core i7 i7-1065G7, Iris Plus Graphics G7 (Ice Lake 64 EU), Toshiba BG4 KBG40ZPZ512G, IPS, 1920x1200, 13.4" | Lenovo Yoga 6 13 82ND0009US R5 5500U, Vega 7, WDC PC SN530 SDBPMPZ-265G, IPS, 1920x1080, 13.3" | Asus ZenBook Flip 13 UX363EA-HP069T i7-1165G7, Iris Xe G7 96EUs, WDC PC SN730 SDBPNTY-1T00, OLED, 1920x1080, 13.3" | Samsung Galaxy Book Pro 360 13 i5-1135G7, Iris Xe G7 80EUs, Samsung PM991 MZVLQ256HAJD, AMOLED, 1920x1080, 13.2" | |
|---|---|---|---|---|---|---|
| Power Consumption | -11% | -9% | -20% | -11% | -22% | |
| Idle Minimum * (Watt) | 2.6 | 3.9 -50% | 2.6 -0% | 5 -92% | 4.4 -69% | 5 -92% |
| Idle Average * (Watt) | 6.4 | 5.9 8% | 5.3 17% | 6.3 2% | 7.4 -16% | 6 6% |
| Idle Maximum * (Watt) | 7.7 | 6.3 18% | 7 9% | 6.9 10% | 11.3 -47% | 11.7 -52% |
| Load Average * (Watt) | 29.9 | 39.7 -33% | 43.1 -44% | 41.5 -39% | 22 26% | 28 6% |
| Witcher 3 ultra * (Watt) | 32.2 | 34.8 -8% | 43.1 -34% | 33.2 -3% | 22.8 29% | 28.3 12% |
| Load Maximum * (Watt) | 47.5 | 47.5 -0% | 49 -3% | 46.5 2% | 42.5 11% | 53 -12% |
* ... Meglio usare valori piccoli
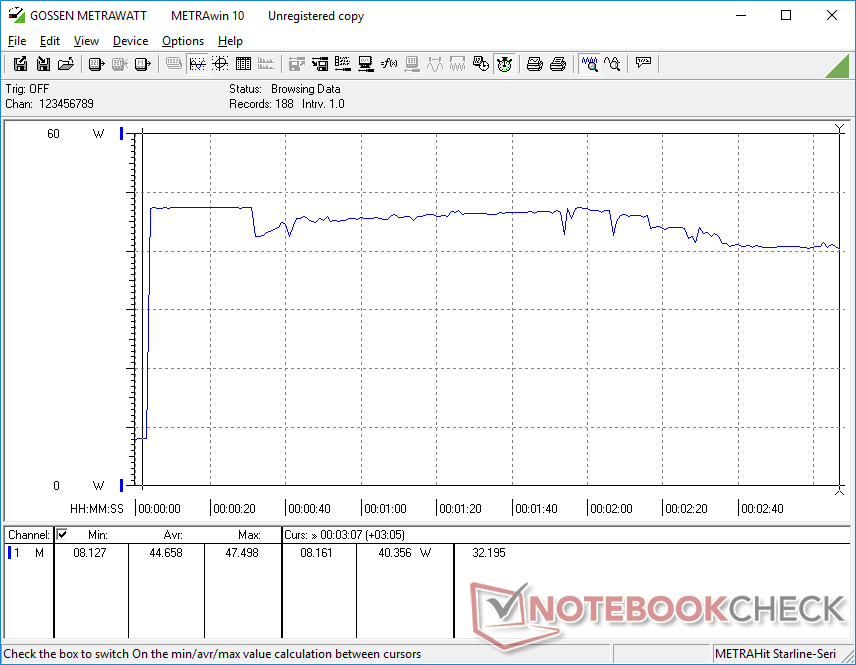
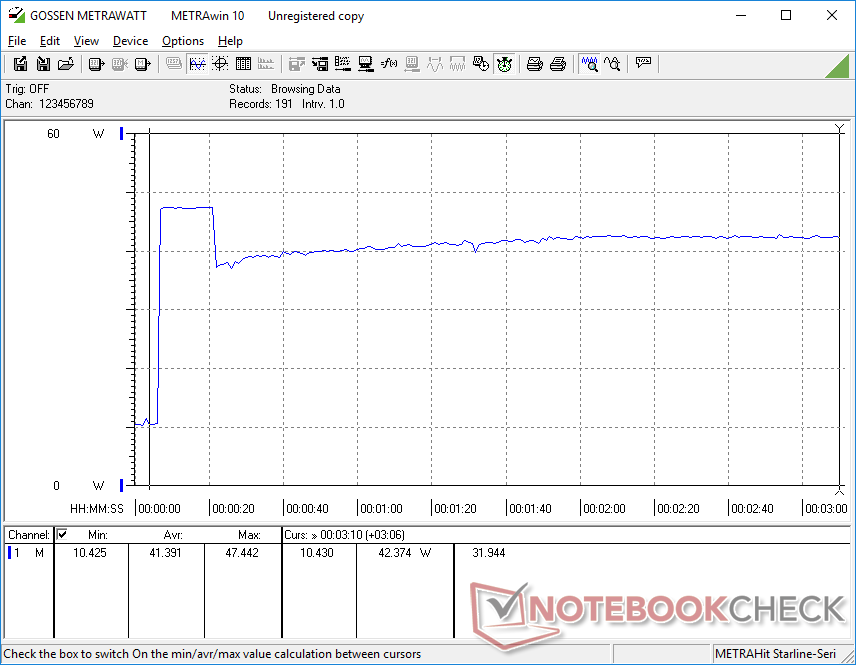
Consumo energetico Witcher 3 / Stresstest
Durata della batteria - Runtime a due cifre
I tempi di esecuzione sono molto vicini a quelli che abbiamo registrato sull'XPS 13 9310 clamshell mentre sono quasi due ore in più rispetto al vecchio XPS 13 7390 2-in-1. Con 11 ore di navigazione WLAN nel mondo reale, la batteria dovrebbe essere sufficiente per un giorno di utilizzo produttivo
La ricarica da vuoto a piena capacità richiede ancora circa 1,5 ore. L'adattatore USB-C da 45 W può essere utilizzato per caricare anche altri dispositivi.
| Dell XPS 13 9310 2-in-1 i7-1165G7, Iris Xe G7 96EUs, 51 Wh | Dell XPS 13 9310 Core i7 FHD i7-1165G7, Iris Xe G7 96EUs, 52 Wh | Dell XPS 13 7390 2-in-1 Core i7 i7-1065G7, Iris Plus Graphics G7 (Ice Lake 64 EU), 51 Wh | Lenovo Yoga 6 13 82ND0009US R5 5500U, Vega 7, 60 Wh | Asus ZenBook Flip 13 UX363EA-HP069T i7-1165G7, Iris Xe G7 96EUs, 67 Wh | Samsung Galaxy Book Pro 360 13 i5-1135G7, Iris Xe G7 80EUs, 63 Wh | |
|---|---|---|---|---|---|---|
| Autonomia della batteria | 5% | -16% | -16% | -6% | 12% | |
| Reader / Idle (h) | 25.4 | 30 18% | 17.5 -31% | 20.5 -19% | 31.3 23% | |
| WiFi v1.3 (h) | 10.7 | 11 3% | 9 -16% | 13.2 23% | 10.7 0% | 12.1 13% |
| Load (h) | 3.4 | 3.2 -6% | 2 -41% | 3.4 0% | 3.4 0% |
Pro
Contro
Verdetto - Più veloce senza costi aggiuntivi
L'XPS 13 9310 2-in-1 offre prestazioni grafiche significativamente più veloci dell'XPS 13 7390 2-in-1. Meglio ancora, il sistema realizza questo sotto lo stesso pacchetto di potenza, il che significa che gli utenti stanno ottenendo una grafica migliore senza dover sacrificare la durata della batteria, le temperature di superficie o il rumore della ventola lungo la strada. Se fate un sacco di lavoro di editing grafico, allora senza dubbio trarrete grandi benefici passando a Iris Xe dal vecchio UHD Graphics o Iris Plus G7 dell'anno scorso.
Intel Iris Xe è stato un enorme vantaggio per la serie XPS 13, ma le frequenze di clock della CPU e della GPU instabili rispetto alla maggior parte degli altri Ultrabook o subnotebook possono essere fastidiose per alcuni utenti esperti.
Sfortunatamente, le prestazioni del processore sono a malapena migliorate dal Core i7 XPS 13 7390 2-in-1. I tassi di clock tendono a fluttuare molto più facilmente sul nostro Core i7 XPS 13 9310 2-in-1 mentre la mancanza di qualsiasi nuova opzione di visualizzazione è un incentivo in meno per possedere il nuovo modello. Di conseguenza, molti utenti domestici troveranno poco da guadagnare dall'XPS 13 9310 2-in-1 rispetto all'XPS 13 7390 2-in-1, specialmente quando il vecchio modello può essere trovato più economico.
Prezzo e disponibilità
Dell XPS 13 9310 2-in-1
- 10/02/2021 v7 (old)
Allen Ngo
Price comparison

