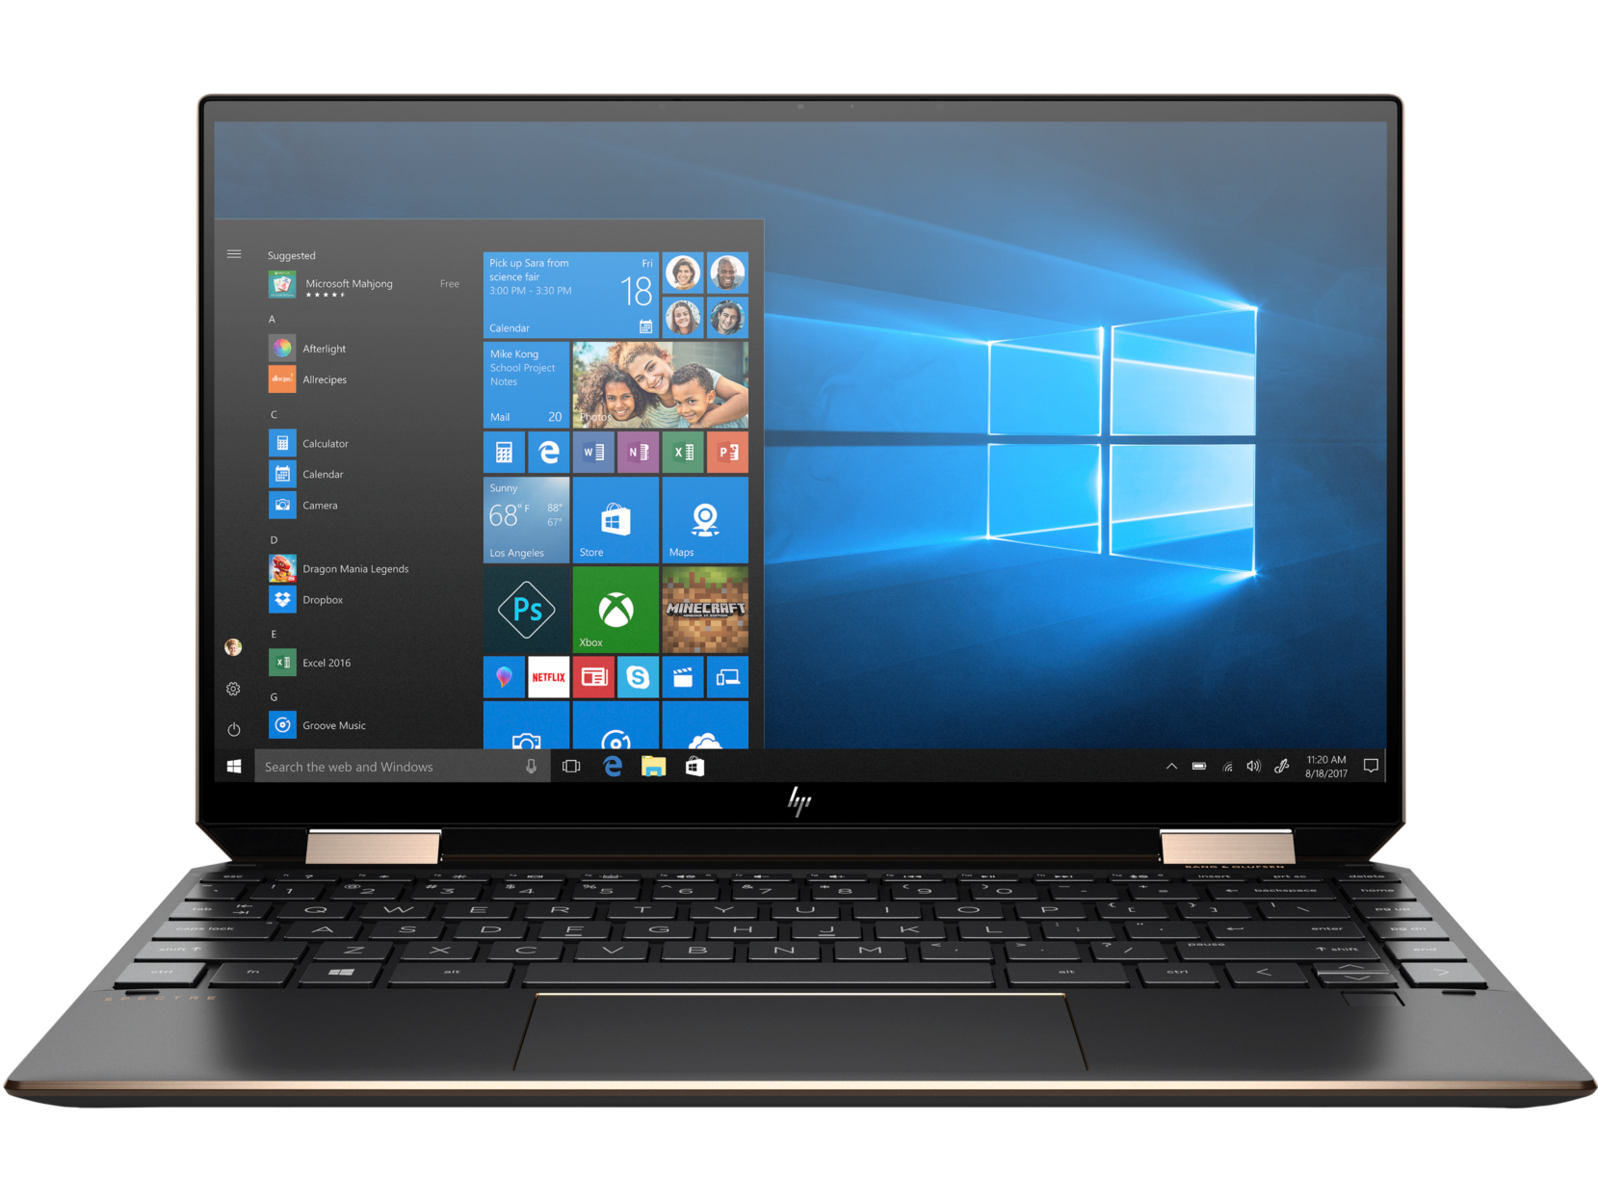
Recensione del computer portatile Convertible HP Spectre x360 13 11° generazione Intel: La prova che l'OLED non è tutto
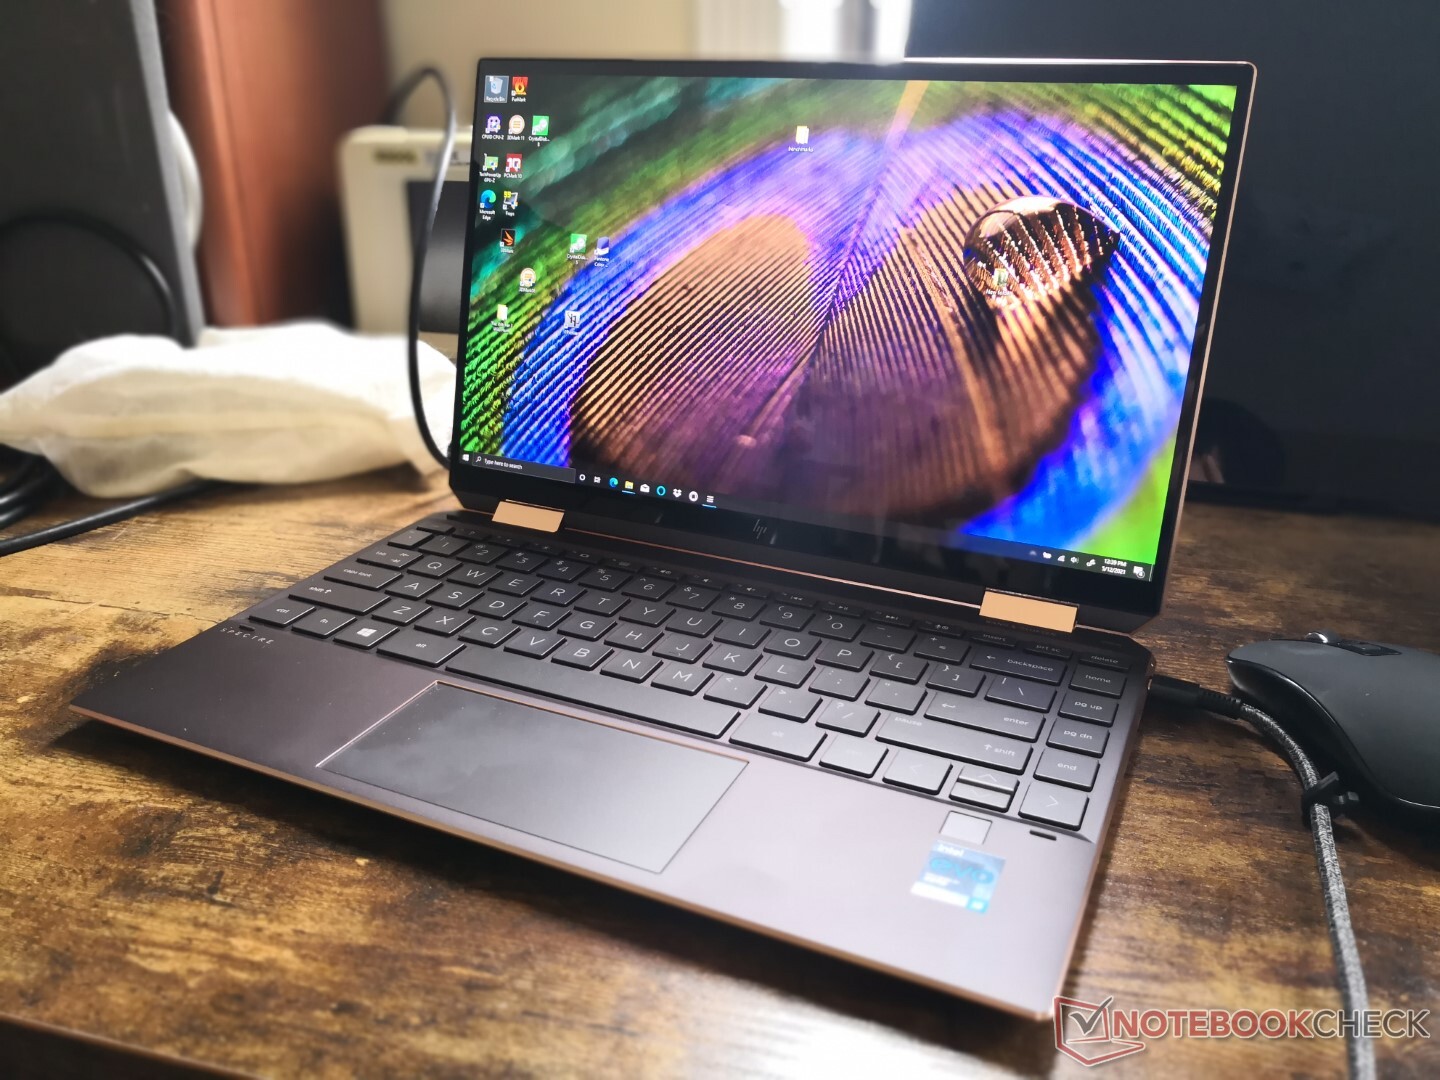
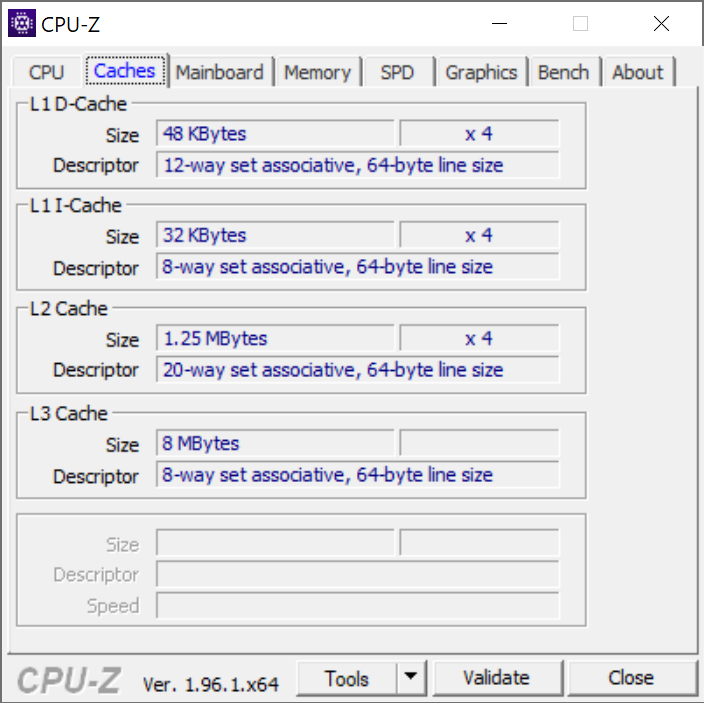
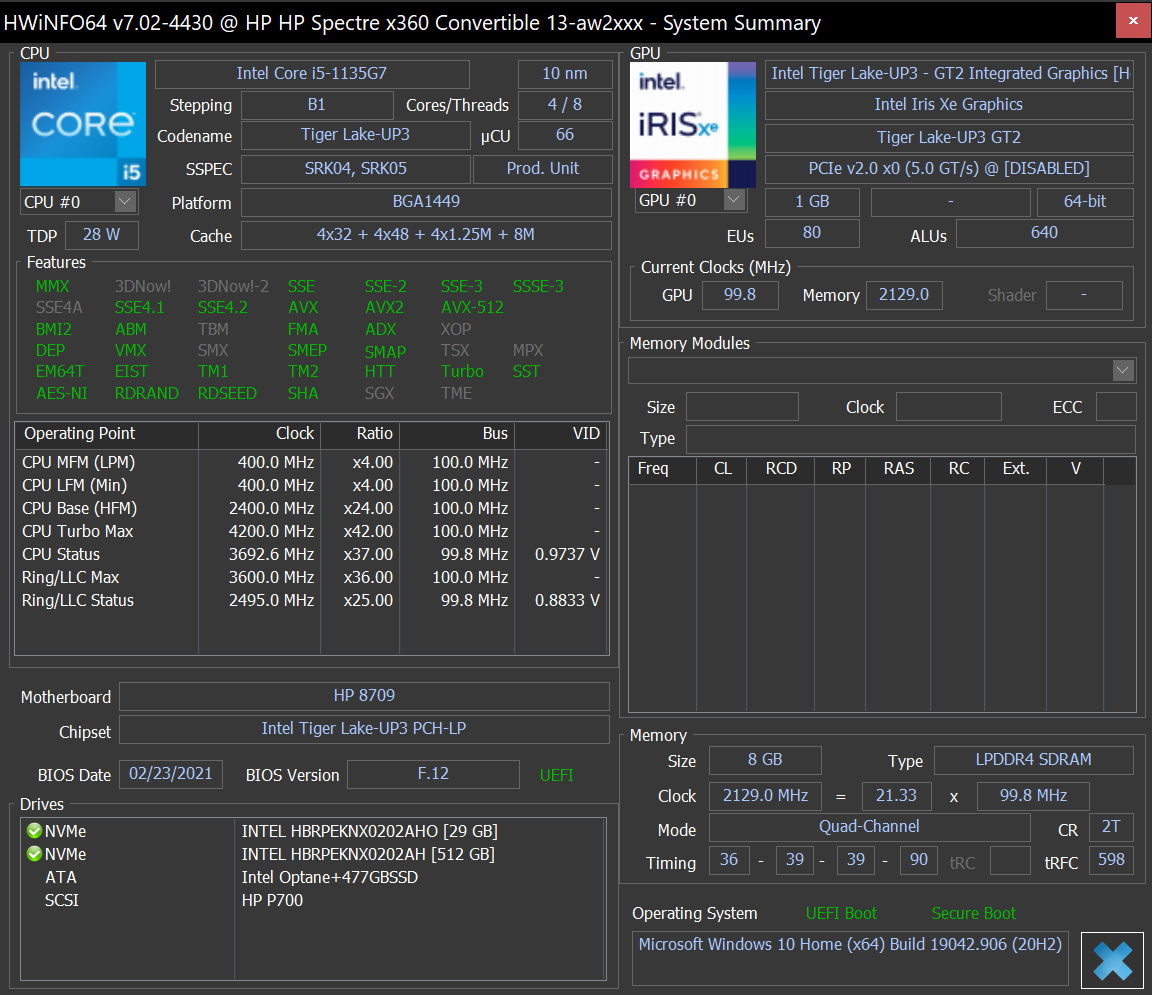
Sono passati quasi due anni dall'ultima volta che abbiamo controllato lo Spectre x360 13 e la serie è stata aggiornata con CPU e opzioni di display più recenti. Il sistema che testermo oggi è il modello 2021 presto equipaggiato con l'11° gen Core i5-1135G7 CPU, grafica integrata Iris Xe 80 EUs, 8 GB di RAM, SSD da 512 GB, e 4K OLED touchscreen per circa $1300 USD al dettaglio. Altre configurazioni sono disponibili con il doppio della RAM e la più veloce CPU Core i7-1165G7.
I concorrenti includono altri convertibili subnotebook da 13" e 14" come il Dell XPS 13 2-in-1, Asus ZenBook Flip, Lenovo Yoga 9i, LG Gram 14 o MSI vertice 13 Flip. Confronteremo anche il nostro Spectre x360 13 del 2021 con il modello da 13,5" HP Spectre x360 14 e più vecchio 2019 10th gen Ice Lake Spectre x360 13 in modo che i lettori possano avere un'idea migliore delle differenze tra loro.
Altre recensioni HP:
Confronto con i potenziali concorrenti
Punteggio | Data | Modello | Peso | Altezza | Dimensione | Risoluzione | Prezzo |
|---|---|---|---|---|---|---|---|
| 87.8 % v7 (old) | 05/2021 | HP Spectre x360 13-aw2003dx i5-1135G7, Iris Xe G7 80EUs | 1.2 kg | 16.9 mm | 13.30" | 3840x2160 | |
| 89.4 % v7 (old) | 12/2020 | HP Spectre x360 14t-ea000 i7-1165G7, Iris Xe G7 96EUs | 1.3 kg | 17.2 mm | 13.50" | 1920x1280 | |
| 88.4 % v7 (old) | 12/2019 | HP Spectre x360 13-aw0013dx i7-1065G7, Iris Plus Graphics G7 (Ice Lake 64 EU) | 1.2 kg | 16.9 mm | 13.30" | 1920x1080 | |
| 85.9 % v7 (old) | 11/2019 | Dell XPS 13 7390 Core i7-10710U i7-10710U, UHD Graphics 620 | 1.2 kg | 11.6 mm | 13.30" | 3840x2160 | |
| 86.9 % v7 (old) | 04/2021 | MSI Summit E13 Flip Evo A11MT i7-1185G7, Iris Xe G7 96EUs | 1.4 kg | 14.9 mm | 13.40" | 1920x1200 | |
| 87.1 % v7 (old) | 11/2020 | Lenovo Yoga Duet 7 13IML05-82AS000WGE i5-10210U, UHD Graphics 620 | 1.2 kg | 9.2 mm | 13.00" | 2160x1350 |
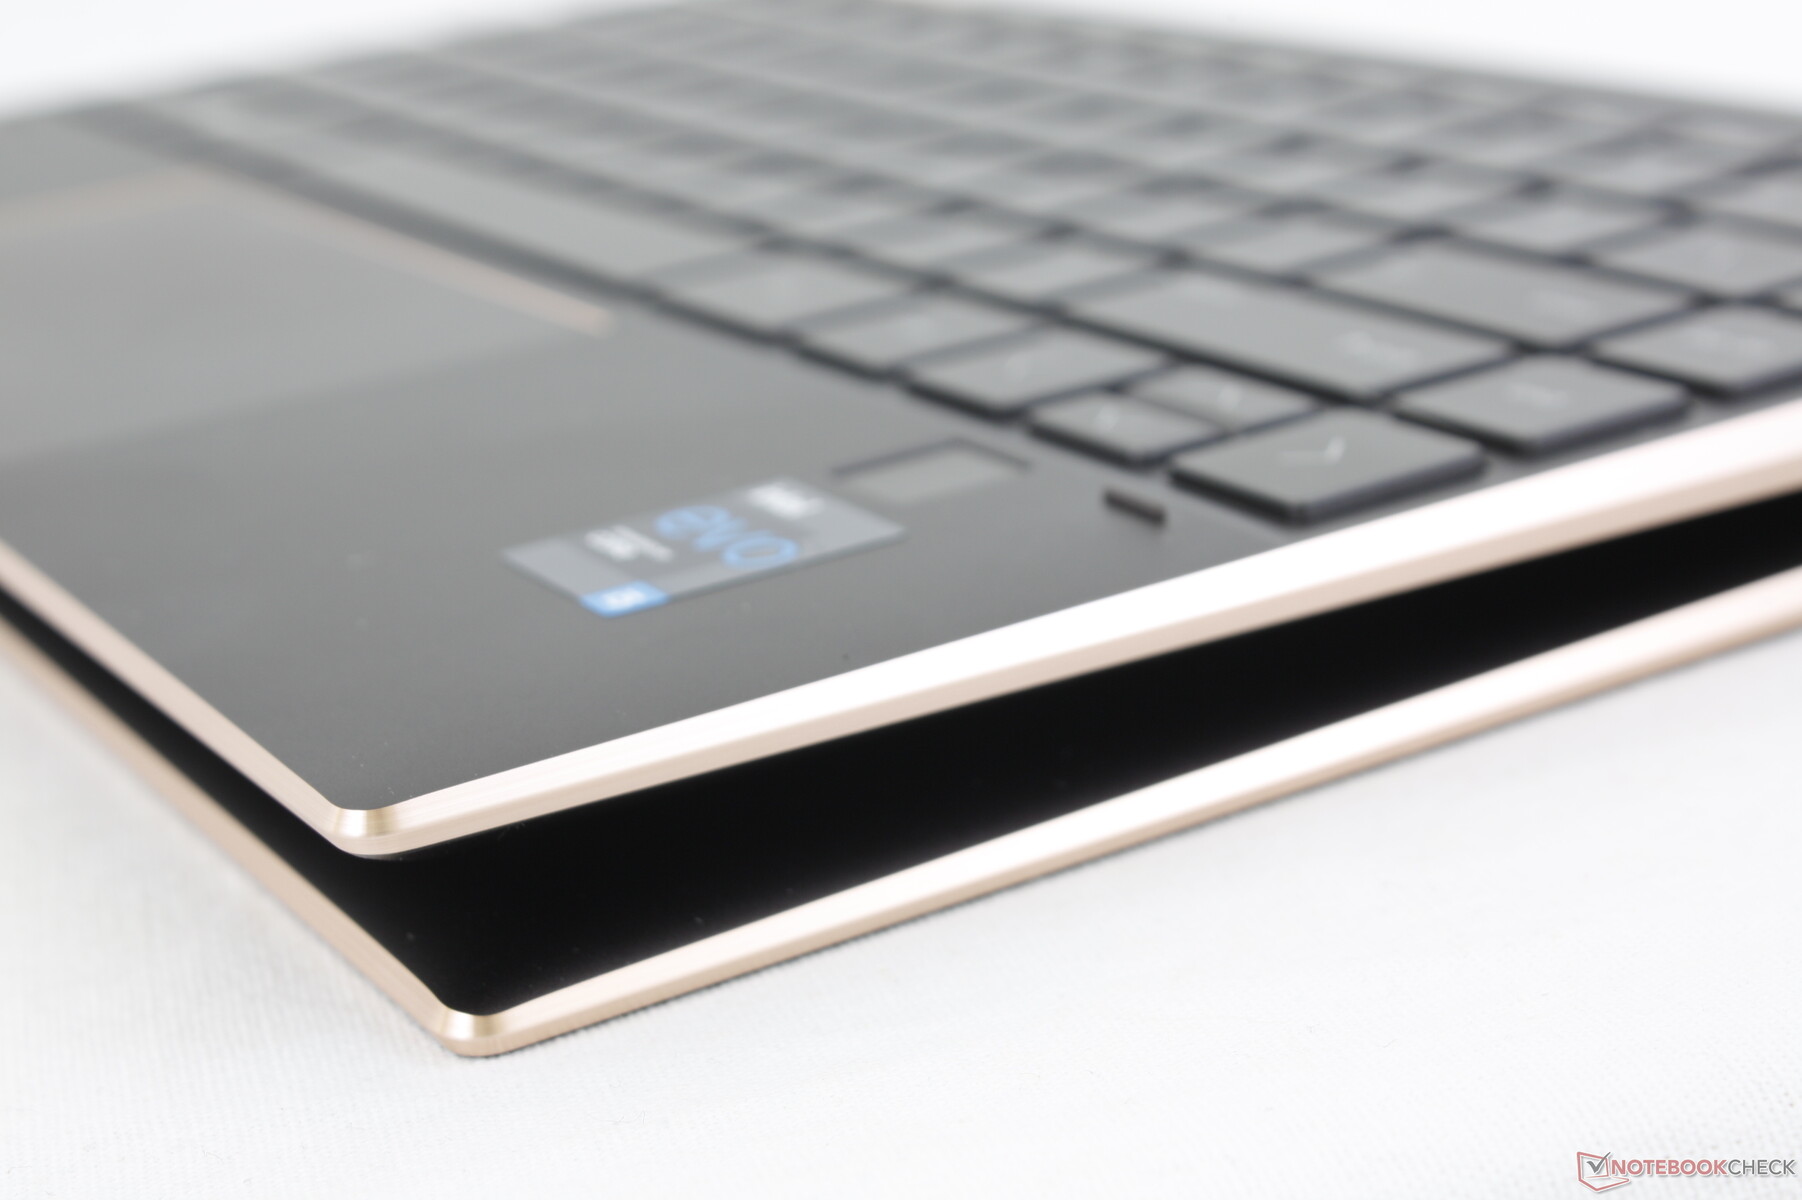
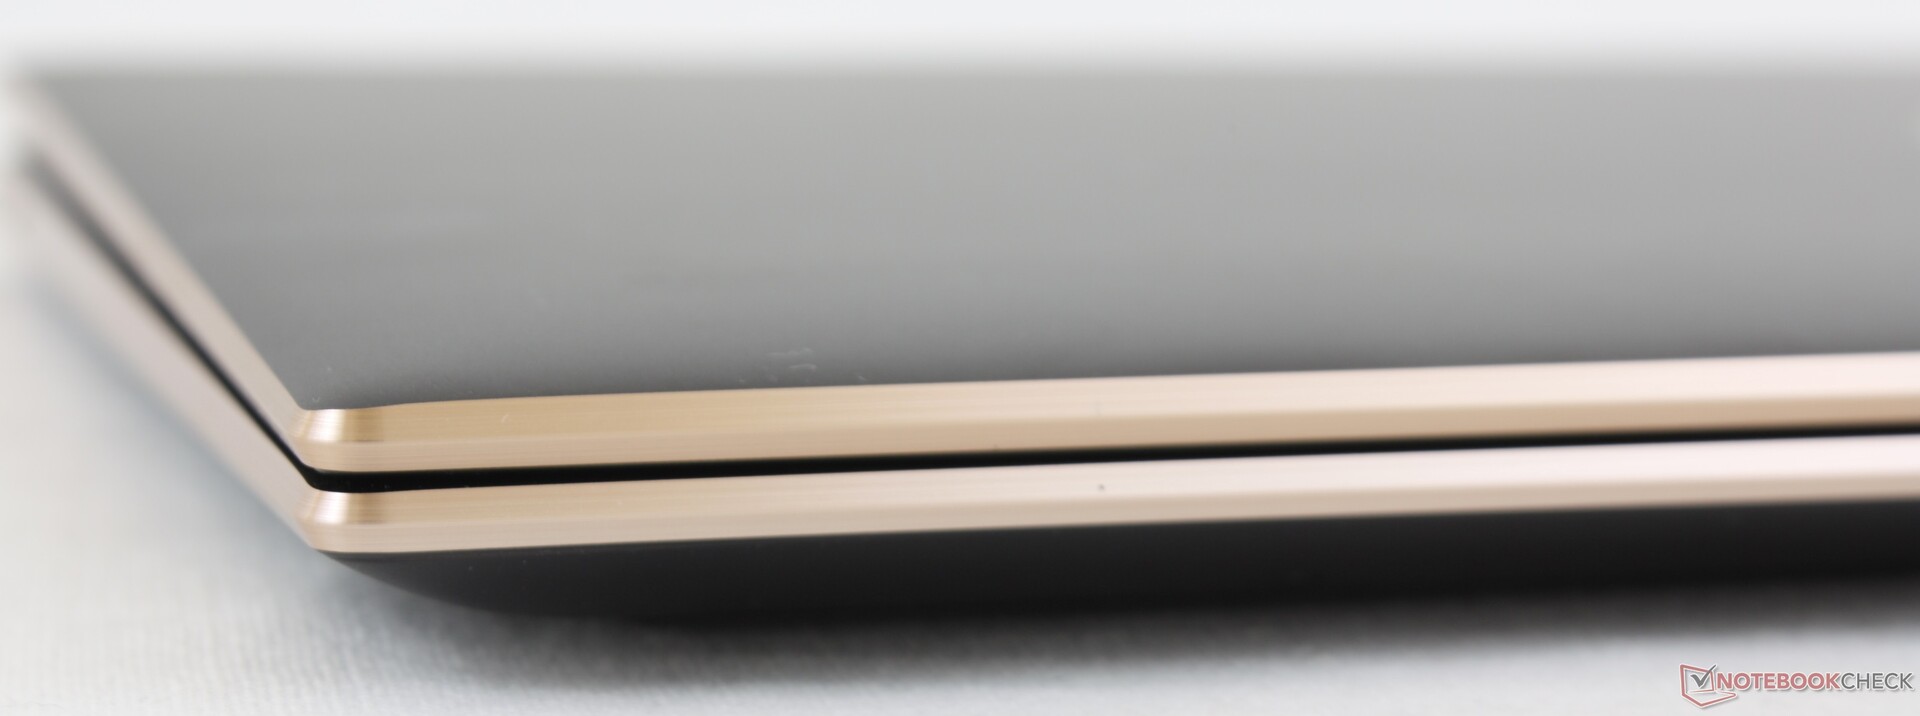
Case
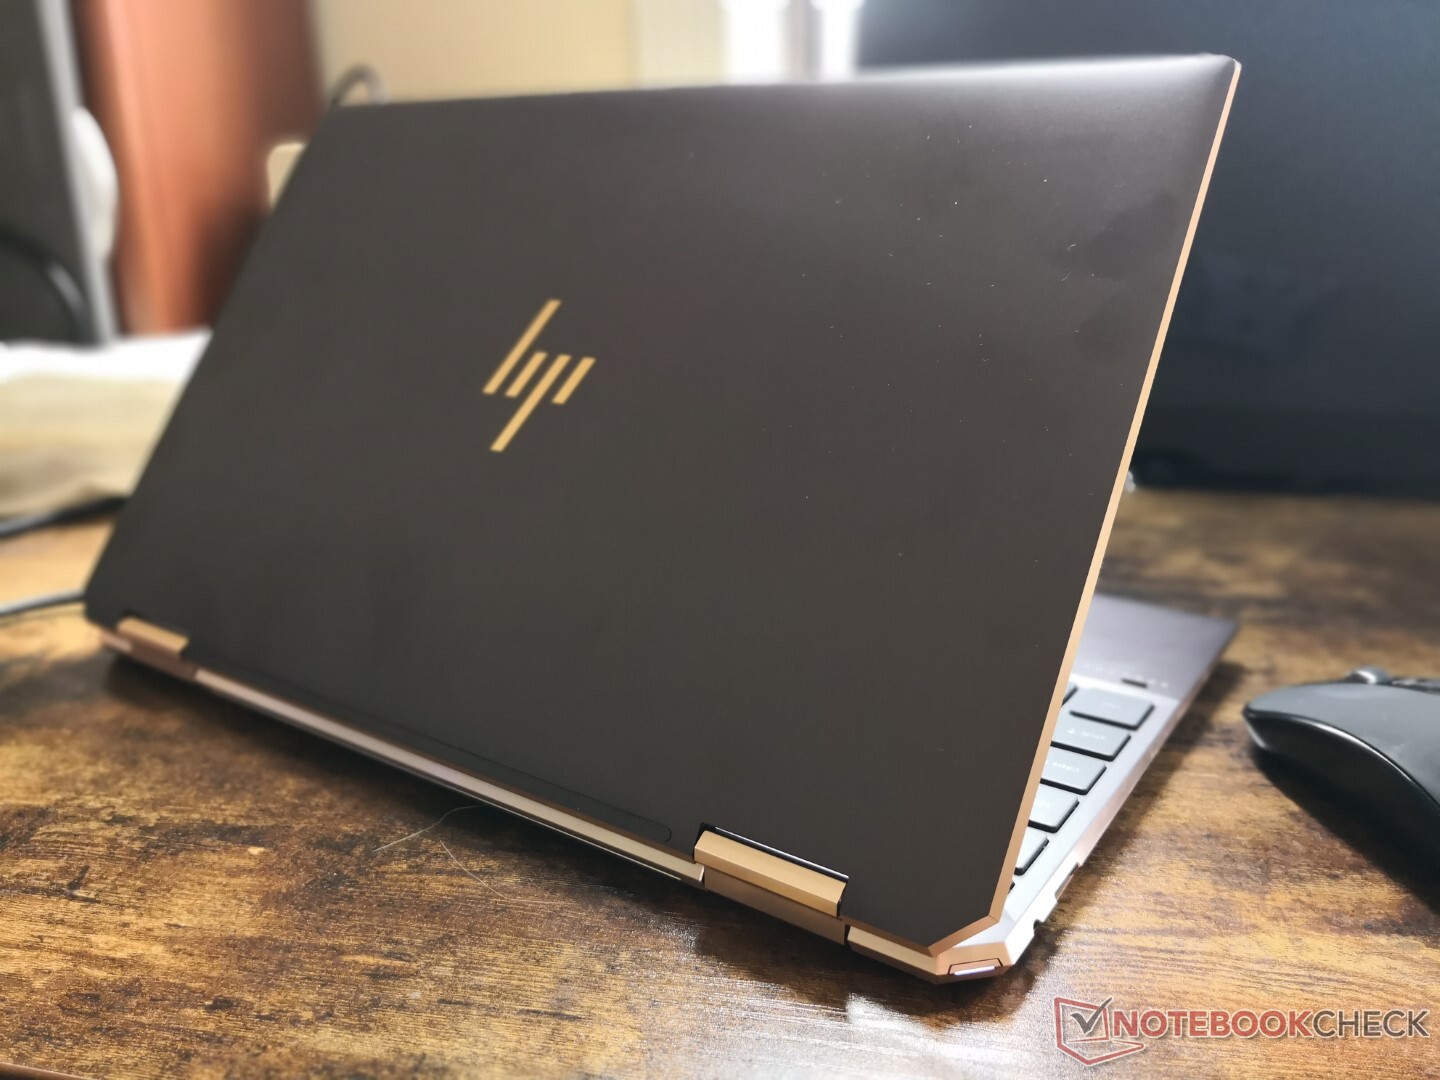
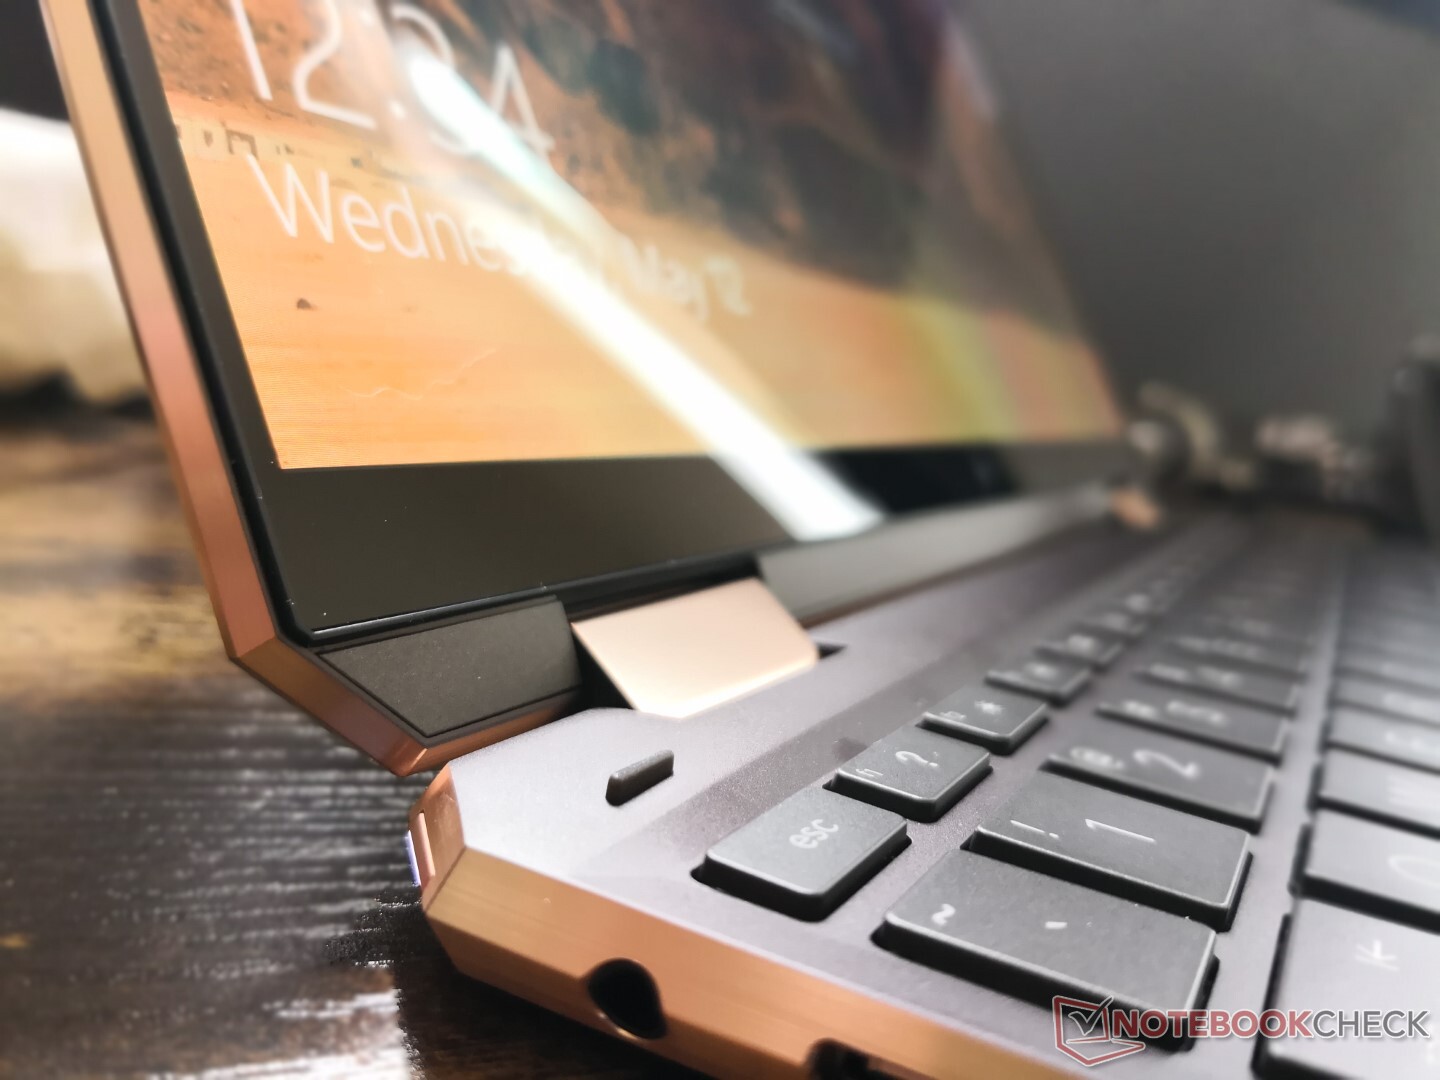
Il telaio rimane identico al modello 2019 Ice Lake. L'XPS 13 2-in-1 è ancora l'opzione più piccola e leggera, ma il sistema HP più rigido riesce a includere alcune caratteristiche in più come risultato del suo profilo più spesso. Lo Spectre x360 14 è leggermente più pesante e significativamente più lungo a causa del suo formato 3:2.
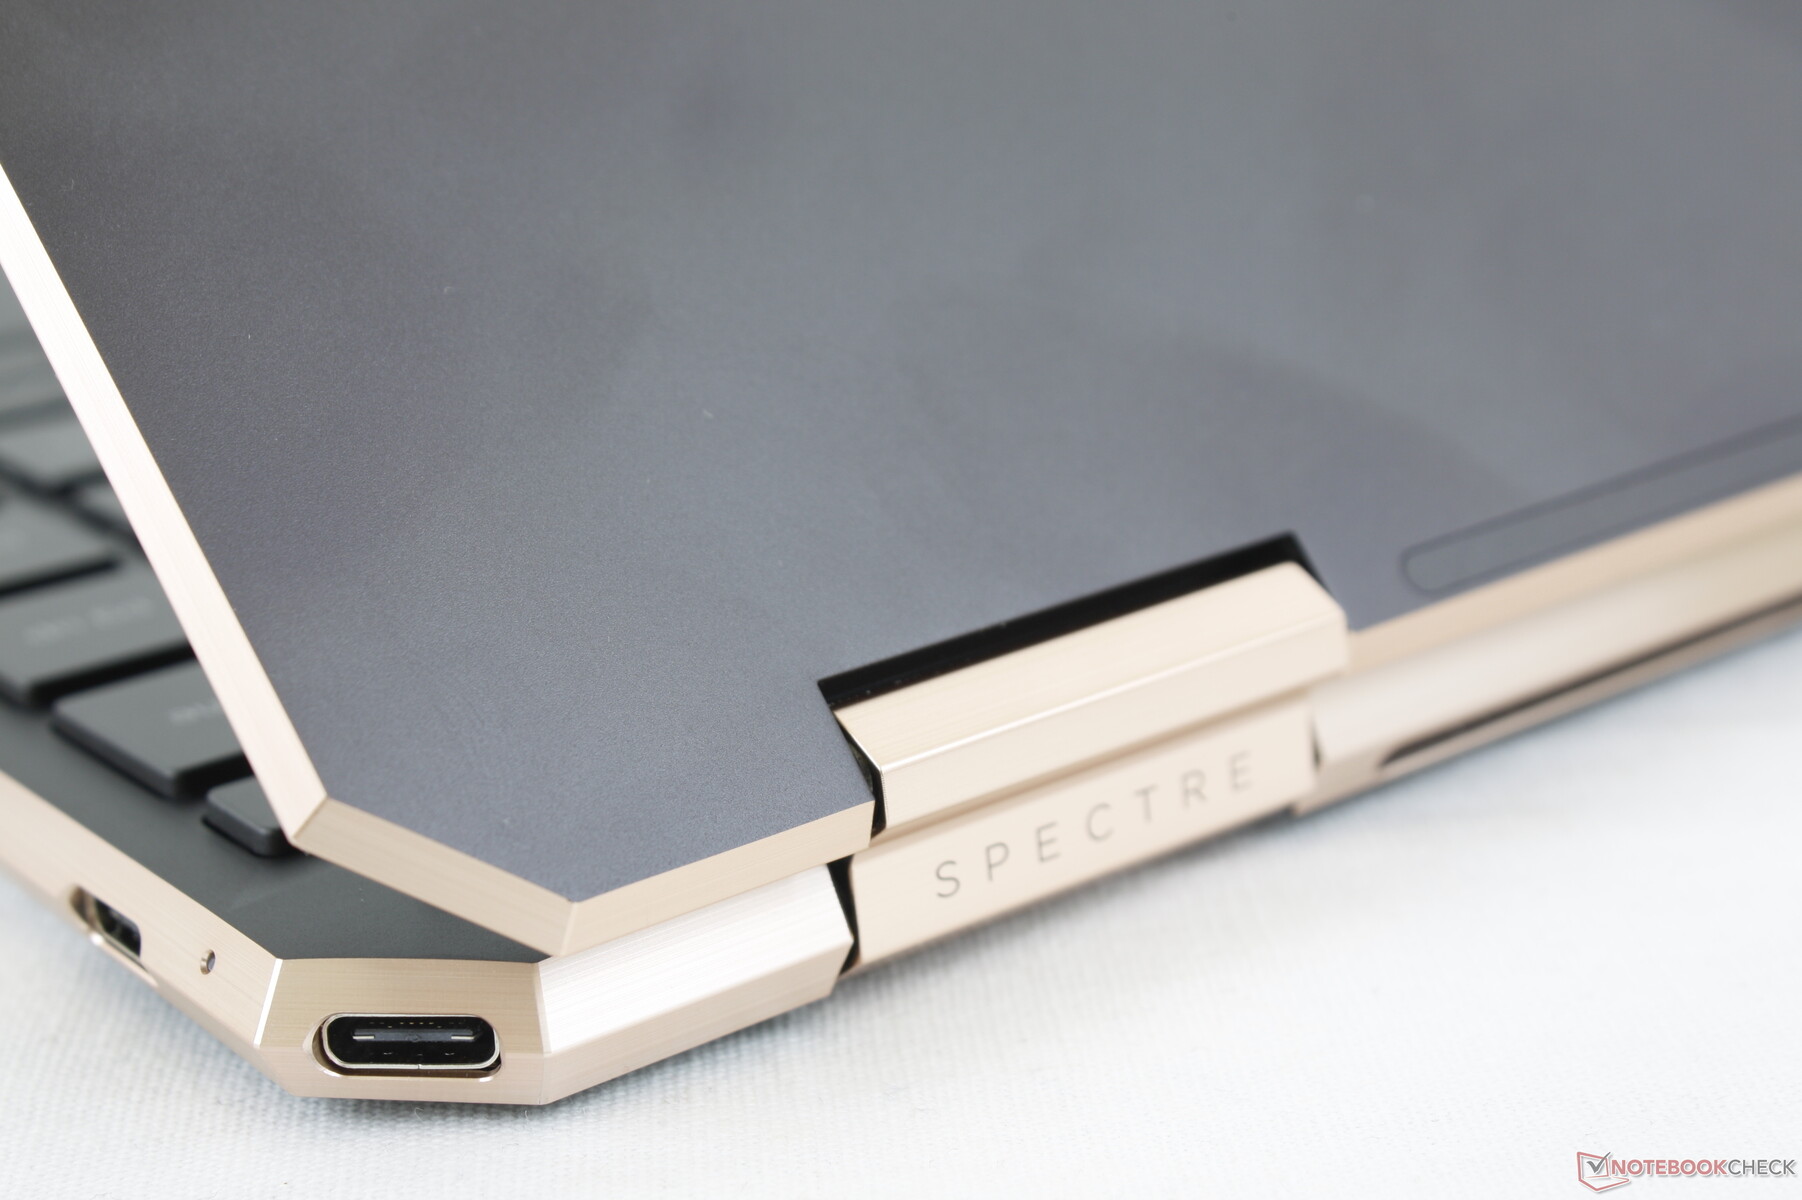
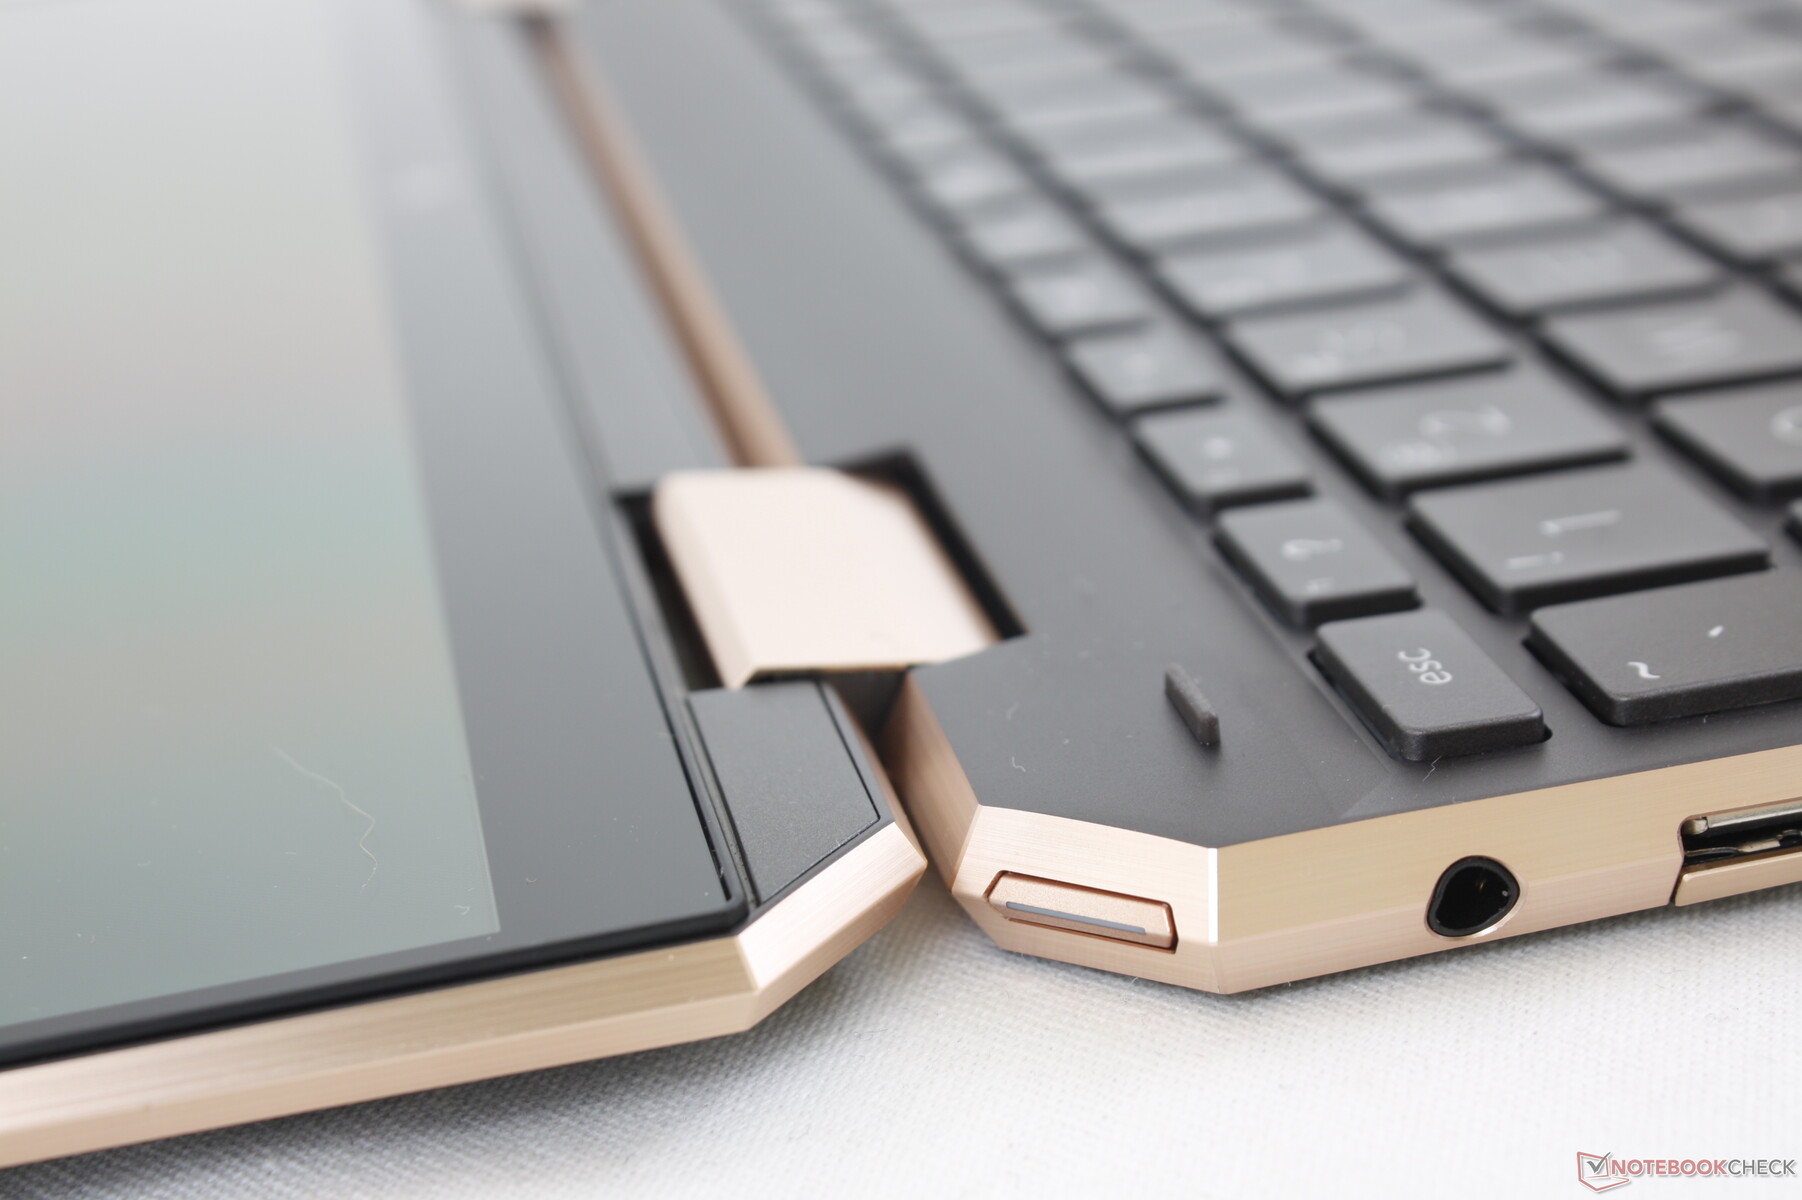
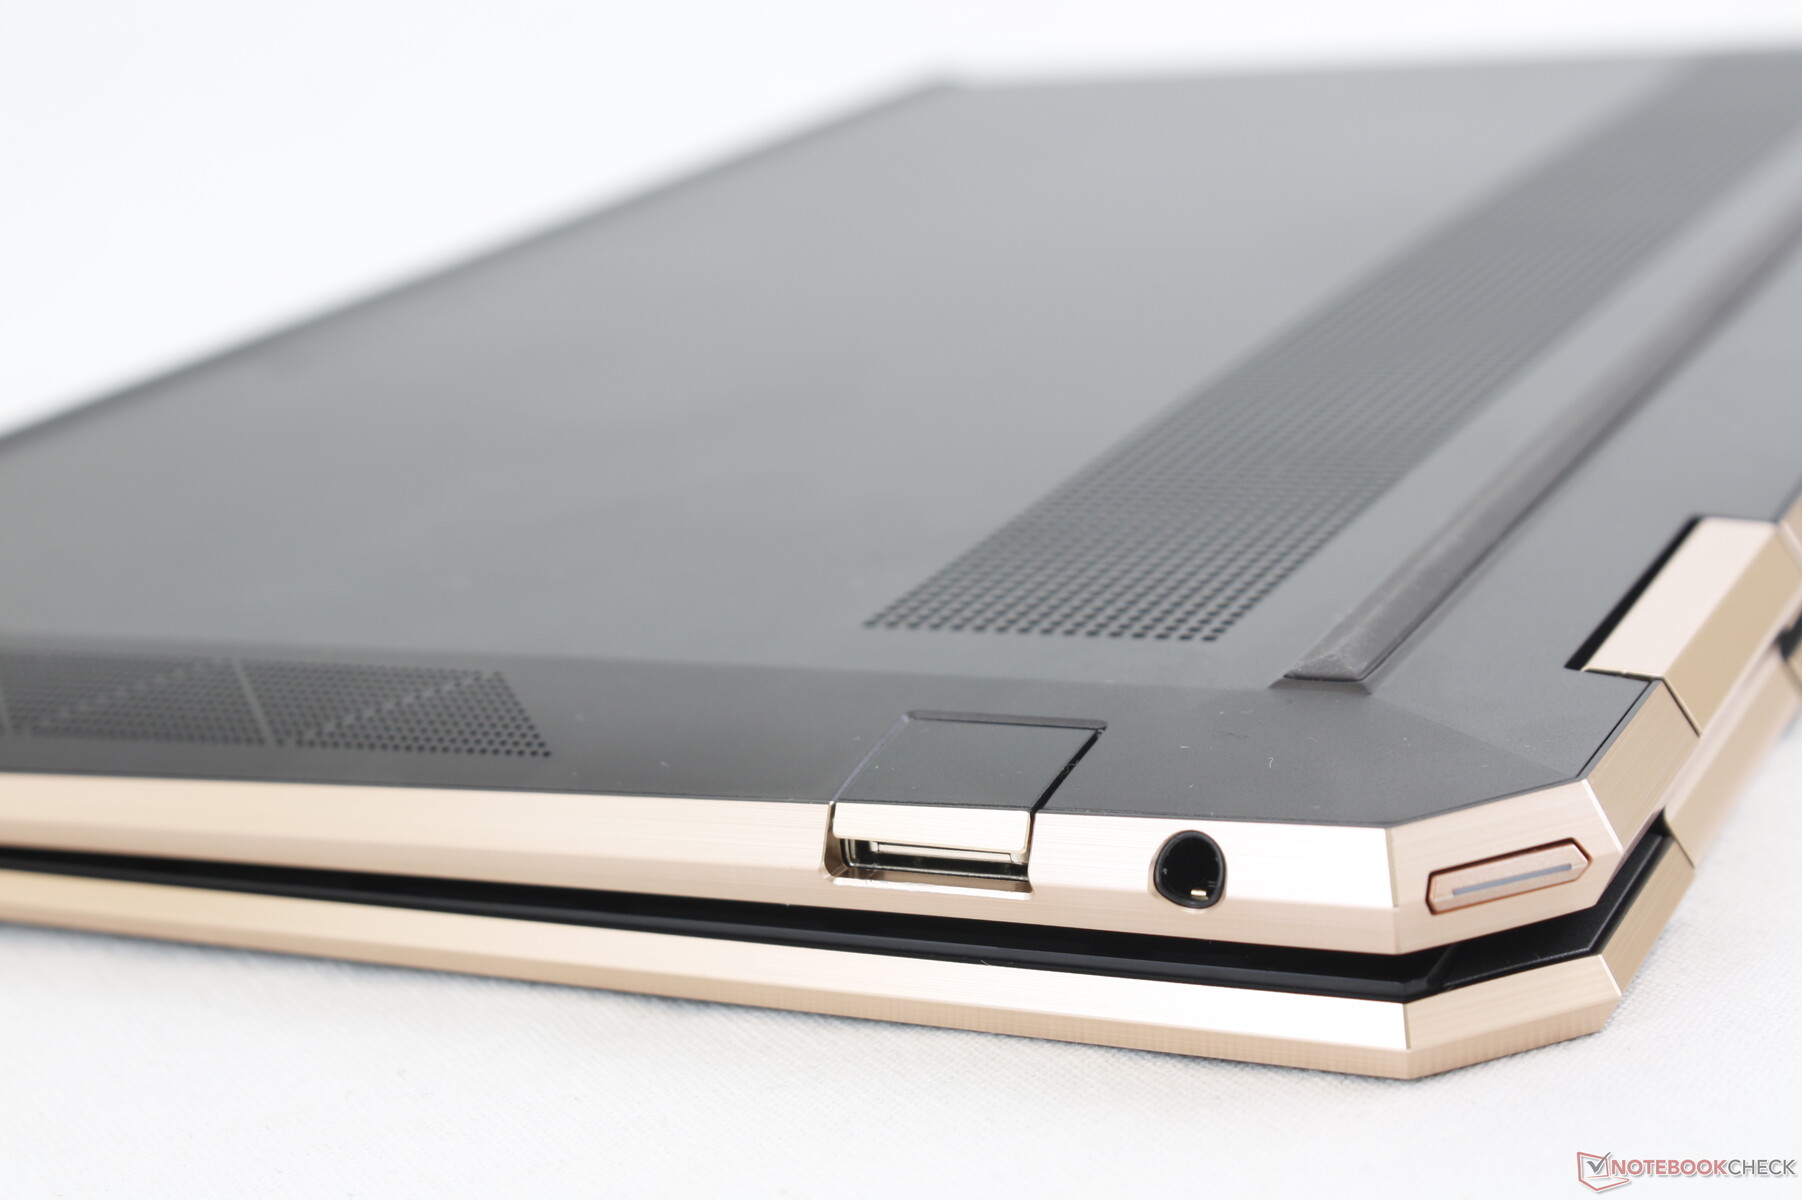
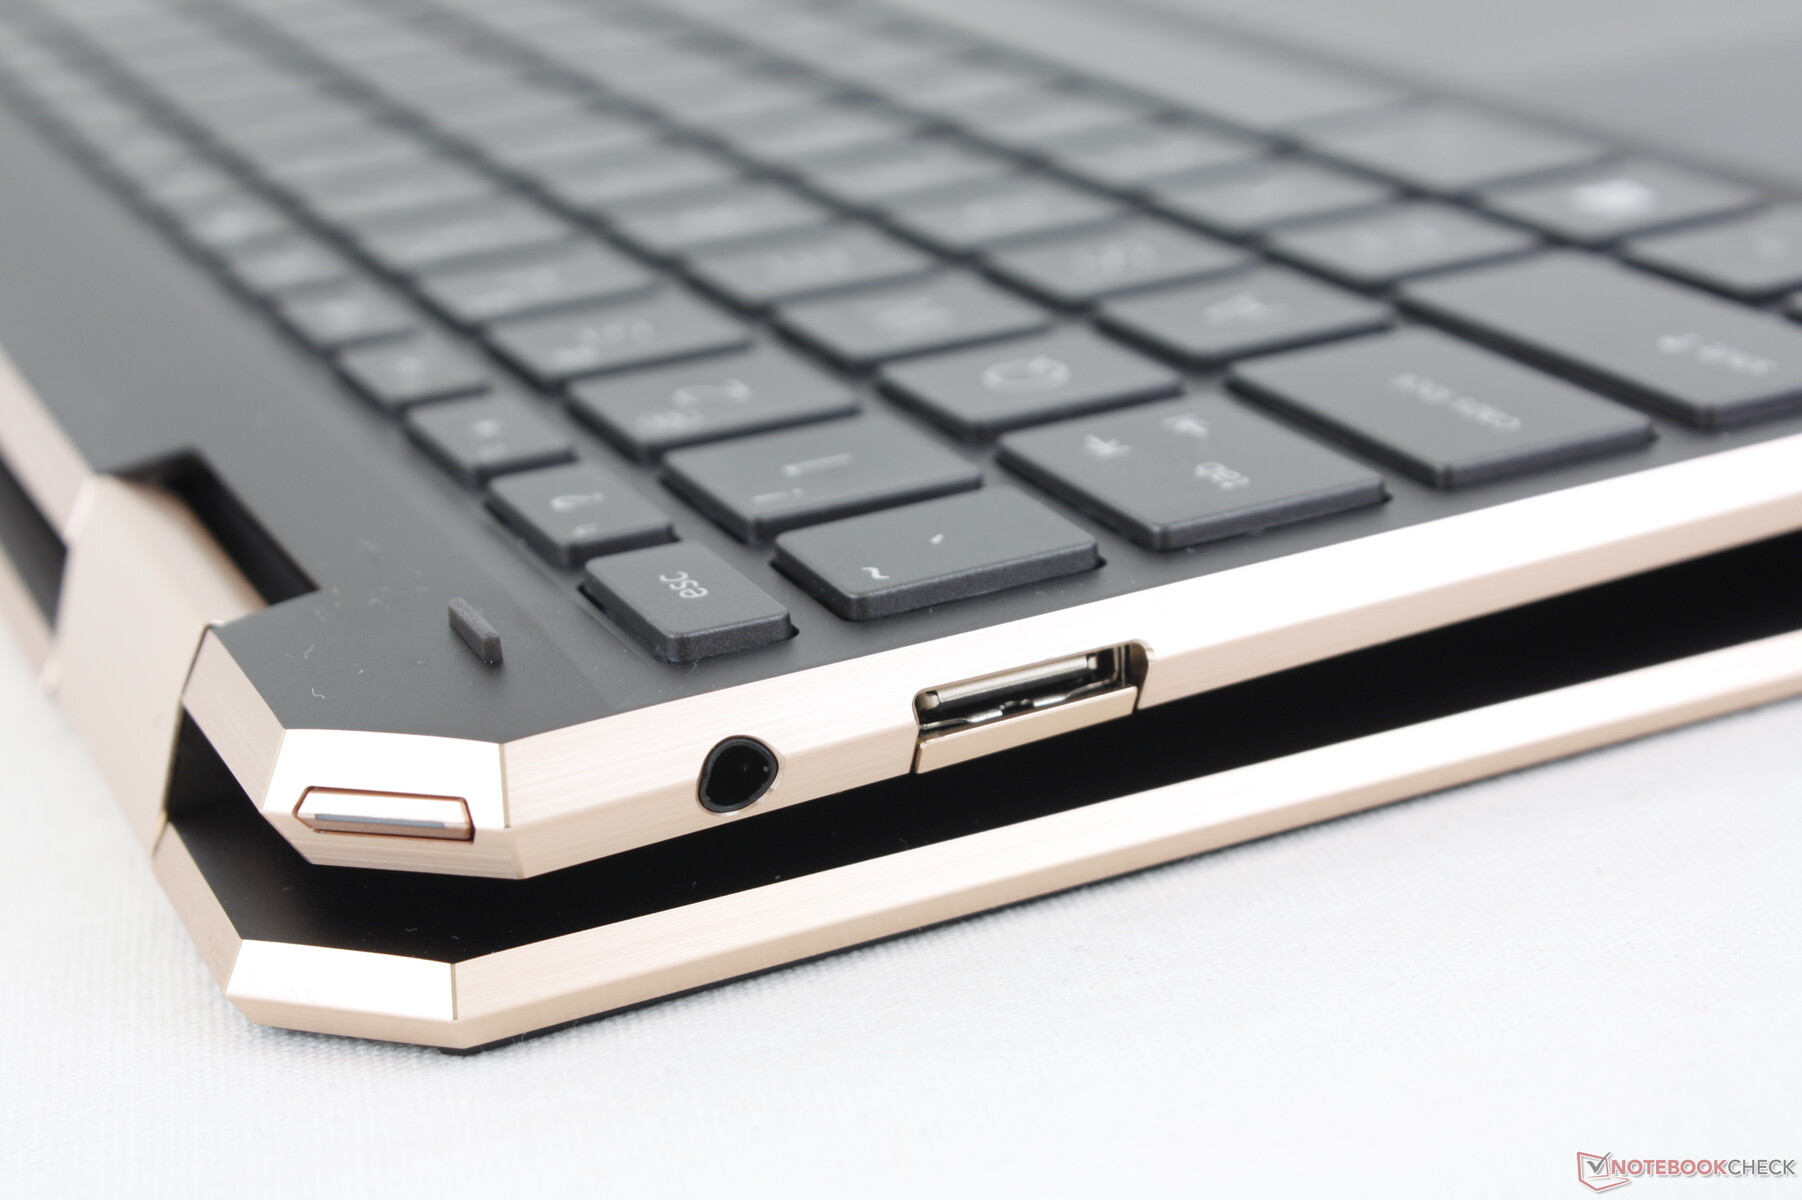
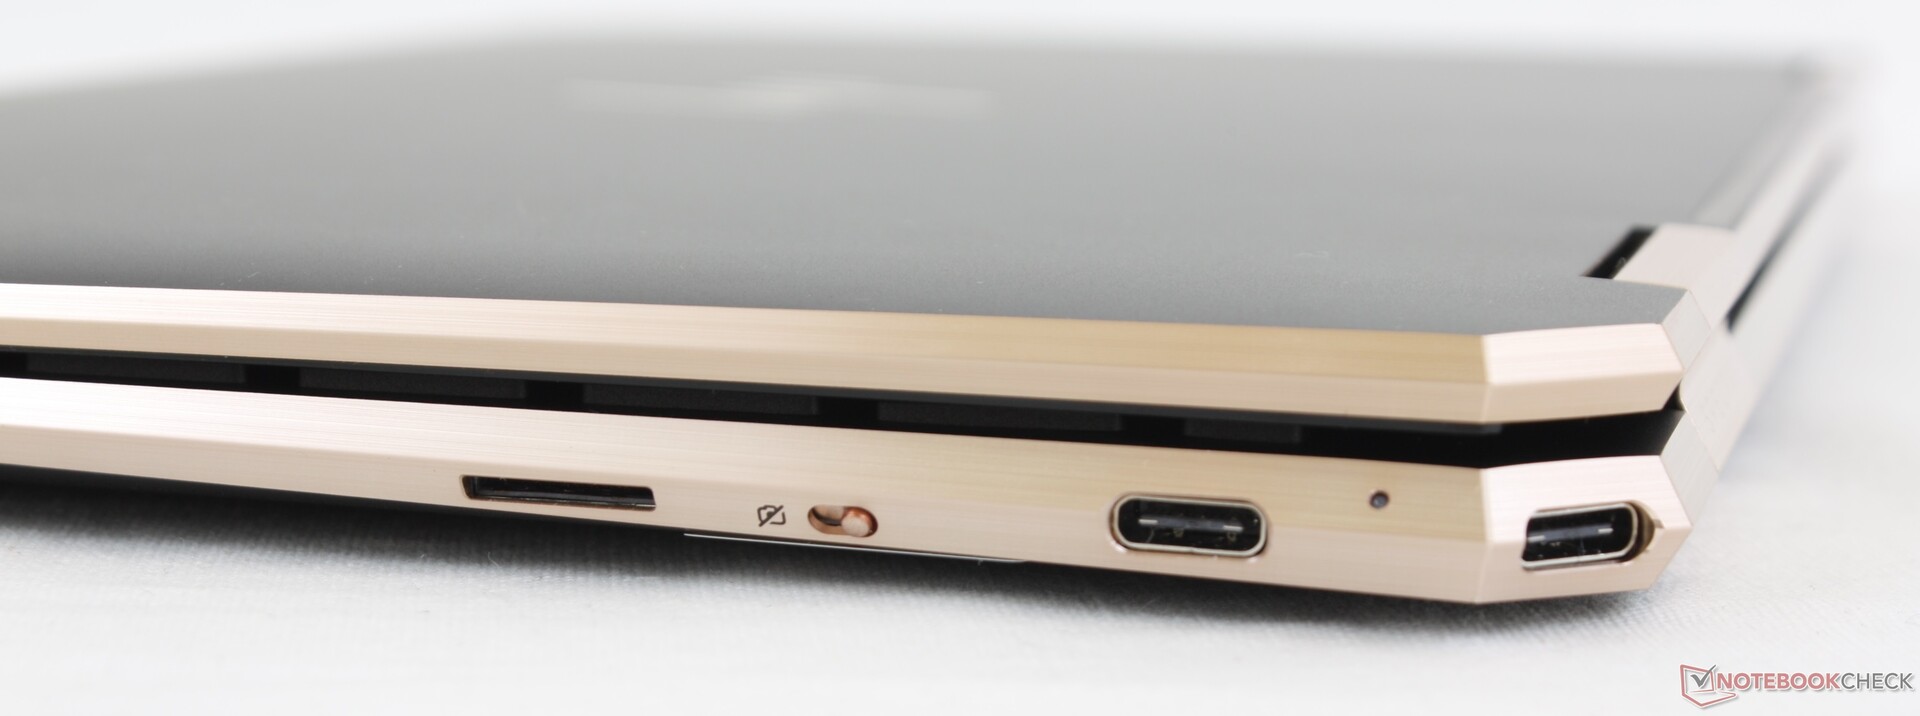
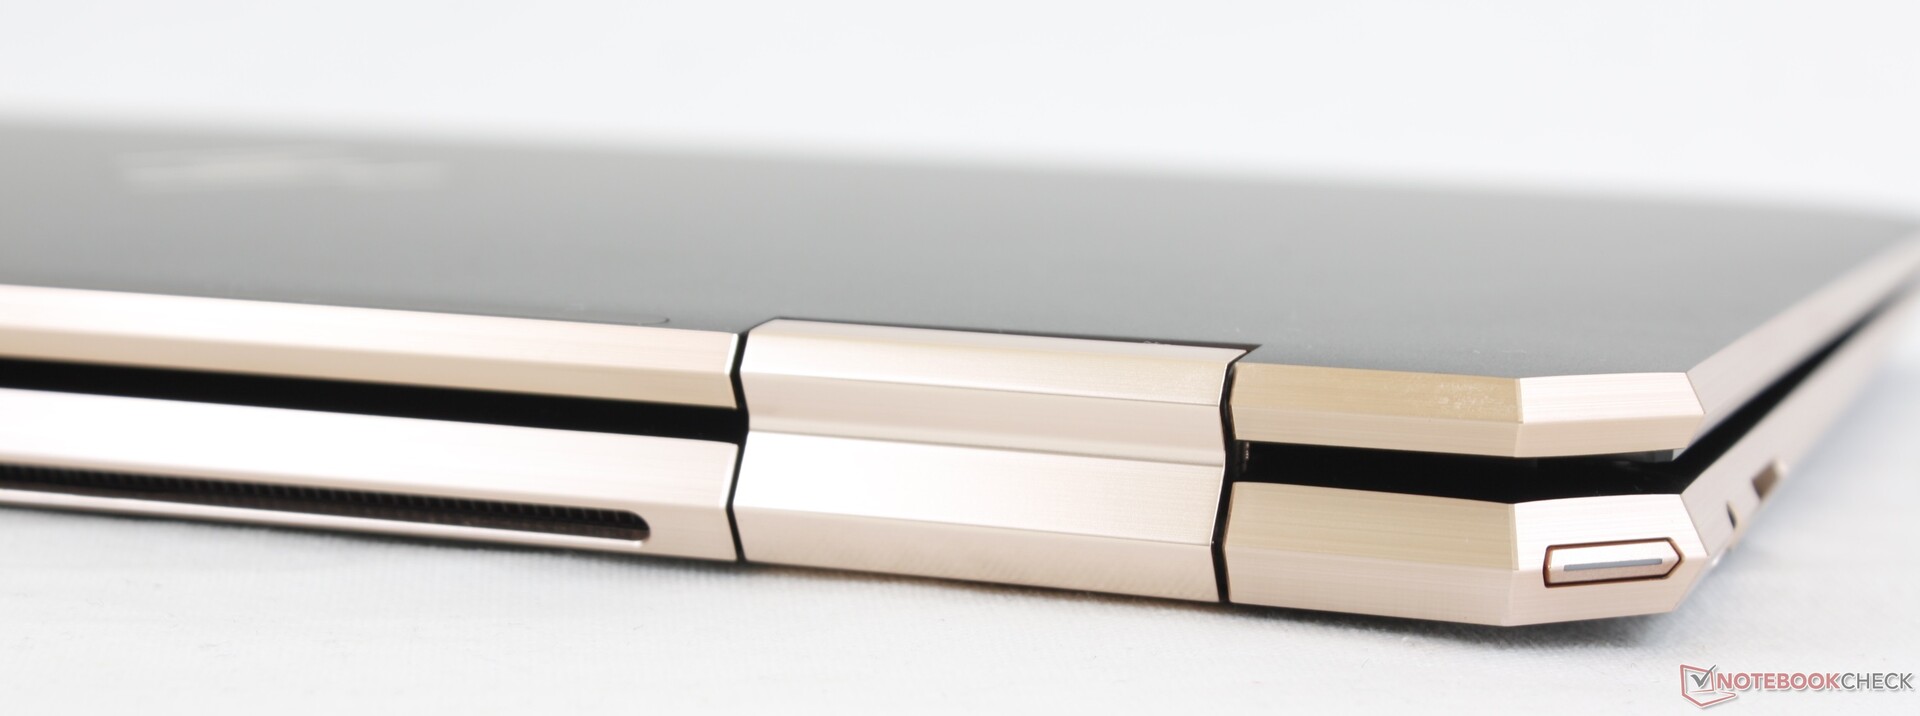
Connettività
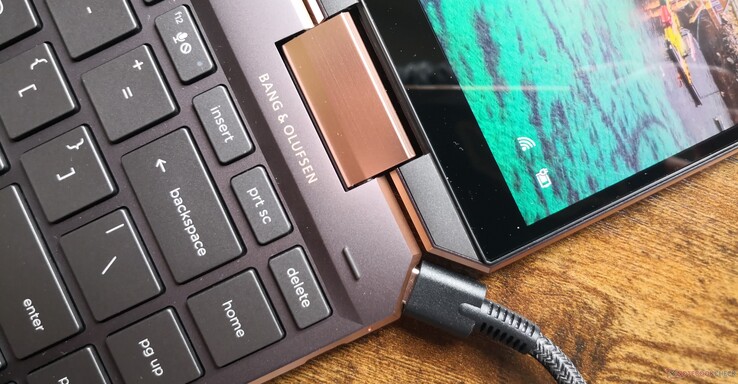
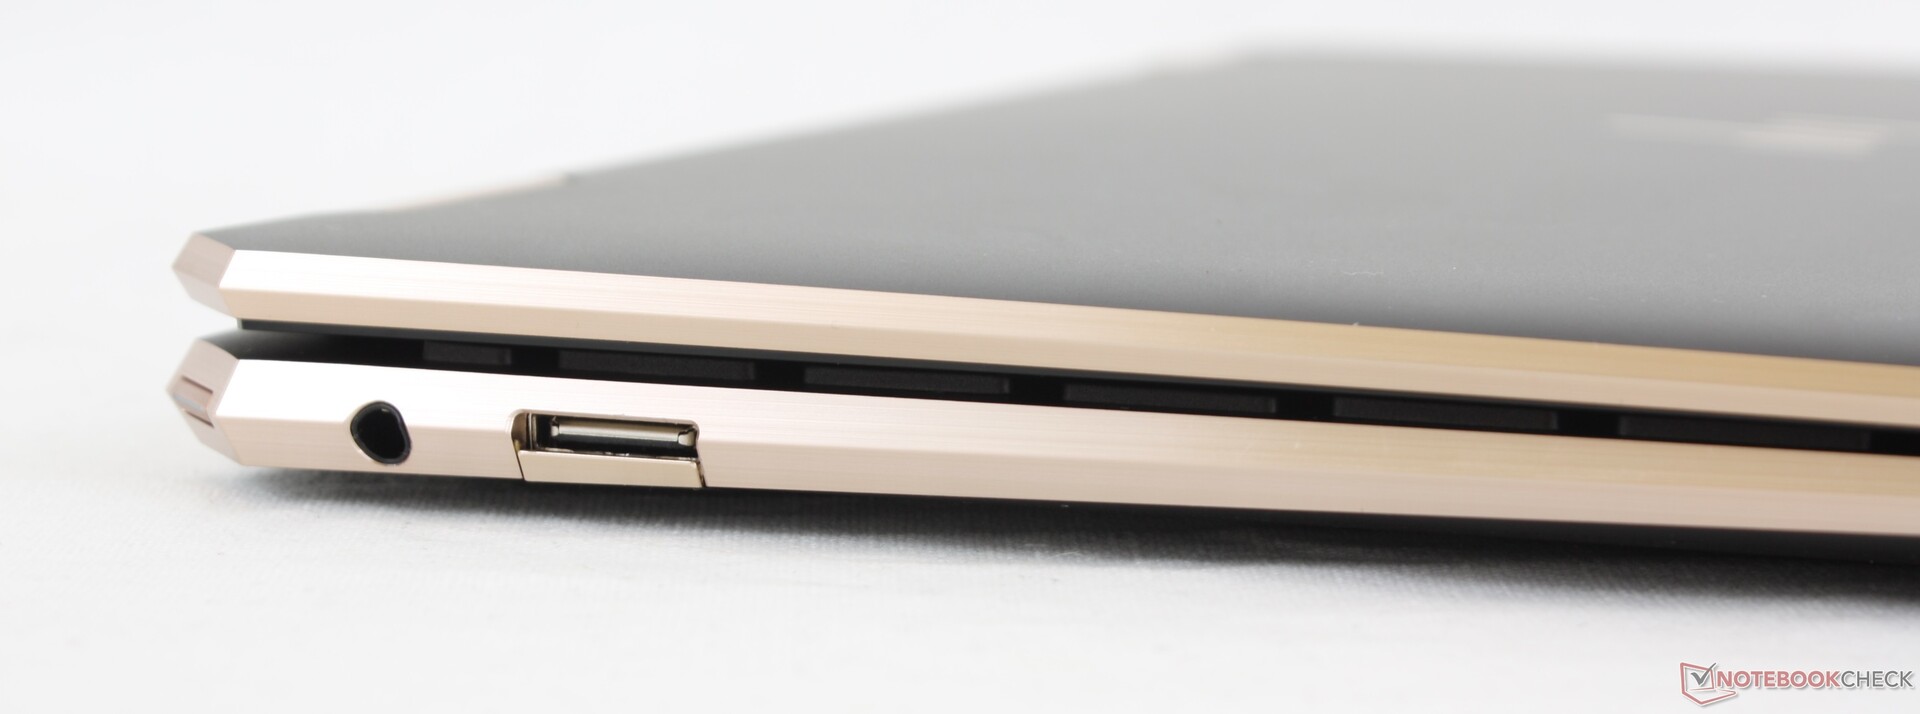
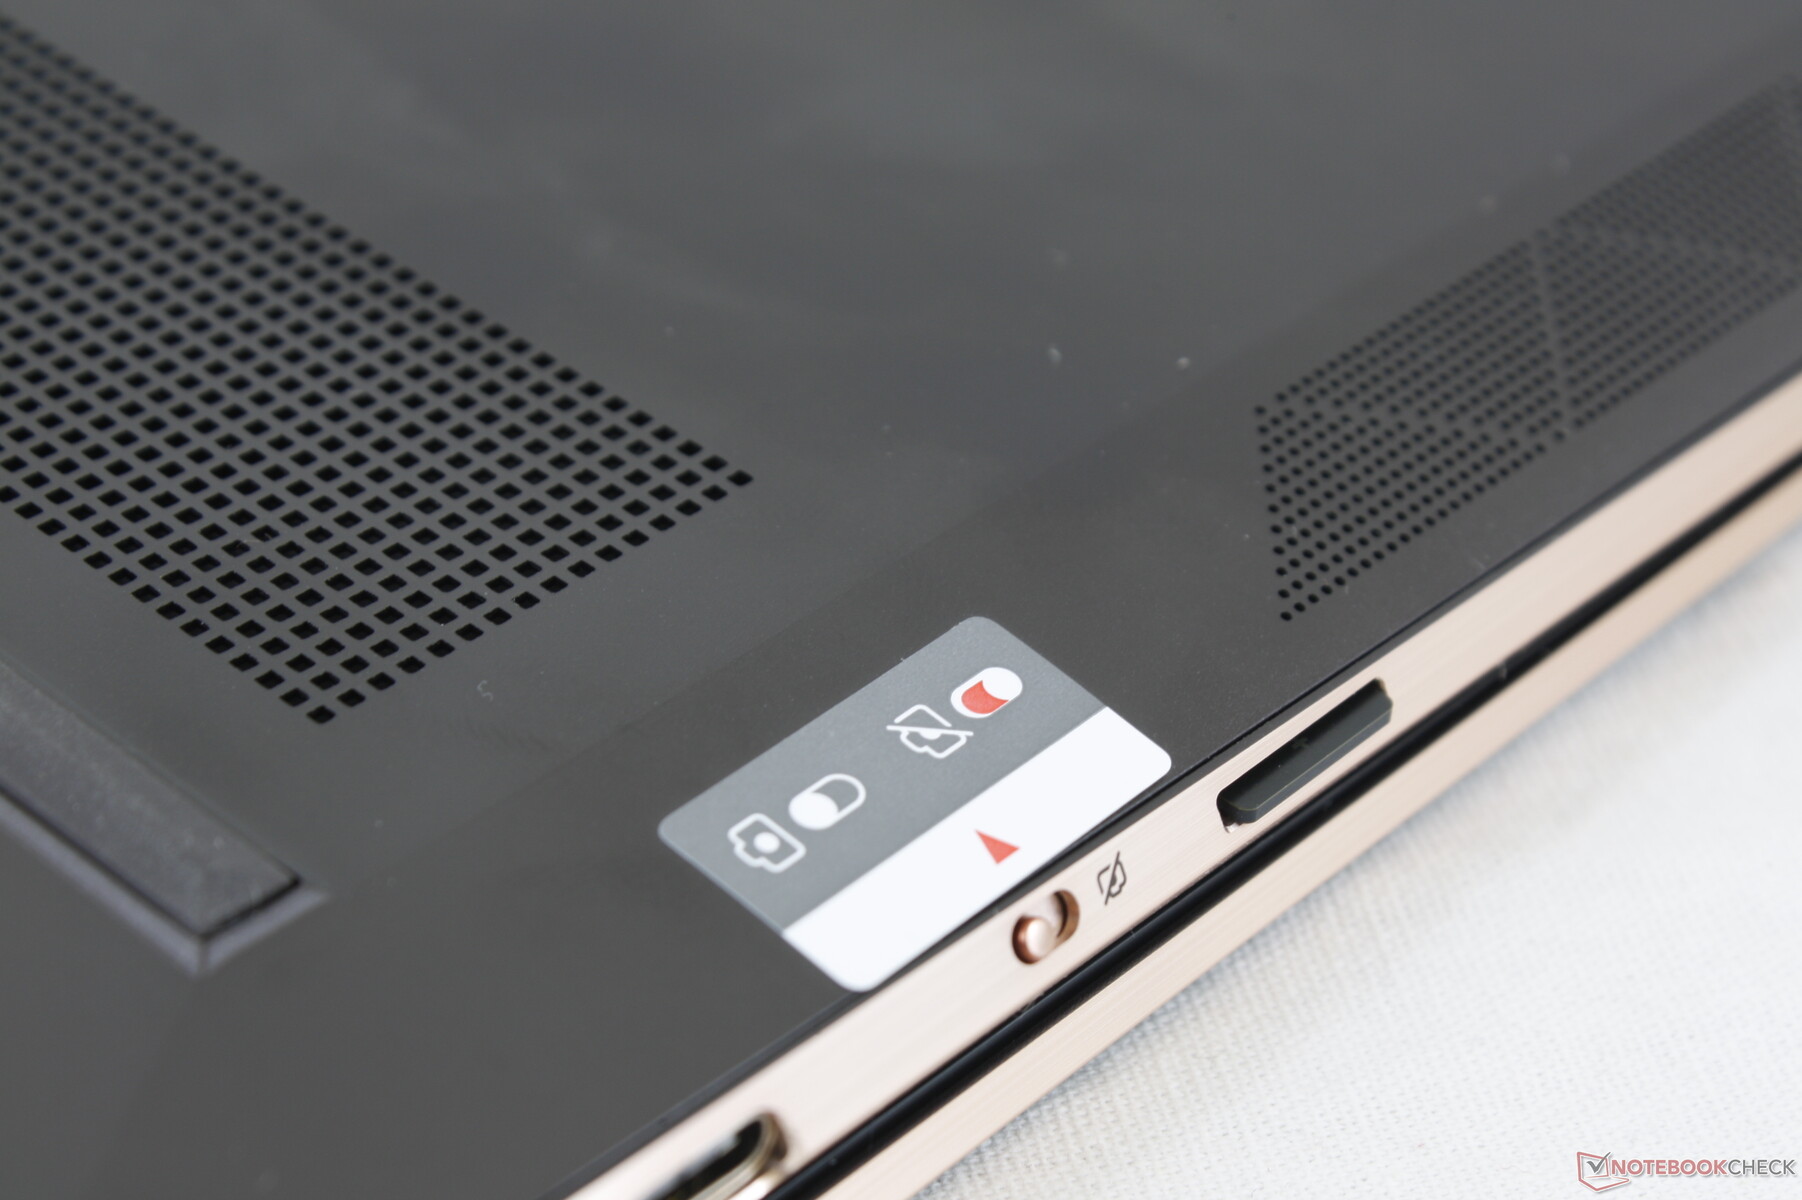
Le opzioni delle porte e il posizionamento sono gli stessi dello Spectre x360 13 del 2019, comprese le doppie porte Thunderbolt 3. È un po' deludente che le porte USB-C non siano state aggiornate a Thunderbolt 4, ma HP promette 40 Gbps per porta a prescindere. La porta USB-A integrata è apprezzata dal momento che alcuni convertibili non hanno l'opzione.
Uno slot SIM è disponibile lungo il bordo sinistro se configurato con 4G LTE.
Lettore di schede SD
Il lettore MicroSD a molla è veloce come prima, con velocità di trasferimento di oltre 180 MB/s sulla nostra scheda di test AV PRO microSD 128 GB V60.
| SD Card Reader | |
| average JPG Copy Test (av. of 3 runs) | |
| HP Spectre x360 14t-ea000 (Toshiba Exceria Pro M501 microSDXC 32GB) | |
| HP Spectre x360 13-aw2003dx (AV PRO microSD 128 GB V60) | |
| Dell XPS 13 7390 Core i7-10710U (Toshiba Exceria Pro M501 64 GB UHS-II) | |
| HP Spectre x360 13-aw0013dx (Toshiba Exceria Pro M501 microSDXC 64GB) | |
| Lenovo Yoga Duet 7 13IML05-82AS000WGE (Toshiba Exceria Pro M501 microSDXC 64GB) | |
| MSI Summit E13 Flip Evo A11MT (AV PRO microSD 128 GB V60) | |
| maximum AS SSD Seq Read Test (1GB) | |
| HP Spectre x360 14t-ea000 (Toshiba Exceria Pro M501 microSDXC 32GB) | |
| Dell XPS 13 7390 Core i7-10710U (Toshiba Exceria Pro M501 64 GB UHS-II) | |
| HP Spectre x360 13-aw0013dx (Toshiba Exceria Pro M501 microSDXC 64GB) | |
| HP Spectre x360 13-aw2003dx (AV PRO microSD 128 GB V60) | |
| MSI Summit E13 Flip Evo A11MT (AV PRO microSD 128 GB V60) | |
| Lenovo Yoga Duet 7 13IML05-82AS000WGE (Toshiba Exceria Pro M501 microSDXC 64GB) | |
Comunicazione
L'Intel AX201 è dotato di Bluetooth 5.1 integrato, proprio come il modello 2019 Ice Lake. Non abbiamo riscontrato problemi quando accoppiato al nostro router Netgear RAX200 Wi-Fi 6.
Webcam

")
")
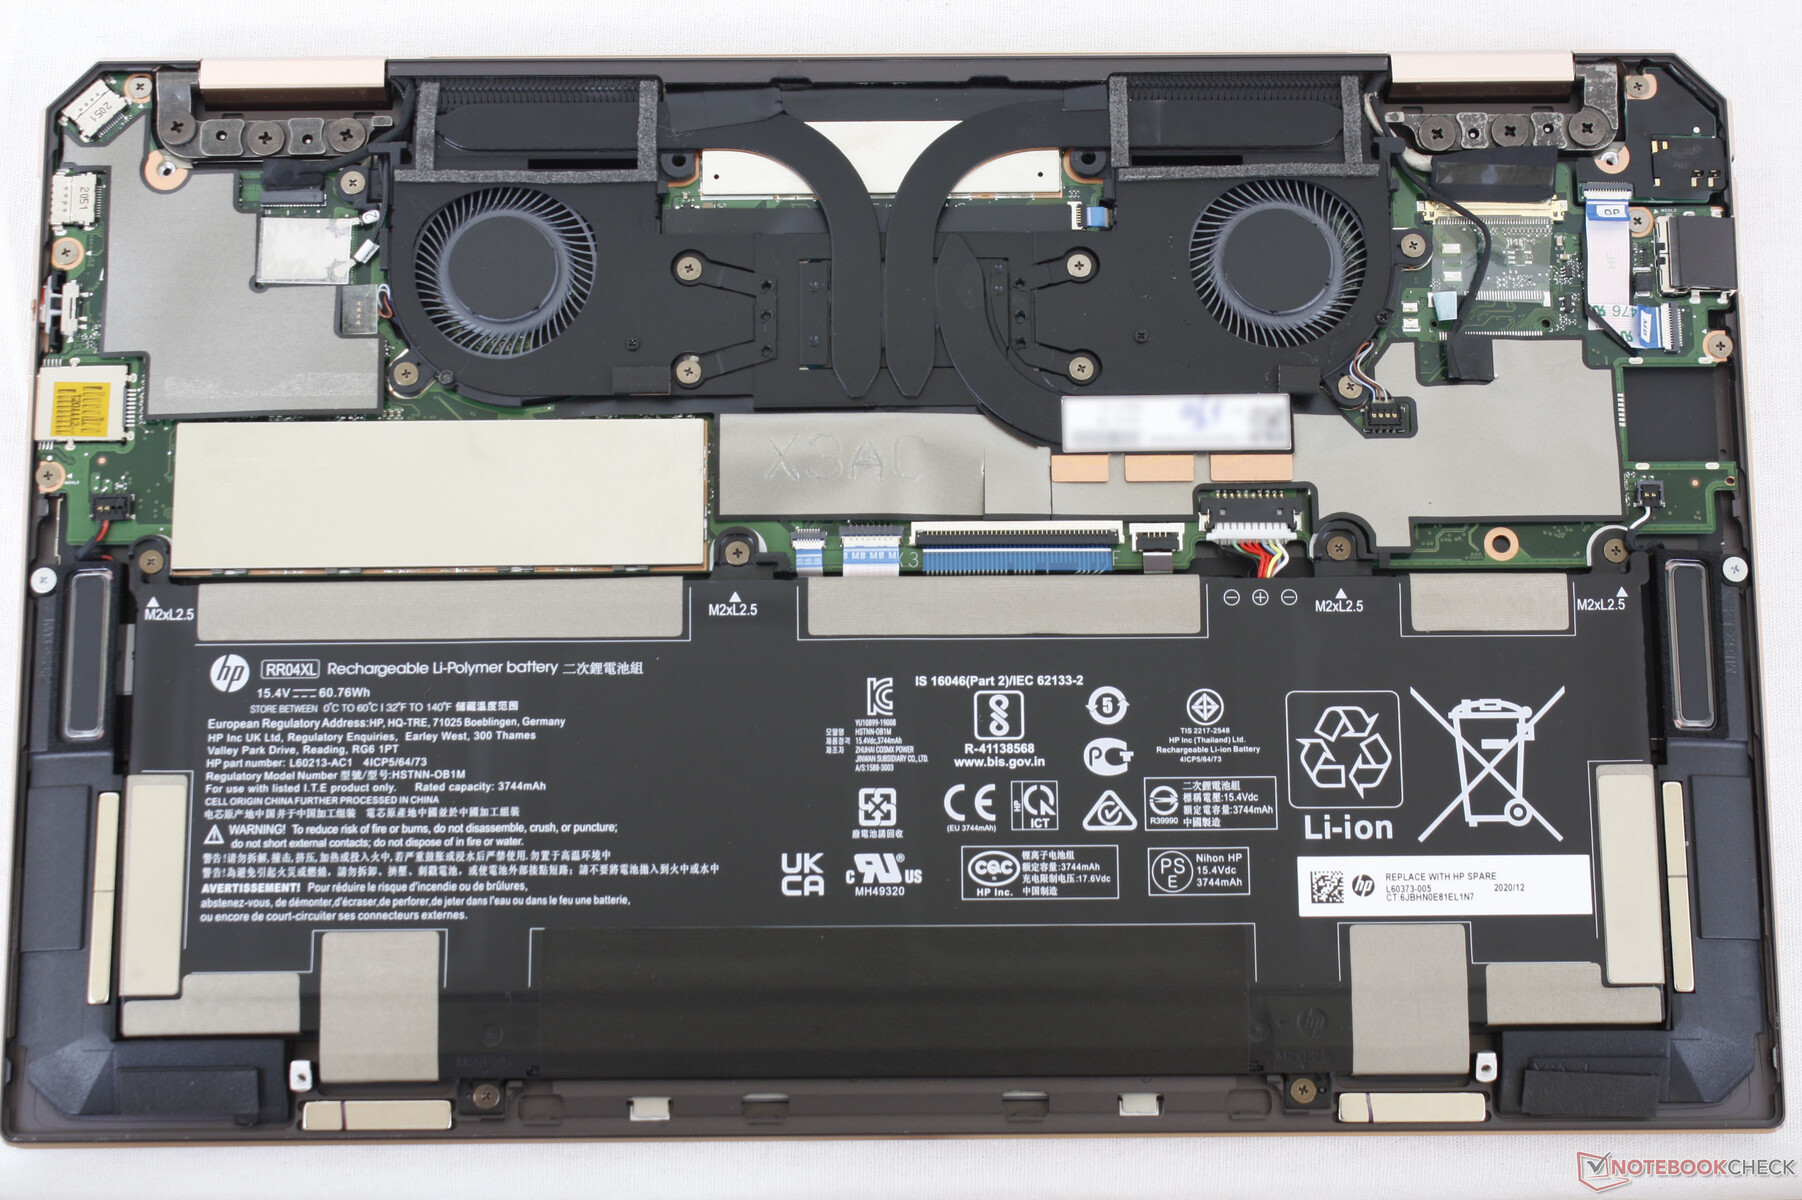
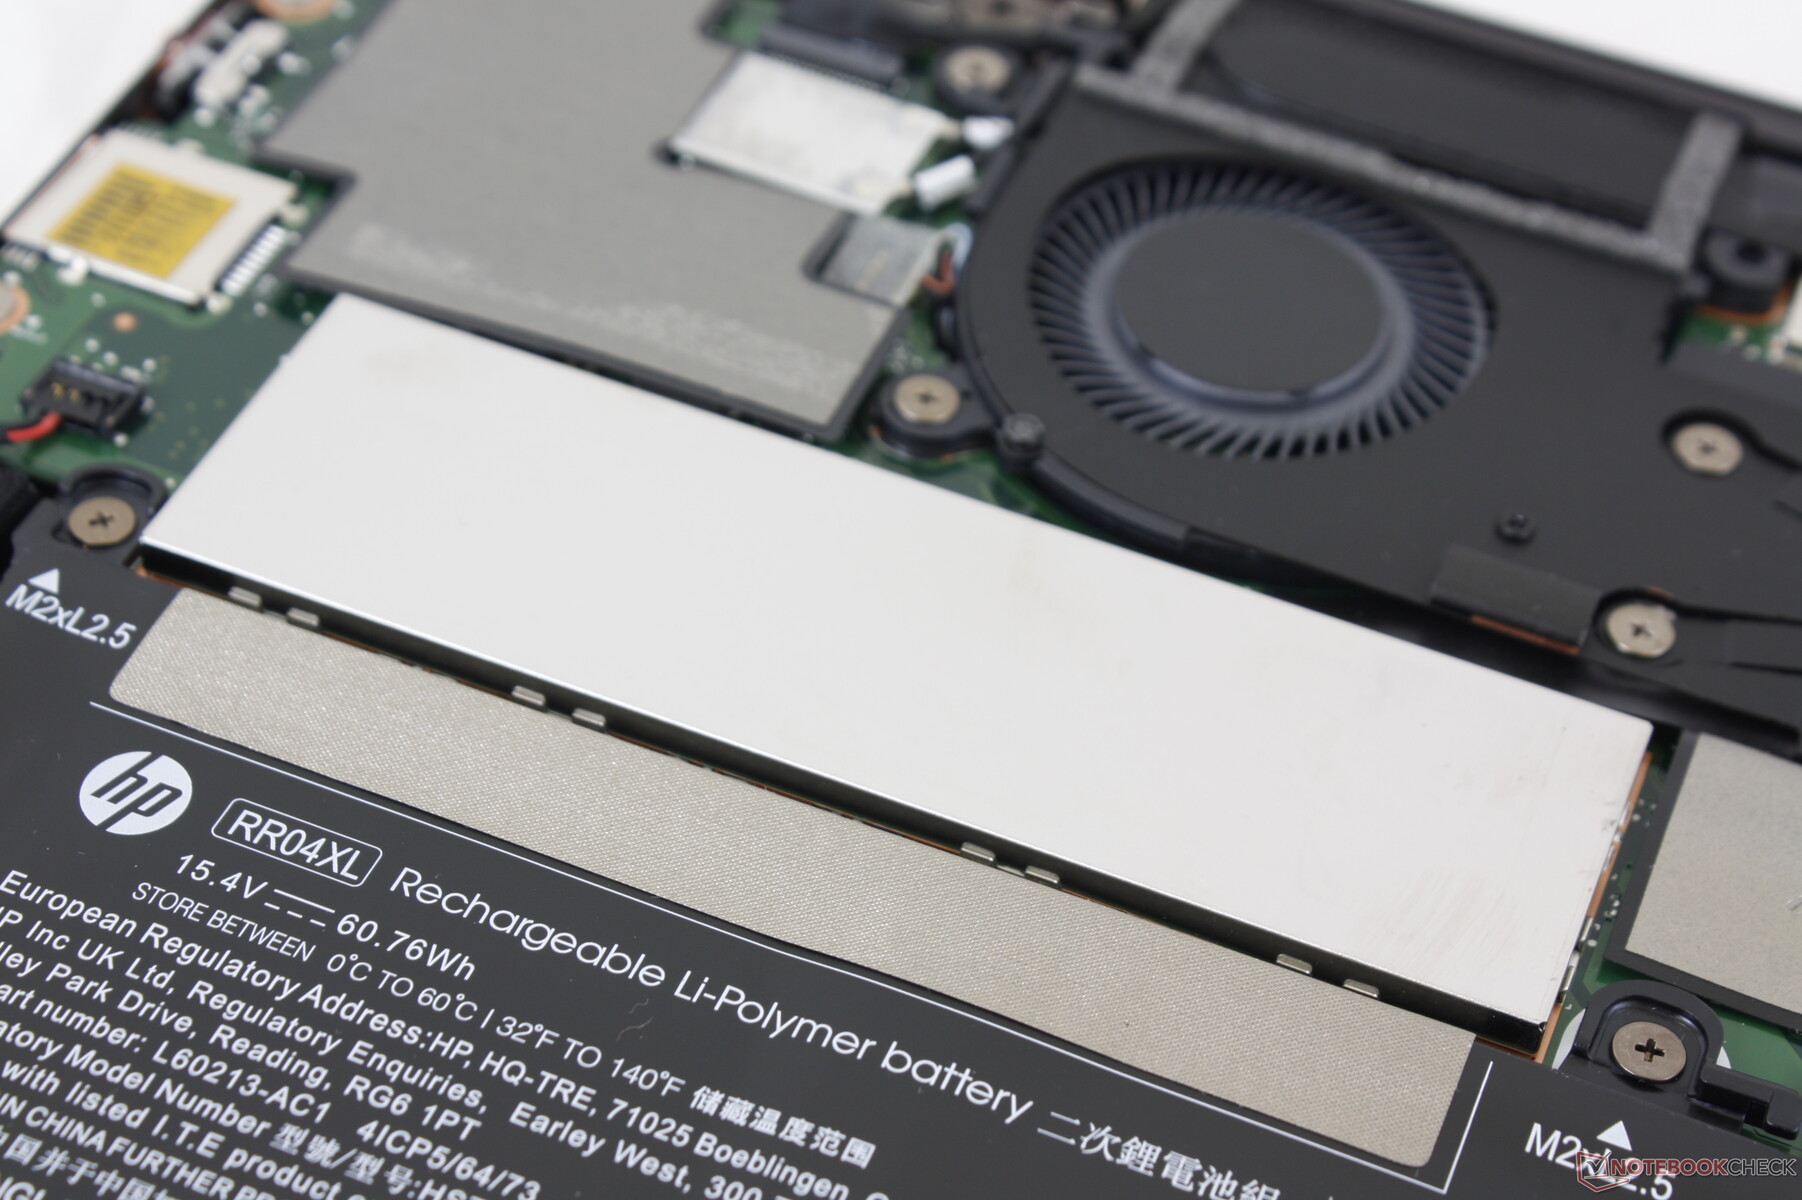
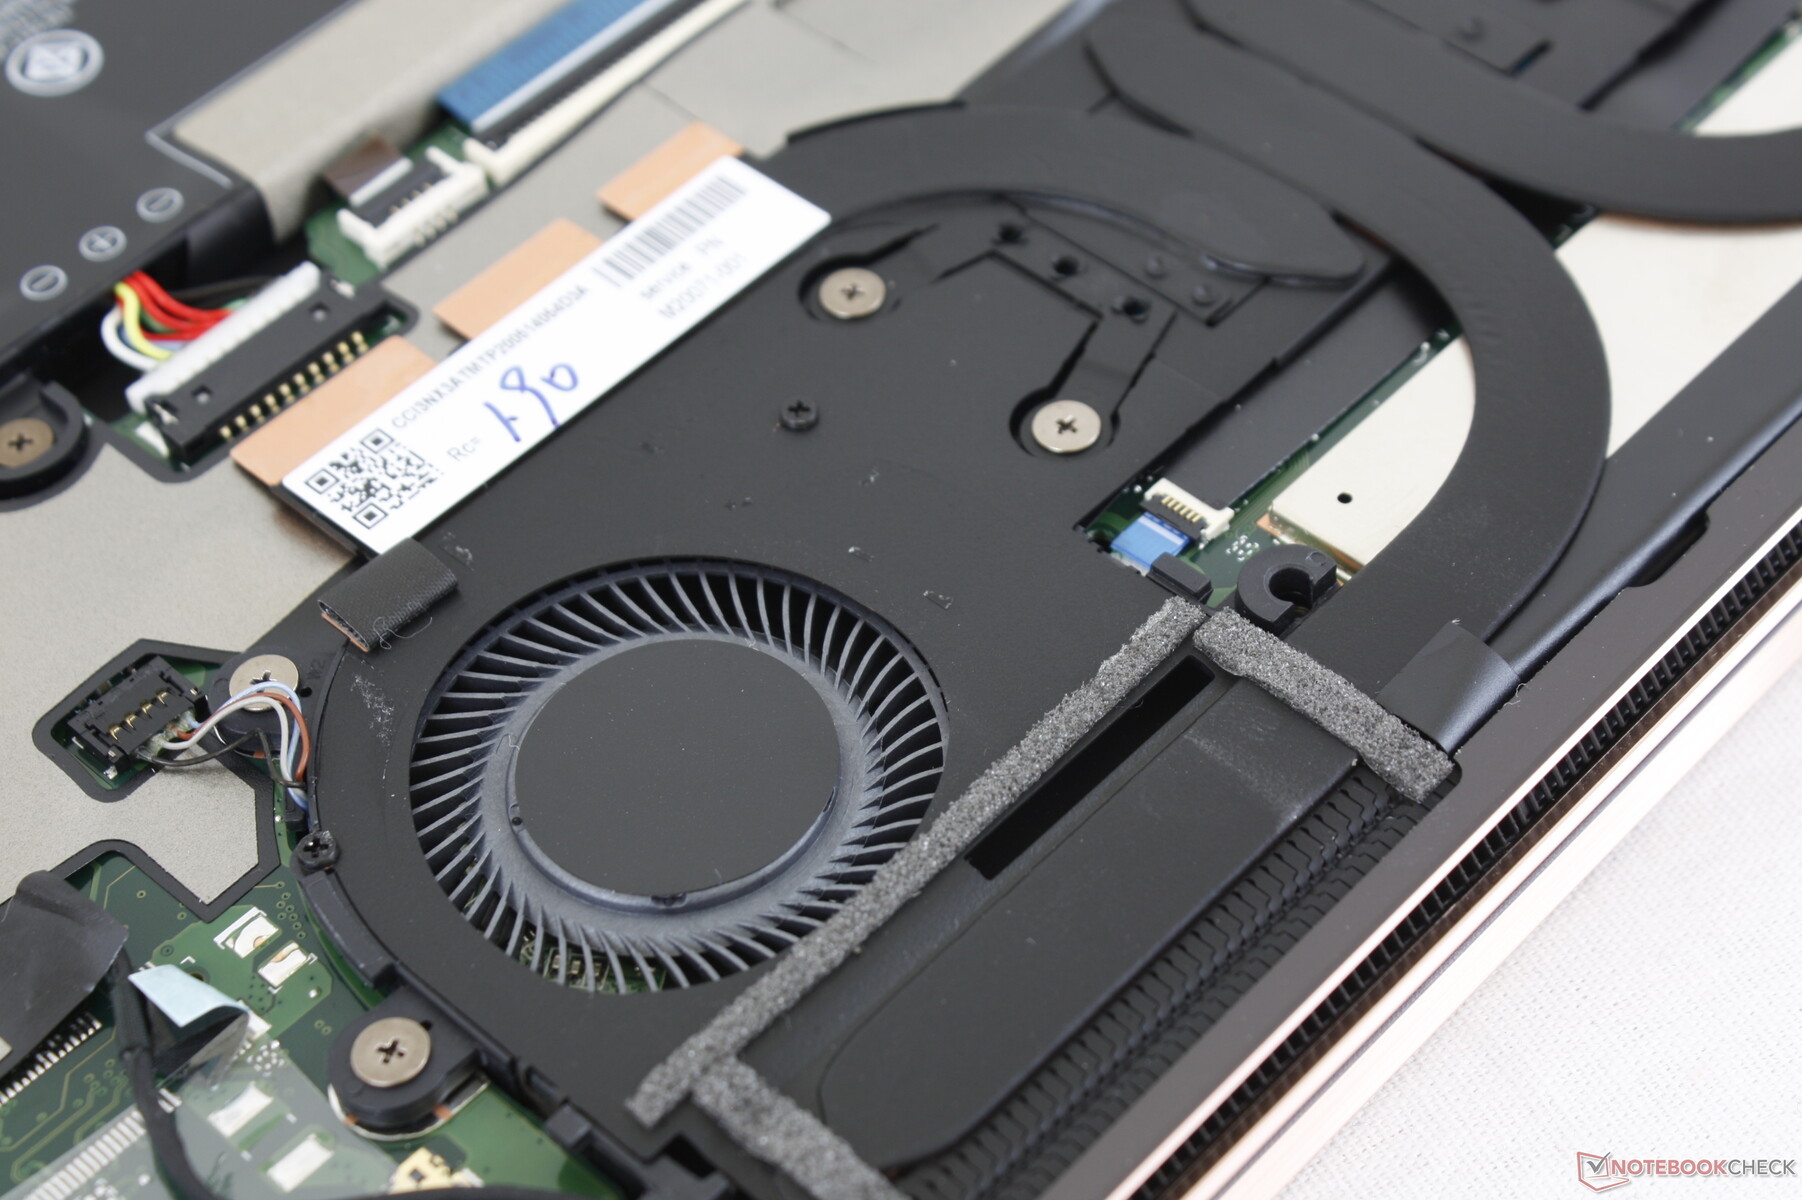
Manutenzione
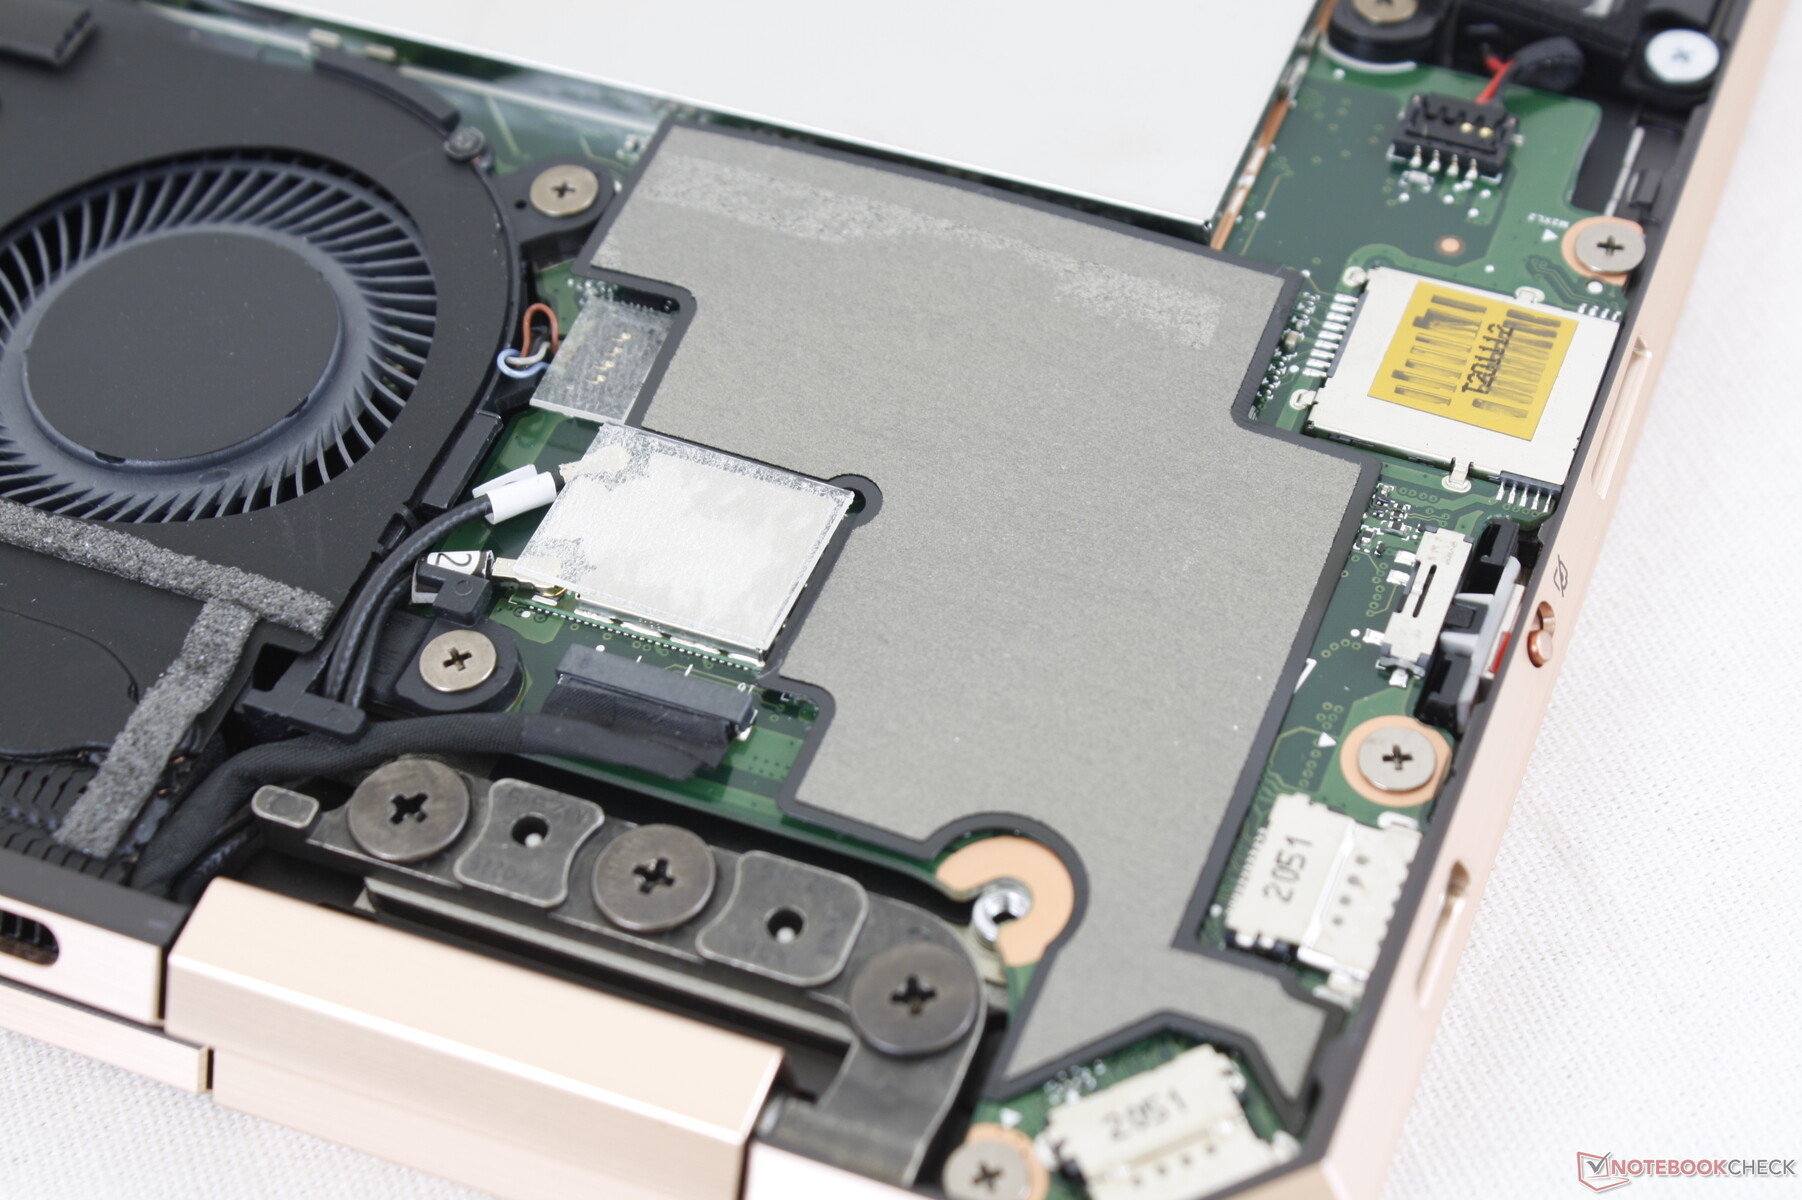
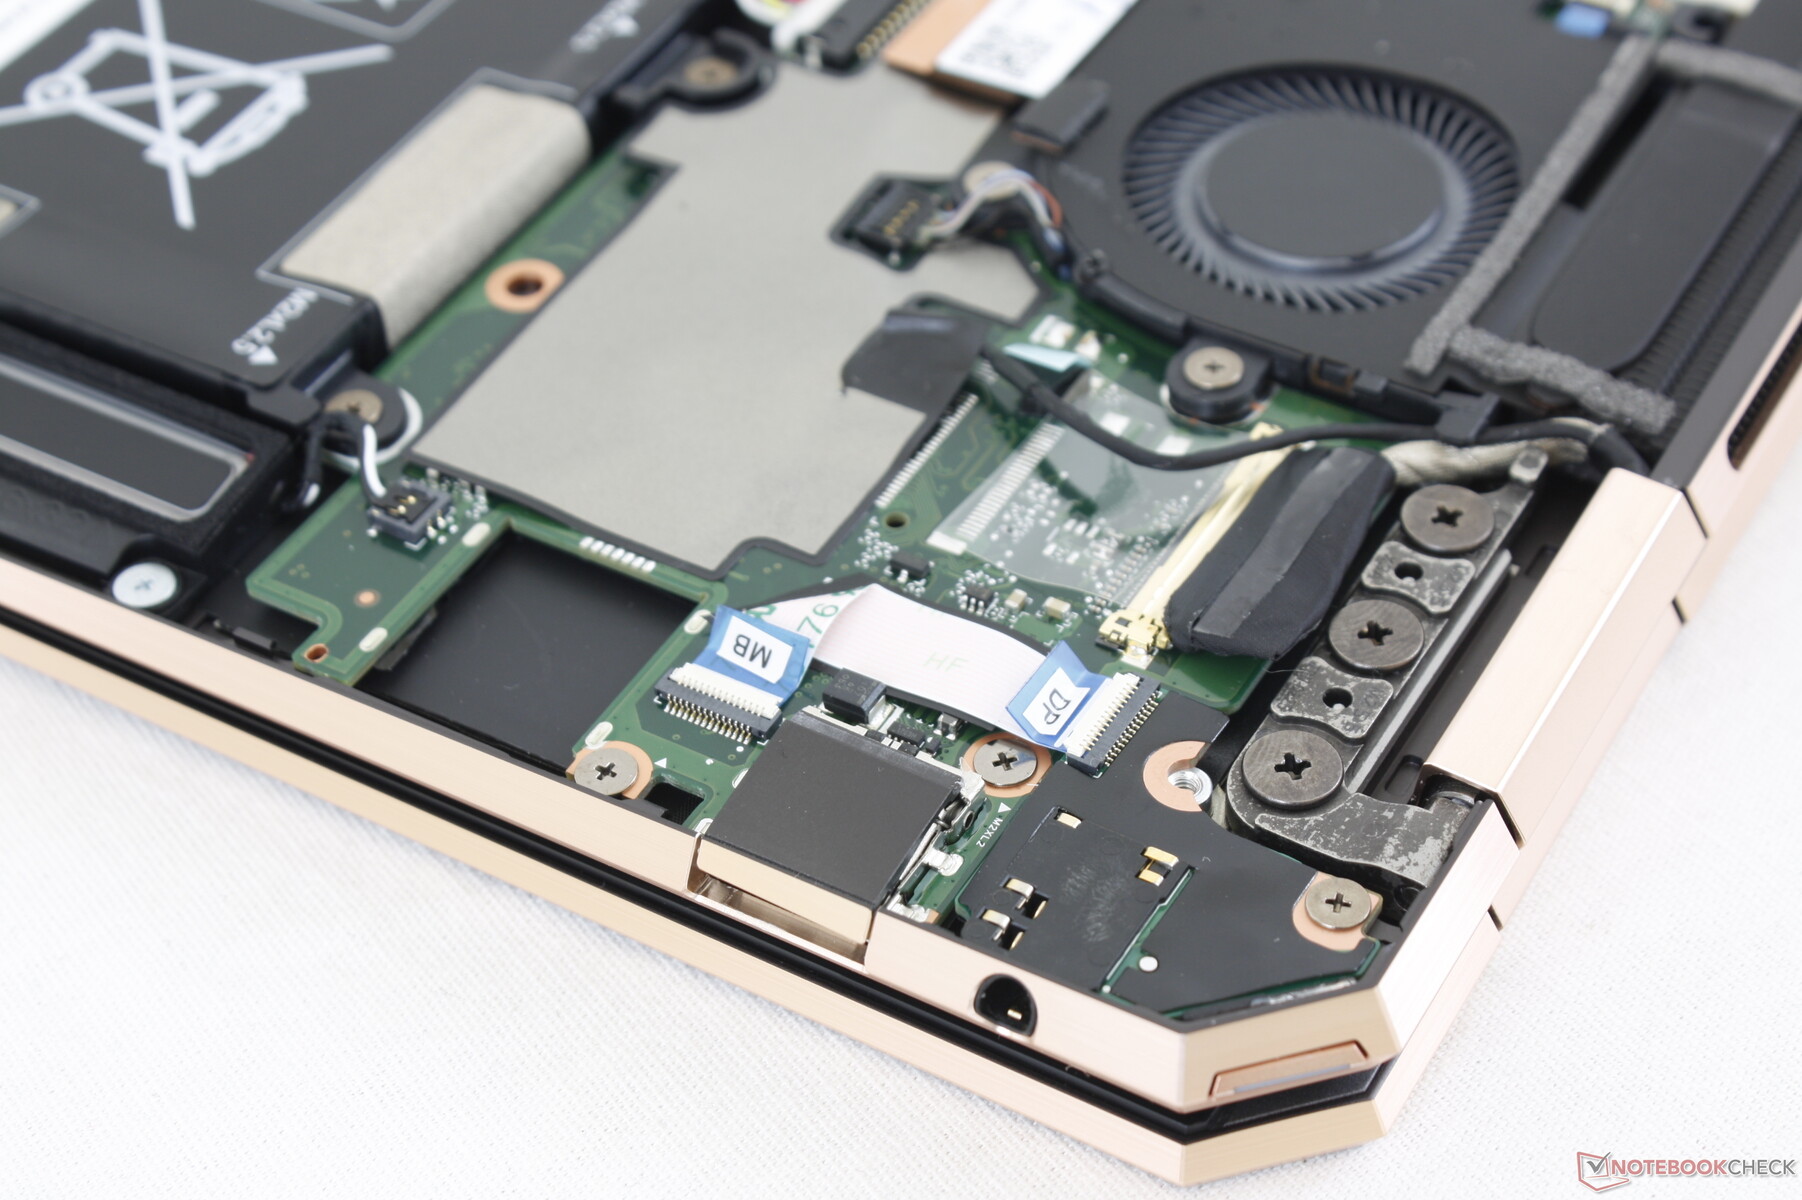
Il pannello inferiore è fissato da due viti T5 Torx più quattro viti Philips nascoste sotto i piedini di gomma. Gli utenti possono aggiornare solo l'SSD M.2 (e potenzialmente il modulo WAN) poiché i moduli WLAN e RAM sono saldati.
Accessori e garanzia
La confezione include una penna HP Tilt Pen (HP P/N: M23864-001) insieme a una custodia da trasporto in finta pelle, adattatore AC USB-C e documenti. Un panno per la pulizia non è incluso.
Si applica la garanzia limitata standard di un anno del produttore con ampie opzioni. I produttori più grandi come HP, Lenovo o Dell tendono ad avere più opzioni di garanzia rispetto ad altri produttori.
Dispositivi di input
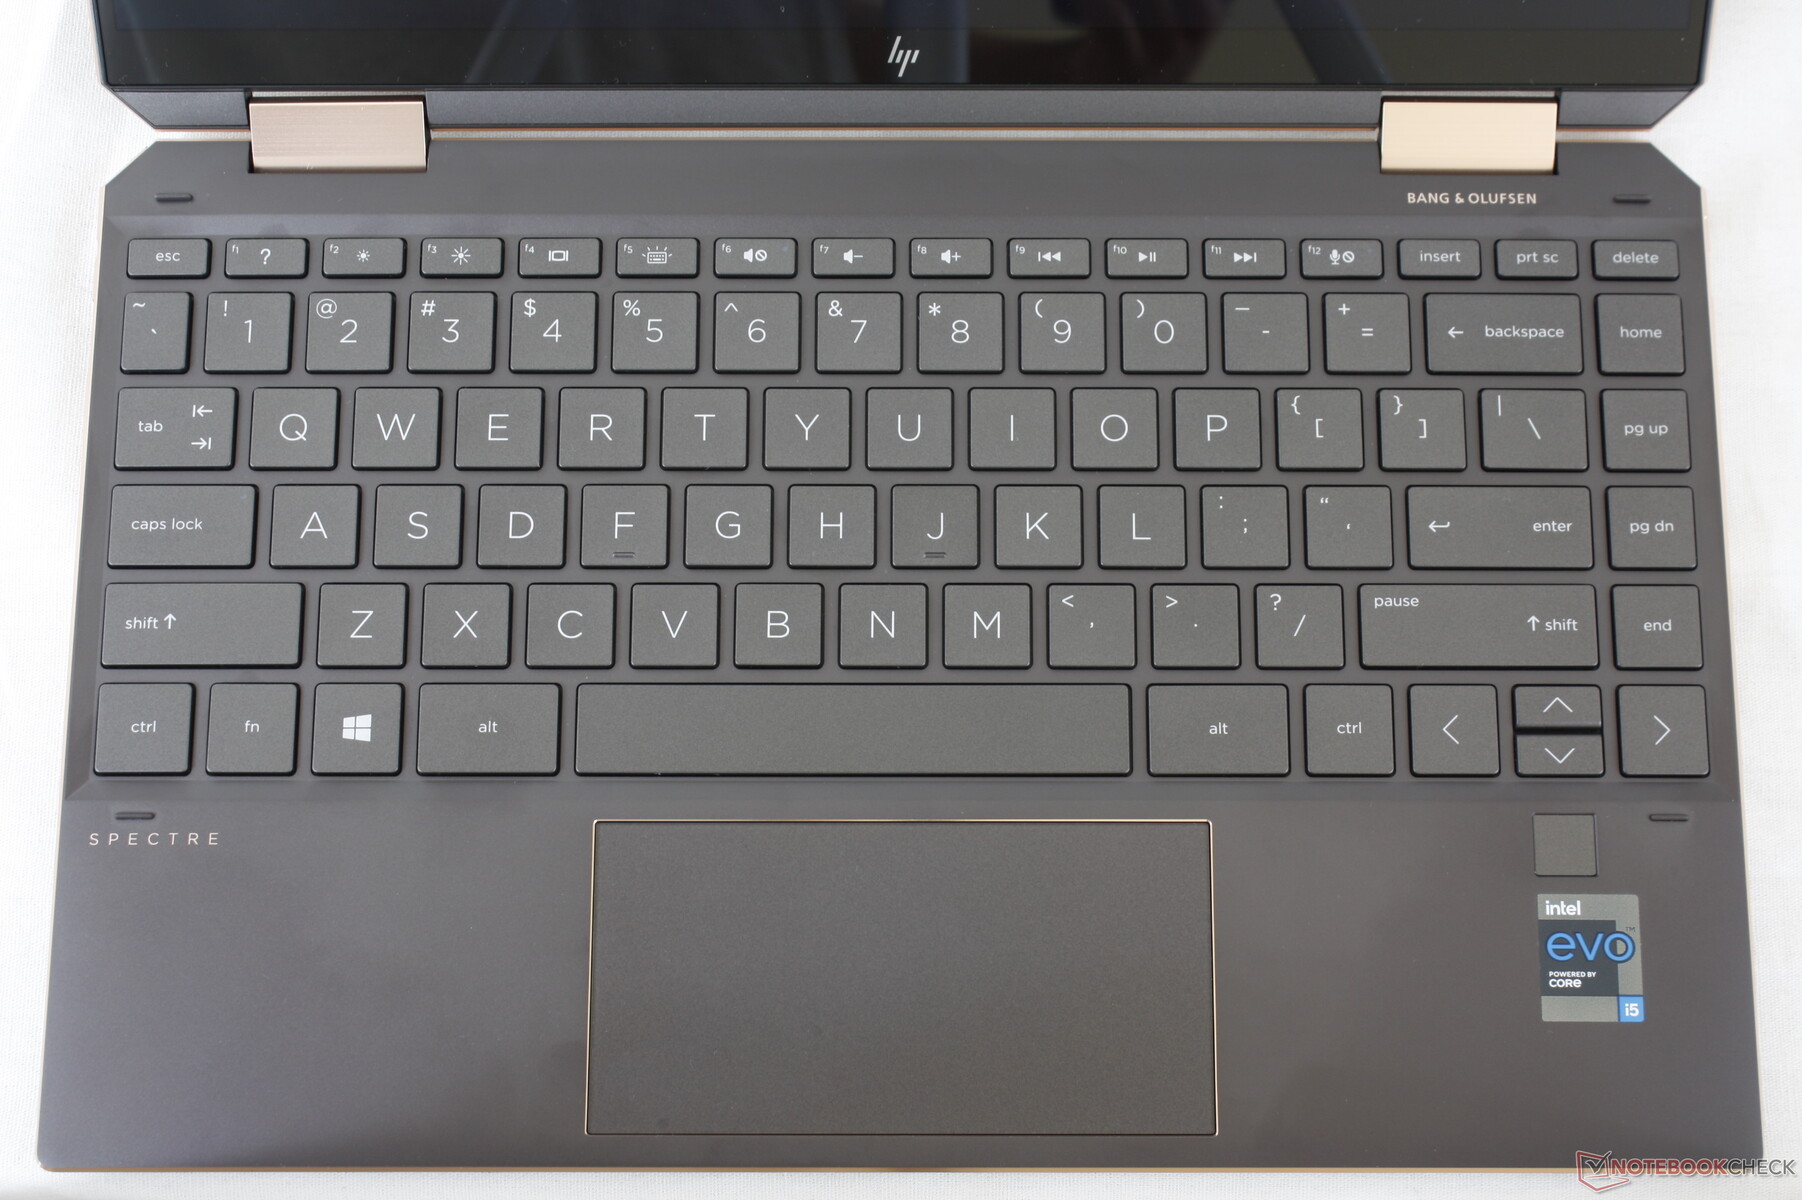
Tastiera
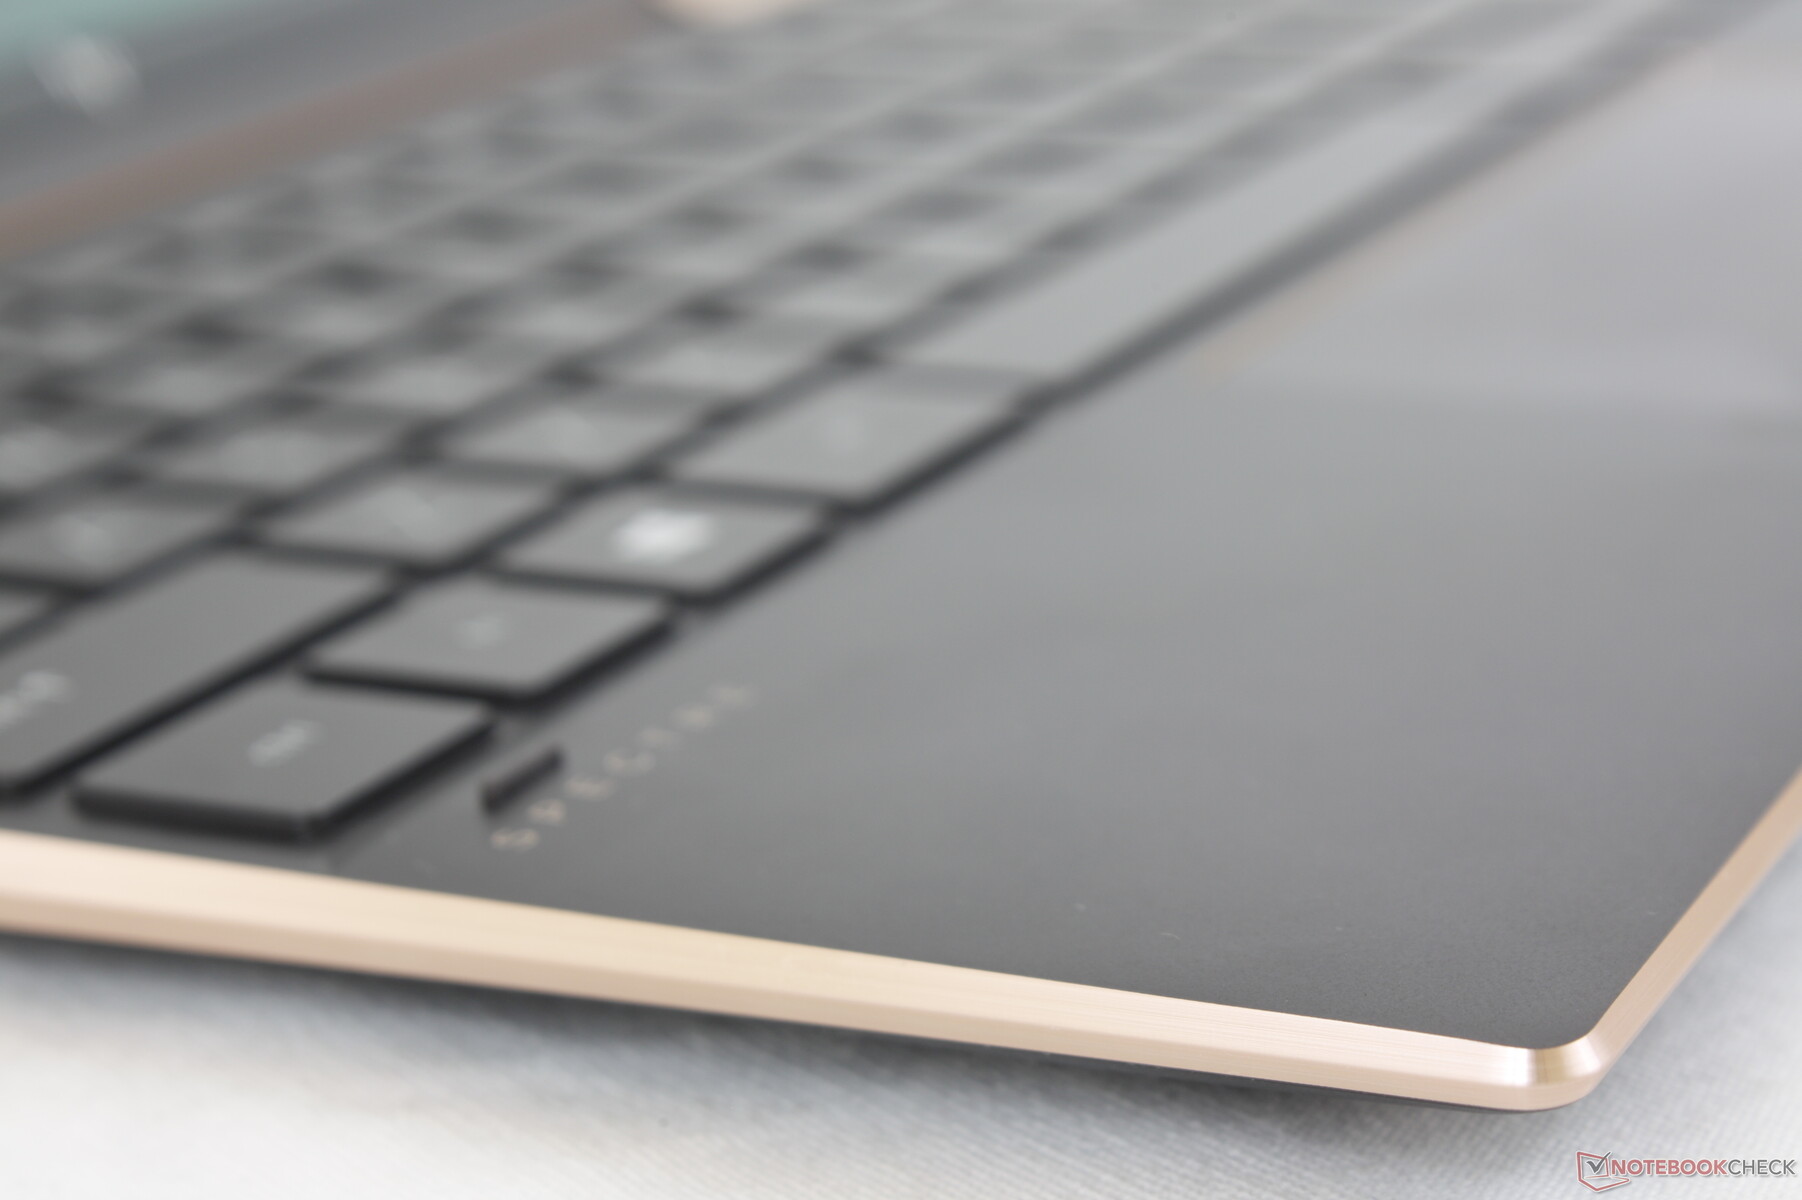
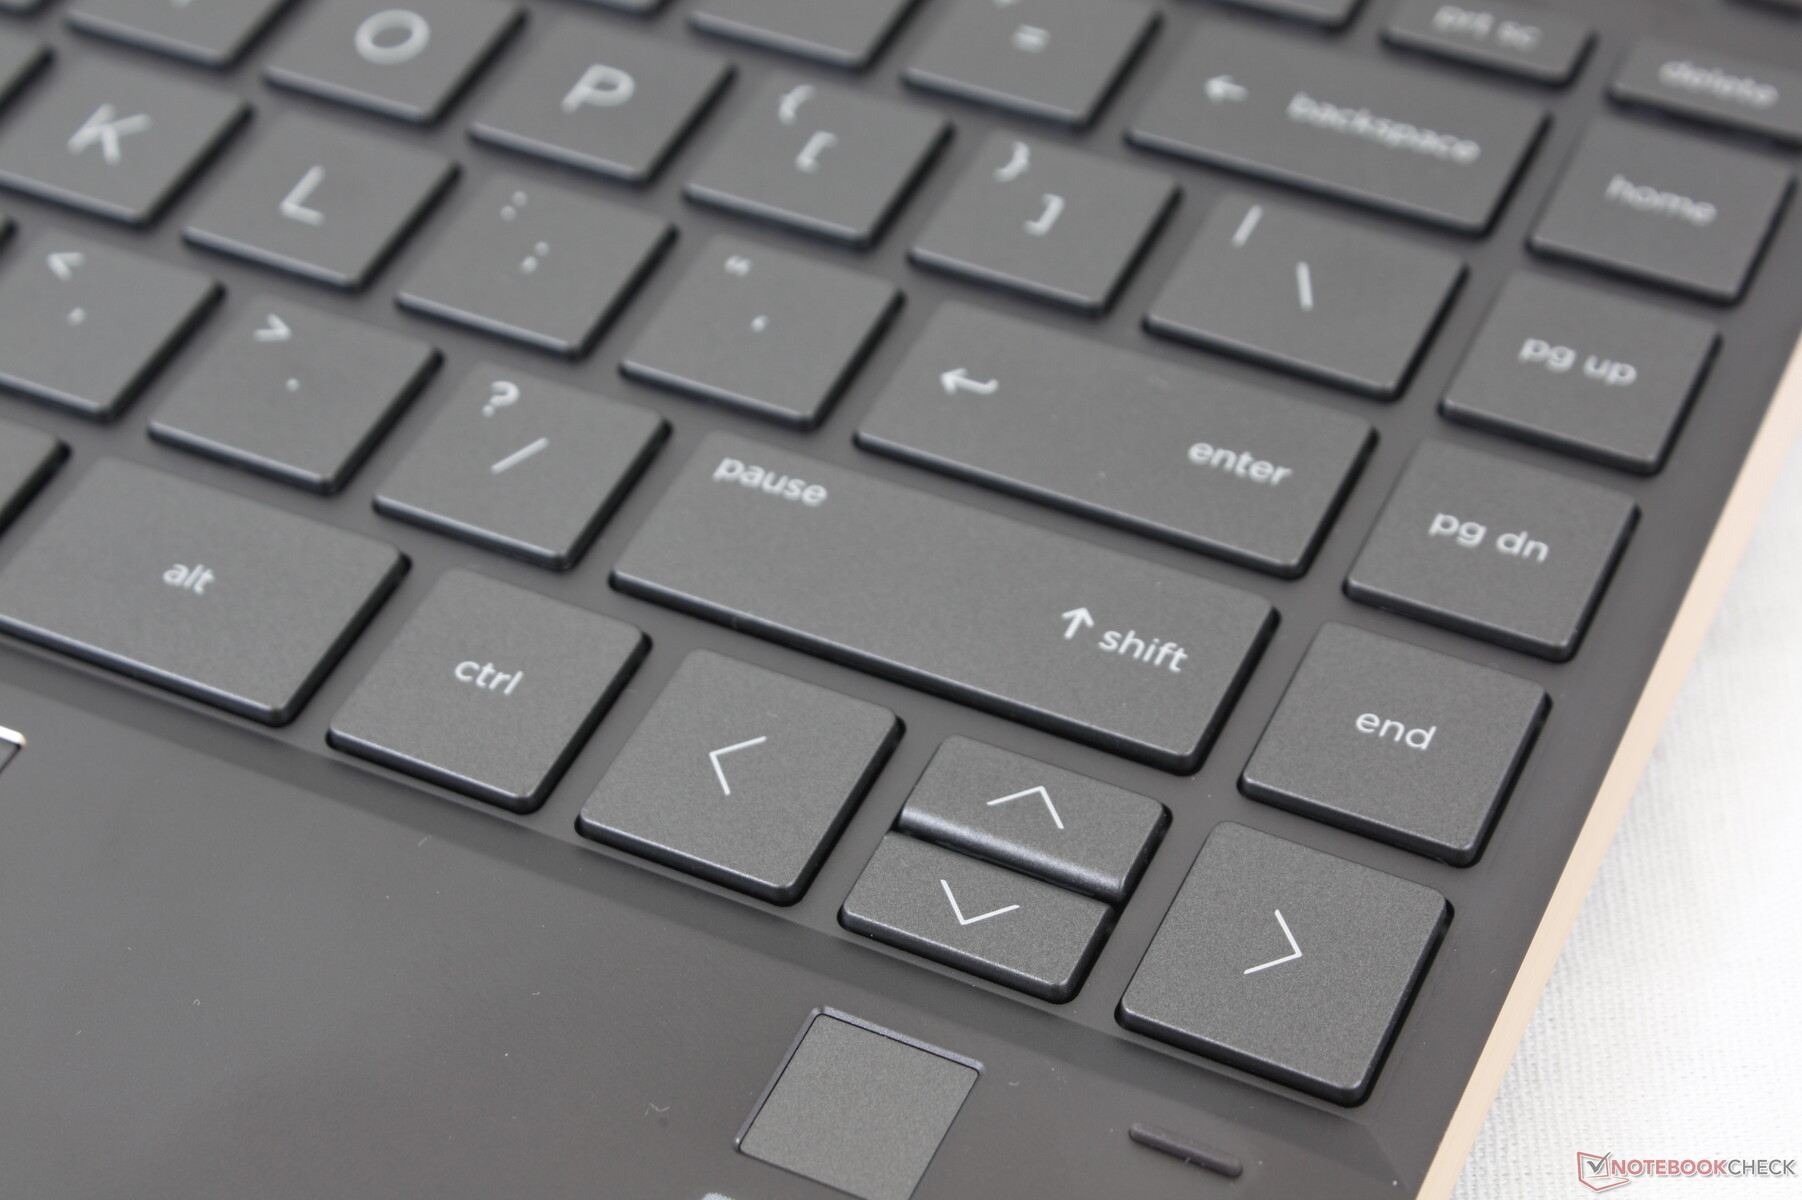
La tastiera rimane identica allo Spectre x360 13 del 2019, compresi anche i simboli su ogni tasto. Le serie Spectre ed EliteBook sono la patria di alcune delle nostre tastiere preferite per i computer portatili e quindi la mancanza di qualsiasi cambiamento gen-to-gen qui non è necessariamente una cosa negativa. Il feedback, la corsa e il rumore sono ancora più nitidi, più profondi e più silenziosi rispetto aulla maggior parte degli altri Ultrabooks fornendo un'esperienza di battuta soddisfacente.
Sui modelli futuri, ci piacerebbe vedere un tasto programmabile HP molto come sul ultimi computer portatili Envy per migliorare la personalizzazione dell'utente.
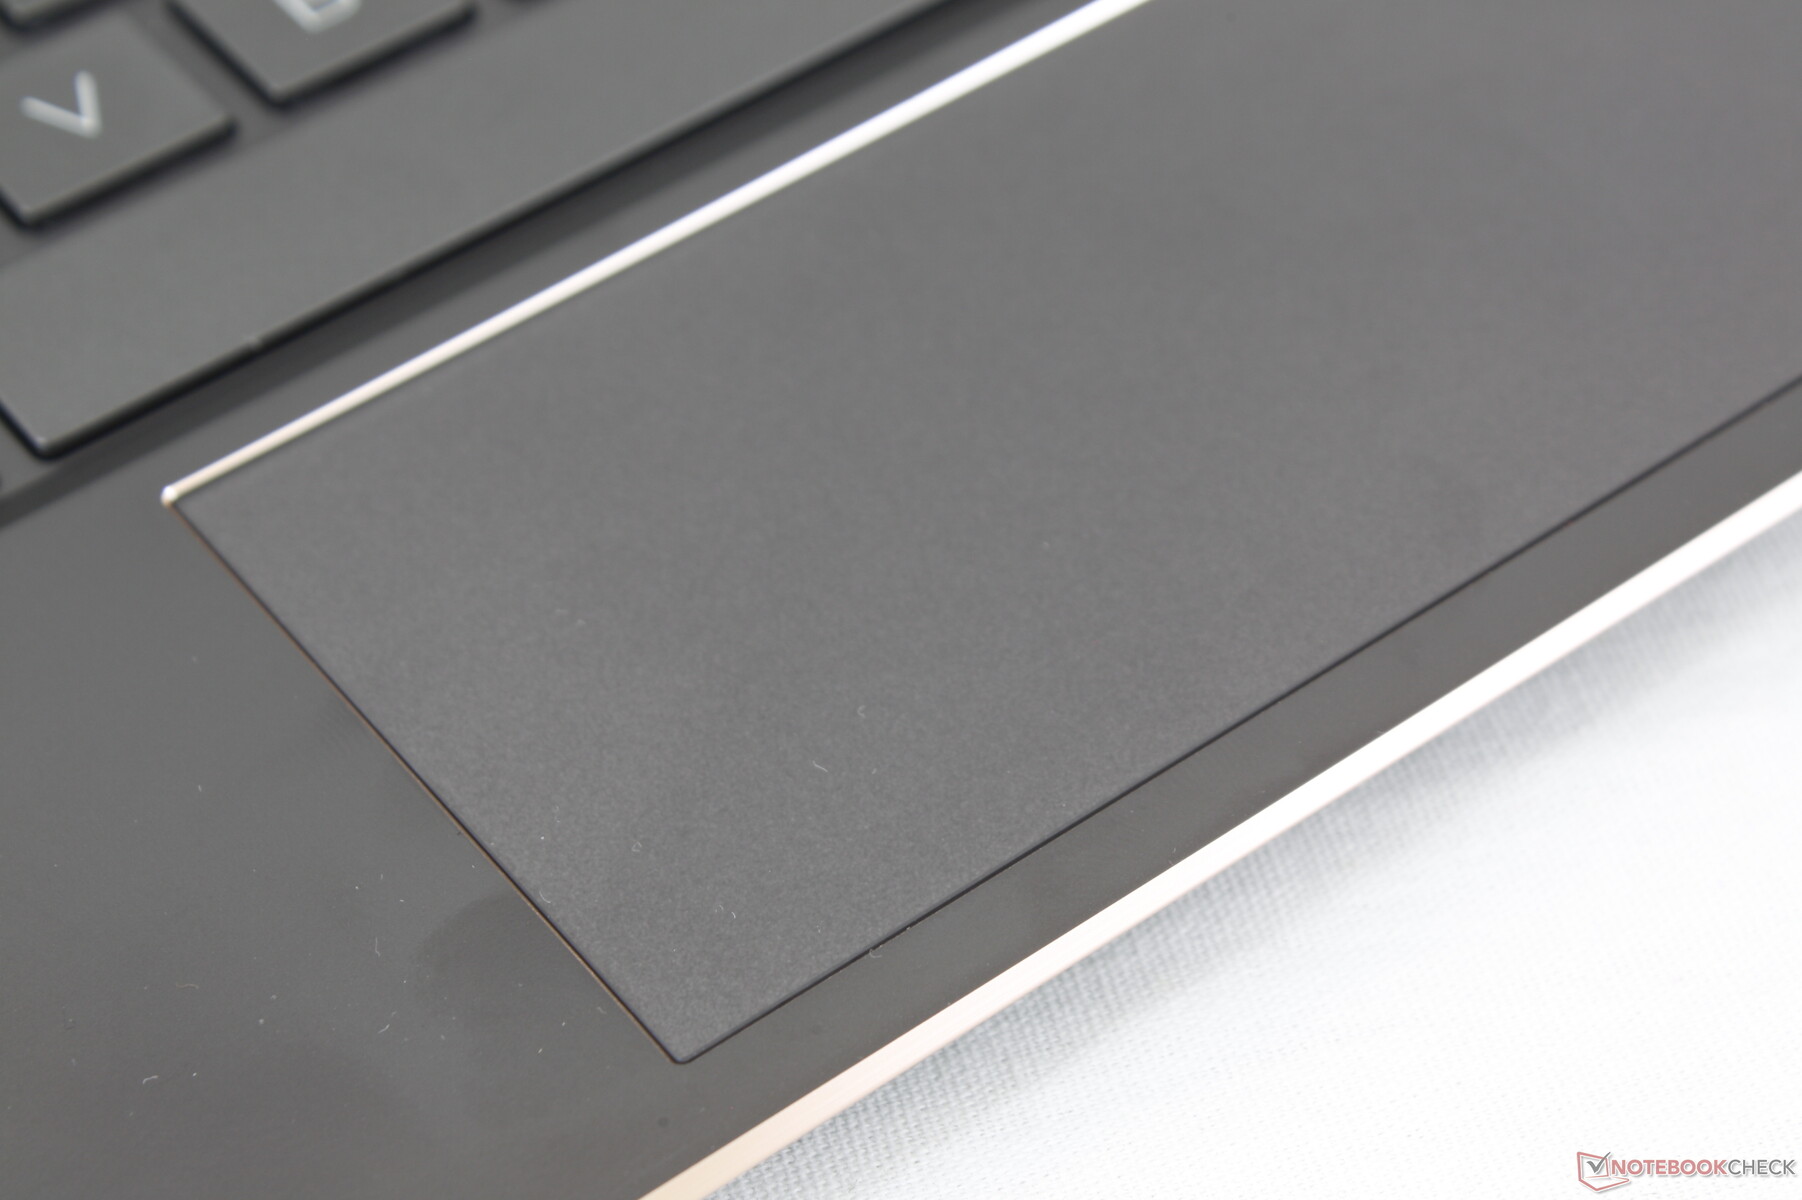
Touchpad
Anche il clickpad rimane identico alla versione 2019 sia nel feedback che nelle dimensioni (~11,1 x 5,6 cm). La sua superficie liscia è buona quando viene premuta e con un rumore forte ma soddisfacente. Il nostro problema principale con il clickpad è che cliccare richiede un po' più forza del solito, il che significa che può diventare faticoso da usare se non si ha un mouse esterno.
Display
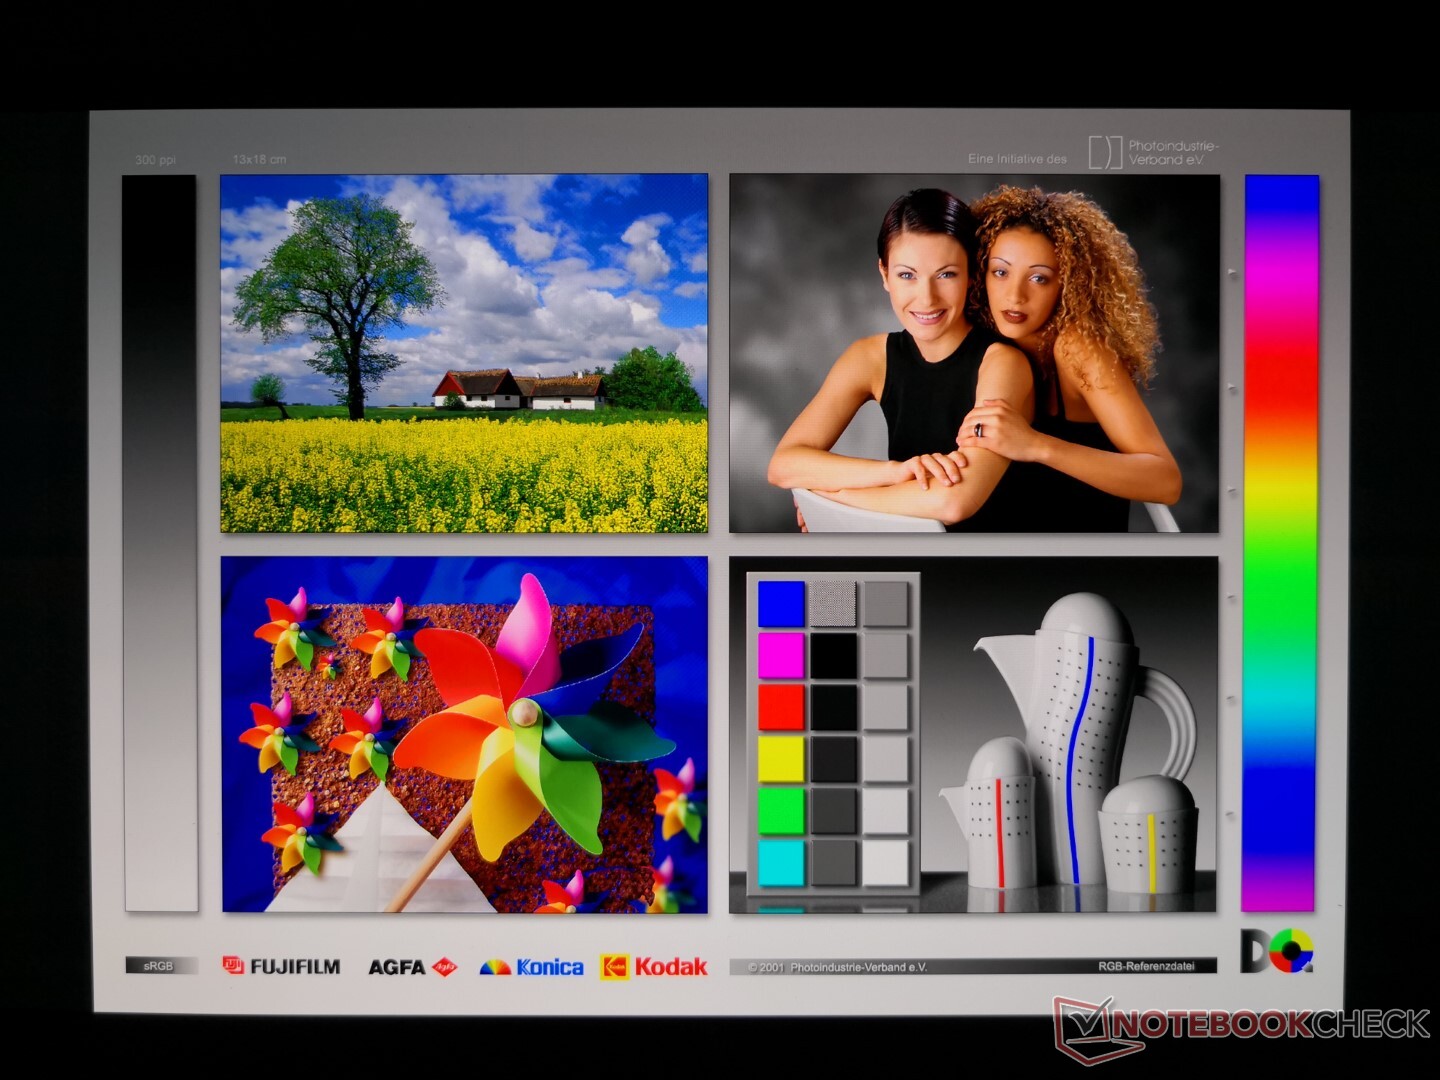
L'OLED offre colori più profondi, un contrasto più elevato e tempi di risposta in bianco e nero e grigio significativamente più veloci rispetto all'IPS per minimizzare il ghosting. Sfortunatamente, questo sembra venire a spese della luminosità, dato che il display OLED arriva al massimo a circa 350 nits rispetto ai 400 della configurazione IPS.
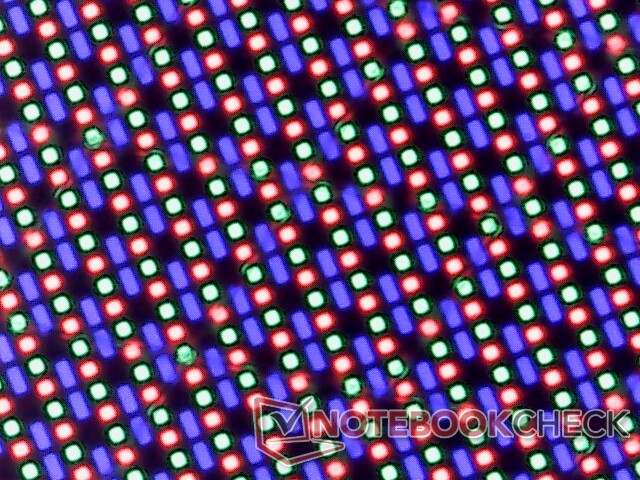
La qualità dell'immagine è buona, ma pensiamo che avrebbe potuto essere migliore. Quando si visualizza un'immagine completamente bianca, c'è una certa granulosità dell'immagine dovuta probabilmente allo strato di vetro touchscreen sovrastante. I testi neri su sfondi bianchi non appaiono poi così nitidi come avrebbero potuto essere, specialmente per un display 4K nativo.
La modulazione di larghezza d'impulso è presente su tutti i livelli di luminosità, simile a quella che abbiamo osservato sul Dell XPS 15 OLED e Razer Blade 15 OLED. In particolare, siamo in grado di misurare una frequenza di modulazione di 242,7 Hz e 59,5 Hz da 0 a 40% di luminosità e da 41 a 100% di luminosità, rispettivamente.

| |||||||||||||||||||||||||
Distribuzione della luminosità: 93 %
Al centro con la batteria: 355 cd/m²
Contrasto: ∞:1 (Nero: 0 cd/m²)
ΔE ColorChecker Calman: 5.74 | ∀{0.5-29.43 Ø4.73}
calibrated: 6.69
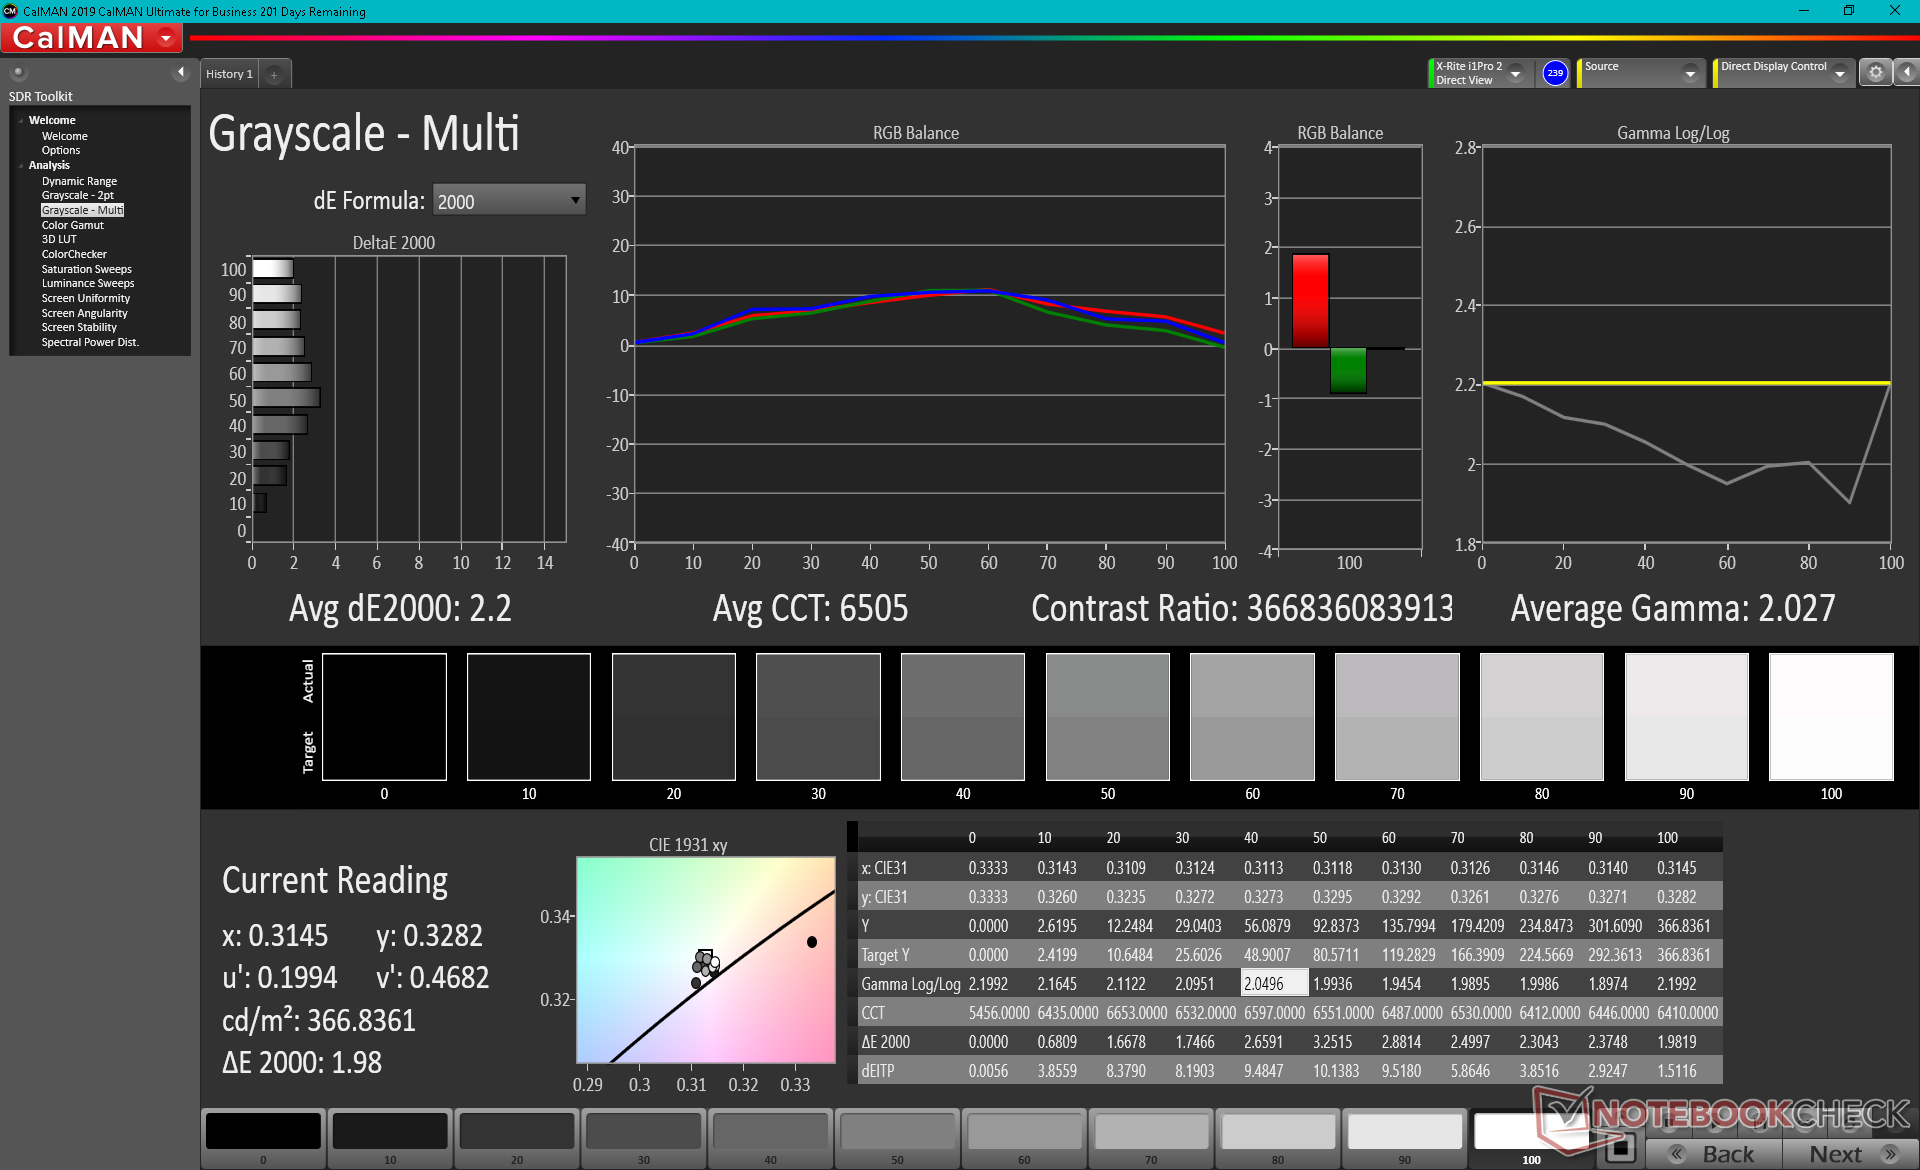
ΔE Greyscale Calman: 2.2 | ∀{0.09-98 Ø4.97}
88.6% sRGB (Argyll 1.6.3 3D)
73.6% AdobeRGB 1998 (Argyll 1.6.3 3D)
81.2% AdobeRGB 1998 (Argyll 3D)
88.5% sRGB (Argyll 3D)
70% Display P3 (Argyll 3D)
Gamma: 2.03
CCT: 6505 K
| HP Spectre x360 13-aw2003dx Samsung SDC4149, OLED, 13.3", 3840x2160 | HP Spectre x360 14t-ea000 LG Philips LGD0663, IPS, 13.5", 1920x1280 | HP Spectre x360 13-aw0013dx AU Optronics AUO5E2D, IPS, 13.3", 1920x1080 | Dell XPS 13 7390 Core i7-10710U AU Optronics B133ZAN, Dell P/N: 90NTH, IPS, 13.3", 3840x2160 | MSI Summit E13 Flip Evo A11MT Sharp LQ134N1JW53, IPS, 13.4", 1920x1200 | Lenovo Yoga Duet 7 13IML05-82AS000WGE CSOT T3 LEN8290, IPS, 13", 2160x1350 | |
|---|---|---|---|---|---|---|
| Display | -4% | -0% | -8% | -0% | -1% | |
| Display P3 Coverage (%) | 70 | 65.8 -6% | 69.6 -1% | 63.4 -9% | 69.8 0% | 68.9 -2% |
| sRGB Coverage (%) | 88.5 | 98.2 11% | 98.9 12% | 93.7 6% | 98.8 12% | 98.2 11% |
| AdobeRGB 1998 Coverage (%) | 81.2 | 67.9 -16% | 71.5 -12% | 64.3 -21% | 70.6 -13% | 71.1 -12% |
| Response Times | -1714% | -1643% | -1422% | -1829% | -1400% | |
| Response Time Grey 50% / Grey 80% * (ms) | 2.8 ? | 62 ? -2114% | 60.8 ? -2071% | 51.6 ? -1743% | 64 ? -2186% | 58 ? -1971% |
| Response Time Black / White * (ms) | 2.8 ? | 39.6 ? -1314% | 36.8 ? -1214% | 33.6 ? -1100% | 44 ? -1471% | 26 ? -829% |
| PWM Frequency (Hz) | 242.7 ? | |||||
| Screen | 14% | -4% | -19% | 39% | -9% | |
| Brightness middle (cd/m²) | 355 | 443.5 25% | 447.4 26% | 408.2 15% | 551.3 55% | 450 27% |
| Brightness (cd/m²) | 368 | 394 7% | 420 14% | 399 8% | 517 40% | 411 12% |
| Brightness Distribution (%) | 93 | 78 -16% | 85 -9% | 89 -4% | 91 -2% | 83 -11% |
| Black Level * (cd/m²) | 0.17 | 0.31 | 0.39 | 0.37 | 0.22 | |
| Colorchecker dE 2000 * | 5.74 | 2.7 53% | 4.23 26% | 4.6 20% | 1.45 75% | 4.15 28% |
| Colorchecker dE 2000 max. * | 9.52 | 4.36 54% | 9.34 2% | 11.84 -24% | 2.86 70% | 11.49 -21% |
| Colorchecker dE 2000 calibrated * | 6.69 | 2.61 61% | 1.32 80% | 2.03 70% | 1.7 75% | 1.09 84% |
| Greyscale dE 2000 * | 2.2 | 3.4 -55% | 6.1 -177% | 7.5 -241% | 1.3 41% | 6.66 -203% |
| Gamma | 2.03 108% | 2.09 105% | 2.11 104% | 2.12 104% | 2.14 103% | 2.42 91% |
| CCT | 6505 100% | 6144 106% | 6136 106% | 7966 82% | 6580 99% | 6043 108% |
| Color Space (Percent of AdobeRGB 1998) (%) | 73.6 | 62.1 -16% | 64.8 -12% | 59.5 -19% | 65 -12% | 65 -12% |
| Color Space (Percent of sRGB) (%) | 88.6 | 98.5 11% | 98.9 12% | 93.5 6% | 99 12% | 98 11% |
| Contrast (:1) | 2609 | 1443 | 1047 | 1490 | 2045 | |
| Media totale (Programma / Settaggio) | -568% /
-237% | -549% /
-237% | -483% /
-217% | -597% /
-236% | -470% /
-206% |
* ... Meglio usare valori piccoli
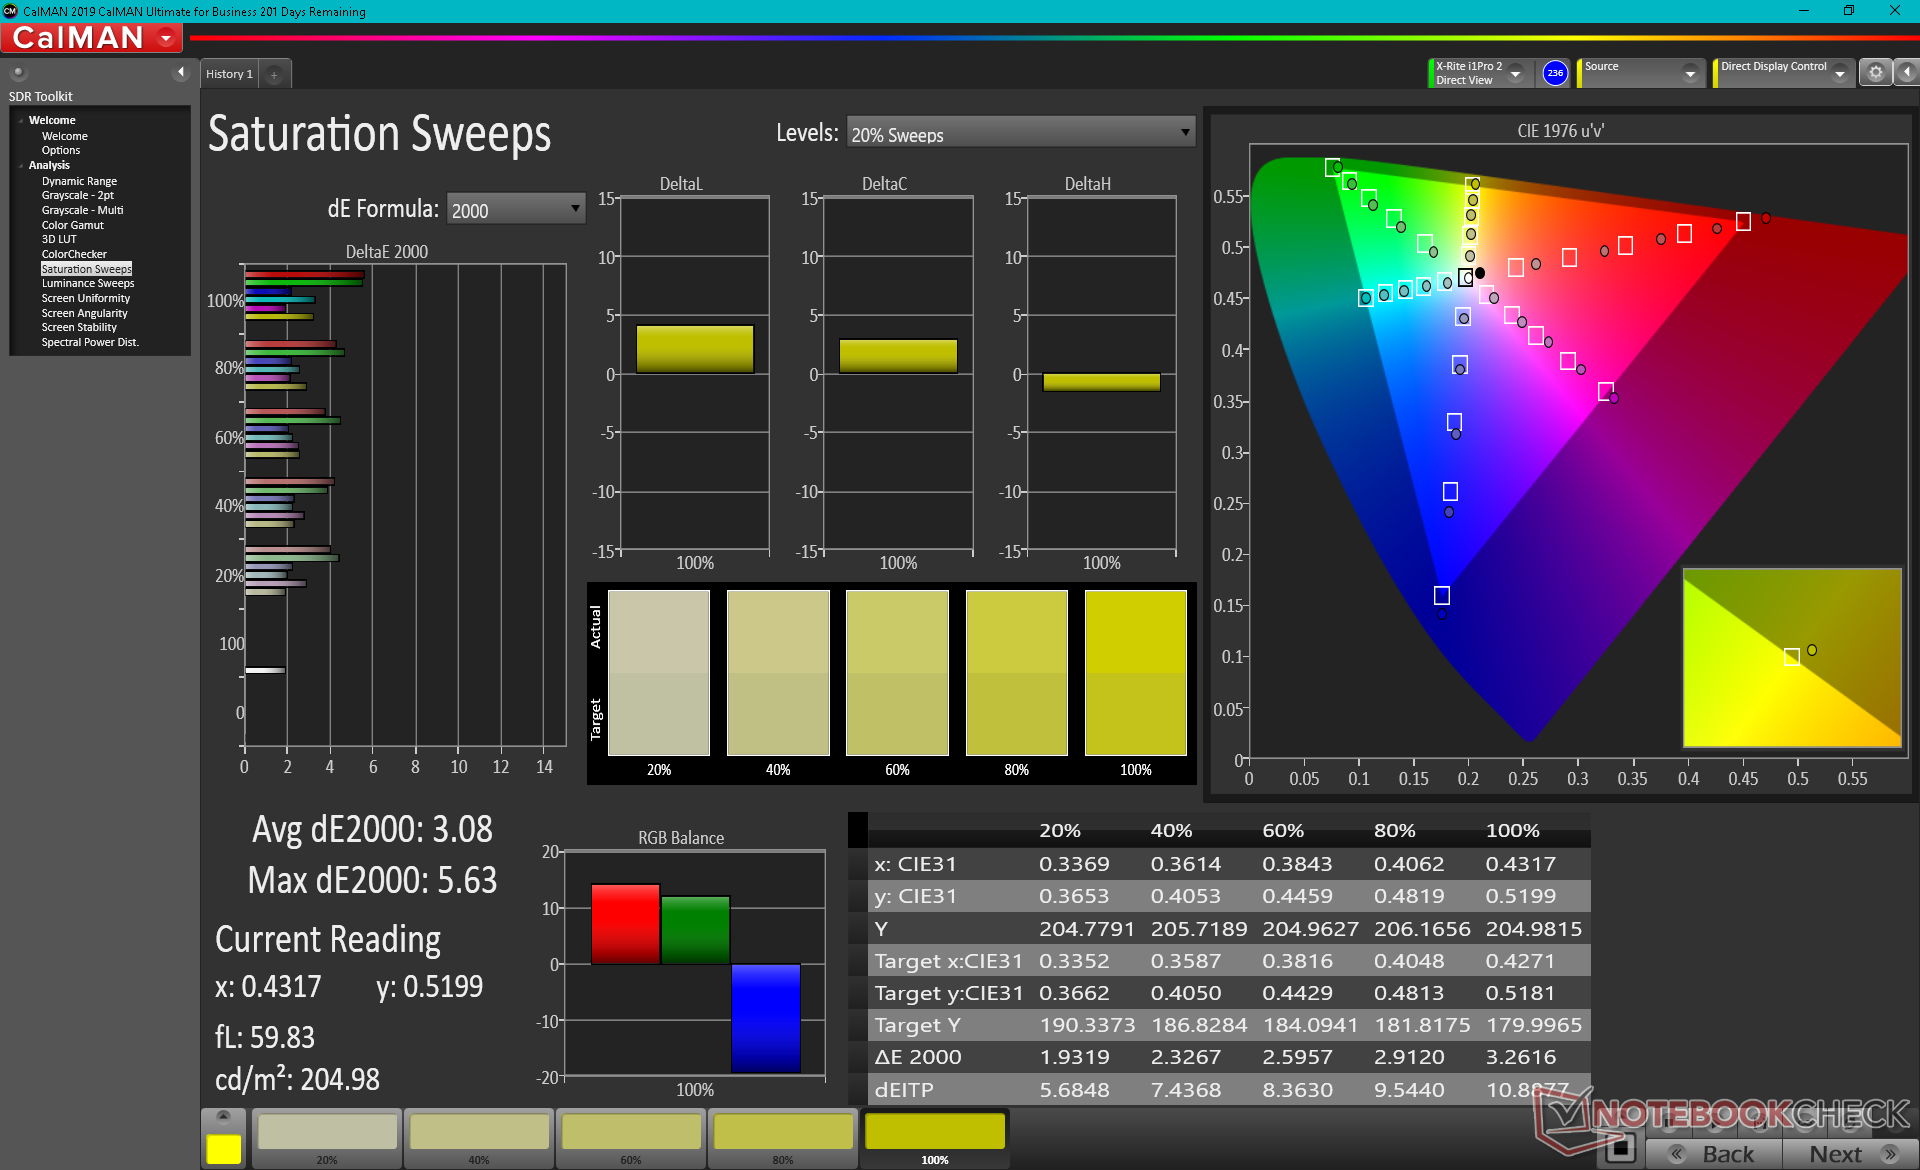
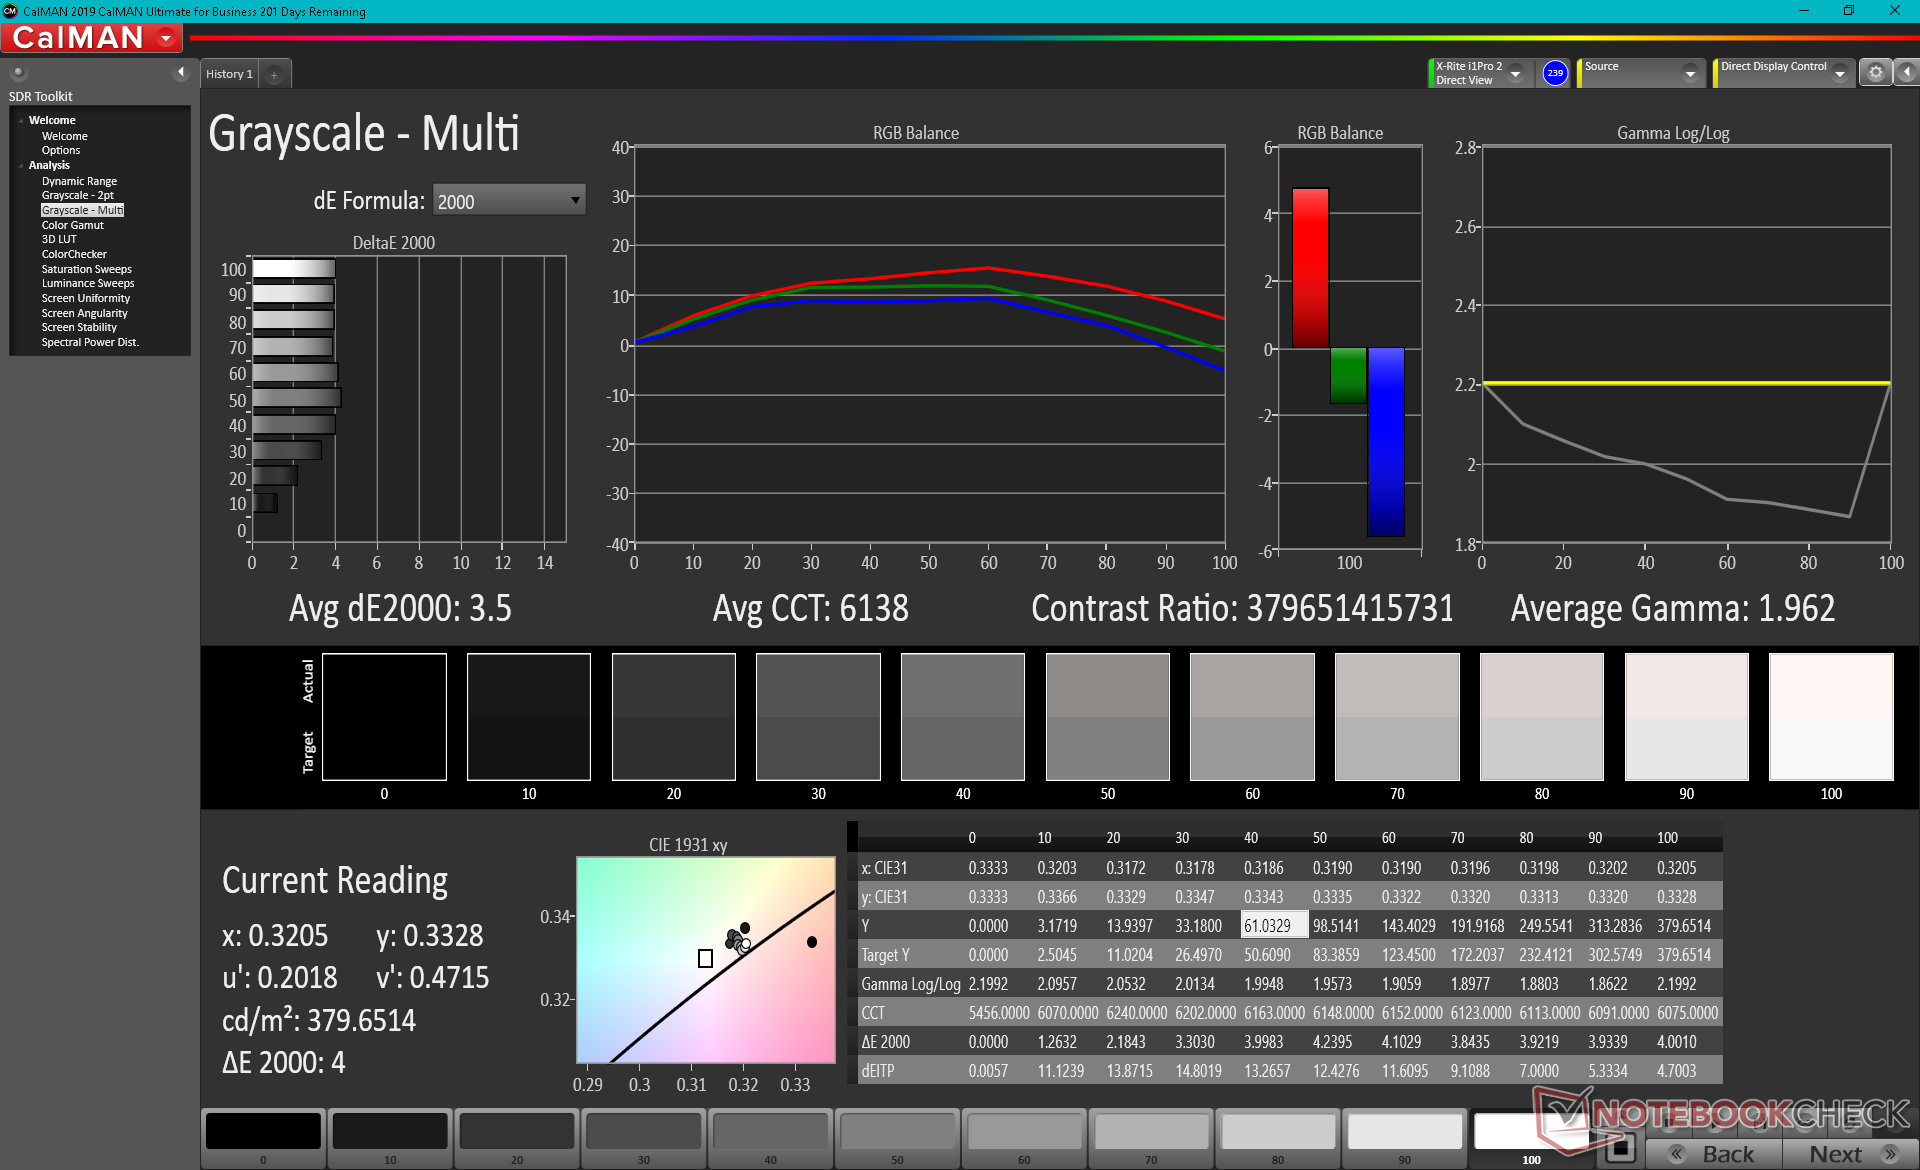
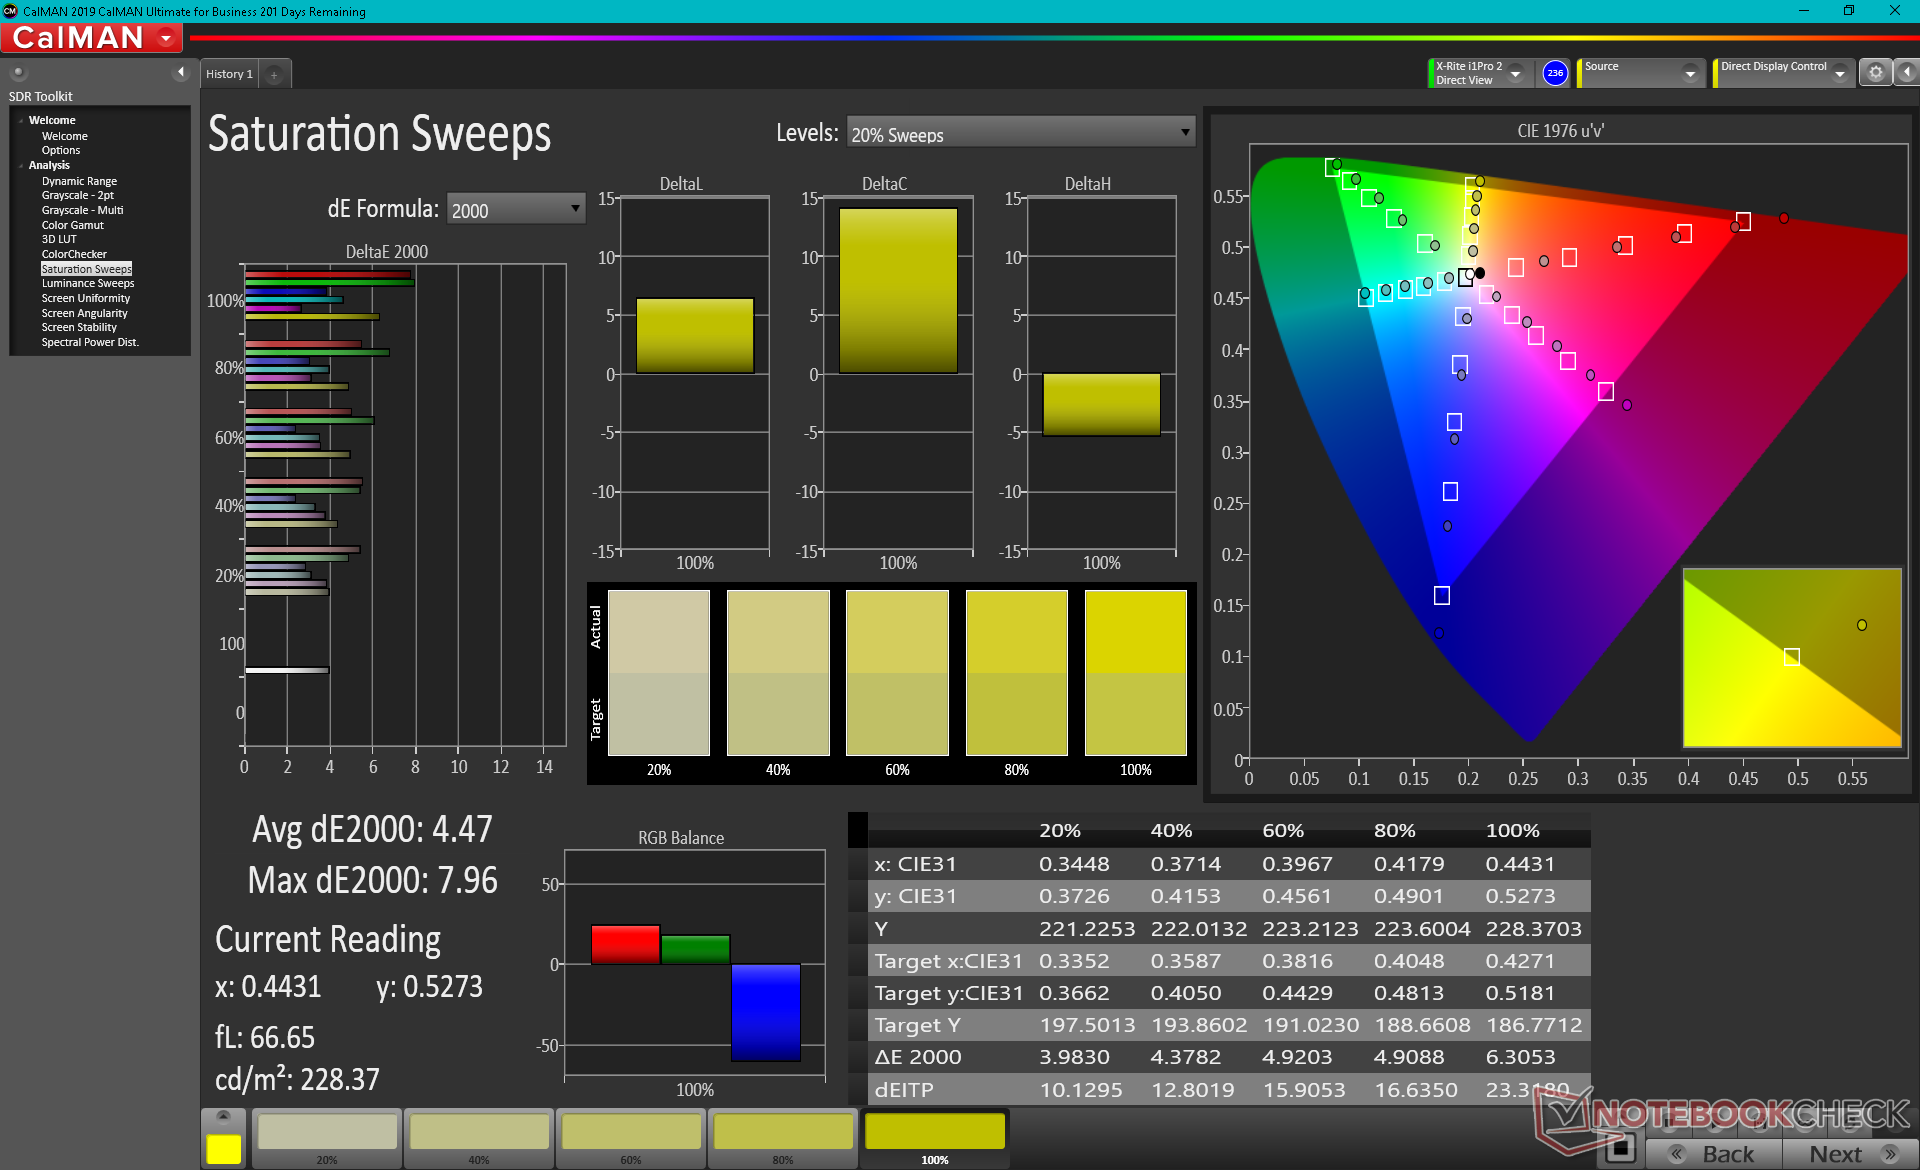
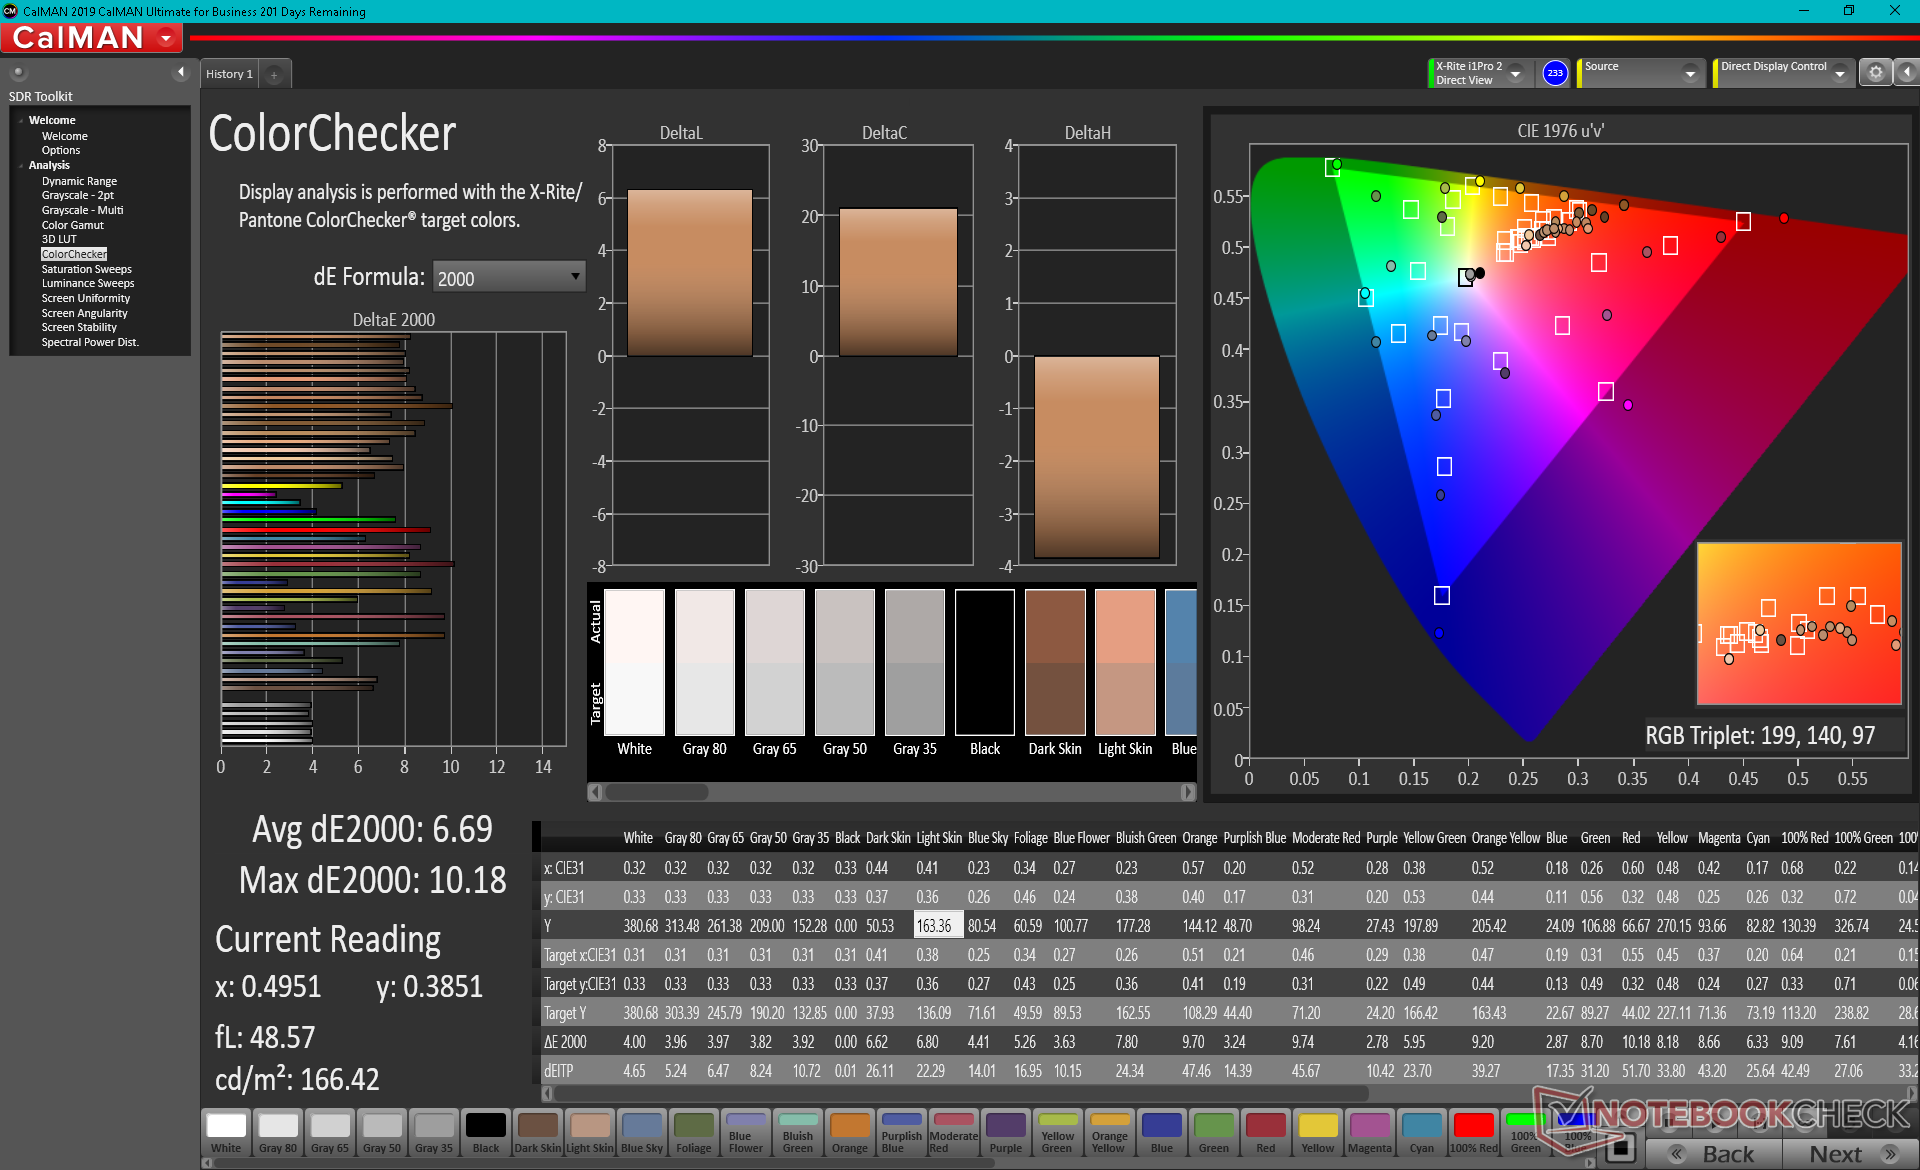
HP pubblicizza una copertura DCI-P3 completa, mentre le nostre misurazioni indipendenti mostrano una copertura AdobeRGB del 74% quando è impostata sul profilo colore AdobeRGB. Gli utenti possono passare rapidamente tra i profili di colore sRGB, AdobeRGB, DCI-P3 e Native con un semplice clic destro sul desktop.
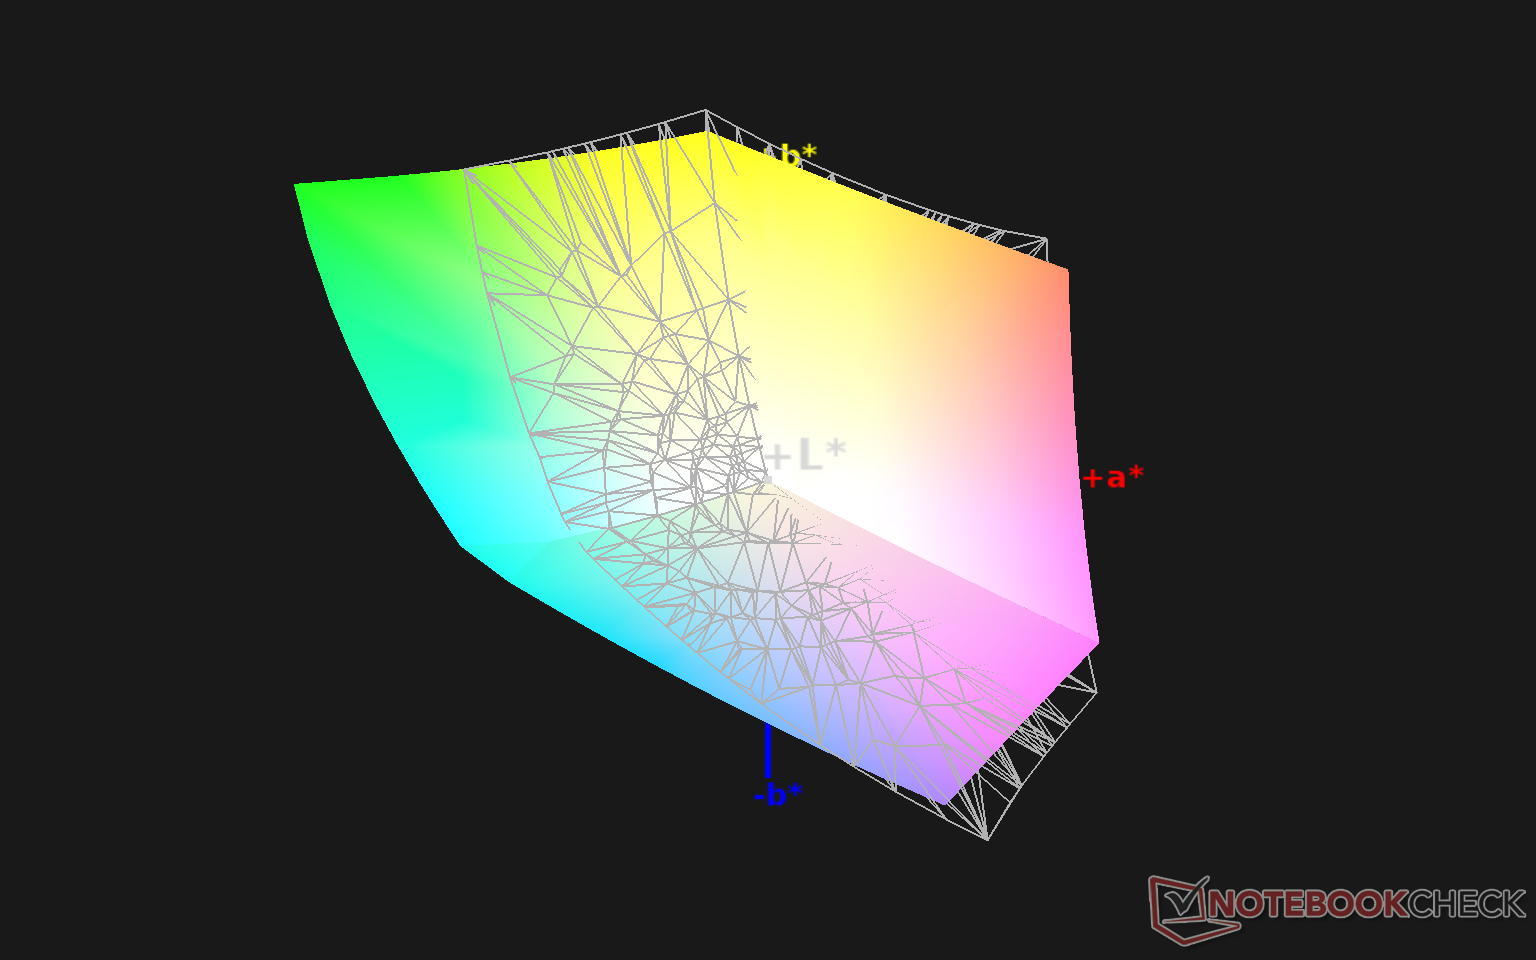
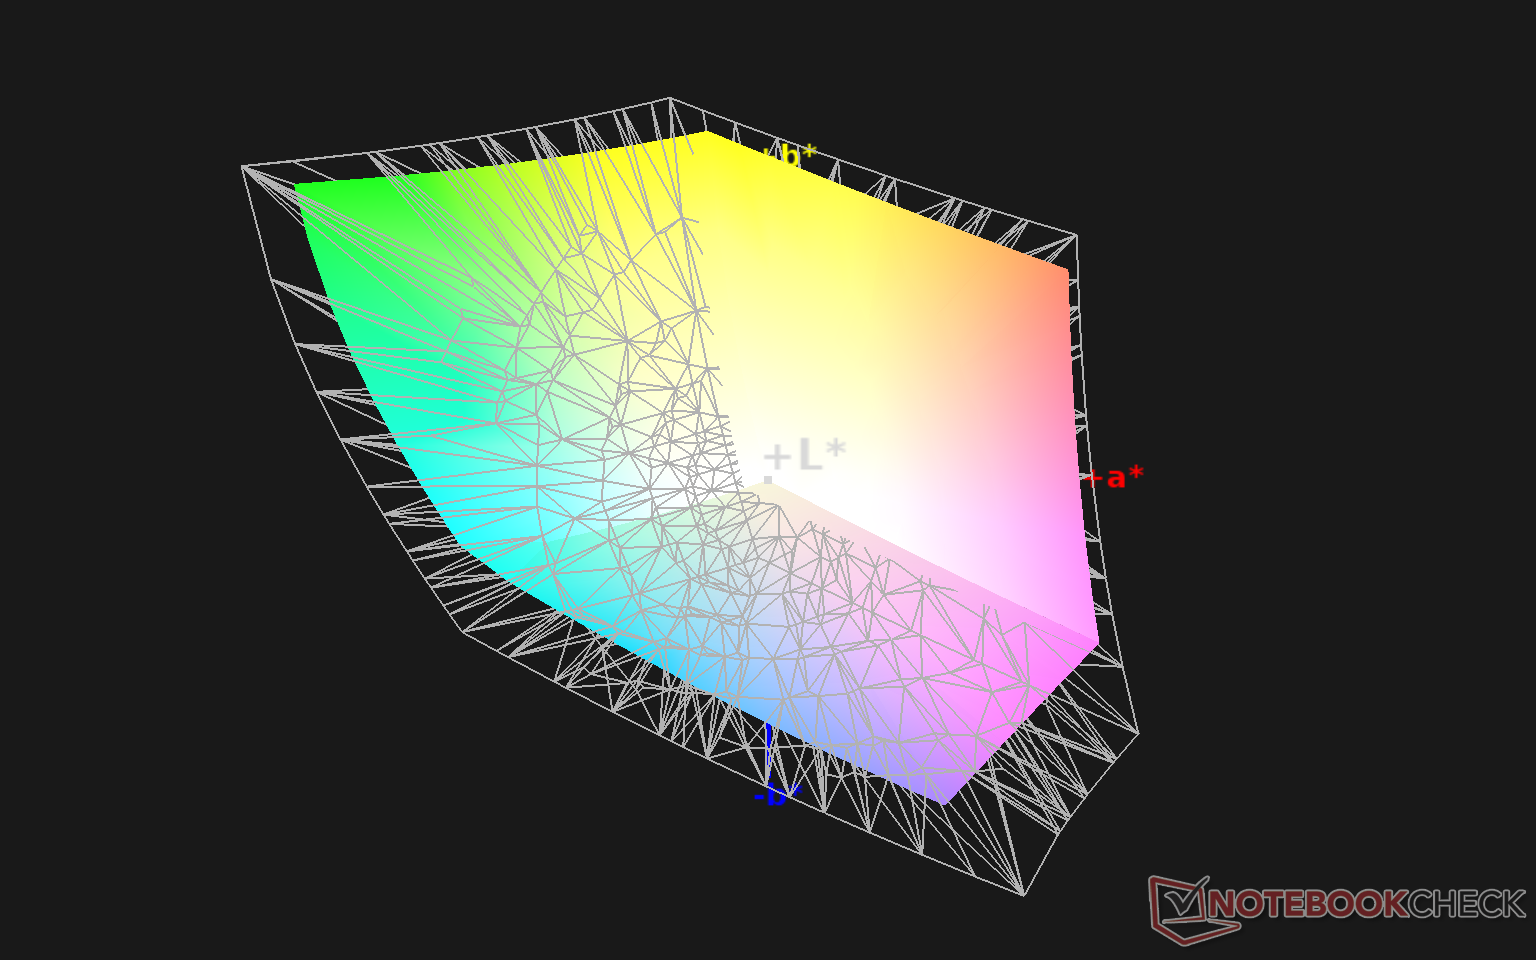
Le misurazioni del colorimetro X-Rite in modalità AdobeRGB mostrano un eccellente DeltaE medio in scala di grigi di appena 2,2, ma i colori non sono così precisi come avrebbero potuto essere. I colori possono diventare più imprecisi dopo aver provato a calibrare il display OLED da soli, il che significa che qualsiasi tentativo dell'utente finale potrebbe essere un po' difficile.

Tempi di risposta del Display
| ↔ Tempi di risposta dal Nero al Bianco | ||
|---|---|---|
| 2.8 ms ... aumenta ↗ e diminuisce ↘ combinato | ↗ 1.3 ms Incremento | 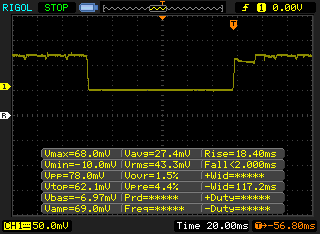 |
| ↘ 1.5 ms Calo | ||
| Lo schermo ha mostrato valori di risposta molto veloci nei nostri tests ed è molto adatto per i gaming veloce. In confronto, tutti i dispositivi di test variano da 0.1 (minimo) a 240 (massimo) ms. » 14 % di tutti i dispositivi è migliore. Questo significa che i tempi di risposta rilevati sono migliori rispettto alla media di tutti i dispositivi testati (19.9 ms). | ||
| ↔ Tempo di risposta dal 50% Grigio all'80% Grigio | ||
| 2.8 ms ... aumenta ↗ e diminuisce ↘ combinato | ↗ 1.4 ms Incremento | 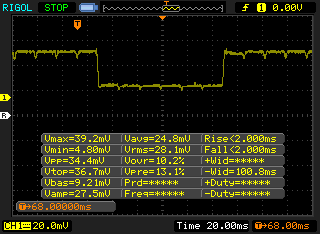 |
| ↘ 1.4 ms Calo | ||
| Lo schermo ha mostrato valori di risposta molto veloci nei nostri tests ed è molto adatto per i gaming veloce. In confronto, tutti i dispositivi di test variano da 0.165 (minimo) a 636 (massimo) ms. » 12 % di tutti i dispositivi è migliore. Questo significa che i tempi di risposta rilevati sono migliori rispettto alla media di tutti i dispositivi testati (31.1 ms). | ||
Sfarfallio dello schermo / PWM (Pulse-Width Modulation)
| flickering dello schermo / PWM rilevato | 242.7 Hz | ≤ 40 % settaggio luminosita' | 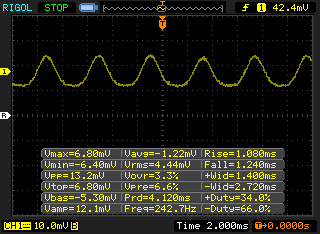 |
Il display sfarfalla a 242.7 Hz (Probabilmente a causa dell'uso di PWM) Flickering rilevato ad una luminosita' di 40 % o inferiore. Non dovrebbe verificarsi flickering o PWM sopra questo valore di luminosita'. La frequenza di 242.7 Hz è relativamente bassa, quindi gli utenti sensibili potrebbero notare il flickering ed accusare stanchezza agli occhi a questo livello di luminosità e a livelli inferiori. In confronto: 52 % di tutti i dispositivi testati non utilizza PWM per ridurre la luminosita' del display. Se è rilevato PWM, una media di 7798 (minimo: 5 - massimo: 343500) Hz è stata rilevata. | |||
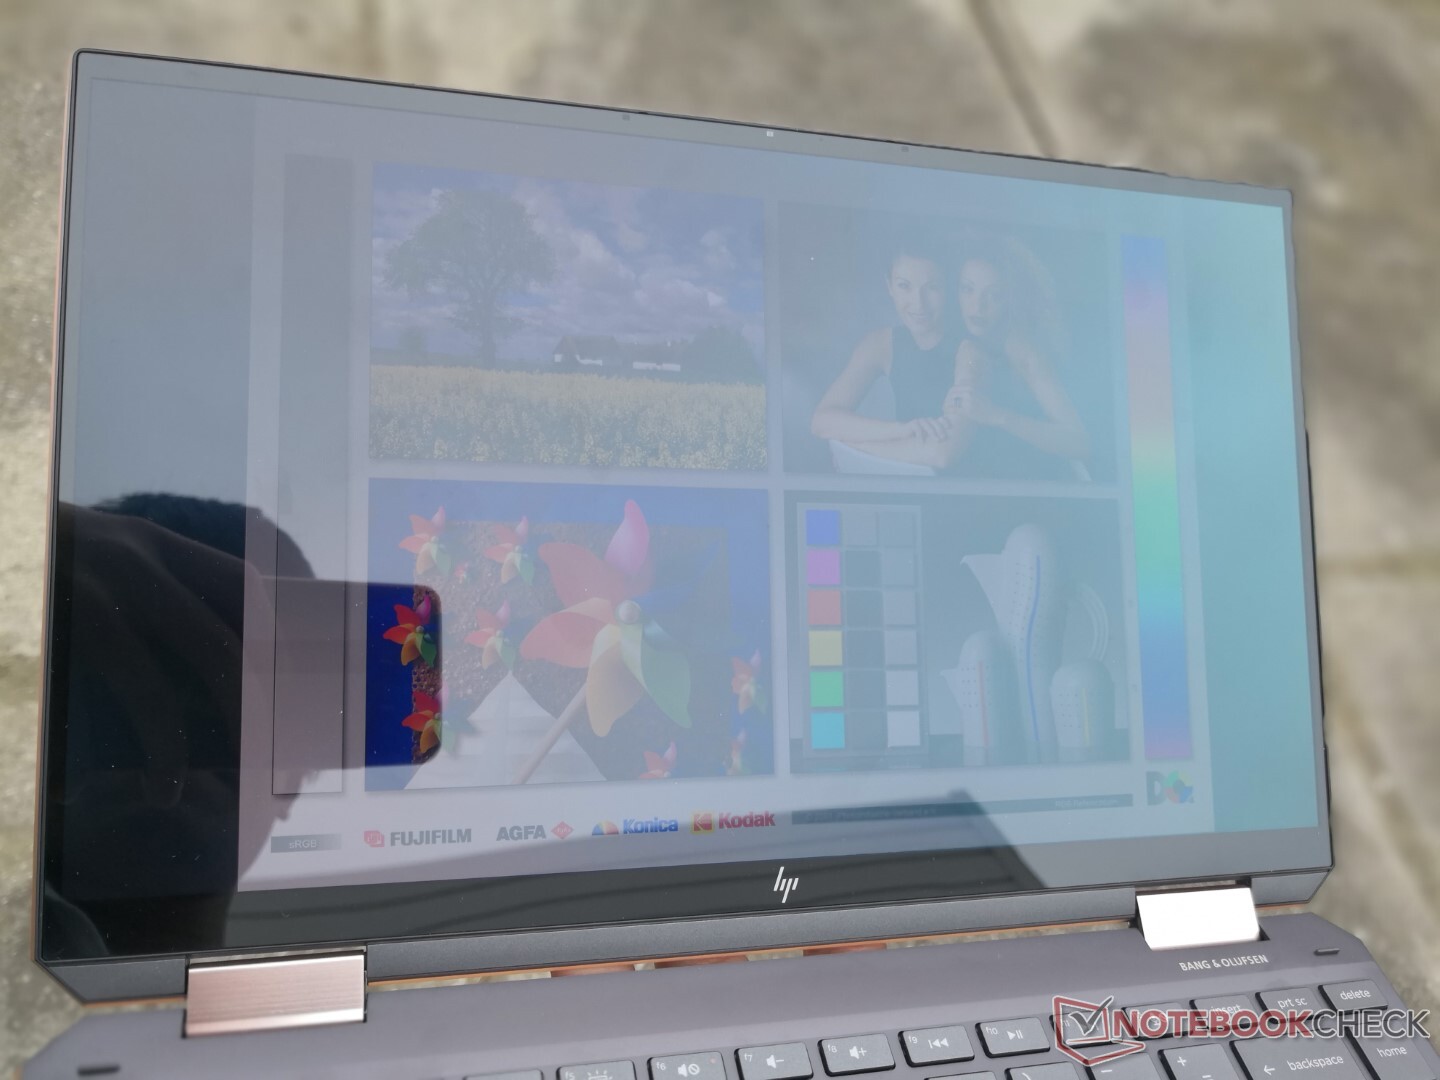
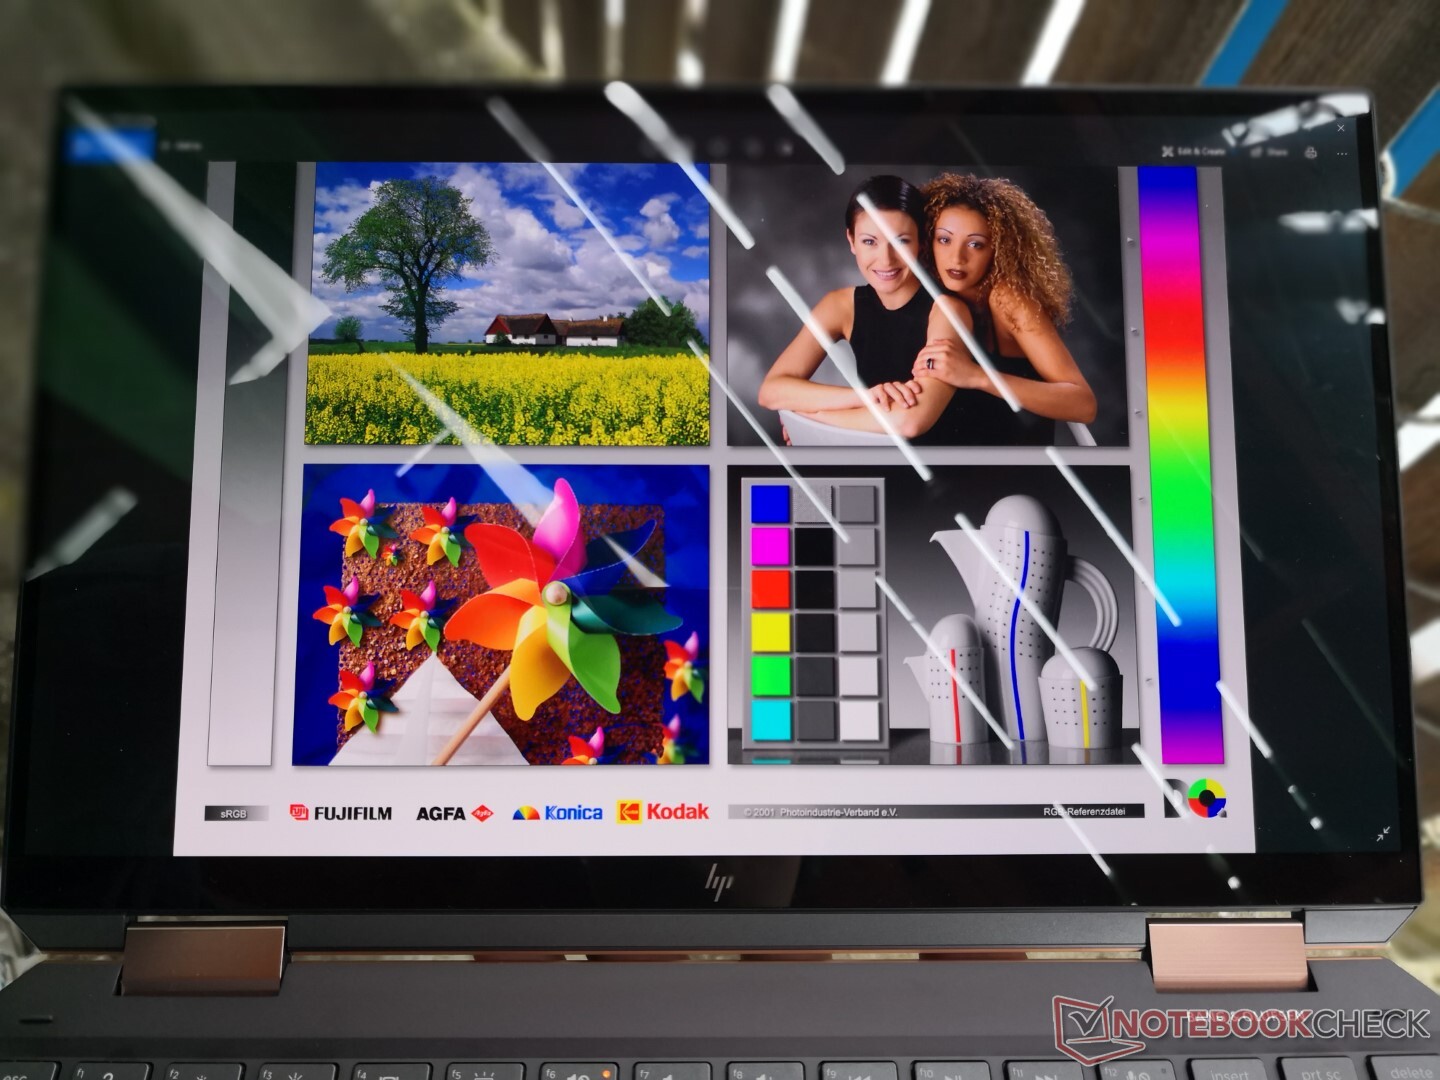
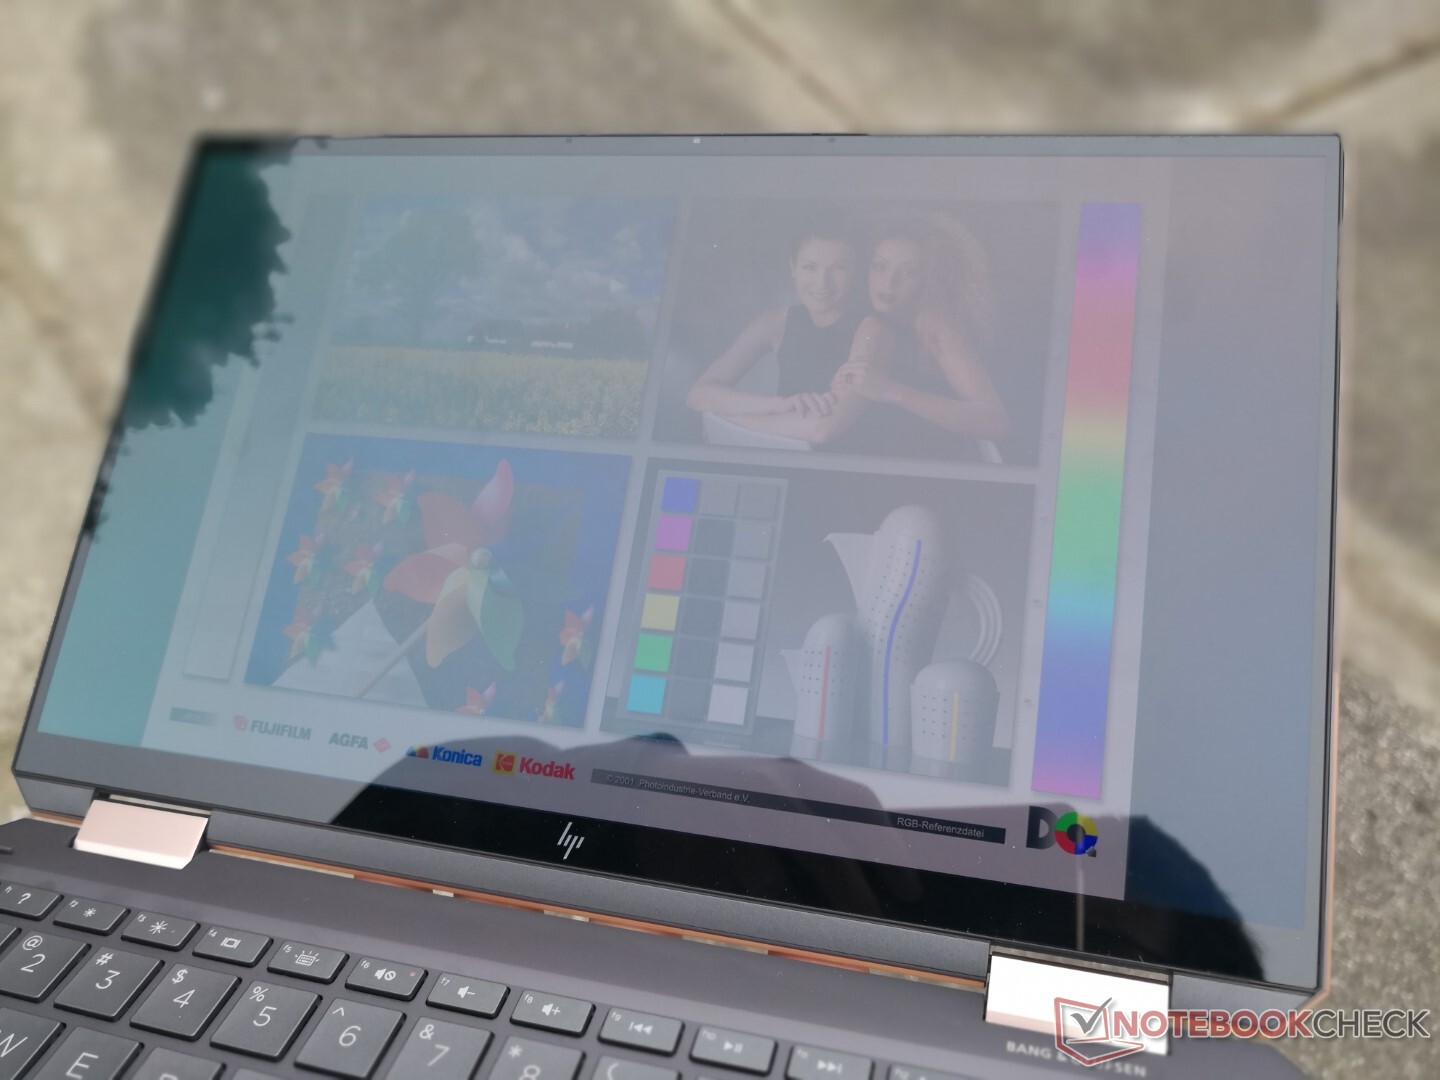
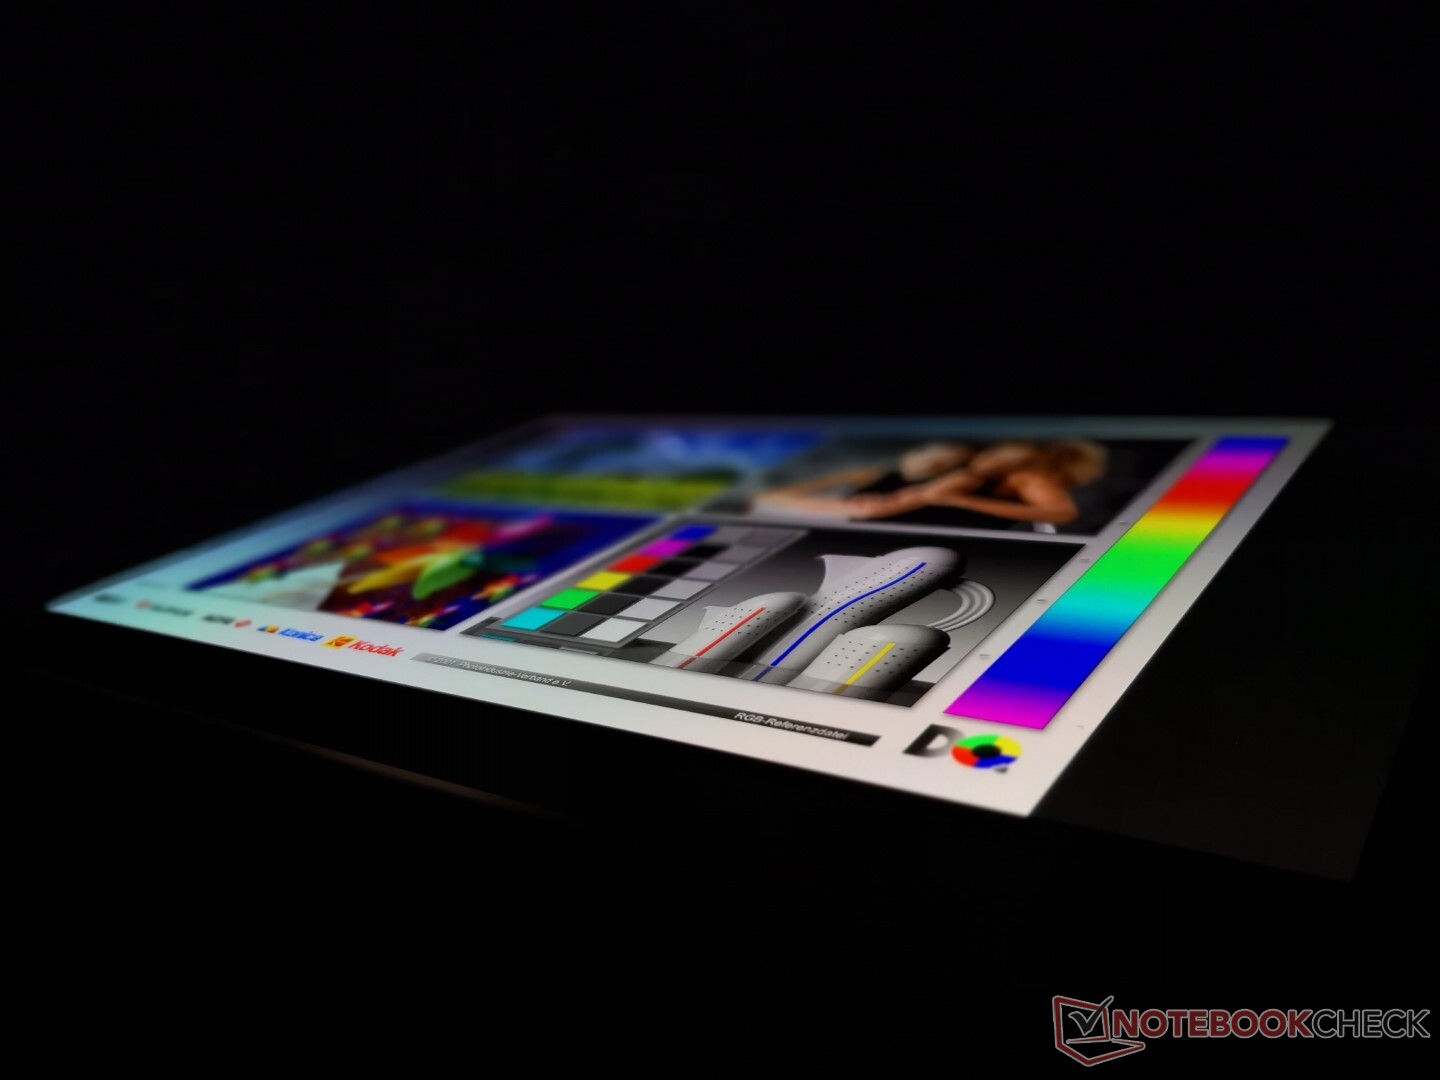
La visibilità esterna è eccellente quando è all'ombra, in parte grazie al livello di nero perfetto dell'OLED. I colori sullo schermo non si sbiadiscono o diventano grigi facilmente come come sulla maggior parte dei display IPS. Tuttavia, i riflessi sono sempre presenti e anche un po' peggio che sullo Spectre x360 13 SKU IPS poiché la luminosità massima è un po' più bassa sull'OLED.

Prestazini
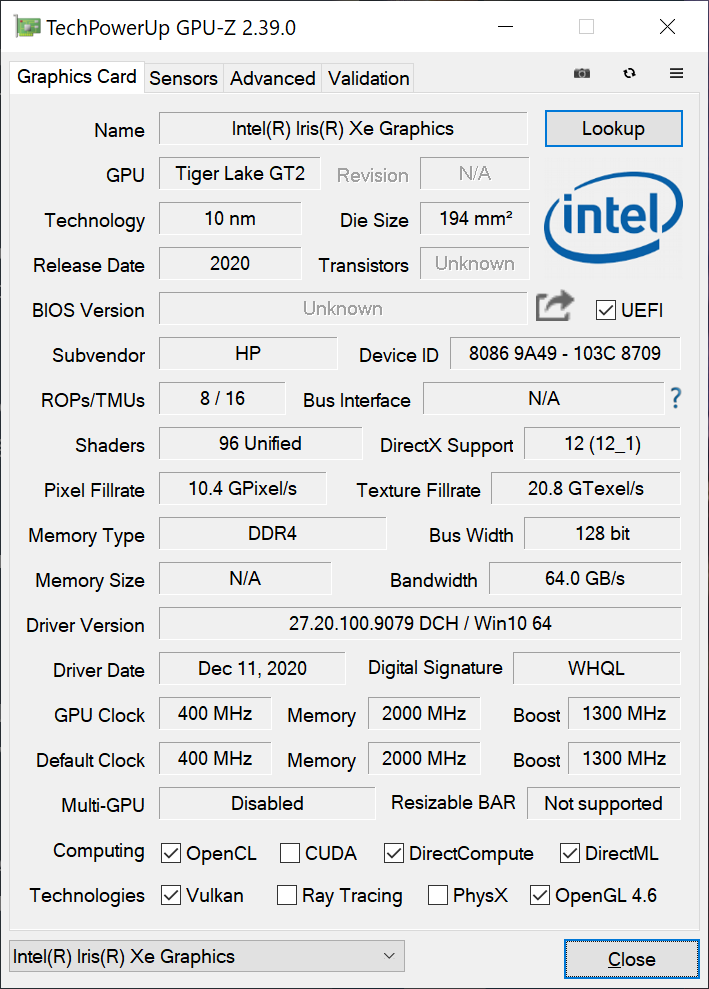
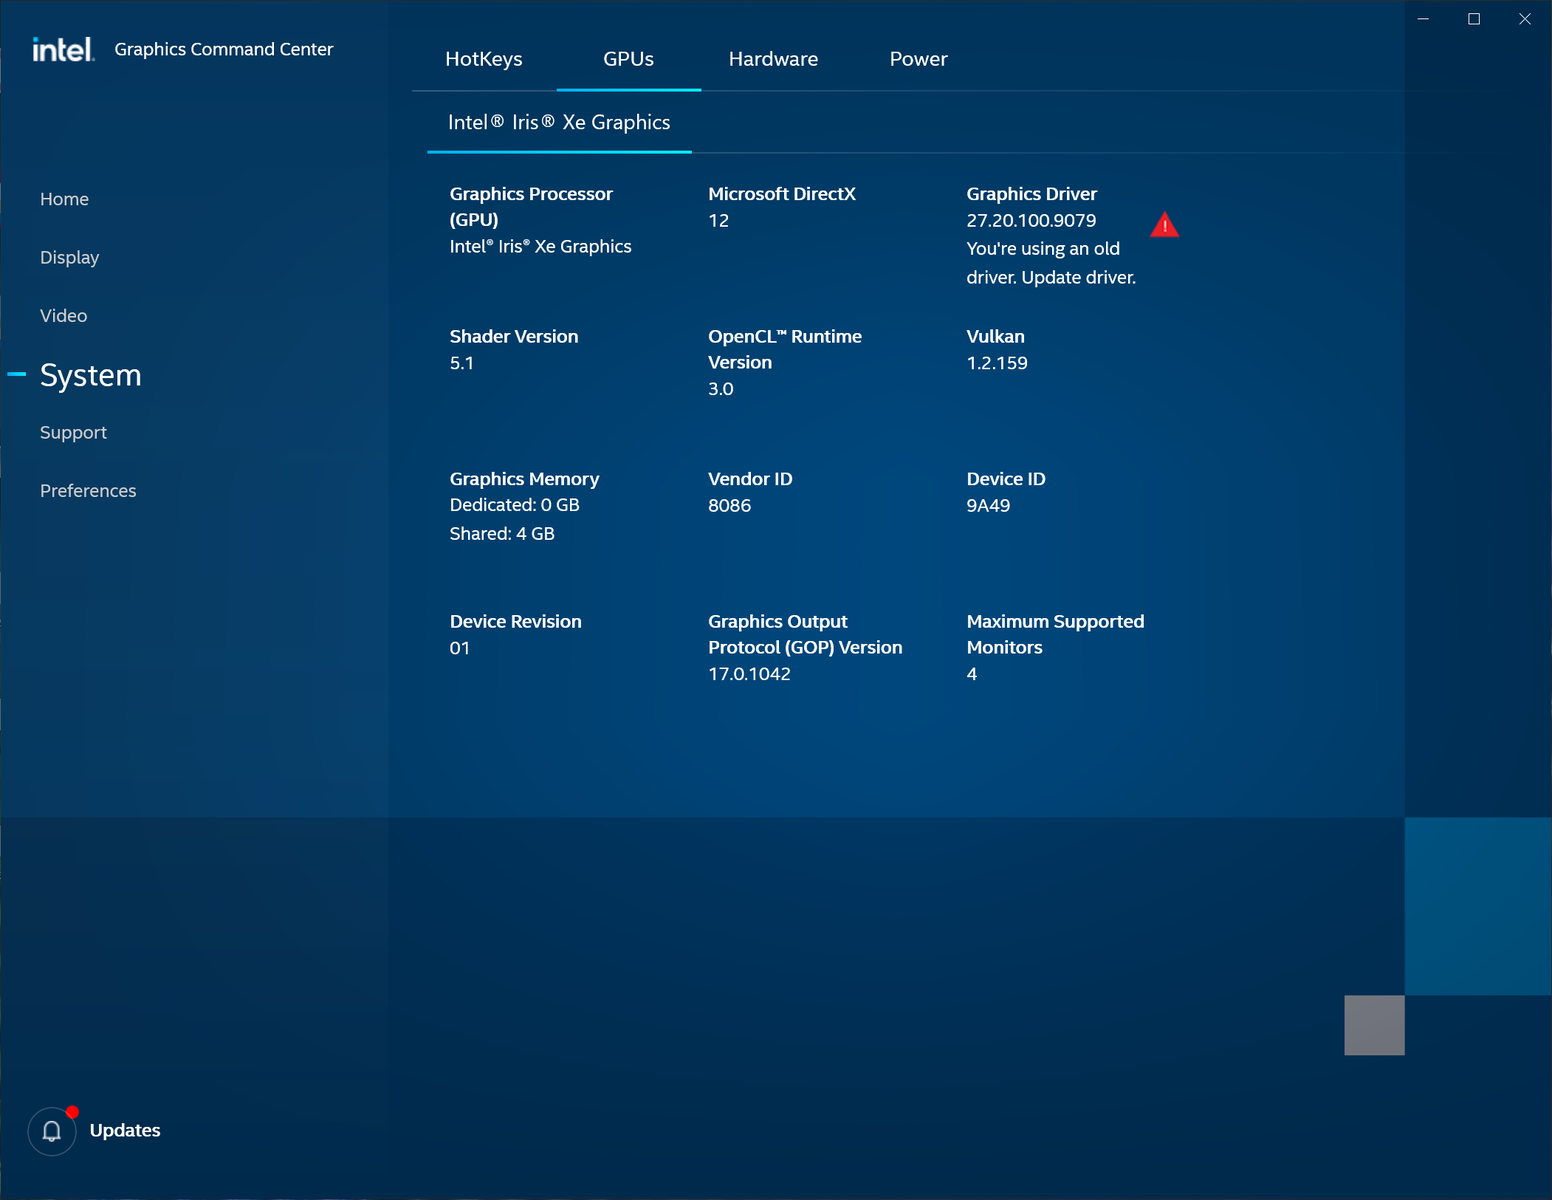
A differenza della più grande e potente serie Spectre x360 15, lo Spectre x360 13 si è sempre concentrato solo su CPU di classe U ULV senza opzioni grafiche dedicate. In questo caso, gli utenti possono scegliere tra il 10° gen Tiger Lake Core i5-1135G7 o Core i7-1165G7 con grafica integrata Iris Xe per sostituire le opzioni 10° gen Ice Lake e Iris Plus dello scorso anno.
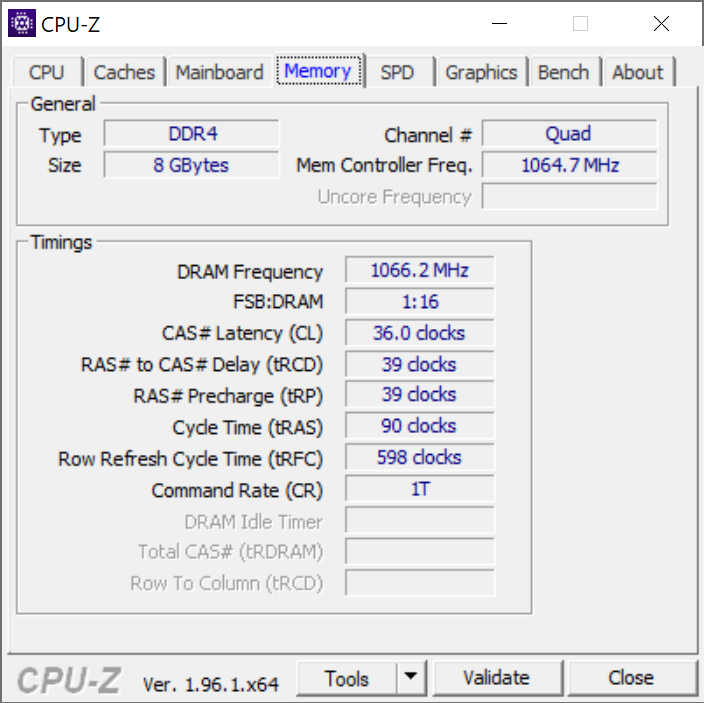
Gli utenti dovrebbero selezionare la RAM con attenzione poiché i moduli sono saldati. Tuttavia, apprezziamo il fatto che l'opzione di fascia bassa da 8 GB sia dual-channel e non single-channel per aiutare le prestazioni della grafica integrata.
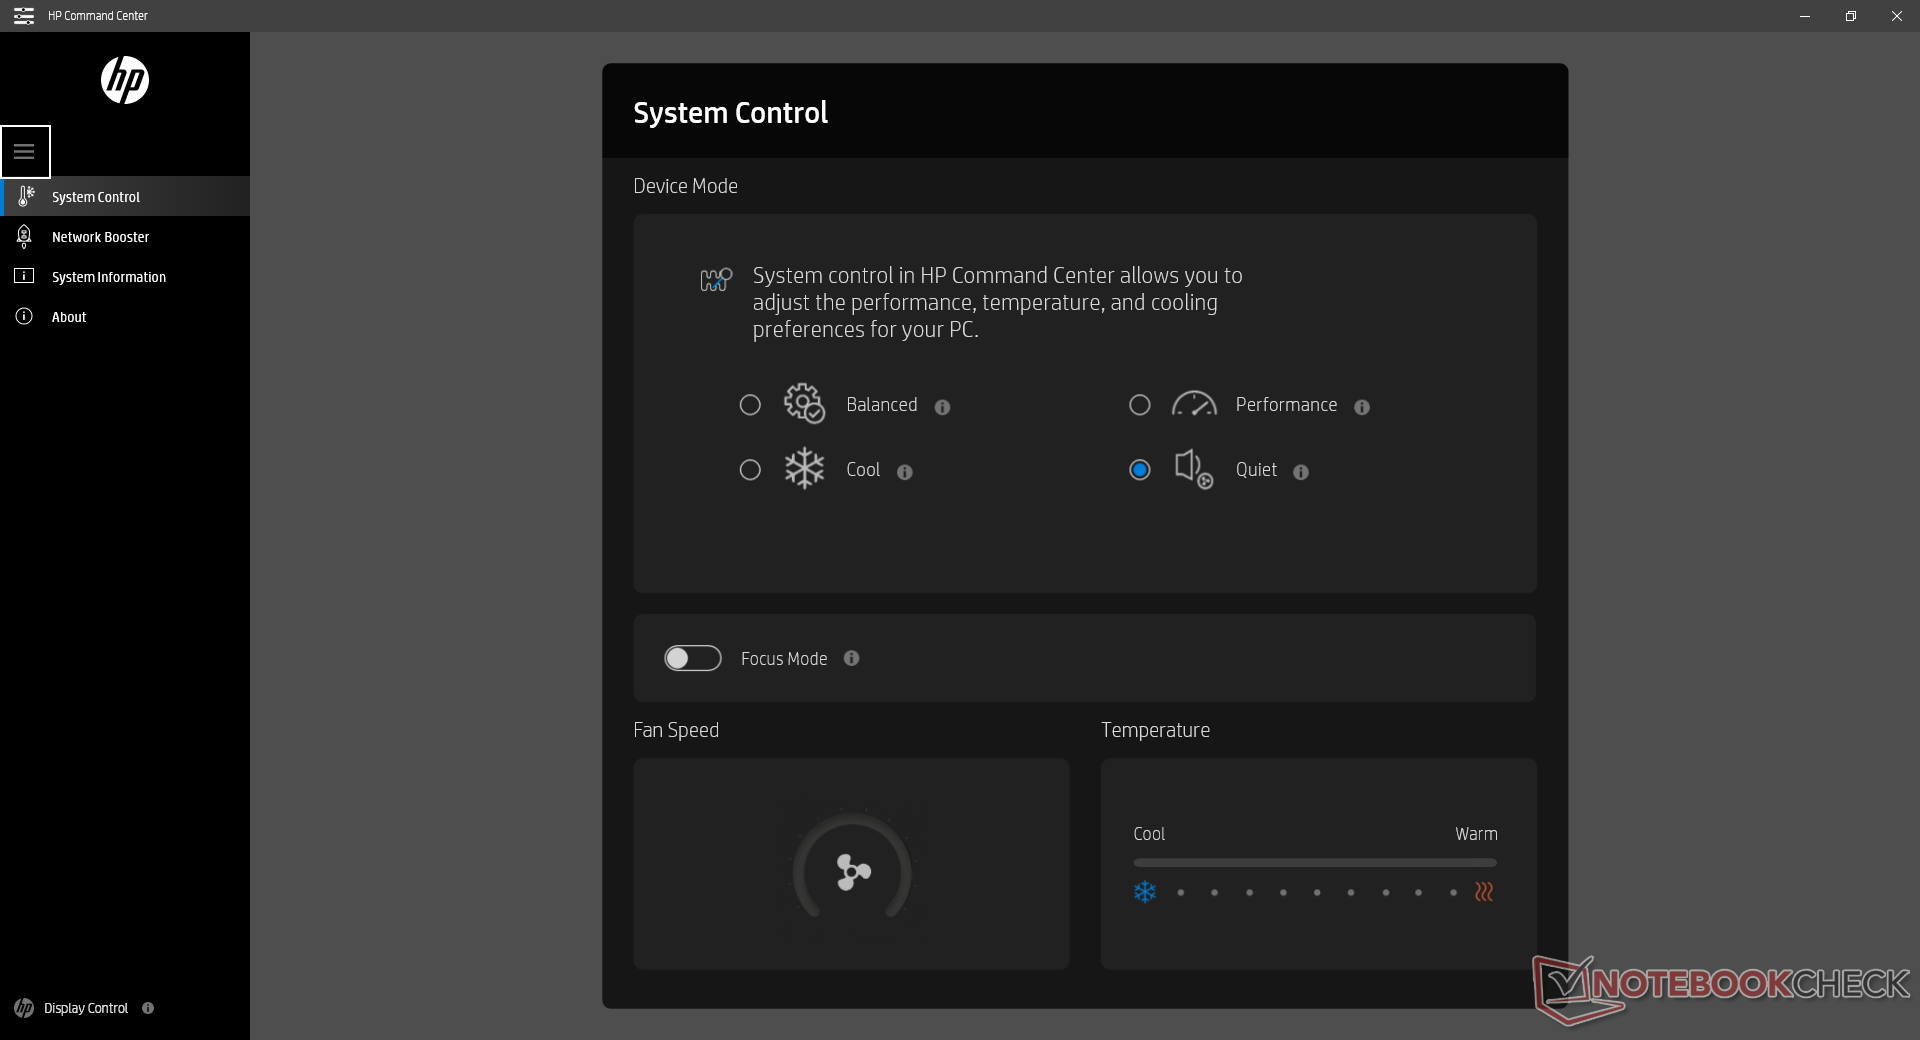
La nostra unità è stata impostata in modalità Performance tramite HP Command Center per ottenere i più alti punteggi possibili. Raccomandiamo ai proprietari di familiarizzare con Command Center, poiché le prestazioni del sistema sono strettamente legate all'applicazione.
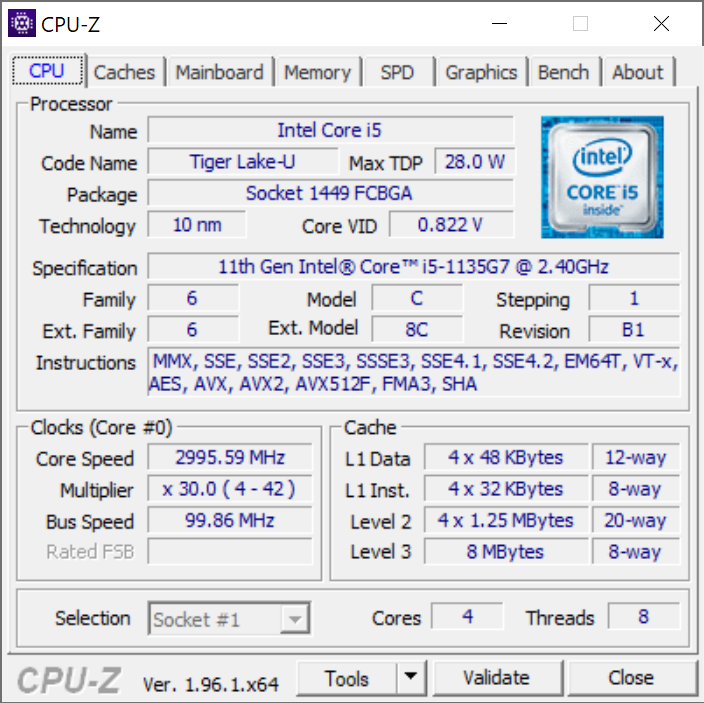
Processore
Le prestazioni multi-thread crude sono entro percentuali a una cifra della media del Core i5-1135G7 nel nostro database. Optando per il Core i7-1165G7 dovrebbo aversi fino al 30% di prestazioni in più della CPU, ipotizzando che la soluzione di raffreddamento possa tenere il passo. Gli utenti che passano da un vecchio Core i5-1035G4 o Core i5-8265U vedranno circa il 50-60% di prestazioni multi-thread in più ciascuno.
Le frequenze di clock della CPU non sono costanti, tuttavia, come esemplificato dai nostri risultati del ciclo CineBench R15 xT qui sotto. I punteggi oscillano tra i 680 e gli 800 punti, mentre la stessa CPU nel Intel NUC11 mini PC restituiva punteggi più stabili durante lo stesso test in loop. La nostra sezione Stress Test qui sotto esplora ulteriormente le frequenze di clock ciclistiche dello Spectre.
Cinebench R23: Multi Core | Single Core
Cinebench R15: CPU Multi 64Bit | CPU Single 64Bit
Blender: v2.79 BMW27 CPU
7-Zip 18.03: 7z b 4 -mmt1 | 7z b 4
Geekbench 5.5: Single-Core | Multi-Core
HWBOT x265 Benchmark v2.2: 4k Preset
LibreOffice : 20 Documents To PDF
R Benchmark 2.5: Overall mean
| Cinebench R23 / Multi Core | |
| Lenovo IdeaPad Flex 5 14ALC05 82HU002YUS | |
| Lenovo Yoga Slim 7-14ARE | |
| Lenovo Yoga Slim 7 14ARE05 82A20008GE | |
| Razer Book 13 FHD | |
| MSI Summit E13 Flip Evo A11MT | |
| HP Spectre x360 13-aw2003dx | |
| Media Intel Core i5-1135G7 (2786 - 6136, n=55) | |
| Cinebench R23 / Single Core | |
| MSI Summit E13 Flip Evo A11MT | |
| HP Spectre x360 13-aw2003dx | |
| Media Intel Core i5-1135G7 (1062 - 1373, n=53) | |
| Lenovo IdeaPad Flex 5 14ALC05 82HU002YUS | |
| Lenovo Yoga Slim 7-14ARE | |
| Lenovo Yoga Slim 7 14ARE05 82A20008GE | |
Cinebench R23: Multi Core | Single Core
Cinebench R15: CPU Multi 64Bit | CPU Single 64Bit
Blender: v2.79 BMW27 CPU
7-Zip 18.03: 7z b 4 -mmt1 | 7z b 4
Geekbench 5.5: Single-Core | Multi-Core
HWBOT x265 Benchmark v2.2: 4k Preset
LibreOffice : 20 Documents To PDF
R Benchmark 2.5: Overall mean
* ... Meglio usare valori piccoli
Prestazioni del sistema
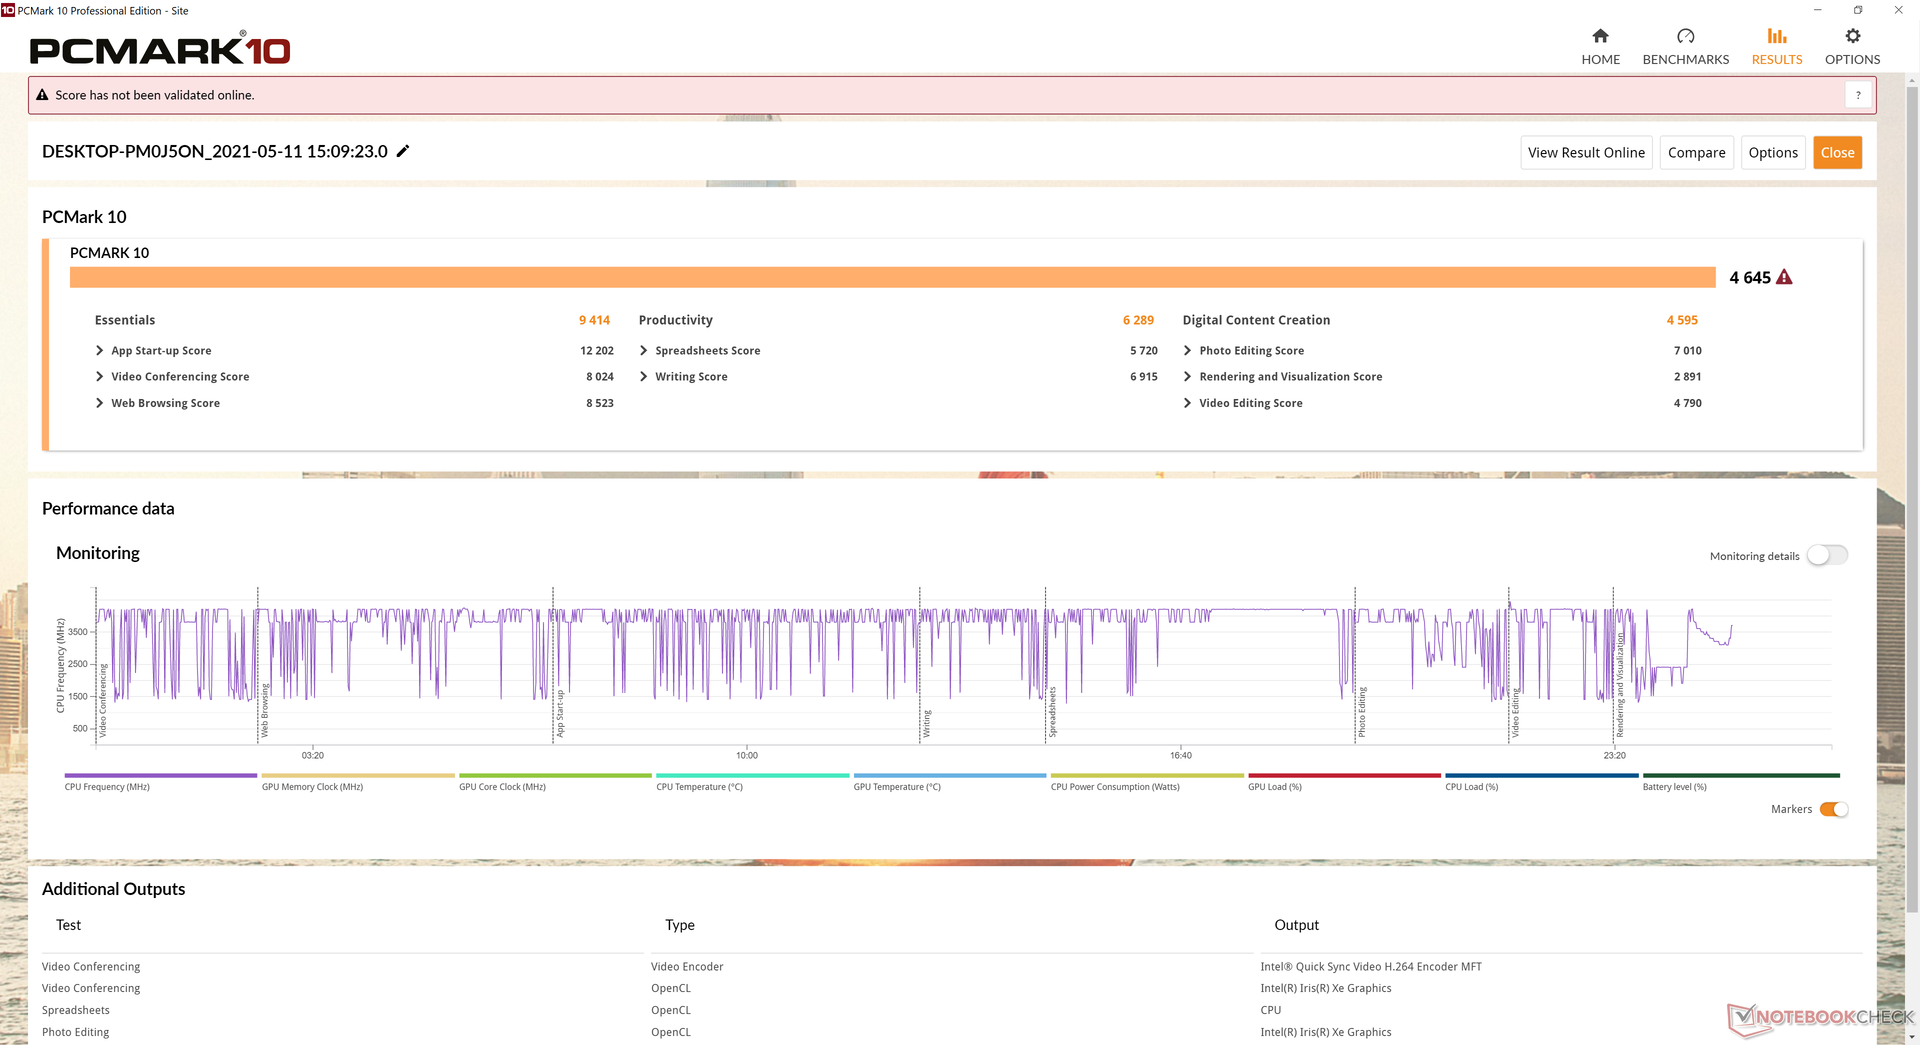
| PCMark 10 Score | 4645 punti | |
Aiuto | ||
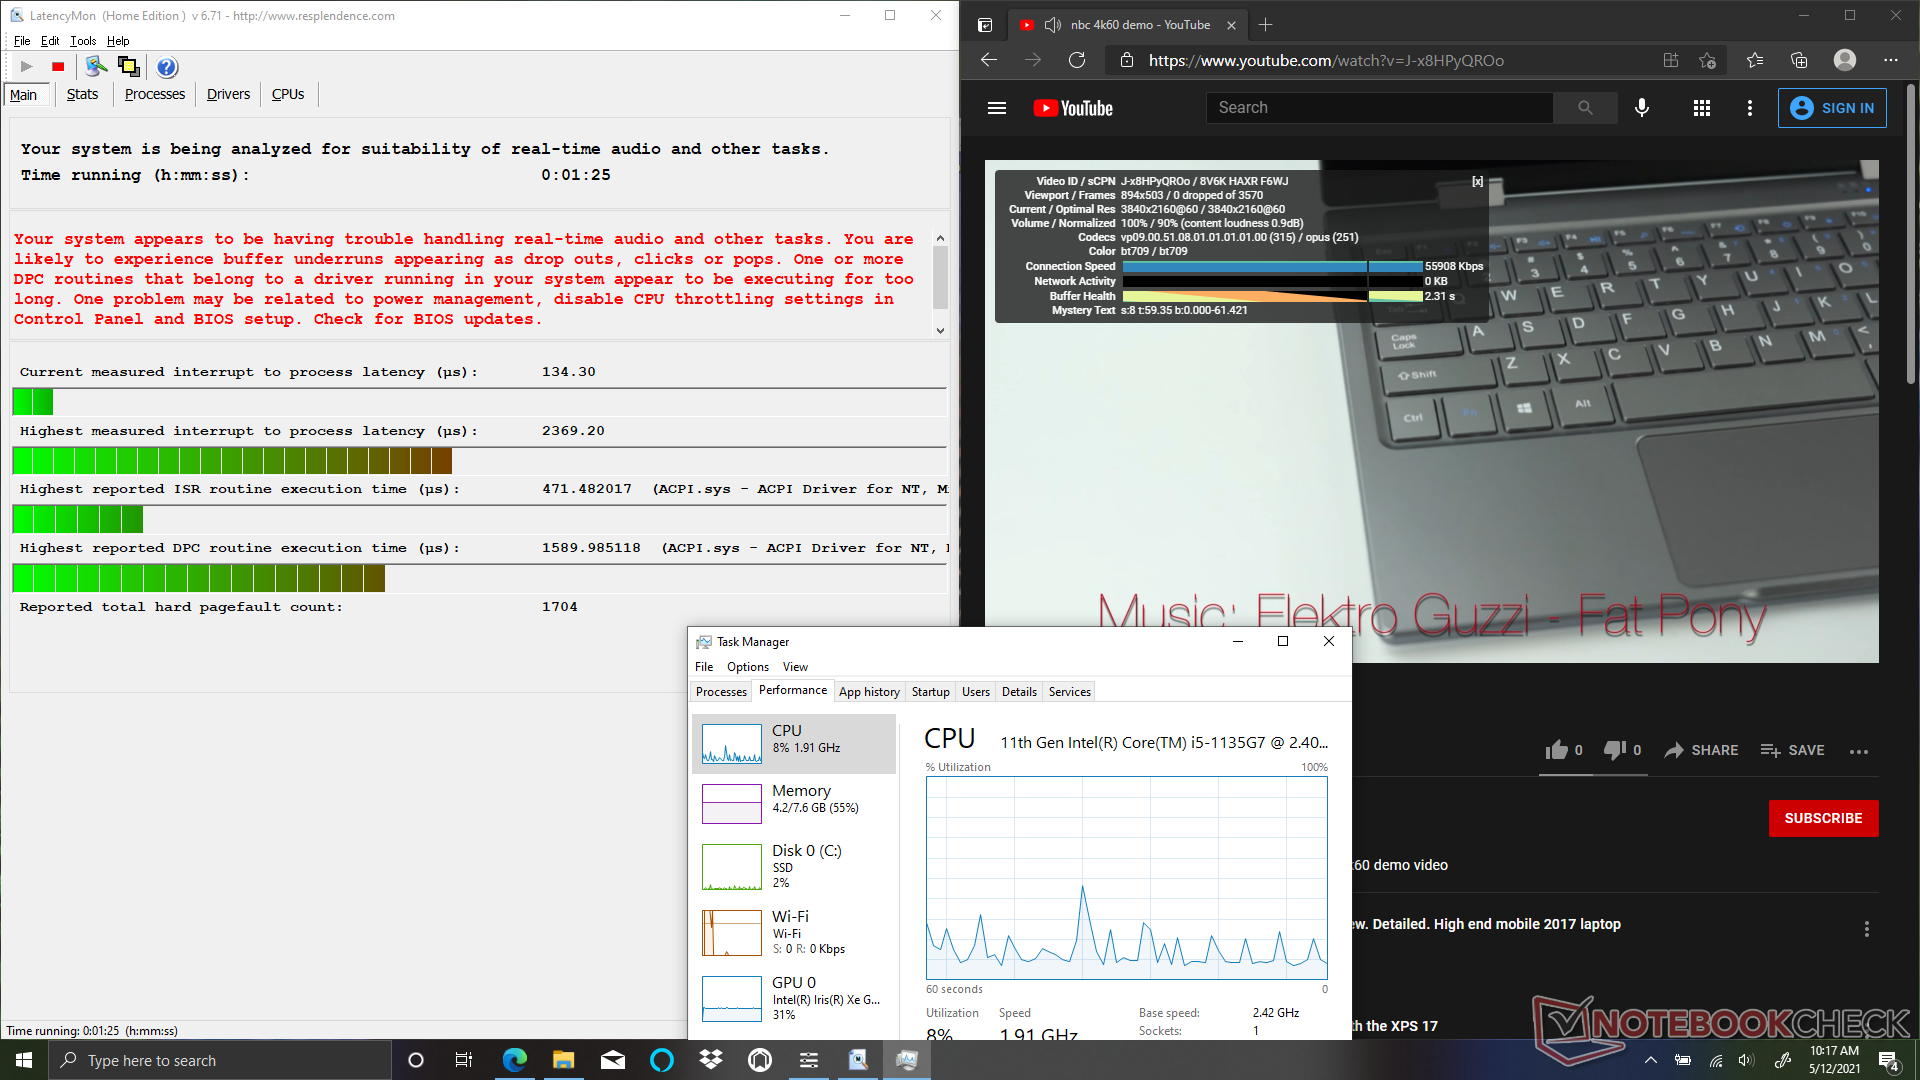
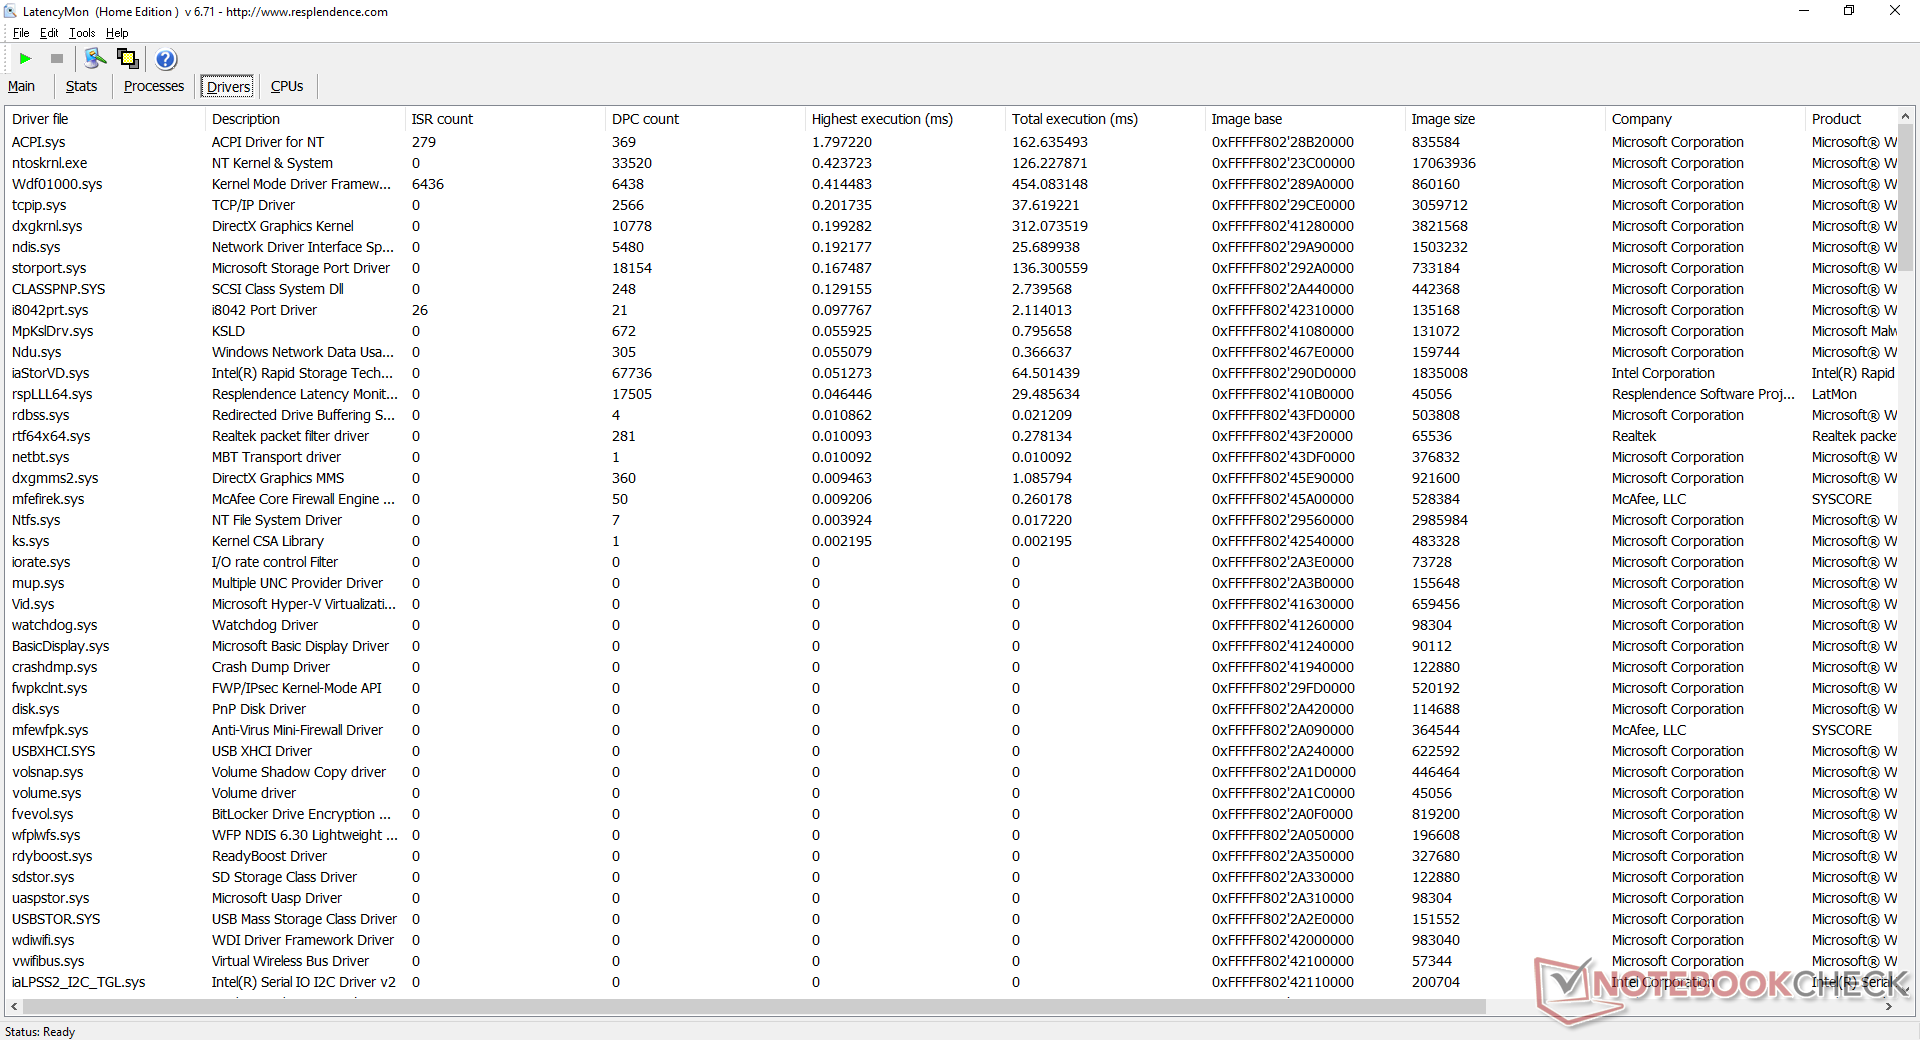
Latenza DPC
LatencyMon rivela problemi di latenza DPC quando si aprono più schede del browser sulla nostra homepage. Fortunatamente, la riproduzione di video 4K a 60 FPS rimane fluida senza perdita di fotogrammi.
| DPC Latencies / LatencyMon - interrupt to process latency (max), Web, Youtube, Prime95 | |
| Lenovo Yoga Duet 7 13IML05-82AS000WGE | |
| MSI Summit E13 Flip Evo A11MT | |
| HP Spectre x360 13-aw2003dx | |
| HP Spectre x360 14t-ea000 | |
* ... Meglio usare valori piccoli
Dispositivi di archiviazione
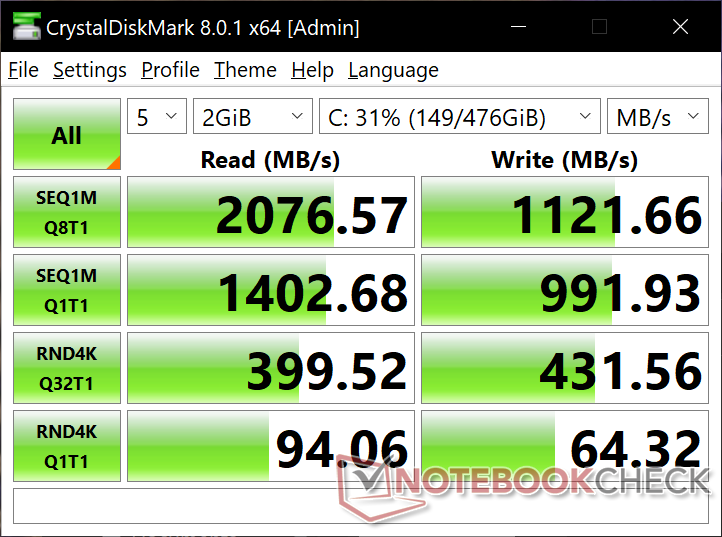
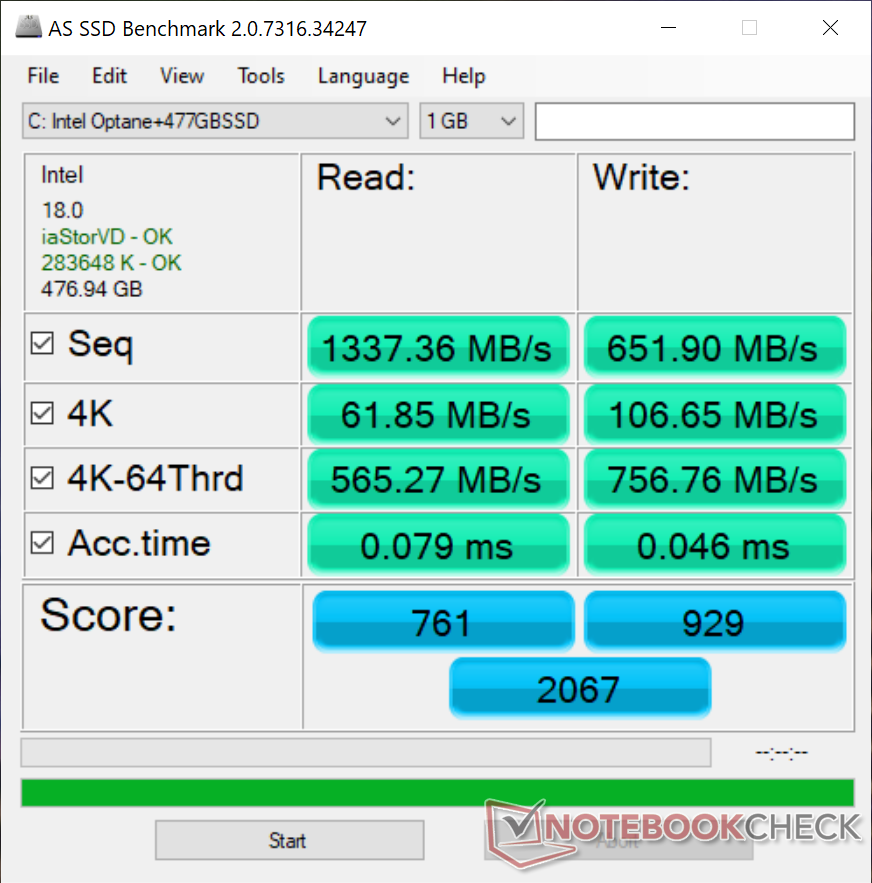
La nostra unità è dotata dello stesso SSD Intel PCIe 3.0 NVMe da 512 GB e 32 GB di memoria Optane come sul modello 2019. Per la maggior parte degli utenti, un SSD standard Samsung PM981a o più recente PCIe 4.0 come sulla maggior parte degli altri Ultrabooks sarebbe stato preferibile.
| HP Spectre x360 13-aw2003dx Intel Optane Memory H10 with Solid State Storage 32GB + 512GB HBRPEKNX0202A(L/H) | HP Spectre x360 14t-ea000 Samsung SSD PM981a MZVLB512HBJQ | Dell XPS 13 7390 Core i7-10710U SK Hynix PC601 NVMe 512 GB | MSI Summit E13 Flip Evo A11MT Phison 1TB SM2801T24GKBB4S-E162 | |
|---|---|---|---|---|
| AS SSD | 59% | 14% | 98% | |
| Seq Read (MB/s) | 1337 | 2188 64% | 1804 35% | 3789 183% |
| Seq Write (MB/s) | 652 | 1320 102% | 1000 53% | 2257 246% |
| 4K Read (MB/s) | 61.8 | 53.5 -13% | 45.1 -27% | 54.2 -12% |
| 4K Write (MB/s) | 106.7 | 123.7 16% | 115 8% | 78.7 -26% |
| 4K-64 Read (MB/s) | 565 | 1010 79% | 893 58% | 1330 135% |
| 4K-64 Write (MB/s) | 757 | 1808 139% | 732 -3% | 2038 169% |
| Access Time Read * (ms) | 0.079 | 0.055 30% | 0.044 44% | 0.042 47% |
| Access Time Write * (ms) | 0.046 | 0.076 -65% | 0.095 -107% | 0.04 13% |
| Score Read (Points) | 761 | 1282 68% | 1119 47% | 1763 132% |
| Score Write (Points) | 929 | 2063 122% | 947 2% | 2343 152% |
| Score Total (Points) | 2067 | 3970 92% | 2608 26% | 4938 139% |
| Copy ISO MB/s (MB/s) | 912 | 1644 80% | 1515 66% | 2270 149% |
| Copy Program MB/s (MB/s) | 696 | 920 32% | 535 -23% | 670 -4% |
| Copy Game MB/s (MB/s) | 994 | 1725 74% | 1211 22% | 1525 53% |
| CrystalDiskMark 5.2 / 6 | 37% | 32% | 115% | |
| Write 4K (MB/s) | 64.8 | 82.2 27% | 134 107% | 311.1 380% |
| Read 4K (MB/s) | 98 | 45.7 -53% | 42.91 -56% | 56.6 -42% |
| Write Seq (MB/s) | 994 | 2000 101% | 1841 85% | 2397 141% |
| Read Seq (MB/s) | 1440 | 2206 53% | 1707 19% | 2277 58% |
| Write 4K Q32T1 (MB/s) | 444.5 | 451.2 2% | 394.7 -11% | 803 81% |
| Read 4K Q32T1 (MB/s) | 397.1 | 351 -12% | 398.5 0% | 849 114% |
| Write Seq Q32T1 (MB/s) | 1265 | 2982 136% | 2250 78% | 2410 91% |
| Read Seq Q32T1 (MB/s) | 2501 | 3529 41% | 3265 31% | 4954 98% |
| Media totale (Programma / Settaggio) | 48% /
51% | 23% /
21% | 107% /
104% |
* ... Meglio usare valori piccoli

Throttling Disco: DiskSpd Read Loop, Queue Depth 8
Prestazioni della GPU
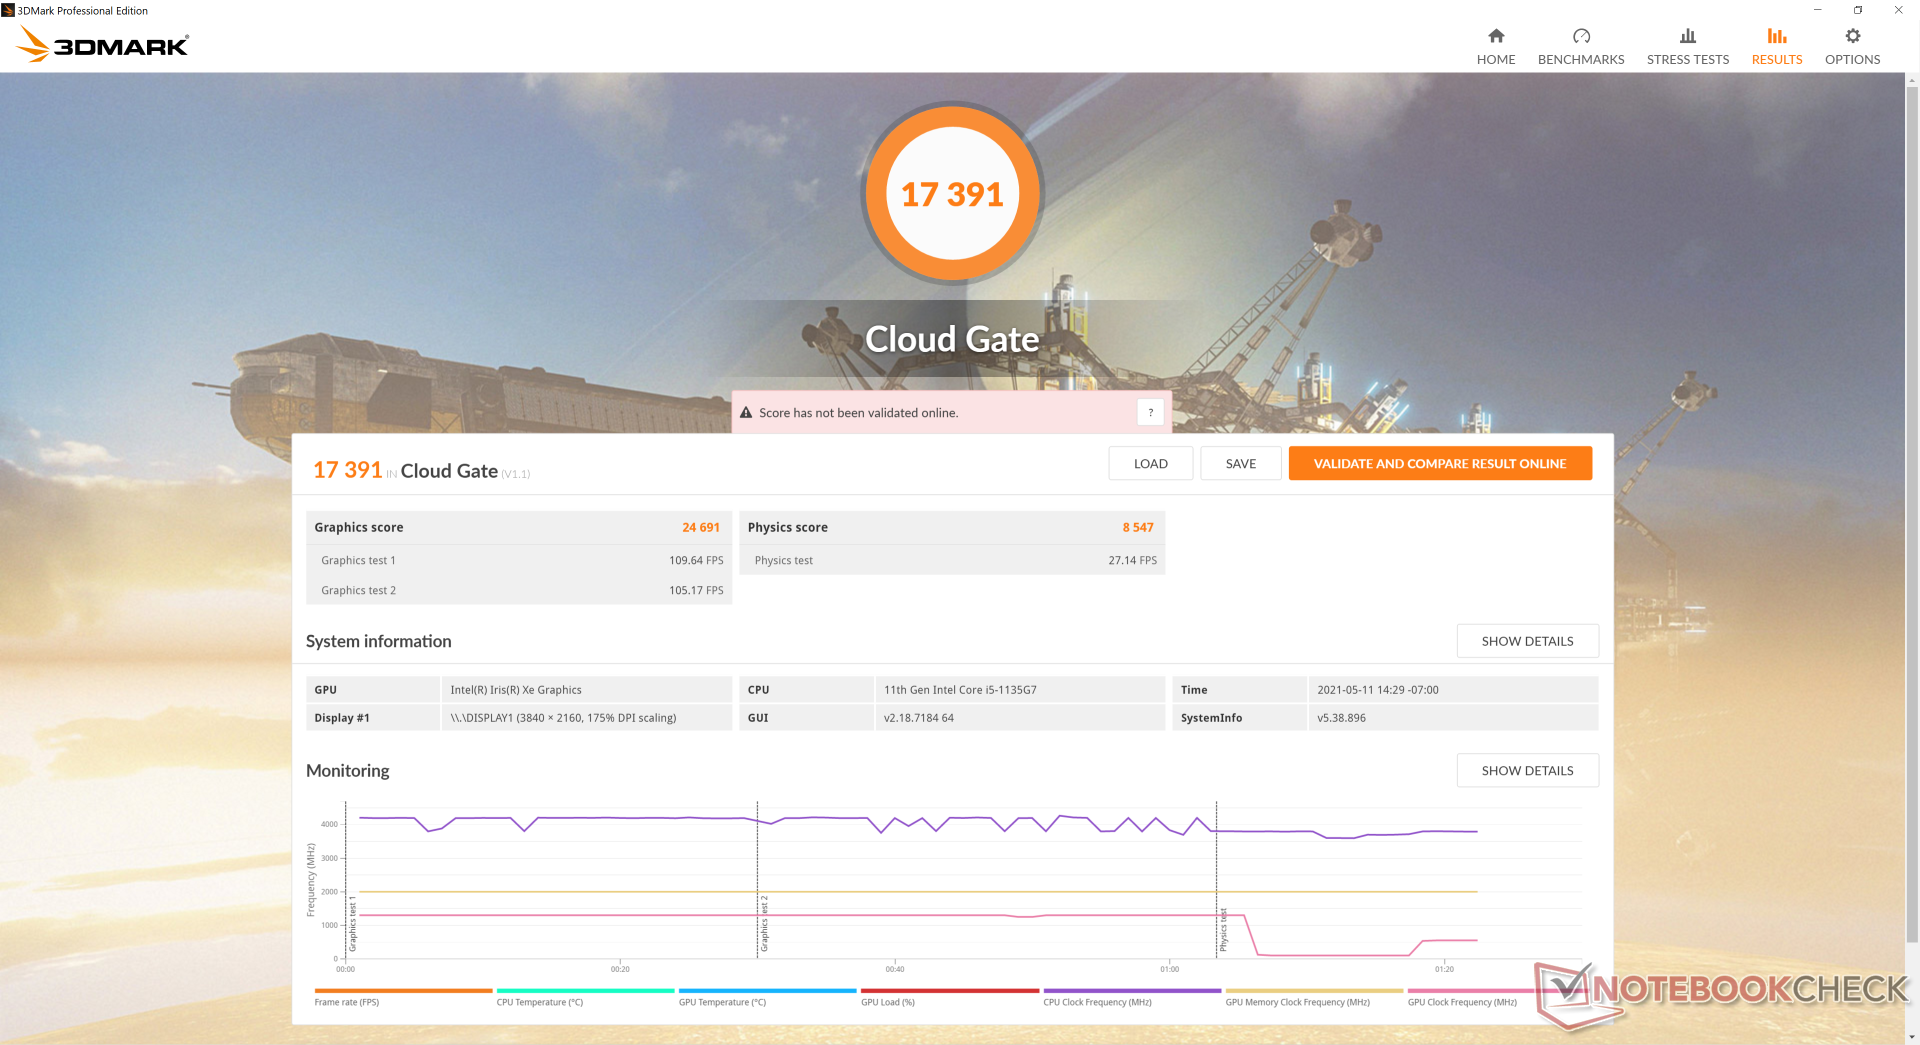
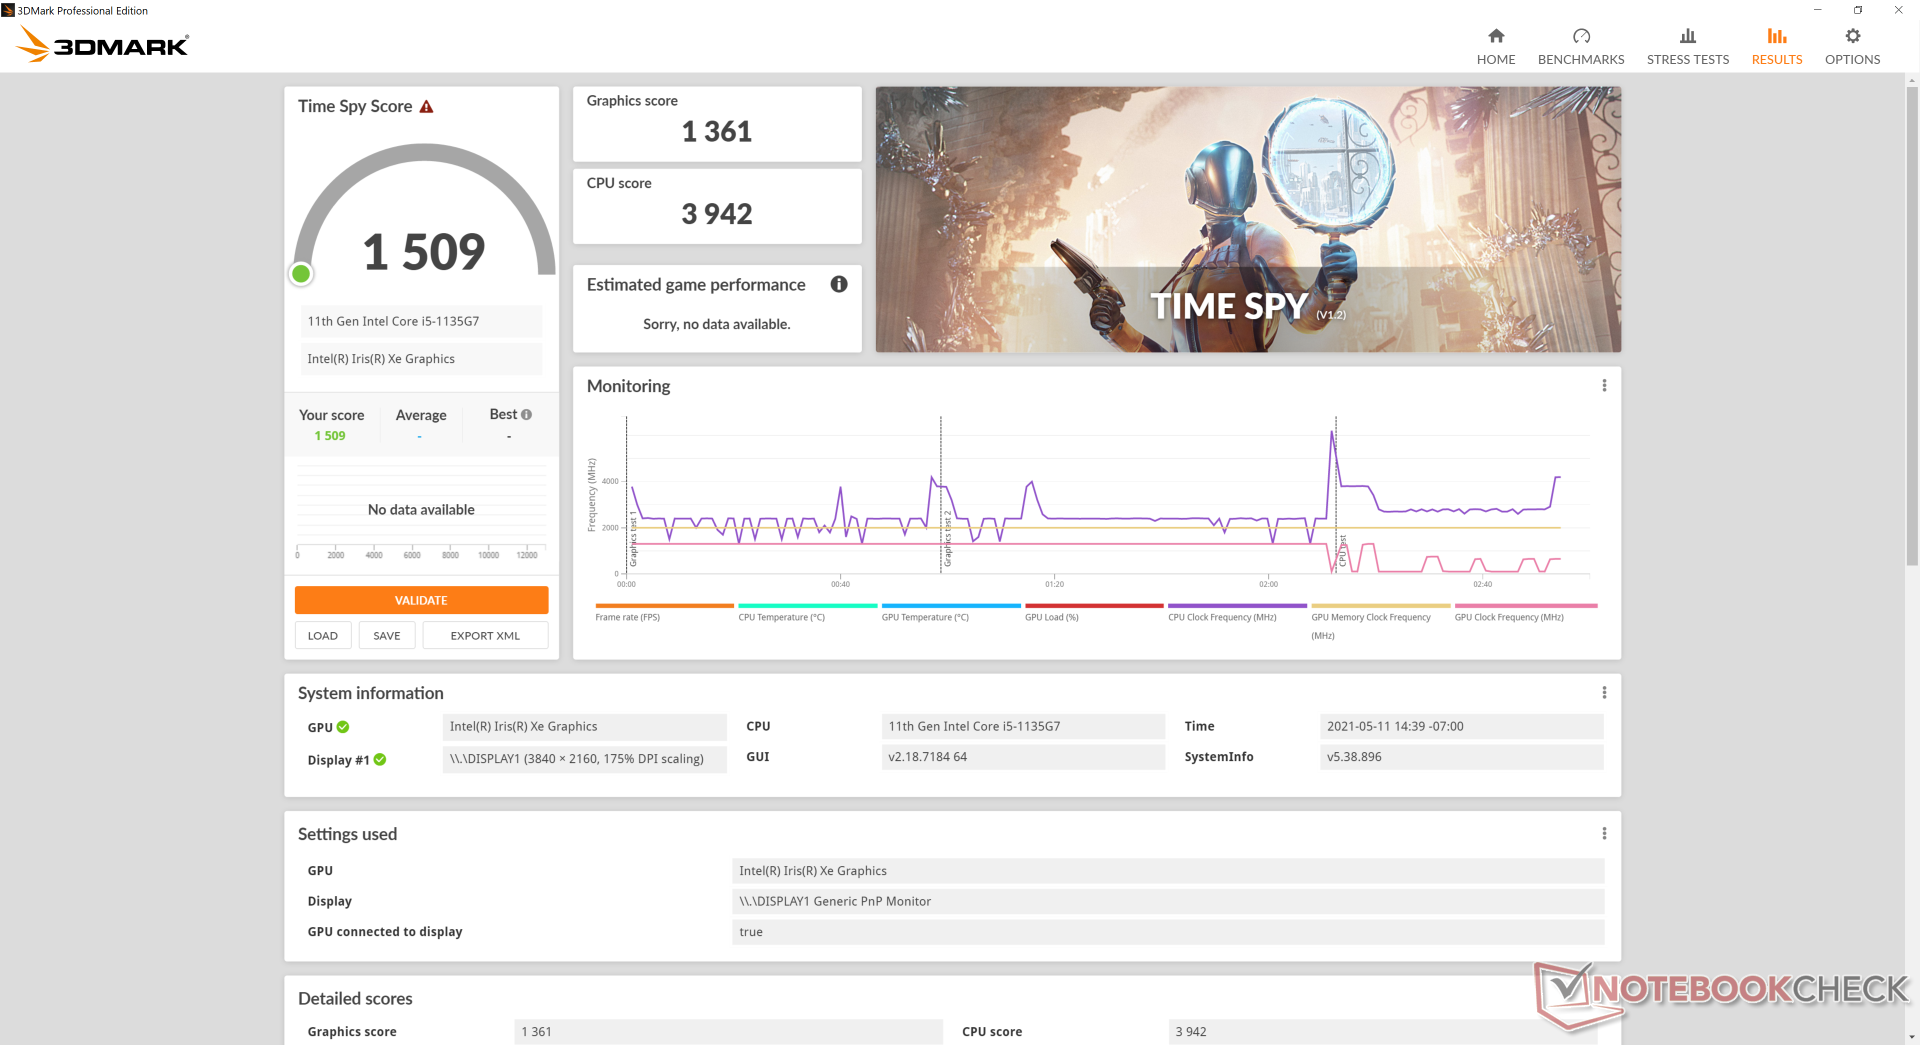
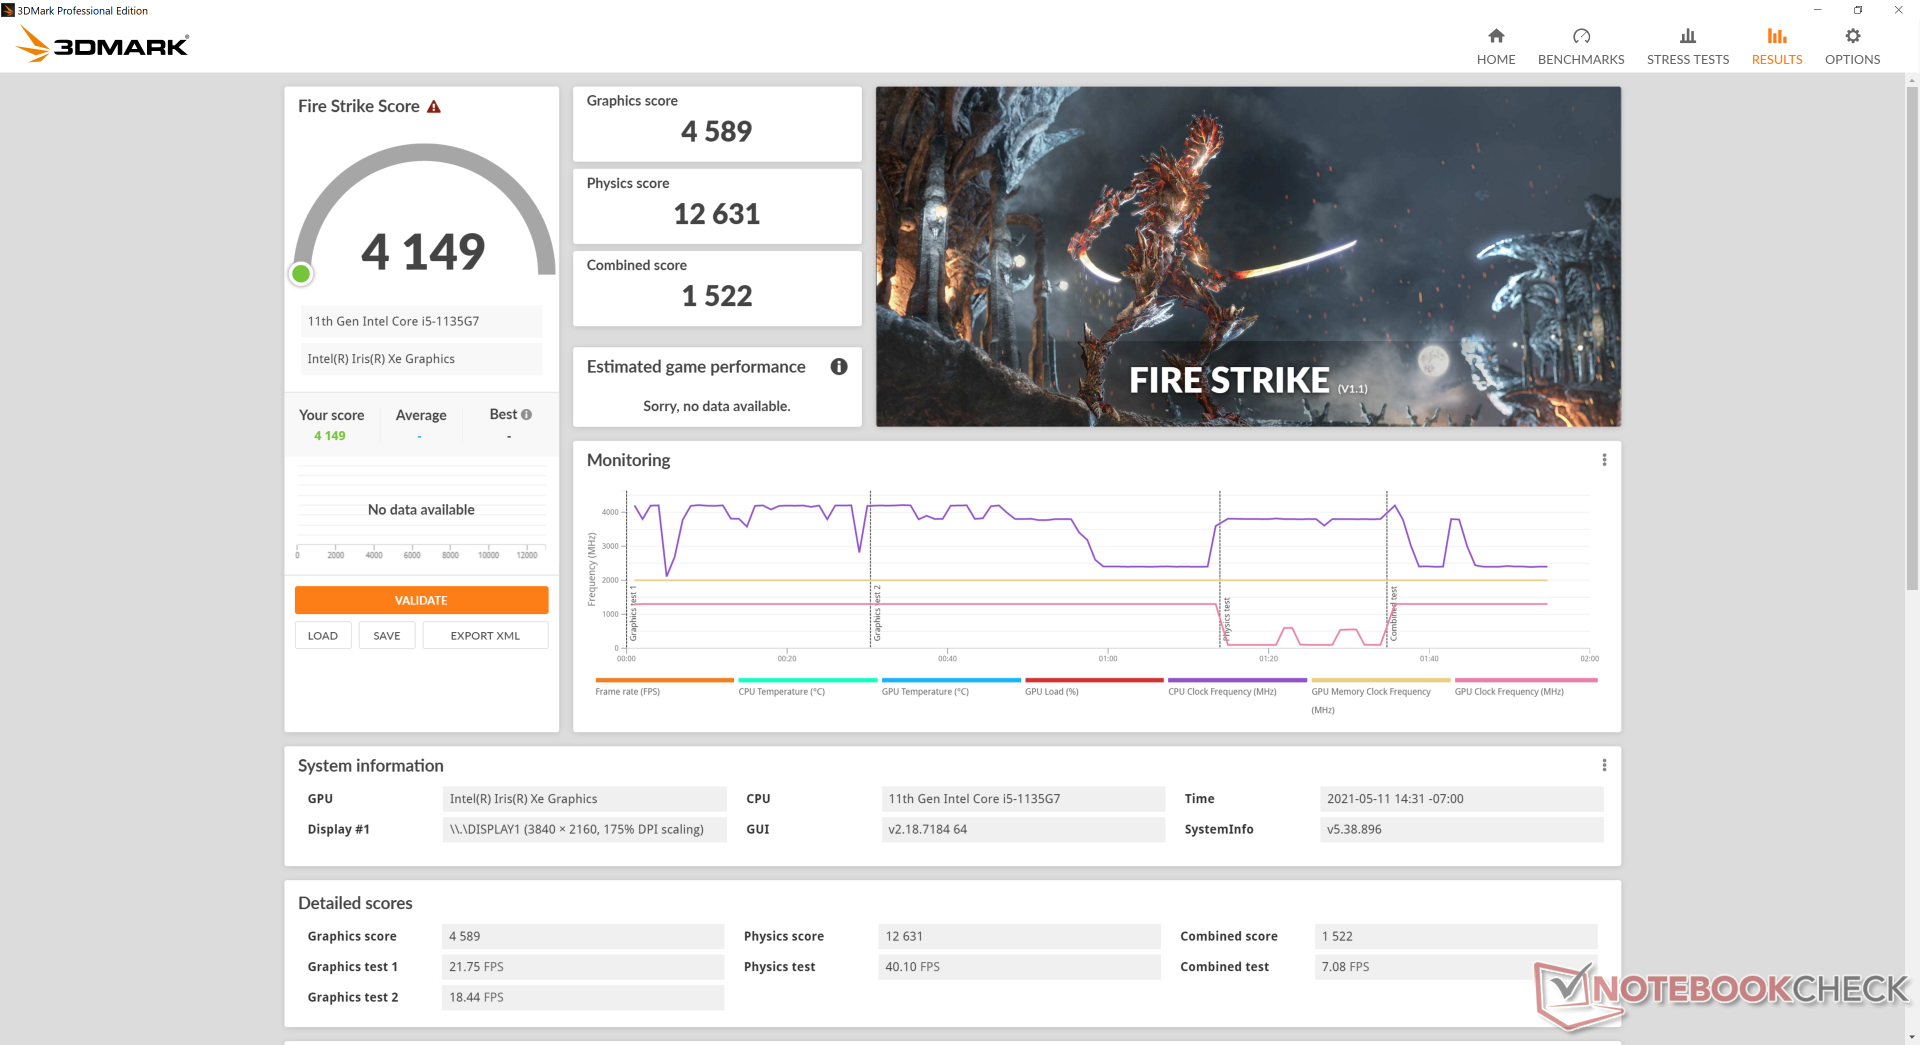
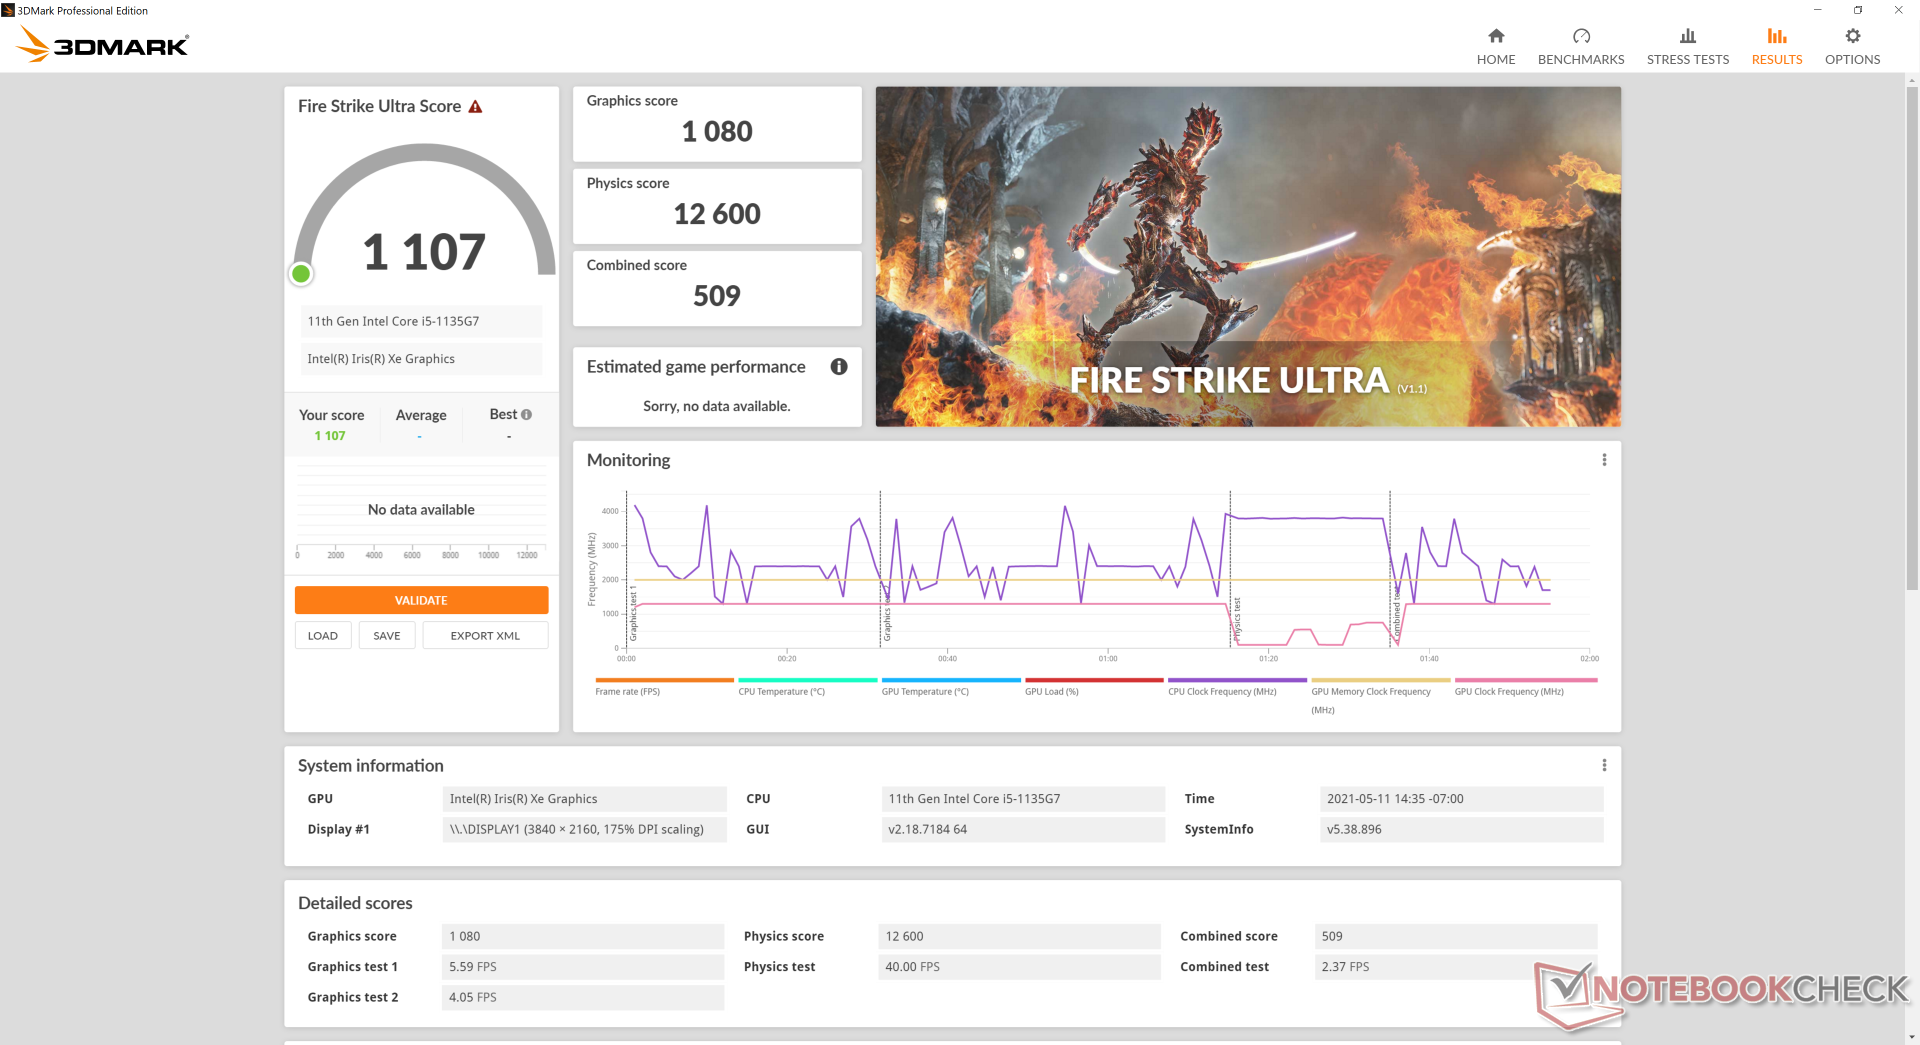
Le prestazioni grafiche sono eccellenti con risultati 3DMark che sono circa il 20% superiori rispetto alla media Iris Xe 80 EU in altri portatili. I benchmarks sintetici non raccontano tutta la storia, tuttavia, poiché le prestazioni nei giochi del mondo reale fluttuano molto. Il nostro grafico qui sotto mostra i frame rates nel tempo quando si gioca al minimo a The Witcher 3 alle impostazioni grafiche più basse. Il frame rate oscilla costantemente tra i bassi 70 e gli alti 80 anche dopo aver impostato la nostra unità in modalità Performance. Questo stesso fenomeno è stato osservato sullo Spectre x360 14 e sullo Spectre x360 13 del 2019, il che significa che HP non ha fatto nulla per risolvere il problema.
Gli utenti possono comunque aggirare i frame rates irregolari limitandoli o abilitando il v-sync. È un peccato che il display non supporti la frequenza di aggiornamento variabile a differenza di molti Ultrabook AMD-powered.
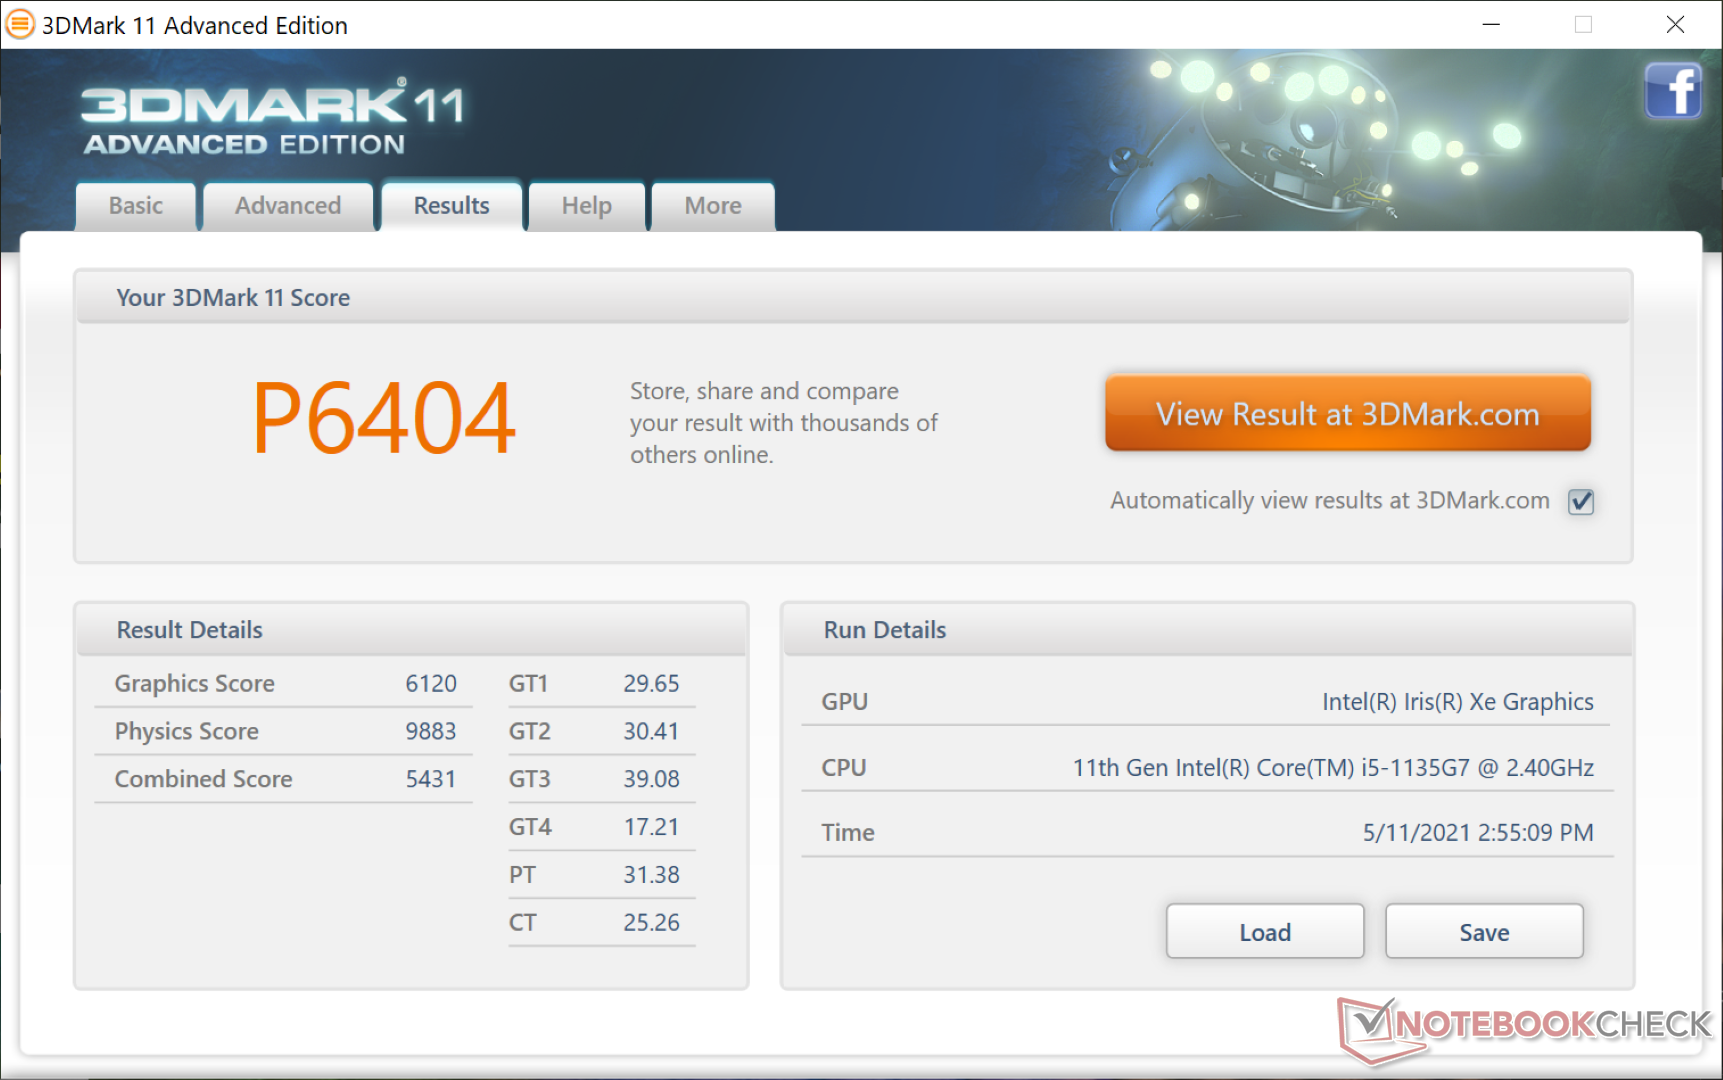
| 3DMark 11 Performance | 6404 punti | |
| 3DMark Cloud Gate Standard Score | 17391 punti | |
| 3DMark Fire Strike Score | 4149 punti | |
| 3DMark Time Spy Score | 1509 punti | |
Aiuto | ||
| basso | medio | alto | ultra | |
|---|---|---|---|---|
| The Witcher 3 (2015) | 84.5 | 46.2 | 29.5 | 13.5 |
| Dota 2 Reborn (2015) | 83.4 | 68.3 | 49.8 | 48 |
| Final Fantasy XV Benchmark (2018) | 38.4 | 20.8 | 20.8 | |
| X-Plane 11.11 (2018) | 24.1 | 33.8 | 19.6 |
Emissioni
Rumorosità
Il rumore delle ventole è sorprendentemente basso nella maggior parte delle attività. Per esempio, abbiamo dovuto eseguire la prima scena di benchmark di 3DMark 06 due volte prima che le ventole cominciassero ad entrare in funzione. Gli utenti possono quindi eseguire applicazioni leggere come lo streaming video senza alcun rumore di ventola che distragga.
Sfortunatamente, le ventole tendono a pulsare quando si eseguono i giochi, mentre nella maggior parte degli altri portatili le ventole sono fisse ad un certo numero di giri. L'esecuzione di The Witcher 3 provoca un rumore delle ventole tra 36.6 dB(A) e 44.6 dB(A) quando si imposta la modalità Performance. Un valore fisso di 44.6 dB(A) sarebbe stato preferibile in quanto le ventole pulsanti possono essere più evidenti o fastidiose. Questo comportamento ciclico è correlato alle frequenze di clock del processore e alle temperature ciclistiche come notato nella nostra sezione Stress Test qui sotto.
| HP Spectre x360 13-aw2003dx Iris Xe G7 80EUs, i5-1135G7, Intel Optane Memory H10 with Solid State Storage 32GB + 512GB HBRPEKNX0202A(L/H) | HP Spectre x360 14t-ea000 Iris Xe G7 96EUs, i7-1165G7, Samsung SSD PM981a MZVLB512HBJQ | Dell XPS 13 7390 Core i7-10710U UHD Graphics 620, i7-10710U, SK Hynix PC601 NVMe 512 GB | MSI Summit E13 Flip Evo A11MT Iris Xe G7 96EUs, i7-1185G7, Phison 1TB SM2801T24GKBB4S-E162 | |
|---|---|---|---|---|
| Noise | 2% | -13% | -7% | |
| off /ambiente * (dB) | 25.3 | 25.8 -2% | 28 -11% | 24.5 3% |
| Idle Minimum * (dB) | 25.4 | 25.9 -2% | 28 -10% | 24.7 3% |
| Idle Average * (dB) | 25.4 | 25.9 -2% | 28 -10% | 24.7 3% |
| Idle Maximum * (dB) | 25.4 | 25.9 -2% | 28 -10% | 26.4 -4% |
| Load Average * (dB) | 25.4 | 26.4 -4% | 33.7 -33% | 37.8 -49% |
| Witcher 3 ultra * (dB) | 44.6 | 36.9 17% | 41.4 7% | |
| Load Maximum * (dB) | 44.8 | 41.5 7% | 46.5 -4% | 48.8 -9% |
* ... Meglio usare valori piccoli
Rumorosità
| Idle |
| 25.4 / 25.4 / 25.4 dB(A) |
| Sotto carico |
| 25.4 / 44.8 dB(A) |
 | ||
30 dB silenzioso 40 dB(A) udibile 50 dB(A) rumoroso |
||
min: | ||
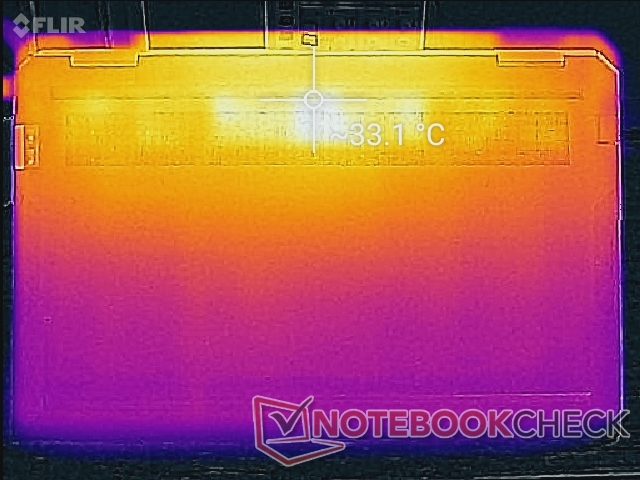
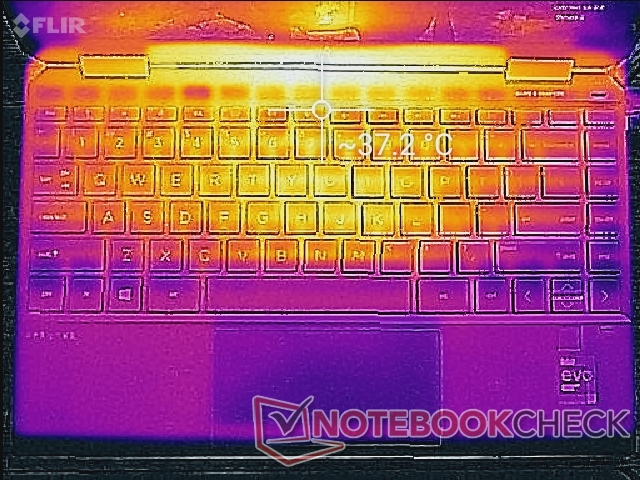
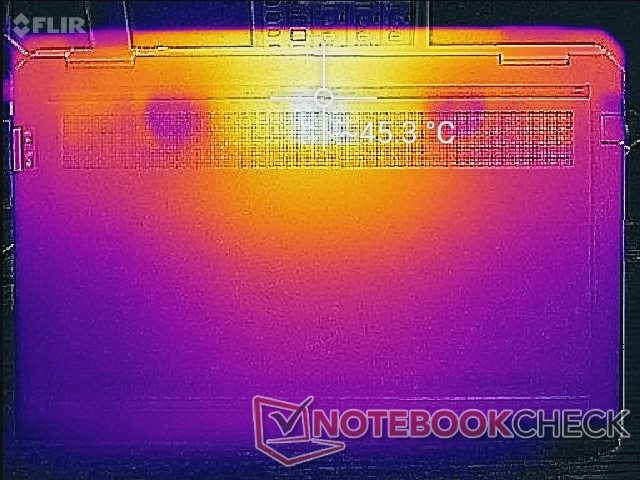
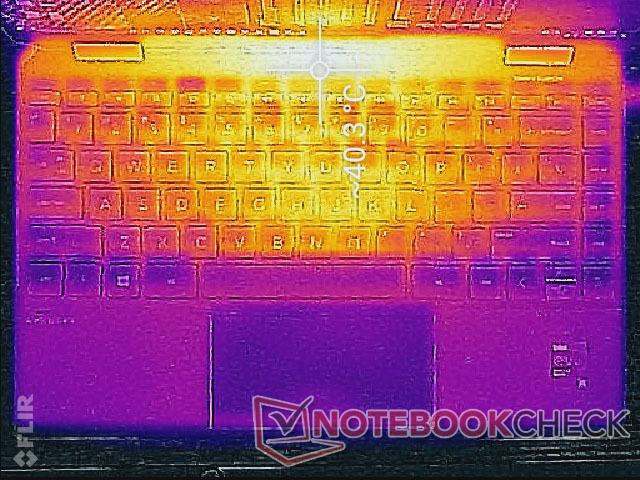
Temperature
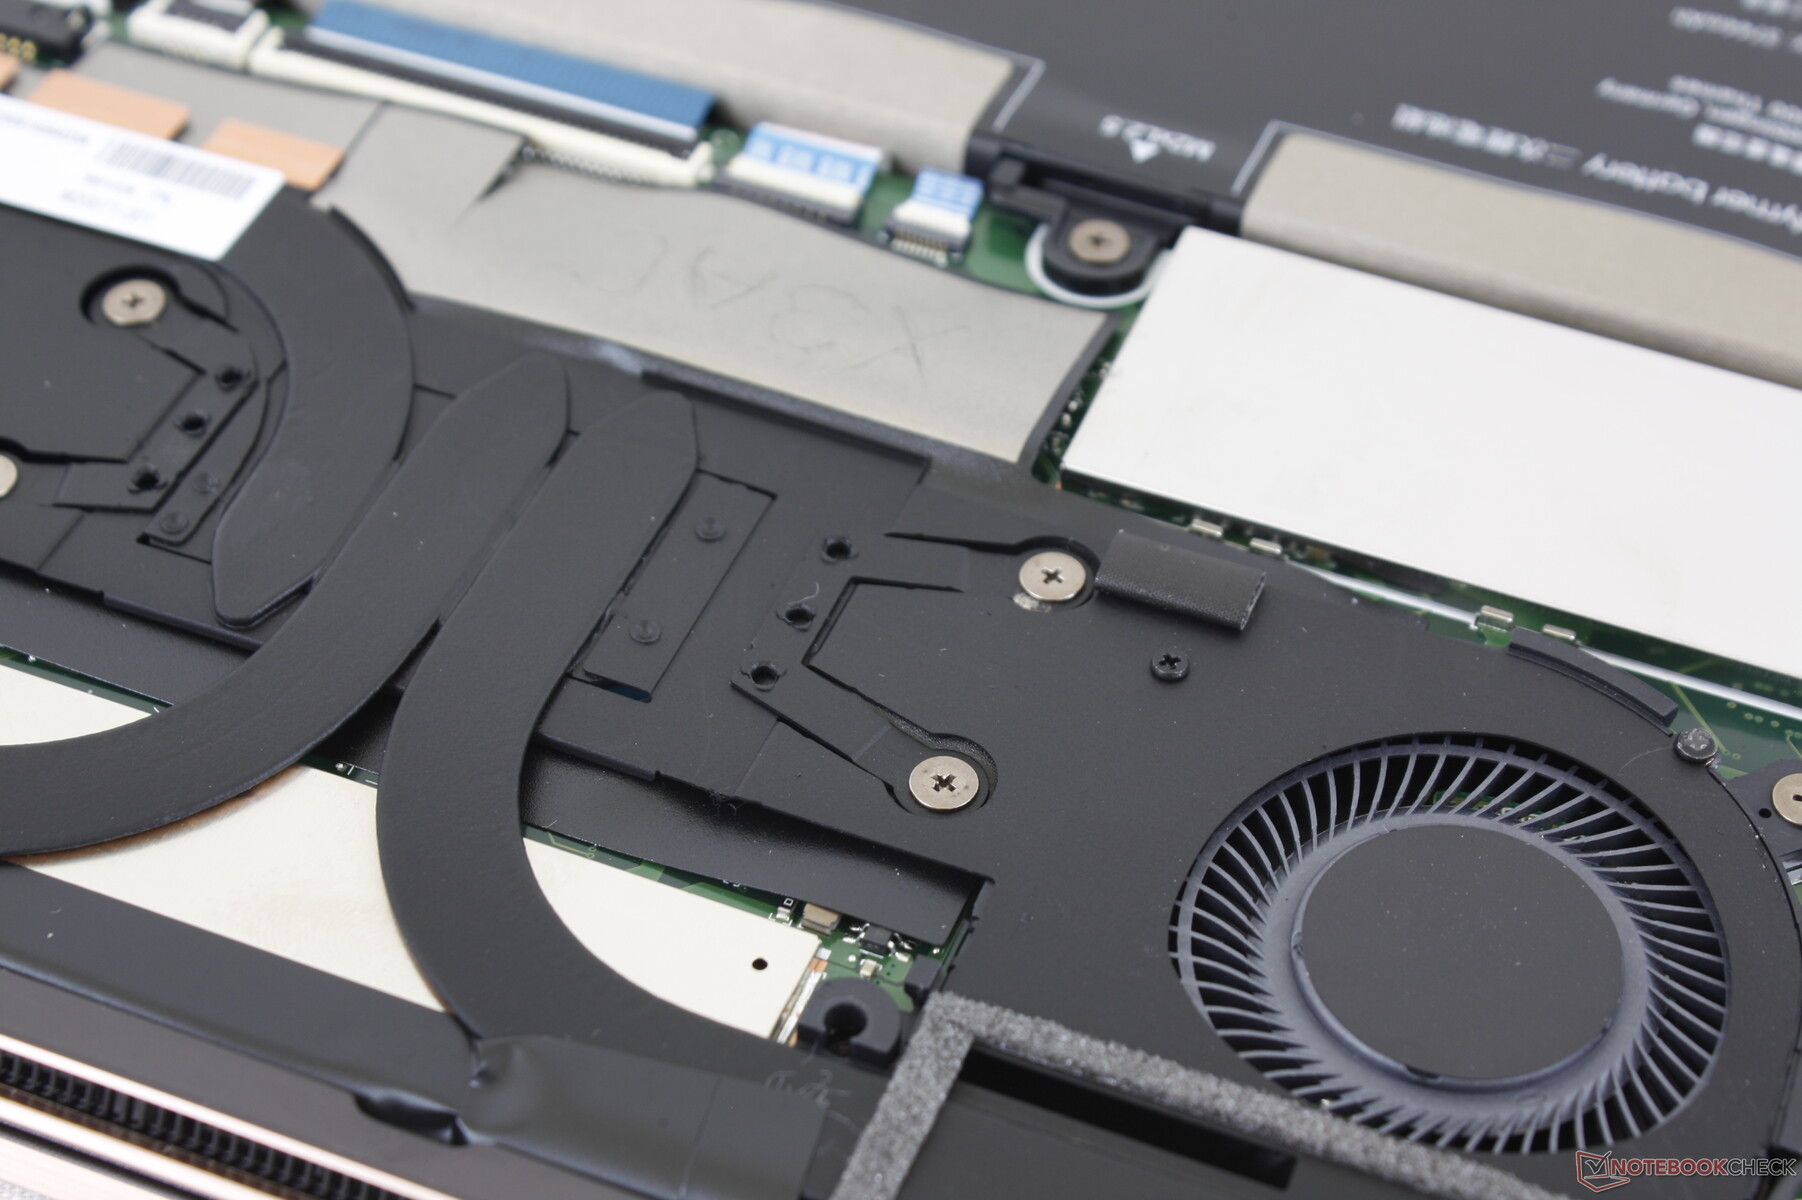
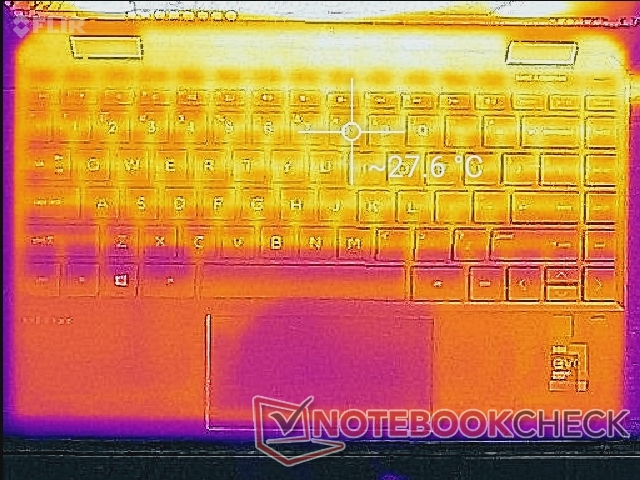
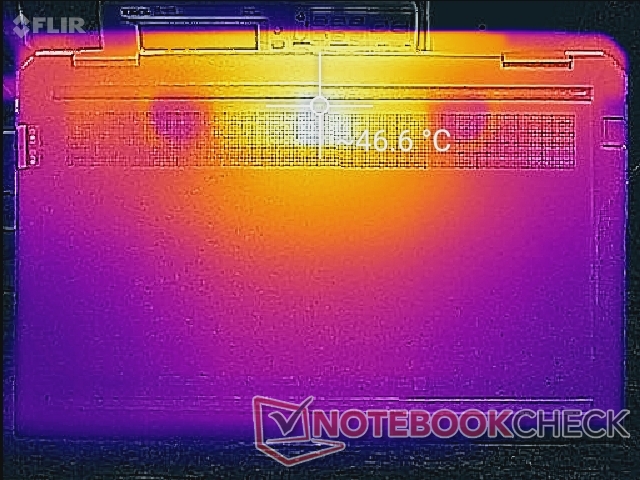
Lo sviluppo delle temperatura di superficie è in gran parte simmetrico a causa del posizionamento simmetrico delle due ventole e dei tubi di calore all'interno. I punti caldi si trovano quindi verso la parte posteriore dell'unità lontano dai poggiapolsi e dalla maggior parte dei tasti diversamente dai tasti del Asus ZenBook 14 UX435 che possono arrivare fino a 46° C.
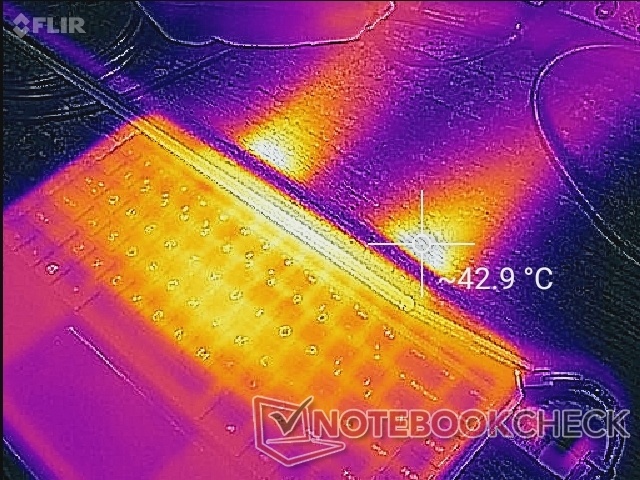
(±) La temperatura massima sul lato superiore è di 40 °C / 104 F, rispetto alla media di 35.4 °C / 96 F, che varia da 19.6 a 60 °C per questa classe Convertible.
(-) Il lato inferiore si riscalda fino ad un massimo di 47 °C / 117 F, rispetto alla media di 36.9 °C / 98 F
(+) In idle, la temperatura media del lato superiore è di 26.7 °C / 80 F, rispetto alla media deld ispositivo di 30.3 °C / 87 F.
(+) Riproducendo The Witcher 3, la temperatura media per il lato superiore e' di 30.9 °C / 88 F, rispetto alla media del dispositivo di 30.3 °C / 87 F.
(+) I poggiapolsi e il touchpad sono piu' freddi della temperatura della pelle con un massimo di 28.4 °C / 83.1 F e sono quindi freddi al tatto.
(±) La temperatura media della zona del palmo della mano di dispositivi simili e'stata di 28 °C / 82.4 F (-0.4 °C / -0.7 F).
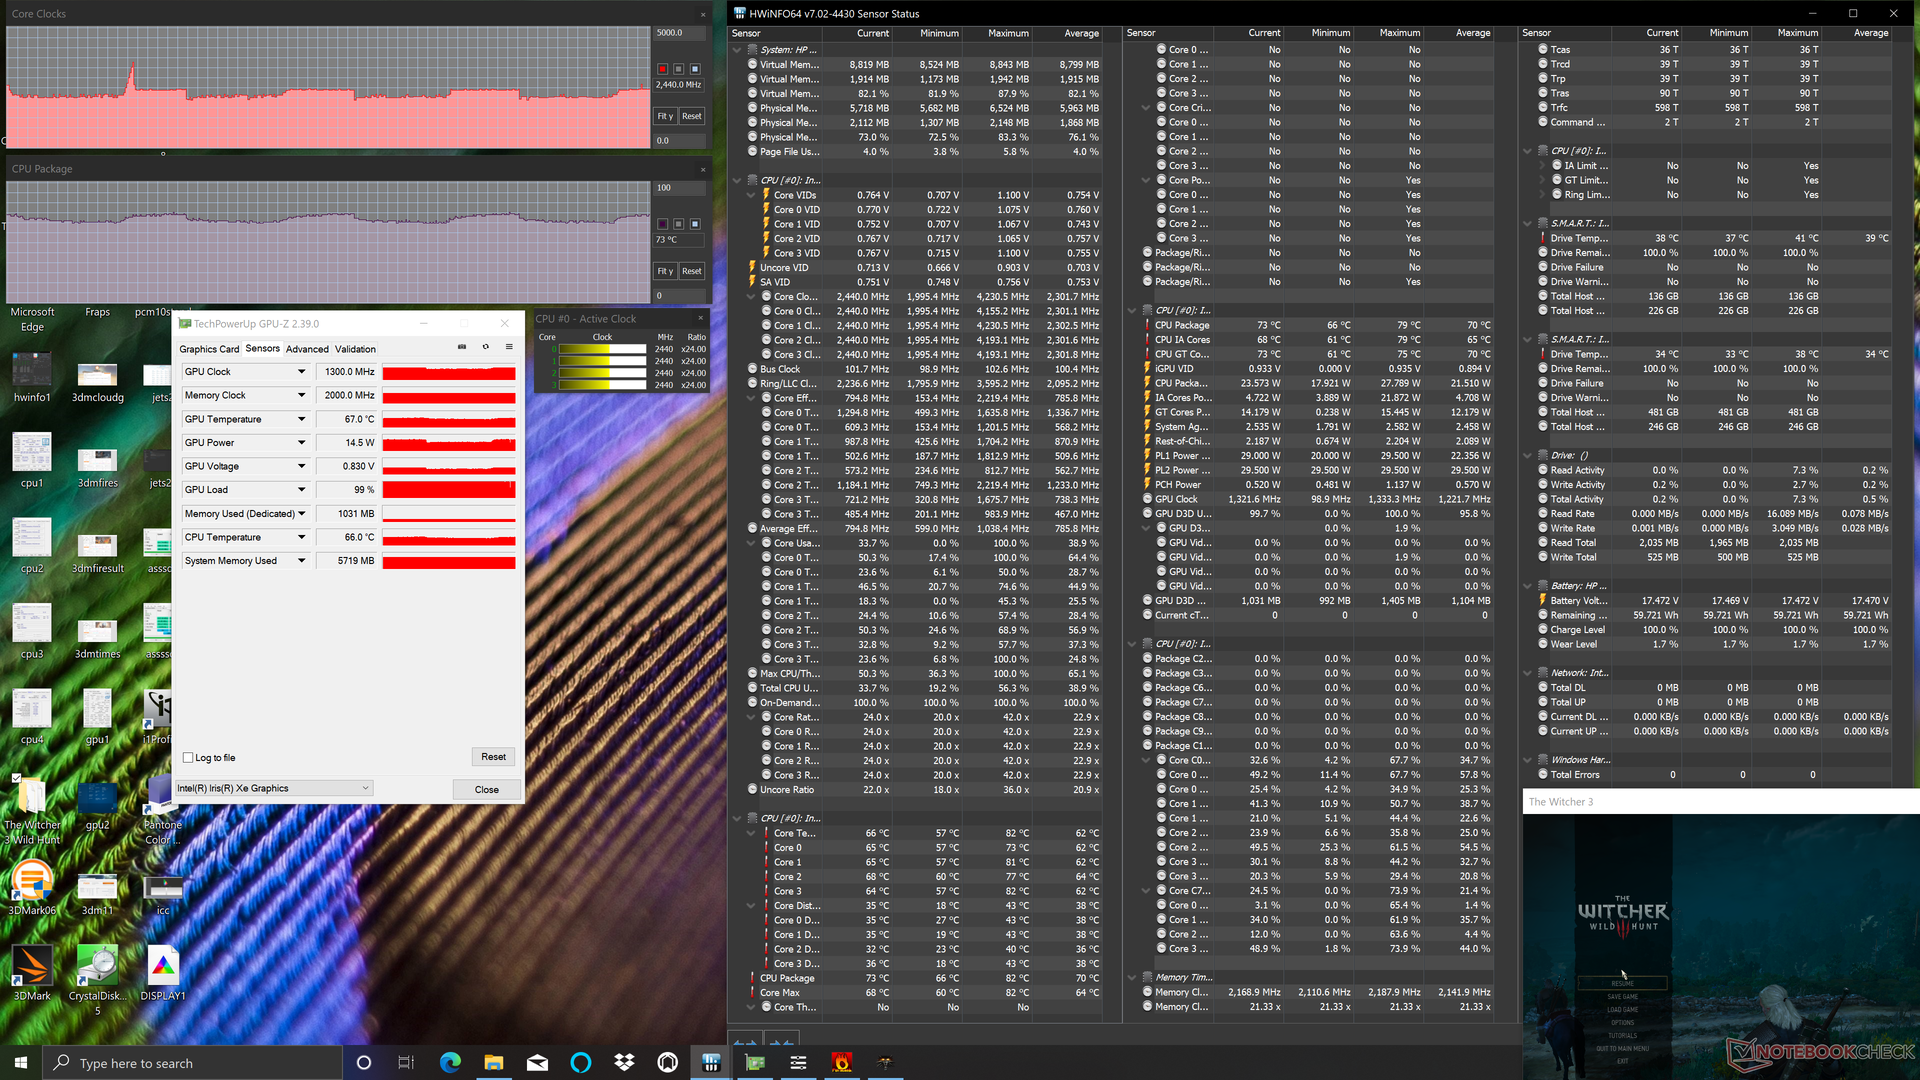
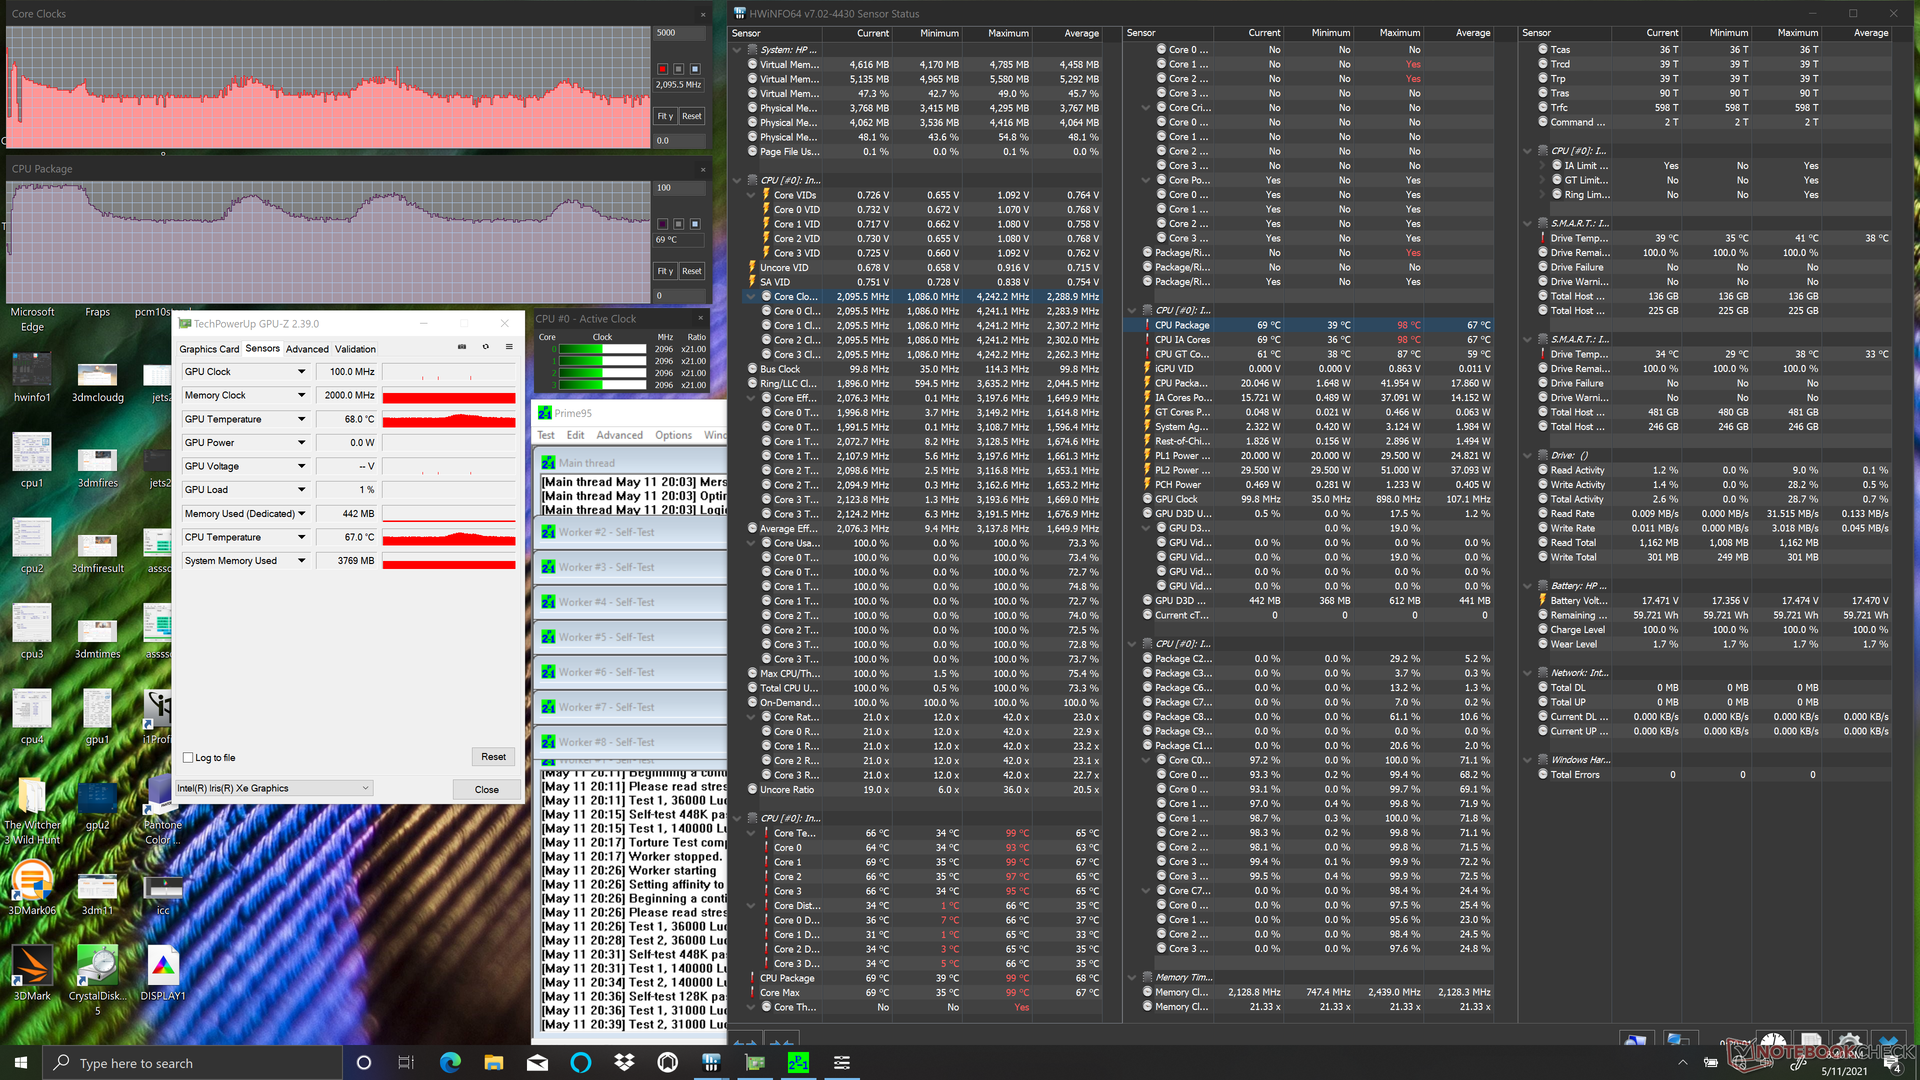
Stress Test
Guardando più da vicino le frequenze di clock della CPU e della GPU durante l'esecuzione di carichi impegnativi ci mostra esattamente perché sia i risultati del nostro test CineBench loop che i frame rates di The Witcher 3 sono sempre fluttuanti. Come mostrato dai nostri screenshots qui sotto, le frequenze di clock sono generalmente instabili quando si eseguono tali carichi anche se impostate in modalità Performance con HP Command Center. Si noti che abbiamo osservato questo stesso fenomeno sia sullo Spectre x360 14 che sullo Spectre x360 13 del 2019 per mostrare che questi risultati sono coerenti in tutta la famiglia Spectre.
Le frequenze di clock variabili puntano ad aumentare le prestazioni medie di CPU e GPU nel tempo, ma al costo ovvio di risultati instabili. Le CPU nella maggior parte degli altri Ultrabooks come l'Asus ZenBook UX425 tendono a rimanere piatte a frequenze di clock fisse per prestazioni più costanti.
L'uso della batteria non avrà un grande impatto sulle prestazioni. Un 3DMark 11 eseguito con la batteria restituisce punteggi di Physics e Graphics di 10393 e 5996 punti, rispettivamente, rispetto a 9883 e 6120 punti quando è alimentato da rete elettric.
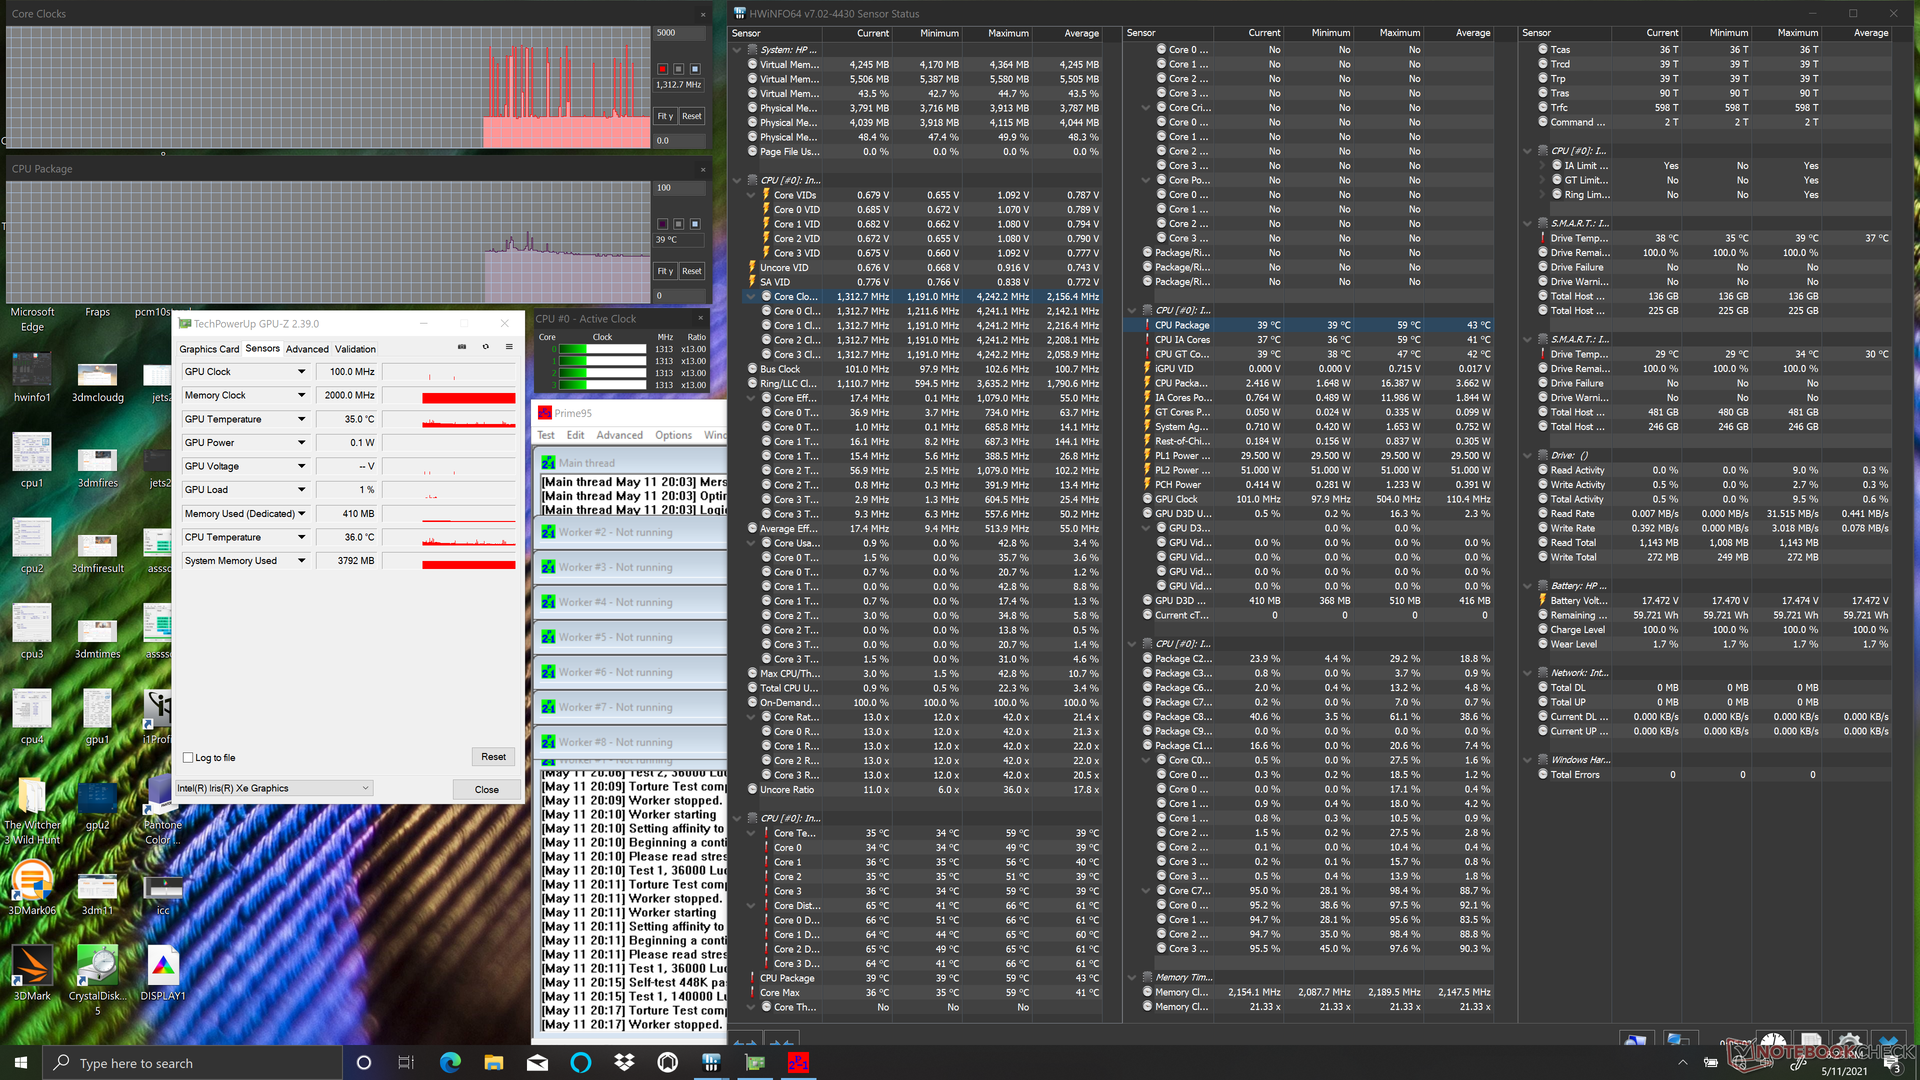
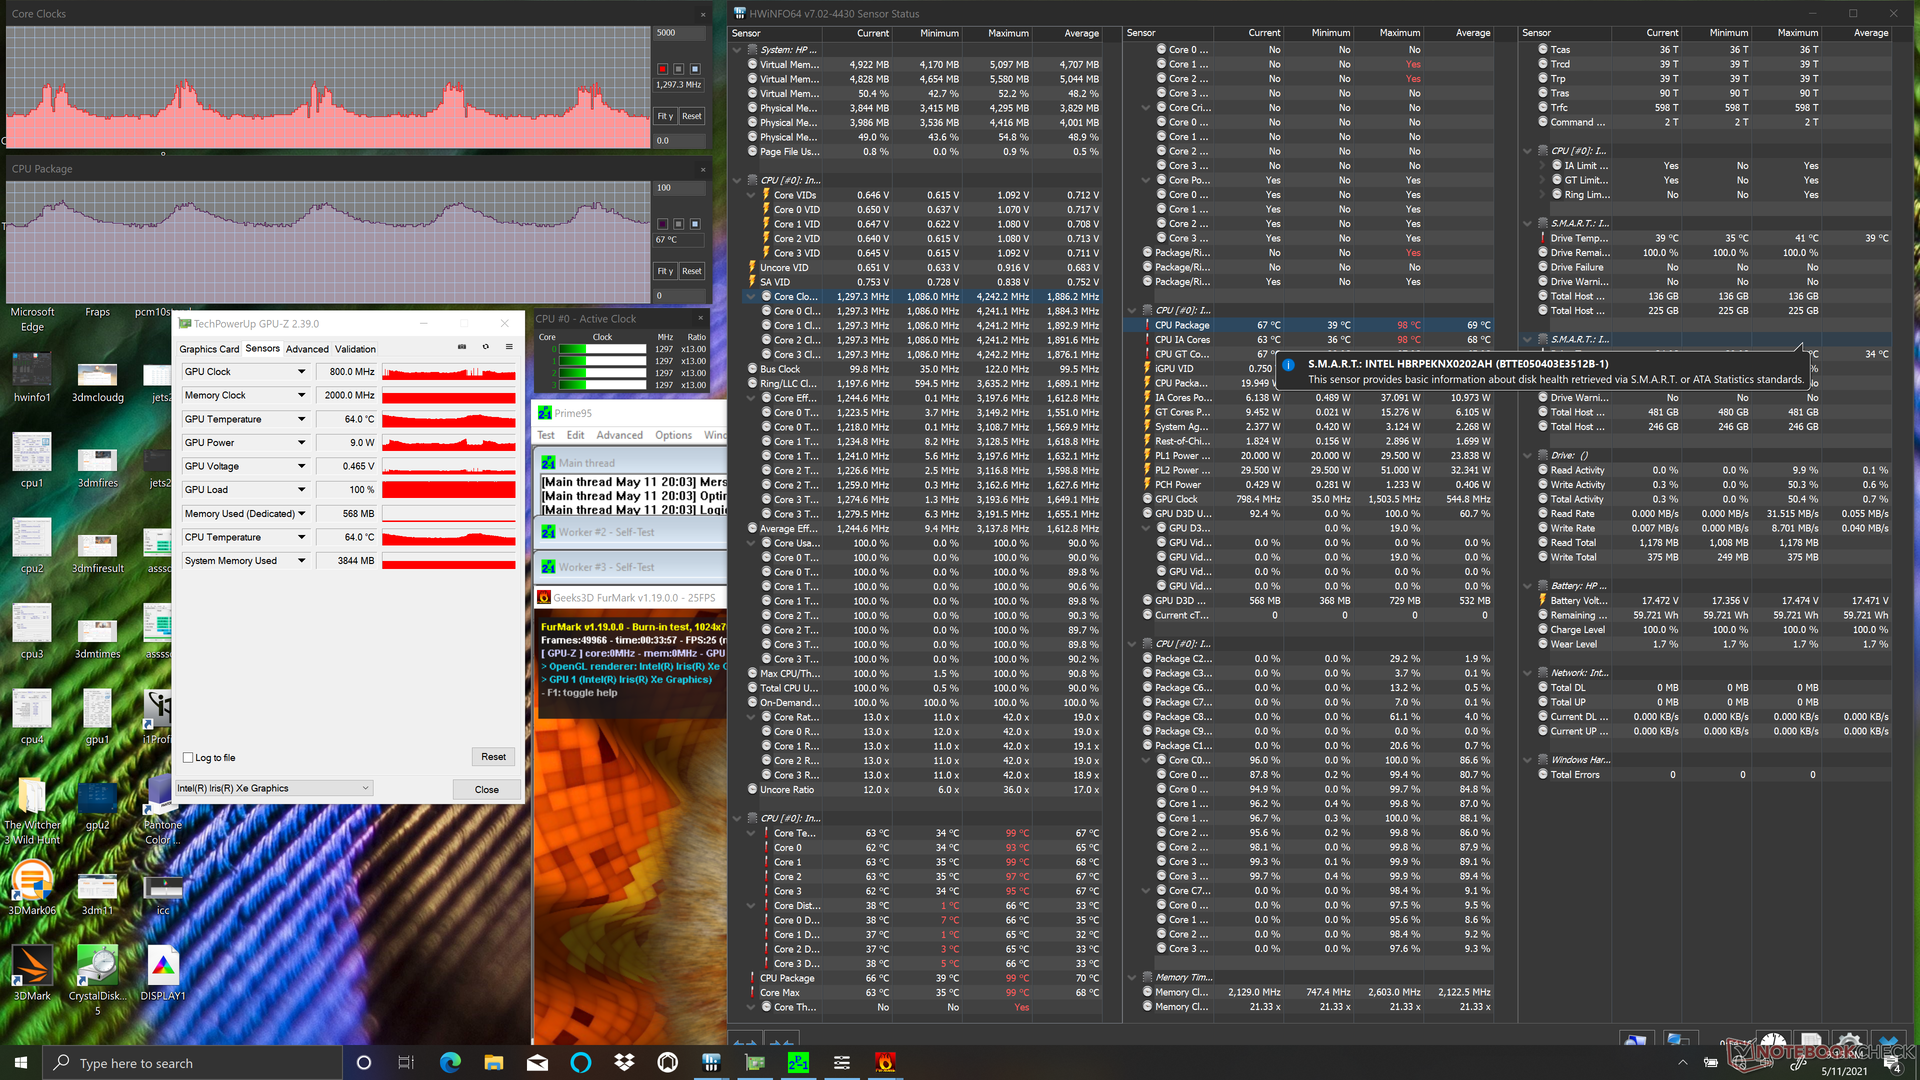
| Clock della CPU (GHz)Clock della GPU(MHz)Temperaturamedia dellaCPU (°C) |
| Sistema inattivo |
| Prime95 Stress |
| Prime95 + FurMark Stress |
| Witcher 3 Stress |
Altoparlanti


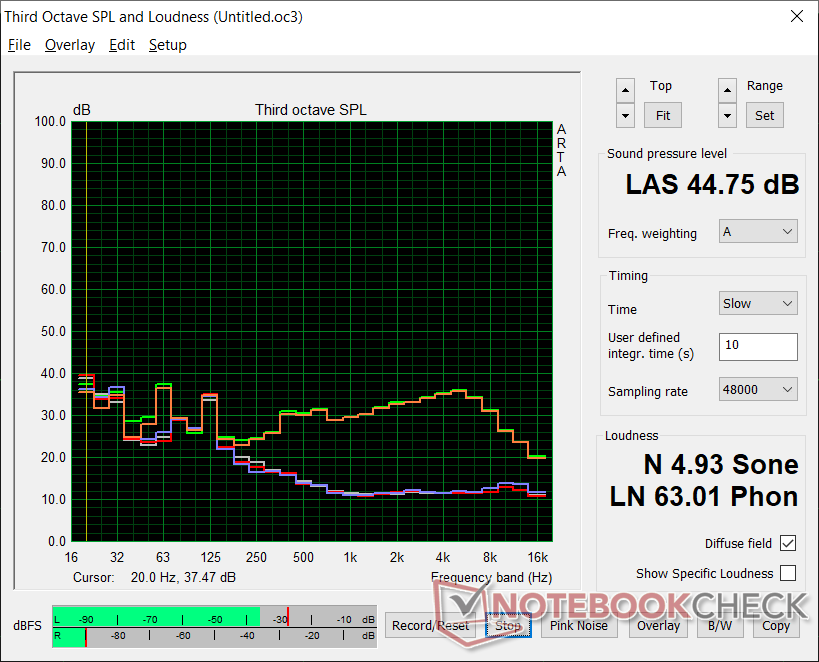
HP Spectre x360 13-aw2003dx analisi audio
(±) | potenza degli altiparlanti media ma buona (80.1 dB)
Bassi 100 - 315 Hz
(±) | bassi ridotti - in media 12.5% inferiori alla media
(±) | la linearità dei bassi è media (8.7% delta rispetto alla precedente frequenza)
Medi 400 - 2000 Hz
(±) | medi elevati - circa 5.1% superiore alla media
(+) | medi lineari (6.6% delta rispetto alla precedente frequenza)
Alti 2 - 16 kHz
(±) | alti elevati - circa 6.2% superiori alla media
(+) | alti lineari (4.9% delta rispetto alla precedente frequenza)
Nel complesso 100 - 16.000 Hz
(±) | la linearità complessiva del suono è media (16.6% di differenza rispetto alla media
Rispetto alla stessa classe
» 31% di tutti i dispositivi testati in questa classe è stato migliore, 4% simile, 66% peggiore
» Il migliore ha avuto un delta di 6%, medio di 20%, peggiore di 57%
Rispetto a tutti i dispositivi testati
» 29% di tutti i dispositivi testati in questa classe è stato migliore, 6% similare, 66% peggiore
» Il migliore ha avuto un delta di 4%, medio di 24%, peggiore di 134%
Apple MacBook 12 (Early 2016) 1.1 GHz analisi audio
(+) | gli altoparlanti sono relativamente potenti (83.6 dB)
Bassi 100 - 315 Hz
(±) | bassi ridotti - in media 11.3% inferiori alla media
(±) | la linearità dei bassi è media (14.2% delta rispetto alla precedente frequenza)
Medi 400 - 2000 Hz
(+) | medi bilanciati - solo only 2.4% rispetto alla media
(+) | medi lineari (5.5% delta rispetto alla precedente frequenza)
Alti 2 - 16 kHz
(+) | Alti bilanciati - appena 2% dalla media
(+) | alti lineari (4.5% delta rispetto alla precedente frequenza)
Nel complesso 100 - 16.000 Hz
(+) | suono nel complesso lineare (10.2% differenza dalla media)
Rispetto alla stessa classe
» 7% di tutti i dispositivi testati in questa classe è stato migliore, 2% simile, 91% peggiore
» Il migliore ha avuto un delta di 5%, medio di 18%, peggiore di 53%
Rispetto a tutti i dispositivi testati
» 5% di tutti i dispositivi testati in questa classe è stato migliore, 1% similare, 94% peggiore
» Il migliore ha avuto un delta di 4%, medio di 24%, peggiore di 134%
Gestione energetica
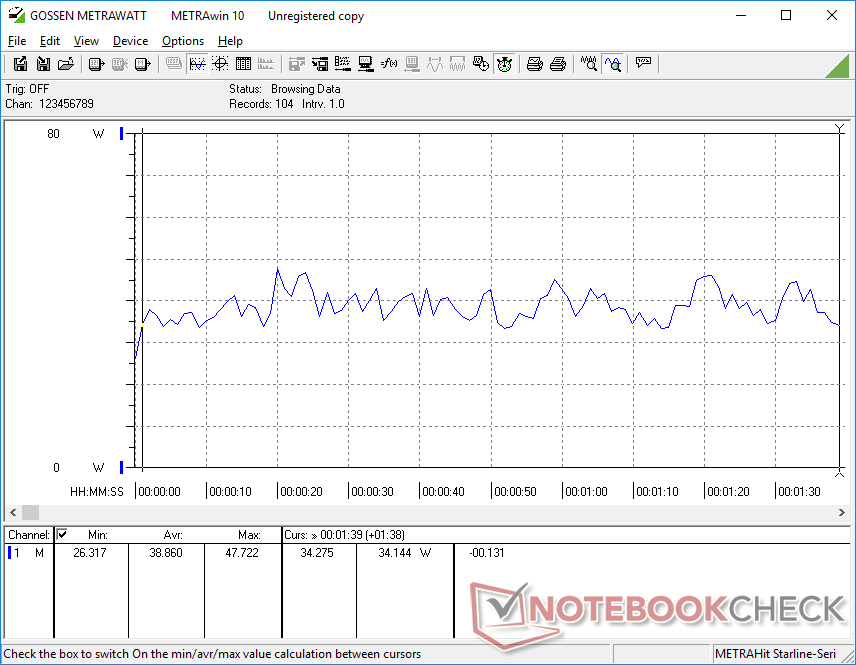
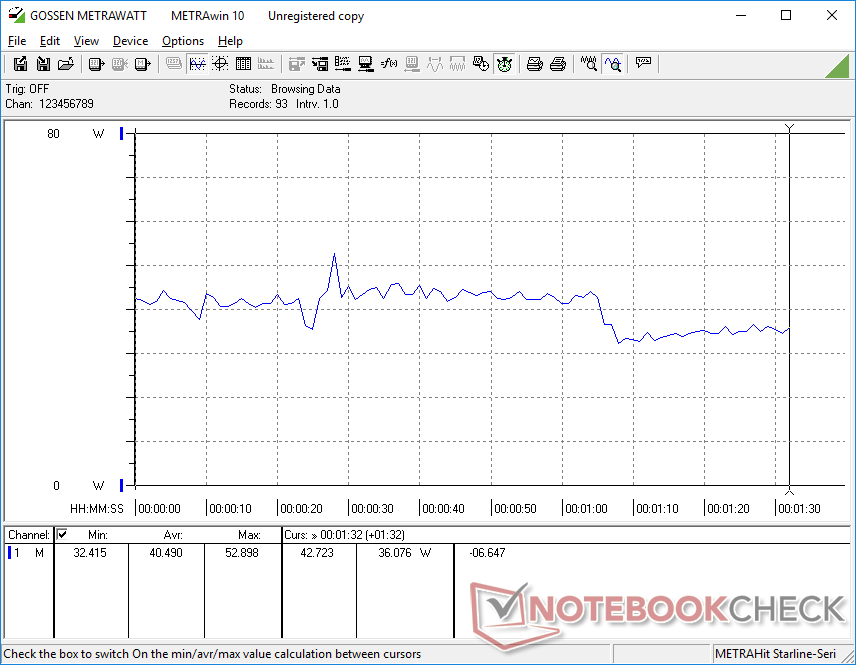
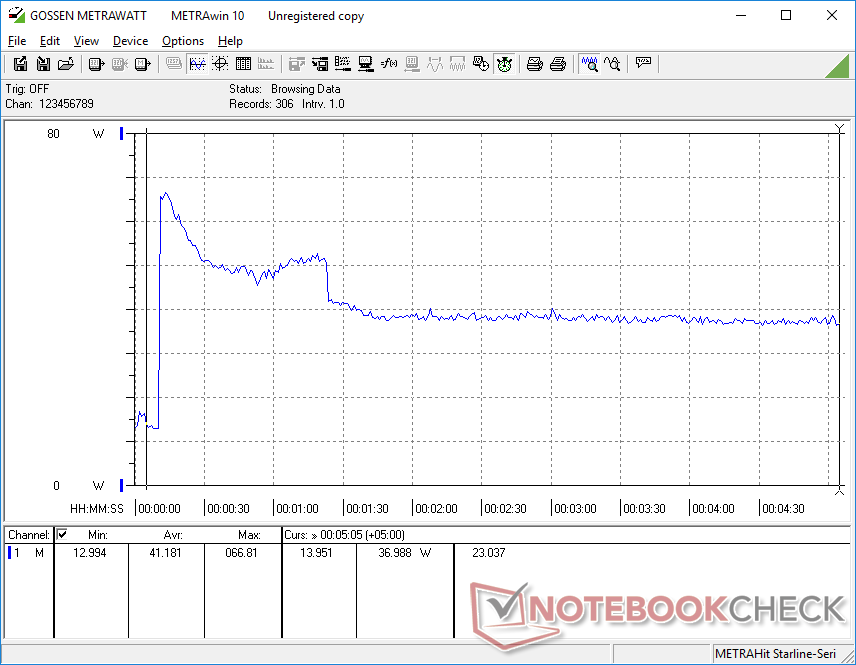
Consumo di energia
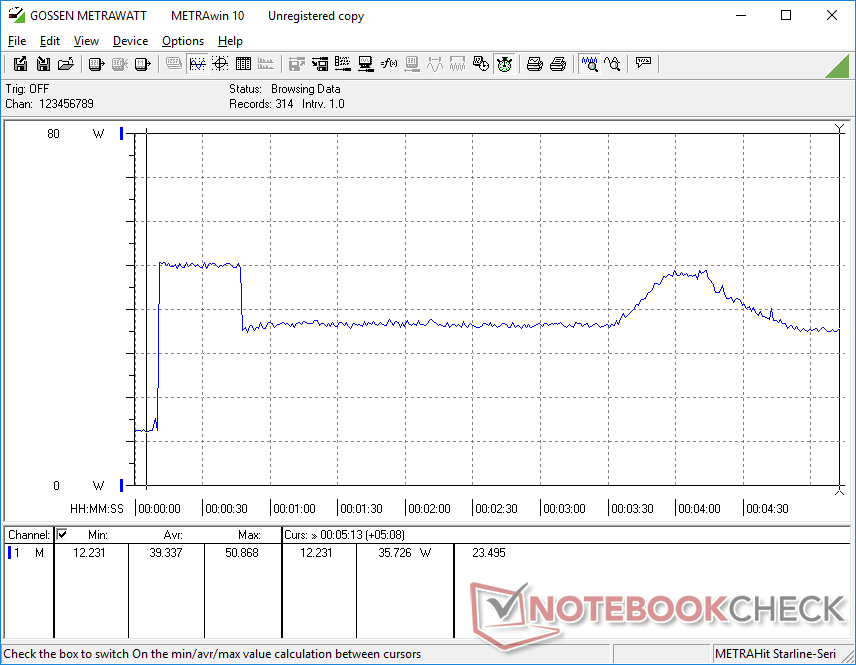
L'inattività sul desktop consuma tra 5 W e 9 W risultando essere maggiore di quello che abbiamo registrato sullo Spectre x360 14 o sullo Spectre x360 13 del 2019 a causa del pannello OLED 4K più esigente sulla nostra versione 2021. Abbiamo già dimostrato che i portatili con OLED consumeranno tipicamente più delle loro controparti IPS soprattutto quando i loro display sono impostati su colori bianchi brillanti e questo Spectre non fa eccezione. Se volete estendere la durata della batteria, allora vi consigliamo di utilizzare temi di colore più scuri. Infatti, il sistema è preconfigurato per eseguire Windows 10 in modalità scura proprio per questa ragione.
Il consumo energetico è per il resto vicino allo Spectre x360 14 a circa 40 W in media quando si eseguono carichi più elevati come i giochi. Lo Spectre x360 13 del 2019 consuma ancora meno, ma ha anche un throttling più intenso.
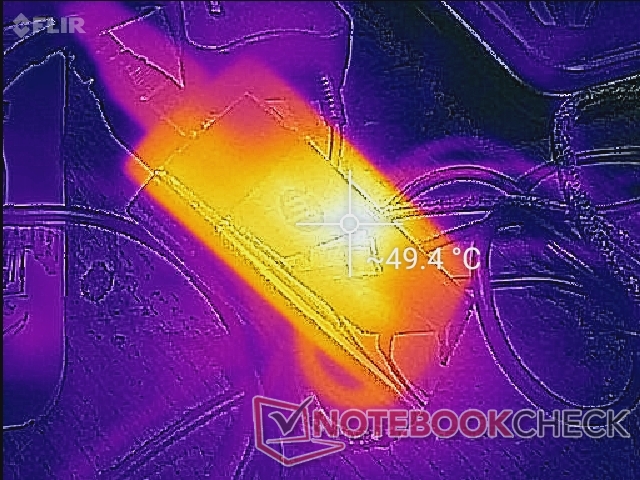
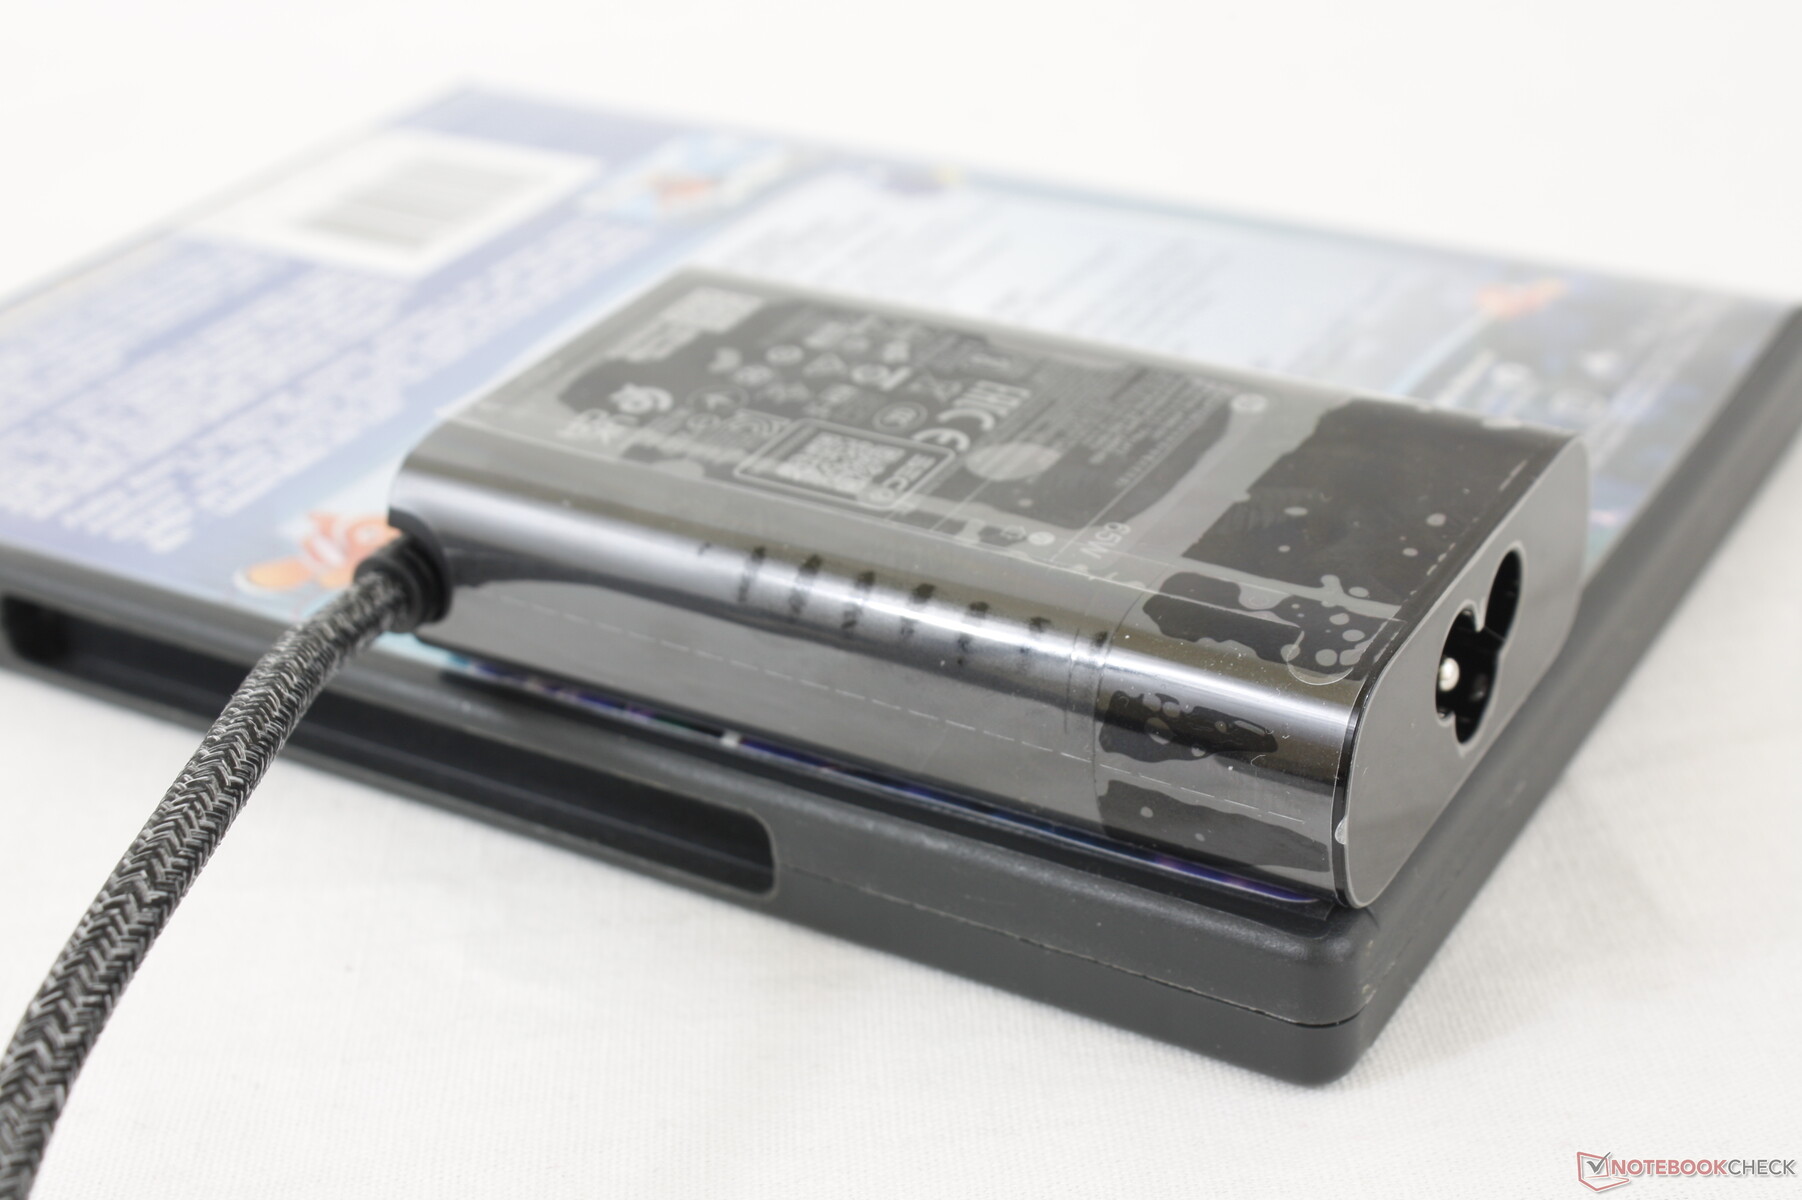
Siamo in grado di registrare un assorbimento massimo di 66,9 W dal piccolo (~8,8 x 5,4 x 2,2 cm) adattatore AC da 65 W. Questo valore è solo temporaneo a causa del limitato potenziale Turbo Boost del sistema.
| Off / Standby | |
| Idle | |
| Sotto carico |
|
Leggenda:
min: | |
| HP Spectre x360 13-aw2003dx i5-1135G7, Iris Xe G7 80EUs, Intel Optane Memory H10 with Solid State Storage 32GB + 512GB HBRPEKNX0202A(L/H), OLED, 3840x2160, 13.3" | HP Spectre x360 14t-ea000 i7-1165G7, Iris Xe G7 96EUs, Samsung SSD PM981a MZVLB512HBJQ, IPS, 1920x1280, 13.5" | HP Spectre x360 13-aw0013dx i7-1065G7, Iris Plus Graphics G7 (Ice Lake 64 EU), Intel Optane Memory H10 with Solid State Storage 32GB + 512GB HBRPEKNX0202A(L/H), IPS, 1920x1080, 13.3" | Dell XPS 13 7390 Core i7-10710U i7-10710U, UHD Graphics 620, SK Hynix PC601 NVMe 512 GB, IPS, 3840x2160, 13.3" | MSI Summit E13 Flip Evo A11MT i7-1185G7, Iris Xe G7 96EUs, Phison 1TB SM2801T24GKBB4S-E162, IPS, 1920x1200, 13.4" | Lenovo Yoga Duet 7 13IML05-82AS000WGE i5-10210U, UHD Graphics 620, Lenovo UMIS RPJTJ256MEE1OWX, IPS, 2160x1350, 13" | |
|---|---|---|---|---|---|---|
| Power Consumption | 22% | 24% | 7% | -5% | 38% | |
| Idle Minimum * (Watt) | 5.7 | 3 47% | 3.9 32% | 4.7 18% | 4.8 16% | 3.1 46% |
| Idle Average * (Watt) | 8.4 | 5.1 39% | 6.3 25% | 8.3 1% | 8.4 -0% | 5.7 32% |
| Idle Maximum * (Watt) | 8.8 | 6.4 27% | 6.8 23% | 9 -2% | 8.6 2% | 8.7 1% |
| Load Average * (Watt) | 38.9 | 39.6 -2% | 32.6 16% | 42 -8% | 47.1 -21% | 20.5 47% |
| Witcher 3 ultra * (Watt) | 40.5 | 39.6 2% | 25.6 37% | 51.6 -27% | ||
| Load Maximum * (Watt) | 66.9 | 56.2 16% | 59 12% | 49 27% | 65.9 1% | 22.6 66% |
* ... Meglio usare valori piccoli
Durata della batteria
I tempi di autonomia sono significativamente più brevi di quelli che abbiamo registrato sul modello IPS 2019. L'inattività in modalità Power Saver all'impostazione di luminosità minima dura solo 12 ore rispetto alle 36 ore del vecchio modello. Allo stesso modo, la navigazione sul web in modalità Balanced a 150 nit di luminosità dura solo 6 ore e 10 ore sul modello 2021 e sul modello 2019, rispettivamente. Il prezzo da pagare per il 4K OLED può essere piuttosto alto se non si ha un accesso frequente alle prese elettriche.
La ricarica completa richiede circa 1,5-2 ore. Si noti che questo stesso caricatore USB-C può essere utilizzato anche per ricaricare la maggior parte degli altri computer portatili con USB-C Power Delivery.
| HP Spectre x360 13-aw2003dx i5-1135G7, Iris Xe G7 80EUs, 60 Wh | HP Spectre x360 14t-ea000 i7-1165G7, Iris Xe G7 96EUs, 66 Wh | HP Spectre x360 13-aw0013dx i7-1065G7, Iris Plus Graphics G7 (Ice Lake 64 EU), 60 Wh | Dell XPS 13 7390 Core i7-10710U i7-10710U, UHD Graphics 620, 52 Wh | MSI Summit E13 Flip Evo A11MT i7-1185G7, Iris Xe G7 96EUs, 70 Wh | Lenovo Yoga Duet 7 13IML05-82AS000WGE i5-10210U, UHD Graphics 620, 39 Wh | |
|---|---|---|---|---|---|---|
| Autonomia della batteria | 111% | 108% | 38% | 54% | 13% | |
| Reader / Idle (h) | 11.9 | 36.4 206% | 37.1 212% | 21.1 77% | 12.8 8% | |
| WiFi v1.3 (h) | 6.1 | 11.8 93% | 9.9 62% | 8.4 38% | 11.2 84% | 8.7 43% |
| Load (h) | 1.8 | 2.4 33% | 2.7 50% | 1.8 0% | 1.6 -11% |
Pro
Contro
Valutazione complessiva del computer portatile Spectre x360 13
La ragione principale per scegliere lo Spectre x360 13 con Intel di 11a generazione invece del vecchio Spectre x360 13 con Intel di 10a generazione è l'aumento delle prestazioni grafiche. Il salto dal 60% al 100% rispetto alla Iris Plus G7 nello Spectre x360 13 del 2019 è abbastanza significativo da essere evidente per gli editor e i gamers.
Gli utenti non interessati ai benefici di Iris Xe potrebbero voler considerare invece lo Spectre x360 13 con 10th gen Intel. I soldi risparmiati possono essere investiti su più RAM e storage piuttosto che sul 4K OLED.
Se le vostre attività quotidiane coinvolgono principalmente lo streaming video 4K, la navigazione e l'editing occasionale, allora il modello di 11a generazione offrirà poco rispetto al modello di 10a generazione, poiché praticamente tutto il resto dei due computer portatili rimane identico. Purtroppo, il modello di 11a generazione è dotato di Wi-Fi 6 invece di Wi-Fi 6E, PCIe 3.0 invece di PCIe 4.0, Thunderbolt 3 invece di Thunderbolt 4, e nessun cambiamento nelle prestazioni della RAM rispetto al modello dell'anno scorso.
Il pannello OLED è anche un po' deludente rispetto ai tipici pannelli IPS 1080p o 4K degli altri modelli Spectre. La durata della batteria è più breve, il display è più debole, la qualità dell'immagine appare più granulosa, e la modulazione di larghezza d'impulso (o flickering) è presente. Gli utenti ottengono colori più profondi, un contrasto più elevato, una risoluzione nativa più alta e tempi di risposta più rapidi in cambio, naturalmente, ma i notevoli svantaggi spiccano restano una nota dolente.
Prezzo e disponibilità
HP Spectre x360 13-aw2003dx
- 08/31/2022 v7 (old)
Allen Ngo
Price comparison
