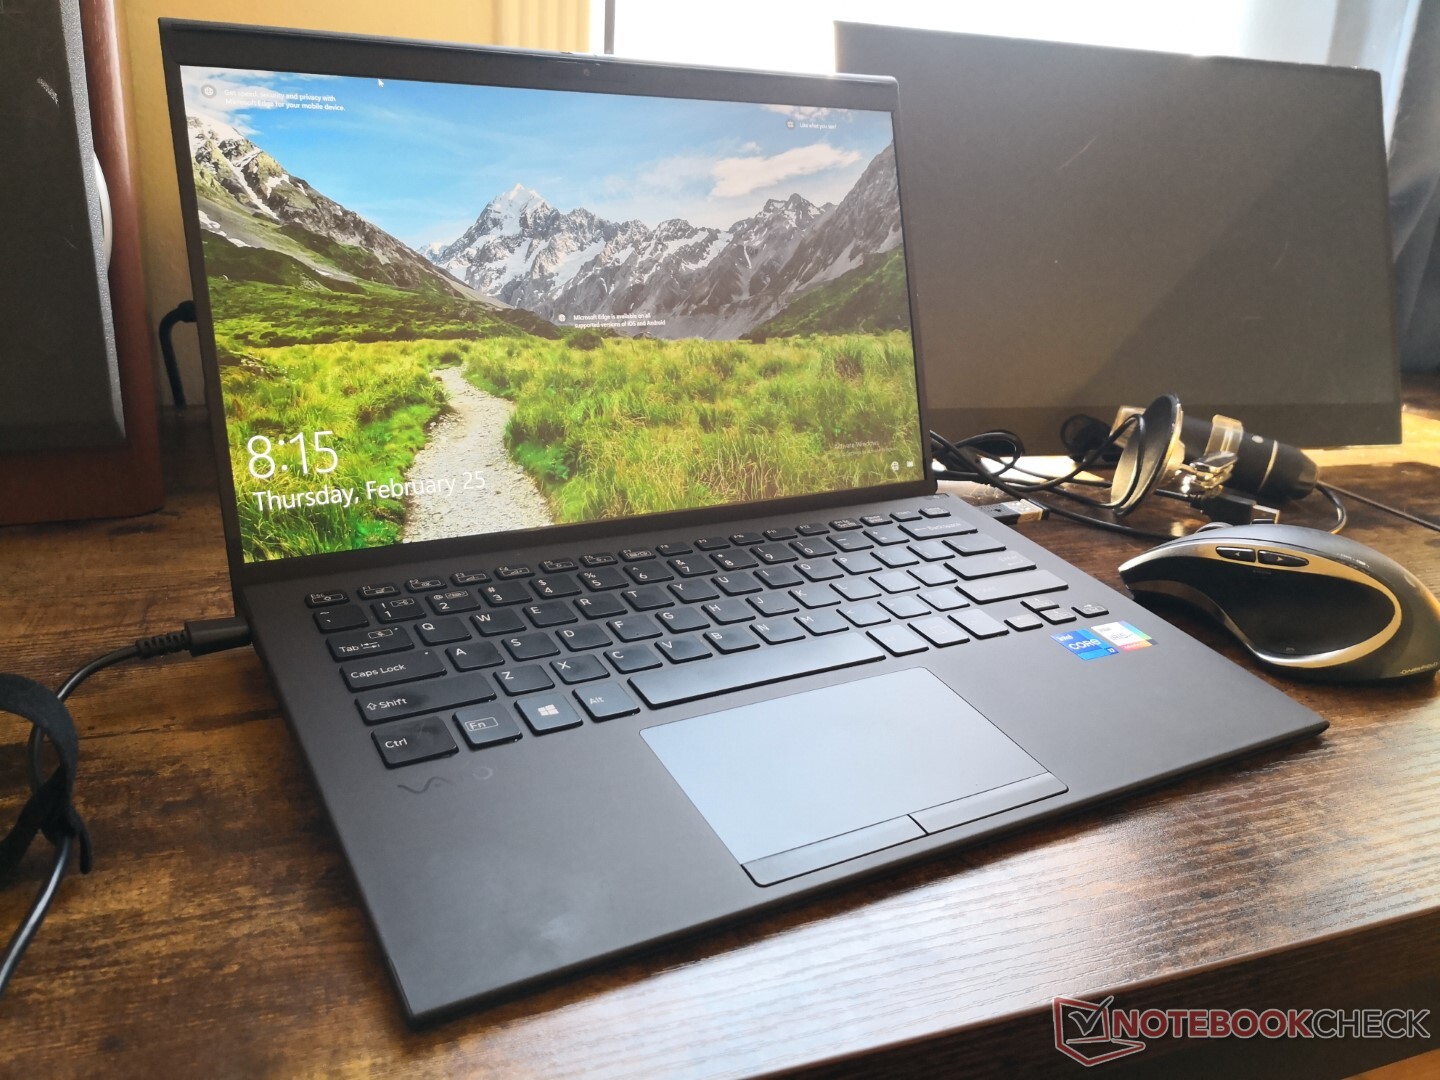
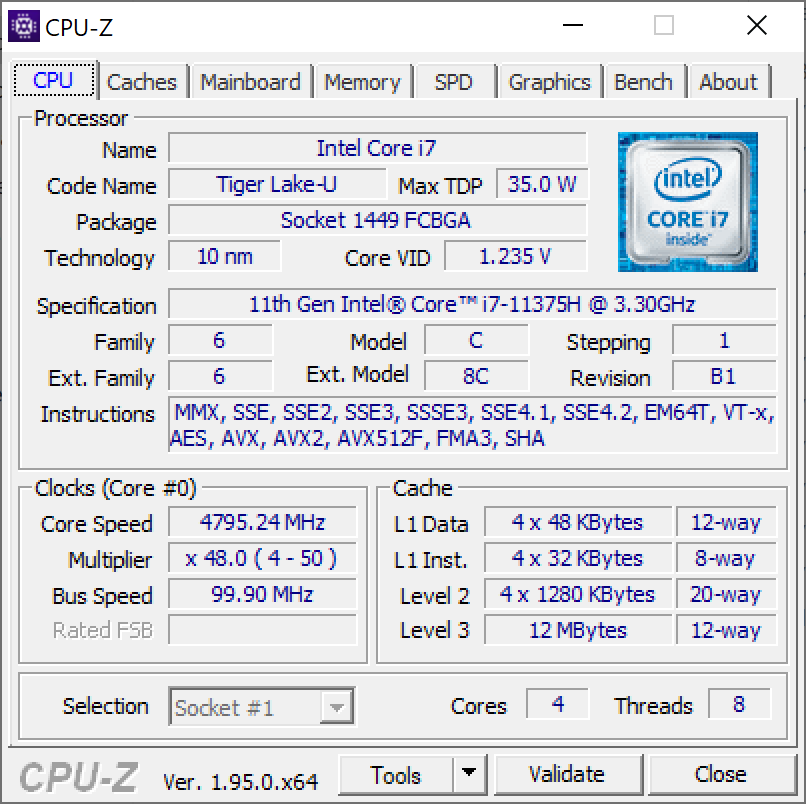
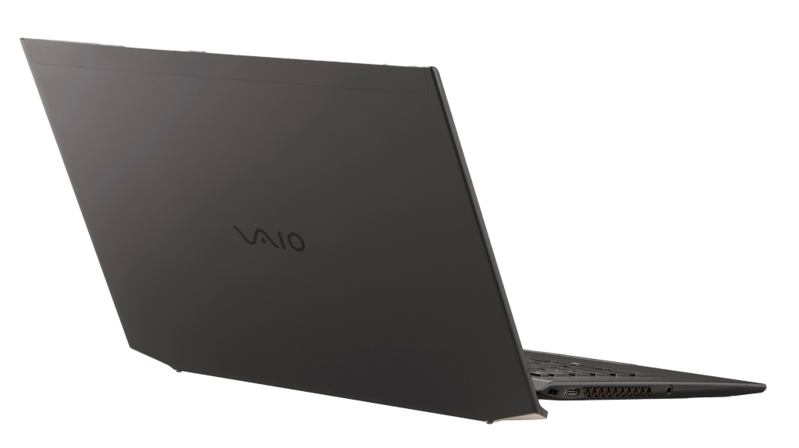
Recensione del VAIO Z Core i7-11375H: portatile per amministratori delegati e dirigenti
Confronto con i potenziali concorrenti
Punteggio | Data | Modello | Peso | Altezza | Dimensione | Risoluzione | Prezzo |
|---|---|---|---|---|---|---|---|
| 83.8 % v7 (old) | 02/2021 | VAIO Z VJZ141C11L i7-11375H, Iris Xe G7 96EUs | 1 kg | 16.9 mm | 14.00" | 3840x2160 | |
| 87.4 % v7 (old) | 12/2020 | Dell XPS 13 9310 Core i7 4K i7-1185G7, Iris Xe G7 96EUs | 1.3 kg | 14.8 mm | 13.40" | 3840x2400 | |
| 82.6 % v7 (old) | 02/2021 | Dell Latitude 14 5411-WJ40N i7-10850H, GeForce MX250 | 1.5 kg | 21 mm | 14.00" | 1920x1080 | |
| 89.4 % v7 (old) | 12/2020 | HP Spectre x360 14t-ea000 i7-1165G7, Iris Xe G7 96EUs | 1.3 kg | 17.2 mm | 13.50" | 1920x1280 | |
| 84.2 % v7 (old) | 01/2021 | Lenovo IdeaPad Slim 9i 14ITL5 i7-1165G7, Iris Xe G7 96EUs | 1.3 kg | 14.6 mm | 14.00" | 3840x2160 | |
| 84.2 % v7 (old) | 10/2020 | Asus ZenBook 14 UX425EA i7-1165G7, Iris Xe G7 96EUs | 1.2 kg | 13.9 mm | 14.00" | 1920x1080 | |
| 86.3 % v7 (old) | 12/2020 | Huawei MateBook 14 2020 Intel i7-10510U, GeForce MX350 | 1.5 kg | 15.9 mm | 14.00" | 2160x1440 |


| |||||||||||||||||||||||||
Distribuzione della luminosità: 90 %
Al centro con la batteria: 368.3 cd/m²
Contrasto: 1674:1 (Nero: 0.22 cd/m²)
ΔE ColorChecker Calman: 3.27 | ∀{0.5-29.43 Ø4.71}
calibrated: 2.33
ΔE Greyscale Calman: 2.9 | ∀{0.09-98 Ø4.96}
99.5% sRGB (Argyll 1.6.3 3D)
76.8% AdobeRGB 1998 (Argyll 1.6.3 3D)
86.4% AdobeRGB 1998 (Argyll 3D)
99.5% sRGB (Argyll 3D)
95.7% Display P3 (Argyll 3D)
Gamma: 2.2
CCT: 6071 K
| VAIO Z VJZ141C11L BOE NE140QUM-N62, IPS, 14", 3840x2160 | Dell XPS 13 9310 Core i7 4K Sharp LQ134R1, IPS, 13.4", 3840x2400 | Dell Latitude 14 5411-WJ40N AU Optronics AUO463D, IPS, 14", 1920x1080 | HP Spectre x360 14t-ea000 LG Philips LGD0663, IPS, 13.5", 1920x1280 | Lenovo IdeaPad Slim 9i 14ITL5 B140ZAN01.7, IPS, 14", 3840x2160 | Asus ZenBook 14 UX425EA AU Optronics B140HAN06.8, IPS, 14", 1920x1080 | Huawei MateBook 14 2020 Intel TV140WTM-NH0, IPS LED, 14", 2160x1440 | |
|---|---|---|---|---|---|---|---|
| Display | -8% | -53% | -18% | -5% | -16% | -17% | |
| Display P3 Coverage (%) | 95.7 | 80.2 -16% | 37.43 -61% | 65.8 -31% | 87.4 -9% | 68.6 -28% | 67.1 -30% |
| sRGB Coverage (%) | 99.5 | 100 1% | 56.2 -44% | 98.2 -1% | 99.9 0% | 98.3 -1% | 99.1 0% |
| AdobeRGB 1998 Coverage (%) | 86.4 | 78.9 -9% | 38.67 -55% | 67.9 -21% | 81.1 -6% | 69.8 -19% | 69 -20% |
| Response Times | -35% | 42% | -37% | -18% | 0% | 20% | |
| Response Time Grey 50% / Grey 80% * (ms) | 46.8 ? | 59.2 ? -26% | 31 ? 34% | 62 ? -32% | 48.4 ? -3% | 49.6 ? -6% | 37.6 ? 20% |
| Response Time Black / White * (ms) | 28 ? | 40.4 ? -44% | 14 ? 50% | 39.6 ? -41% | 37.2 ? -33% | 26.4 ? 6% | 22.4 ? 20% |
| PWM Frequency (Hz) | 2137 ? | 59520 ? | |||||
| Screen | 5% | -60% | 8% | -16% | 3% | -4% | |
| Brightness middle (cd/m²) | 368.3 | 508.7 38% | 256 -30% | 443.5 20% | 475.8 29% | 375.1 2% | 458 24% |
| Brightness (cd/m²) | 361 | 479 33% | 236 -35% | 394 9% | 463 28% | 371 3% | 448 24% |
| Brightness Distribution (%) | 90 | 84 -7% | 86 -4% | 78 -13% | 89 -1% | 91 1% | 89 -1% |
| Black Level * (cd/m²) | 0.22 | 0.3 -36% | 0.23 -5% | 0.17 23% | 0.44 -100% | 0.34 -55% | 0.25 -14% |
| Contrast (:1) | 1674 | 1696 1% | 1113 -34% | 2609 56% | 1081 -35% | 1103 -34% | 1832 9% |
| Colorchecker dE 2000 * | 3.27 | 2.72 17% | 5.76 -76% | 2.7 17% | 3.81 -17% | 1.79 45% | 3.4 -4% |
| Colorchecker dE 2000 max. * | 5.43 | 4.7 13% | 20.65 -280% | 4.36 20% | 6.96 -28% | 3.05 44% | 6.7 -23% |
| Colorchecker dE 2000 calibrated * | 2.33 | 1.92 18% | 2.61 -12% | 2.55 -9% | 1.79 23% | 1.7 27% | |
| Greyscale dE 2000 * | 2.9 | 3.4 -17% | 4 -38% | 3.4 -17% | 4.1 -41% | 2.3 21% | 4.9 -69% |
| Gamma | 2.2 100% | 2.11 104% | 2.52 87% | 2.09 105% | 2.14 103% | 2.29 96% | 2.16 102% |
| CCT | 6071 107% | 6245 104% | 6182 105% | 6144 106% | 6564 99% | 6405 101% | 7704 84% |
| Color Space (Percent of AdobeRGB 1998) (%) | 76.8 | 70.7 -8% | 36 -53% | 62.1 -19% | 72.4 -6% | 63.9 -17% | 63.5 -17% |
| Color Space (Percent of sRGB) (%) | 99.5 | 100 1% | 56 -44% | 98.5 -1% | 99.9 0% | 98.8 -1% | 99.1 0% |
| Media totale (Programma / Settaggio) | -13% /
-3% | -24% /
-45% | -16% /
-3% | -13% /
-14% | -4% /
-1% | -0% /
-3% |
* ... Meglio usare valori piccoli
Tempi di risposta del Display
| ↔ Tempi di risposta dal Nero al Bianco | ||
|---|---|---|
| 28 ms ... aumenta ↗ e diminuisce ↘ combinato | ↗ 17.2 ms Incremento | 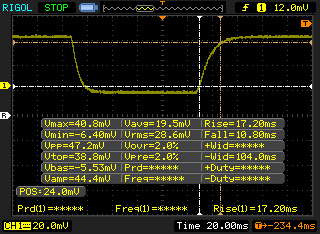 |
| ↘ 10.8 ms Calo | ||
| Lo schermo mostra tempi di risposta relativamente lenti nei nostri tests e potrebbe essere troppo lento per i gamers. In confronto, tutti i dispositivi di test variano da 0.1 (minimo) a 240 (massimo) ms. » 71 % di tutti i dispositivi è migliore. Questo significa che i tempi di risposta rilevati sono peggiori rispetto alla media di tutti i dispositivi testati (19.8 ms). | ||
| ↔ Tempo di risposta dal 50% Grigio all'80% Grigio | ||
| 46.8 ms ... aumenta ↗ e diminuisce ↘ combinato | ↗ 23.6 ms Incremento | 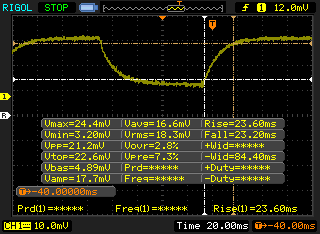 |
| ↘ 23.2 ms Calo | ||
| Lo schermo mostra tempi di risposta lenti nei nostri tests e sarà insoddisfacente per i gamers. In confronto, tutti i dispositivi di test variano da 0.165 (minimo) a 636 (massimo) ms. » 81 % di tutti i dispositivi è migliore. Questo significa che i tempi di risposta rilevati sono peggiori rispetto alla media di tutti i dispositivi testati (30.9 ms). | ||
Sfarfallio dello schermo / PWM (Pulse-Width Modulation)
| flickering dello schermo / PWM non rilevato | 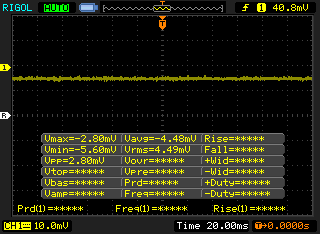 | ||
In confronto: 52 % di tutti i dispositivi testati non utilizza PWM per ridurre la luminosita' del display. Se è rilevato PWM, una media di 7741 (minimo: 5 - massimo: 343500) Hz è stata rilevata. | |||
Cinebench R15: CPU Multi 64Bit | CPU Single 64Bit
Blender: v2.79 BMW27 CPU
7-Zip 18.03: 7z b 4 -mmt1 | 7z b 4
Geekbench 5.5: Single-Core | Multi-Core
HWBOT x265 Benchmark v2.2: 4k Preset
LibreOffice : 20 Documents To PDF
R Benchmark 2.5: Overall mean
Cinebench R15: CPU Multi 64Bit | CPU Single 64Bit
Blender: v2.79 BMW27 CPU
7-Zip 18.03: 7z b 4 -mmt1 | 7z b 4
Geekbench 5.5: Single-Core | Multi-Core
HWBOT x265 Benchmark v2.2: 4k Preset
LibreOffice : 20 Documents To PDF
R Benchmark 2.5: Overall mean
* ... Meglio usare valori piccoli
| PCMark 10 Score | 5268 punti | |
Aiuto | ||
| DPC Latencies / LatencyMon - interrupt to process latency (max), Web, Youtube, Prime95 | |
| Dell Latitude 14 5411-WJ40N | |
| HP Spectre x360 14t-ea000 | |
| Dell XPS 13 9310 Core i7 4K | |
| Asus ZenBook 14 UX425EA | |
| Lenovo IdeaPad Slim 9i 14ITL5 | |
| VAIO Z VJZ141C11L | |
| Huawei MateBook 14 2020 Intel | |
* ... Meglio usare valori piccoli
| VAIO Z VJZ141C11L Samsung PM9A1 MZVL2512HCJQ | Dell XPS 13 9310 Core i7 4K Micron 2300 512GB MTFDHBA512TDV | Dell Latitude 14 5411-WJ40N SK Hynix PC611 512GB | HP Spectre x360 14t-ea000 Samsung SSD PM981a MZVLB512HBJQ | Lenovo IdeaPad Slim 9i 14ITL5 WDC PC SN730 SDBPNTY-512G | |
|---|---|---|---|---|---|
| AS SSD | -57% | -34% | -31% | -37% | |
| Seq Read (MB/s) | 5533 | 2144 -61% | 2681 -52% | 2188 -60% | 2068 -63% |
| Seq Write (MB/s) | 3289 | 1389 -58% | 1430 -57% | 1320 -60% | 1414 -57% |
| 4K Read (MB/s) | 72.5 | 49.77 -31% | 49.22 -32% | 53.5 -26% | 46.99 -35% |
| 4K Write (MB/s) | 213.7 | 105 -51% | 118 -45% | 123.7 -42% | 211.9 -1% |
| 4K-64 Read (MB/s) | 2128 | 855 -60% | 1139 -46% | 1010 -53% | 1027 -52% |
| 4K-64 Write (MB/s) | 2032 | 1660 -18% | 1488 -27% | 1808 -11% | 978 -52% |
| Access Time Read * (ms) | 0.039 | 0.058 -49% | 0.057 -46% | 0.055 -41% | 0.057 -46% |
| Access Time Write * (ms) | 0.06 | 0.272 -353% | 0.031 48% | 0.076 -27% | 0.066 -10% |
| Score Read (Points) | 2754 | 1119 -59% | 1456 -47% | 1282 -53% | 1281 -53% |
| Score Write (Points) | 2574 | 1904 -26% | 1749 -32% | 2063 -20% | 1331 -48% |
| Score Total (Points) | 6629 | 3570 -46% | 3895 -41% | 3970 -40% | 3243 -51% |
| Copy ISO MB/s (MB/s) | 2235 | 1929 -14% | 1644 -26% | 1891 -15% | |
| Copy Program MB/s (MB/s) | 796 | 1012 27% | 920 16% | 604 -24% | |
| Copy Game MB/s (MB/s) | 1652 | 1737 5% | 1725 4% | 1422 -14% | |
| CrystalDiskMark 5.2 / 6 | -50% | -46% | -45% | -44% | |
| Write 4K (MB/s) | 236.7 | 86 -64% | 125.9 -47% | 82.2 -65% | 131.5 -44% |
| Read 4K (MB/s) | 78.6 | 40.11 -49% | 42.45 -46% | 45.7 -42% | 36.83 -53% |
| Write Seq (MB/s) | 3689 | 1738 -53% | 2064 -44% | 2000 -46% | 1614 -56% |
| Read Seq (MB/s) | 4340 | 1553 -64% | 1627 -63% | 2206 -49% | 2030 -53% |
| Write 4K Q32T1 (MB/s) | 646 | 454.9 -30% | 419.8 -35% | 451.2 -30% | 516 -20% |
| Read 4K Q32T1 (MB/s) | 717 | 385.4 -46% | 382.1 -47% | 351 -51% | 419.7 -41% |
| Write Seq Q32T1 (MB/s) | 4396 | 2784 -37% | 2729 -38% | 2982 -32% | 2705 -38% |
| Read Seq Q32T1 (MB/s) | 6804 | 3217 -53% | 3441 -49% | 3529 -48% | 3390 -50% |
| Media totale (Programma / Settaggio) | -54% /
-54% | -40% /
-39% | -38% /
-36% | -41% /
-40% |
* ... Meglio usare valori piccoli

Throttling disco: DiskSpd Read Loop, Queue Depth 8
| 3DMark 11 Performance | 7606 punti | |
| 3DMark Cloud Gate Standard Score | 20177 punti | |
| 3DMark Fire Strike Score | 5111 punti | |
| 3DMark Time Spy Score | 1852 punti | |
Aiuto | ||
| basso | medio | alto | ultra | QHD | 4K | |
|---|---|---|---|---|---|---|
| GTA V (2015) | 103 | 84.8 | 29.8 | 12.5 | 8.55 | 8.45 |
| The Witcher 3 (2015) | 97.8 | 63.5 | 45.9 | 15.7 | 11.7 | |
| Dota 2 Reborn (2015) | 85.3 | 87.4 | 58.4 | 54.6 | 26 | |
| Final Fantasy XV Benchmark (2018) | 47.3 | 26.2 | 18.7 | 14.1 | 8.01 | |
| X-Plane 11.11 (2018) | 32.1 | 31 | 28.5 | 17.6 | ||
| Strange Brigade (2018) | 95.9 | 42.1 | 33.5 | 27.2 | 19.5 | 11.3 |
| VAIO Z VJZ141C11L Iris Xe G7 96EUs, i7-11375H, Samsung PM9A1 MZVL2512HCJQ | Dell XPS 13 9310 Core i7 4K Iris Xe G7 96EUs, i7-1185G7, Micron 2300 512GB MTFDHBA512TDV | HP Spectre x360 14t-ea000 Iris Xe G7 96EUs, i7-1165G7, Samsung SSD PM981a MZVLB512HBJQ | Lenovo IdeaPad Slim 9i 14ITL5 Iris Xe G7 96EUs, i7-1165G7, WDC PC SN730 SDBPNTY-512G | Asus ZenBook 14 UX425EA Iris Xe G7 96EUs, i7-1165G7, Intel SSD 660p 1TB SSDPEKNW010T8 | Huawei MateBook 14 2020 Intel GeForce MX350, i7-10510U, Lite-On CA5-8D512 | |
|---|---|---|---|---|---|---|
| Noise | 10% | 12% | 5% | -1% | 2% | |
| off /ambiente * (dB) | 26.1 | 27.7 -6% | 25.8 1% | 26.7 -2% | 29.8 -14% | 29.3 -12% |
| Idle Minimum * (dB) | 26.1 | 27.8 -7% | 25.9 1% | 26.7 -2% | 29.9 -15% | 29.3 -12% |
| Idle Average * (dB) | 26.1 | 27.8 -7% | 25.9 1% | 26.7 -2% | 31 -19% | 29.3 -12% |
| Idle Maximum * (dB) | 29.9 | 27.8 7% | 25.9 13% | 26.7 11% | 31 -4% | 30.8 -3% |
| Load Average * (dB) | 36.3 | 27.9 23% | 26.4 27% | 34 6% | 35.6 2% | 35.7 2% |
| Witcher 3 ultra * (dB) | 43.7 | 32.8 25% | 36.9 16% | 43.5 -0% | 37.4 14% | 35.7 18% |
| Load Maximum * (dB) | 55.4 | 37 33% | 41.5 25% | 43.5 21% | 40.8 26% | 37.9 32% |
* ... Meglio usare valori piccoli
Rumorosità
| Idle |
| 26.1 / 26.1 / 29.9 dB(A) |
| Sotto carico |
| 36.3 / 55.4 dB(A) |
 | ||
30 dB silenzioso 40 dB(A) udibile 50 dB(A) rumoroso |
||
min: | ||
(±) La temperatura massima sul lato superiore è di 40 °C / 104 F, rispetto alla media di 34.3 °C / 94 F, che varia da 21.2 a 62.5 °C per questa classe Office.
(±) Il lato inferiore si riscalda fino ad un massimo di 45 °C / 113 F, rispetto alla media di 36.8 °C / 98 F
(+) In idle, la temperatura media del lato superiore è di 28.2 °C / 83 F, rispetto alla media deld ispositivo di 29.5 °C / 85 F.
(+) I poggiapolsi e il touchpad sono piu' freddi della temperatura della pelle con un massimo di 26.4 °C / 79.5 F e sono quindi freddi al tatto.
(±) La temperatura media della zona del palmo della mano di dispositivi simili e'stata di 27.6 °C / 81.7 F (+1.2 °C / 2.2 F).
VAIO Z VJZ141C11L analisi audio
(+) | gli altoparlanti sono relativamente potenti (88.4 dB)
Bassi 100 - 315 Hz
(-) | quasi nessun basso - in media 25.3% inferiori alla media
(±) | la linearità dei bassi è media (10.8% delta rispetto alla precedente frequenza)
Medi 400 - 2000 Hz
(+) | medi bilanciati - solo only 4.2% rispetto alla media
(+) | medi lineari (6.5% delta rispetto alla precedente frequenza)
Alti 2 - 16 kHz
(+) | Alti bilanciati - appena 3.3% dalla media
(+) | alti lineari (5.1% delta rispetto alla precedente frequenza)
Nel complesso 100 - 16.000 Hz
(±) | la linearità complessiva del suono è media (19.6% di differenza rispetto alla media
Rispetto alla stessa classe
» 41% di tutti i dispositivi testati in questa classe è stato migliore, 8% simile, 51% peggiore
» Il migliore ha avuto un delta di 7%, medio di 21%, peggiore di 53%
Rispetto a tutti i dispositivi testati
» 49% di tutti i dispositivi testati in questa classe è stato migliore, 7% similare, 44% peggiore
» Il migliore ha avuto un delta di 4%, medio di 23%, peggiore di 134%
Apple MacBook 12 (Early 2016) 1.1 GHz analisi audio
(+) | gli altoparlanti sono relativamente potenti (83.6 dB)
Bassi 100 - 315 Hz
(±) | bassi ridotti - in media 11.3% inferiori alla media
(±) | la linearità dei bassi è media (14.2% delta rispetto alla precedente frequenza)
Medi 400 - 2000 Hz
(+) | medi bilanciati - solo only 2.4% rispetto alla media
(+) | medi lineari (5.5% delta rispetto alla precedente frequenza)
Alti 2 - 16 kHz
(+) | Alti bilanciati - appena 2% dalla media
(+) | alti lineari (4.5% delta rispetto alla precedente frequenza)
Nel complesso 100 - 16.000 Hz
(+) | suono nel complesso lineare (10.2% differenza dalla media)
Rispetto alla stessa classe
» 7% di tutti i dispositivi testati in questa classe è stato migliore, 2% simile, 90% peggiore
» Il migliore ha avuto un delta di 5%, medio di 18%, peggiore di 53%
Rispetto a tutti i dispositivi testati
» 5% di tutti i dispositivi testati in questa classe è stato migliore, 1% similare, 94% peggiore
» Il migliore ha avuto un delta di 4%, medio di 23%, peggiore di 134%
| Off / Standby | |
| Idle | |
| Sotto carico |
|
Leggenda:
min: | |
| VAIO Z VJZ141C11L i7-11375H, Iris Xe G7 96EUs, Samsung PM9A1 MZVL2512HCJQ, IPS, 3840x2160, 14" | Dell XPS 13 9310 Core i7 4K i7-1185G7, Iris Xe G7 96EUs, Micron 2300 512GB MTFDHBA512TDV, IPS, 3840x2400, 13.4" | Dell Latitude 14 5411-WJ40N i7-10850H, GeForce MX250, SK Hynix PC611 512GB, IPS, 1920x1080, 14" | HP Spectre x360 14t-ea000 i7-1165G7, Iris Xe G7 96EUs, Samsung SSD PM981a MZVLB512HBJQ, IPS, 1920x1280, 13.5" | Lenovo IdeaPad Slim 9i 14ITL5 i7-1165G7, Iris Xe G7 96EUs, WDC PC SN730 SDBPNTY-512G, IPS, 3840x2160, 14" | Asus ZenBook 14 UX425EA i7-1165G7, Iris Xe G7 96EUs, Intel SSD 660p 1TB SSDPEKNW010T8, IPS, 1920x1080, 14" | Huawei MateBook 14 2020 Intel i7-10510U, GeForce MX350, Lite-On CA5-8D512, IPS LED, 2160x1440, 14" | |
|---|---|---|---|---|---|---|---|
| Power Consumption | 31% | 2% | 40% | 21% | 41% | 16% | |
| Idle Minimum * (Watt) | 9.5 | 4.3 55% | 3.1 67% | 3 68% | 4.5 53% | 4.8 49% | 3 68% |
| Idle Average * (Watt) | 13.7 | 8.3 39% | 5.4 61% | 5.1 63% | 10.5 23% | 6.5 53% | 9 34% |
| Idle Maximum * (Watt) | 14.4 | 8.8 39% | 9 37% | 6.4 56% | 10.6 26% | 7.7 47% | 11 24% |
| Load Average * (Watt) | 54.3 | 46.2 15% | 84 -55% | 39.6 27% | 44.2 19% | 29.6 45% | 60.8 -12% |
| Witcher 3 ultra * (Watt) | 46.1 | 42.2 8% | 39.6 14% | 45.8 1% | 28.6 38% | 56 -21% | |
| Load Maximum * (Watt) | 65.5 | 47.3 28% | 131 -100% | 56.2 14% | 61.9 5% | 57.8 12% | 65.6 -0% |
* ... Meglio usare valori piccoli
| VAIO Z VJZ141C11L i7-11375H, Iris Xe G7 96EUs, 53 Wh | Dell XPS 13 9310 Core i7 4K i7-1185G7, Iris Xe G7 96EUs, 52 Wh | Dell Latitude 14 5411-WJ40N i7-10850H, GeForce MX250, 68 Wh | HP Spectre x360 14t-ea000 i7-1165G7, Iris Xe G7 96EUs, 66 Wh | Lenovo IdeaPad Slim 9i 14ITL5 i7-1165G7, Iris Xe G7 96EUs, 63.5 Wh | Asus ZenBook 14 UX425EA i7-1165G7, Iris Xe G7 96EUs, 67 Wh | Huawei MateBook 14 2020 Intel i7-10510U, GeForce MX350, 56 Wh | |
|---|---|---|---|---|---|---|---|
| Autonomia della batteria | 1% | 20% | 66% | 55% | 85% | 80% | |
| WiFi v1.3 (h) | 7.1 | 7.2 1% | 8.5 20% | 11.8 66% | 11 55% | 13.1 85% | 12.8 80% |
| Reader / Idle (h) | 36.4 | 40.1 | 25.9 | ||||
| Load (h) | 2.4 | 2 | 3.2 | 2 |
Pro
Contro
Non ci lamenteremo del prezzo. Se pensate che 3800 dollari siano troppi per un Ultrabook, allora questo portatile non fa per voi. Il Vaio Z si rivolge ad un tipo specifico di pubblico o di utente business che non si preoccupa di pagare il sovrapprezzo per un prodotto di lusso.
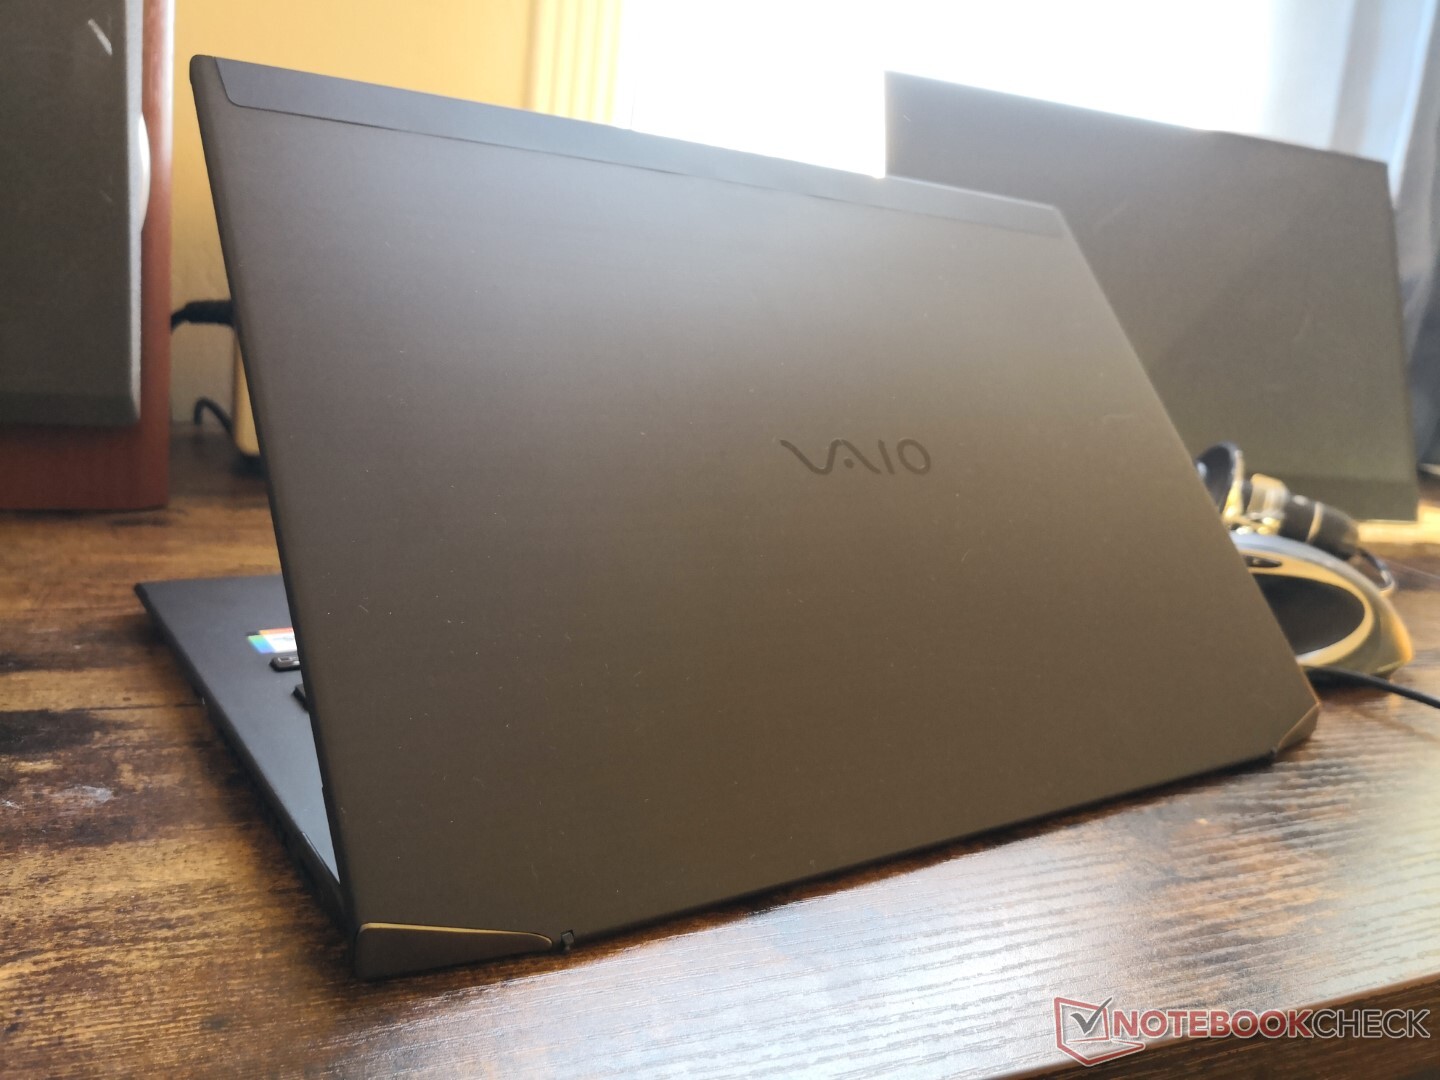
L'ultraleggero Vaio Z ha l'aspetto di un portatile di lusso. Tuttavia, gli utenti sacrificheranno molto in quasi tutti gli altri aspetti solo per il peso ridotto e il design intricato.
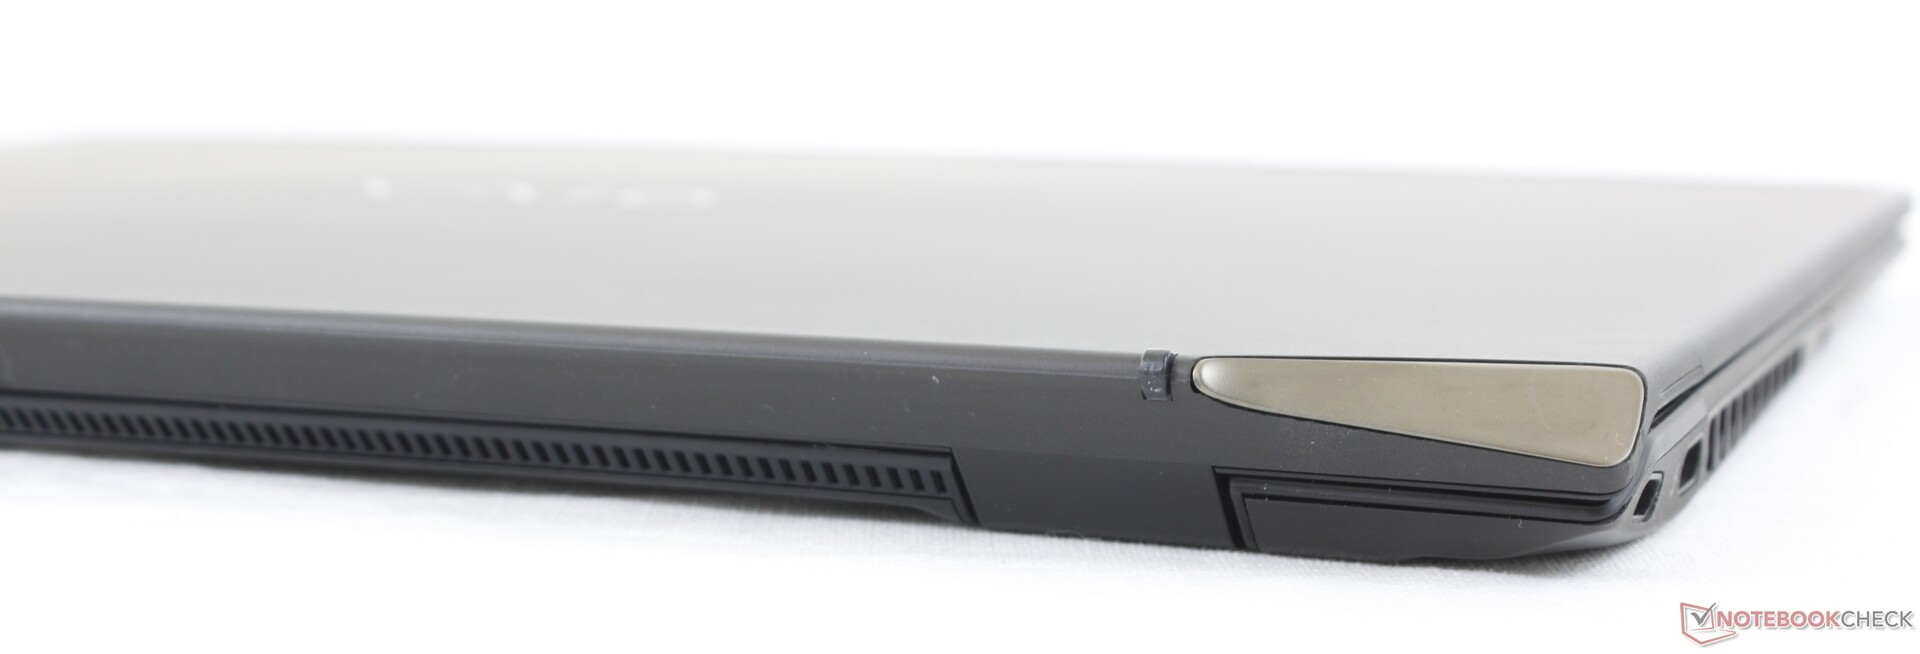
Ciò di cui possiamo lamentarci, tuttavia, è il portatile stesso se confrontato con alternative meno costose di Dell, HP, Lenovo, o anche Apple. Il sistema è nella media in molti aspetti. Le cerniere, per esempio, sono deboli e traballano frequentemente mentre l'intero telaio scricchiola molto di più che sulla maggior parte degli altri portatili di punta in lega di alluminio. Questo potrebbe essere stato progettato come conseguenza del telaio in fibra di carbonio, ma la presenza stessa di scricchiolii udibili fa pensare più allla parola "cheap" che a "lusso".
Il display non è così luminoso come il Dell XPS, MacBook, o certi modelli HP EliteBook e la velocità di ricarica della batteria è due volte più lenta. Se avete intenzione di usare questo portatile all'aperto frequentemente, allora le alternative di cui sopra potrebbero essere la scelta migliore
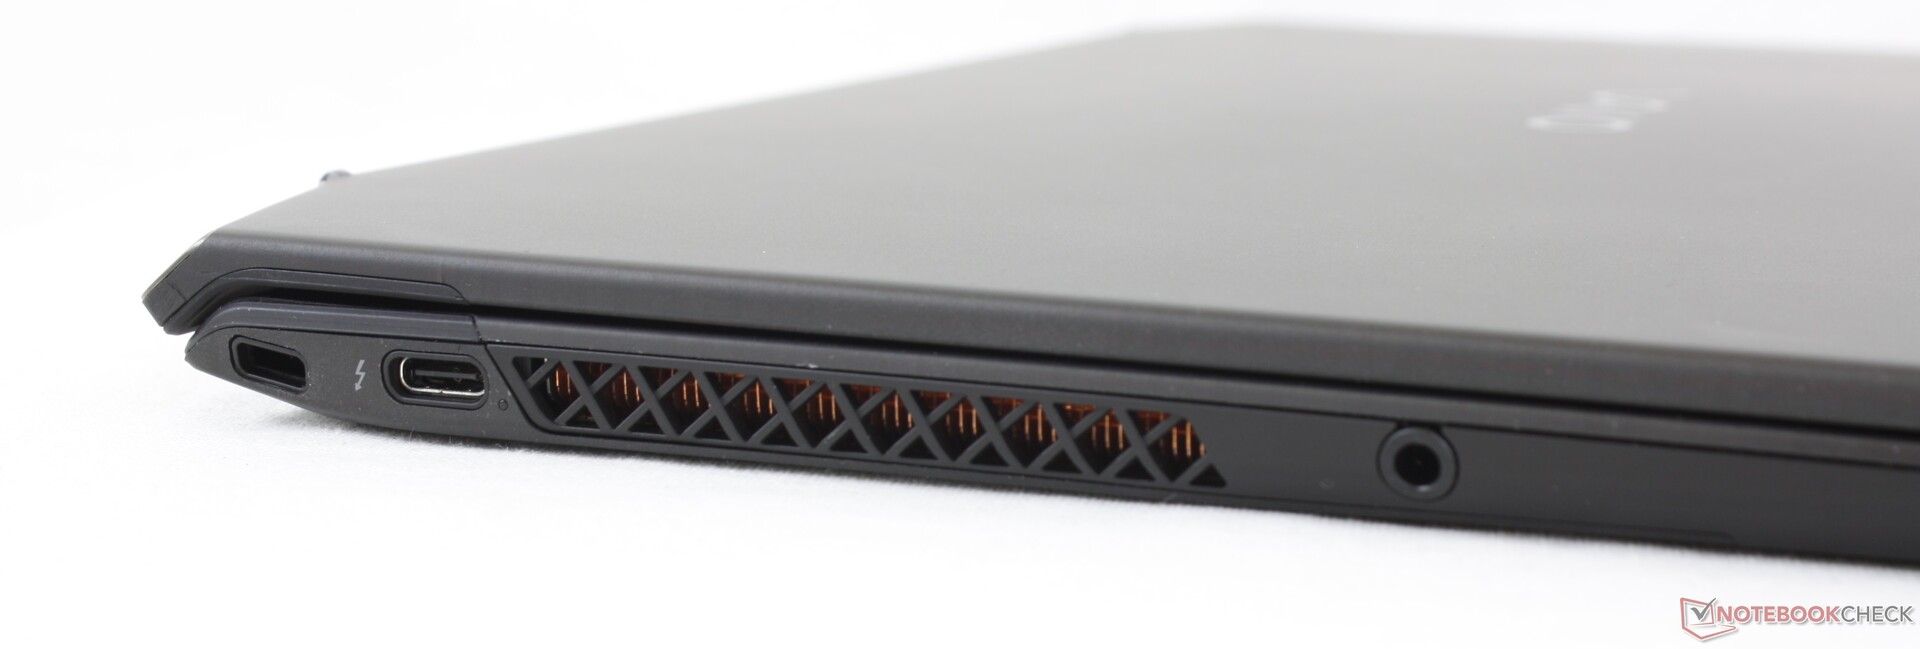
Infine, l'assistenza all'utente finale non è facile. L'accesso all'SSD o alla batteria fa venire il mal di testa sul Vaio in contrasto con la maggior parte dei portatili prosumer degli OEM concorrenti.
Le due caratteristiche distintive del Vaio Z sono le prestazioni elevate e il peso ridotto. Non c'è nulla che impedisca ad altri OEM di usare la stessa CPU Core i7-11375H, comunque, e quindi le elevate prestazioni di sistema non sono speciali per questo modello. Il peso ridotto è quindi la caratteristica più impressionante del Vaio Z; è solo un peccato che quasi tutto il resto non sia alla pari con i portatili concorrenti che costano meno della metà.
VAIO Z VJZ141C11L
- 02/26/2021 v7 (old)
Allen Ngo
Price comparison
