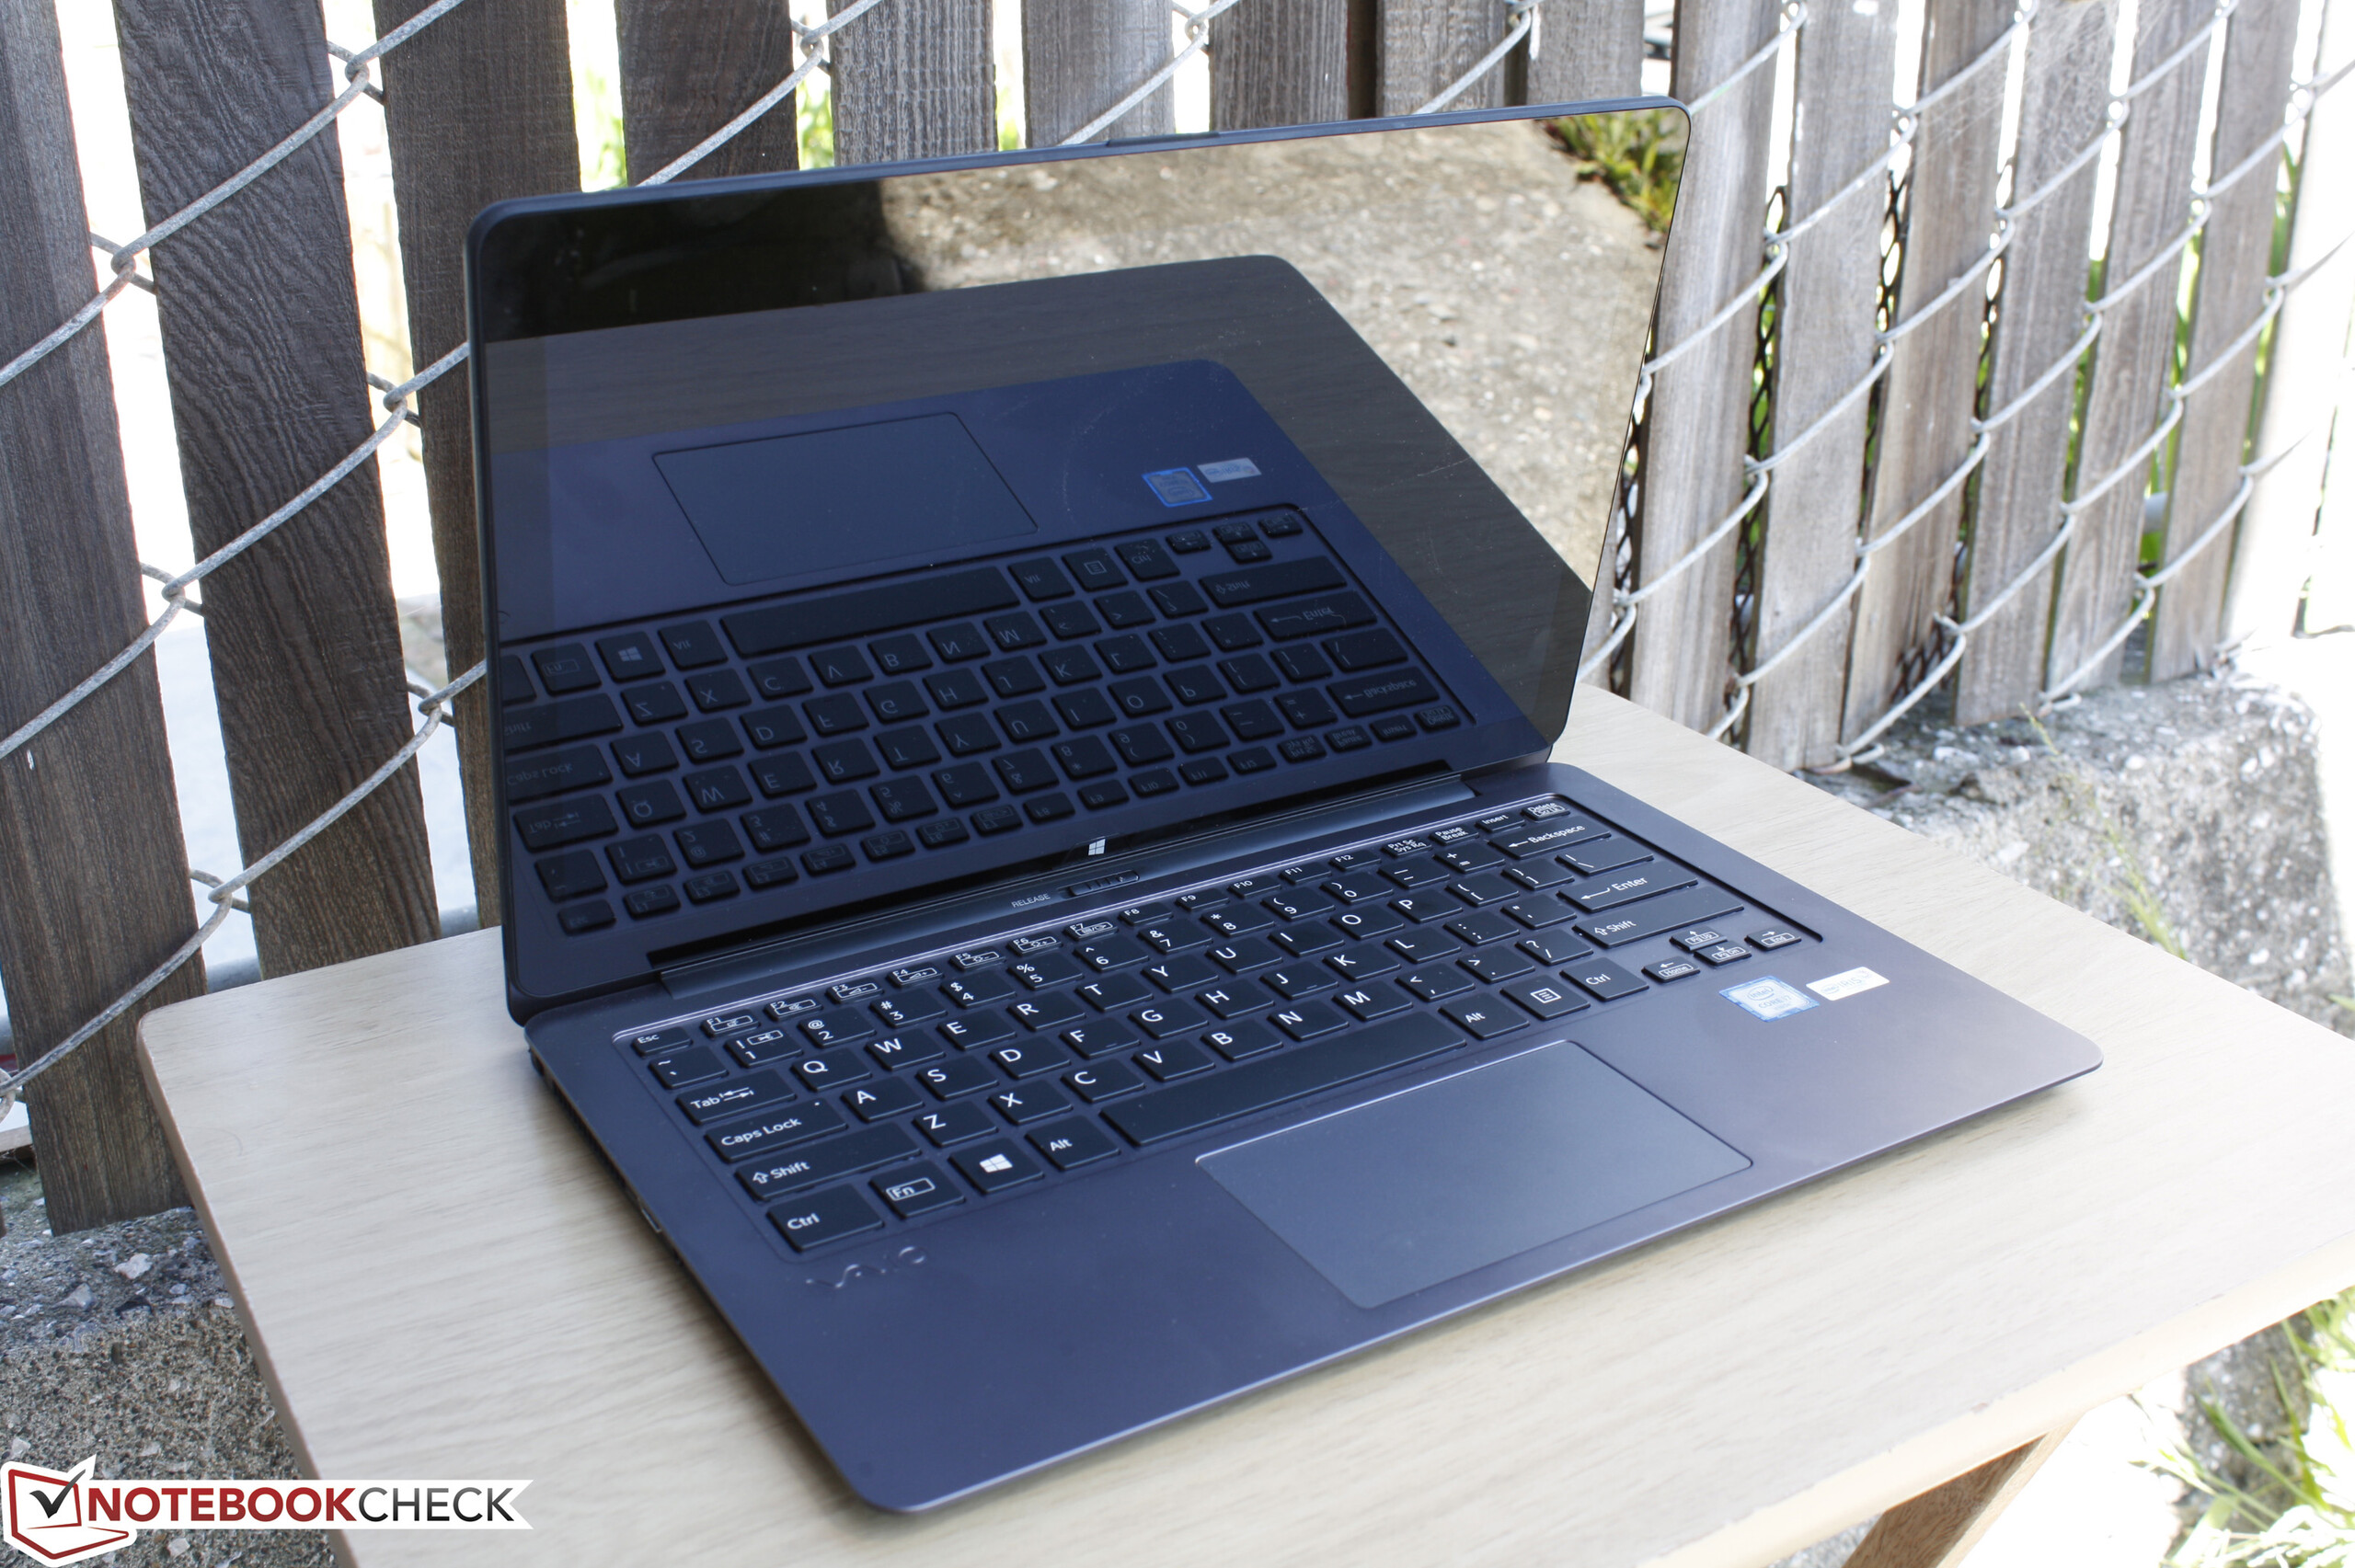
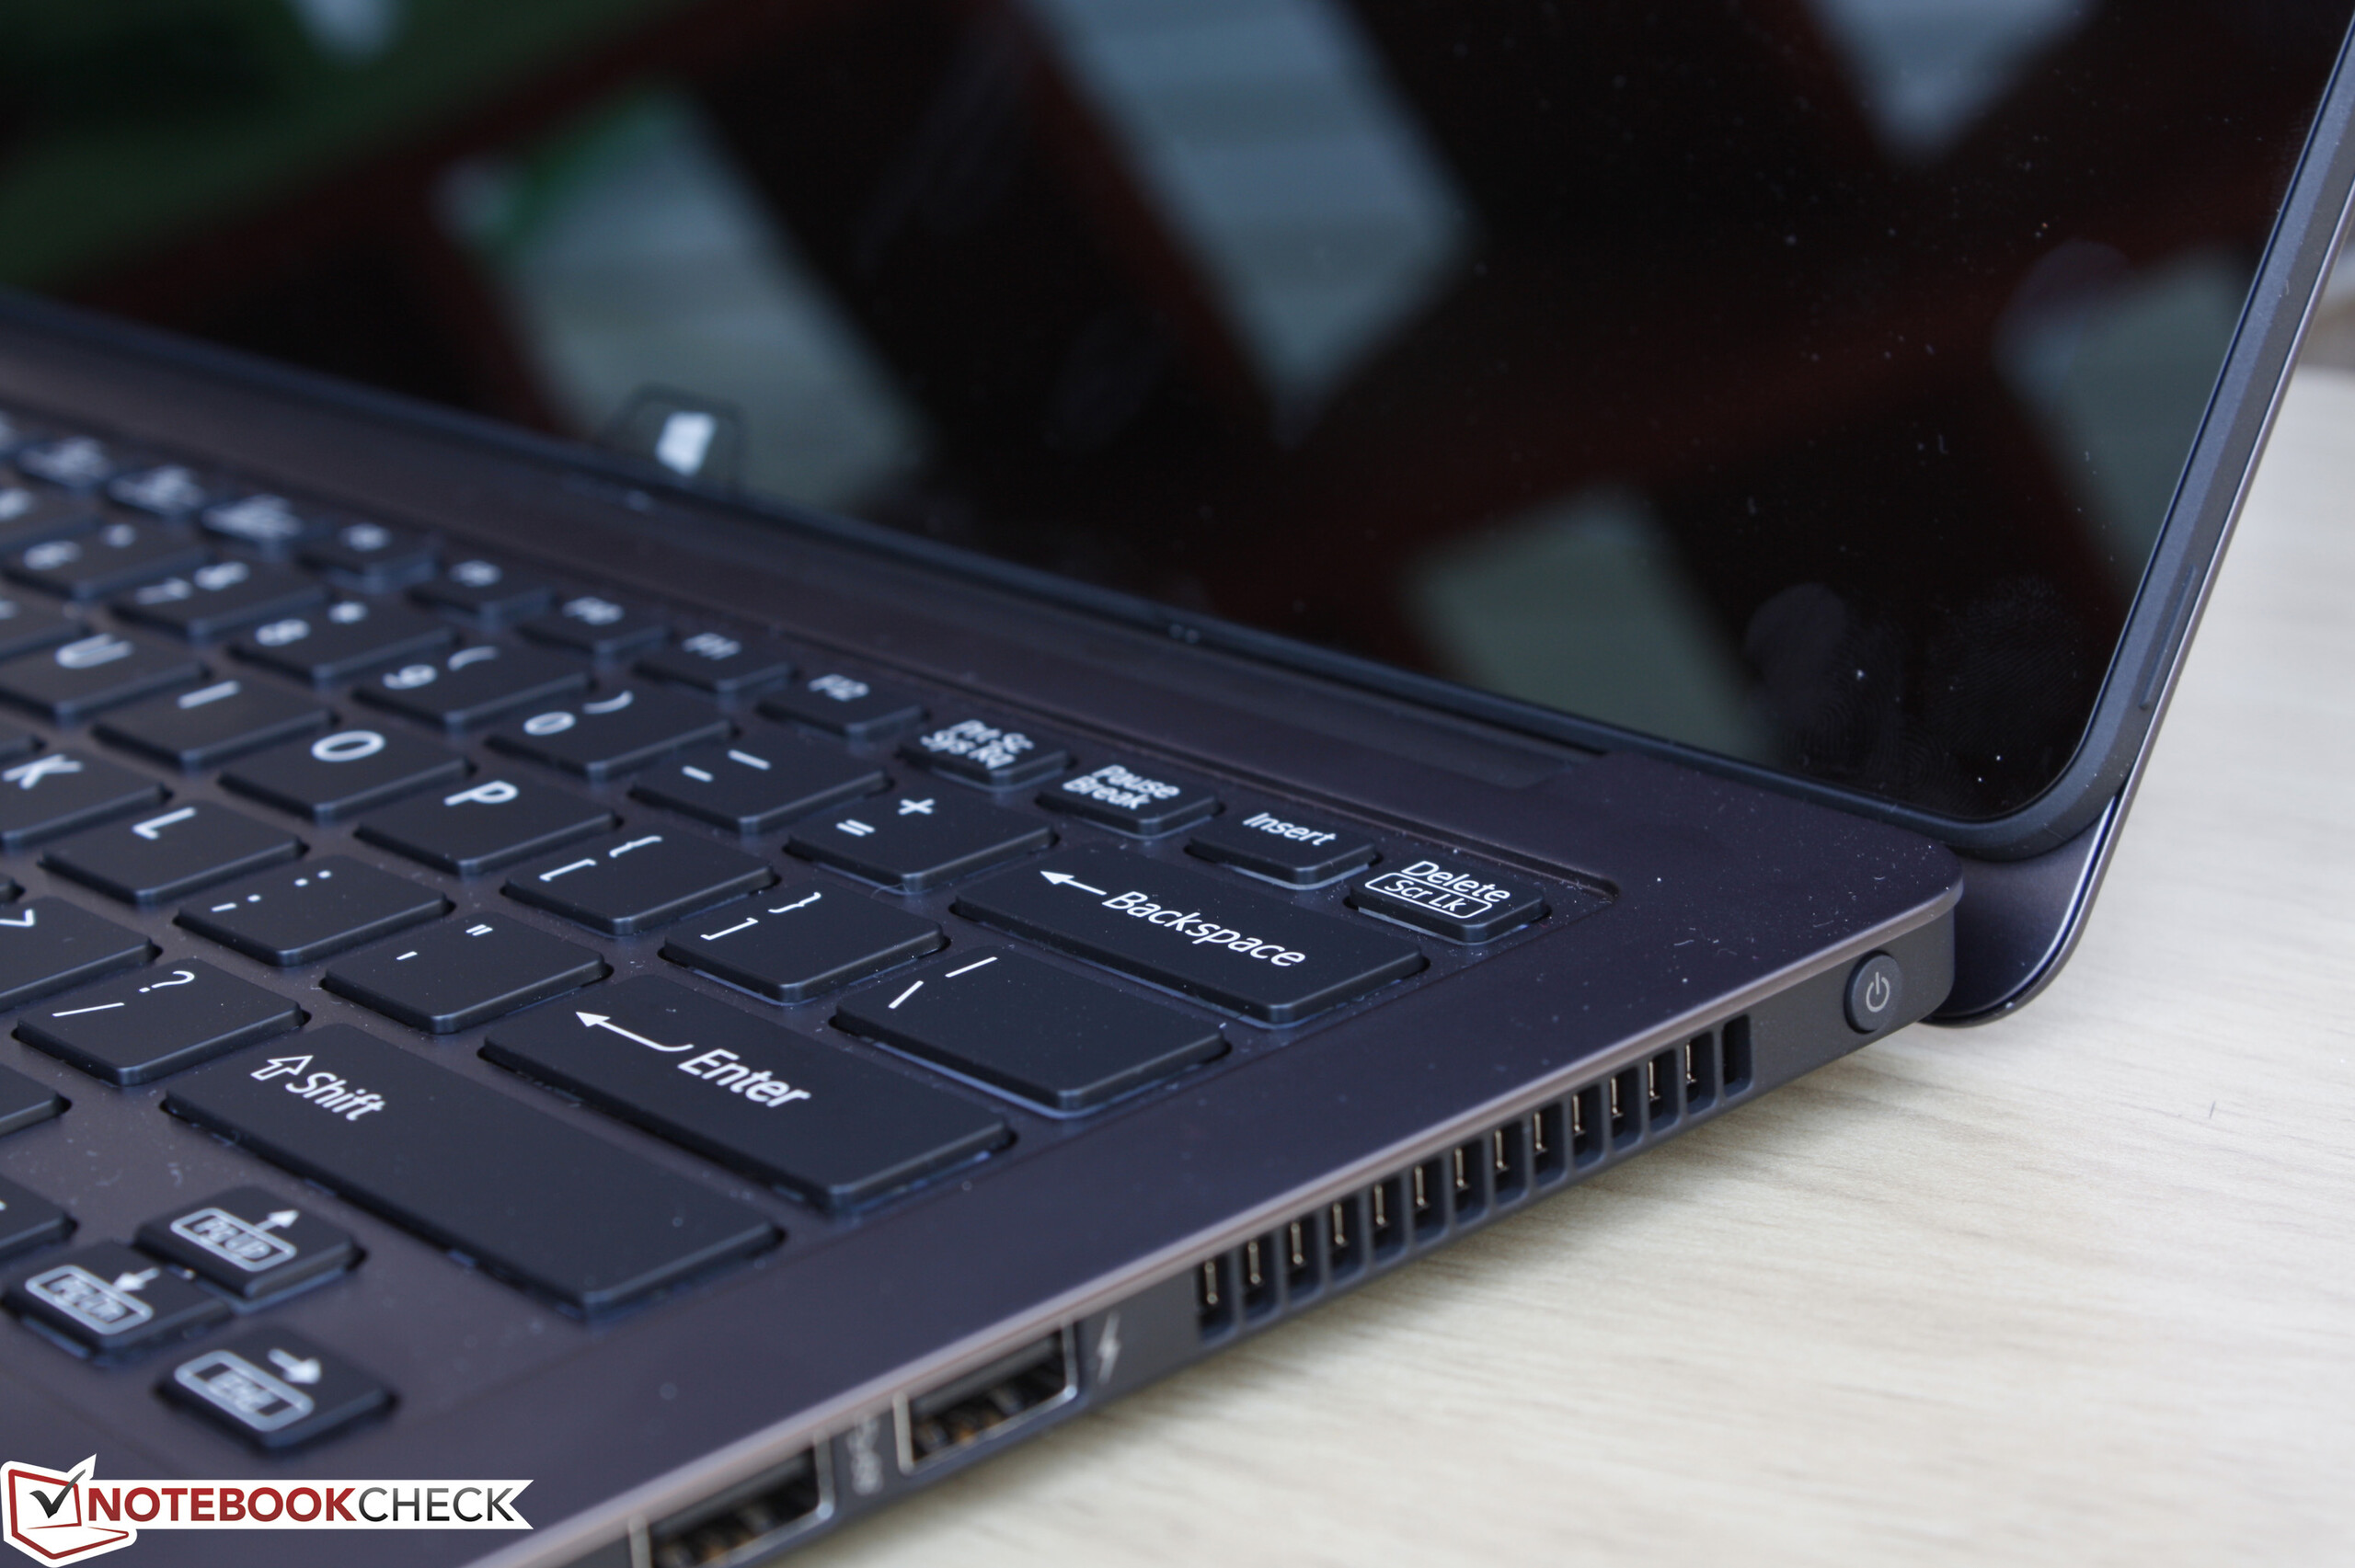
Recensione breve del Convertibile Vaio Z Flip VJZ13BA11L


| |||||||||||||||||||||||||
Distribuzione della luminosità: 89 %
Al centro con la batteria: 355.2 cd/m²
Contrasto: 1246:1 (Nero: 0.285 cd/m²)
ΔE ColorChecker Calman: 9.56 | ∀{0.5-29.43 Ø4.71}
ΔE Greyscale Calman: 4.08 | ∀{0.09-98 Ø4.96}
97.1% sRGB (Argyll 1.6.3 3D)
64.3% AdobeRGB 1998 (Argyll 1.6.3 3D)
69.4% AdobeRGB 1998 (Argyll 3D)
97.1% sRGB (Argyll 3D)
68.7% Display P3 (Argyll 3D)
Gamma: 2.33
CCT: 6560 K
| Sony Vaio Z Flip 13.3", 2560x1440 | Apple MacBook Air 13 inch 2015-03 13.3", 1440x900 | Lenovo Yoga 900-13ISK 80MK 13.3", 3200x1800 | Dell XPS 13 9350 WQXGA 13.3", 3200x1800 | Asus Zenbook UX303UA-R4051T 13.3", 1920x1080 | |
|---|---|---|---|---|---|
| Display | -40% | -8% | -6% | -3% | |
| Display P3 Coverage (%) | 68.7 | 40.1 -42% | 63.2 -8% | 63.6 -7% | 67.5 -2% |
| sRGB Coverage (%) | 97.1 | 59.8 -38% | 88.7 -9% | 92.3 -5% | 92.5 -5% |
| AdobeRGB 1998 Coverage (%) | 69.4 | 41.51 -40% | 64.9 -6% | 65.4 -6% | 67.7 -2% |
| Response Times | 7% | -22% | 18% | ||
| Response Time Grey 50% / Grey 80% * (ms) | 38.4 ? | 38.8 ? -1% | 50.8 ? -32% | 31 ? 19% | |
| Response Time Black / White * (ms) | 26.4 ? | 22.4 ? 15% | 29.6 ? -12% | 22 ? 17% | |
| PWM Frequency (Hz) | 1316 | 198 ? | |||
| Screen | -7% | -22% | 8% | -1% | |
| Brightness middle (cd/m²) | 355.2 | 329 -7% | 319.8 -10% | 307.5 -13% | 357 1% |
| Brightness (cd/m²) | 354 | 310 -12% | 302 -15% | 297 -16% | 351 -1% |
| Brightness Distribution (%) | 89 | 82 -8% | 88 -1% | 92 3% | 90 1% |
| Black Level * (cd/m²) | 0.285 | 0.405 -42% | 0.835 -193% | 0.207 27% | 0.58 -104% |
| Contrast (:1) | 1246 | 812 -35% | 383 -69% | 1486 19% | 616 -51% |
| Colorchecker dE 2000 * | 9.56 | 3.96 59% | 2.68 72% | 4.18 56% | 3.39 65% |
| Colorchecker dE 2000 max. * | 12.81 | 7.51 41% | 7.84 39% | 6.76 47% | |
| Greyscale dE 2000 * | 4.08 | 3.51 14% | 2.35 42% | 4.94 -21% | 2.36 42% |
| Gamma | 2.33 94% | 3.83 57% | 2.09 105% | 2.31 95% | 2.2 100% |
| CCT | 6560 99% | 6711 97% | 6975 93% | 7645 85% | 6653 98% |
| Color Space (Percent of AdobeRGB 1998) (%) | 64.3 | 38.4 -40% | 57 -11% | 59 -8% | 60 -7% |
| Color Space (Percent of sRGB) (%) | 97.1 | 59.8 -38% | 88 -9% | 92 -5% | 93 -4% |
| Media totale (Programma / Settaggio) | -24% /
-14% | -8% /
-15% | -7% /
1% | 5% /
1% |
* ... Meglio usare valori piccoli
Tempi di risposta del Display
| ↔ Tempi di risposta dal Nero al Bianco | ||
|---|---|---|
| 26.4 ms ... aumenta ↗ e diminuisce ↘ combinato | ↗ 6.8 ms Incremento | 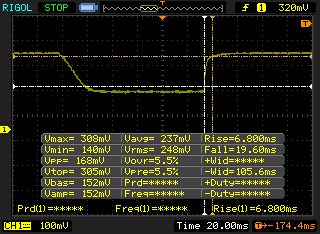 |
| ↘ 19.6 ms Calo | ||
| Lo schermo mostra tempi di risposta relativamente lenti nei nostri tests e potrebbe essere troppo lento per i gamers. In confronto, tutti i dispositivi di test variano da 0.1 (minimo) a 240 (massimo) ms. » 66 % di tutti i dispositivi è migliore. Questo significa che i tempi di risposta rilevati sono peggiori rispetto alla media di tutti i dispositivi testati (19.8 ms). | ||
| ↔ Tempo di risposta dal 50% Grigio all'80% Grigio | ||
| 38.4 ms ... aumenta ↗ e diminuisce ↘ combinato | ↗ 14.8 ms Incremento | 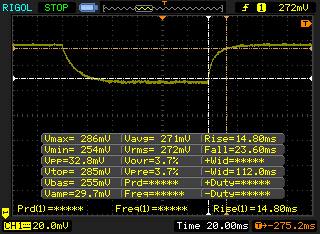 |
| ↘ 23.6 ms Calo | ||
| Lo schermo mostra tempi di risposta lenti nei nostri tests e sarà insoddisfacente per i gamers. In confronto, tutti i dispositivi di test variano da 0.165 (minimo) a 636 (massimo) ms. » 58 % di tutti i dispositivi è migliore. Questo significa che i tempi di risposta rilevati sono peggiori rispetto alla media di tutti i dispositivi testati (31 ms). | ||
Sfarfallio dello schermo / PWM (Pulse-Width Modulation)
| flickering dello schermo / PWM non rilevato | 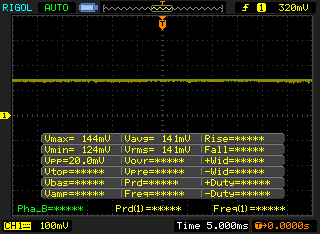 | ||
In confronto: 52 % di tutti i dispositivi testati non utilizza PWM per ridurre la luminosita' del display. Se è rilevato PWM, una media di 7757 (minimo: 5 - massimo: 343500) Hz è stata rilevata. | |||
| Cinebench R15 | |
| CPU Single 64Bit (ordina per valore) | |
| Sony Vaio Z Flip | |
| Asus GL552VW-DH74 | |
| Clevo W230SD | |
| HP ProBook 650 G2 T8X61EA | |
| Razer Blade Stealth UHD i7-6500U | |
| CPU Multi 64Bit (ordina per valore) | |
| Sony Vaio Z Flip | |
| Asus GL552VW-DH74 | |
| Clevo W230SD | |
| HP ProBook 650 G2 T8X61EA | |
| Razer Blade Stealth UHD i7-6500U | |
| Cinebench R11.5 | |
| CPU Single 64Bit (ordina per valore) | |
| Sony Vaio Z Flip | |
| Asus GL552VW-DH74 | |
| Clevo W230SD | |
| HP ProBook 650 G2 T8X61EA | |
| Razer Blade Stealth UHD i7-6500U | |
| CPU Multi 64Bit (ordina per valore) | |
| Sony Vaio Z Flip | |
| Asus GL552VW-DH74 | |
| Clevo W230SD | |
| HP ProBook 650 G2 T8X61EA | |
| Razer Blade Stealth UHD i7-6500U | |
| Cinebench R10 | |
| Rendering Single 32Bit (ordina per valore) | |
| Sony Vaio Z Flip | |
| Asus GL552VW-DH74 | |
| Clevo W230SD | |
| HP ProBook 650 G2 T8X61EA | |
| Razer Blade Stealth UHD i7-6500U | |
| Rendering Multiple CPUs 32Bit (ordina per valore) | |
| Sony Vaio Z Flip | |
| Asus GL552VW-DH74 | |
| Clevo W230SD | |
| HP ProBook 650 G2 T8X61EA | |
| Razer Blade Stealth UHD i7-6500U | |
| wPrime 2.10 - 1024m (ordina per valore) | |
| Sony Vaio Z Flip | |
| Asus GL552VW-DH74 | |
| Clevo W230SD | |
| HP ProBook 650 G2 T8X61EA | |
| Razer Blade Stealth UHD i7-6500U | |
| Super Pi Mod 1.5 XS 32M - 32M (ordina per valore) | |
| Sony Vaio Z Flip | |
| Asus GL552VW-DH74 | |
| Clevo W230SD | |
| HP ProBook 650 G2 T8X61EA | |
| Razer Blade Stealth UHD i7-6500U | |
* ... Meglio usare valori piccoli
| PCMark 7 Score | 5449 punti | |
| PCMark 8 Home Score Accelerated v2 | 3424 punti | |
| PCMark 8 Creative Score Accelerated v2 | 4321 punti | |
| PCMark 8 Work Score Accelerated v2 | 4432 punti | |
Aiuto | ||
| Sony Vaio Z Flip Iris Graphics 550, 6567U, Samsung SM951 MZVPV256 m.2 | Apple MacBook Air 13 inch 2015-03 HD Graphics 6000, 5650U, Apple SSD SD0256F | Lenovo Yoga 900-13ISK 80MK HD Graphics 520, 6500U, Samsung SSD PM871 MZNLN512HCJH | Dell XPS 13 9350 WQXGA Iris Graphics 540, 6560U, Samsung PM951 NVMe 512 GB | Asus Zenbook UX303UA-R4051T HD Graphics 520, 6500U, SK hynix SSD Canvas SC300 HFS256G32MND | |
|---|---|---|---|---|---|
| AS SSD | -70% | -43% | 9% | -71% | |
| Copy Game MB/s (MB/s) | 639 | 479.3 -25% | 298.7 -53% | 753 18% | 198.8 -69% |
| Copy Program MB/s (MB/s) | 349.2 | 245 -30% | 249.6 -29% | 271.8 -22% | 160.3 -54% |
| Copy ISO MB/s (MB/s) | 731 | 643 -12% | 364.5 -50% | 1041 42% | 249.3 -66% |
| Score Total (Points) | 2323 | 2383 3% | 1129 -51% | 3158 36% | 909 -61% |
| Score Write (Points) | 559 | 463 -17% | 429 -23% | 664 19% | 308 -45% |
| Score Read (Points) | 1187 | 1281 8% | 458 -61% | 1679 41% | 399 -66% |
| Access Time Write * (ms) | 0.031 | 0.155 -400% | 0.039 -26% | 0.031 -0% | 0.07 -126% |
| Access Time Read * (ms) | 0.039 | 0.171 -338% | 0.054 -38% | 0.046 -18% | 0.1 -156% |
| 4K-64 Write (MB/s) | 326.4 | 338.9 4% | 303 -7% | 492 51% | 213.4 -35% |
| 4K-64 Read (MB/s) | 949 | 1140 20% | 374.8 -61% | 1497 58% | 331.2 -65% |
| 4K Write (MB/s) | 121.8 | 23.73 -81% | 80.6 -34% | 116.5 -4% | 65.1 -47% |
| 4K Read (MB/s) | 47.59 | 19.16 -60% | 32.29 -32% | 38.29 -20% | 20.4 -57% |
| Seq Write (MB/s) | 1107 | 1001 -10% | 454.6 -59% | 559 -50% | 301.6 -73% |
| Seq Read (MB/s) | 1896 | 1212 -36% | 505 -73% | 1442 -24% | 474.5 -75% |
* ... Meglio usare valori piccoli

| 3DMark 11 | |
| 1280x720 Performance (ordina per valore) | |
| Sony Vaio Z Flip | |
| MSI PE60 2QD | |
| Lenovo Ideapad 500s-14ISK | |
| Apple MacBook Pro Retina 13 inch 2015-03 | |
| Lenovo ThinkPad T460p | |
| Toshiba Portege Z30t-B1320W10 | |
| 1280x720 Performance GPU (ordina per valore) | |
| Sony Vaio Z Flip | |
| MSI PE60 2QD | |
| Lenovo Ideapad 500s-14ISK | |
| Apple MacBook Pro Retina 13 inch 2015-03 | |
| Lenovo ThinkPad T460p | |
| Toshiba Portege Z30t-B1320W10 | |
| 1280x720 Performance Physics (ordina per valore) | |
| Sony Vaio Z Flip | |
| MSI PE60 2QD | |
| Lenovo Ideapad 500s-14ISK | |
| Apple MacBook Pro Retina 13 inch 2015-03 | |
| Lenovo ThinkPad T460p | |
| Toshiba Portege Z30t-B1320W10 | |
| 1280x720 Performance Combined (ordina per valore) | |
| Sony Vaio Z Flip | |
| MSI PE60 2QD | |
| Lenovo Ideapad 500s-14ISK | |
| Apple MacBook Pro Retina 13 inch 2015-03 | |
| Lenovo ThinkPad T460p | |
| Toshiba Portege Z30t-B1320W10 | |
| 3DMark 11 Performance | 2839 punti | |
| 3DMark Ice Storm Standard Score | 81504 punti | |
| 3DMark Cloud Gate Standard Score | 8646 punti | |
| 3DMark Fire Strike Score | 1544 punti | |
| 3DMark Fire Strike Extreme Score | 690 punti | |
Aiuto | ||
| Metro: Last Light | |
| 1366x768 Medium (DX10) AF:4x | |
| MSI PX60 QD-034US | |
| Microsoft Surface Book Core i5 | |
| Sony Vaio Z Flip | |
| Apple MacBook Pro Retina 13 inch 2015-03 | |
| 1366x768 High (DX11) AF:16x | |
| MSI PX60 QD-034US | |
| Microsoft Surface Book Core i5 | |
| Sony Vaio Z Flip | |
| Apple MacBook Pro Retina 13 inch 2015-03 | |
| 1920x1080 Very High (DX11) AF:16x | |
| MSI PX60 QD-034US | |
| Microsoft Surface Book Core i5 | |
| Sony Vaio Z Flip | |
| Apple MacBook Pro Retina 13 inch 2015-03 | |
| Sleeping Dogs | |
| 1366x768 Medium Preset AA:Normal | |
| MSI PX60 QD-034US | |
| Microsoft Surface Book Core i5 | |
| Sony Vaio Z Flip | |
| 1366x768 High Preset AA:High | |
| MSI PX60 QD-034US | |
| Microsoft Surface Book Core i5 | |
| Sony Vaio Z Flip | |
| 1920x1080 Extreme Preset AA:Extreme | |
| MSI PX60 QD-034US | |
| Microsoft Surface Book Core i5 | |
| Sony Vaio Z Flip | |
| Rise of the Tomb Raider | |
| 1366x768 Medium Preset AF:2x | |
| Sony Vaio Z Flip | |
| Acer Aspire V3-575G-5093 | |
| Lenovo ThinkPad T460s-20FA003GGE | |
| 1920x1080 High Preset AA:FX AF:4x | |
| Sony Vaio Z Flip | |
| Acer Aspire V3-575G-5093 | |
| Lenovo ThinkPad T460s-20FA003GGE | |
| Thief | |
| 1366x768 Normal Preset AA:FX | |
| MSI PX60 QD-034US | |
| Microsoft Surface Book Core i5 | |
| Sony Vaio Z Flip | |
| Apple MacBook Pro Retina 13 inch 2015-03 | |
| 1366x768 High Preset AA:FXAA & Low SS AF:4x | |
| MSI PX60 QD-034US | |
| Microsoft Surface Book Core i5 | |
| Sony Vaio Z Flip | |
| Apple MacBook Pro Retina 13 inch 2015-03 | |
| 1920x1080 Very High Preset AA:FXAA & High SS AF:8x | |
| MSI PX60 QD-034US | |
| Sony Vaio Z Flip | |
| Microsoft Surface Book Core i5 | |
| Apple MacBook Pro Retina 13 inch 2015-03 | |
| Metal Gear Solid V | |
| 1366x768 Medium / Off | |
| MSI PX60 QD-034US | |
| Sony Vaio Z Flip | |
| Microsoft Surface Book Core i5 | |
| 1920x1080 High / On | |
| MSI PX60 QD-034US | |
| Microsoft Surface Book Core i5 | |
| Sony Vaio Z Flip | |
| 1920x1080 Extra High / On | |
| MSI PX60 QD-034US | |
| Microsoft Surface Book Core i5 | |
| Sony Vaio Z Flip | |
| basso | medio | alto | ultra | |
|---|---|---|---|---|
| Sleeping Dogs (2012) | 74.5 | 29.8 | 7 | |
| Tomb Raider (2013) | 77.2 | 52 | 23.6 | |
| BioShock Infinite (2013) | 51.4 | 43.4 | ||
| Metro: Last Light (2013) | 41.4 | 24.9 | 12.6 | |
| Thief (2014) | 25.4 | 21.1 | 10 | |
| Metal Gear Solid V (2015) | 55.7 | 18.9 | 12.3 | |
| Rise of the Tomb Raider (2016) | 18.3 | 10.9 |
| Sony Vaio Z Flip Iris Graphics 550, 6567U, Samsung SM951 MZVPV256 m.2 | Apple MacBook Air 13 inch 2015-03 HD Graphics 6000, 5650U, Apple SSD SD0256F | Lenovo Yoga 900-13ISK 80MK HD Graphics 520, 6500U, Samsung SSD PM871 MZNLN512HCJH | Dell XPS 13 9350 WQXGA Iris Graphics 540, 6560U, Samsung PM951 NVMe 512 GB | Asus Zenbook UX303UA-R4051T HD Graphics 520, 6500U, SK hynix SSD Canvas SC300 HFS256G32MND | |
|---|---|---|---|---|---|
| Noise | 5% | 10% | 12% | 6% | |
| off /ambiente * (dB) | 29.1 | 29.2 -0% | 31.3 -8% | ||
| Idle Minimum * (dB) | 29.1 | 29.2 -0% | 29.7 -2% | 29.2 -0% | 31.3 -8% |
| Idle Average * (dB) | 29.1 | 29.2 -0% | 29.8 -2% | 29.2 -0% | 31.3 -8% |
| Idle Maximum * (dB) | 29.1 | 29.2 -0% | 30 -3% | 29.2 -0% | 31.5 -8% |
| Load Average * (dB) | 46.6 | 40.2 14% | 32 31% | 31.4 33% | 33.2 29% |
| Load Maximum * (dB) | 53.5 | 46.3 13% | 38.5 28% | 31.4 41% | 34.1 36% |
* ... Meglio usare valori piccoli
Rumorosità
| Idle |
| 29.1 / 29.1 / 29.1 dB(A) |
| Sotto carico |
| 46.6 / 53.5 dB(A) |
 | ||
30 dB silenzioso 40 dB(A) udibile 50 dB(A) rumoroso |
||
min: | ||
(±) La temperatura massima sul lato superiore è di 41 °C / 106 F, rispetto alla media di 35.4 °C / 96 F, che varia da 19.6 a 60 °C per questa classe Convertible.
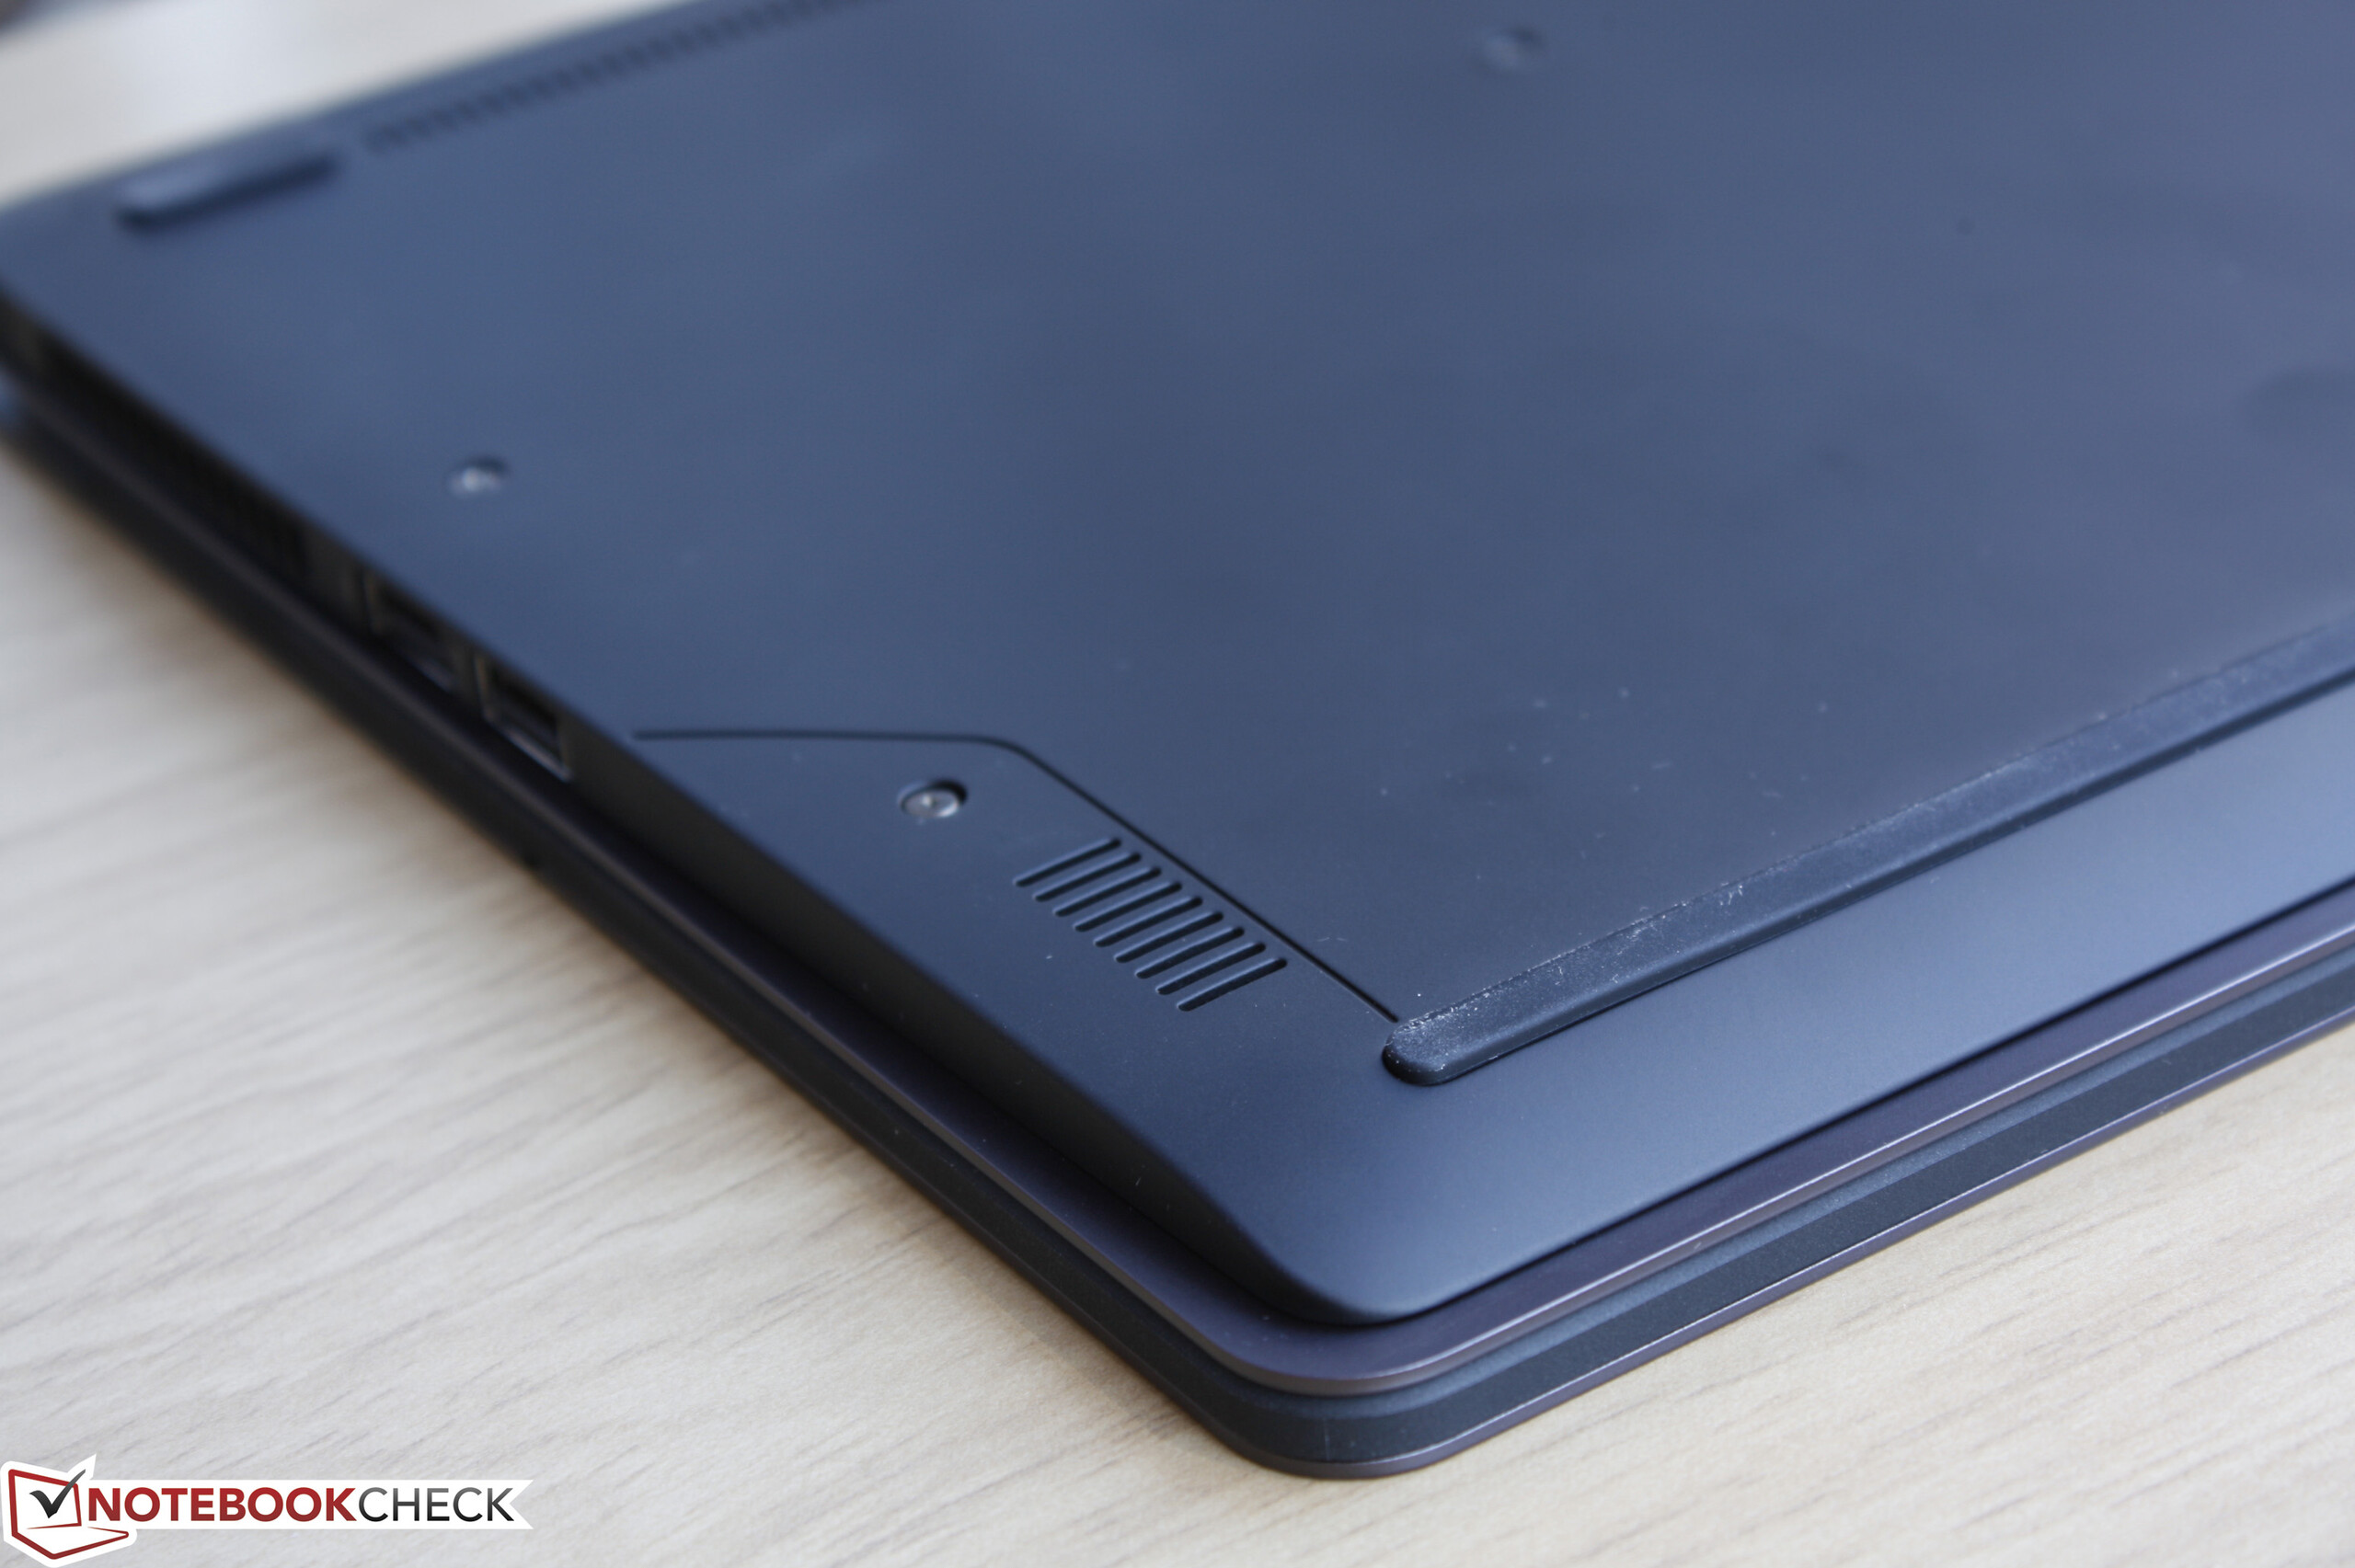
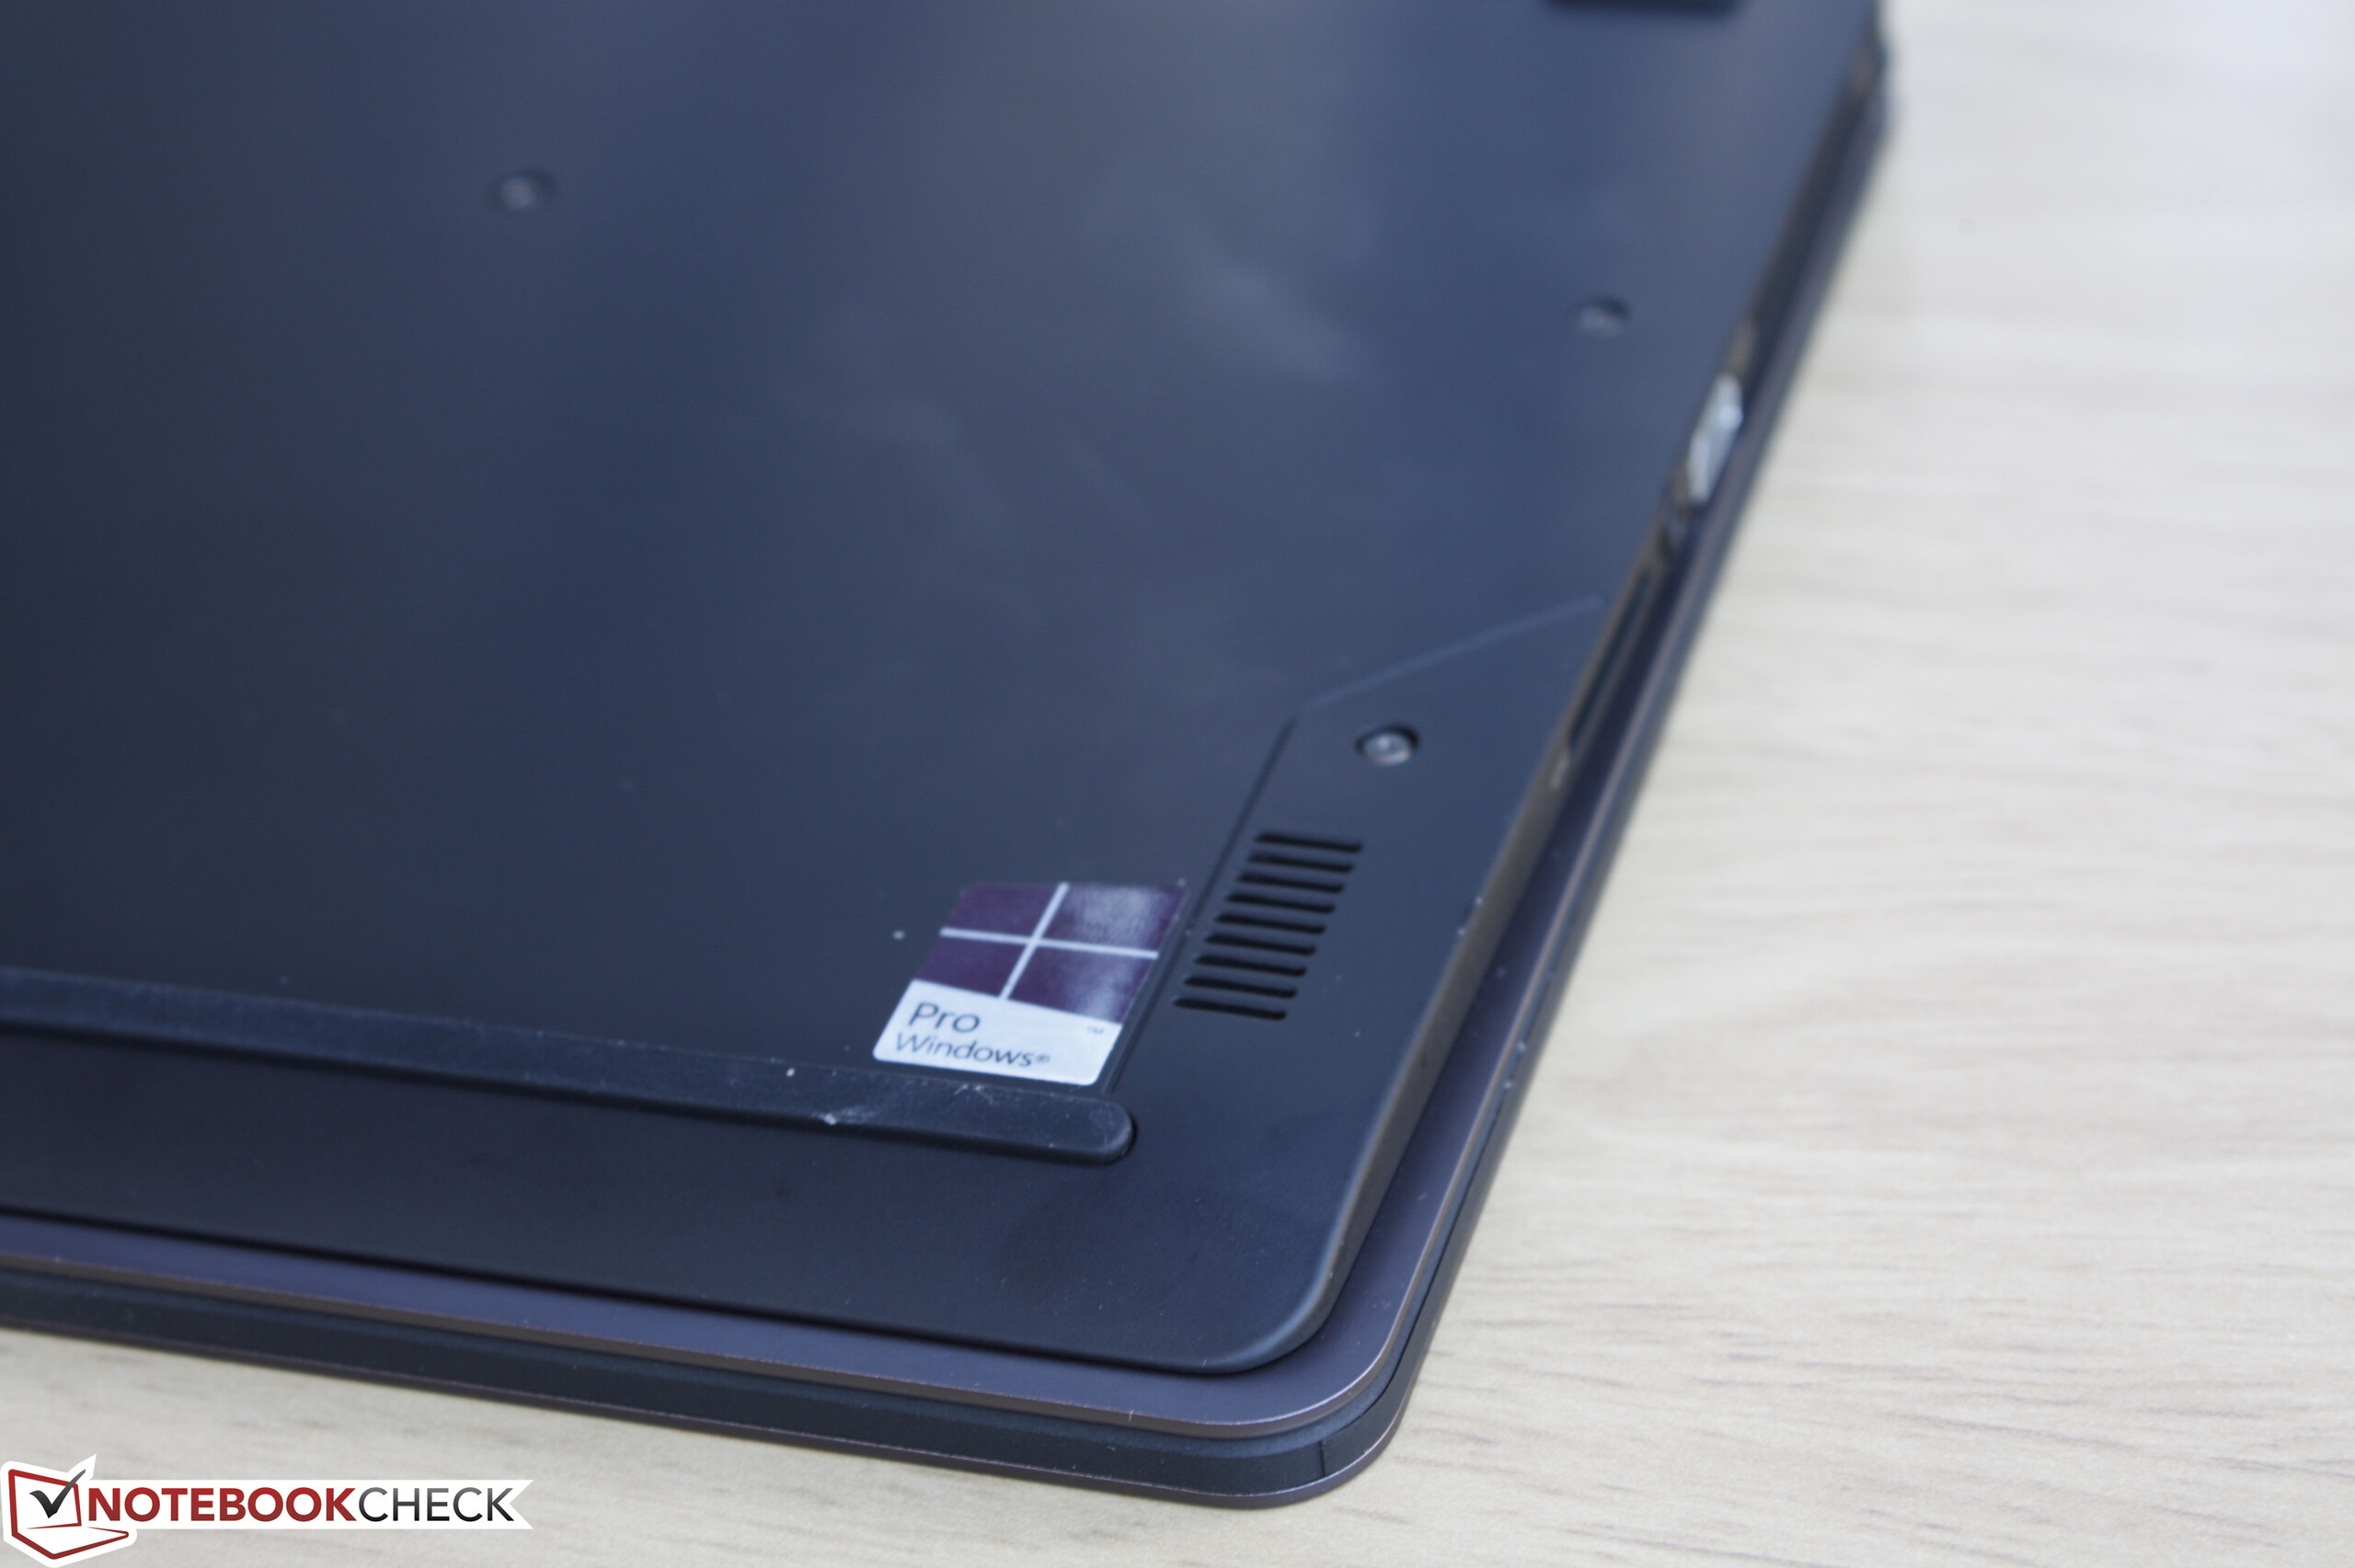
(-) Il lato inferiore si riscalda fino ad un massimo di 47.2 °C / 117 F, rispetto alla media di 36.9 °C / 98 F
(+) In idle, la temperatura media del lato superiore è di 24.8 °C / 77 F, rispetto alla media deld ispositivo di 30.3 °C / 87 F.
(+) I poggiapolsi e il touchpad sono piu' freddi della temperatura della pelle con un massimo di 27.8 °C / 82 F e sono quindi freddi al tatto.
(±) La temperatura media della zona del palmo della mano di dispositivi simili e'stata di 28 °C / 82.4 F (+0.2 °C / 0.4 F).
| Sony Vaio Z Flip Iris Graphics 550, 6567U, Samsung SM951 MZVPV256 m.2 | Apple MacBook Air 13 inch 2015-03 HD Graphics 6000, 5650U, Apple SSD SD0256F | Microsoft Surface Book Core i7 Maxwell GPU (940M, GDDR5), 6600U, Samsung MZFLV512 NVMe | Dell XPS 13 9350 WQXGA Iris Graphics 540, 6560U, Samsung PM951 NVMe 512 GB | Asus Zenbook UX303UA-R4051T HD Graphics 520, 6500U, SK hynix SSD Canvas SC300 HFS256G32MND | |
|---|---|---|---|---|---|
| Power Consumption | 21% | -32% | -24% | 14% | |
| Idle Minimum * (Watt) | 3.7 | 2.7 27% | 4.5 -22% | 7.2 -95% | 3.5 5% |
| Idle Average * (Watt) | 6.9 | 5.7 17% | 9.8 -42% | 9.3 -35% | 7.3 -6% |
| Idle Maximum * (Watt) | 8 | 6 25% | 12.2 -53% | 11.6 -45% | 7.9 1% |
| Load Average * (Watt) | 41.3 | 32.1 22% | 46 -11% | 31.9 23% | 26.6 36% |
| Load Maximum * (Watt) | 42.6 | 36.2 15% | 56 -31% | 29.9 30% | 28 34% |
* ... Meglio usare valori piccoli
| Off / Standby | |
| Idle | |
| Sotto carico |
|
Leggenda:
min: | |
| Sony Vaio Z Flip 58 Wh | Apple MacBook Air 13 inch 2015-03 54 Wh | Lenovo Yoga 900-13ISK 80MK 66 Wh | Dell XPS 13 9350 WQXGA 56 Wh | Asus Zenbook UX303UA-R4051T 50 Wh | |
|---|---|---|---|---|---|
| Autonomia della batteria | 21% | -15% | -30% | -9% | |
| Reader / Idle (h) | 15.8 | 26.2 66% | 14.1 -11% | 10.1 -36% | |
| WiFi v1.3 (h) | 7.5 | 10.3 37% | 6.7 -11% | 5.2 -31% | 6.8 -9% |
| Load (h) | 2.7 | 1.6 -41% | 2.1 -22% | 2.1 -22% |
Pro
Contro
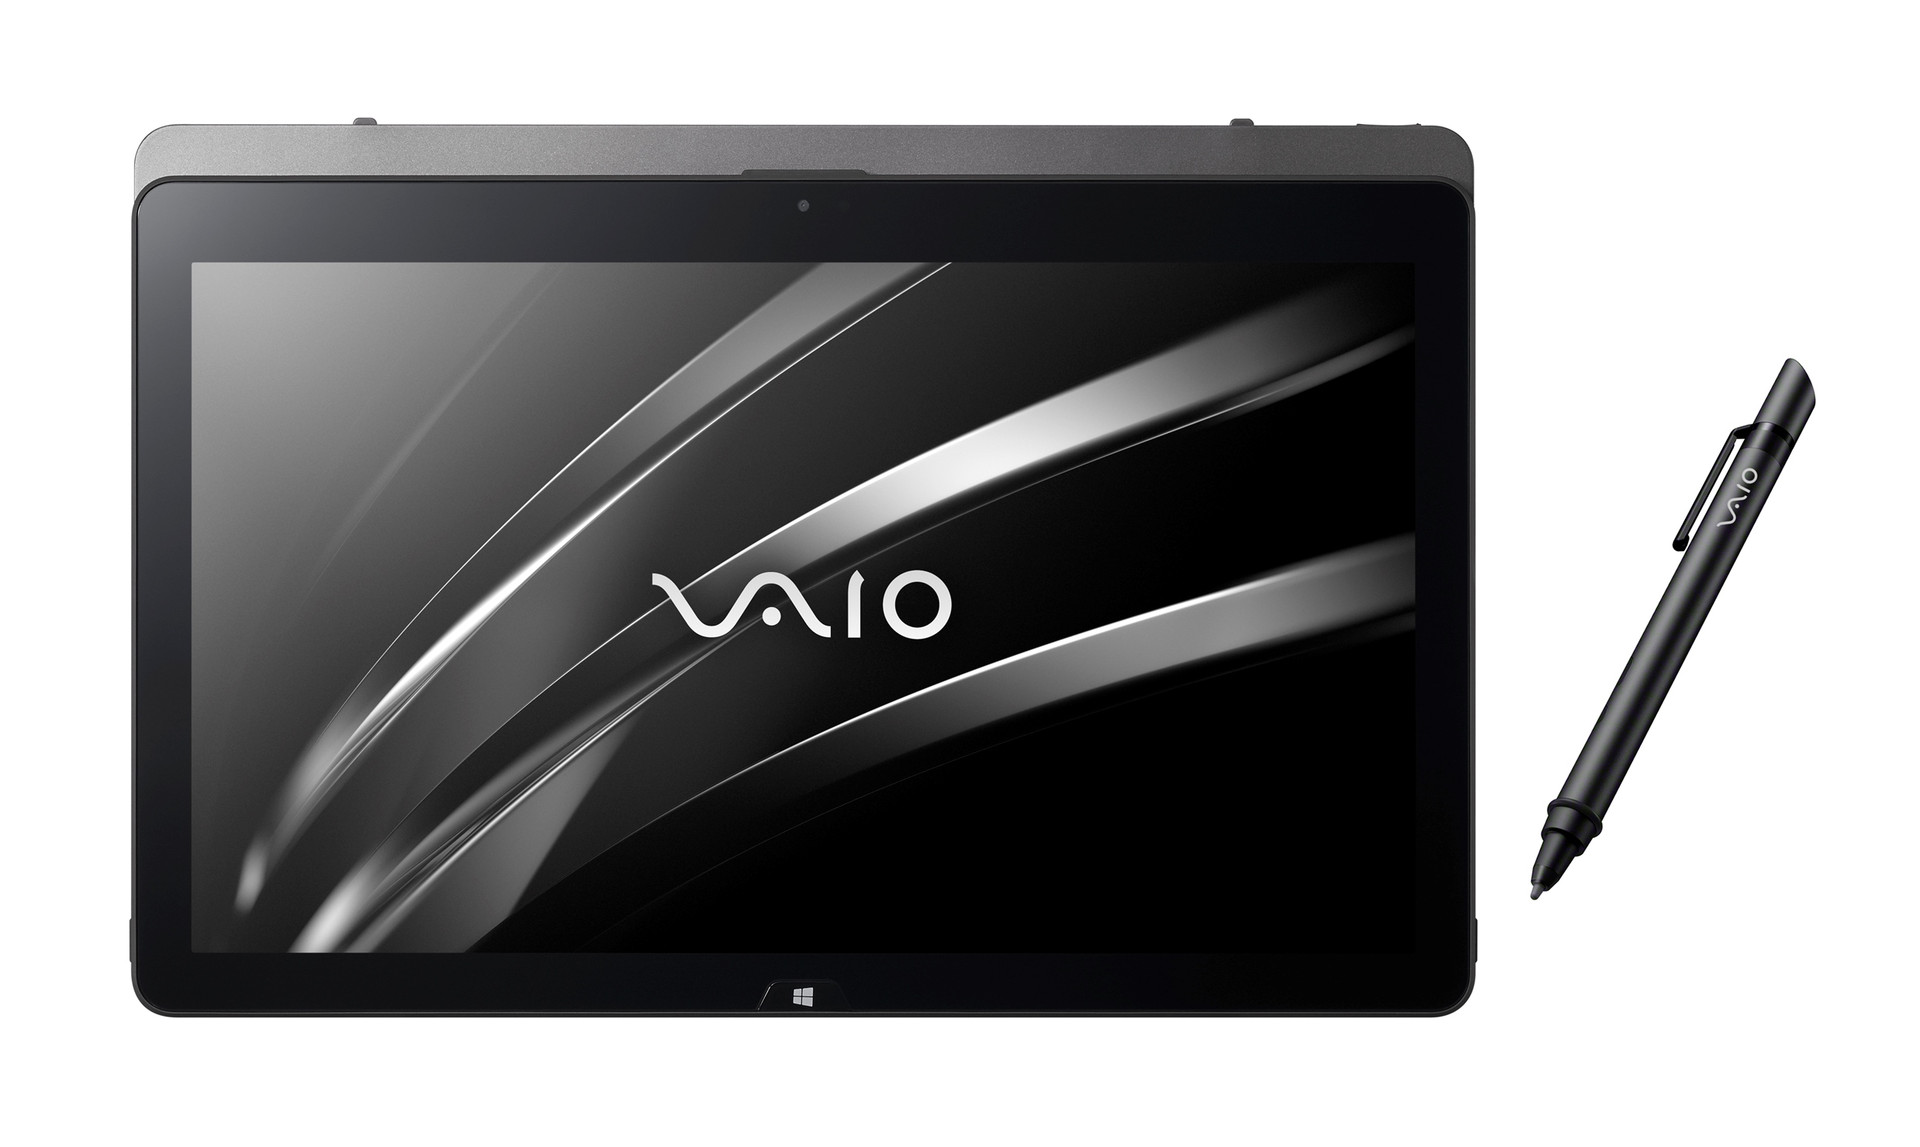
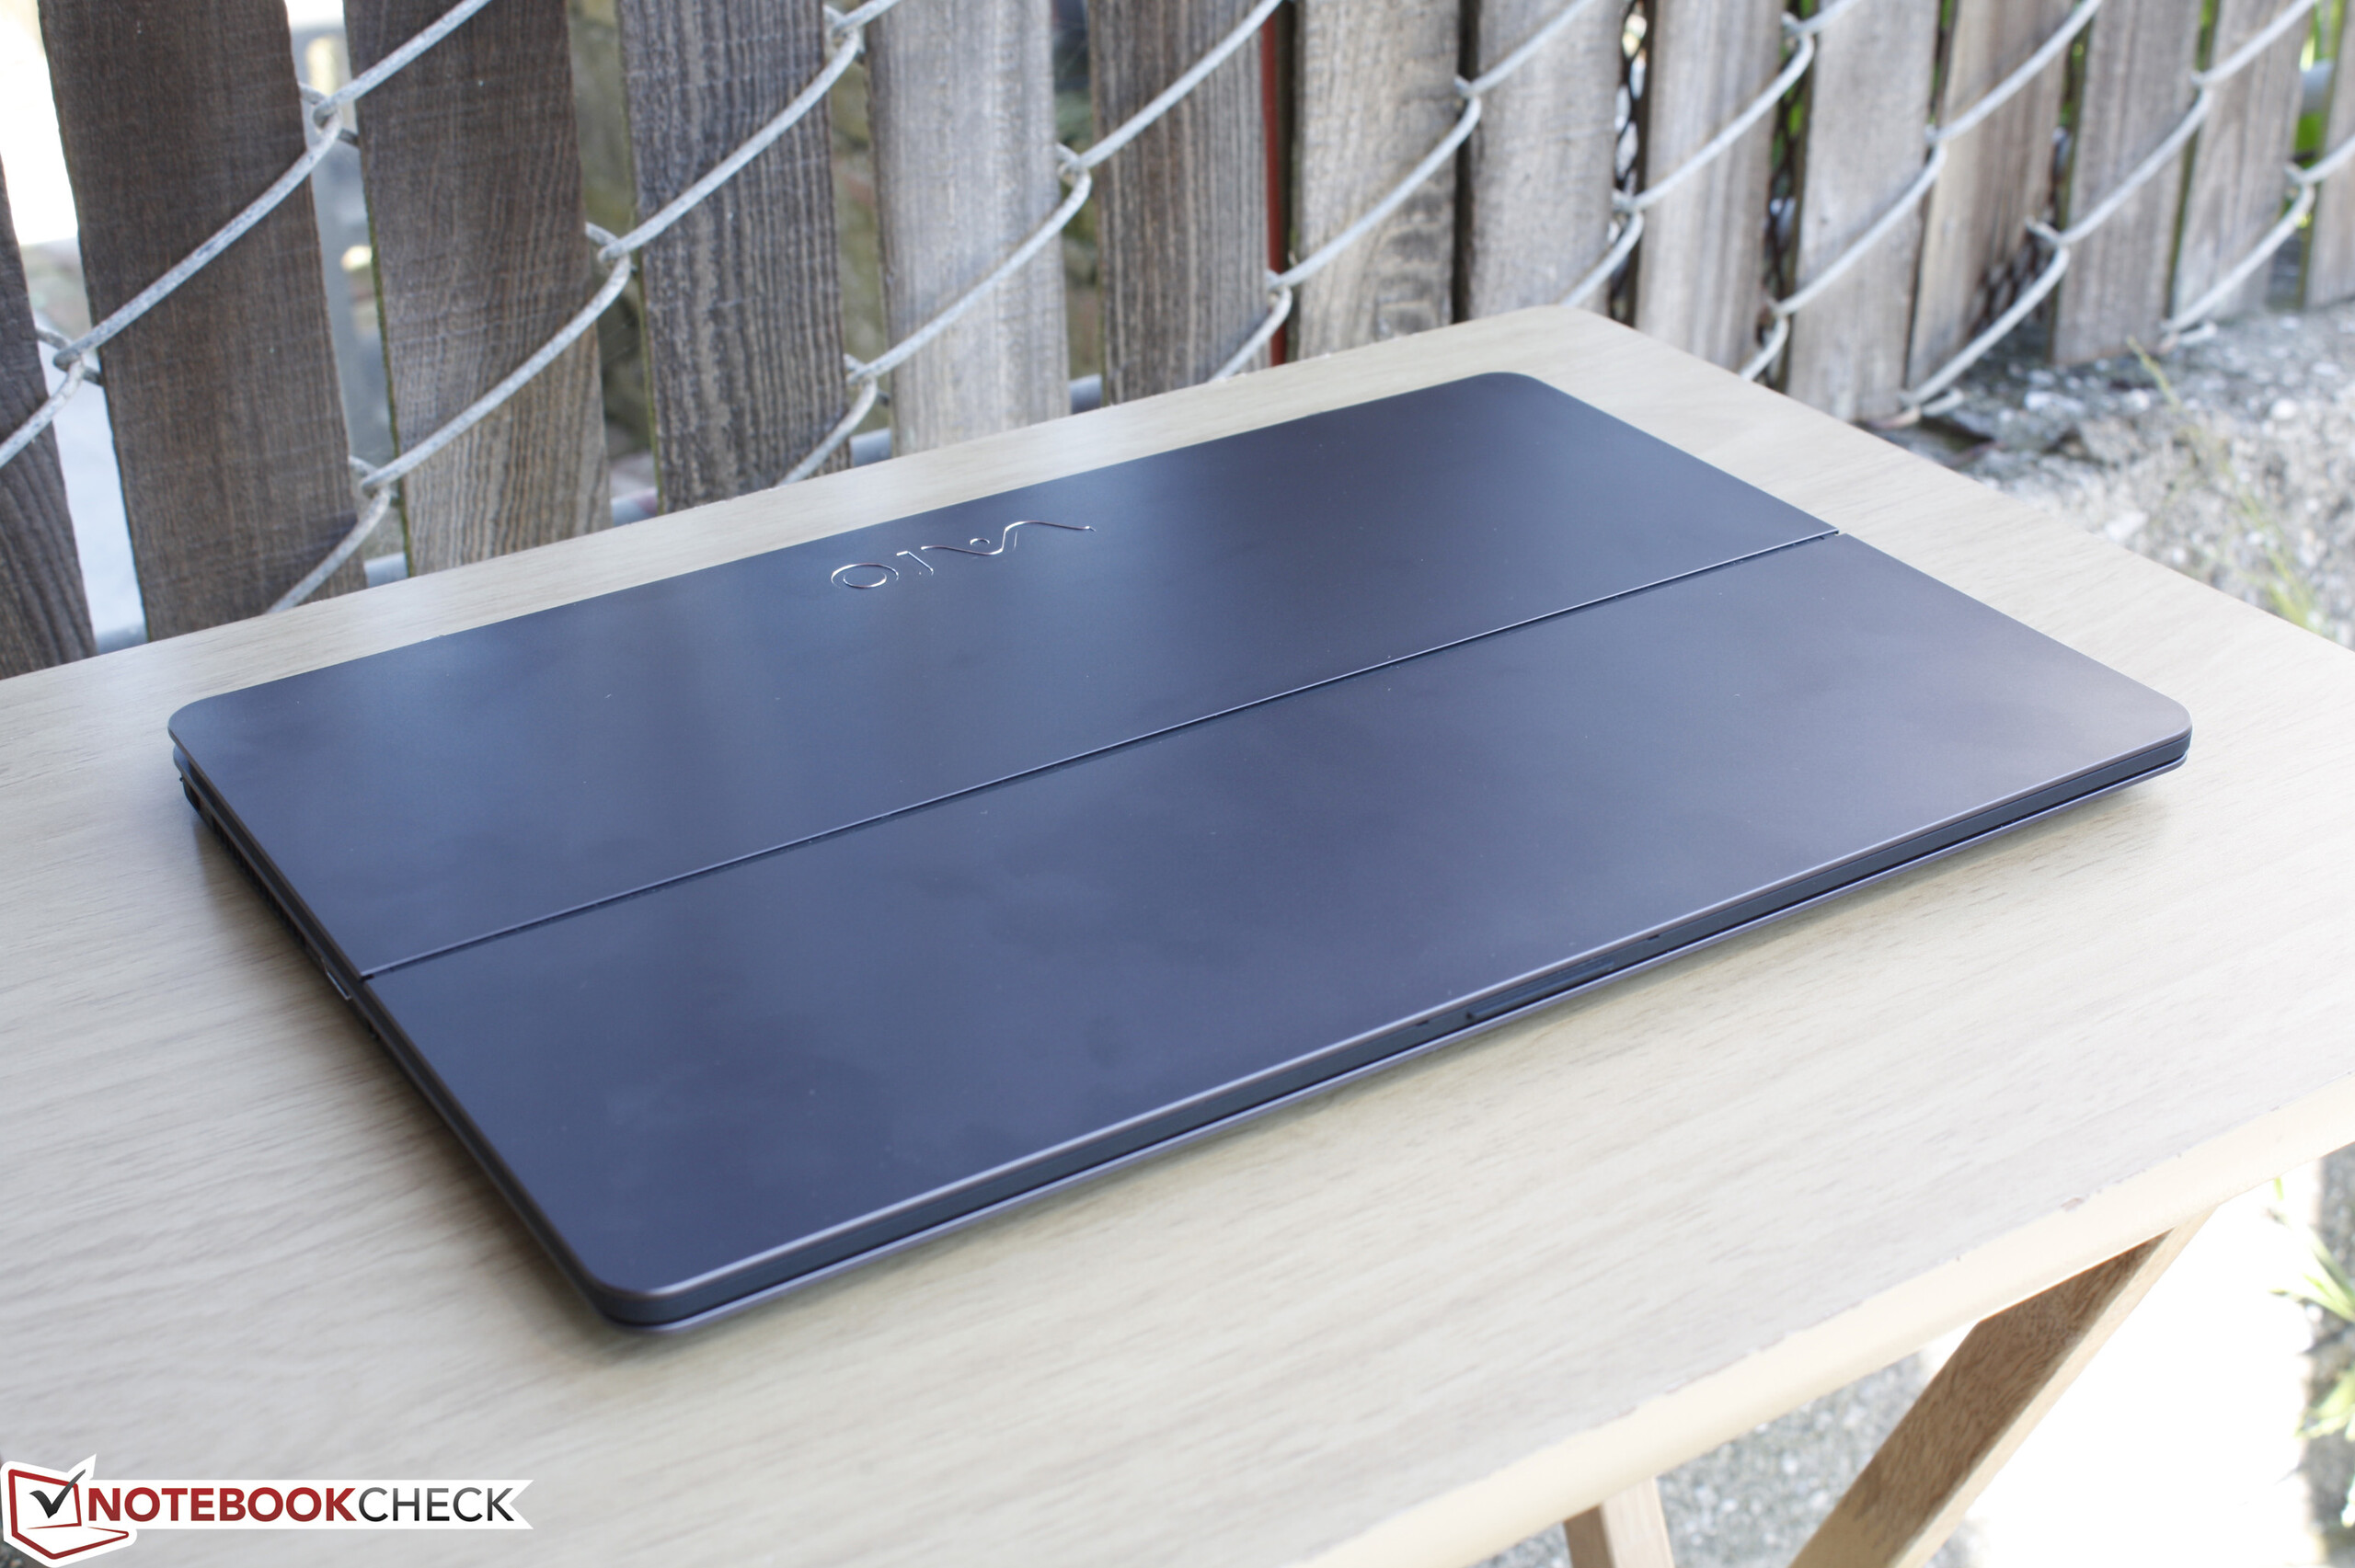
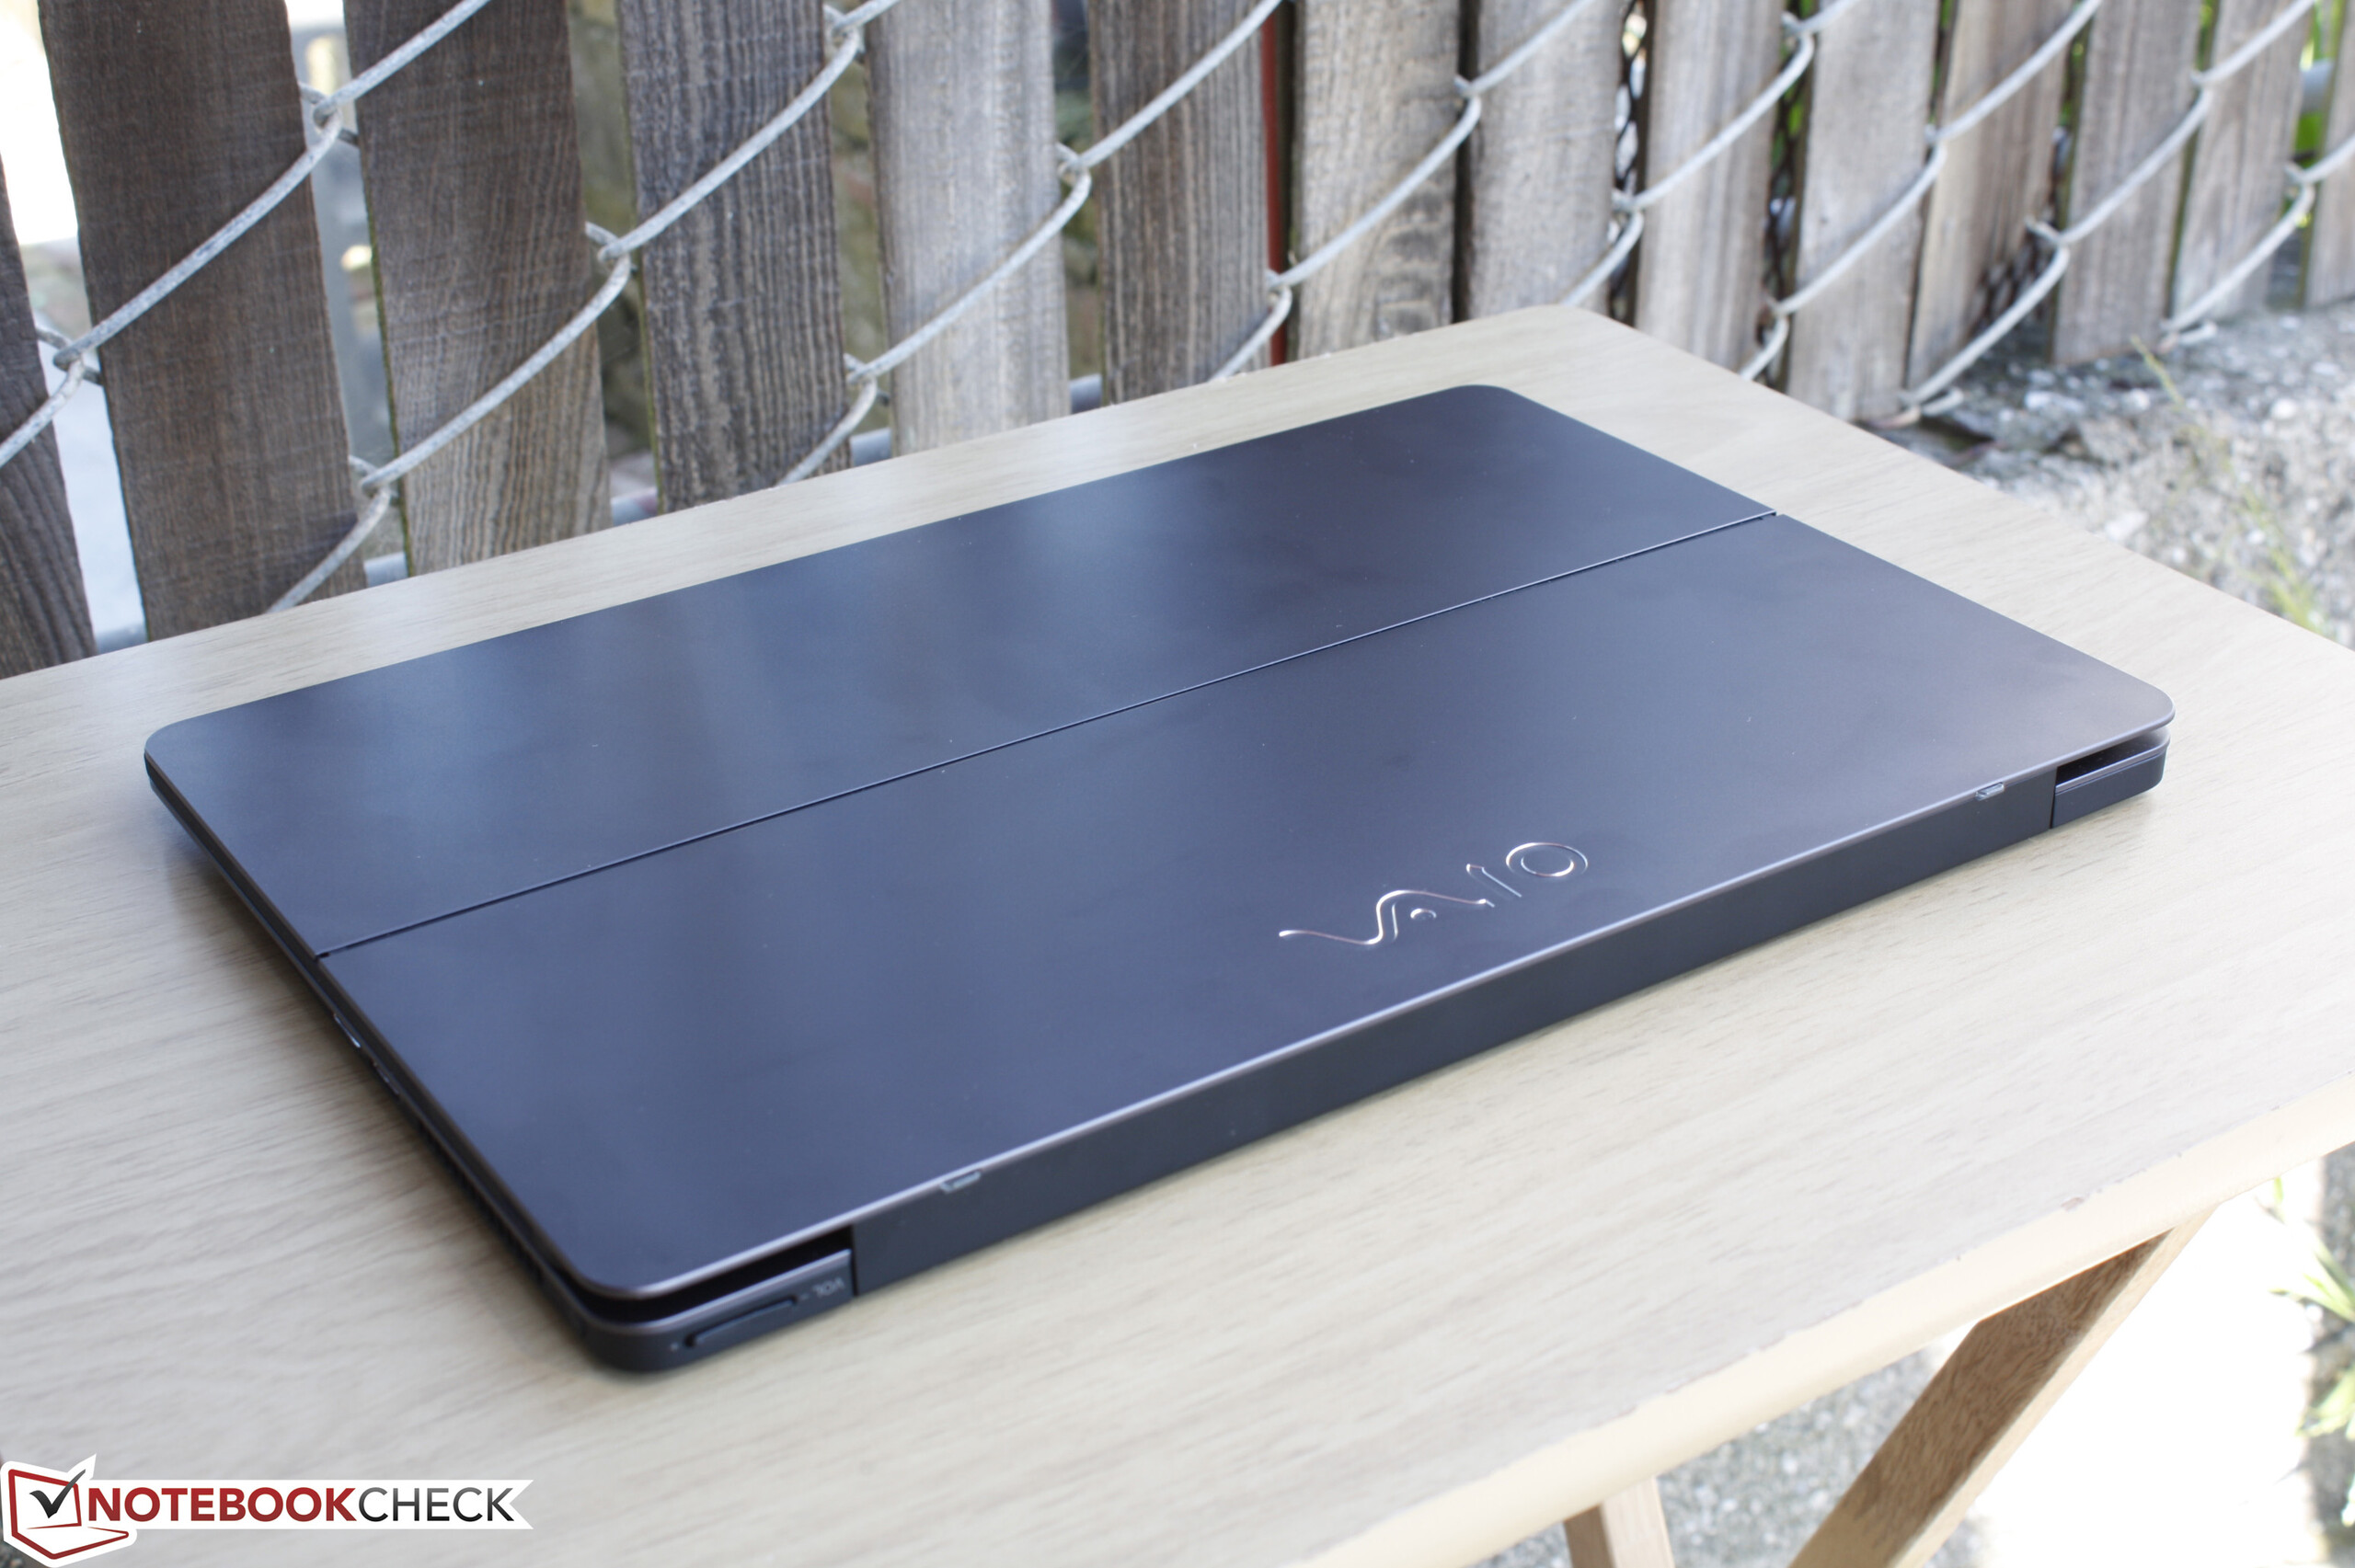
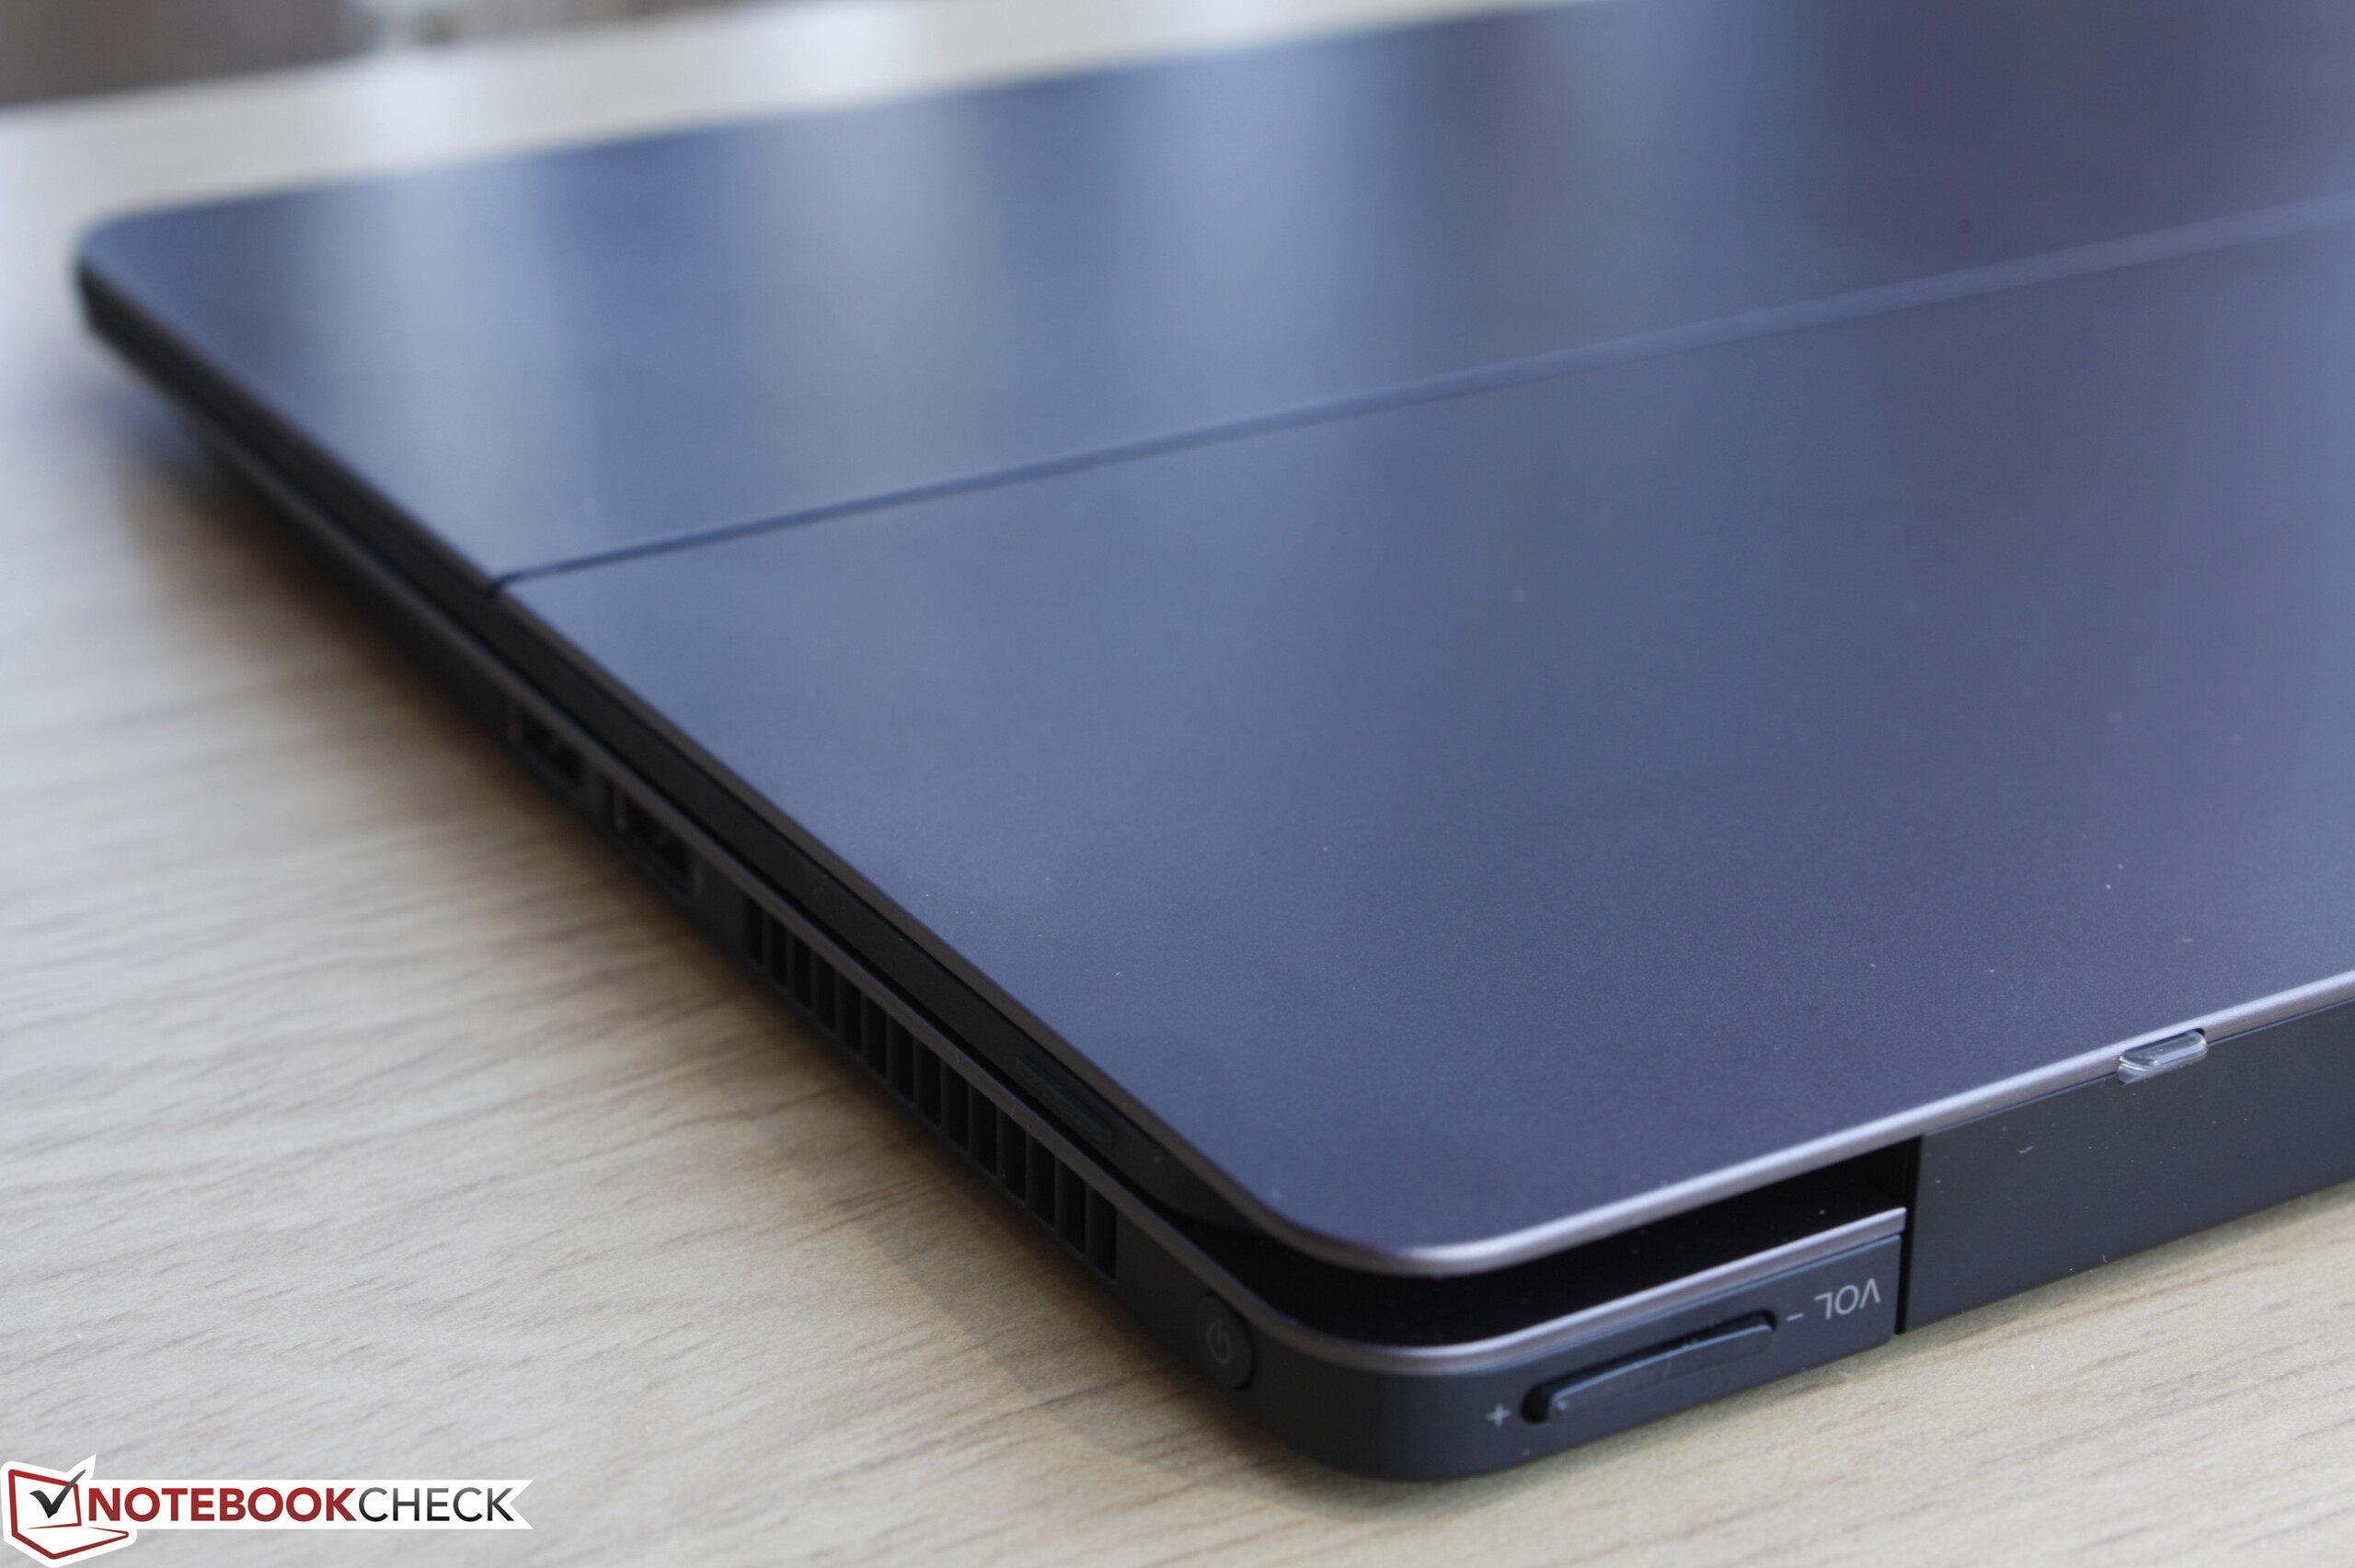
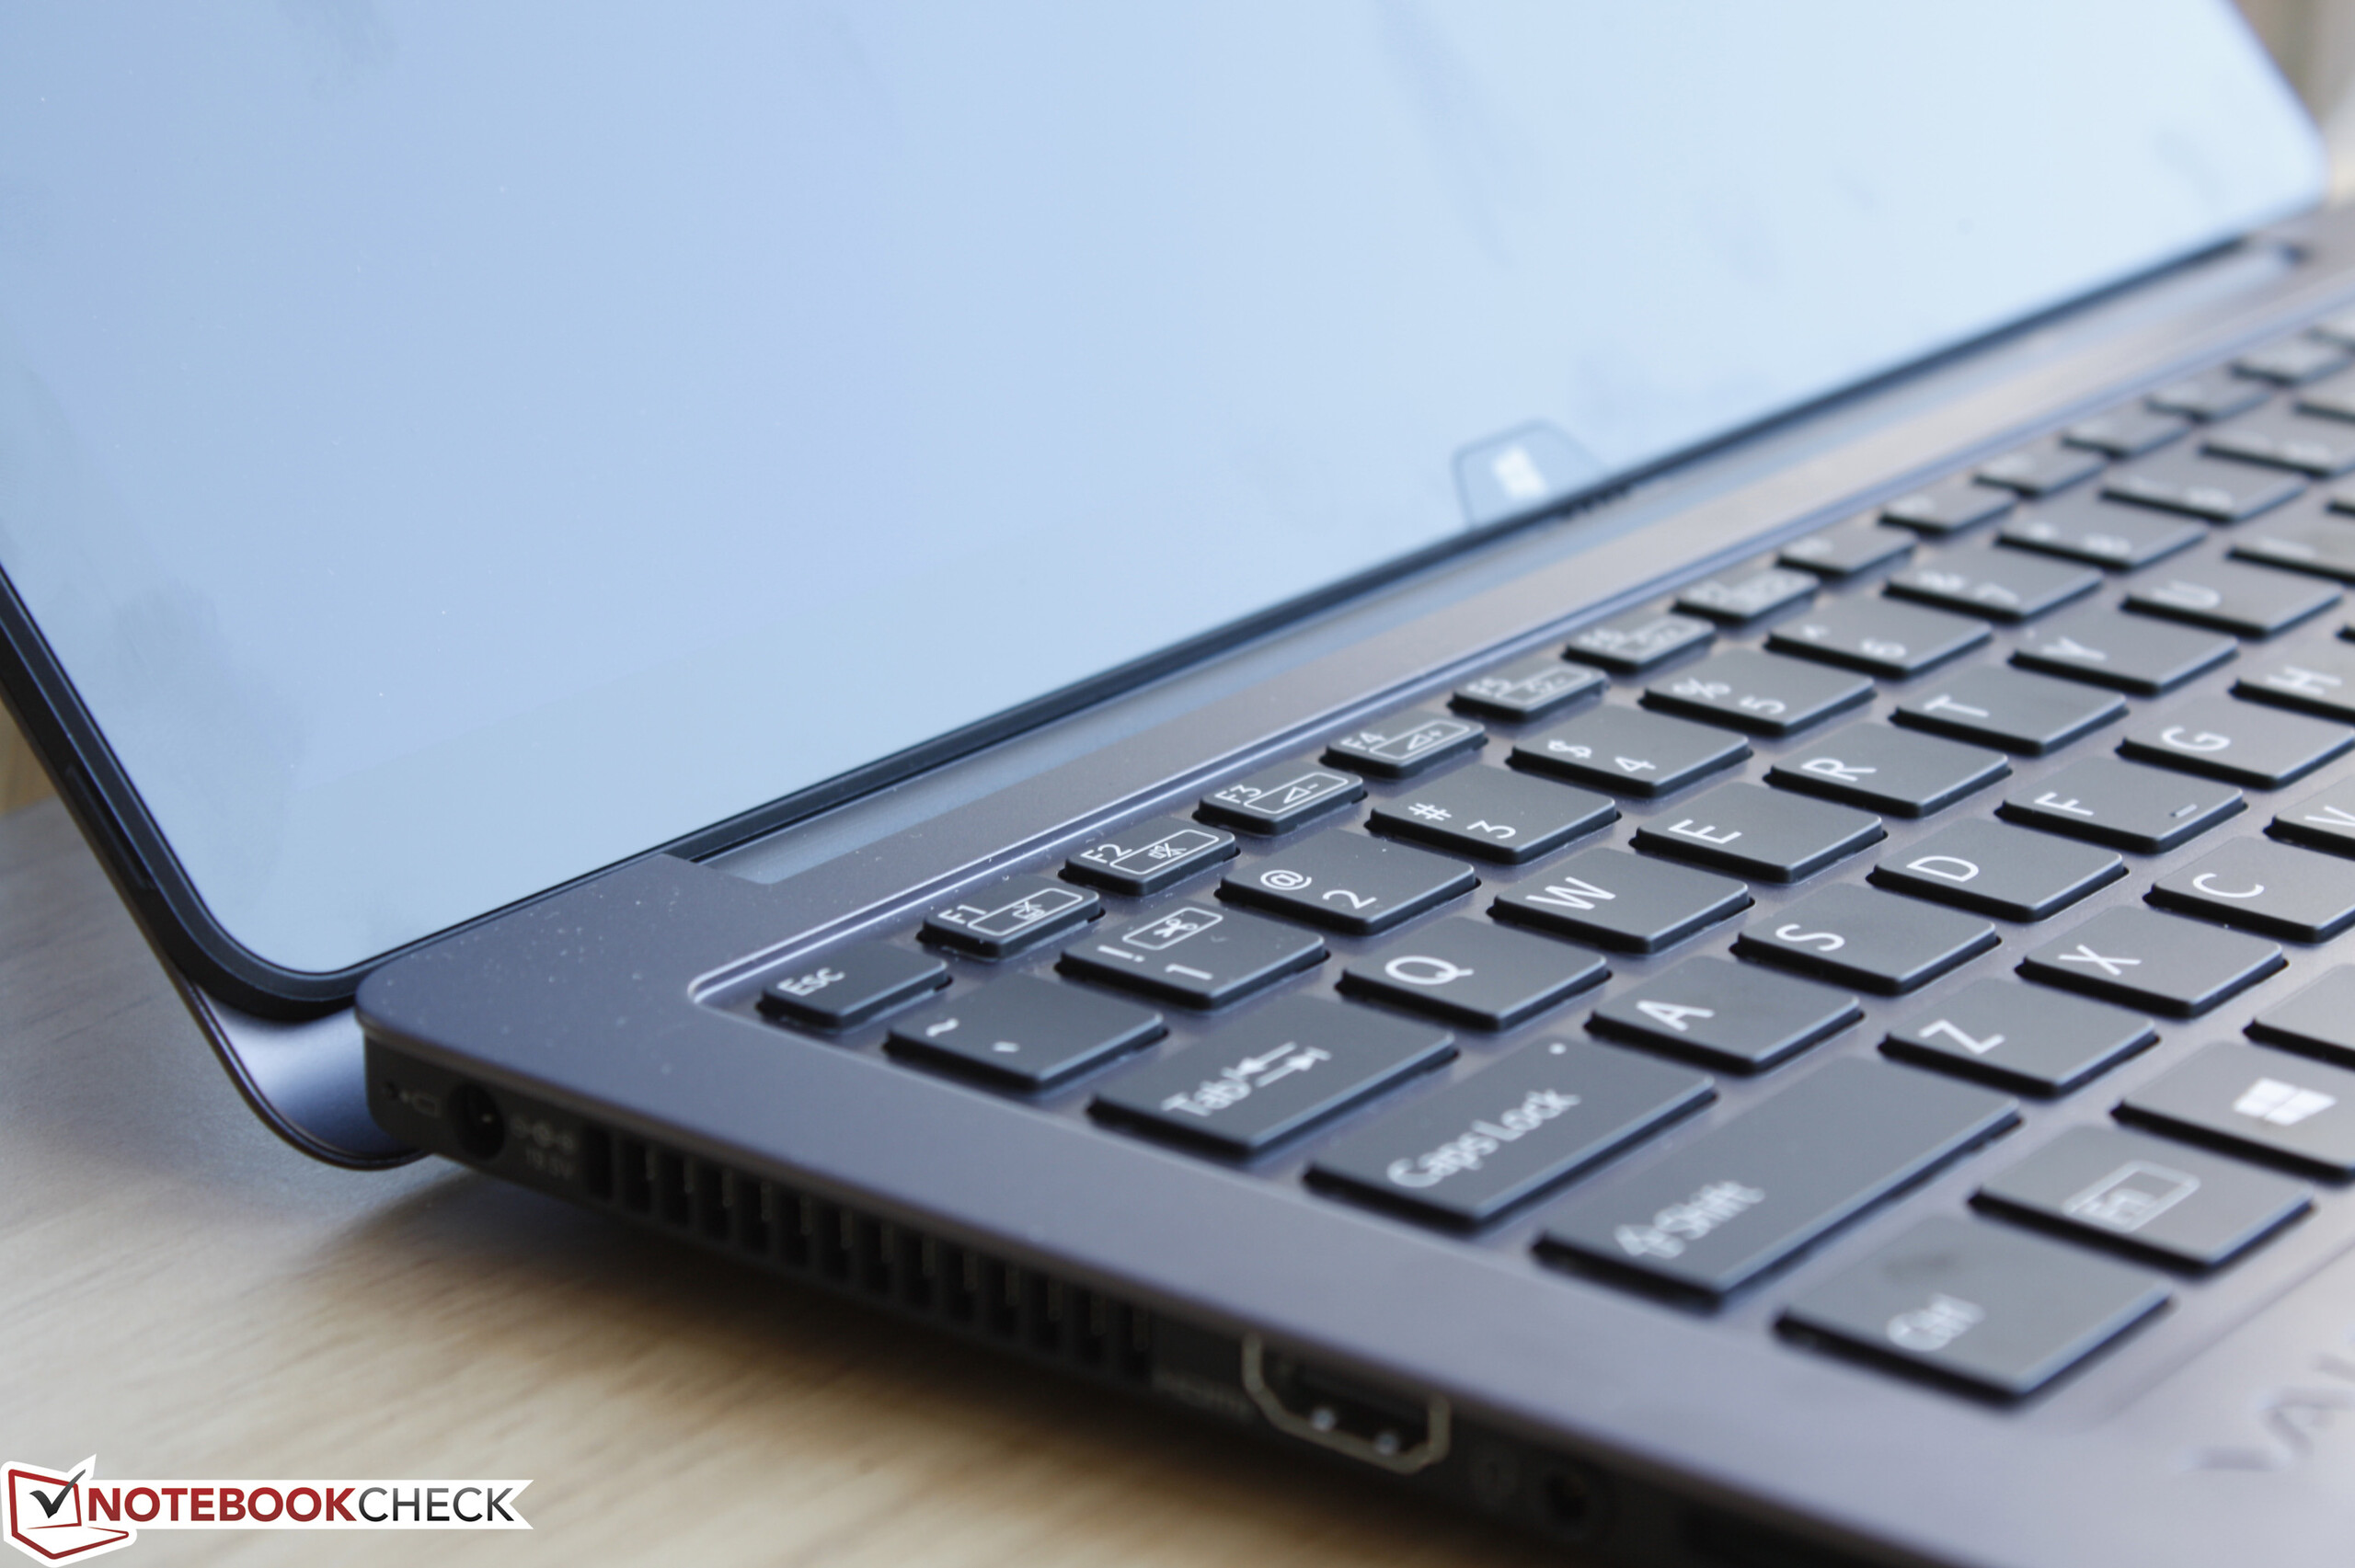
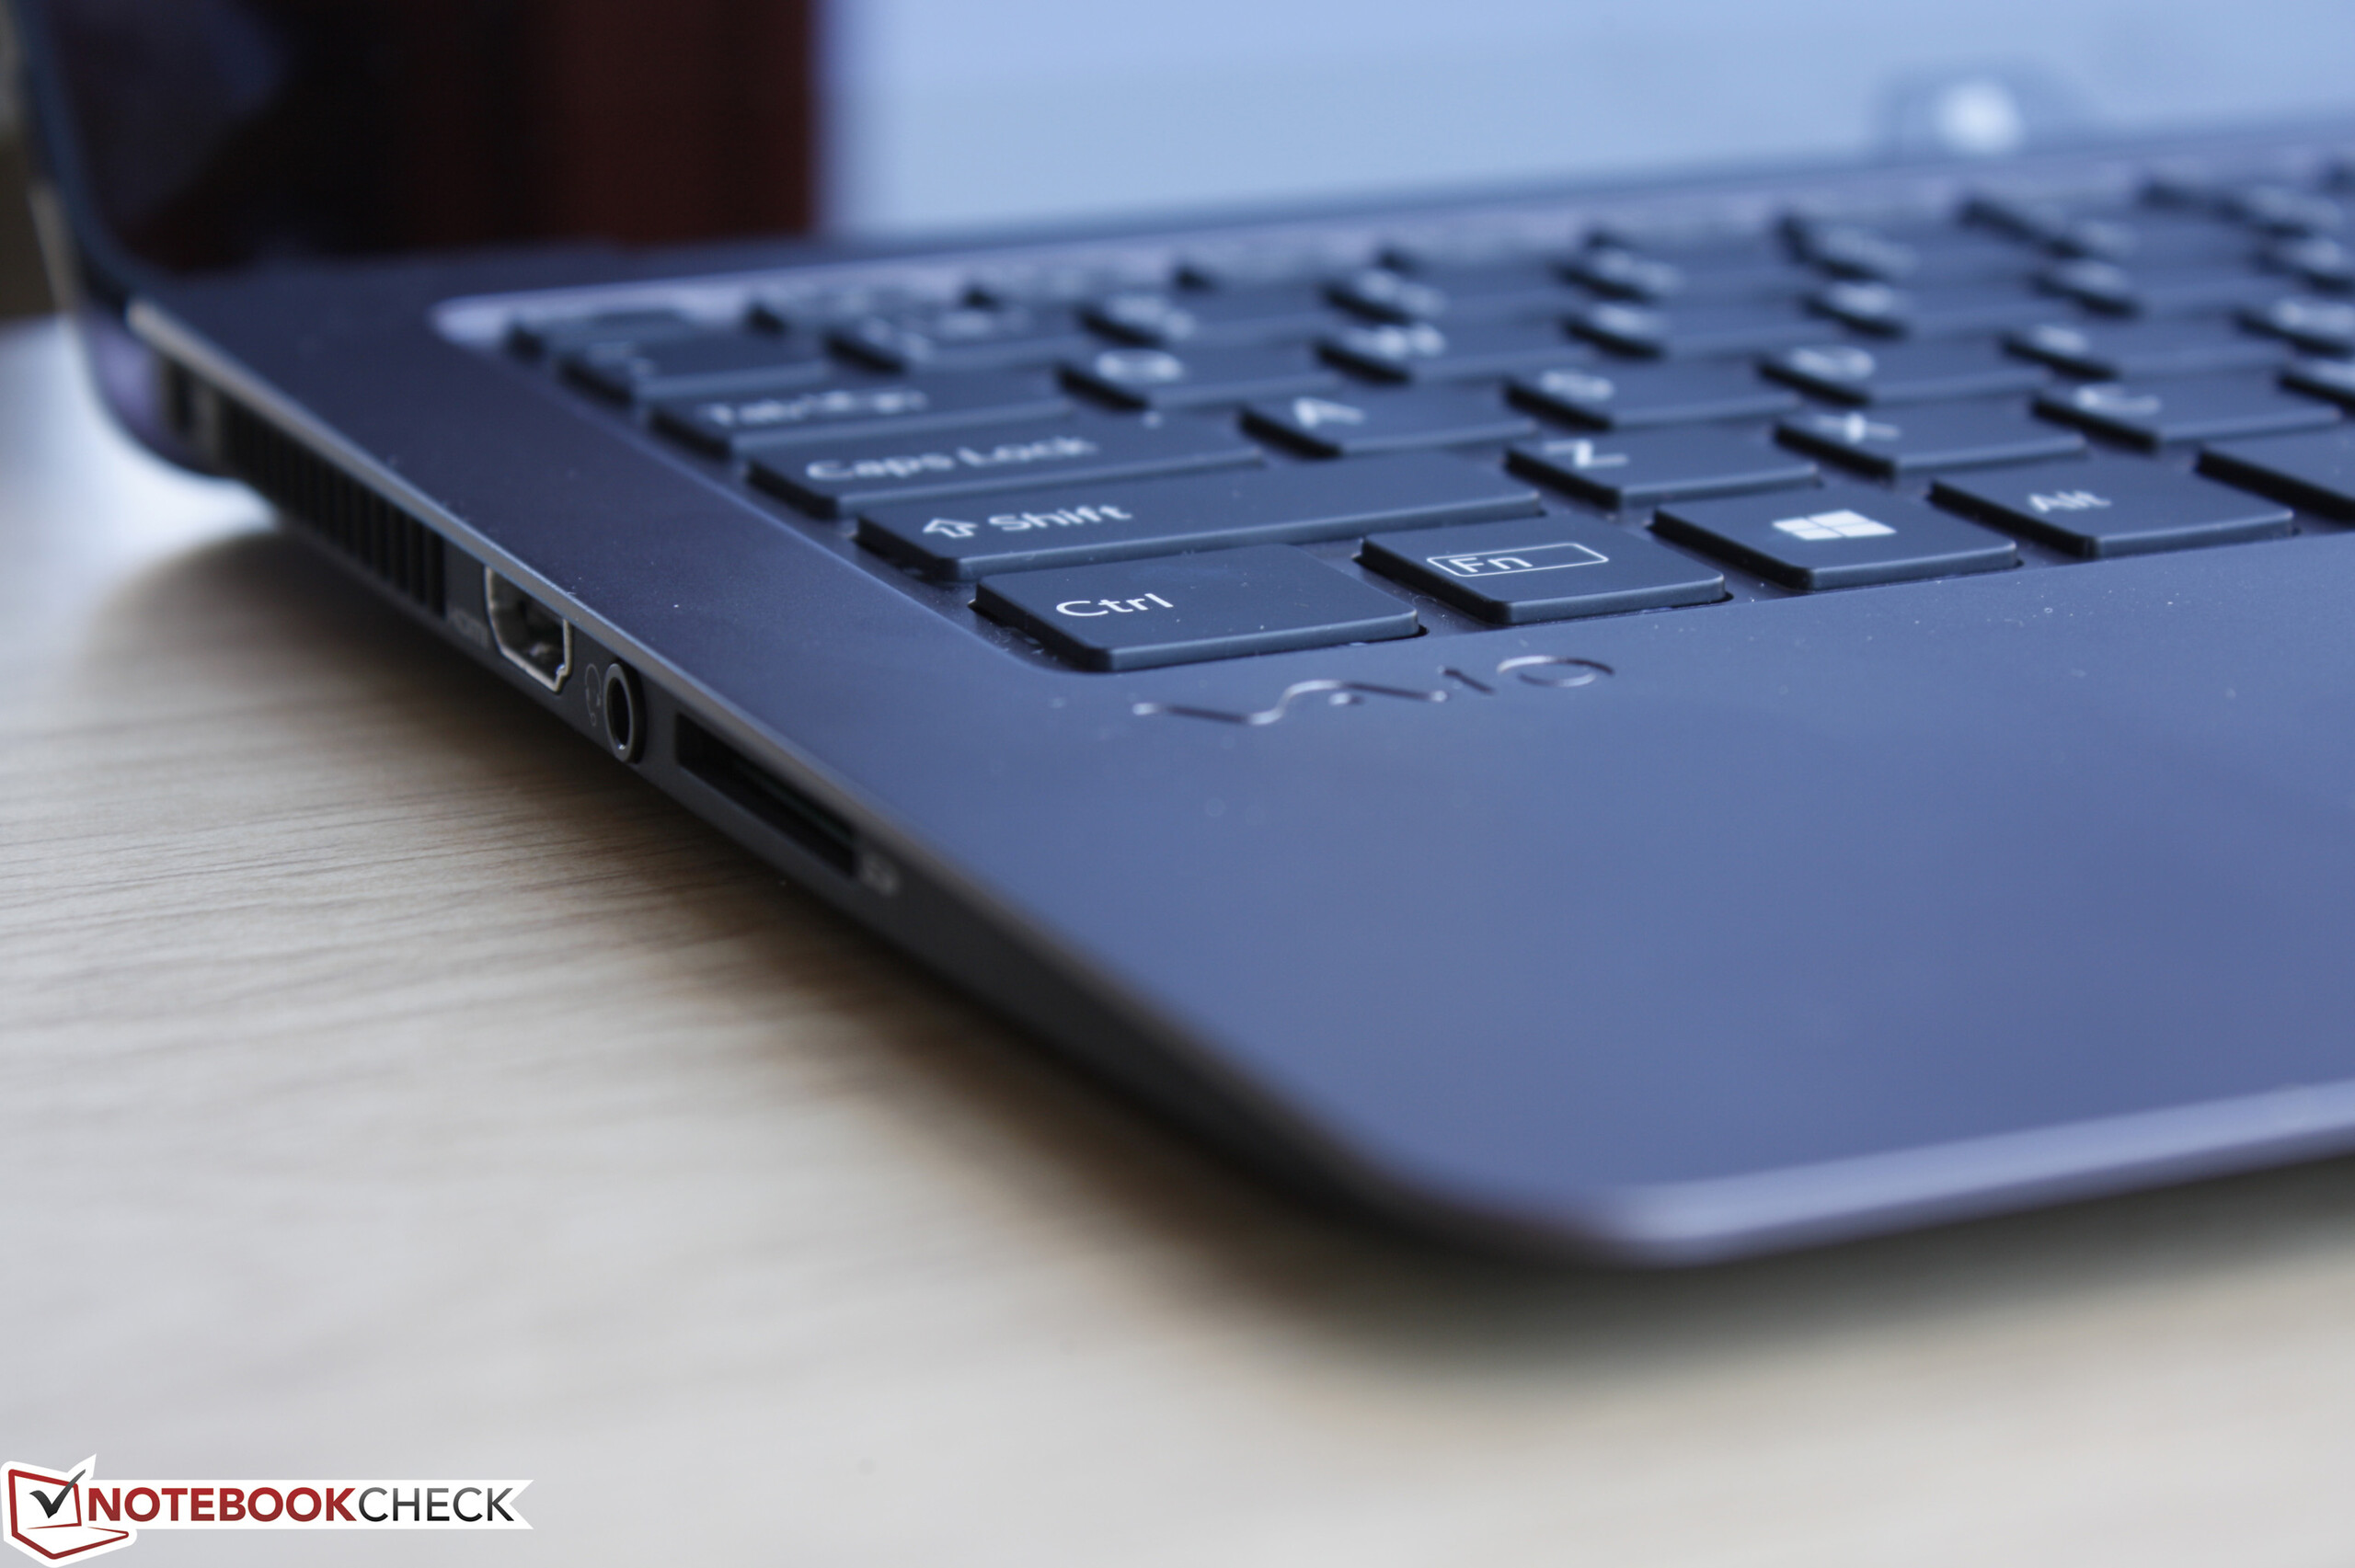
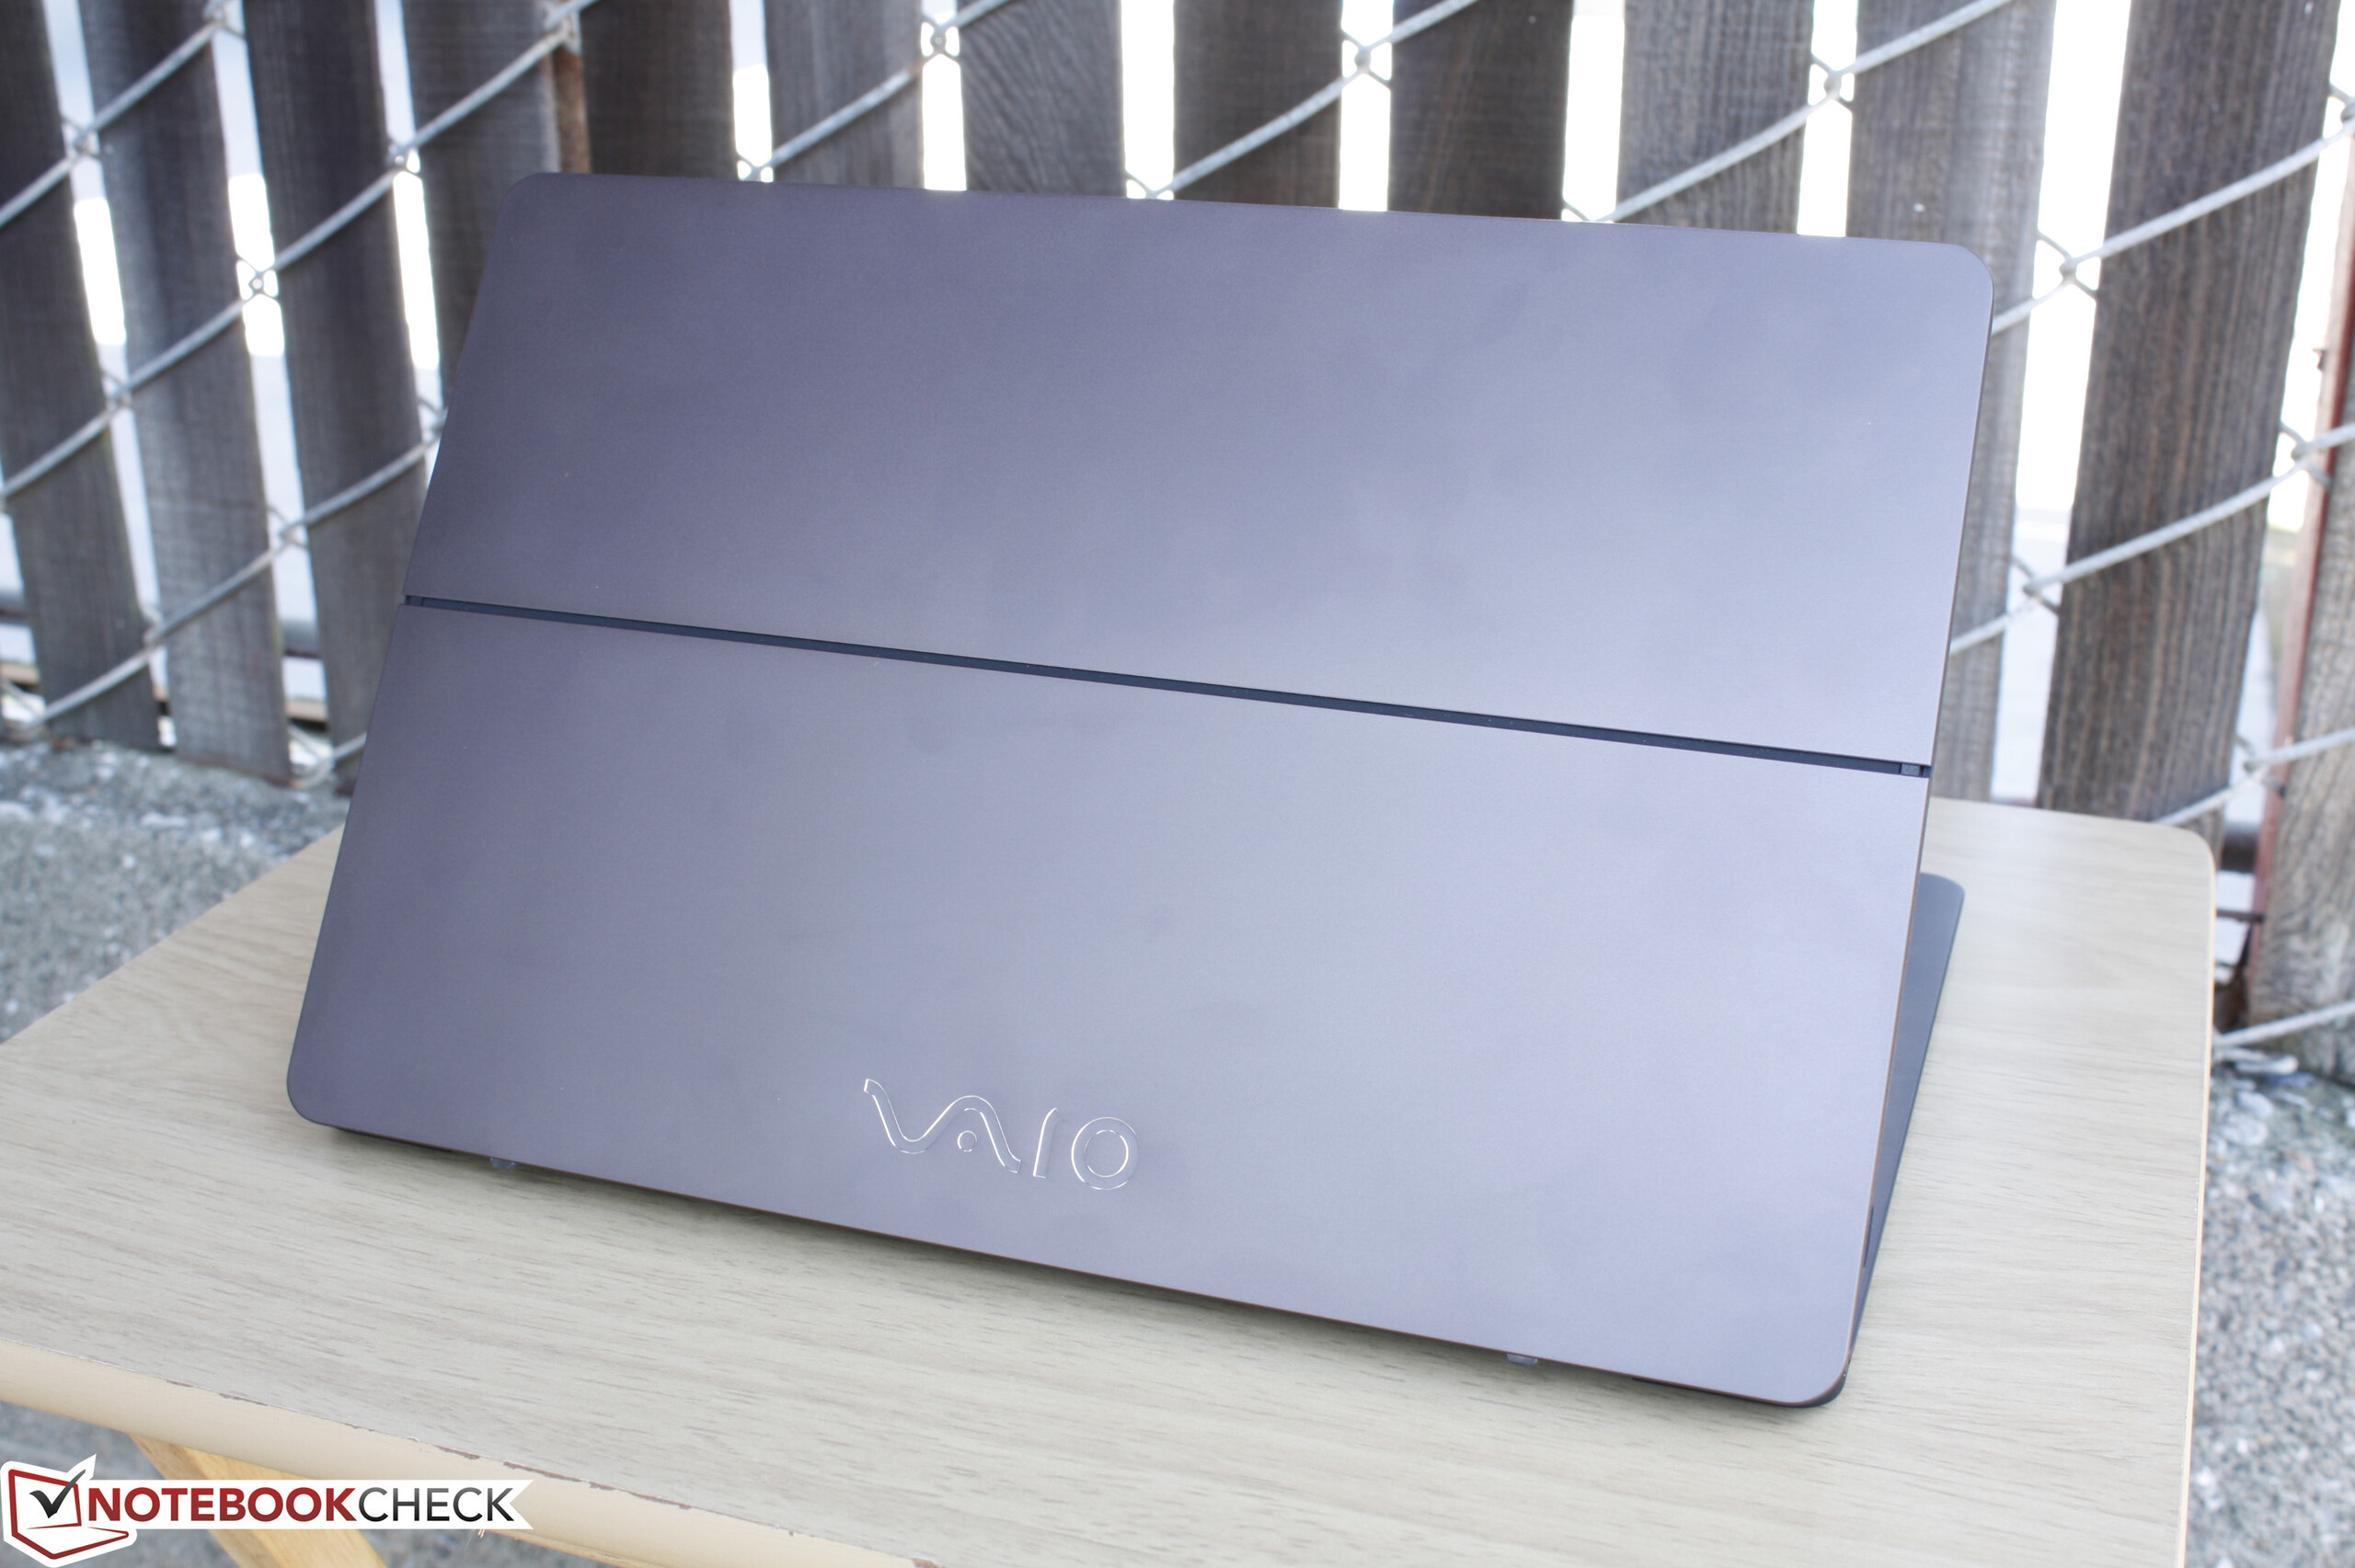
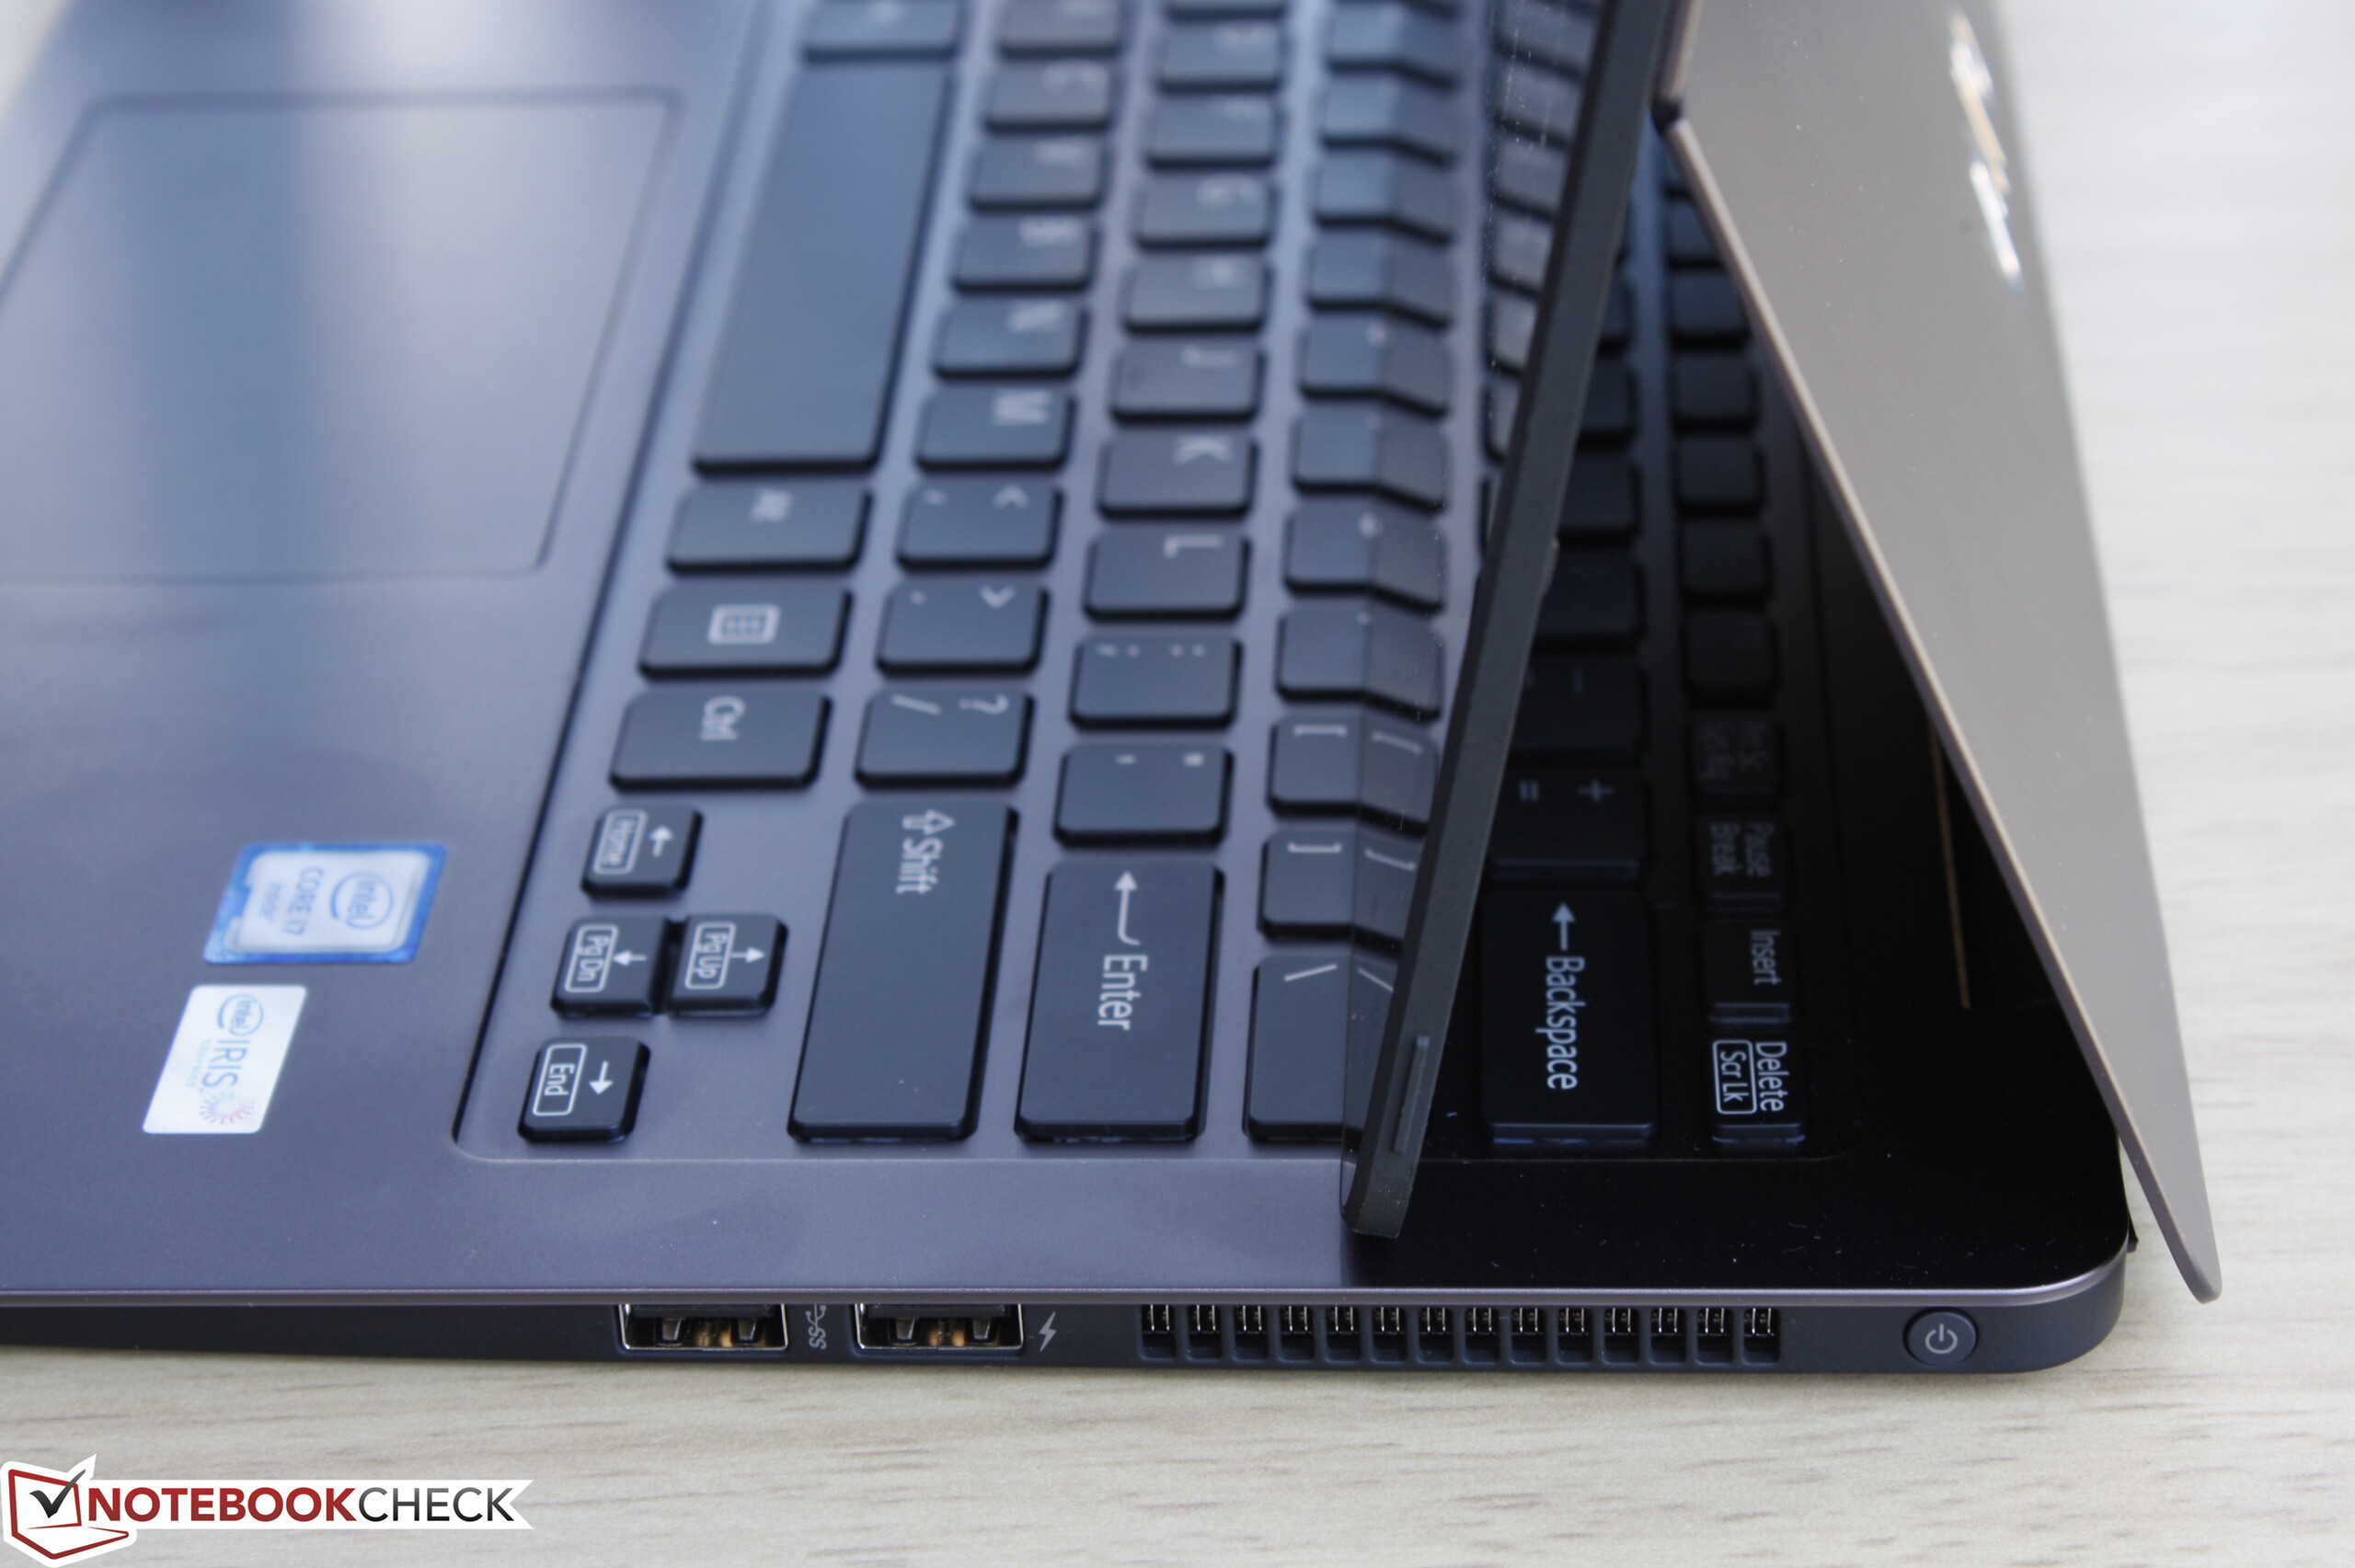
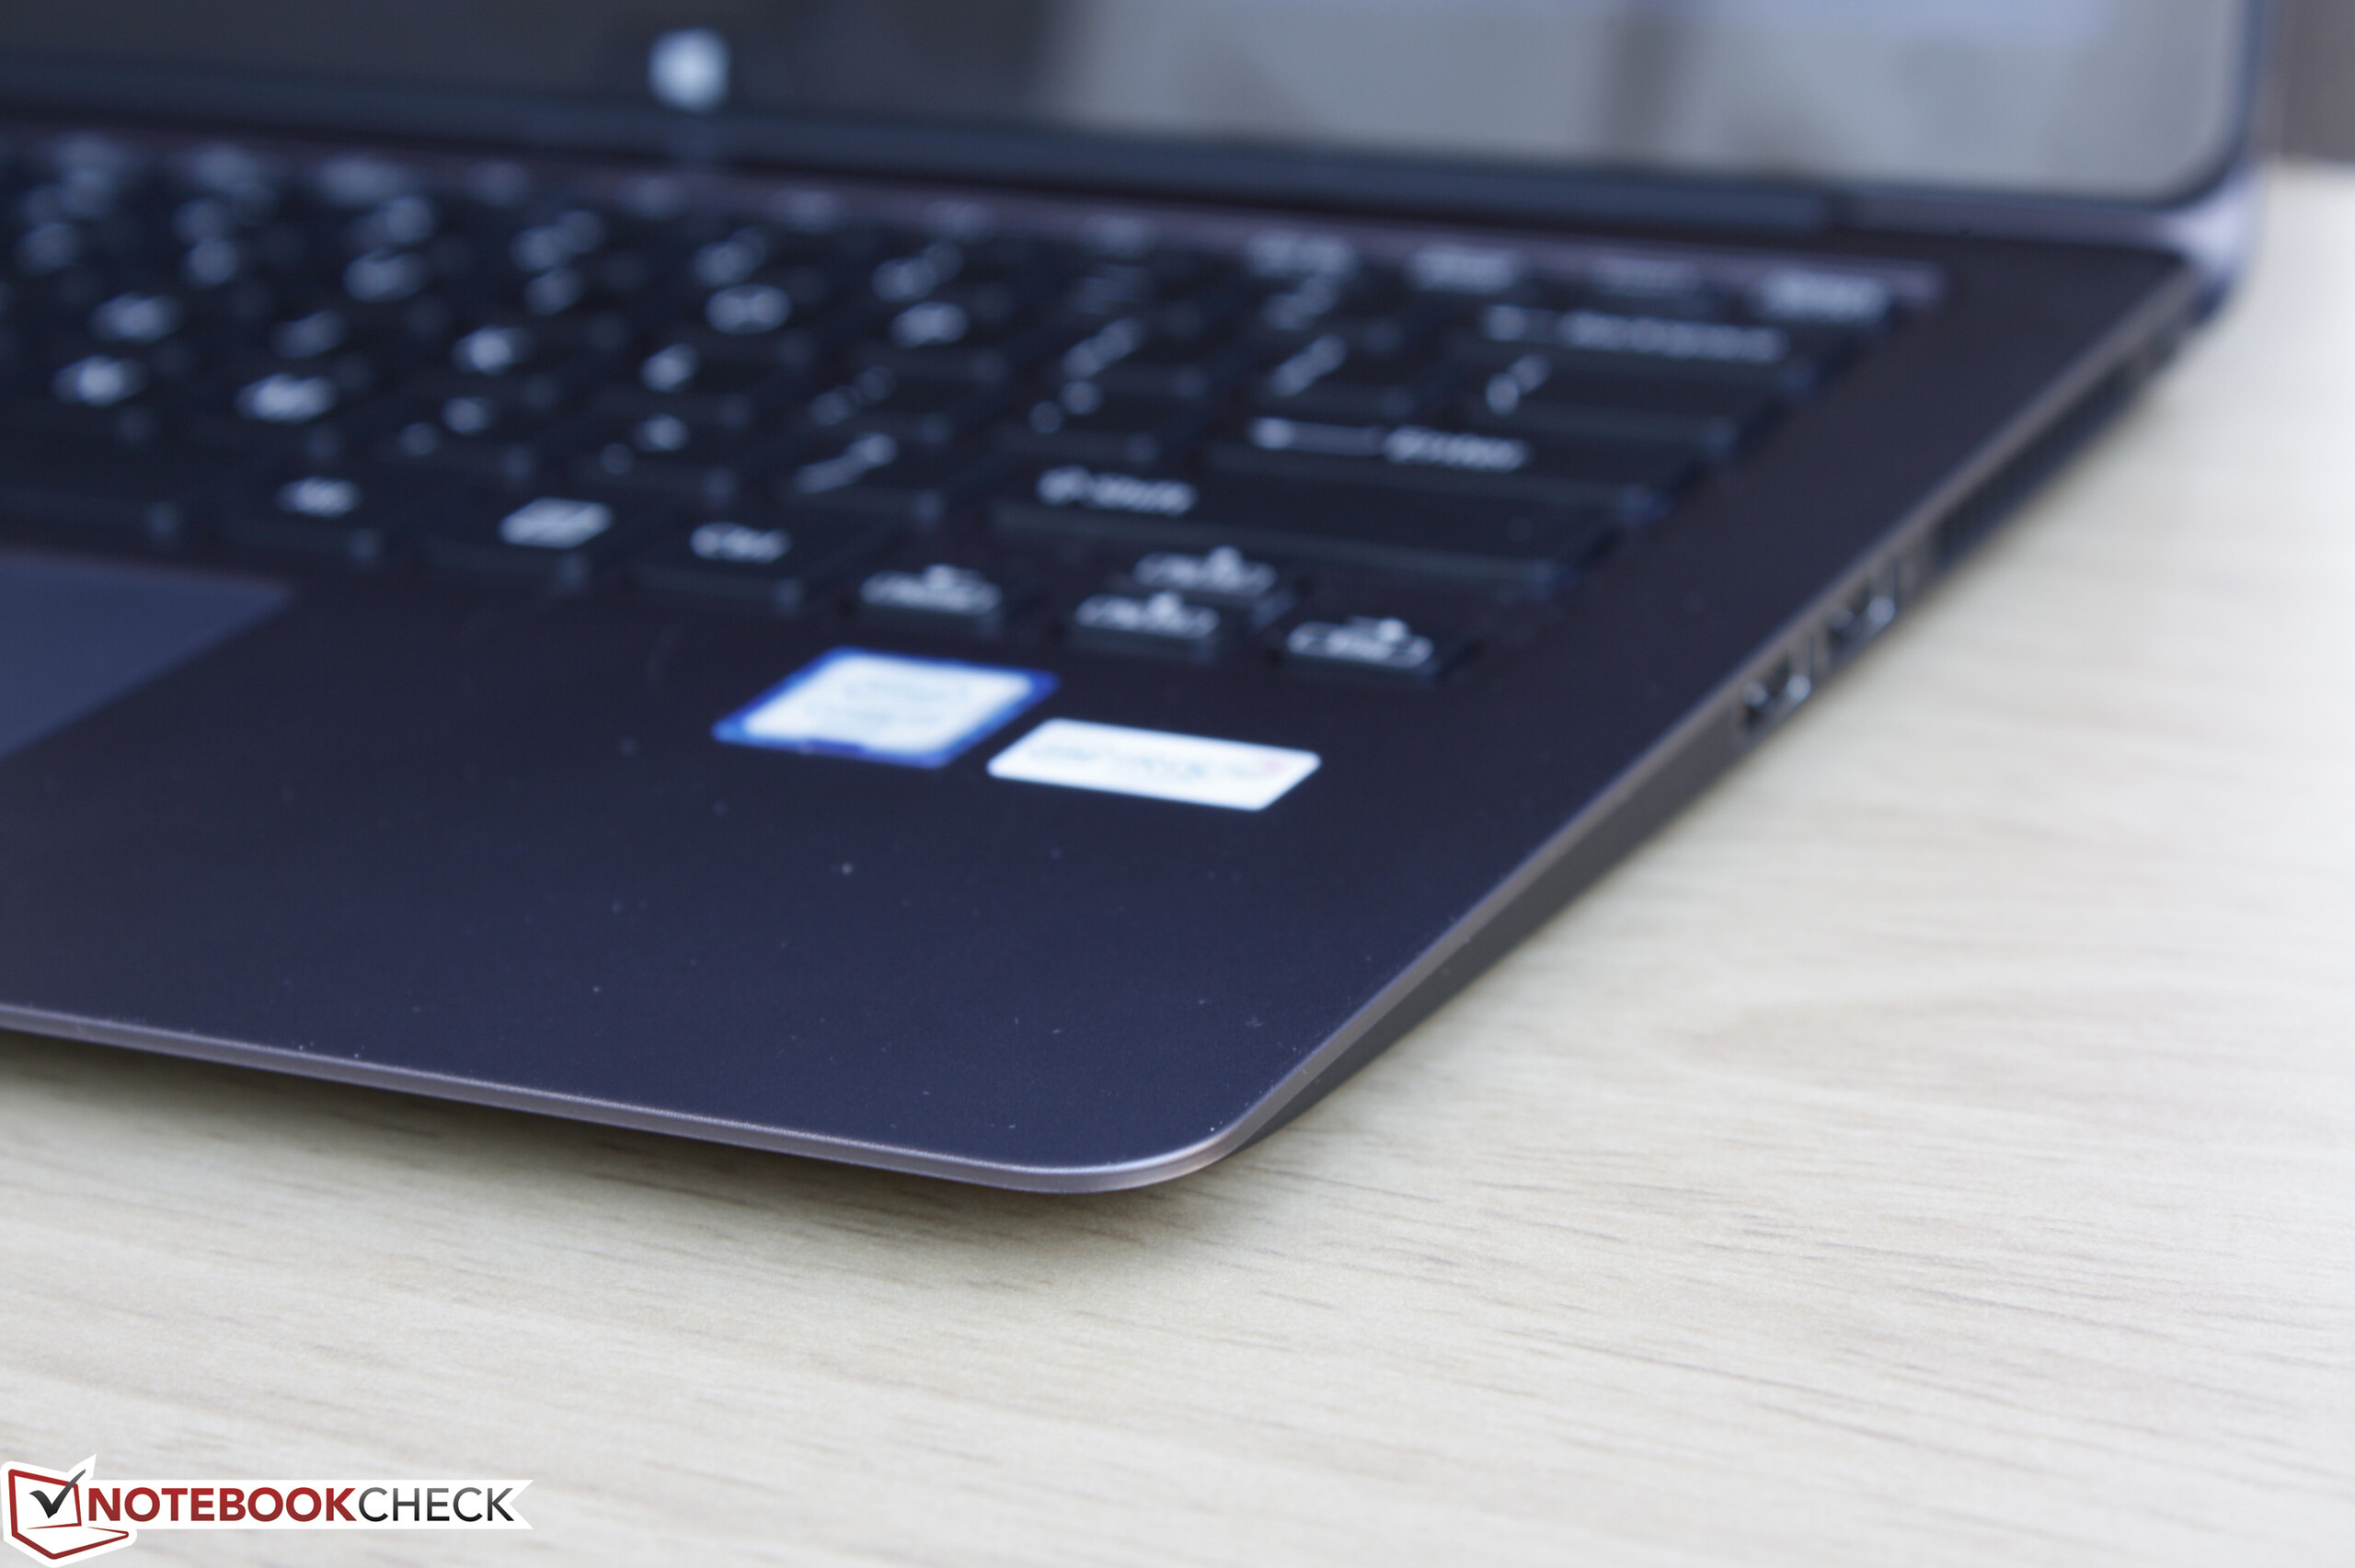
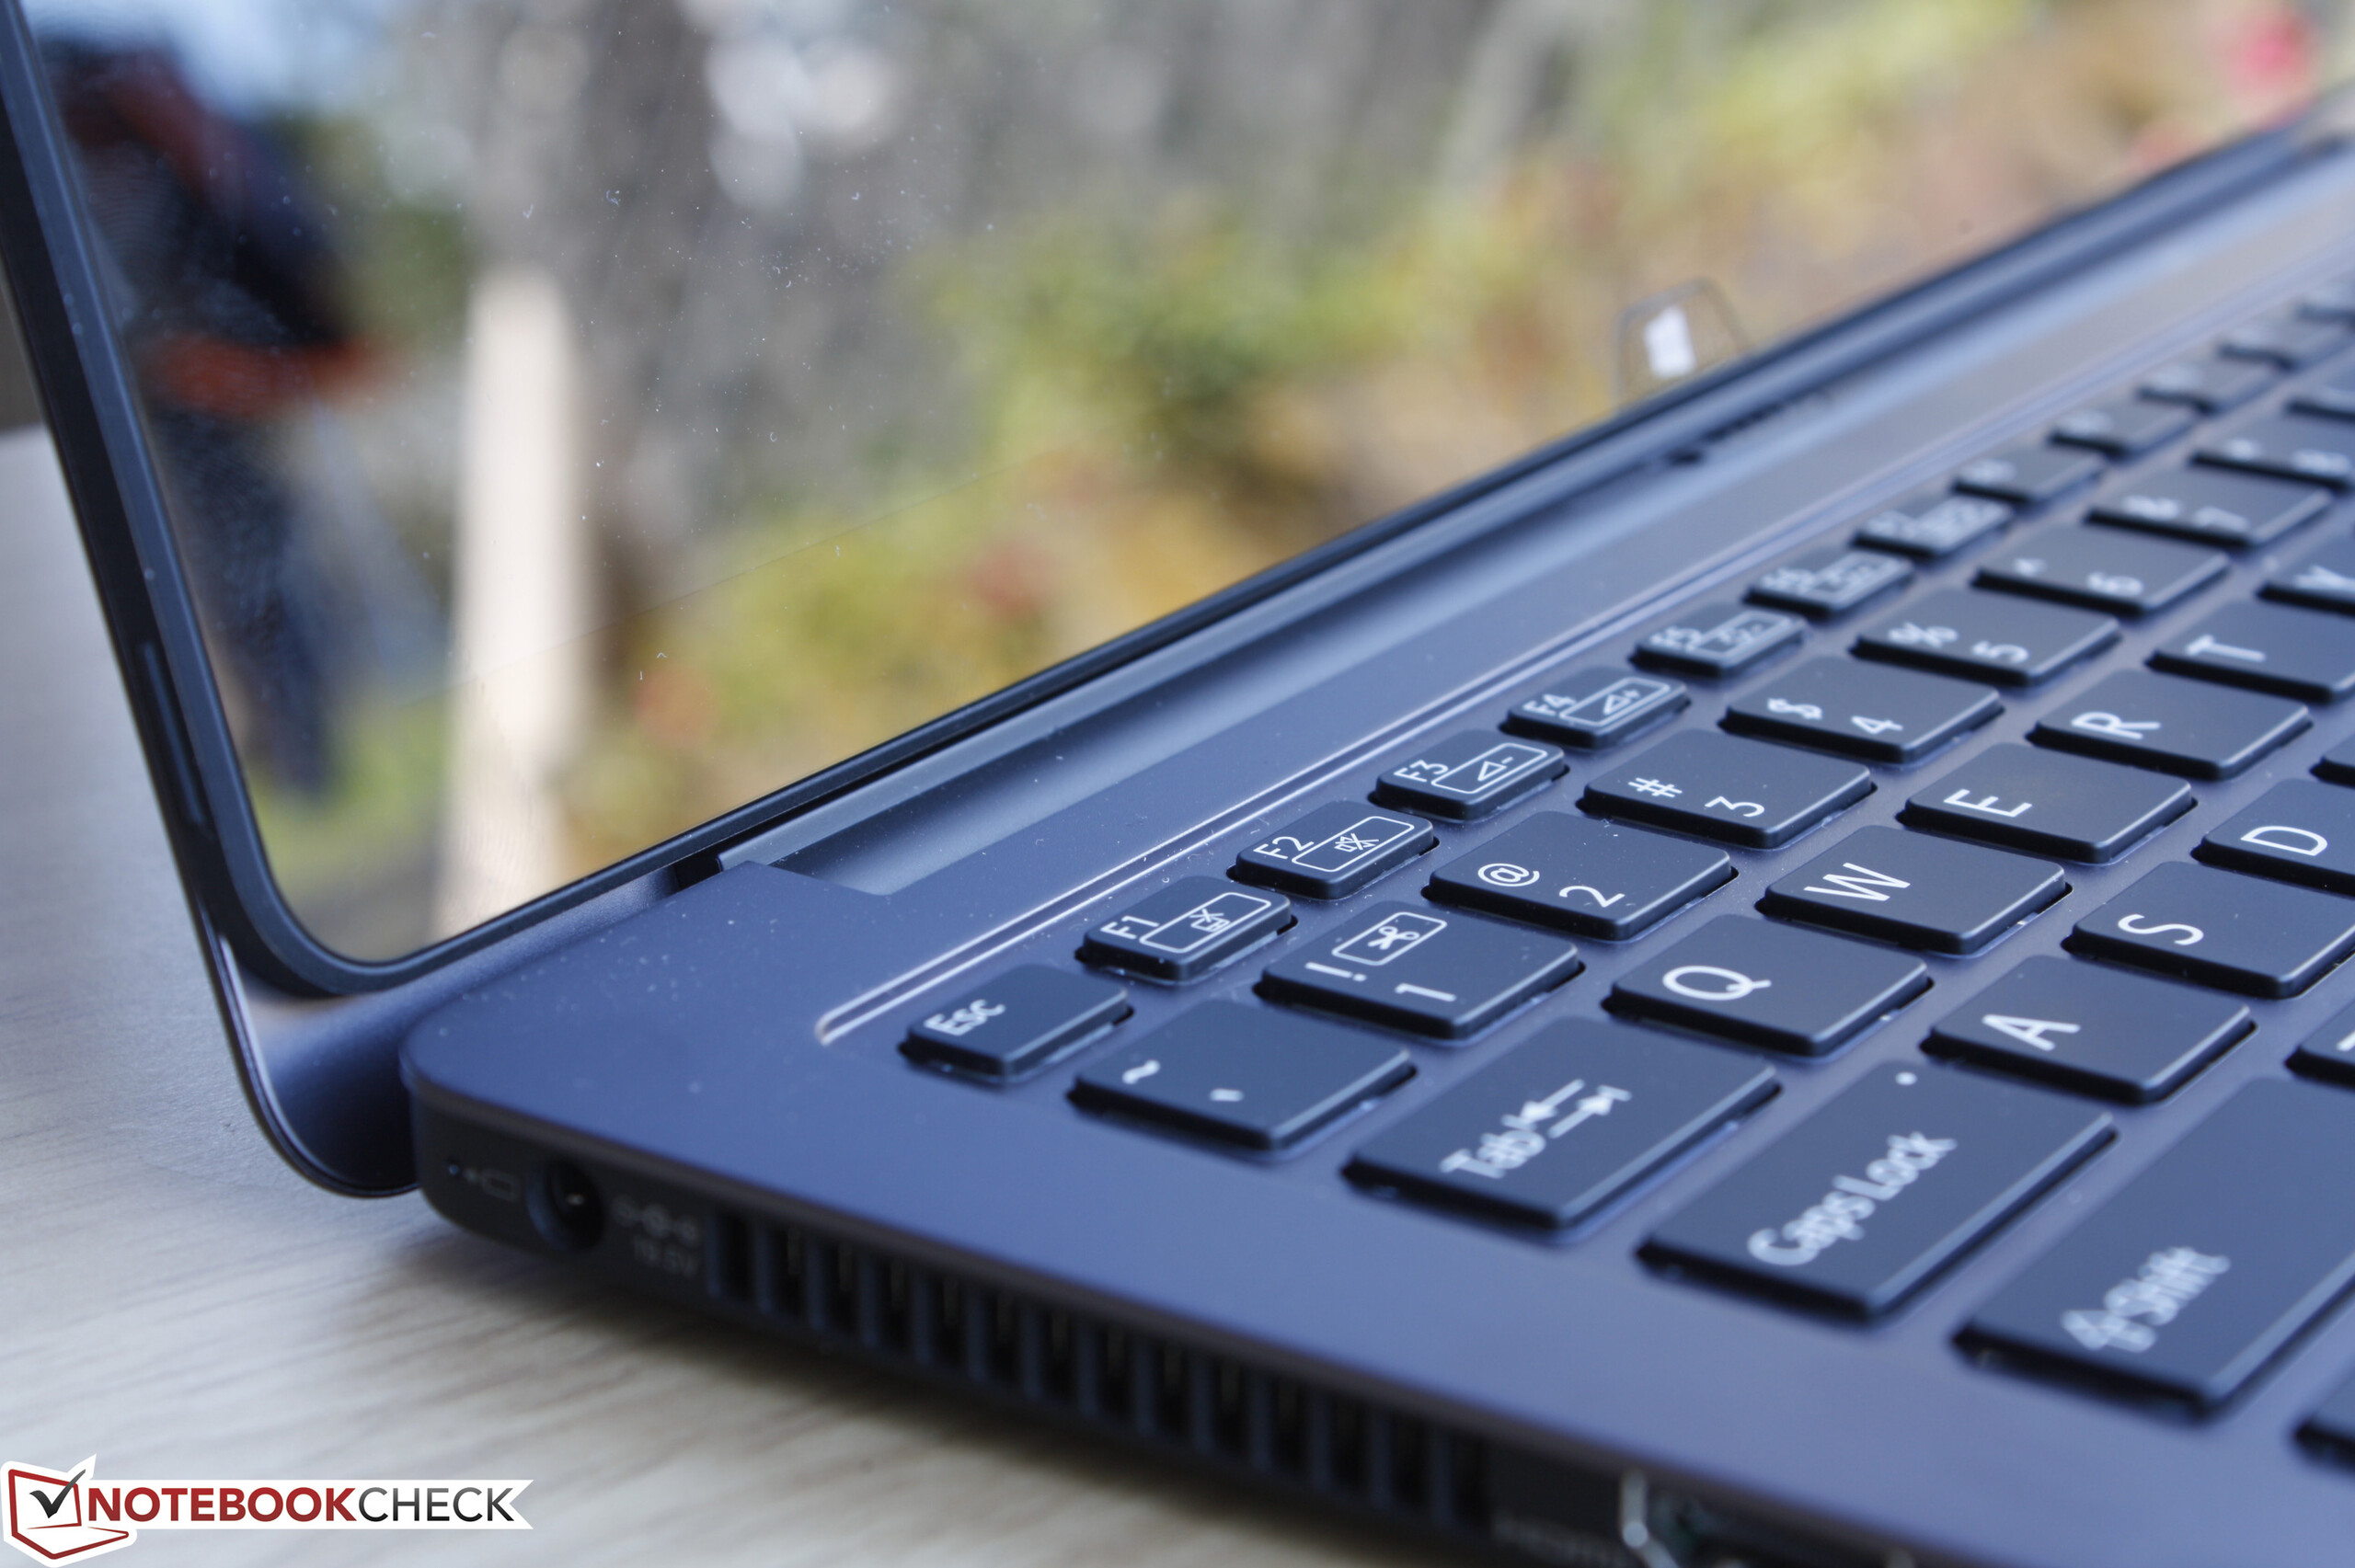
Non ci aspettiamo sempre tutto e questo vale anche con Ultrabooks e convertibili. Indipendentemente Tuttavia, se partite da un prezzo di $1800 per un 13.3", gli utenti inizieranno a volere features in quantità per giustificare il prezzo premium rispetto a convertibili e notebooks che costano quasi la metà. Da questo punto di vista, diventa facile distinguere il Vaio Z Flip in quanto mancano features come USB Type-C, Thunderbolt, NFC, DDR4, WWAN, ed misure di sicurezza aggiuntive. I materiali di classe e l'aspetto non contano molto se alcune aree non sono rigide quanto dovrebbero. Minori critiche riguardano i tasti della tastiera troppo soffici, l'assenza di un alloggio per la penna, e l'assenza di un pulsante per la rotazione in modalità tablet.
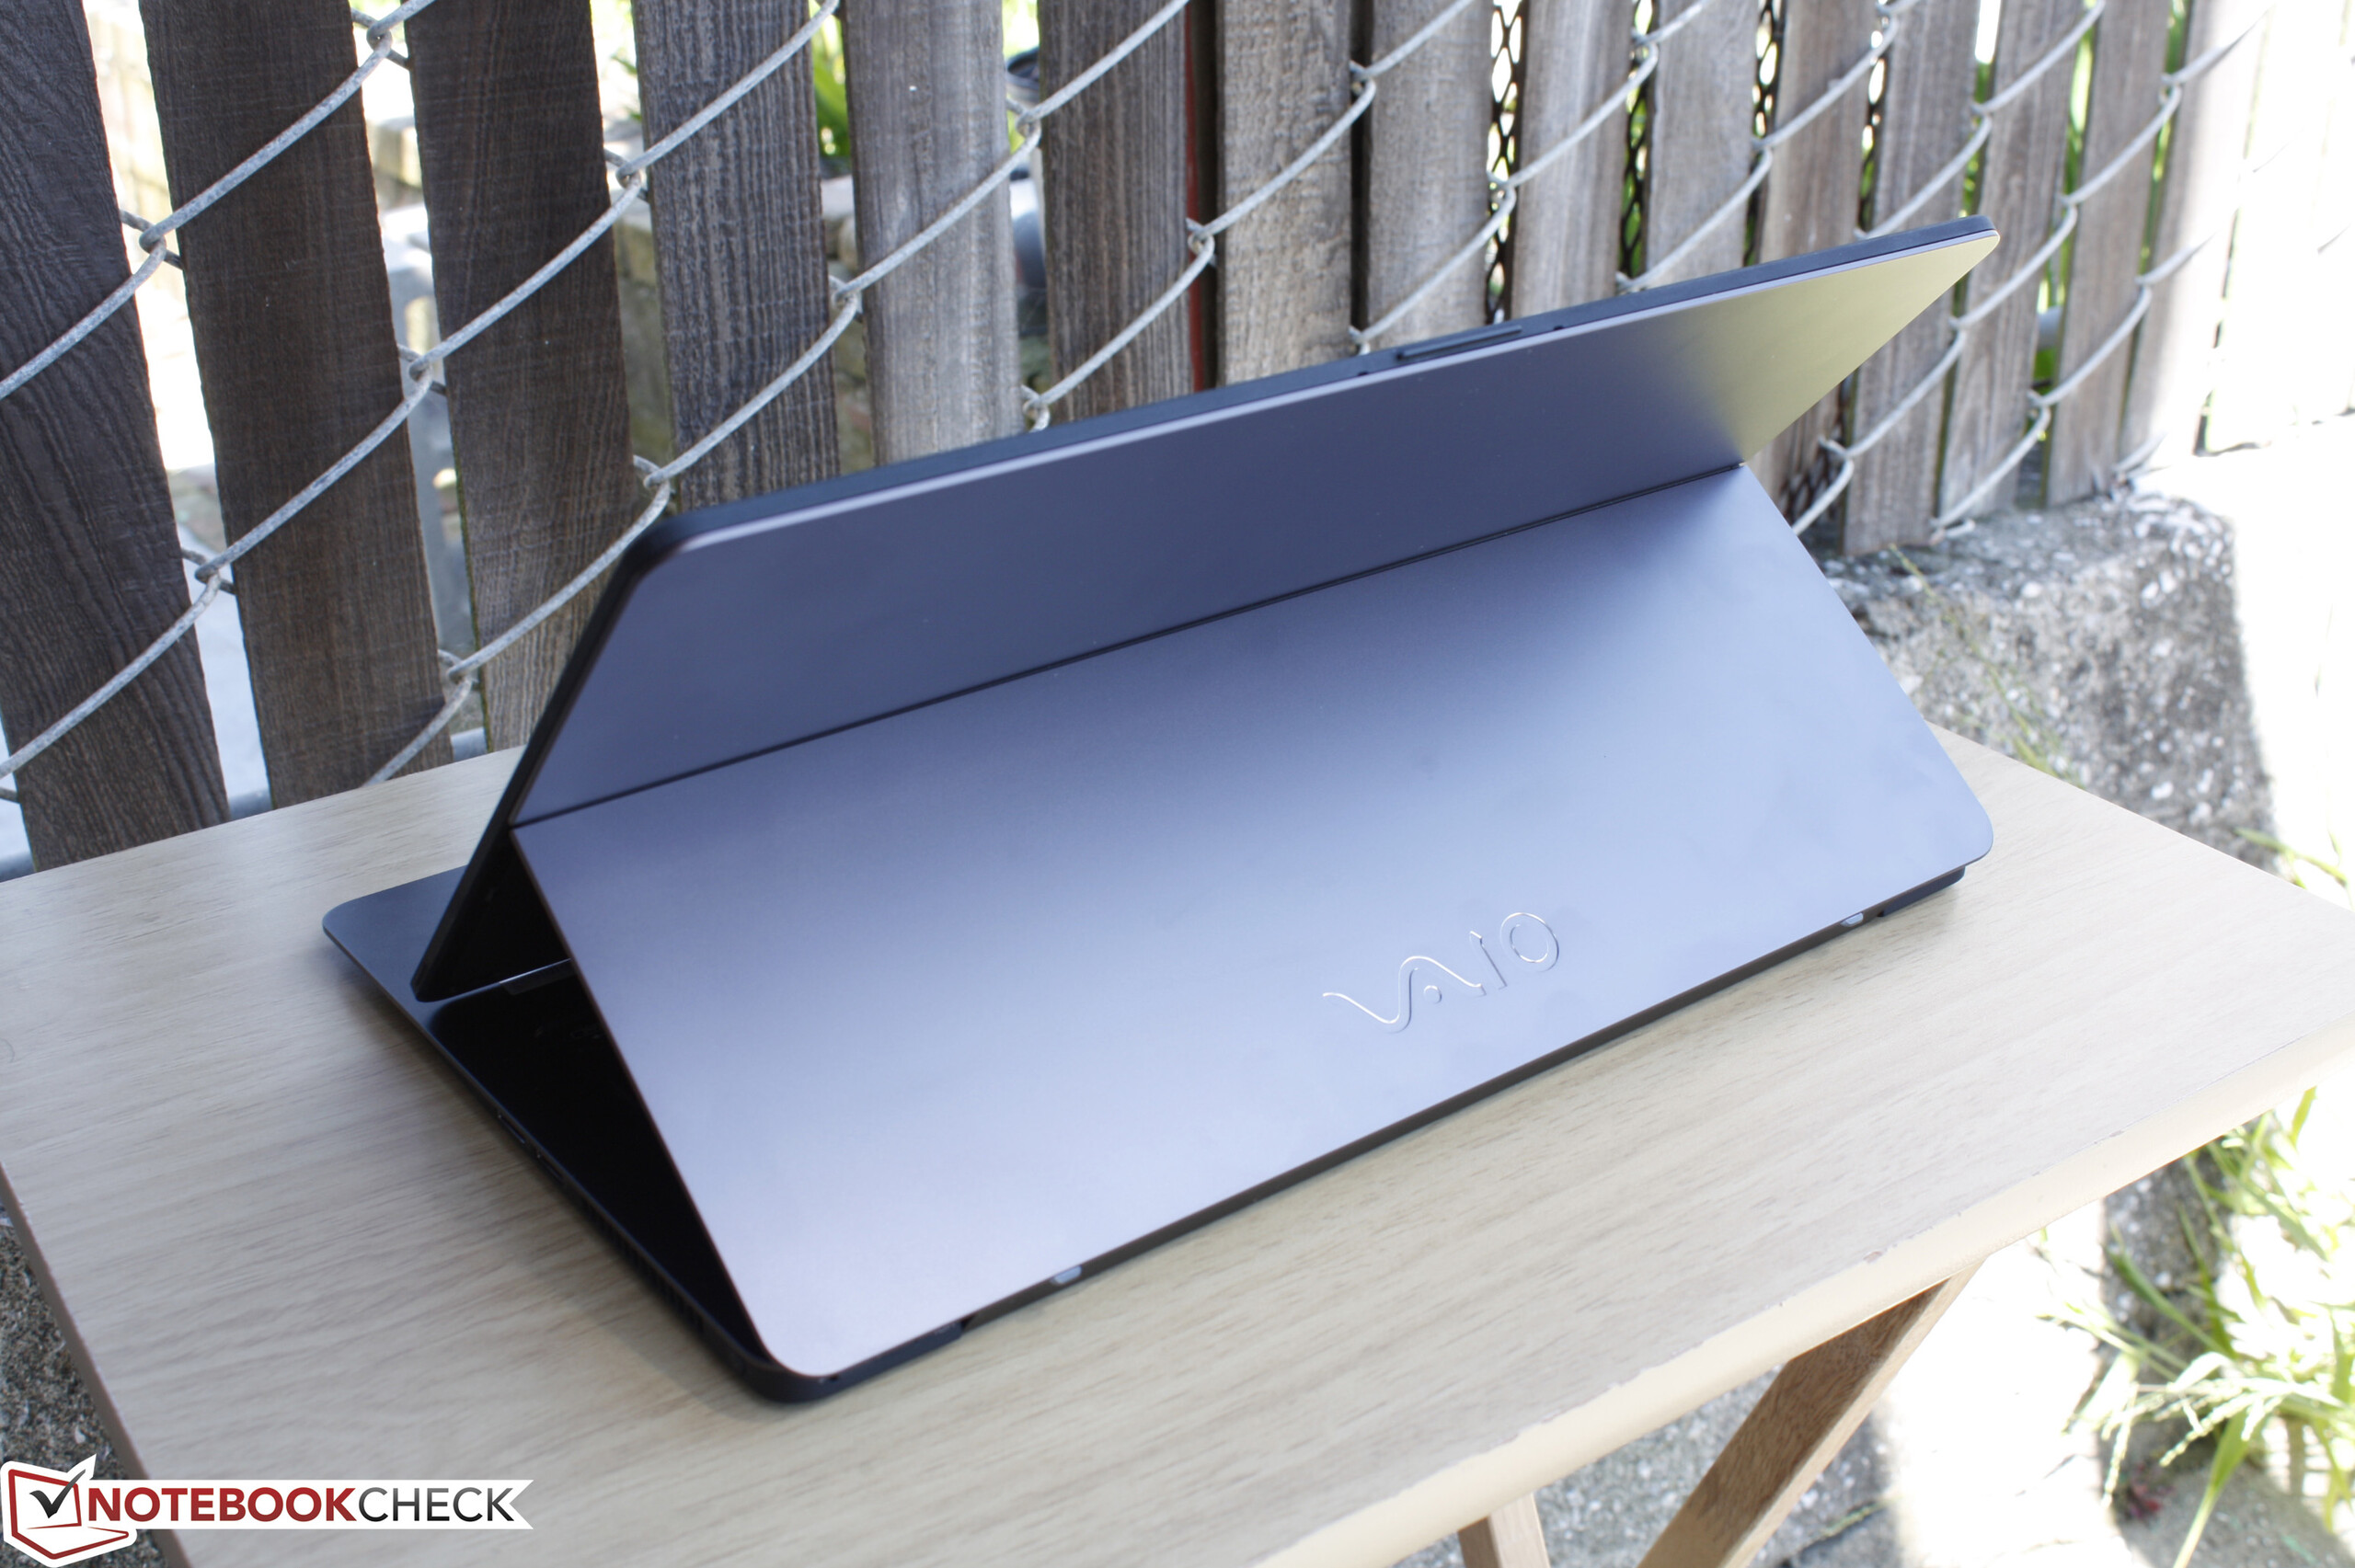
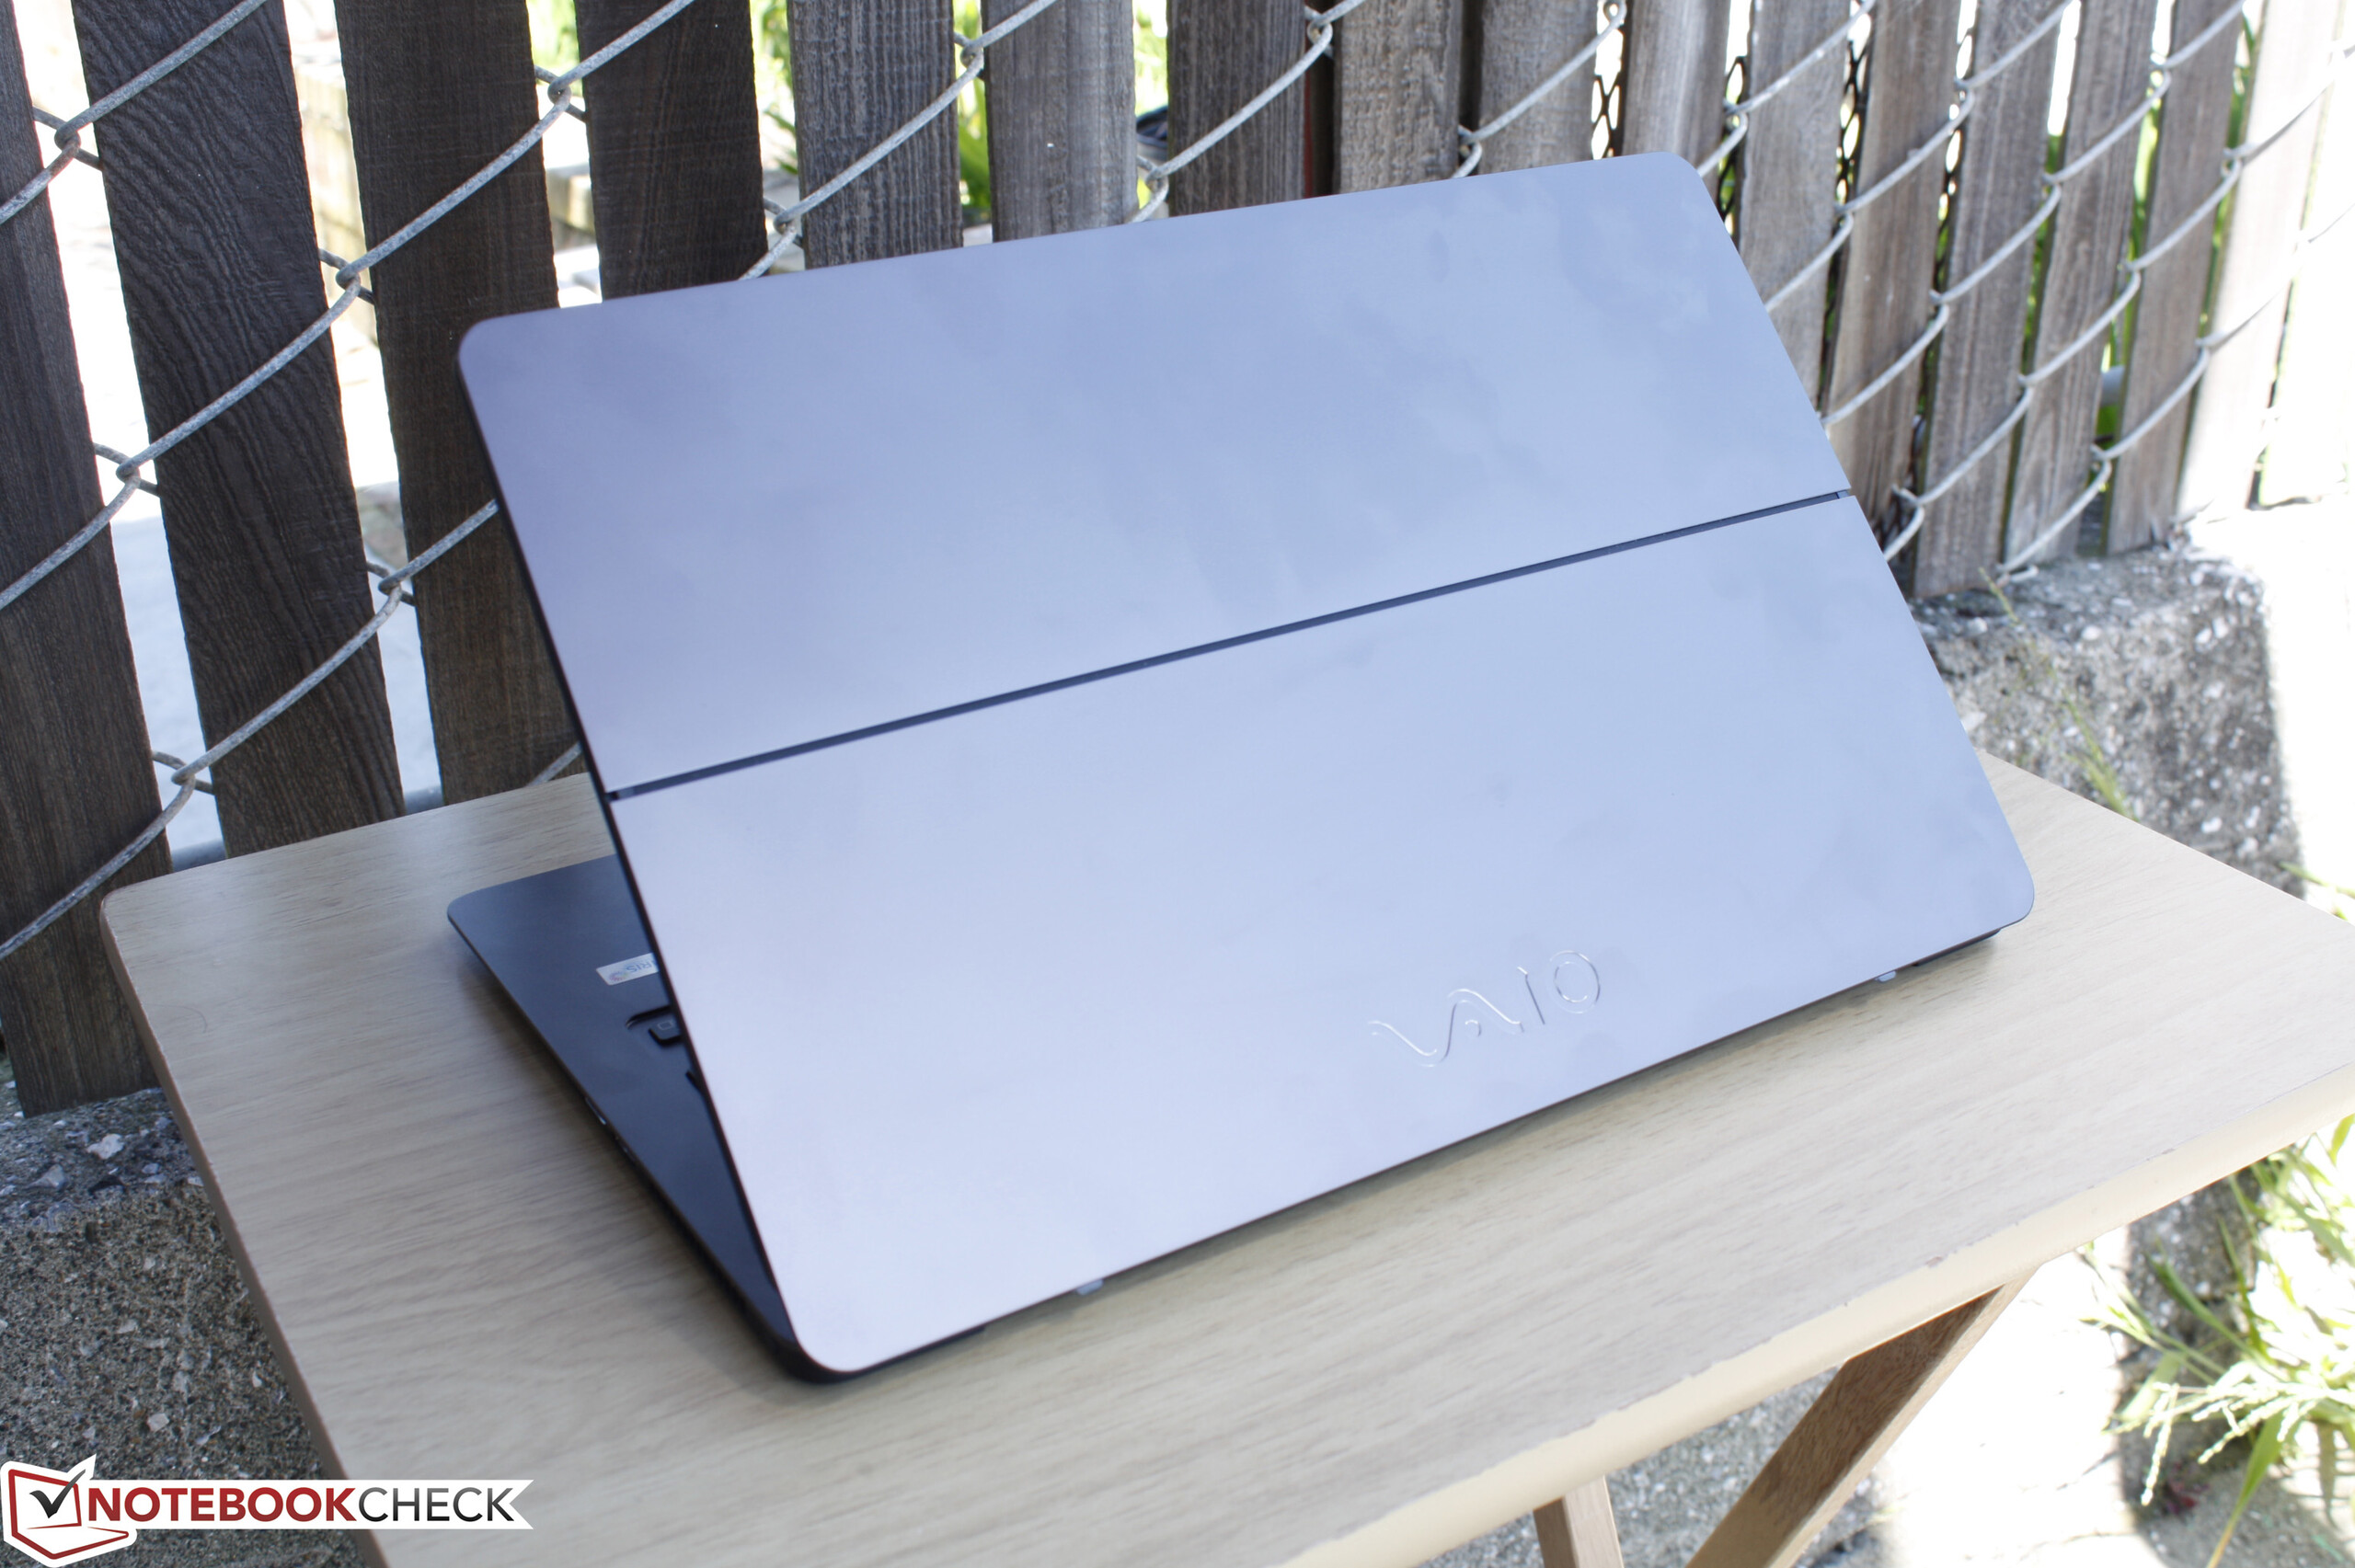
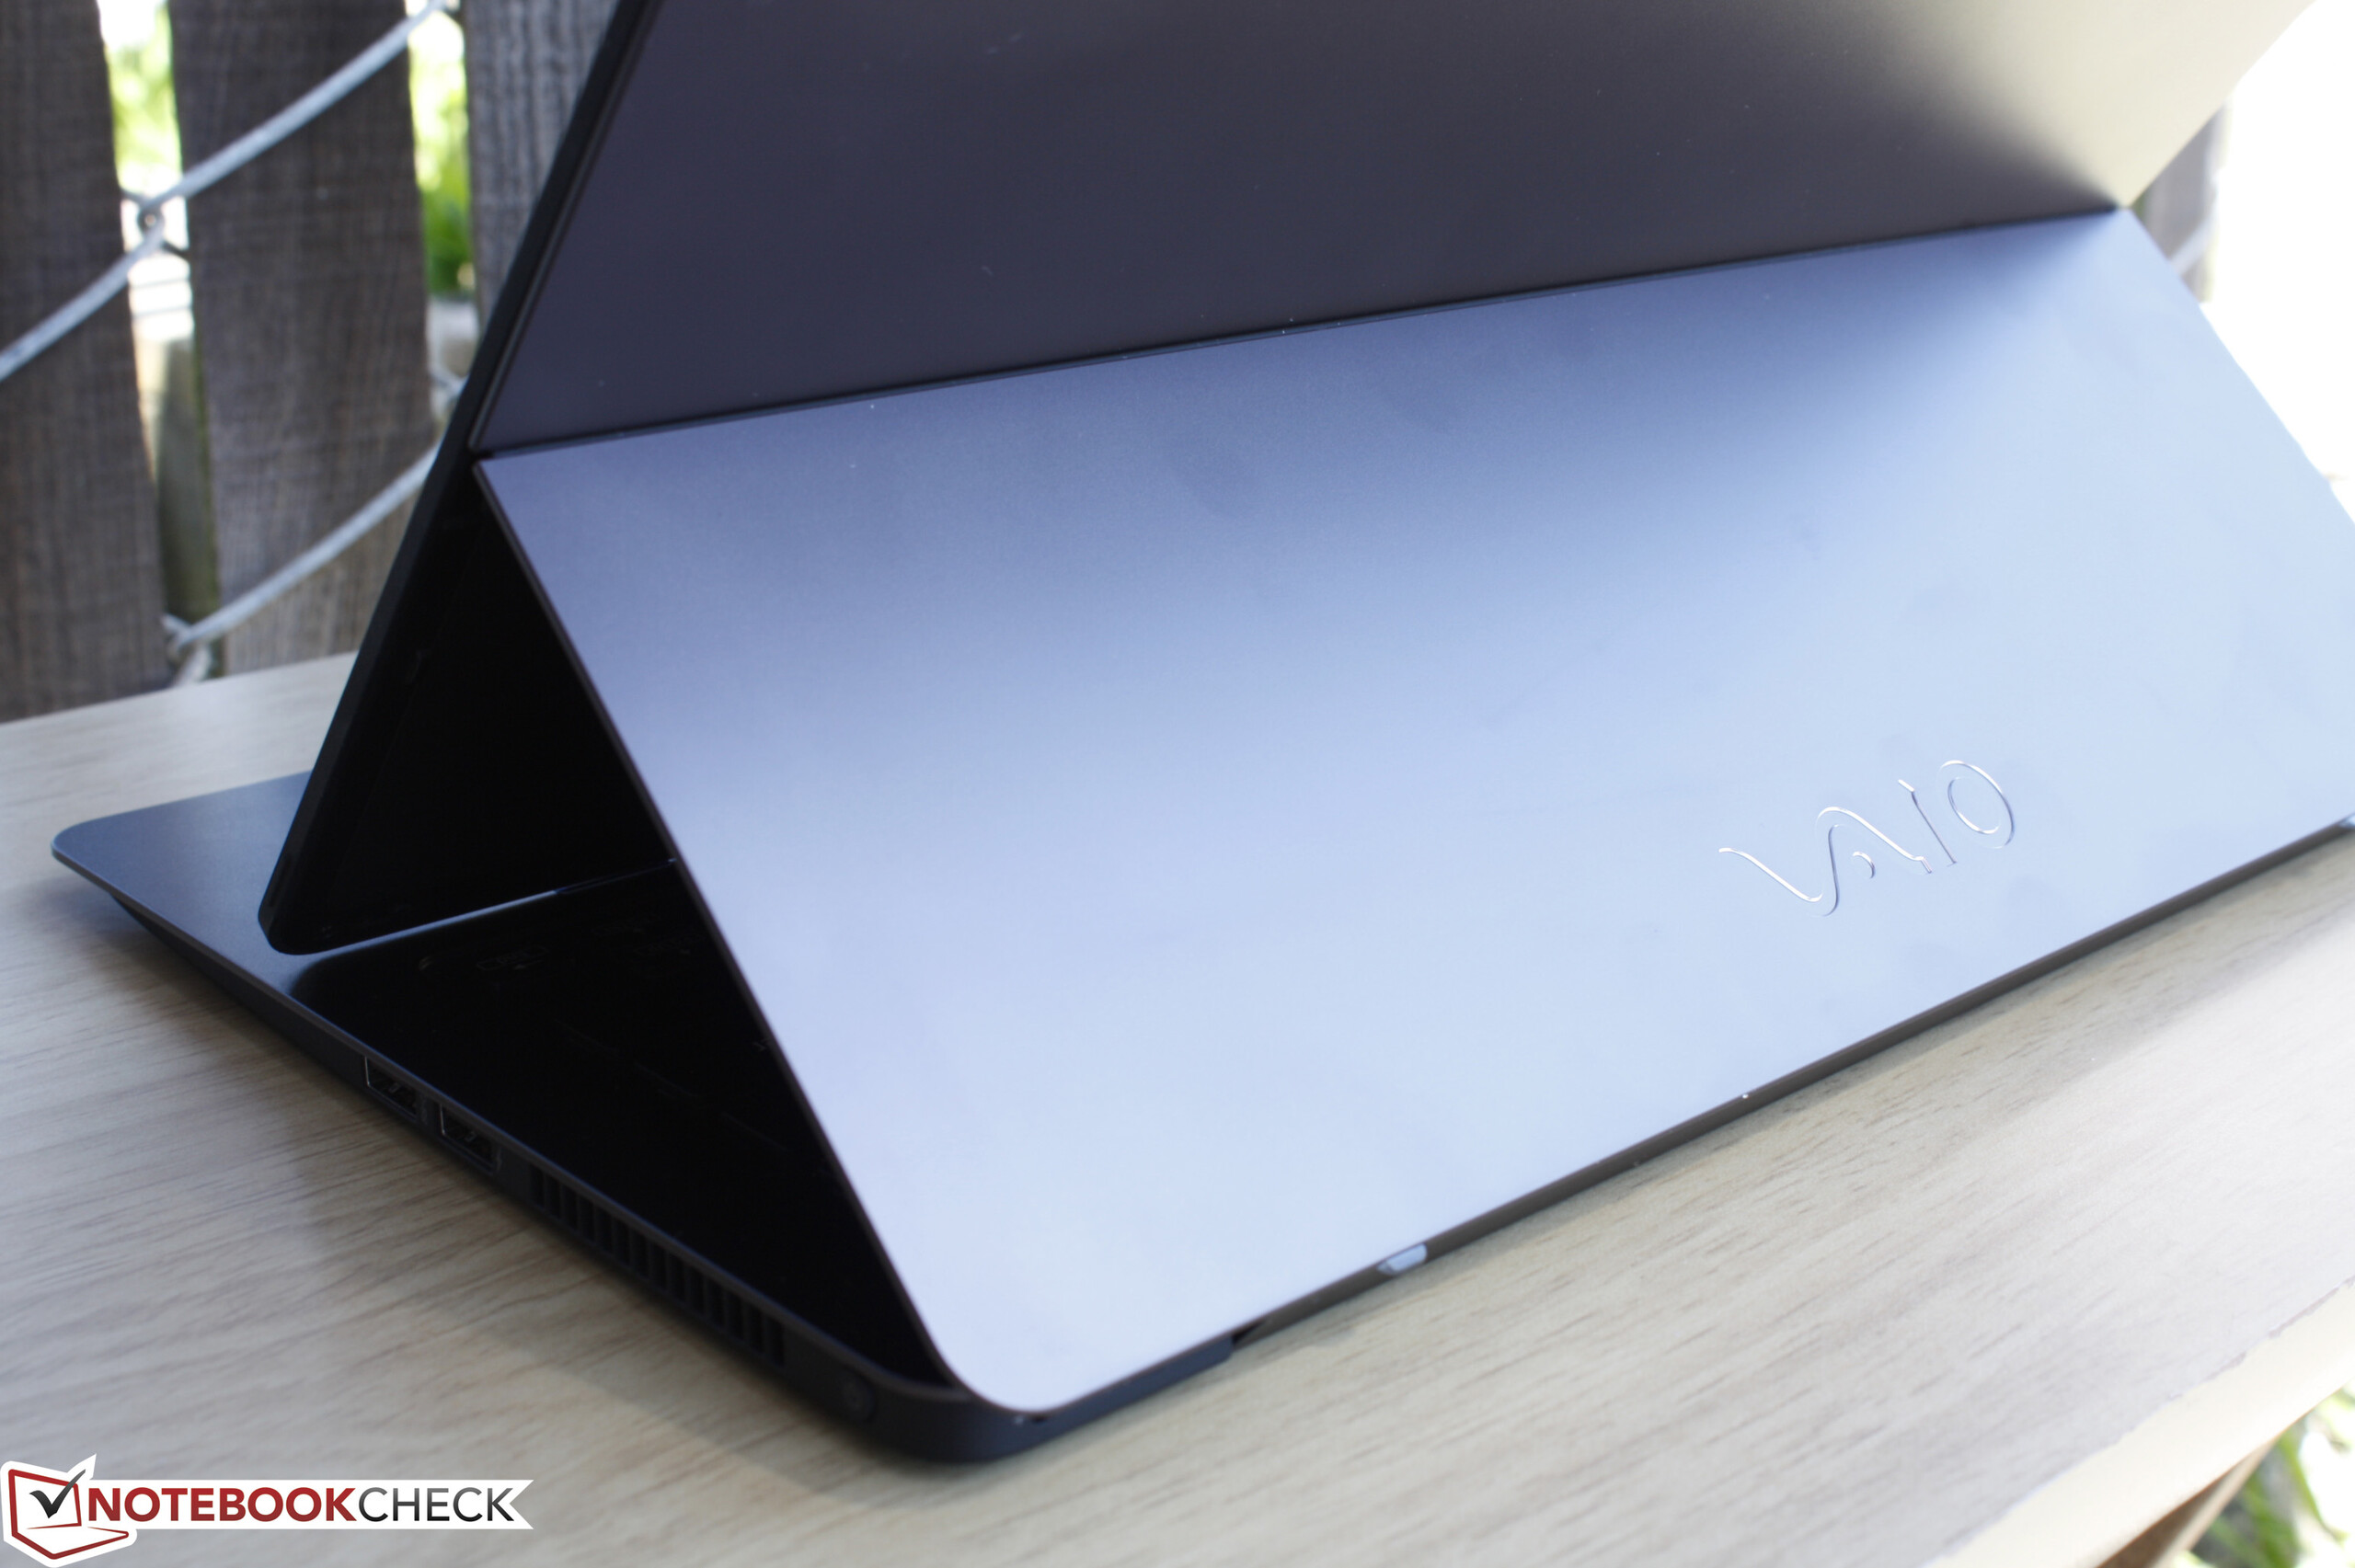
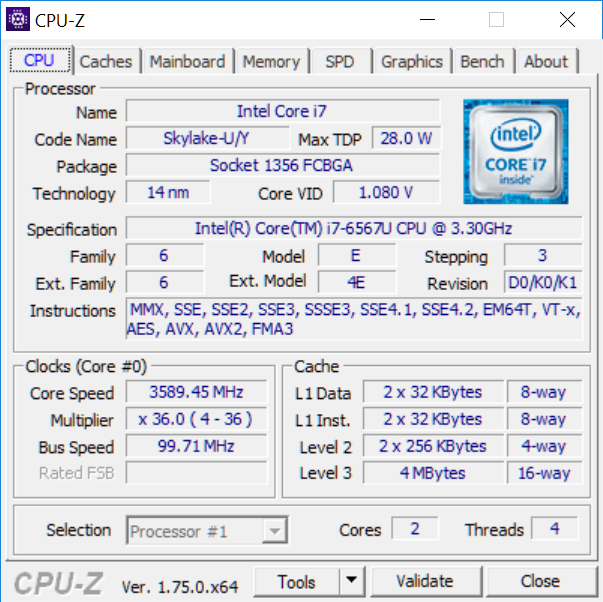
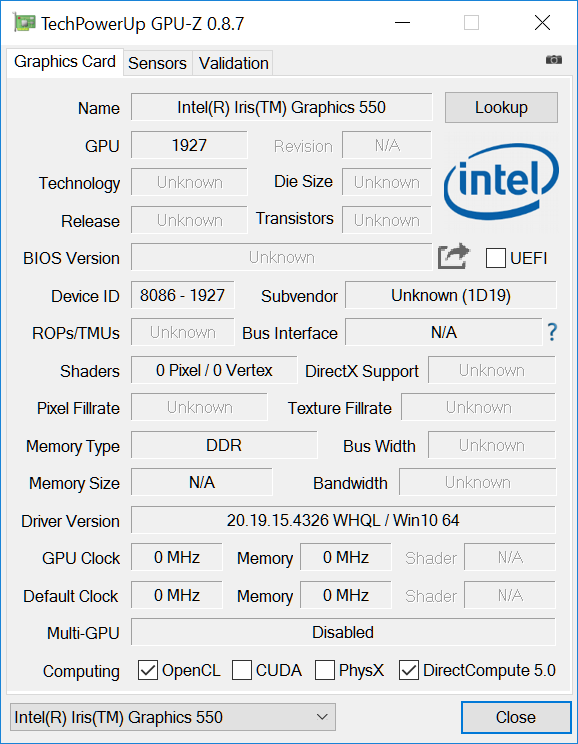
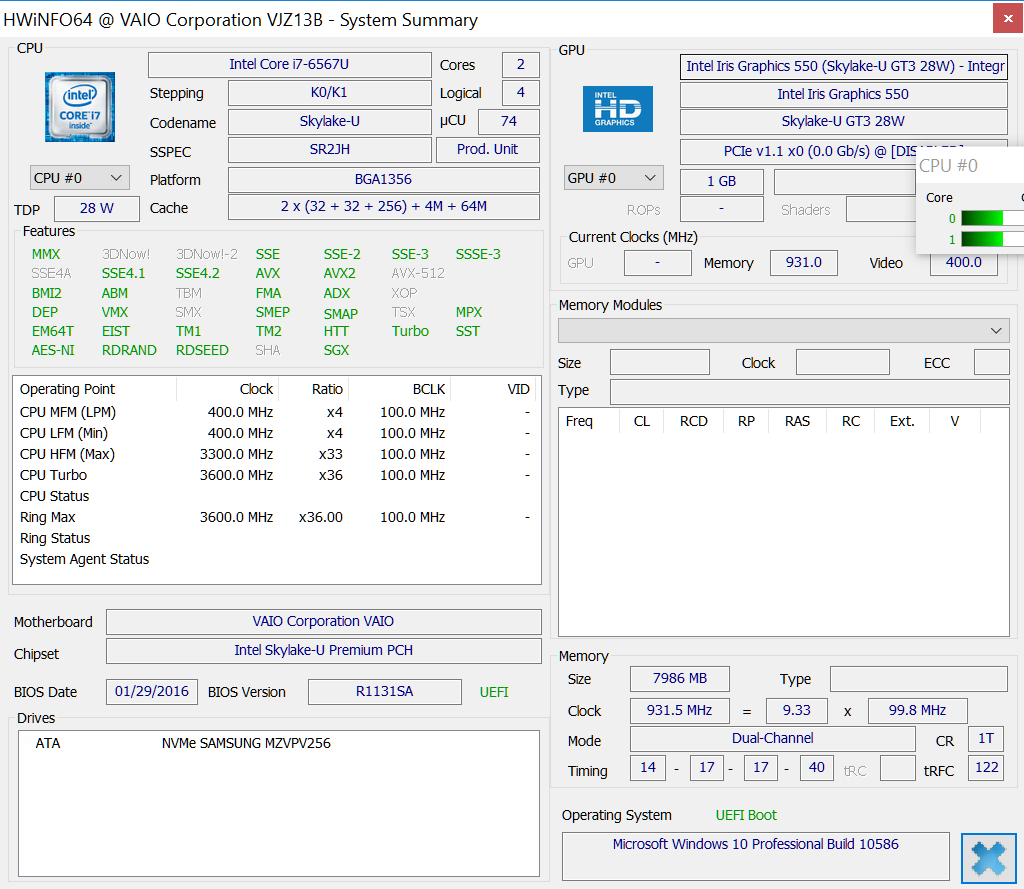
Guardando le passate omissioni il Vaio Z Flip è un convertibile solido e ben progettato che regge il confronto contro la concorrenza. Il luminoso display in particolare è sorprendente in termini di precisione del colore ed è uno dei migliori nella sua classe. Le performance del Core i7-6567U e dalla Iris Graphics 550 integrata sono altrettanto impressionanti in considerazione del basso TDP da 28 W e della ragionevole autonomia, tuttavia le pecche riguardano le temperature core e la rumorosità della ventola rispetto alla maggioranza degli altri convertibles.
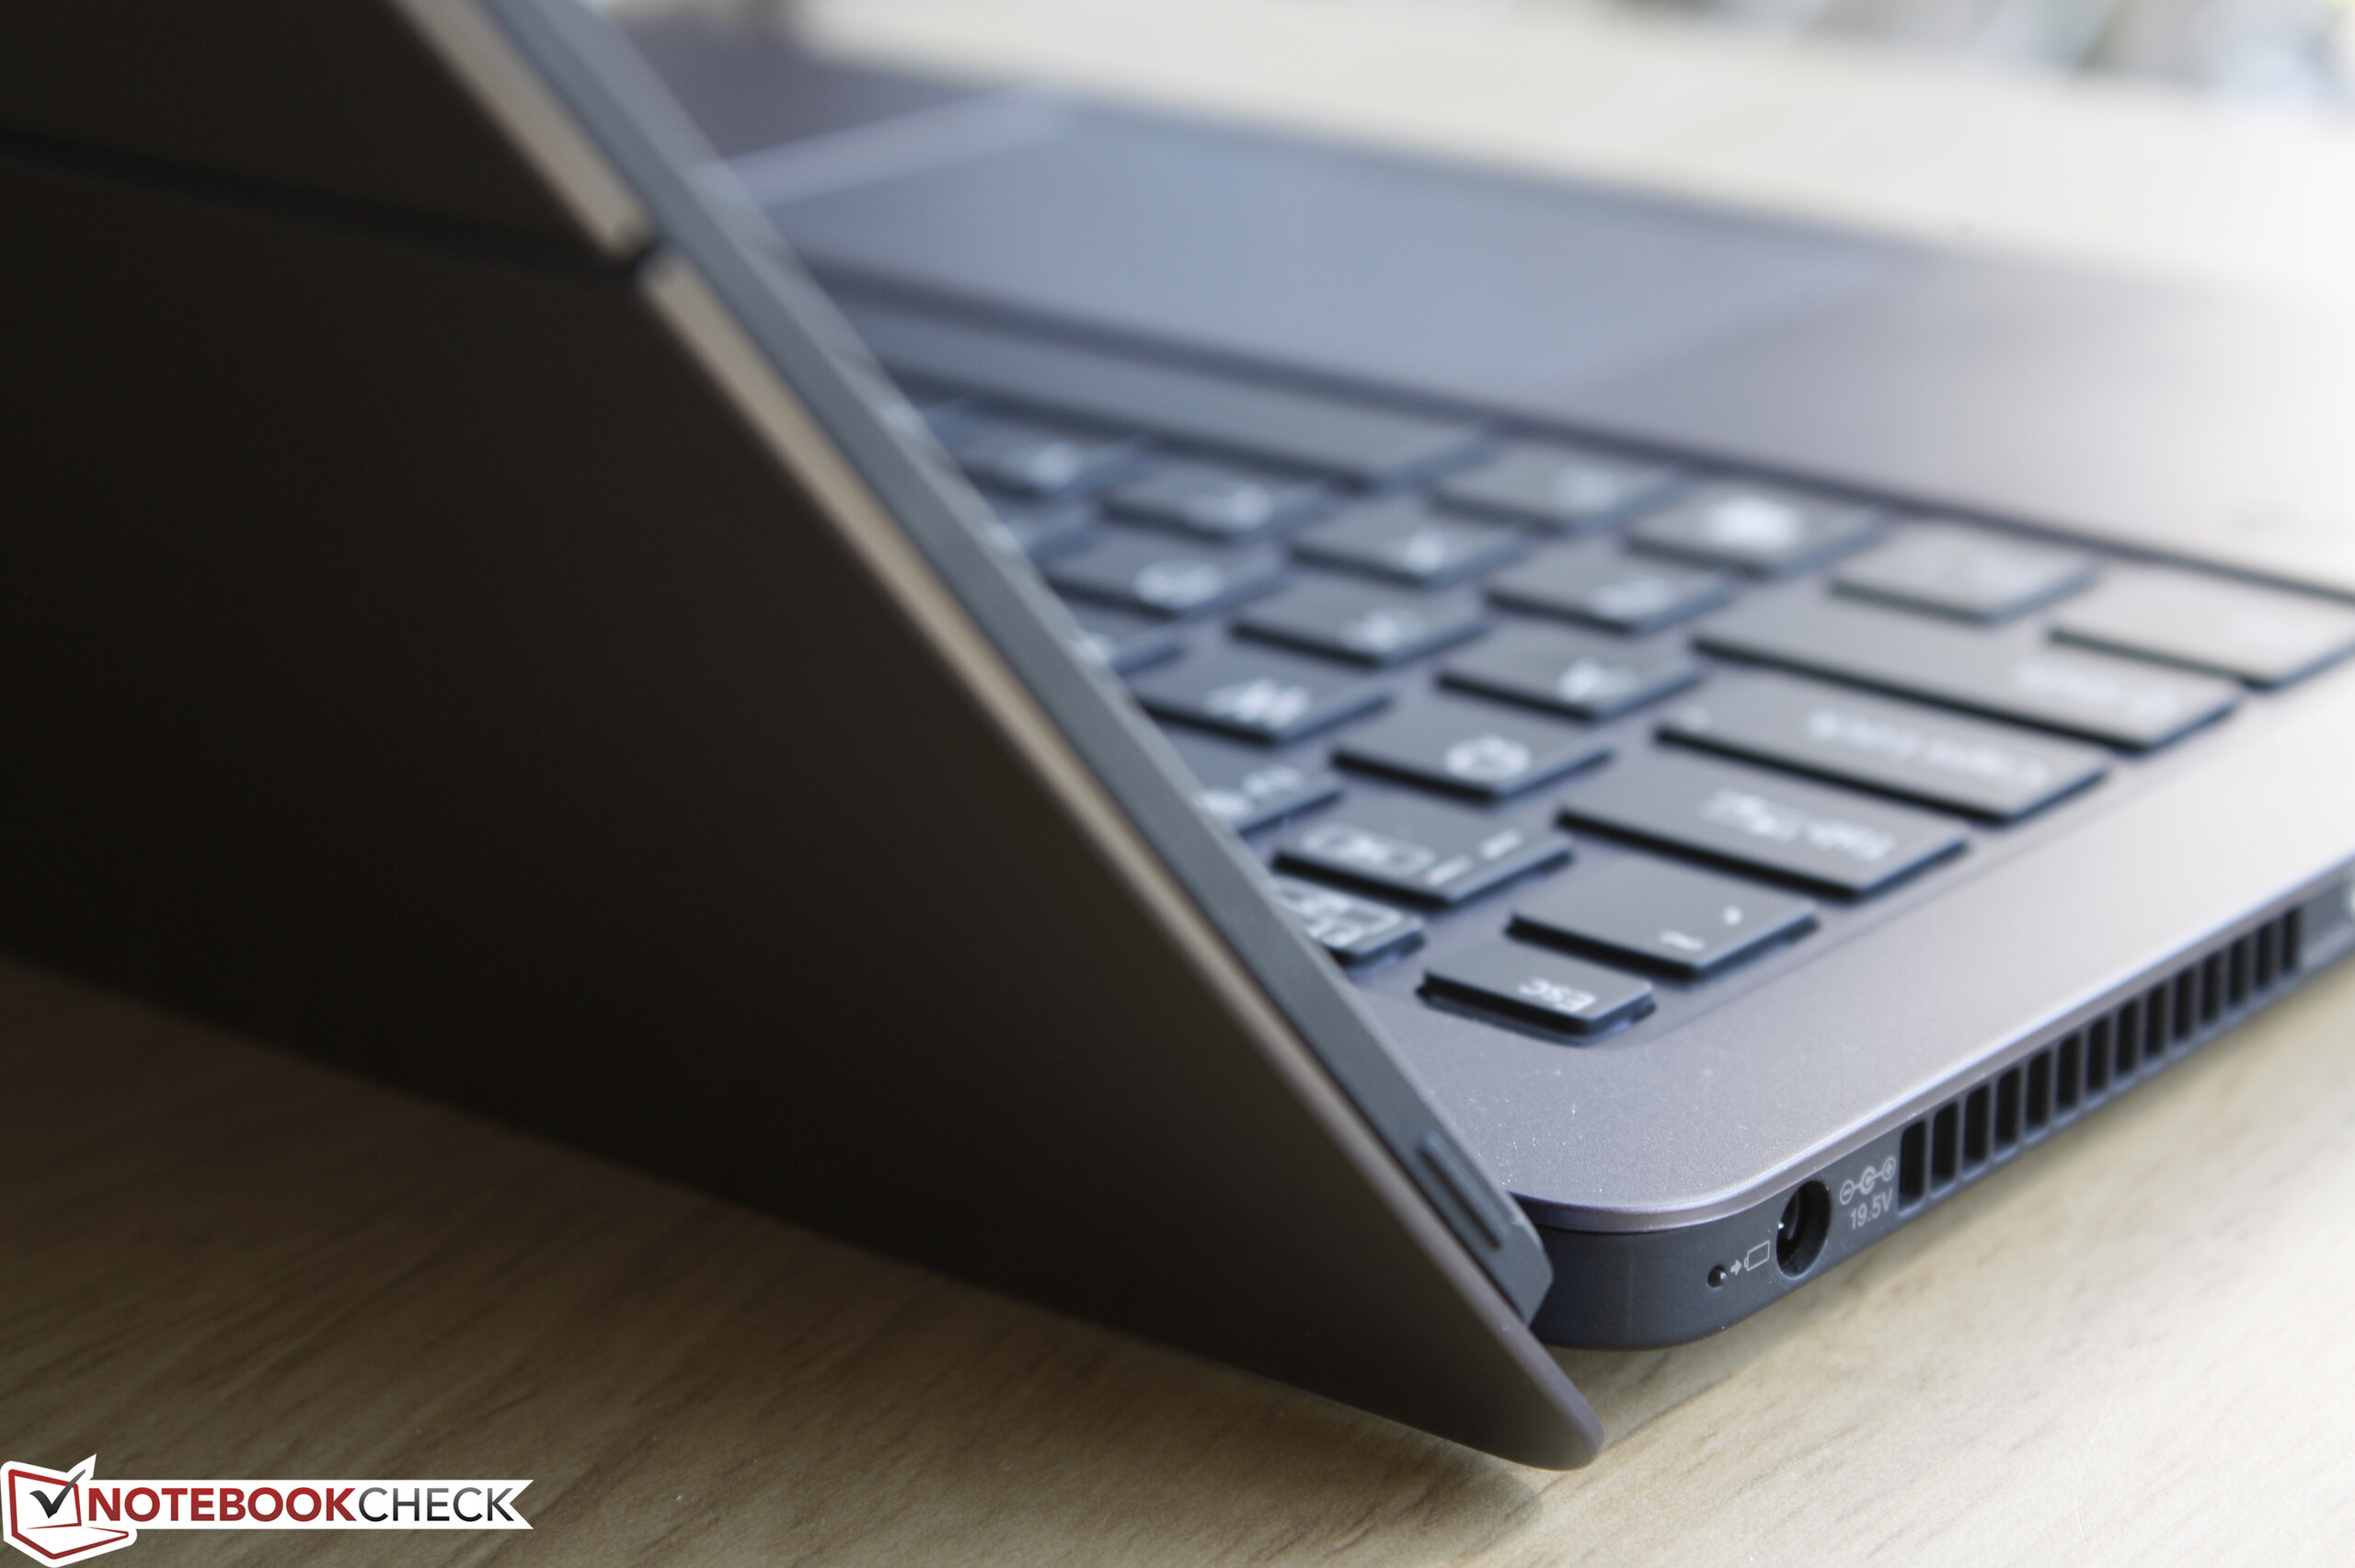
Mentre il Z Flip è potente, unico ed attraente, non offre molto di più rispetto ai concorrenti convertibili di questa fascia di prezzo. Coloro che non hanno problemi economici ameranno le prestazioni, l'autonomia, il display, e l'eleganza dell'ammiraglia Vaio.
Nota: si tratta di una recensione breve, con alcune sezioni non tradotte, per la versione integrale in inglese guardate qui.
Sony Vaio Z Flip
- 04/18/2016 v5.1 (old)
Allen Ngo
Price comparison
