Recensione Breve del Toshiba Portege Z30t-B1320W10
| |||||||||||||||||||||||||
Distribuzione della luminosità: 90 %
Al centro con la batteria: 296.1 cd/m²
Contrasto: 961:1 (Nero: 0.308 cd/m²)
ΔE ColorChecker Calman: 3 | ∀{0.5-29.43 Ø4.73}
ΔE Greyscale Calman: 1.61 | ∀{0.09-98 Ø4.97}
96.57% sRGB (Argyll 1.6.3 3D)
62.37% AdobeRGB 1998 (Argyll 1.6.3 3D)
68.9% AdobeRGB 1998 (Argyll 3D)
96.8% sRGB (Argyll 3D)
67.1% Display P3 (Argyll 3D)
Gamma: 2.18
CCT: 6716 K
| Toshiba Portege Z30t-B1320W10 13.3", 1920x1080 | Lenovo ThinkPad X250-20CLS06D00 12.5", 1920x1080 | Lenovo ThinkPad T450s-20BWS03F00 14", 1920x1080 | HP Elitebook Revolve 810 G3 11.6", 1366x768 | Dell Latitude E7450 14", 1920x1080 | |
|---|---|---|---|---|---|
| Display | -33% | -9% | -30% | -3% | |
| Display P3 Coverage (%) | 67.1 | 44.14 -34% | 64.8 -3% | 46.85 -30% | 66.6 -1% |
| sRGB Coverage (%) | 96.8 | 65.8 -32% | 83.8 -13% | 69.1 -29% | 92.4 -5% |
| AdobeRGB 1998 Coverage (%) | 68.9 | 45.71 -34% | 61.2 -11% | 48.42 -30% | 67.7 -2% |
| Response Times | |||||
| Response Time Grey 50% / Grey 80% * (ms) | 59.2 ? | ||||
| Response Time Black / White * (ms) | 50.4 ? | ||||
| PWM Frequency (Hz) | 215.5 | ||||
| Screen | -22% | -20% | -32% | -18% | |
| Brightness middle (cd/m²) | 296.1 | 397 34% | 272 -8% | 322 9% | 280 -5% |
| Brightness (cd/m²) | 284 | 357 26% | 268 -6% | 312 10% | 257 -10% |
| Brightness Distribution (%) | 90 | 81 -10% | 91 1% | 87 -3% | 75 -17% |
| Black Level * (cd/m²) | 0.308 | 0.44 -43% | 0.245 20% | 0.32 -4% | 0.3 3% |
| Contrast (:1) | 961 | 902 -6% | 1110 16% | 1006 5% | 933 -3% |
| Colorchecker dE 2000 * | 3 | 4.2 -40% | 4.35 -45% | 5.19 -73% | 3.45 -15% |
| Greyscale dE 2000 * | 1.61 | 3.1 -93% | 3.7 -130% | 4.36 -171% | 3.35 -108% |
| Gamma | 2.18 101% | 2.6 85% | 2.68 82% | 2.26 97% | 2.37 93% |
| CCT | 6716 97% | 6246 104% | 6076 107% | 5985 109% | 6940 94% |
| Color Space (Percent of AdobeRGB 1998) (%) | 62.37 | 42 -33% | 54.7 -12% | 44.3 -29% | 60 -4% |
| Color Space (Percent of sRGB) (%) | 96.57 | 65.5 -32% | 83.5 -14% | 92 -5% | |
| Media totale (Programma / Settaggio) | -28% /
-25% | -15% /
-17% | -31% /
-31% | -11% /
-14% |
* ... Meglio usare valori piccoli
Tempi di risposta del Display
| ↔ Tempi di risposta dal Nero al Bianco | ||
|---|---|---|
| 50.4 ms ... aumenta ↗ e diminuisce ↘ combinato | ↗ 11.6 ms Incremento | 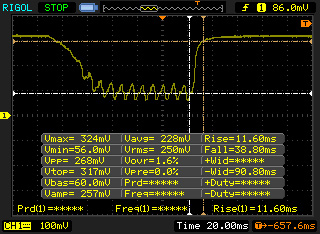 |
| ↘ 38.8 ms Calo | ||
| Lo schermo mostra tempi di risposta lenti nei nostri tests e sarà insoddisfacente per i gamers. In confronto, tutti i dispositivi di test variano da 0.1 (minimo) a 240 (massimo) ms. » 99 % di tutti i dispositivi è migliore. Questo significa che i tempi di risposta rilevati sono peggiori rispetto alla media di tutti i dispositivi testati (19.9 ms). | ||
| ↔ Tempo di risposta dal 50% Grigio all'80% Grigio | ||
| 59.2 ms ... aumenta ↗ e diminuisce ↘ combinato | ↗ 24.4 ms Incremento | 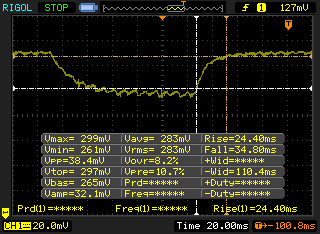 |
| ↘ 34.8 ms Calo | ||
| Lo schermo mostra tempi di risposta lenti nei nostri tests e sarà insoddisfacente per i gamers. In confronto, tutti i dispositivi di test variano da 0.165 (minimo) a 636 (massimo) ms. » 95 % di tutti i dispositivi è migliore. Questo significa che i tempi di risposta rilevati sono peggiori rispetto alla media di tutti i dispositivi testati (31.1 ms). | ||
Sfarfallio dello schermo / PWM (Pulse-Width Modulation)
| flickering dello schermo / PWM rilevato | 215.5 Hz | 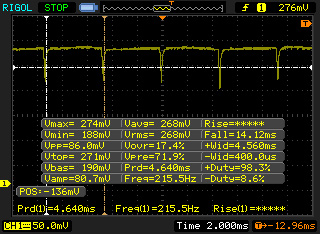 | |
Il display sfarfalla a 215.5 Hz (Probabilmente a causa dell'uso di PWM) . La frequenza di 215.5 Hz è relativamente bassa, quindi gli utenti sensibili potrebbero notare il flickering ed accusare stanchezza agli occhi a questo livello di luminosità e a livelli inferiori. In confronto: 52 % di tutti i dispositivi testati non utilizza PWM per ridurre la luminosita' del display. Se è rilevato PWM, una media di 7801 (minimo: 5 - massimo: 343500) Hz è stata rilevata. | |||
| Cinebench R10 | |
| Rendering Single CPUs 64Bit (ordina per valore) | |
| Toshiba Portege Z30t-B1320W10 | |
| Lenovo ThinkPad X250-20CLS06D00 | |
| Lenovo ThinkPad T450s-20BWS03F00 | |
| Dell Latitude E7450 | |
| Rendering Multiple CPUs 64Bit (ordina per valore) | |
| Toshiba Portege Z30t-B1320W10 | |
| Lenovo ThinkPad X250-20CLS06D00 | |
| Lenovo ThinkPad T450s-20BWS03F00 | |
| Dell Latitude E7450 | |
| PCMark 7 - Score (ordina per valore) | |
| Toshiba Portege Z30t-B1320W10 | |
| Lenovo ThinkPad X250-20CLS06D00 | |
| Lenovo ThinkPad T450s-20BWS03F00 | |
| HP Elitebook Revolve 810 G3 | |
| Dell Latitude E7450 | |
| PCMark 7 Score | 4966 punti | |
| PCMark 8 Home Score Accelerated v2 | 3062 punti | |
| PCMark 8 Creative Score Accelerated v2 | 3716 punti | |
| PCMark 8 Work Score Accelerated v2 | 4330 punti | |
Aiuto | ||

| 3DMark 06 Standard Score | 6548 punti | |
| 3DMark 11 Performance | 1220 punti | |
| 3DMark Ice Storm Standard Score | 45426 punti | |
| 3DMark Cloud Gate Standard Score | 5008 punti | |
| 3DMark Fire Strike Score | 644 punti | |
| 3DMark Fire Strike Extreme Score | 291 punti | |
Aiuto | ||
| 3DMark 11 - 1280x720 Performance (ordina per valore) | |
| Toshiba Portege Z30t-B1320W10 | |
| Lenovo ThinkPad X250-20CLS06D00 | |
| Lenovo ThinkPad T450s-20BWS03F00 | |
| HP Elitebook Revolve 810 G3 | |
| Dell Latitude E7450 | |
| basso | medio | alto | ultra | |
|---|---|---|---|---|
| BioShock Infinite (2013) | 33.74 | 19.5 | 15.81 | 8.98 |
| Toshiba Portege Z30t-B1320W10 HD Graphics 5500, 5600U, Toshiba THNSNJ256GMCU | Lenovo ThinkPad X250-20CLS06D00 HD Graphics 5500, 5600U, Intel SSD Pro 2500 Series SSDSC2BF360A5L | Lenovo ThinkPad T450s-20BWS03F00 HD Graphics 5500, 5600U, Intel SSD Pro 2500 Series SSDSC2BF360A5L | HP Elitebook Revolve 810 G3 HD Graphics 5500, 5600U, Samsung SSD PM851 256 GB MZNTE256HMHP | Dell Latitude E7450 HD Graphics 5500, 5300U, Samsung SSD PM851 mSATA 128 GB | |
|---|---|---|---|---|---|
| Noise | 6% | 6% | 4% | 2% | |
| Idle Minimum * (dB) | 30.2 | 29 4% | 29.1 4% | 29.1 4% | 29.1 4% |
| Idle Average * (dB) | 30.3 | 29 4% | 29.1 4% | 29.1 4% | 29.1 4% |
| Idle Maximum * (dB) | 32.2 | 30.3 6% | 29.1 10% | 29.1 10% | 30 7% |
| Load Average * (dB) | 35.6 | 33.4 6% | 34.3 4% | 35.6 -0% | 36.4 -2% |
| Load Maximum * (dB) | 37.6 | 33.7 10% | 34.8 7% | 37.2 1% | 37.8 -1% |
* ... Meglio usare valori piccoli
Rumorosità
| Idle |
| 30.2 / 30.3 / 32.2 dB(A) |
| Sotto carico |
| 35.6 / 37.6 dB(A) |
 | ||
30 dB silenzioso 40 dB(A) udibile 50 dB(A) rumoroso |
||
min: | ||
(+) La temperatura massima sul lato superiore è di 34.4 °C / 94 F, rispetto alla media di 35.9 °C / 97 F, che varia da 21.4 a 59 °C per questa classe Subnotebook.
(+) Il lato inferiore si riscalda fino ad un massimo di 31.8 °C / 89 F, rispetto alla media di 39.2 °C / 103 F
(+) In idle, la temperatura media del lato superiore è di 22.4 °C / 72 F, rispetto alla media deld ispositivo di 30.8 °C / 87 F.
(+) I poggiapolsi e il touchpad sono piu' freddi della temperatura della pelle con un massimo di 22.6 °C / 72.7 F e sono quindi freddi al tatto.
(+) La temperatura media della zona del palmo della mano di dispositivi simili e'stata di 28.2 °C / 82.8 F (+5.6 °C / 10.1 F).
| Toshiba Portege Z30t-B1320W10 HD Graphics 5500, 5600U, Toshiba THNSNJ256GMCU | Lenovo ThinkPad X250-20CLS06D00 HD Graphics 5500, 5600U, Intel SSD Pro 2500 Series SSDSC2BF360A5L | Lenovo ThinkPad T450s-20BWS03F00 HD Graphics 5500, 5600U, Intel SSD Pro 2500 Series SSDSC2BF360A5L | HP Elitebook Revolve 810 G3 HD Graphics 5500, 5600U, Samsung SSD PM851 256 GB MZNTE256HMHP | Dell Latitude E7450 HD Graphics 5500, 5300U, Samsung SSD PM851 mSATA 128 GB | Dell XPS 13-9350 HD Graphics 520, 6200U, Samsung PM951 NVMe MZ-VLV256D | |
|---|---|---|---|---|---|---|
| Autonomia della batteria | -33% | -35% | -3% | -19% | -5% | |
| Reader / Idle (h) | 20.7 | 13 -37% | 12.9 -38% | 18.4 -11% | 11.9 -43% | 13 -37% |
| WiFi v1.3 (h) | 7.8 | 5 -36% | 4.6 -41% | 8.3 6% | 7 -10% | 7.5 -4% |
| Load (h) | 2 | 1.5 -25% | 1.5 -25% | 1.9 -5% | 1.9 -5% | 2.5 25% |
| H.264 (h) | 5.7 | 5.4 | 7.1 | 7.5 | ||
| WiFi (h) | 5.4 | 5.6 | 7.7 |
Pro
Contro
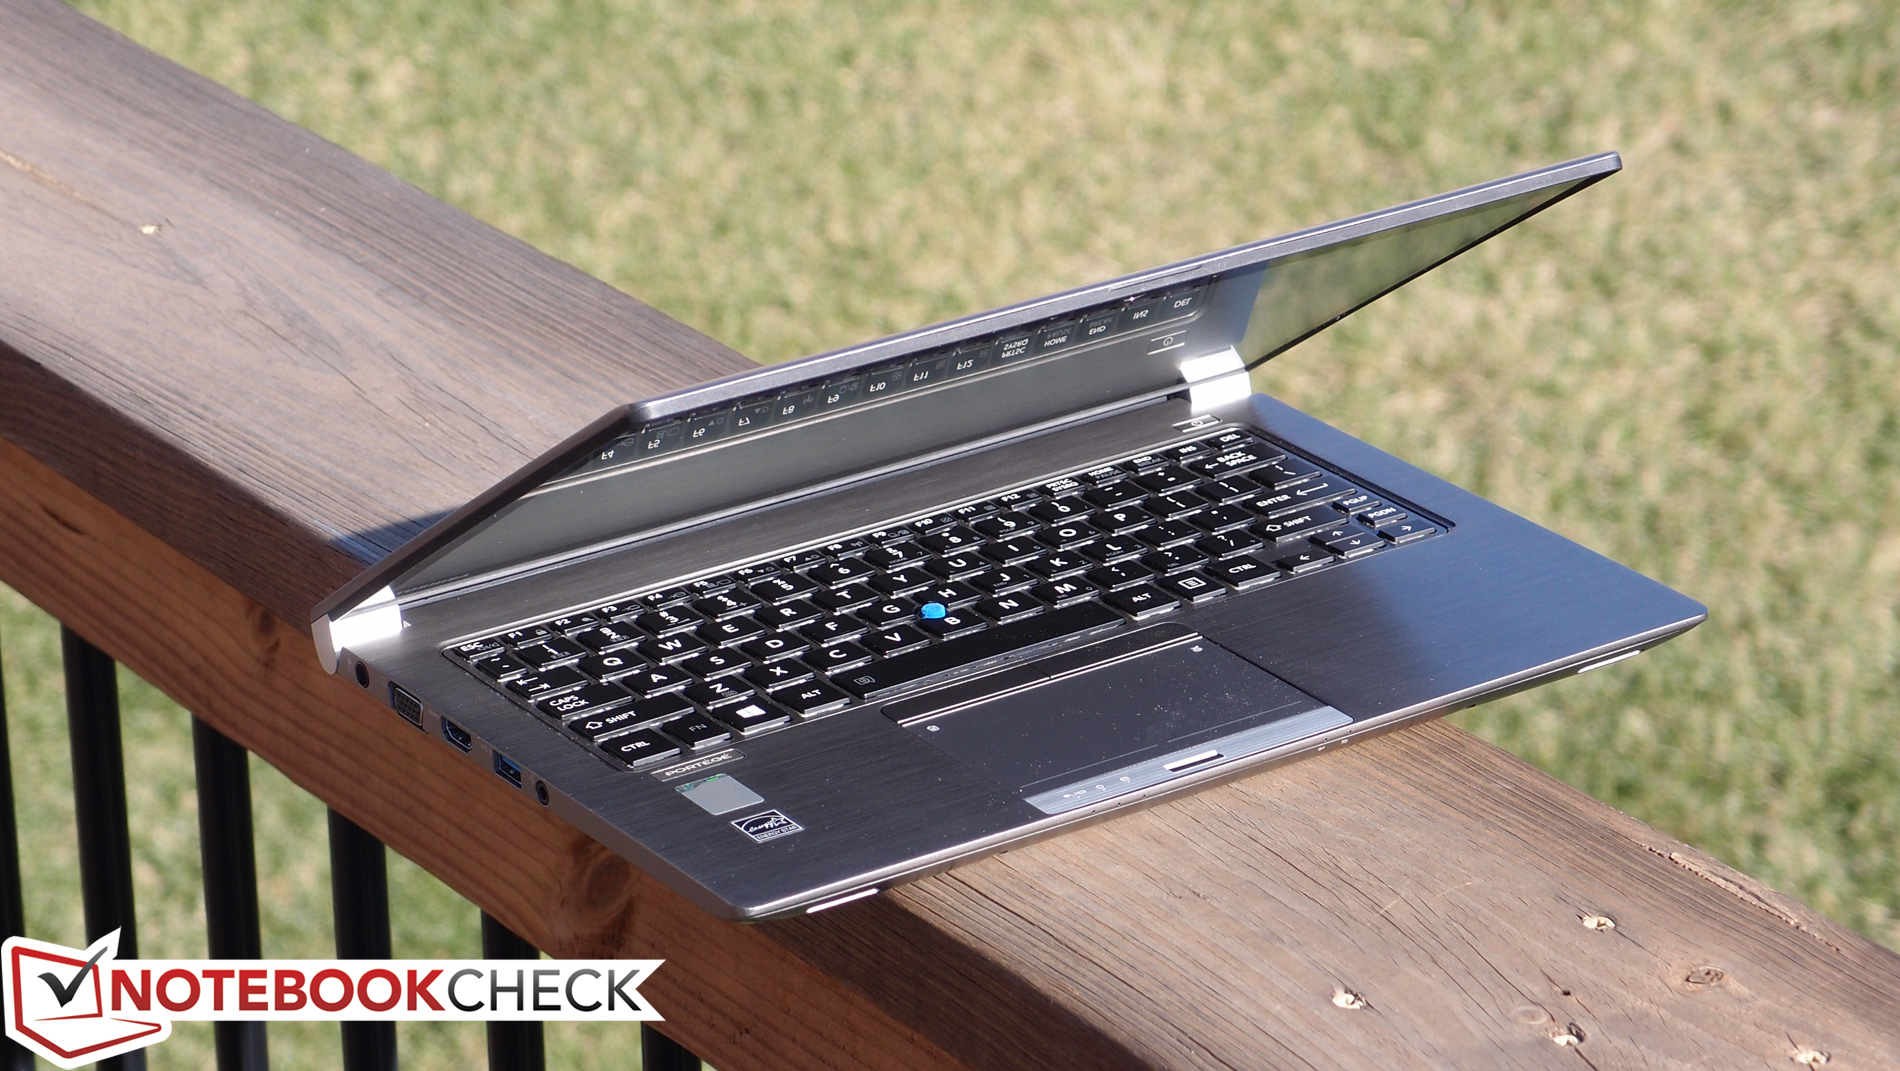
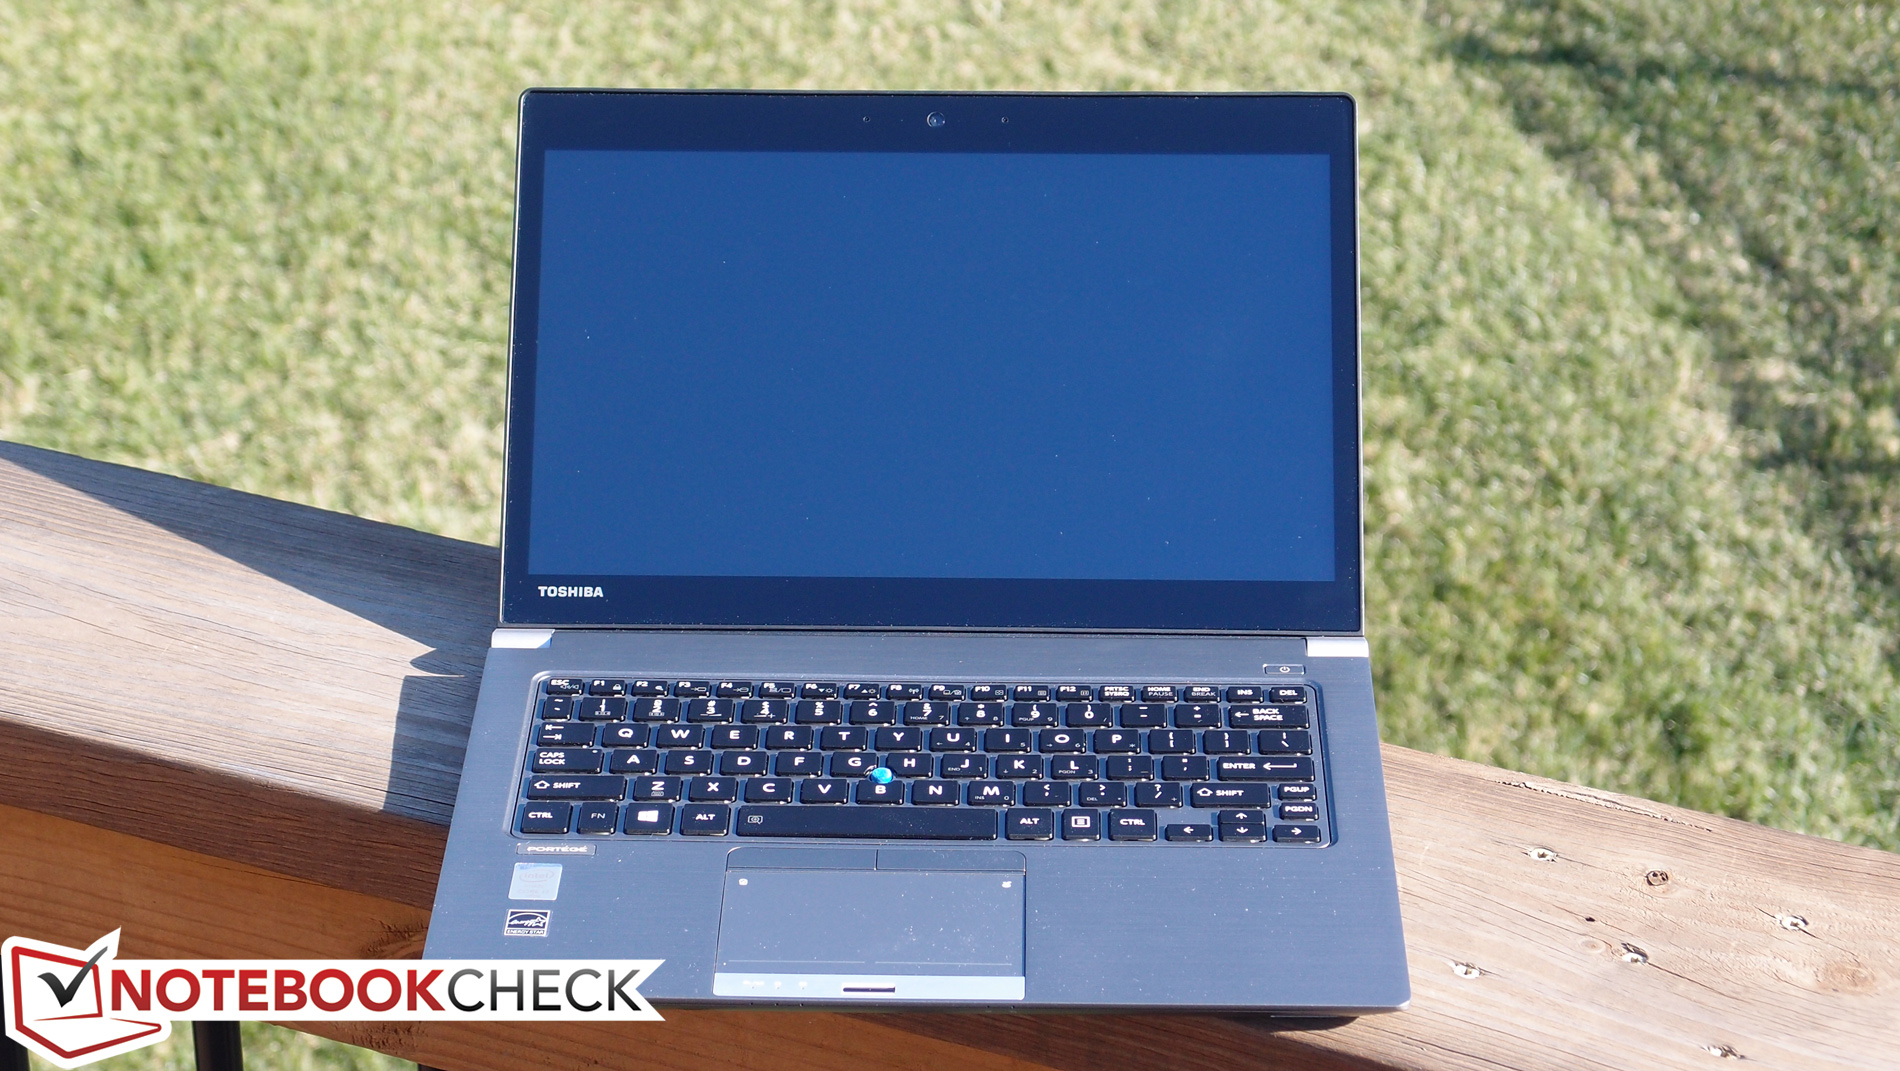
Due anni sono un'eternità nell'informatica, ed è a tanto che non ci sono modifiche significative nel design degli ultraportatili high-end Toshiba. Tuttavia, nonostante il vecchio case, lo Z30t-B1320 è abbastanza portatile con il suo 1.33 kg (2.92 lbs.) - e grazie alla costruzione in lega di alluminio e alla selezione di porte, tutto deve concentrarsi sui componenti interni.
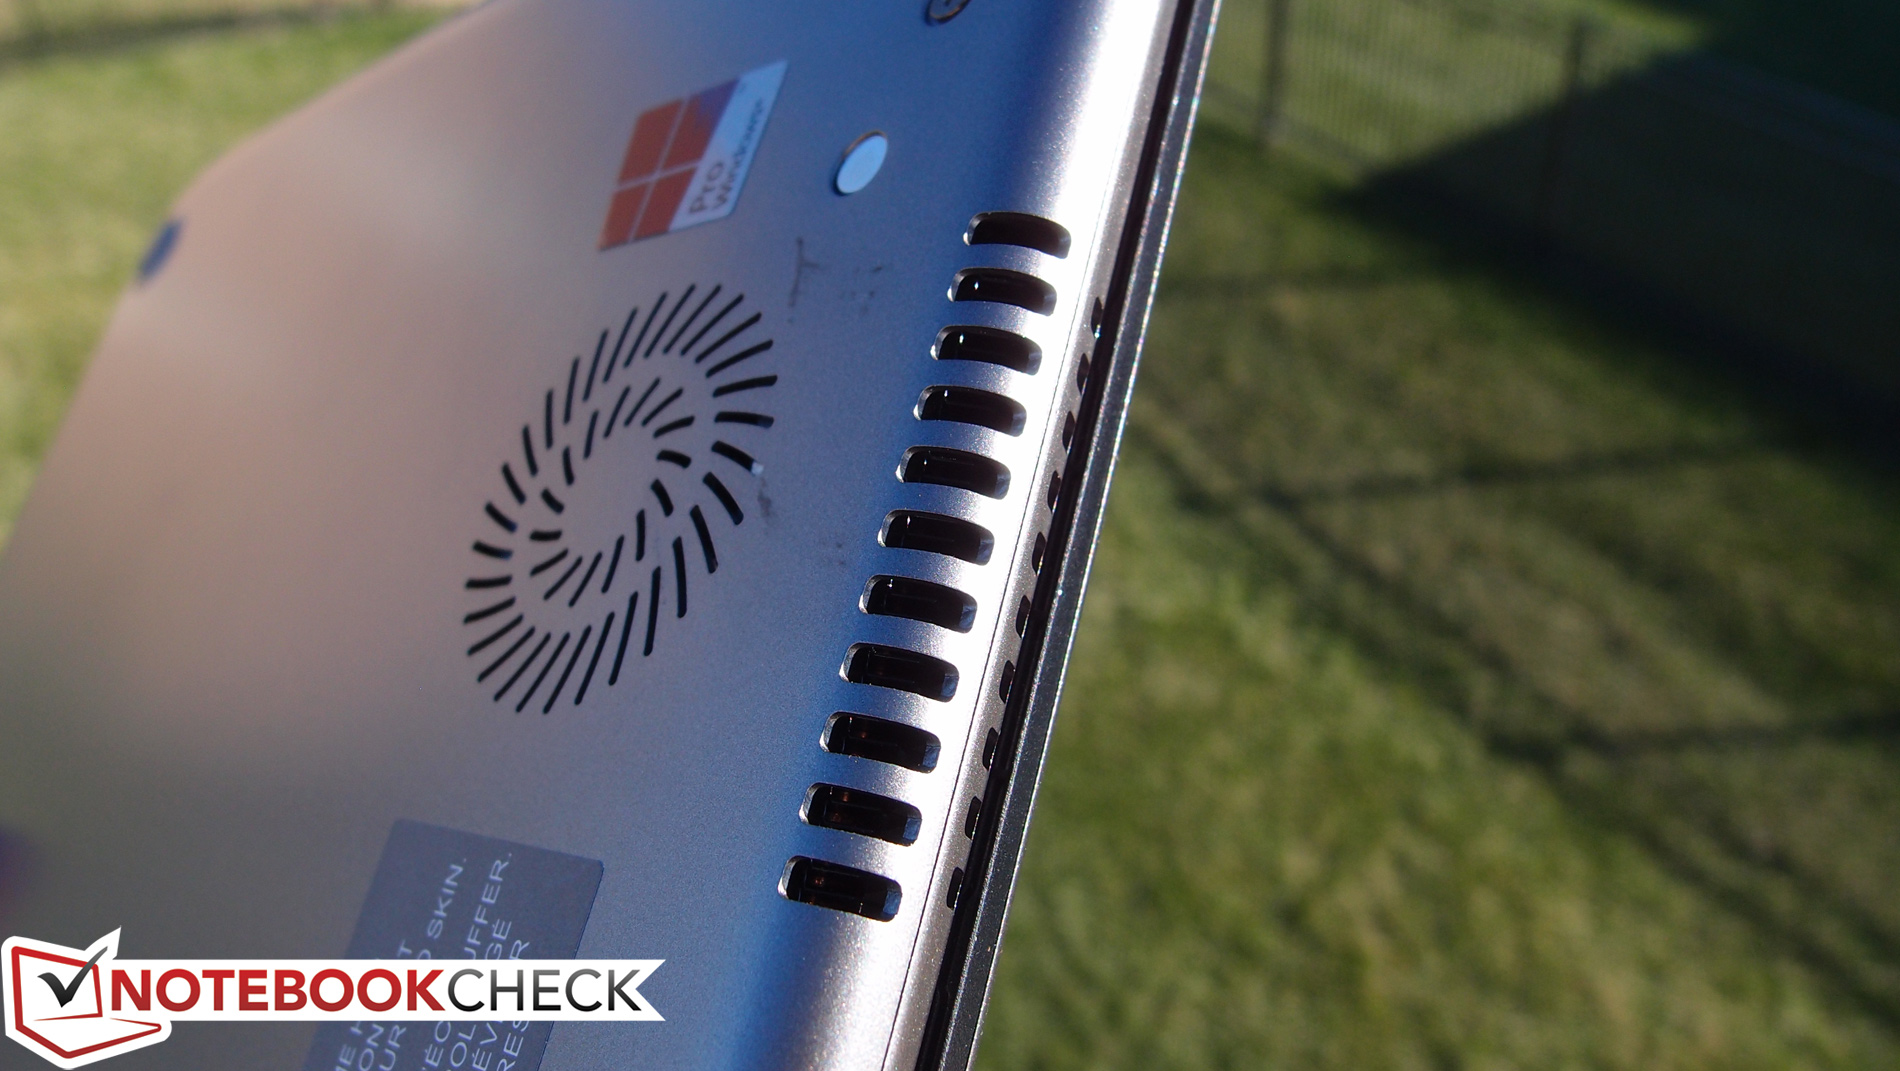
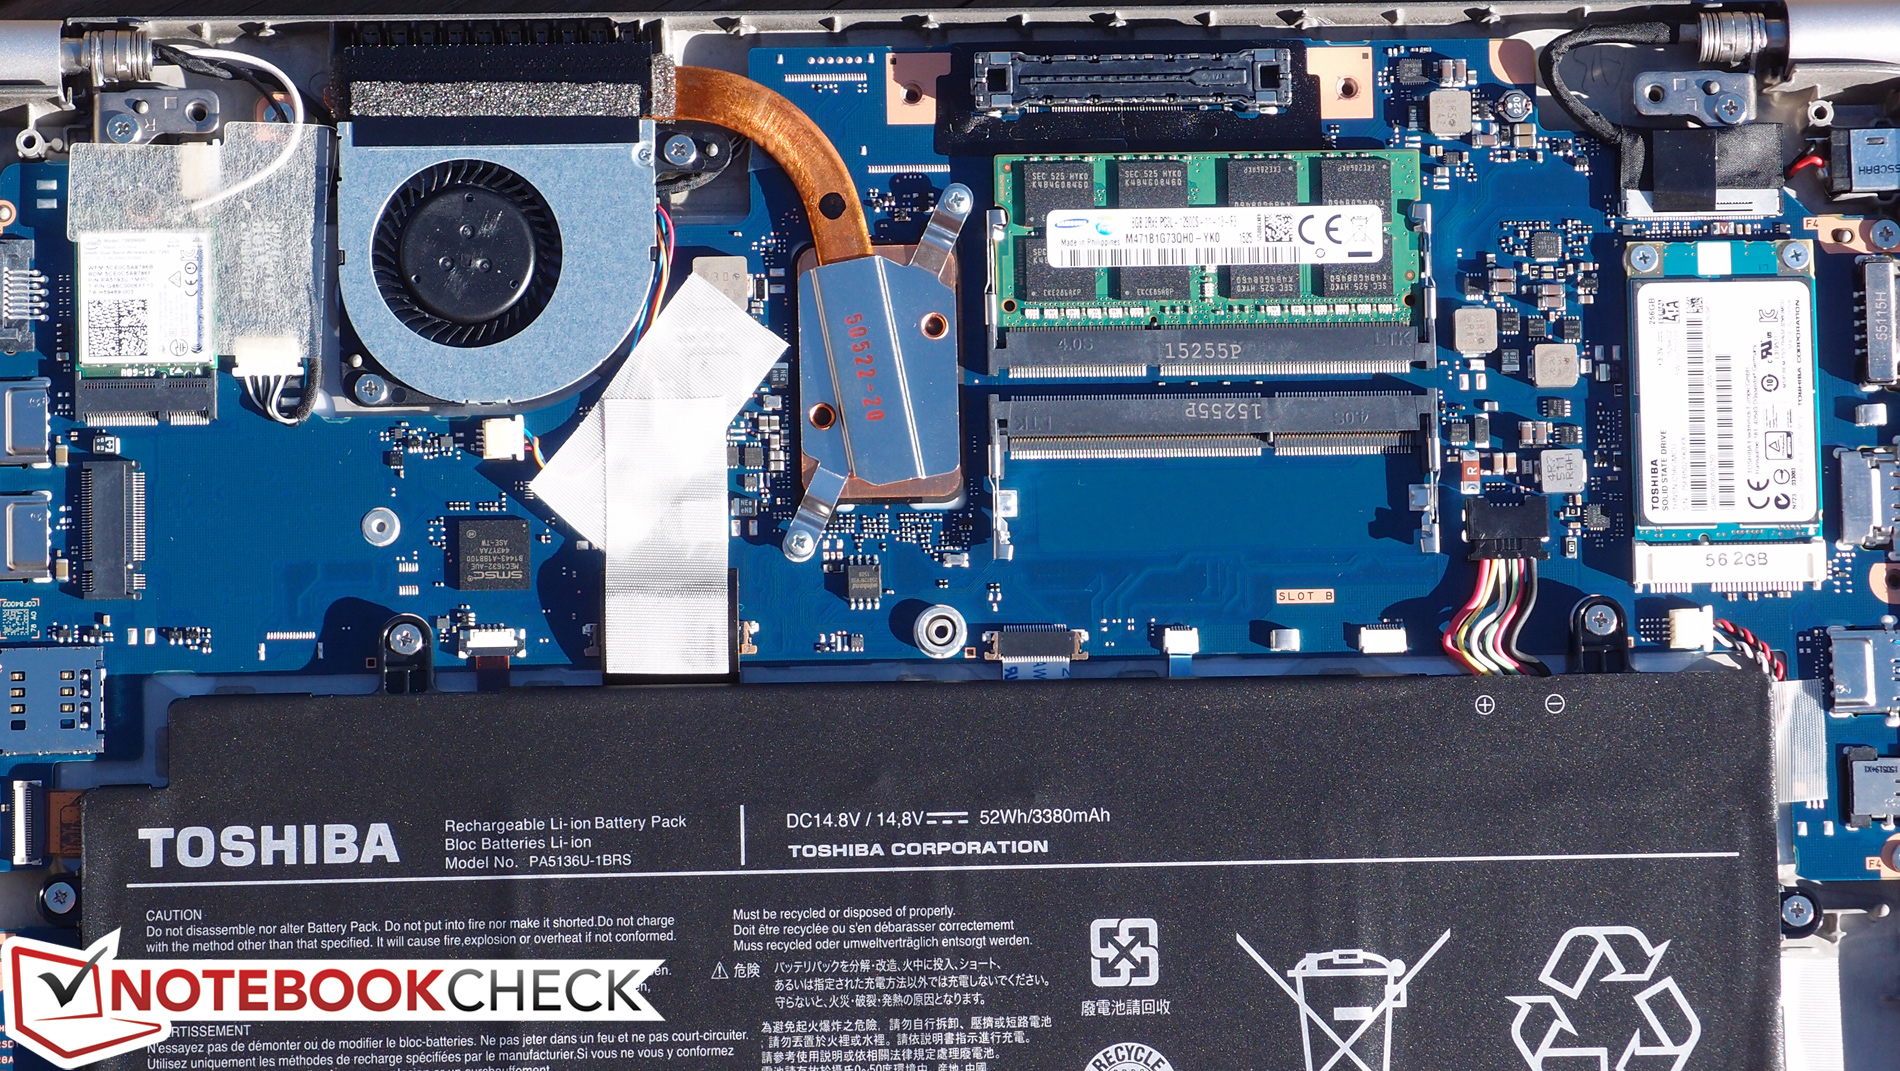
Sostenuto dall'update al chipset Broadwell, questo è il migliore Z30. Ha ottime prestazioni, buona autonomia e temperature basse (con buona collocazione della ventola e thermal design). I dispositivi di input sono altrettanto buoni, e lo schermo ha una buona riproduzione del colore, risoluzione adeguata, e valori luminosità/contrasto buoni.
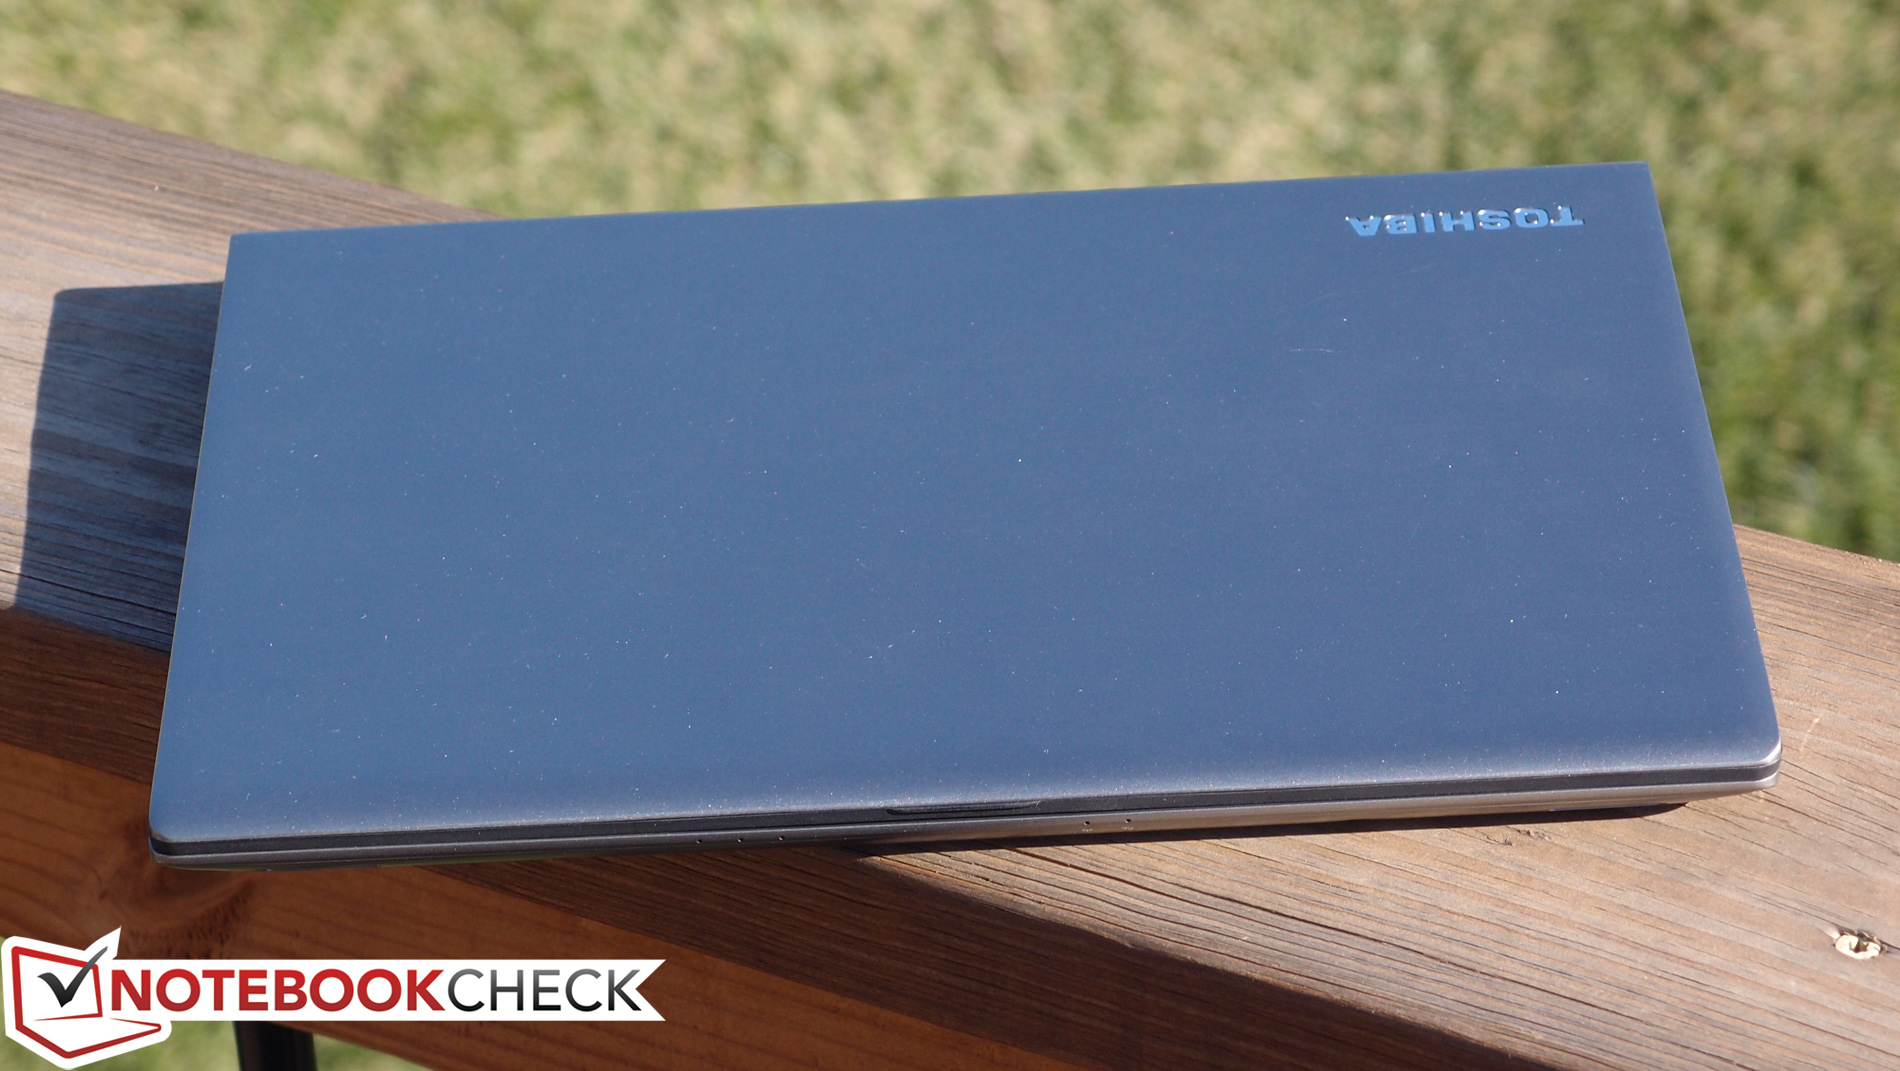
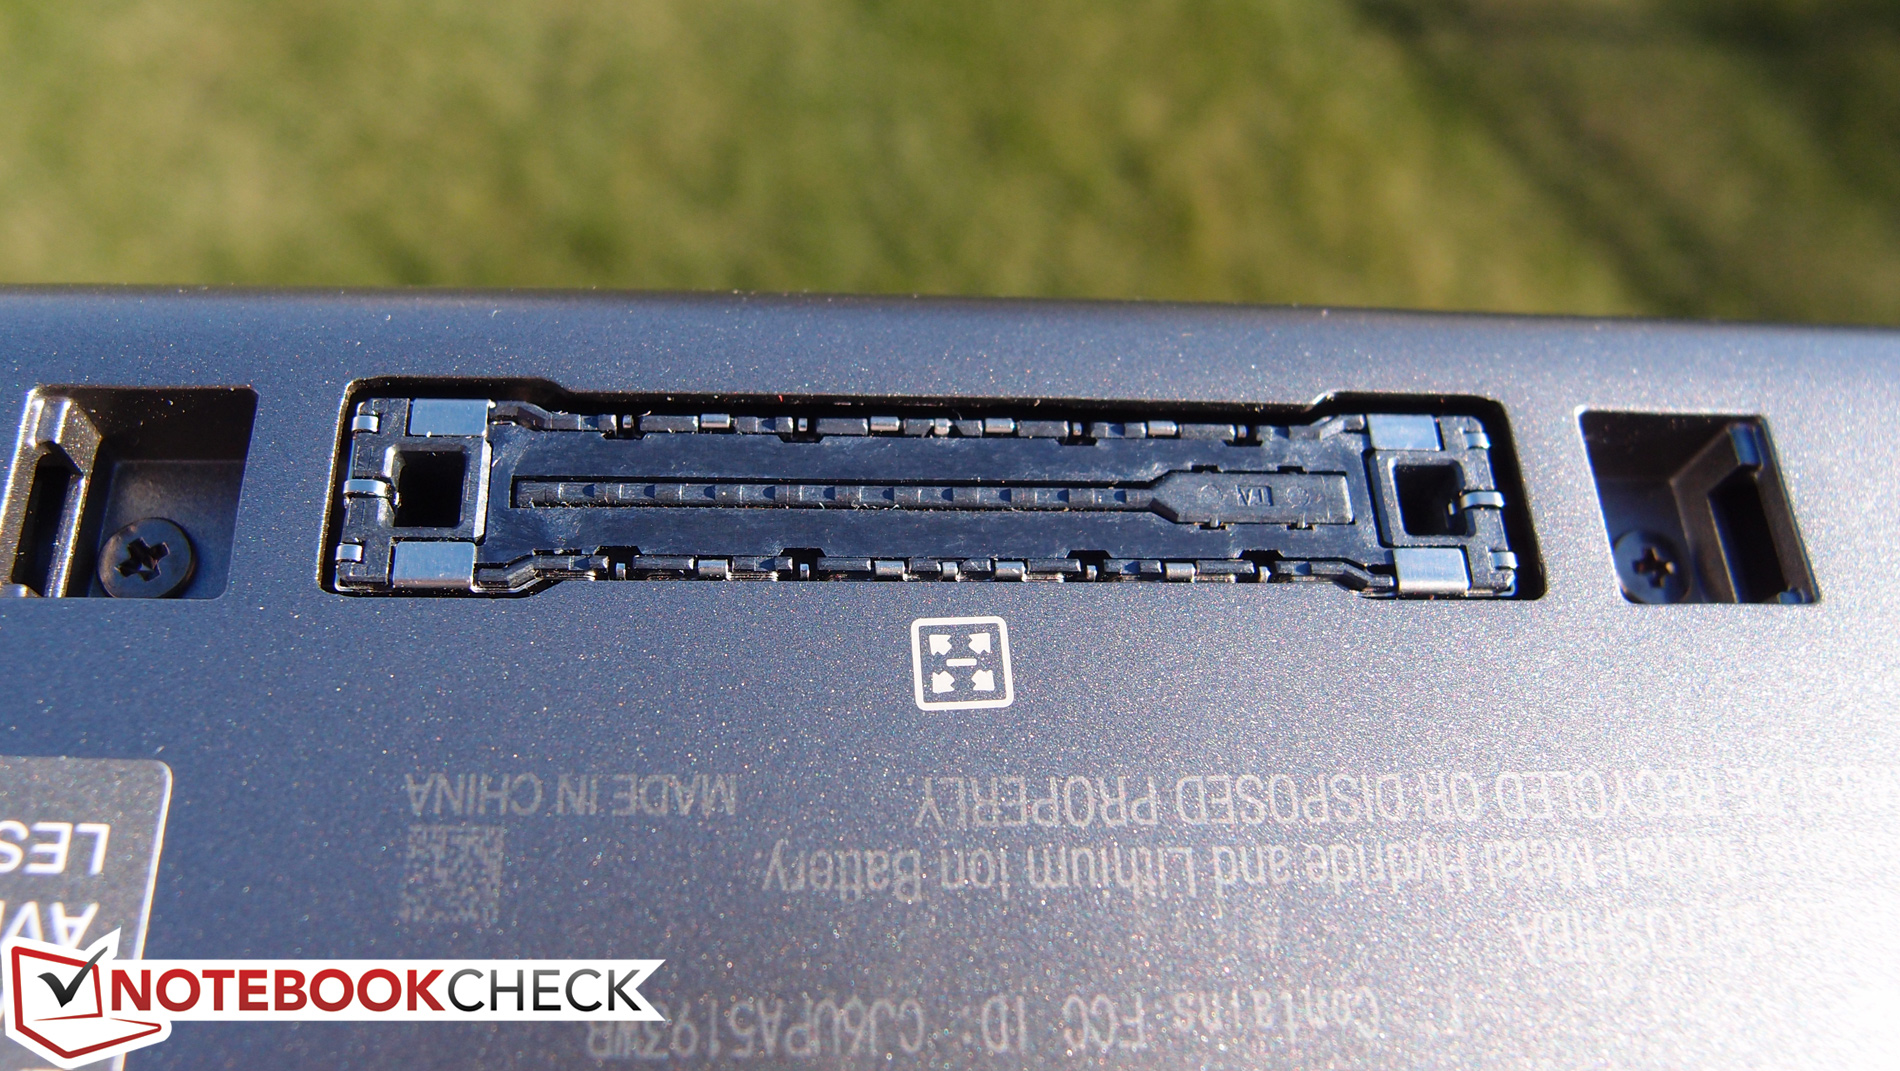
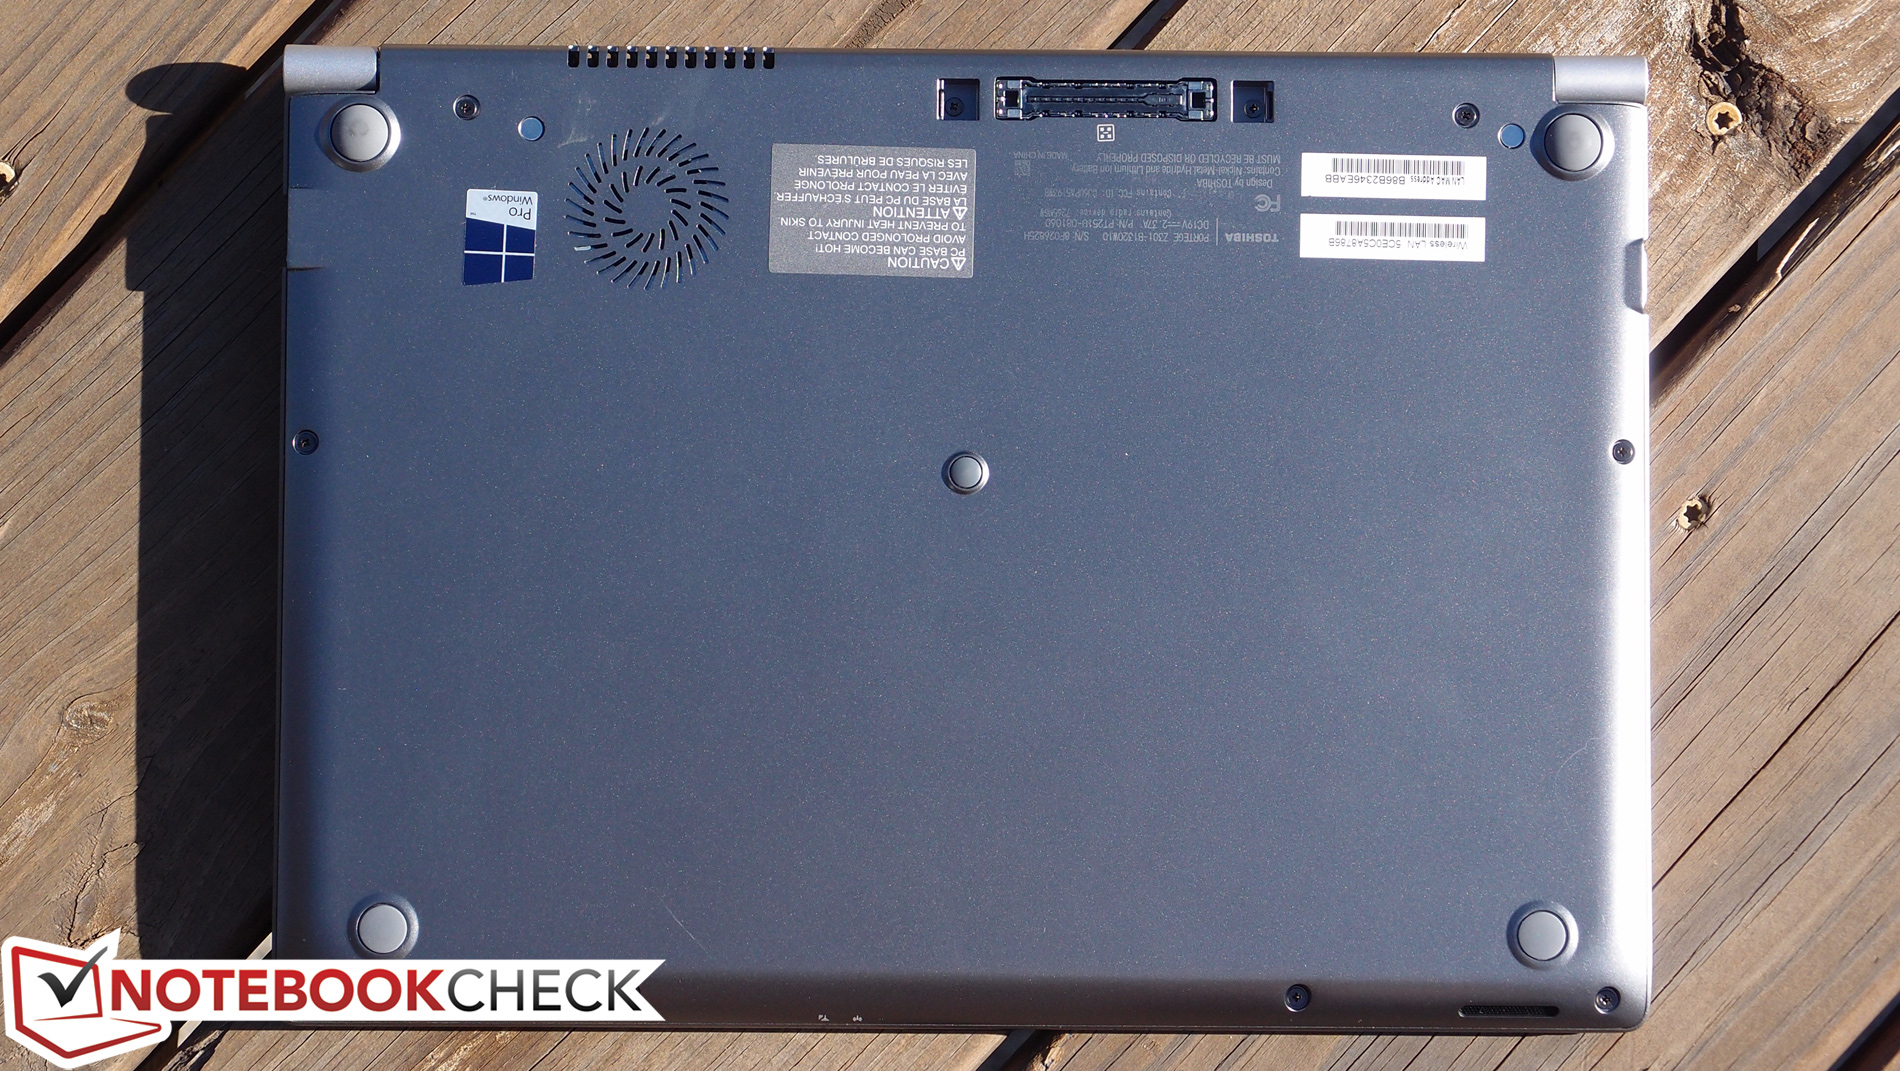
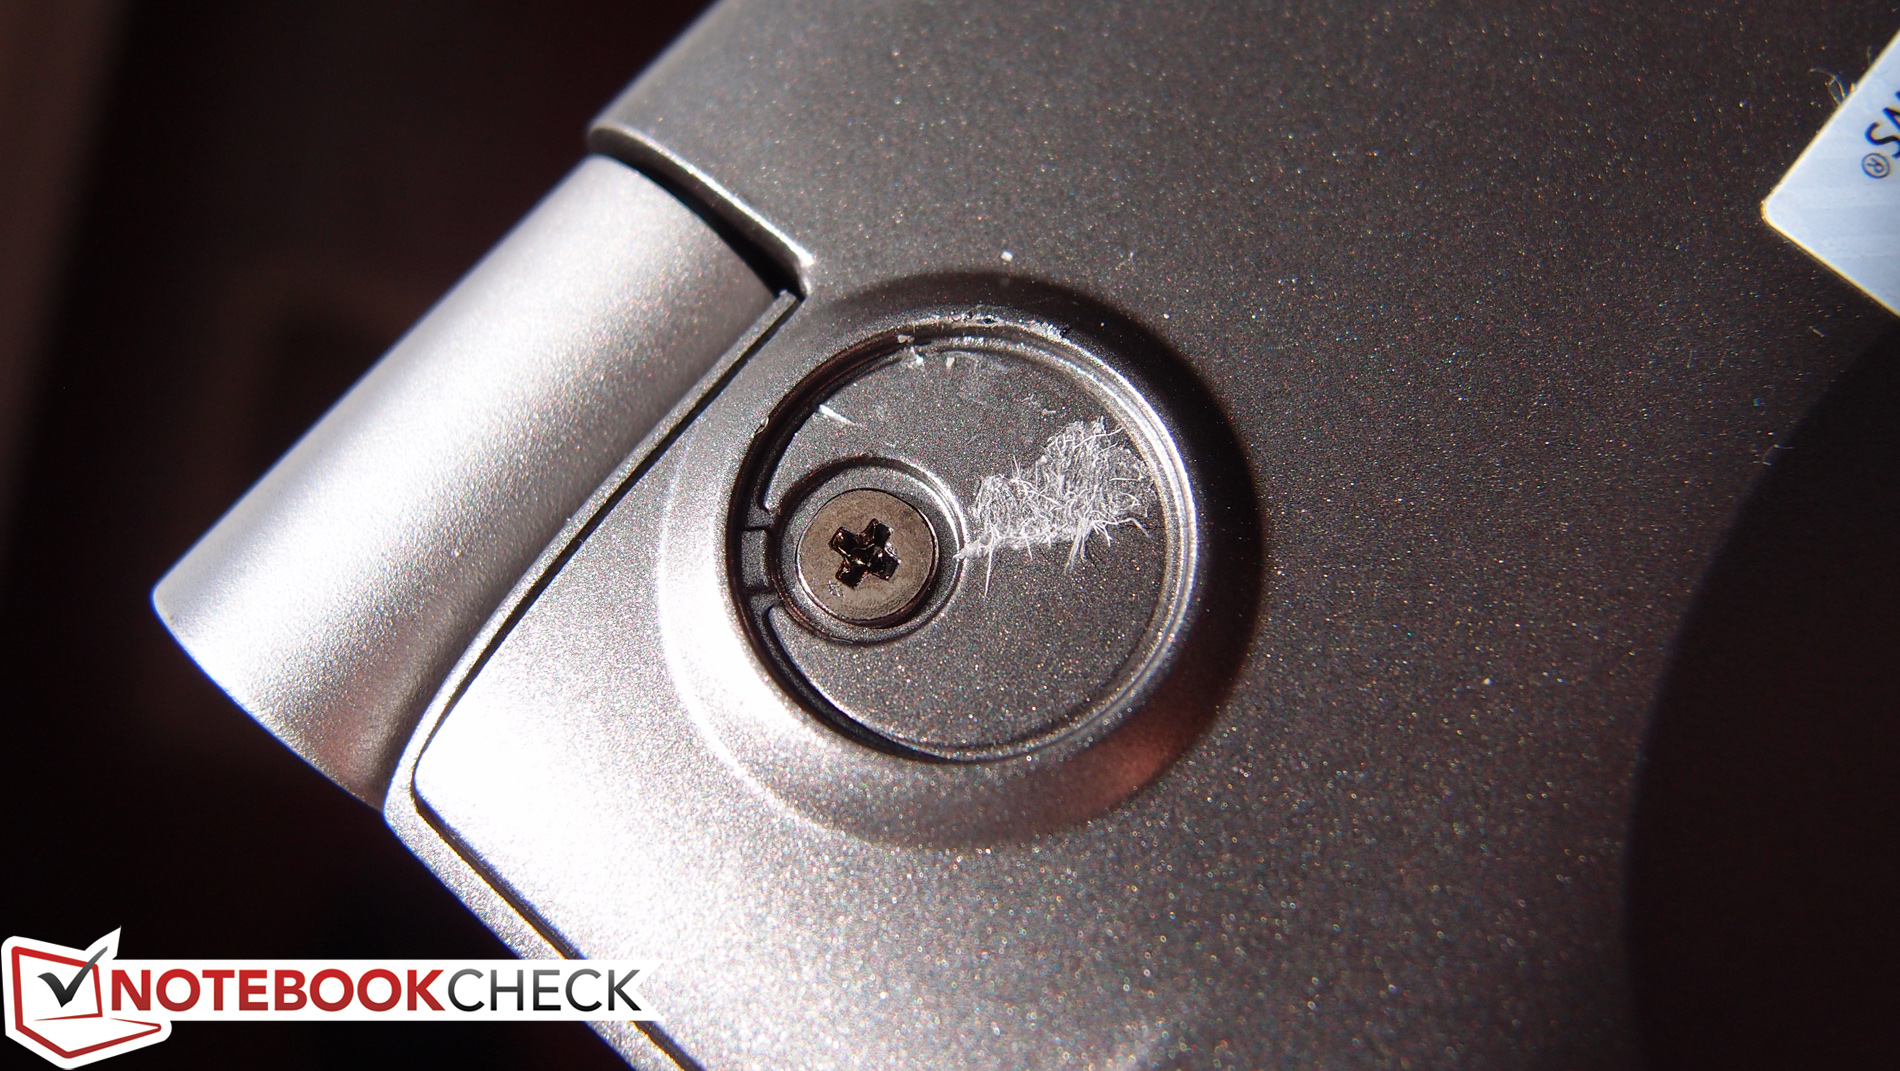
Sicuramente ci sono delle pecche. Il touchscreen ha immagini sgranate a causa del filtro. Il case ha una cover sottile che si torce. La manutenzione è assolutamente ottusa, con viti sotto i piedini di gomma, strano per una macchina high-end business. Infine le casse sono sotto la media, con pochi bassi.
Inoltre, la concorrenza è cresciuta intorno allo Z30t. Il Dell Latitude 7000 e il Lenovo ThinkPad sono ancora superiori per dispositivi di input, ed il case è più robusto. Gli HP EliteBooks sono più cari ma superiori. Ed alcune macchine consumer, nonostante l'assenza di Ethernet e docking station si sono fatti strada nell'area business, come il top-rated XPS 13.
Il Portege Z30t resta un solido contendente, e una vera riserva di potenza, nonostante il design datato.
Nota: si tratta di una recensione breve, con alcune sezioni non tradotte, per la versione integrale in inglese guardate qui.
Toshiba Portege Z30t-B1320W10
- 01/11/2016 v4.1 (old)
Steve Schardein
Price comparison
