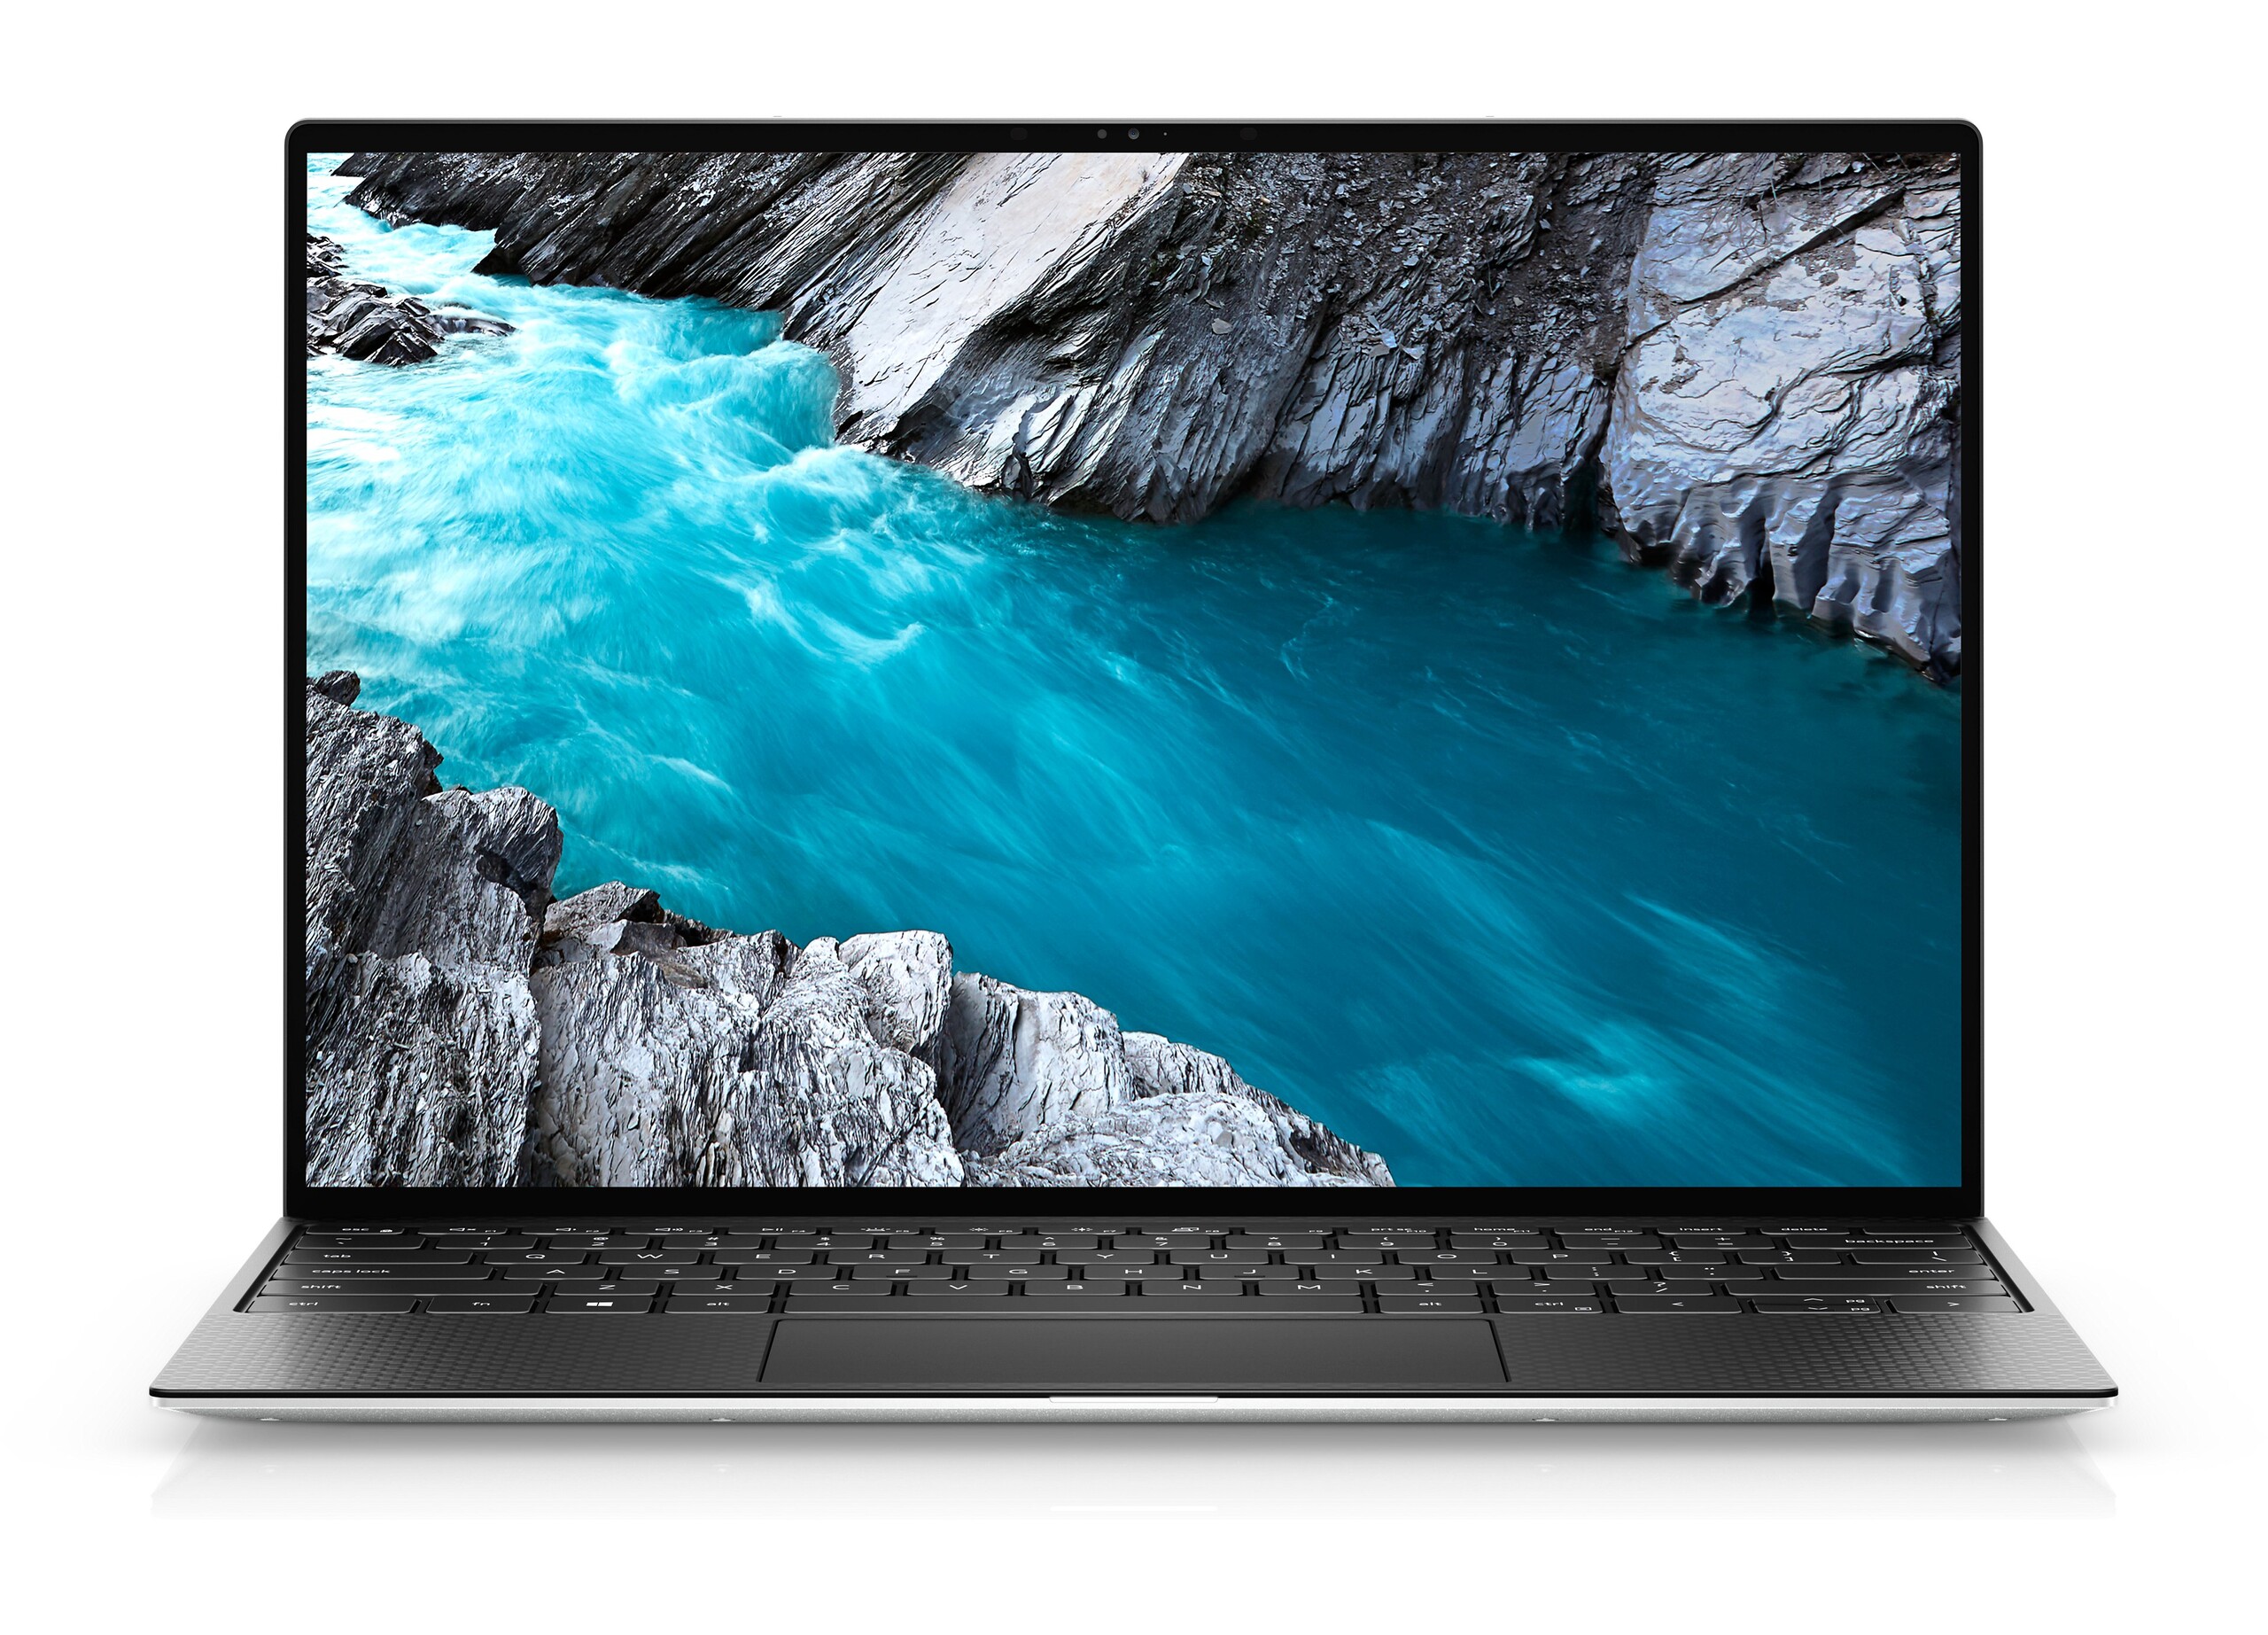
Core i7-1165G7 contro Core i7-1185G7: recensione del Laptop Dell XPS 13 9310 4K
")
Il Dell XPS 13 9310 è stato lanciato solo un paio di mesi fa accanto alla nuovissima piattaforma Intel di 11a generazione Tiger Lake-U. Sulla base del tempo che abbiamo trascorso con un'unità, le prestazioni si sono rivelate un notevole miglioramento rispetto all'XPS 13 9300 soprattutto in termini di grafica, anche se non ci sono state modifiche al design esterno. Se si possedeva un modello XPS più vecchio o si poteva utilizzare il boost grafico, allora un aggiornamento all'XPS 13 9310 avrebbe molto senso.
Questa volta Dell ci ha inviato una seconda unità XPS 13 9310 di fascia più alta equipaggiata con la CPU Core i7-1185G7 e display UHD 4K diversamente dalla nostra prima unità equipaggiata con il display Core i7-1165G7 e FHD. La configurazione attualmente viene venduta al dettaglio per circa $1600 USD o circa $300 in più rispetto alla versione Core i7-1165G7/FHD. Consultate le nostre recensioni sull'XPS 13 9300 e sull'XPS 13 9310 per saperne di più sullo chassis e sulle sue caratteristiche, poiché la nostra recensione qui si concentrerà sulle differenze tra le versioni Core i7-1165G7/FHD e Core i7-1185G7/4K dell'XPS 13 9310. L'opzione più costosa vale il costo extra per il Benjamin?
Altre recensioni Dell:
Confronto con i potenziali concorrenti
Punteggio | Data | Modello | Peso | Altezza | Dimensione | Risoluzione | Prezzo |
|---|---|---|---|---|---|---|---|
| 87.4 % v7 (old) | 12/2020 | Dell XPS 13 9310 Core i7 4K i7-1185G7, Iris Xe G7 96EUs | 1.3 kg | 14.8 mm | 13.40" | 3840x2400 | |
| 85.1 % v7 (old) | 10/2020 | Asus Zenbook S UX393JA i7-1065G7, Iris Plus Graphics G7 (Ice Lake 64 EU) | 1.4 kg | 15.7 mm | 13.90" | 3300x2200 | |
| 87.4 % v7 (old) | 06/2020 | Huawei MateBook X Pro 2020 i7 i7-10510U, GeForce MX250 | 1.3 kg | 14.6 mm | 13.90" | 3000x2000 | |
| 88.9 % v7 (old) | 03/2020 | Dell XPS 13 9300 Core i7-1065G7 i7-1065G7, Iris Plus Graphics G7 (Ice Lake 64 EU) | 1.2 kg | 14.8 mm | 13.40" | 1920x1200 | |
| 85.3 % v7 (old) | 09/2020 | Lenovo Yoga Slim 7-14ARE R7 4800U, Vega 8 | 1.4 kg | 14.9 mm | 14.00" | 1920x1080 | |
| 88.4 % v7 (old) | 12/2019 | HP Spectre x360 13-aw0013dx i7-1065G7, Iris Plus Graphics G7 (Ice Lake 64 EU) | 1.2 kg | 16.9 mm | 13.30" | 1920x1080 |
Case
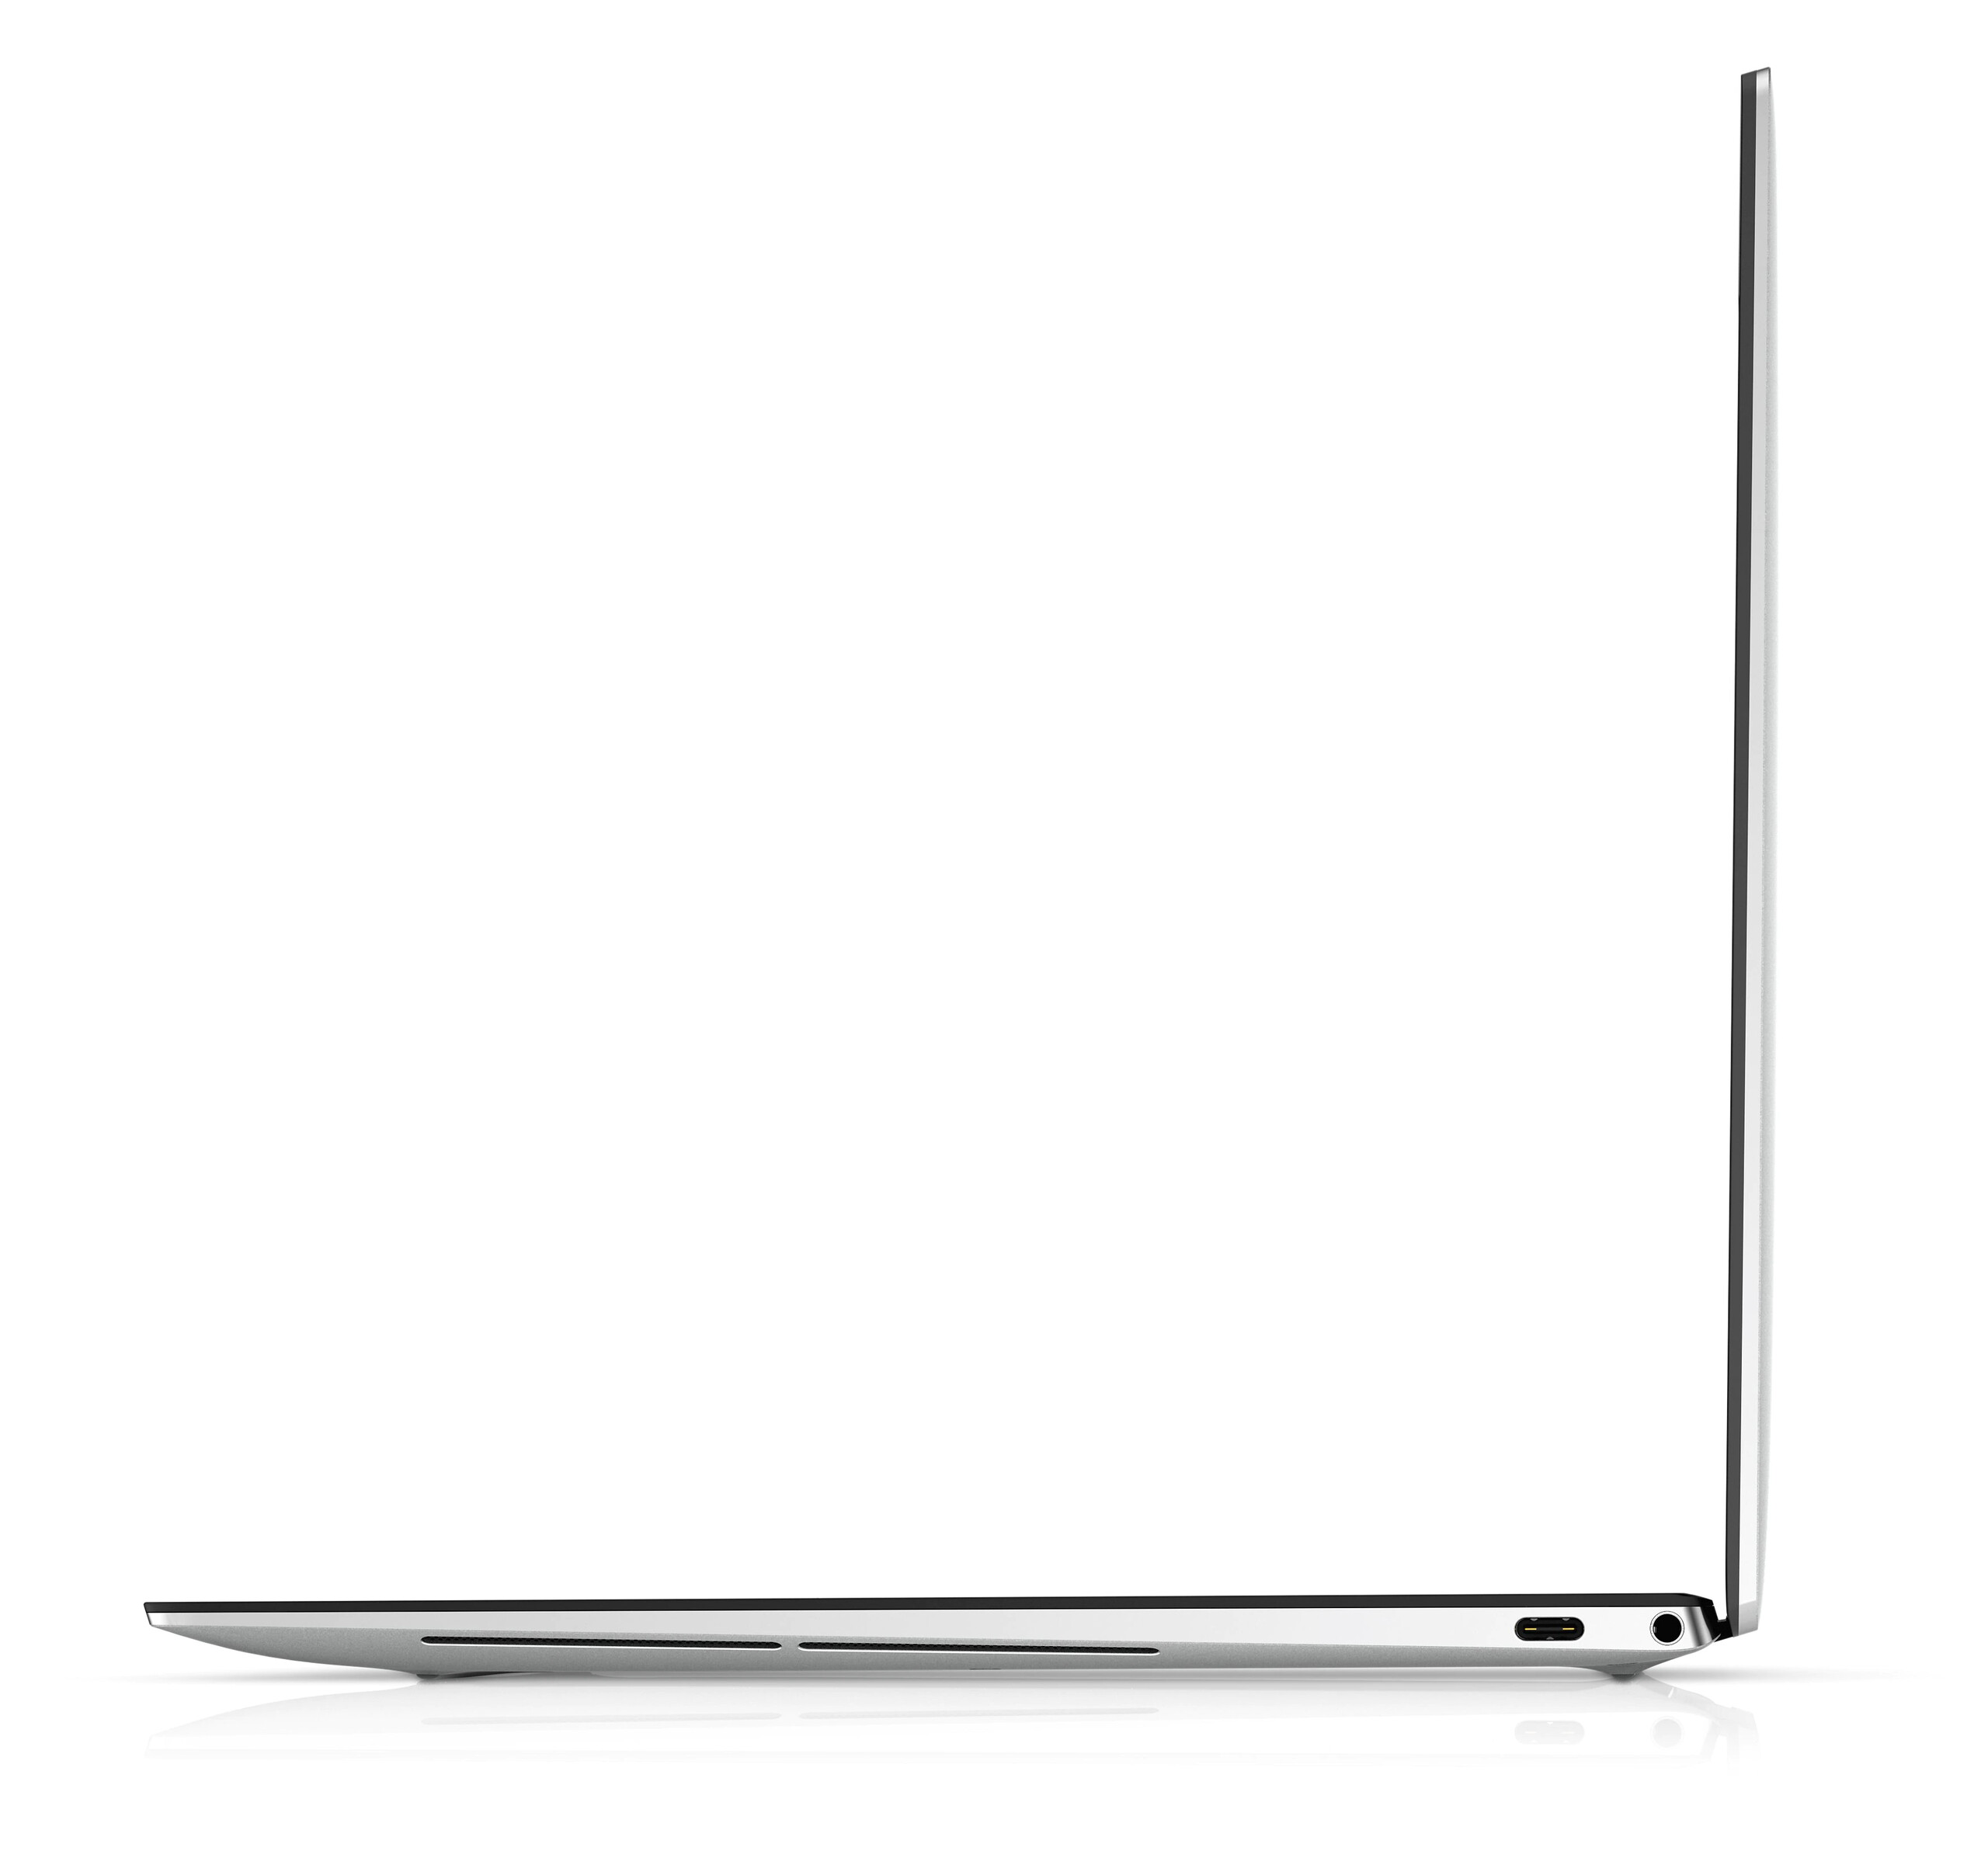
Lettore di schede SD
| SD Card Reader | |
| average JPG Copy Test (av. of 3 runs) | |
| Dell XPS 13 9310 Core i7 4K (Toshiba Exceria Pro M501 32 GB UHS-II) | |
| HP Spectre x360 13-aw0013dx (Toshiba Exceria Pro M501 microSDXC 64GB) | |
| Dell XPS 13 9300 Core i7-1065G7 (Toshiba Exceria Pro M501 64 GB UHS-II) | |
| Asus Zenbook S UX393JA (Toshiba Exceria Pro M501 64 GB UHS-II) | |
| Lenovo Yoga Slim 7-14ARE (Toshiba Exceria Pro M501 64 GB UHS-II) | |
| maximum AS SSD Seq Read Test (1GB) | |
| Dell XPS 13 9310 Core i7 4K (Toshiba Exceria Pro M501 32 GB UHS-II) | |
| Dell XPS 13 9300 Core i7-1065G7 (Toshiba Exceria Pro M501 64 GB UHS-II) | |
| HP Spectre x360 13-aw0013dx (Toshiba Exceria Pro M501 microSDXC 64GB) | |
| Lenovo Yoga Slim 7-14ARE (Toshiba Exceria Pro M501 64 GB UHS-II) | |
| Asus Zenbook S UX393JA (Toshiba Exceria Pro M501 64 GB UHS-II) | |
Comunicazioni
Webcam


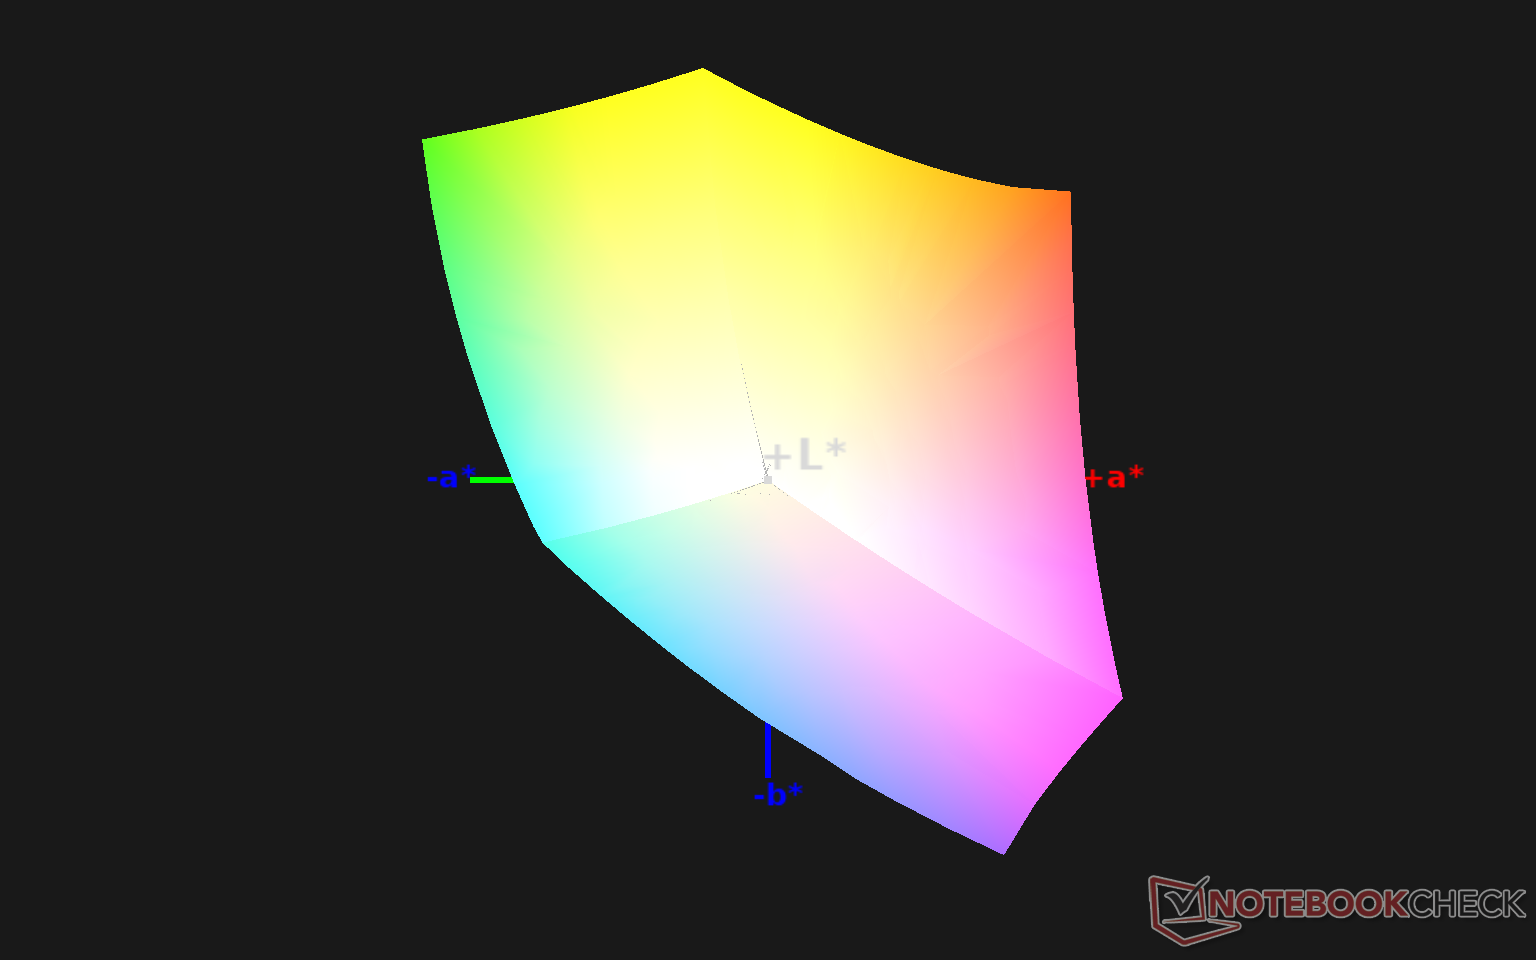
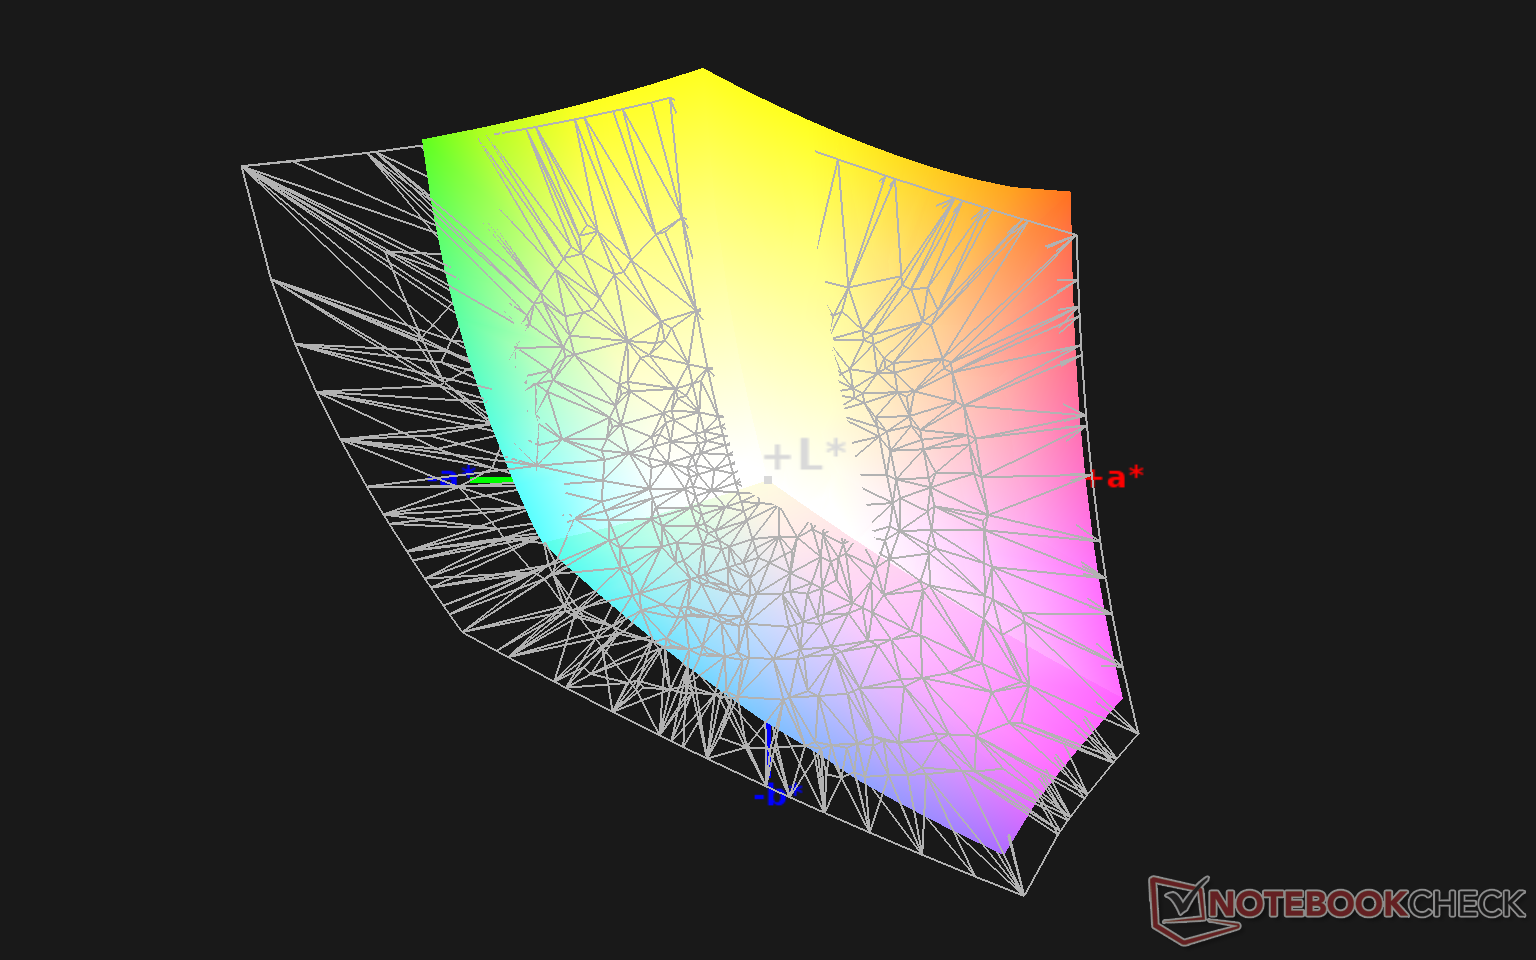
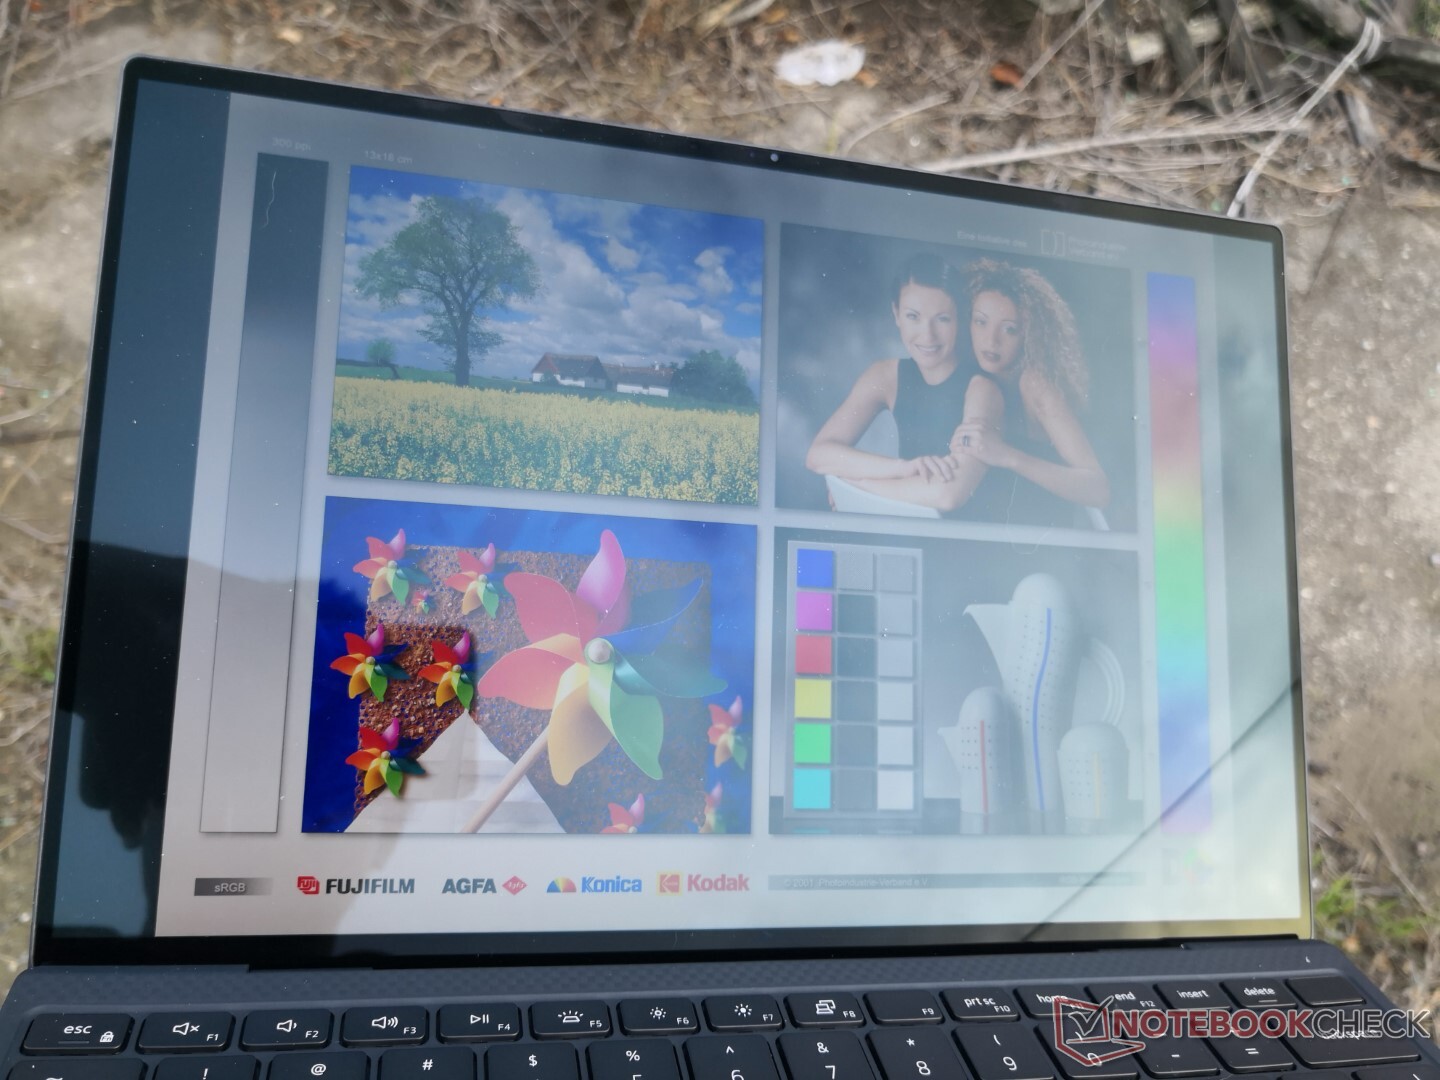
Display
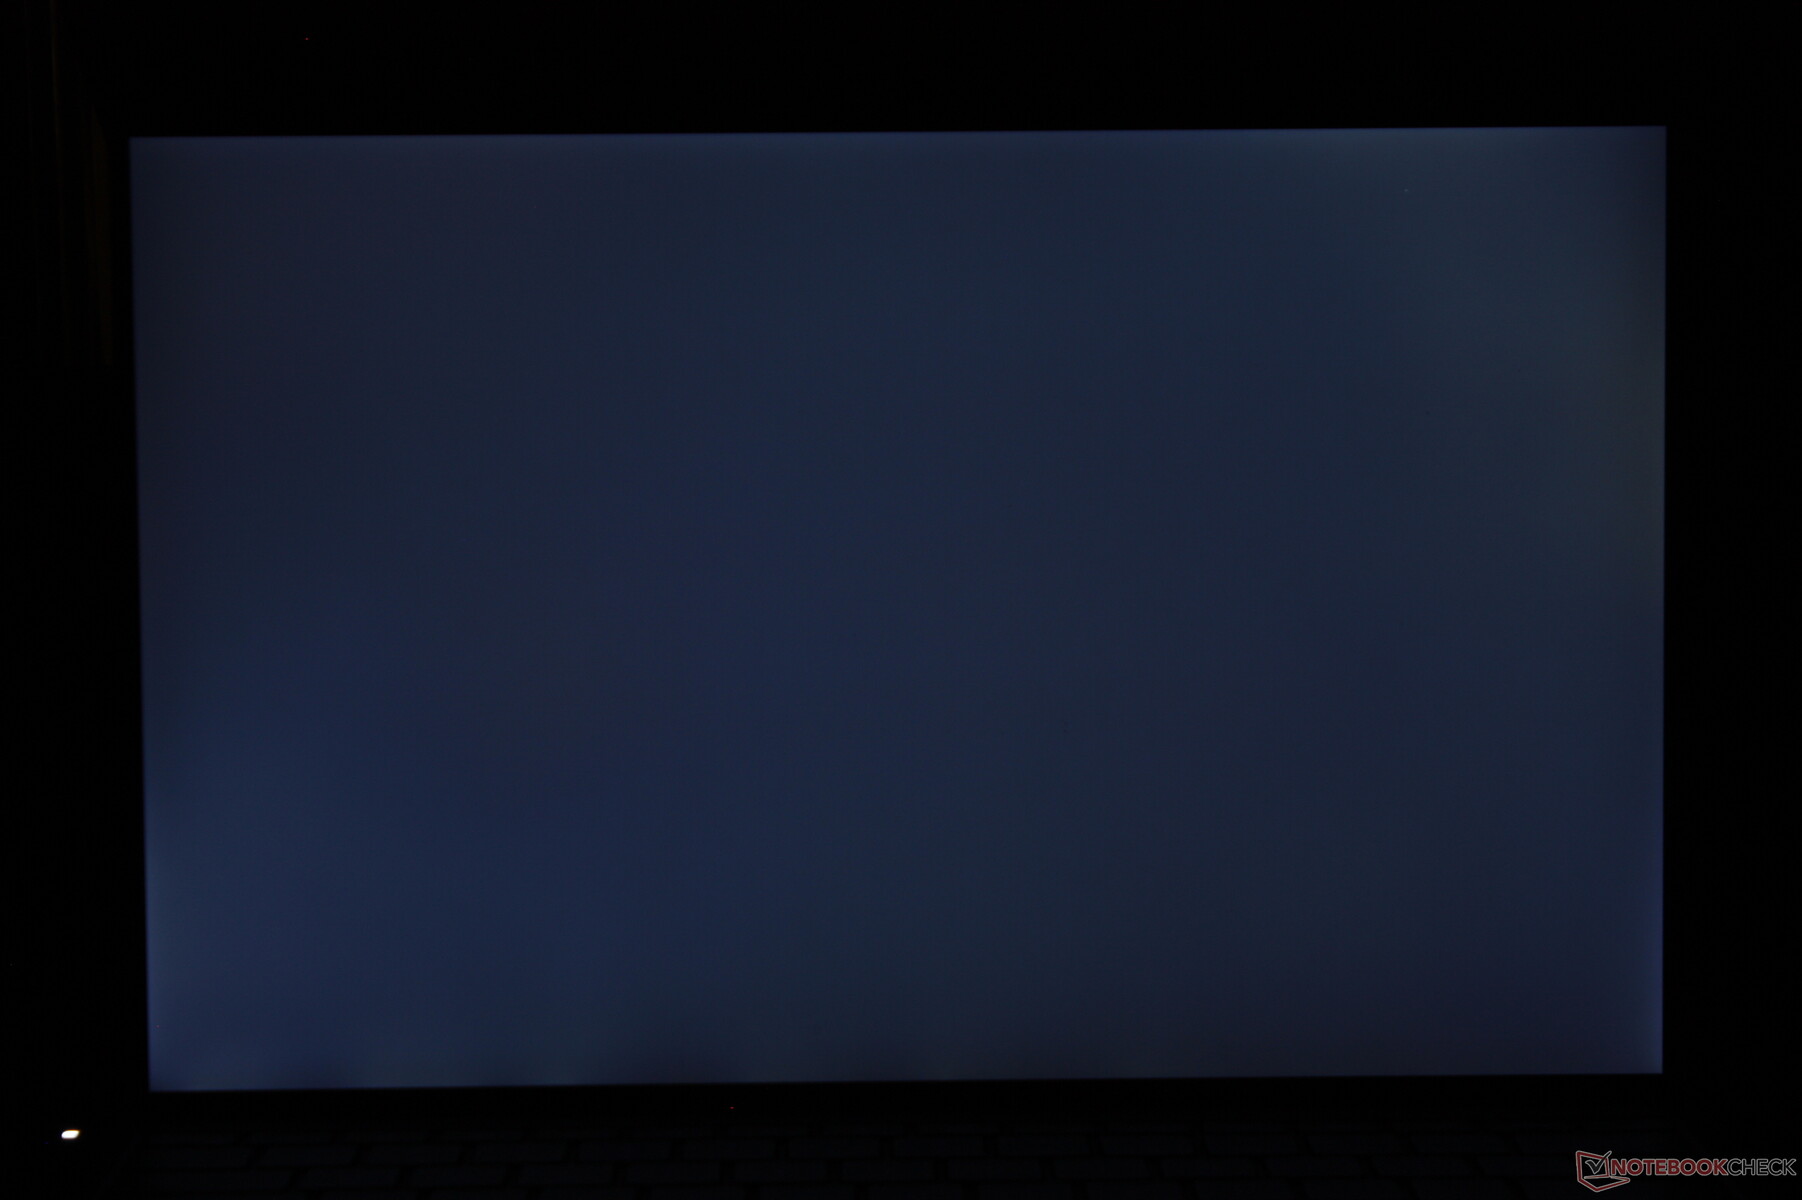
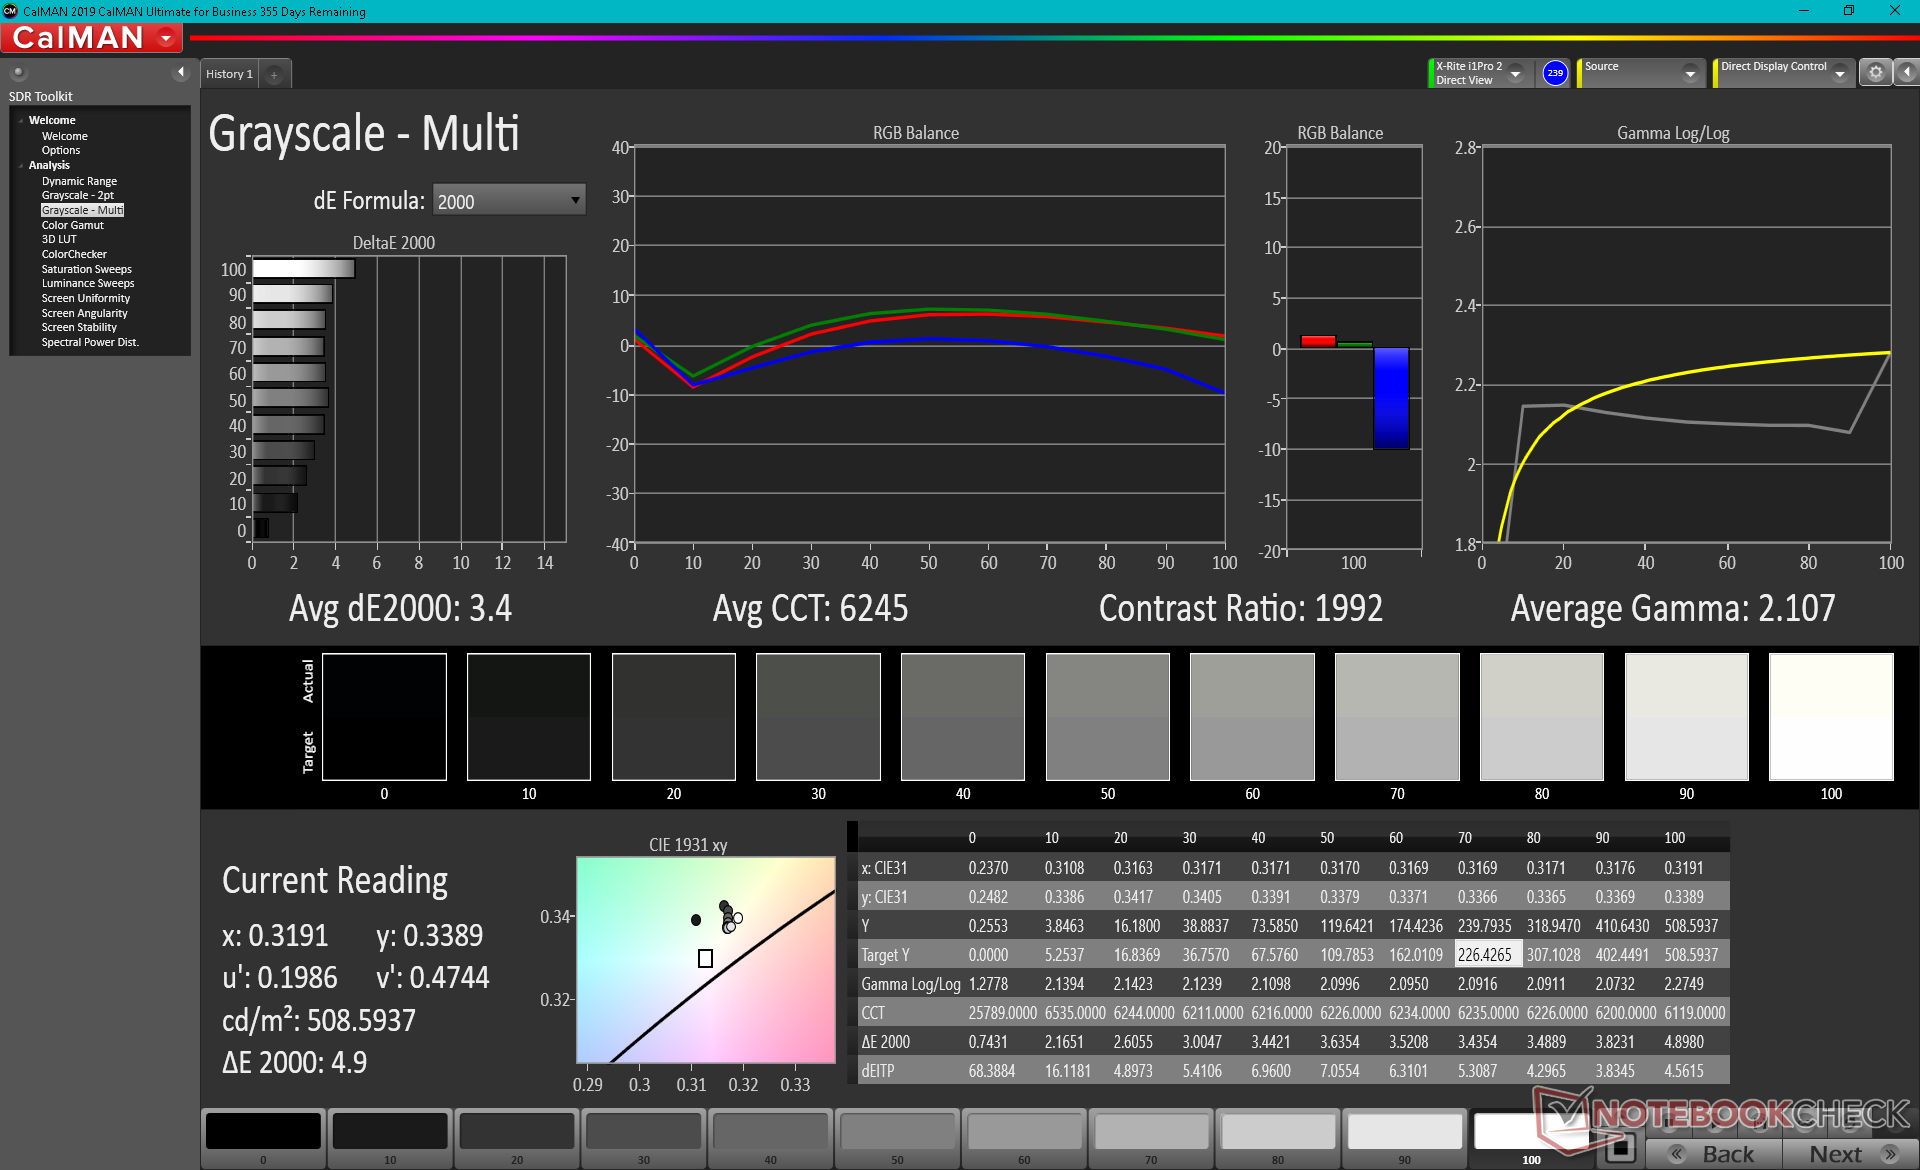
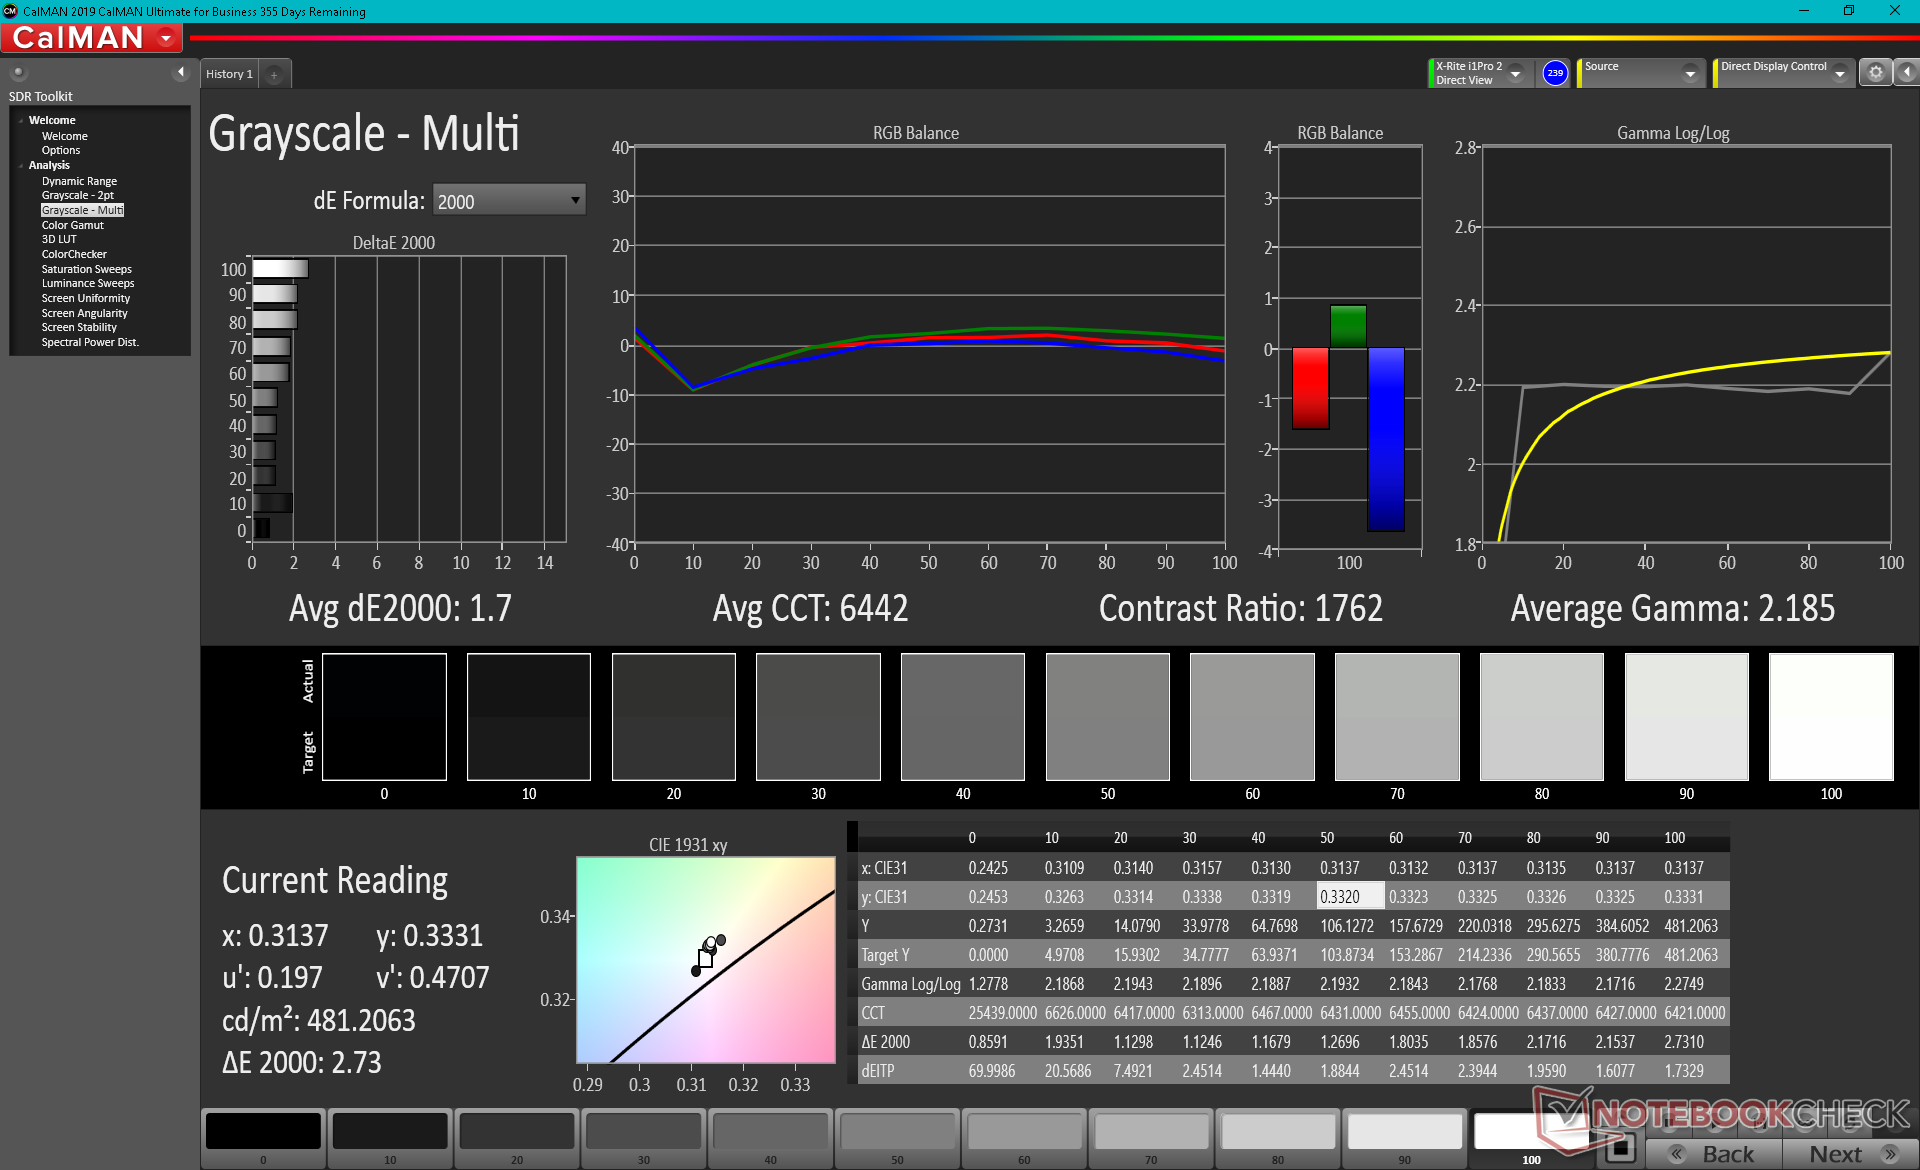
Dell utilizza lo stesso pannello IPS Sharp LQ134R1 IPS per la sua ultima generazione di XPS 13 9300 4K e la generazione attuale XPS 13 9310 4K per una simile esperienza di display gen-to-gen. Una differenza importante che abbiamo notato tra le nostre due unità, tuttavia, riguarda il display più luminoso del più recente XPS 13 9310 (479 nits rispetto ai 401 nits). La modulazione della larghezza di impulso è presente anche sul modello più recente, mentre era assente sul vecchio XPS 13 9300 4K il che suggerisce che Dell potrebbe utilizzare una retroilluminazione diversa questa volta.
L'uniformità della luminosità potrebbe essere un po' migliore sulla nostra unità. L'angolo in alto a sinistra del nostro display è leggermente più scuro di quanto dovrebbe essere come mostrato dalle nostre misure qui sotto. Non basta, ci aspettiamo di meglio da una serie di ammiraglie come l'XPS.

| |||||||||||||||||||||||||
Distribuzione della luminosità: 84 %
Al centro con la batteria: 508.7 cd/m²
Contrasto: 1696:1 (Nero: 0.3 cd/m²)
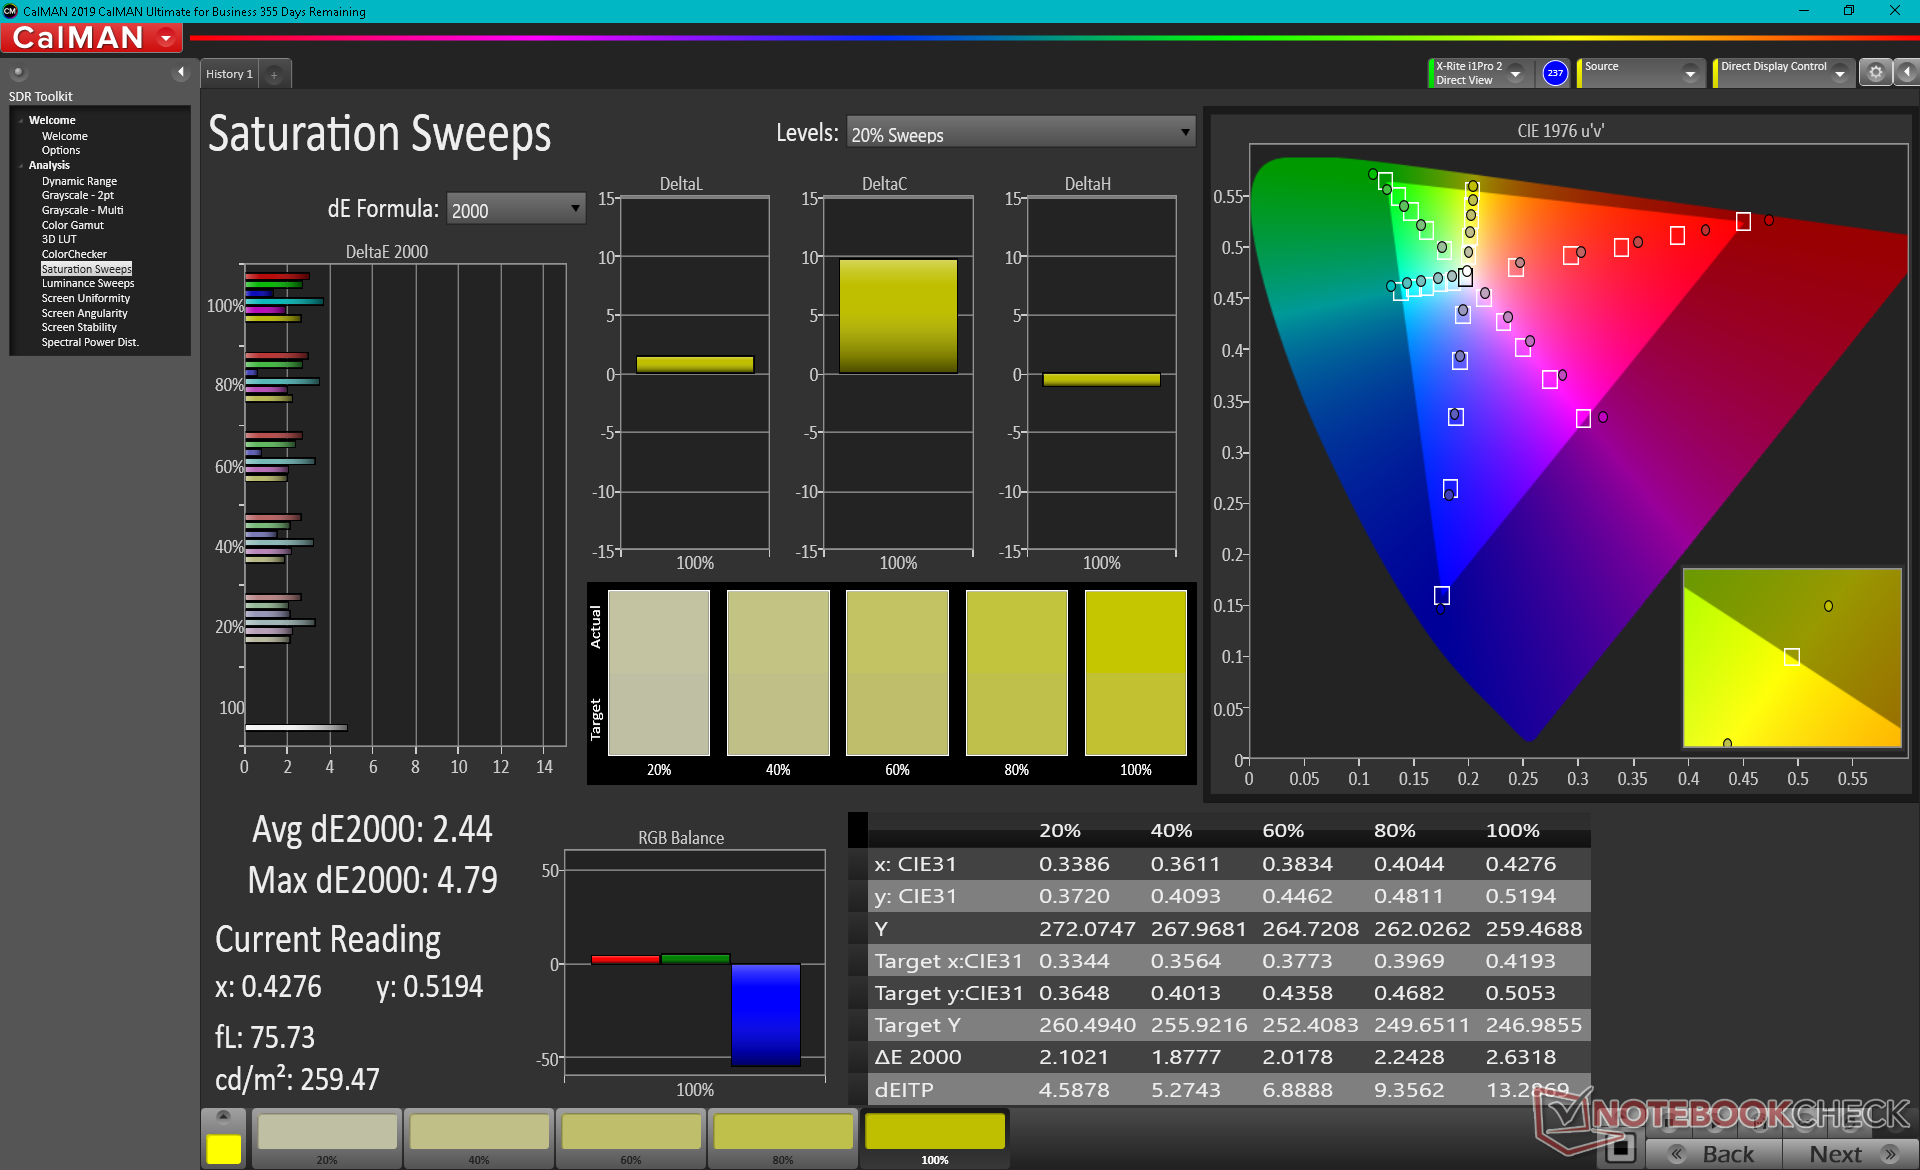
ΔE ColorChecker Calman: 2.72 | ∀{0.5-29.43 Ø4.72}
calibrated: 1.92
ΔE Greyscale Calman: 3.4 | ∀{0.09-98 Ø4.97}
100% sRGB (Argyll 1.6.3 3D)
70.7% AdobeRGB 1998 (Argyll 1.6.3 3D)
78.9% AdobeRGB 1998 (Argyll 3D)
100% sRGB (Argyll 3D)
80.2% Display P3 (Argyll 3D)
Gamma: 2.11
CCT: 6245 K
| Dell XPS 13 9310 Core i7 4K Sharp LQ134R1, IPS, 13.4", 3840x2400 | Asus Zenbook S UX393JA AU Optronics B139KAN01.0, IPS, 13.9", 3300x2200 | Huawei MateBook X Pro 2020 i7 JDI LPM139M422A, LTPS, 13.9", 3000x2000 | Dell XPS 13 9300 Core i7-1065G7 Sharp LQ134N1, IPS, 13.4", 1920x1200 | Lenovo Yoga Slim 7-14ARE AU Optronics B140HAN06.8, IPS, 14", 1920x1080 | HP Spectre x360 13-aw0013dx AU Optronics AUO5E2D, IPS, 13.3", 1920x1080 | |
|---|---|---|---|---|---|---|
| Display | 11% | -10% | -11% | -7% | -8% | |
| Display P3 Coverage (%) | 80.2 | 97.7 22% | 66.6 -17% | 66.3 -17% | 71.7 -11% | 69.6 -13% |
| sRGB Coverage (%) | 100 | 99.8 0% | 99.4 -1% | 97.3 -3% | 99.3 -1% | 98.9 -1% |
| AdobeRGB 1998 Coverage (%) | 78.9 | 87.9 11% | 68.6 -13% | 68.5 -13% | 72.9 -8% | 71.5 -9% |
| Response Times | 5% | 20% | 17% | 25% | 3% | |
| Response Time Grey 50% / Grey 80% * (ms) | 59.2 ? | 56.4 ? 5% | 49.6 ? 16% | 50 ? 16% | 45.6 ? 23% | 60.8 ? -3% |
| Response Time Black / White * (ms) | 40.4 ? | 38.8 ? 4% | 30.8 ? 24% | 33.2 ? 18% | 29.6 ? 27% | 36.8 ? 9% |
| PWM Frequency (Hz) | 2137 ? | 29070 ? | 2500 ? | |||
| Screen | -15% | 18% | -11% | -17% | -23% | |
| Brightness middle (cd/m²) | 508.7 | 444.1 -13% | 557 9% | 607.6 19% | 399.6 -21% | 447.4 -12% |
| Brightness (cd/m²) | 479 | 423 -12% | 532 11% | 595 24% | 385 -20% | 420 -12% |
| Brightness Distribution (%) | 84 | 89 6% | 87 4% | 96 14% | 89 6% | 85 1% |
| Black Level * (cd/m²) | 0.3 | 0.37 -23% | 0.33 -10% | 0.4 -33% | 0.37 -23% | 0.31 -3% |
| Contrast (:1) | 1696 | 1200 -29% | 1688 0% | 1519 -10% | 1080 -36% | 1443 -15% |
| Colorchecker dE 2000 * | 2.72 | 2.94 -8% | 1.4 49% | 3.23 -19% | 3.2 -18% | 4.23 -56% |
| Colorchecker dE 2000 max. * | 4.7 | 7.37 -57% | 2.5 47% | 8.67 -84% | 6.44 -37% | 9.34 -99% |
| Colorchecker dE 2000 calibrated * | 1.92 | 3.05 -59% | 0.7 64% | 1.01 47% | 1.73 10% | 1.32 31% |
| Greyscale dE 2000 * | 3.4 | 2.9 15% | 2 41% | 5.5 -62% | 4.7 -38% | 6.1 -79% |
| Gamma | 2.11 104% | 2.1 105% | 2.14 103% | 2.12 104% | 2.21 100% | 2.11 104% |
| CCT | 6245 104% | 6766 96% | 6689 97% | 6413 101% | 7184 90% | 6136 106% |
| Color Space (Percent of AdobeRGB 1998) (%) | 70.7 | 78.2 11% | 62.5 -12% | 63 -11% | 66.3 -6% | 64.8 -8% |
| Color Space (Percent of sRGB) (%) | 100 | 99.8 0% | 99.5 0% | 97.5 -2% | 99.5 0% | 98.9 -1% |
| Media totale (Programma / Settaggio) | 0% /
-8% | 9% /
13% | -2% /
-7% | 0% /
-10% | -9% /
-17% |
* ... Meglio usare valori piccoli
Lo spazio colore copre tutto sRGB e circa il 70% di AdobeRGB. Non ci sono opzioni AMOLED o complete di AdobeRGB/DCI-P3 probabilmente perché tali pannelli non sono ampiamente disponibili nella dimensione dello schermo 16:10 13,4 pollici.
La temperatura del colore è leggermente troppo calda, ma questo non è nulla che il nostro colorimetro X-Rite non possa risolvere dopo una calibrazione (da 6245 a 6442 CCT). Anche i valori medi del colore e della scala di grigi DeltaE migliorerebbero solo marginalmente dopo un po' di regolazione, non diversamente dalla nostra esperienza con le configurazioni XPS 13 9310 FHD o XPS 13 9300 4K.

Tempi di risposta del Display
| ↔ Tempi di risposta dal Nero al Bianco | ||
|---|---|---|
| 40.4 ms ... aumenta ↗ e diminuisce ↘ combinato | ↗ 22.4 ms Incremento | 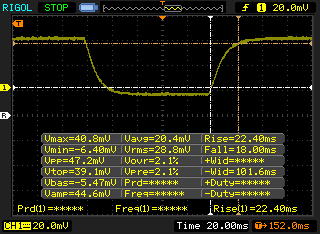 |
| ↘ 18 ms Calo | ||
| Lo schermo mostra tempi di risposta lenti nei nostri tests e sarà insoddisfacente per i gamers. In confronto, tutti i dispositivi di test variano da 0.1 (minimo) a 240 (massimo) ms. » 97 % di tutti i dispositivi è migliore. Questo significa che i tempi di risposta rilevati sono peggiori rispetto alla media di tutti i dispositivi testati (19.8 ms). | ||
| ↔ Tempo di risposta dal 50% Grigio all'80% Grigio | ||
| 59.2 ms ... aumenta ↗ e diminuisce ↘ combinato | ↗ 30 ms Incremento | 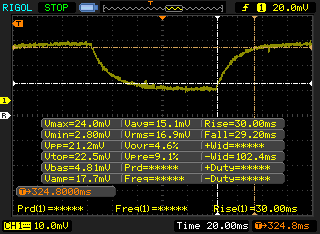 |
| ↘ 29.2 ms Calo | ||
| Lo schermo mostra tempi di risposta lenti nei nostri tests e sarà insoddisfacente per i gamers. In confronto, tutti i dispositivi di test variano da 0.165 (minimo) a 636 (massimo) ms. » 95 % di tutti i dispositivi è migliore. Questo significa che i tempi di risposta rilevati sono peggiori rispetto alla media di tutti i dispositivi testati (31 ms). | ||
Sfarfallio dello schermo / PWM (Pulse-Width Modulation)
| flickering dello schermo / PWM rilevato | 2137 Hz | ≤ 31 % settaggio luminosita' | 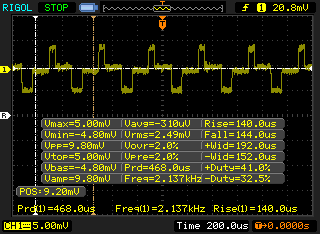 |
Il display sfarfalla a 2137 Hz (Probabilmente a causa dell'uso di PWM) Flickering rilevato ad una luminosita' di 31 % o inferiore. Non dovrebbe verificarsi flickering o PWM sopra questo valore di luminosita'. La frequenza di 2137 Hz è abbastanza alta, quindi la maggioranza degli utenti sensibili al PWM non dovrebbero notare alcun flickering. In confronto: 52 % di tutti i dispositivi testati non utilizza PWM per ridurre la luminosita' del display. Se è rilevato PWM, una media di 7781 (minimo: 5 - massimo: 343500) Hz è stata rilevata. | |||
La visibilità in ambienti aperti non è ottima se in una giornata luminosa a causa del pannello lucido. A differenza di alcuni vecchi modelli XPS 13, Dell non offre l'opzione opaca per la serie XPS 13 9310. Tuttavia, il display è generalmente abbastanza luminoso per una visione confortevole se si lavora all'ombra.


Prestazioni
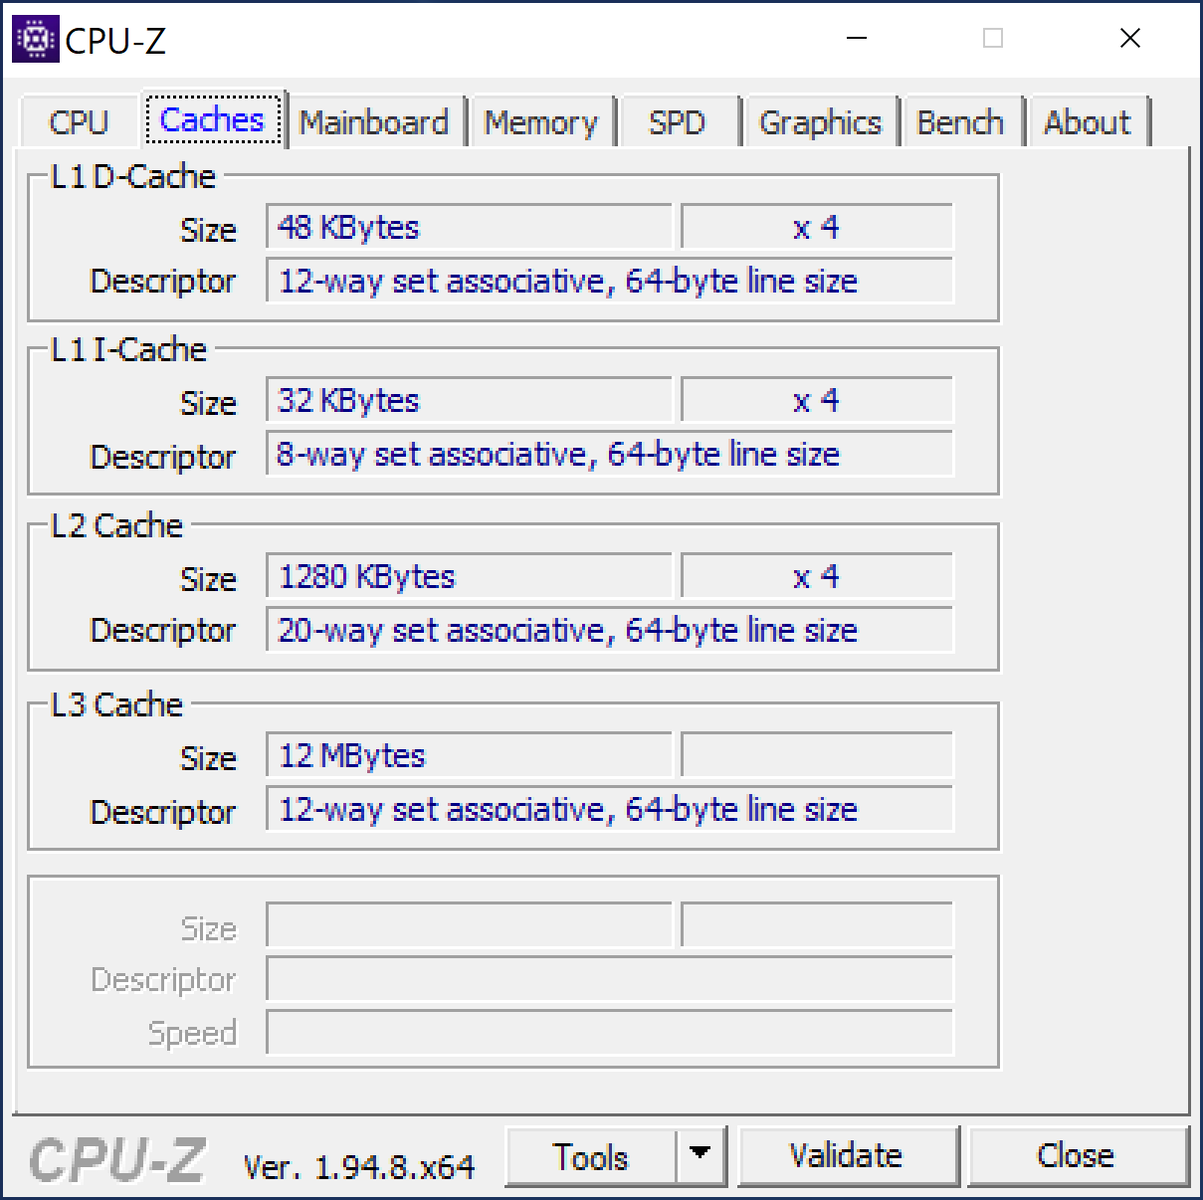
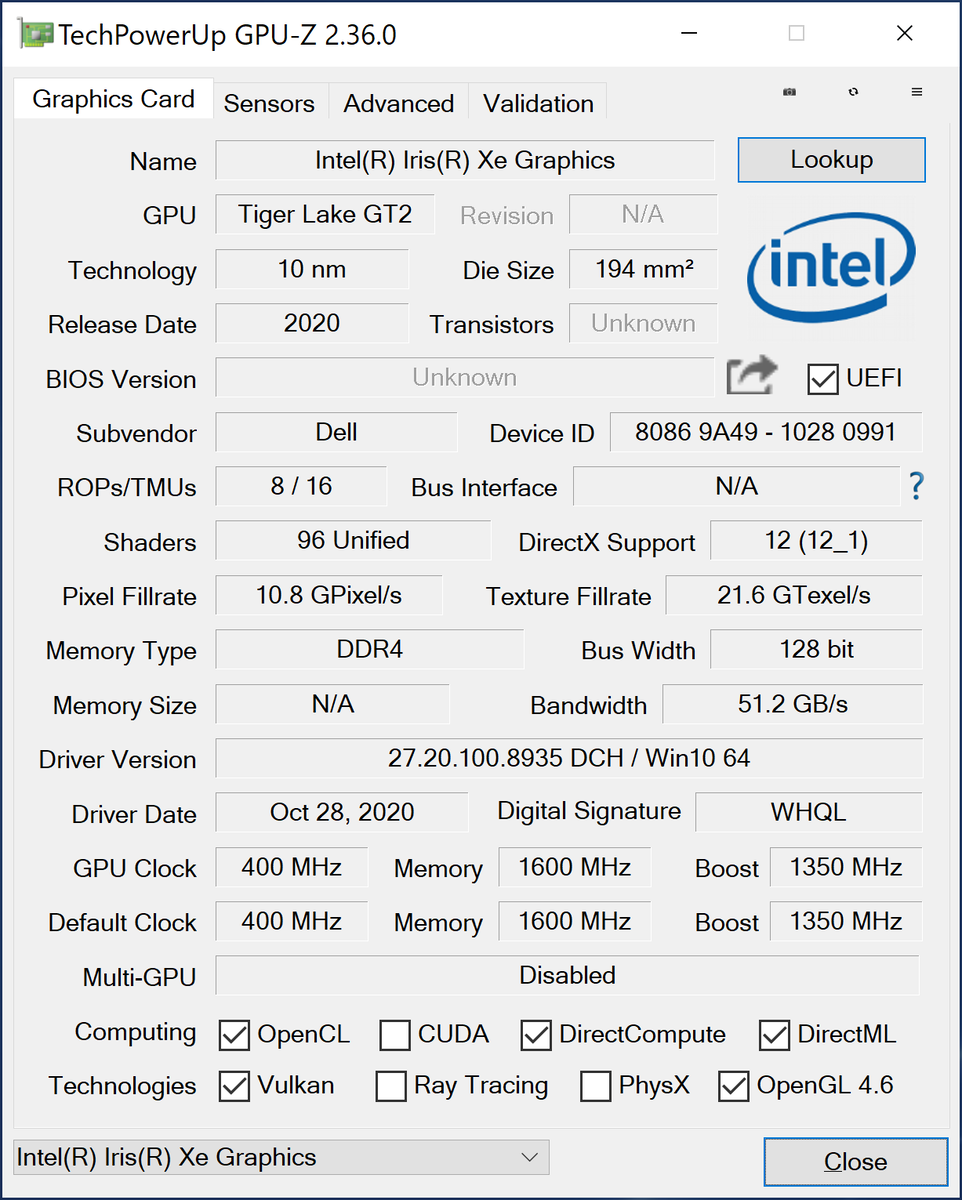
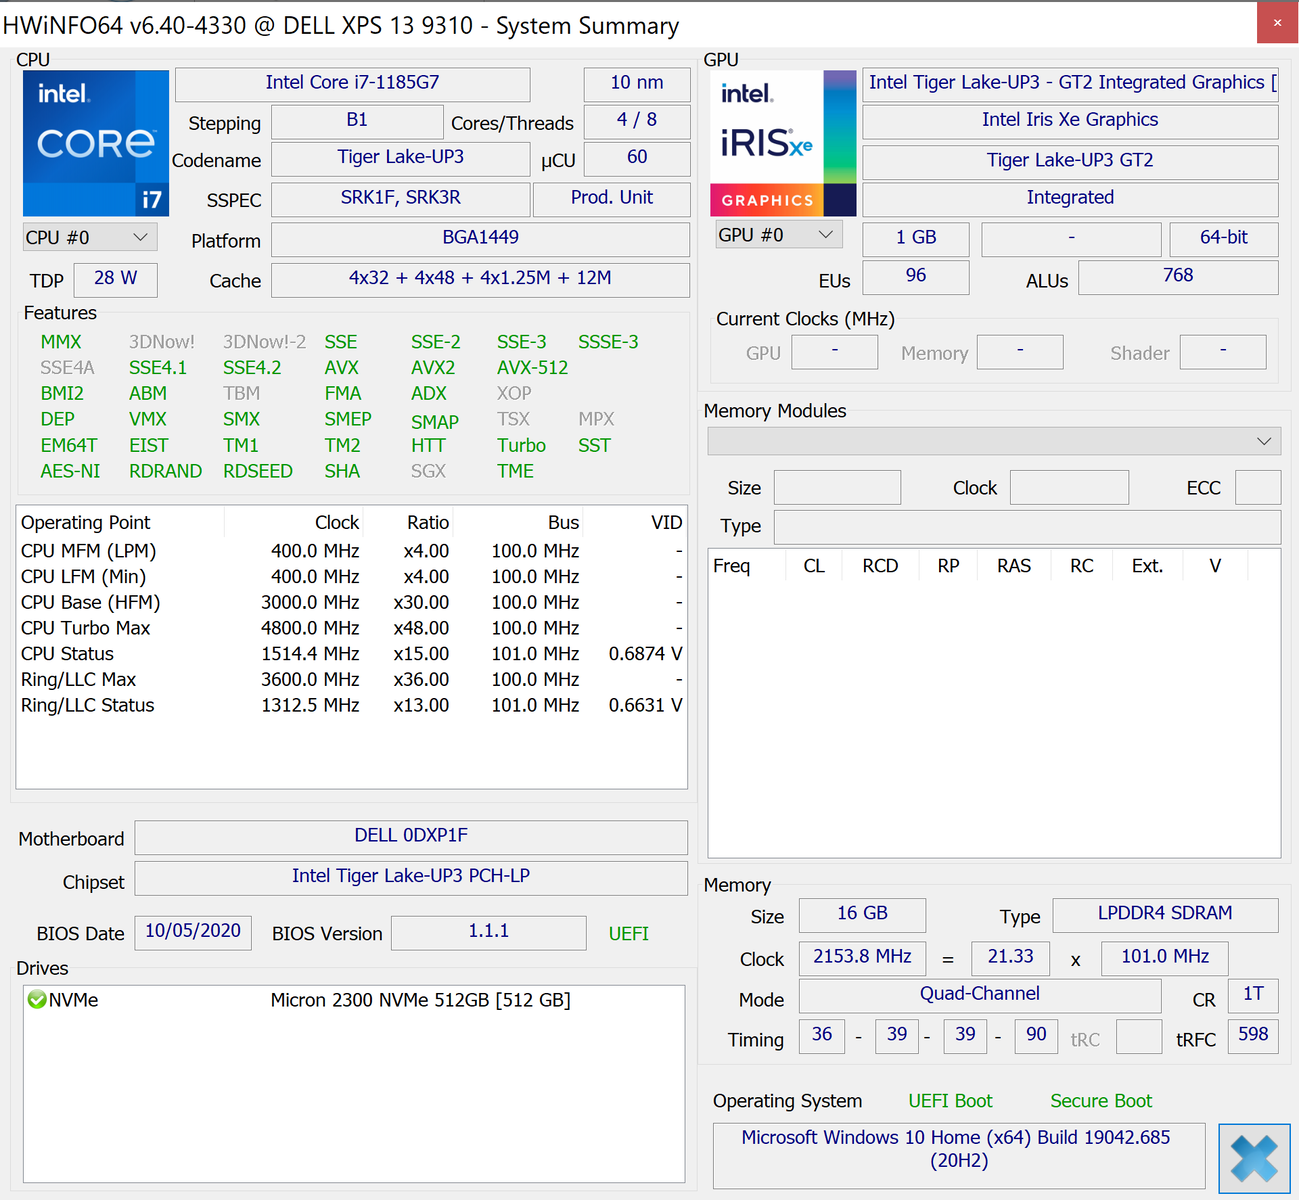
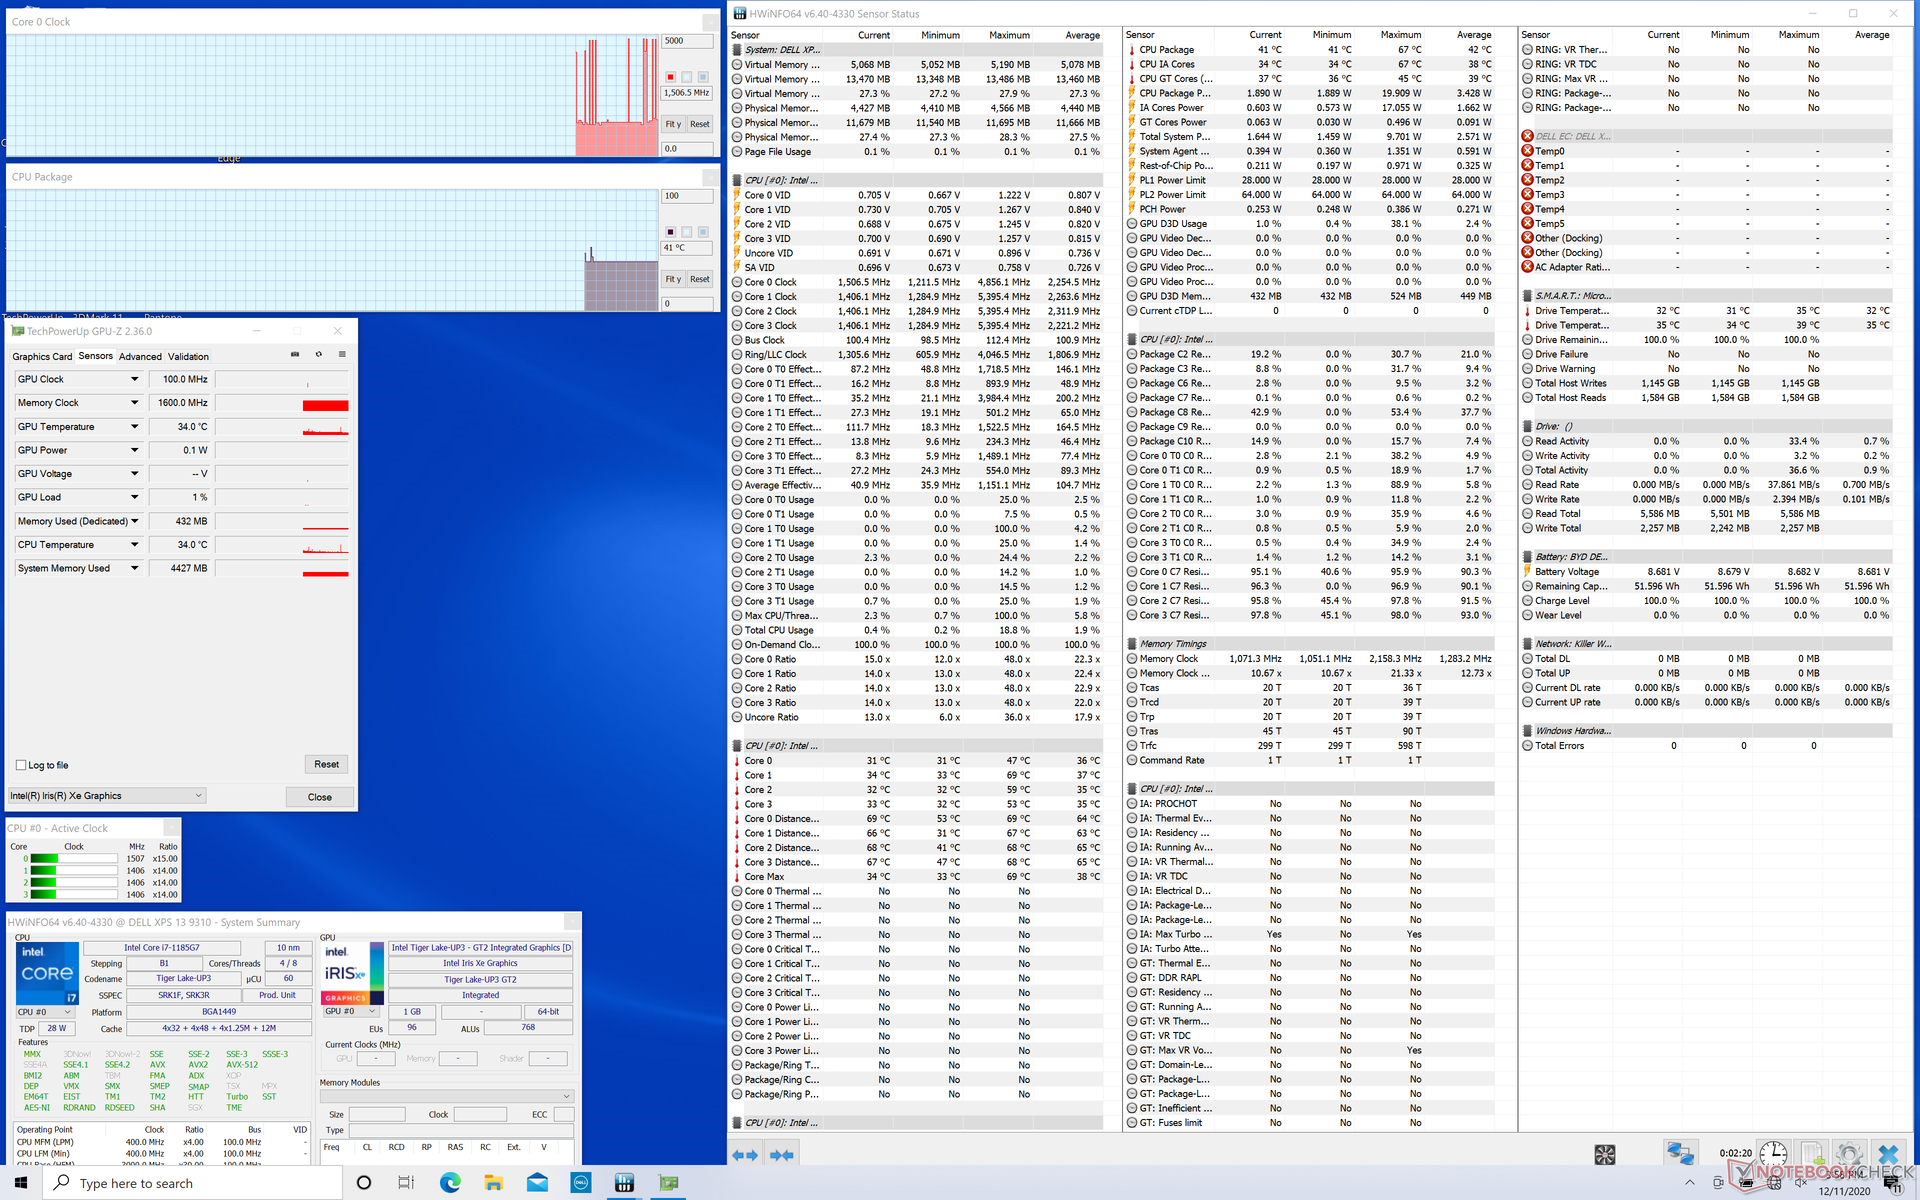
Sulla carta, il Core i7-1185G7 ha valori di clock di base leggermente più veloci e valori di clock Turbo Boost rispetto al Core i7-1165G7 (da 3,0 a 4,8 GHz contro 2,8 a 4,7 GHz). In pratica, tuttavia, dimostreremo che queste specifiche non significano molto quando entrambi i processori sono alla mercé della stessa soluzione di raffreddamento dello chassis. Non ci sono altre differenze sostanziali tra i due processori, in quanto le dimensioni della cache, il range TDP e il numero di cores sono identici. La GPU-Z riporta alcune leggere differenze di riempimento tra le GPU Iris Xe integrate, ma niente di significativo.
Abbiamo impostato la nostra unità in modalità Ultra Performance tramite il software Dell Power Manager prima di eseguire qualsiasi test di performance qui sotto per ottenere i migliori valori possibili. I proprietari dovrebbero familiarizzare con questo software, dato che molte opzioni specifiche per XPS si trovano qui.
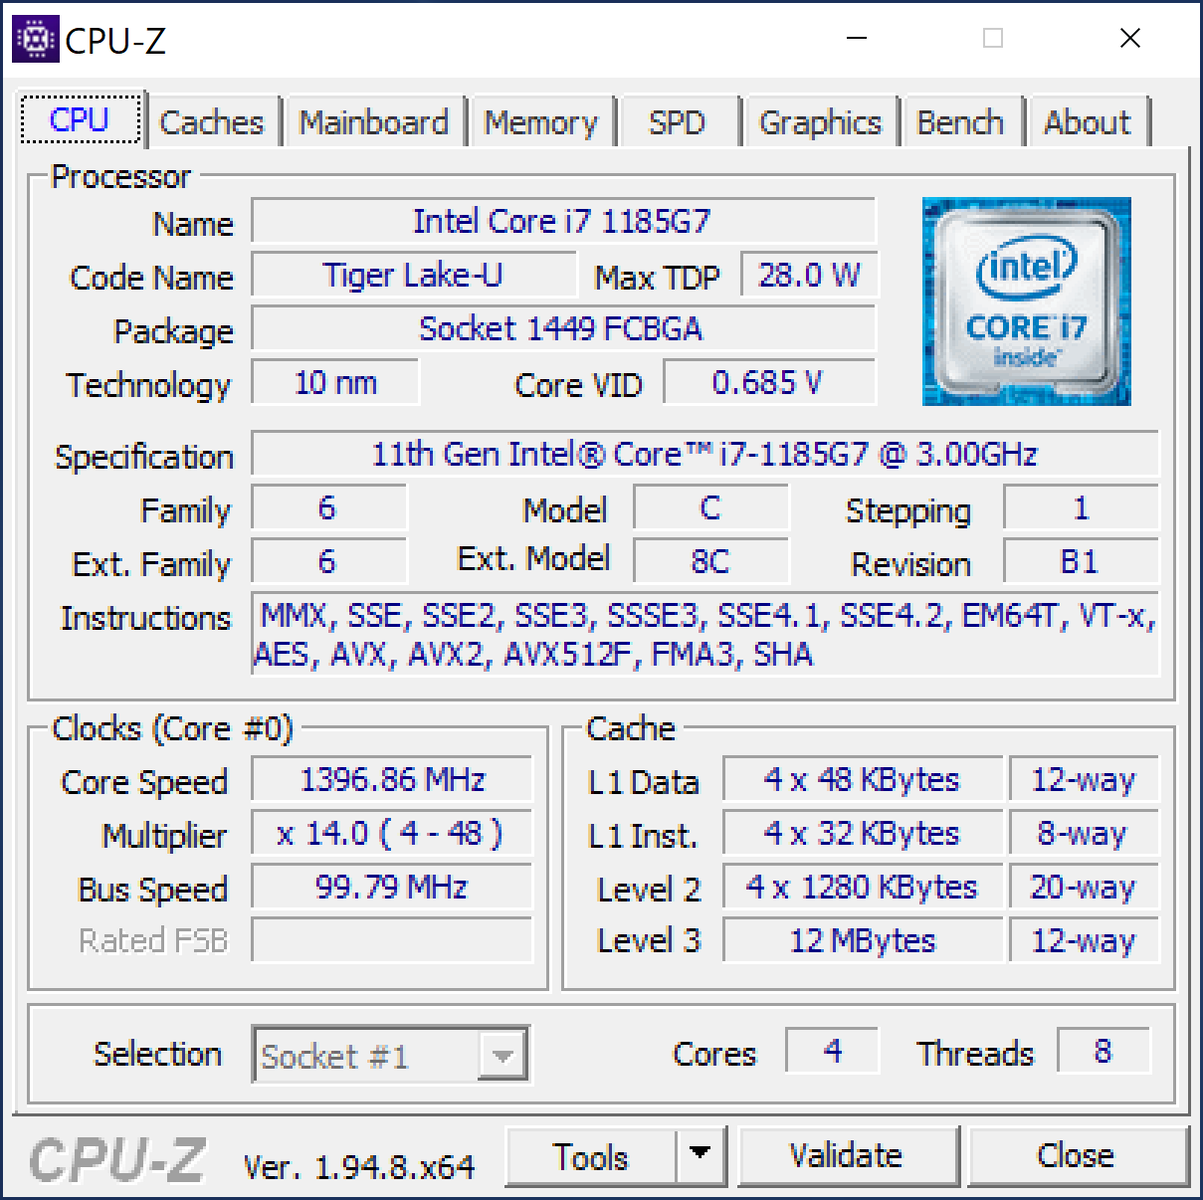
Processore
Proprio come abbiamo osservato tra XPS 15 Core i7-8750H e XPS 15 Core i9-8950HK, le differenze di prestazioni tra le nostre configurazioni XPS 13 Core i7-1185G7 e Core i7-1165G7 sono minime nel migliore dei casi. I risultati del benchmark sono quasi identici tra di loro al punto che il Core i7-1165G7 può a volte superare il Core i7-1185G7 come nella codifica HWBOT x265. Quando si esegue CineBench R15 xT in un loop, si verificano le stesse fluttuazioni del valore di clock per i punteggi instabili dovuti all'implementazione della Dynamic Power Policy di Dell.
Peccato che l'XPS 13 non offra le opzioni AMD Ryzen, poiché i Ryzen 5 4500U o Ryzen 7 4700U hanno prestazioni multi-thread ancora più veloci rispetto a queste CPU Intel Tiger Lake, anche se a costo di prestazioni single-thread più lente.
Cinebench R15: CPU Multi 64Bit | CPU Single 64Bit
Blender: v2.79 BMW27 CPU
7-Zip 18.03: 7z b 4 -mmt1 | 7z b 4
Geekbench 5.5: Single-Core | Multi-Core
HWBOT x265 Benchmark v2.2: 4k Preset
LibreOffice : 20 Documents To PDF
R Benchmark 2.5: Overall mean
| LibreOffice / 20 Documents To PDF | |
| Dell XPS 13 9300 4K UHD | |
| Lenovo Yoga Slim 7 14ARE05 82A20008GE | |
| HP Envy x360 13-ay0010nr | |
| Lenovo Yoga Slim 7-14ARE | |
| Huawei MateBook X Pro 2020 i7 | |
| Media Intel Core i7-1185G7 (41.3 - 61.7, n=26) | |
| Razer Book 13 FHD | |
| Asus Zenbook S UX393JA | |
| Dell XPS 13 9310 Core i7 4K | |
| Dell XPS 13 9310 Core i7 FHD | |
Cinebench R15: CPU Multi 64Bit | CPU Single 64Bit
Blender: v2.79 BMW27 CPU
7-Zip 18.03: 7z b 4 -mmt1 | 7z b 4
Geekbench 5.5: Single-Core | Multi-Core
HWBOT x265 Benchmark v2.2: 4k Preset
LibreOffice : 20 Documents To PDF
R Benchmark 2.5: Overall mean
* ... Meglio usare valori piccoli
Prestazioni di sistema
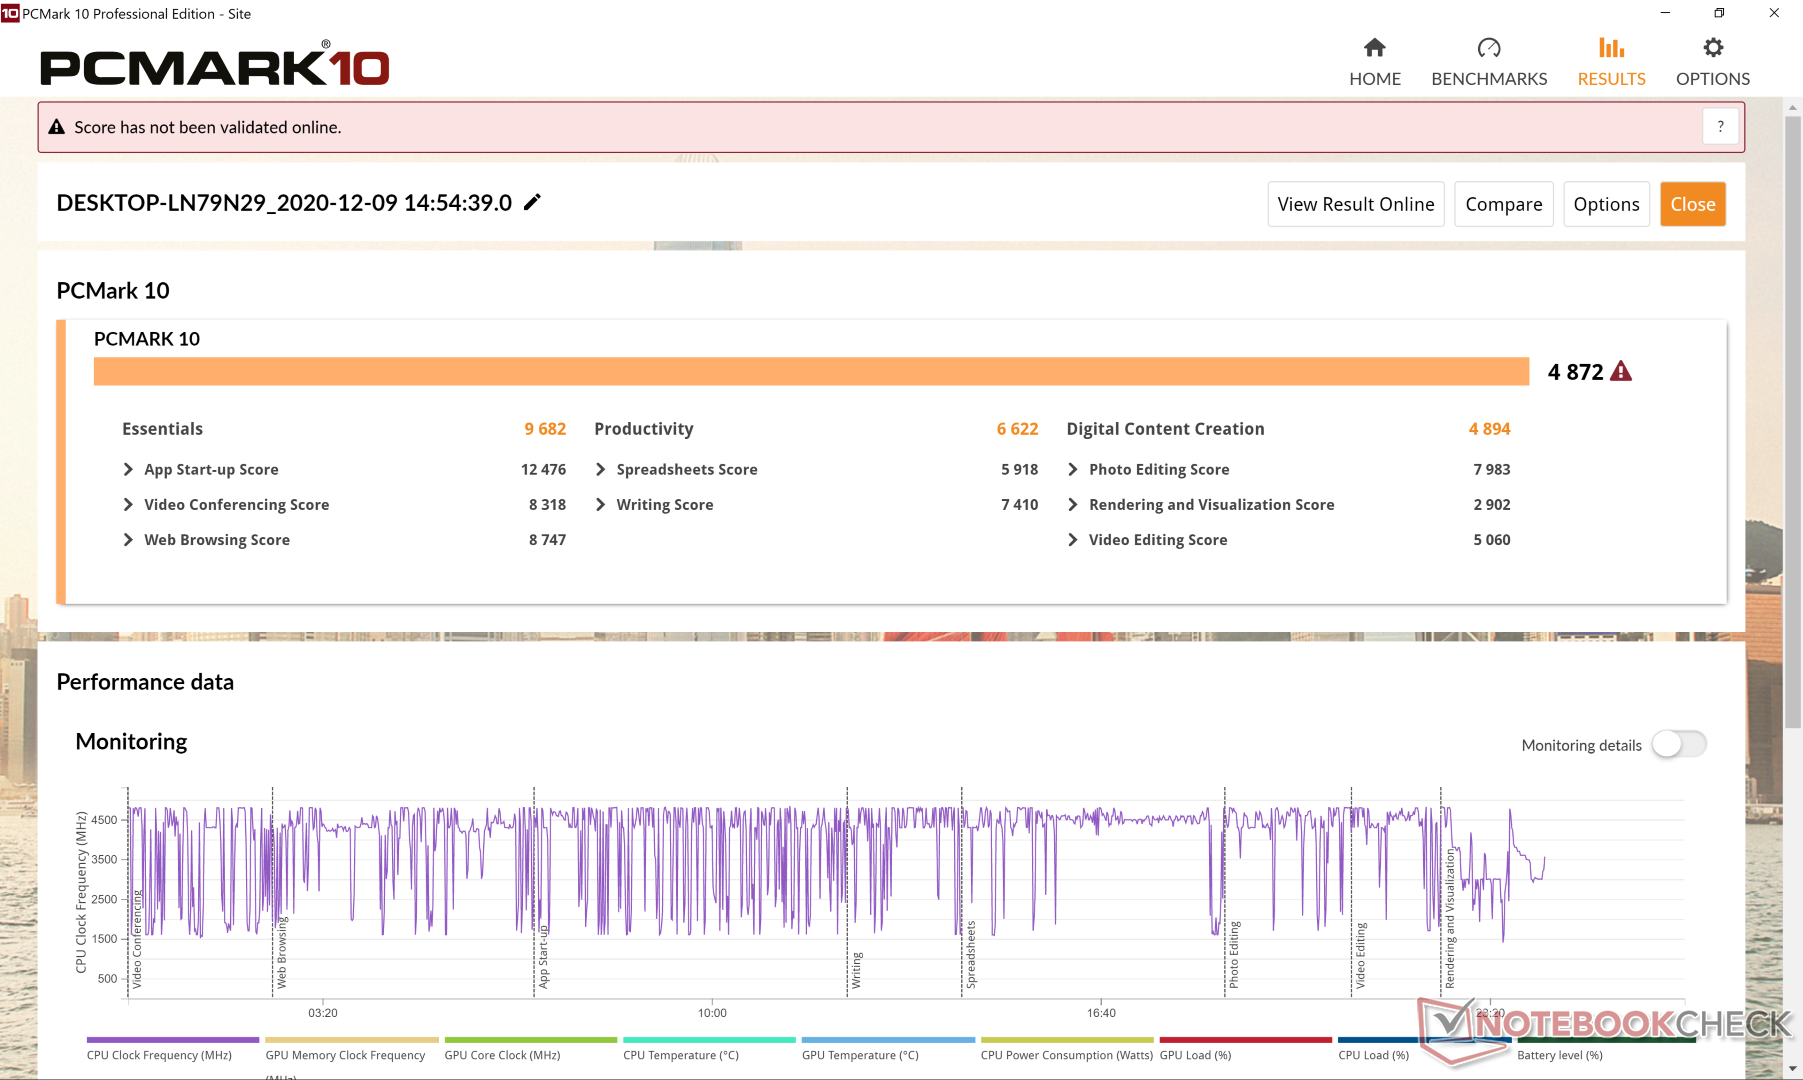
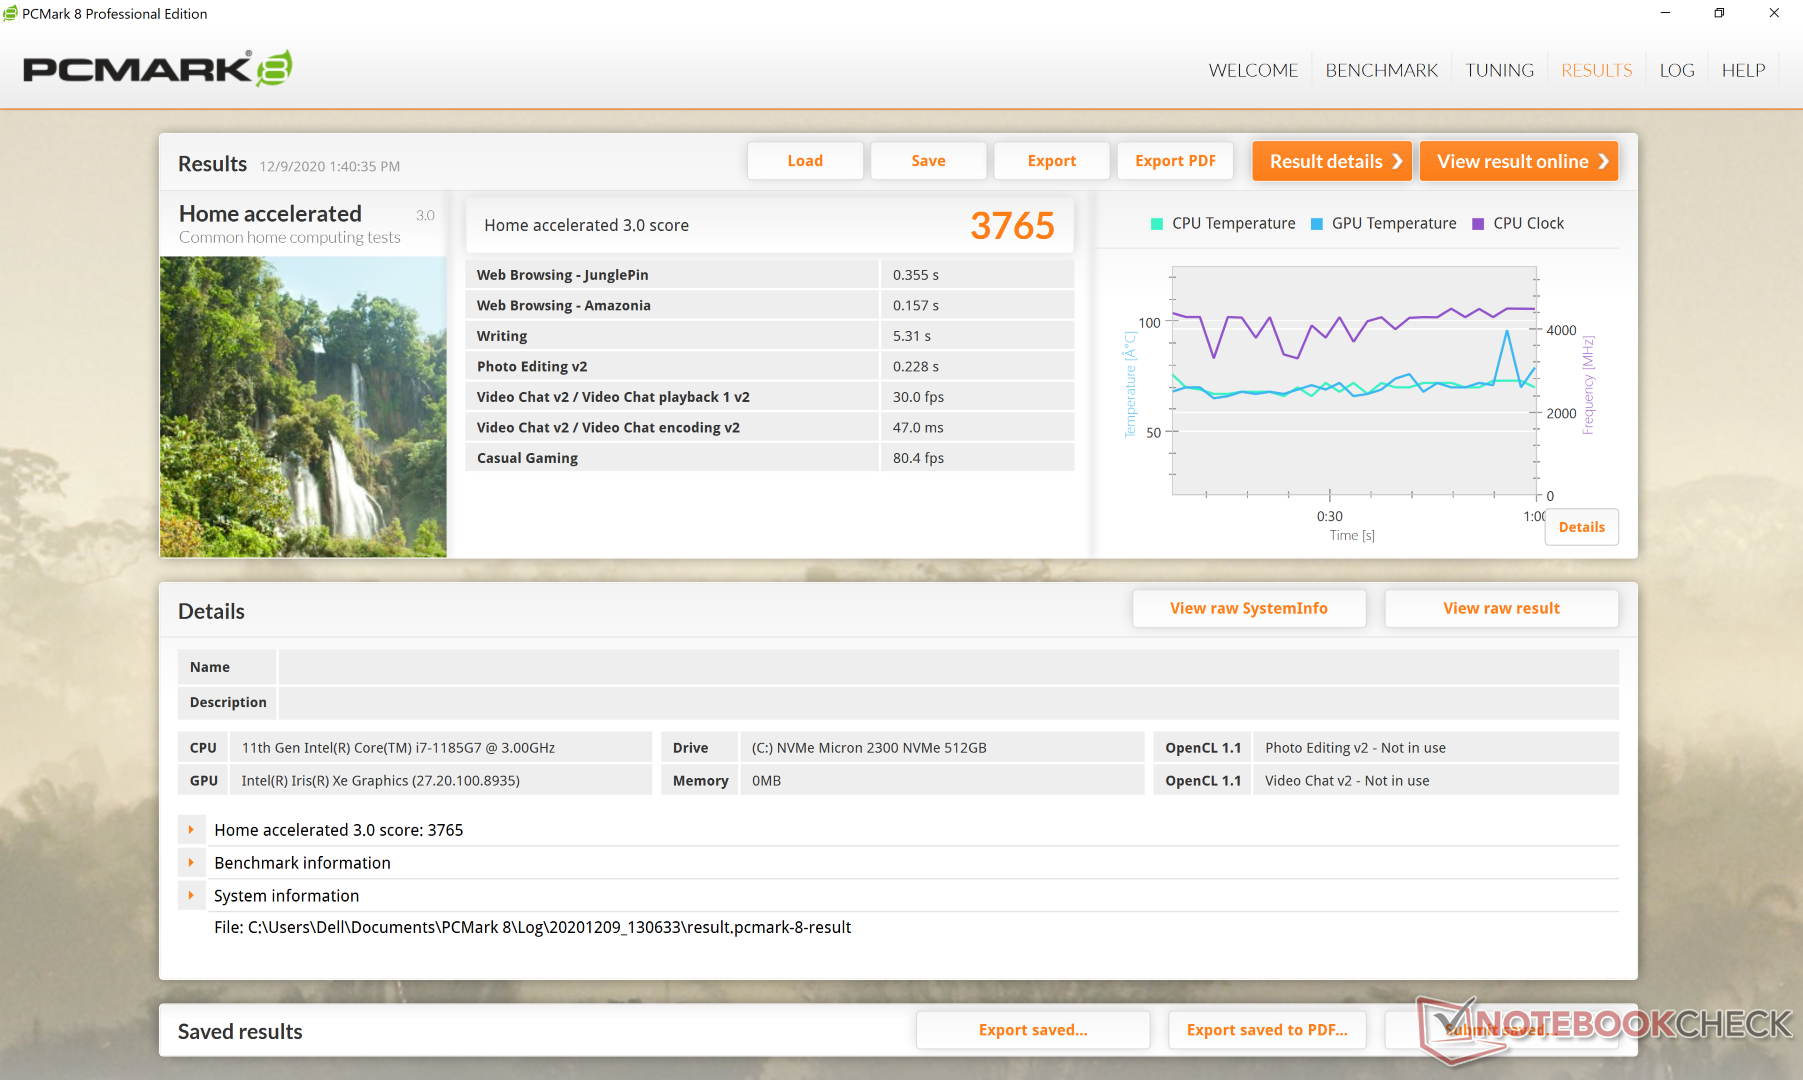
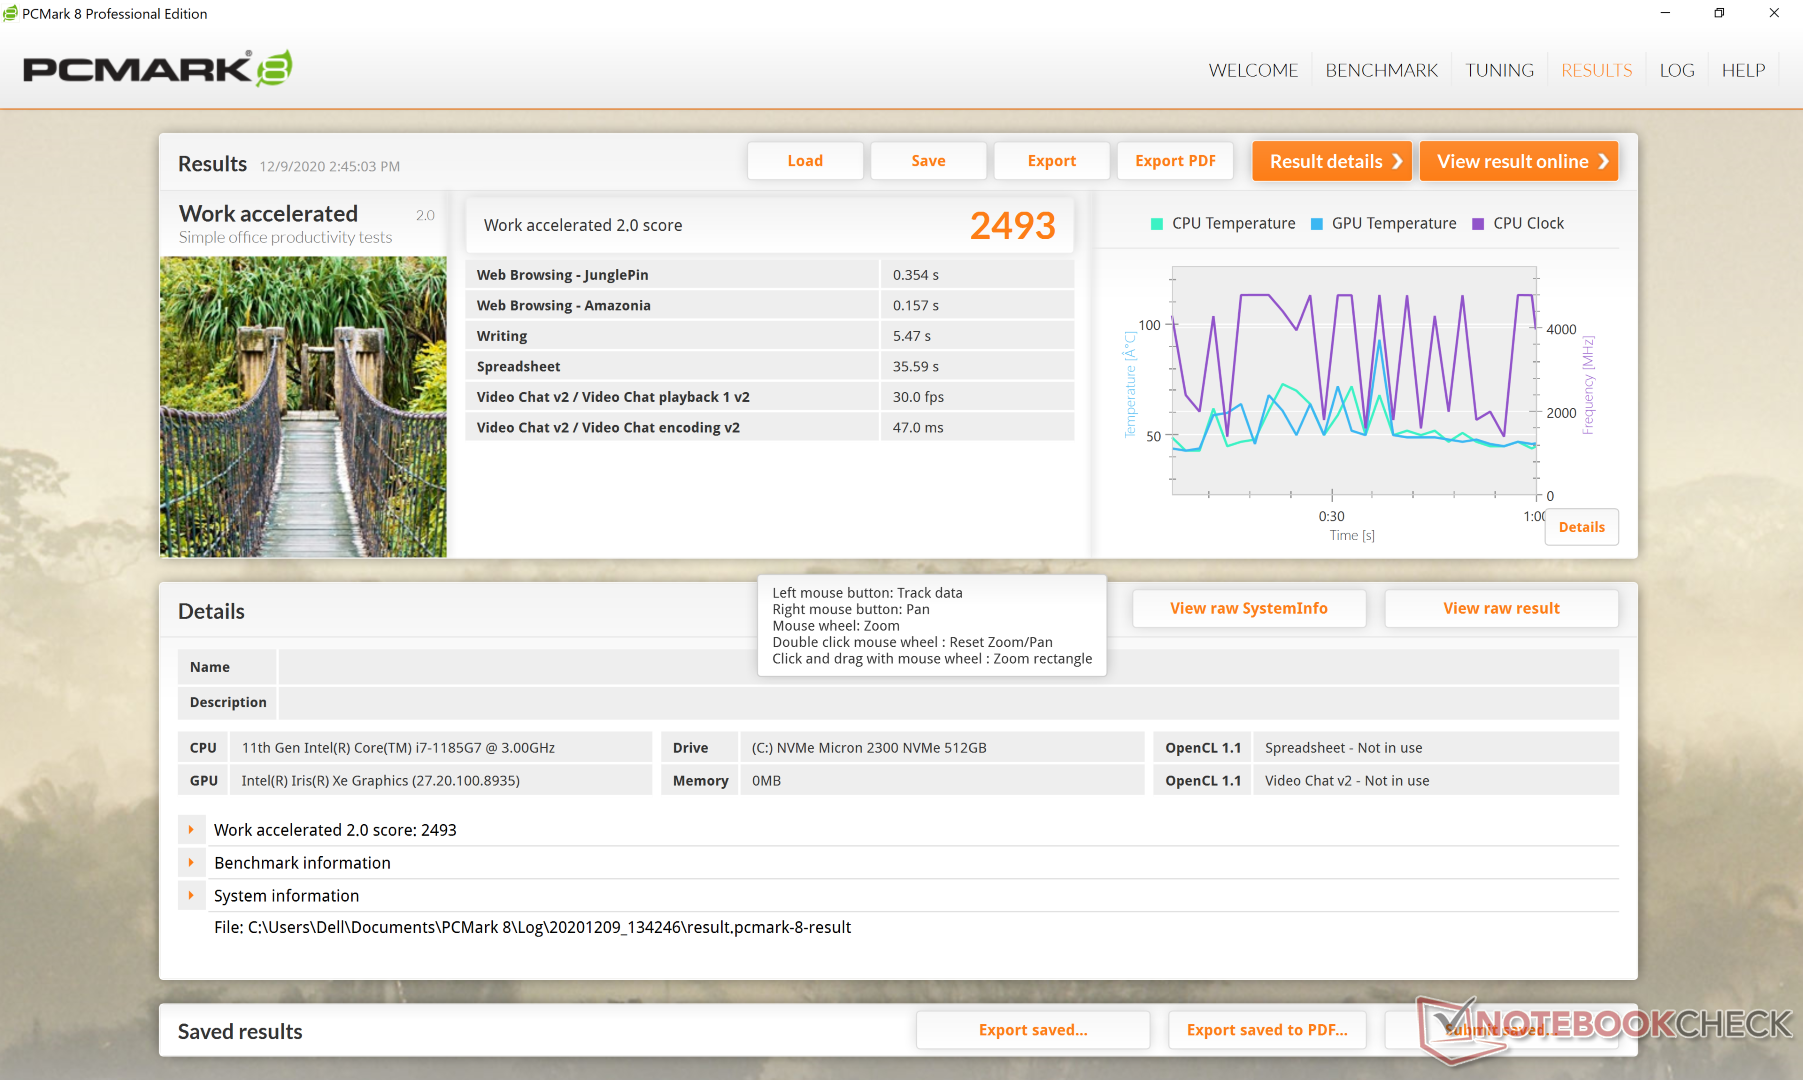
| PCMark 8 Home Score Accelerated v2 | 3765 punti | |
| PCMark 8 Work Score Accelerated v2 | 2493 punti | |
| PCMark 10 Score | 4872 punti | |
Aiuto | ||
Latenza DPC
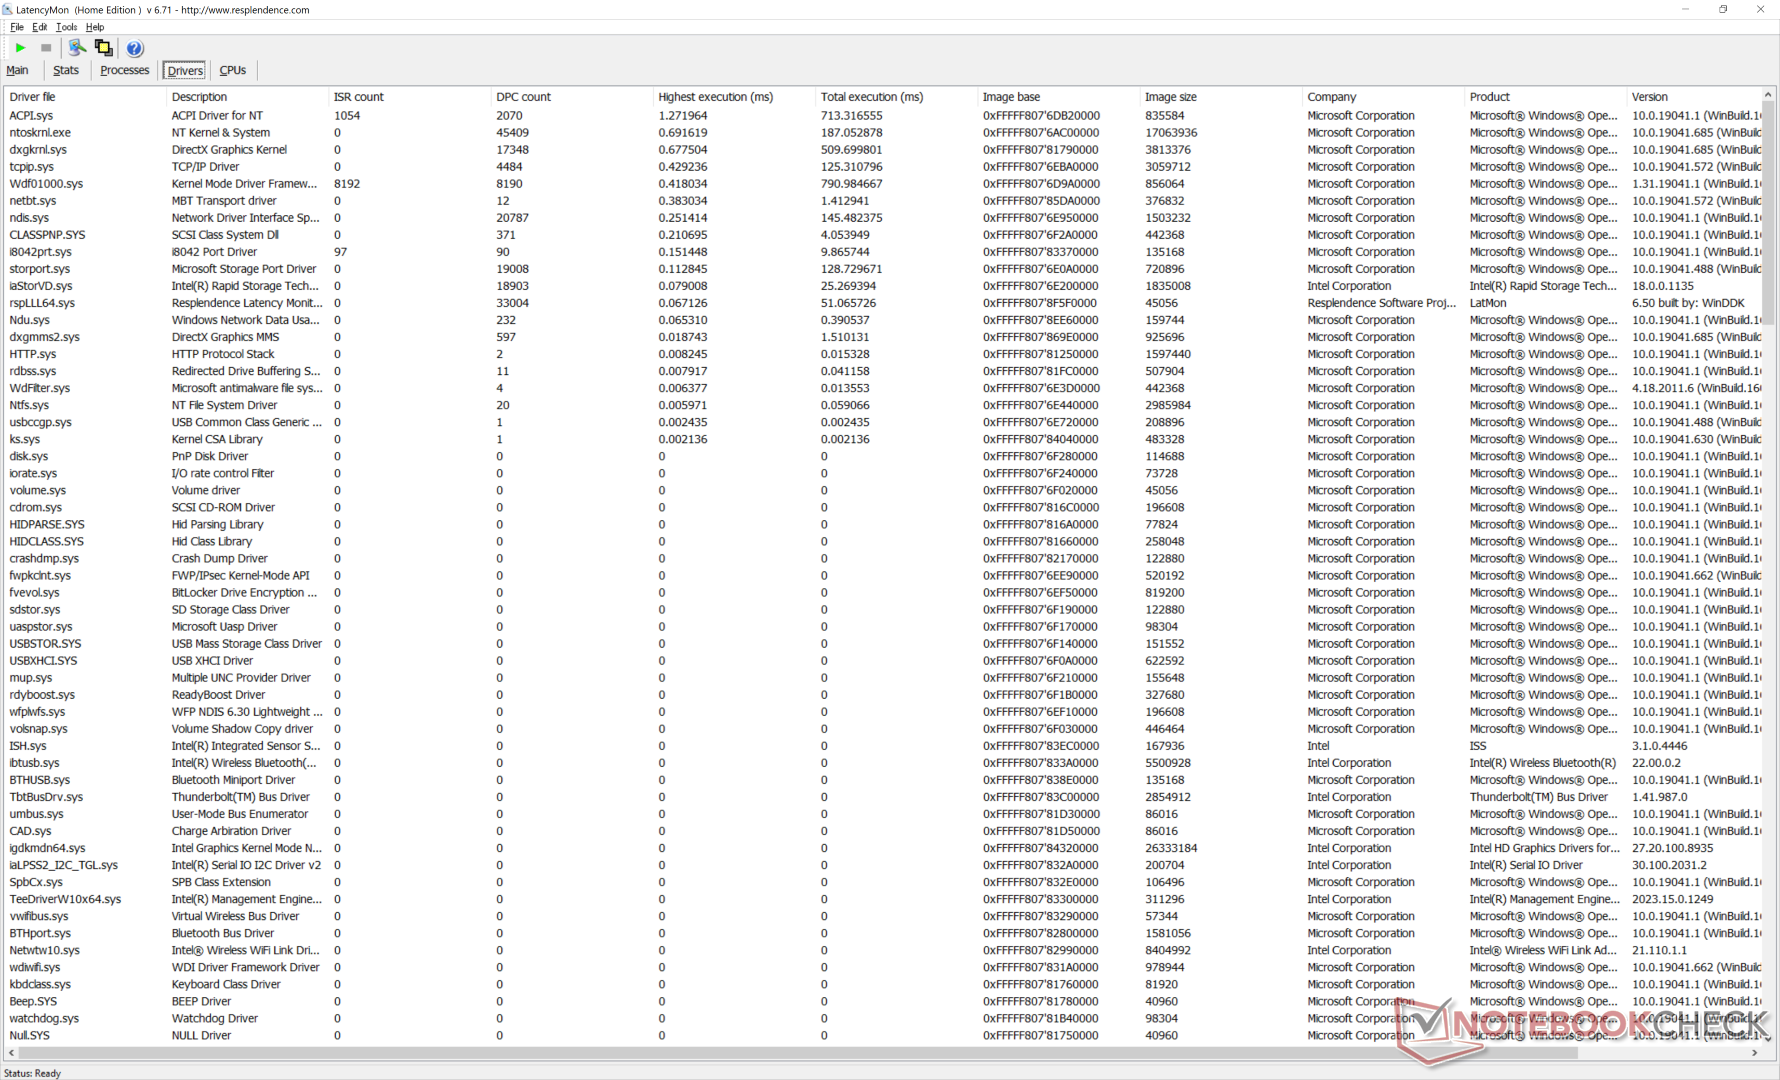
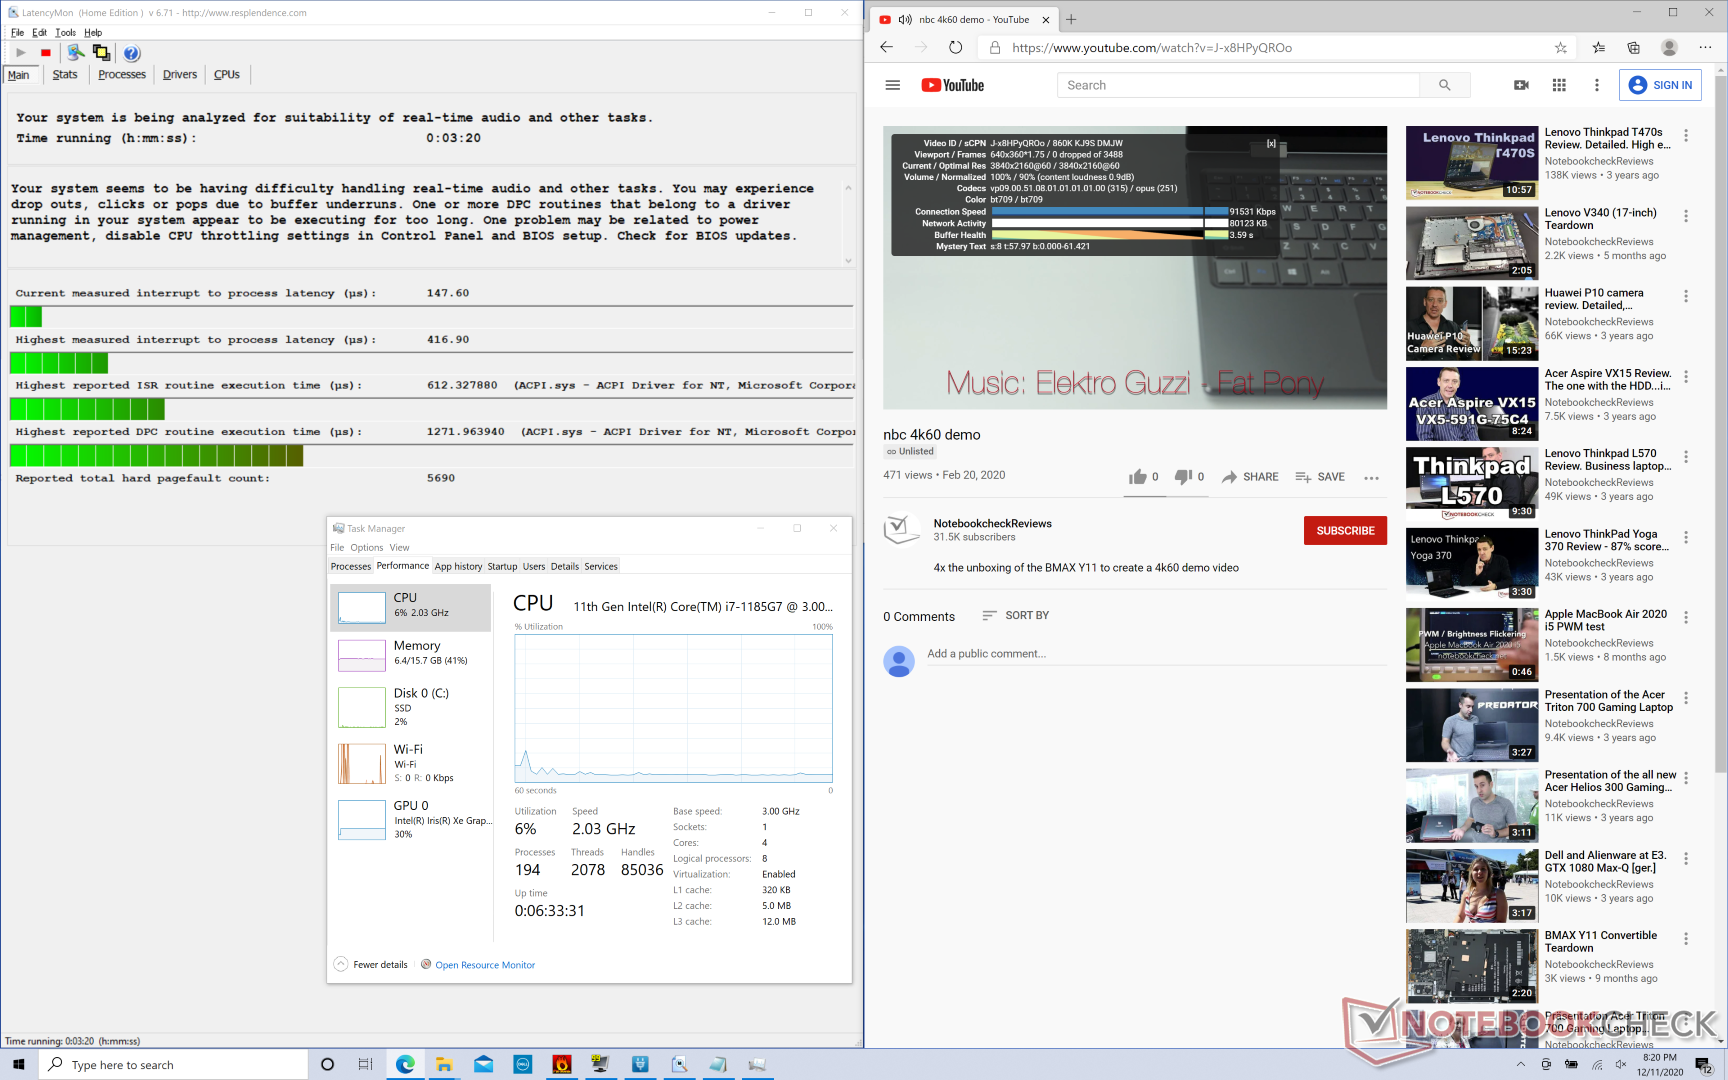
| DPC Latencies / LatencyMon - interrupt to process latency (max), Web, Youtube, Prime95 | |
| Dell XPS 13 9300 Core i7-1065G7 | |
| Asus Zenbook S UX393JA | |
| Lenovo Yoga Slim 7-14ARE | |
| Dell XPS 13 9310 Core i7 4K | |
| Dell XPS 13 9310 Core i7 FHD | |
* ... Meglio usare valori piccoli
Dispositivi di memorizzazione
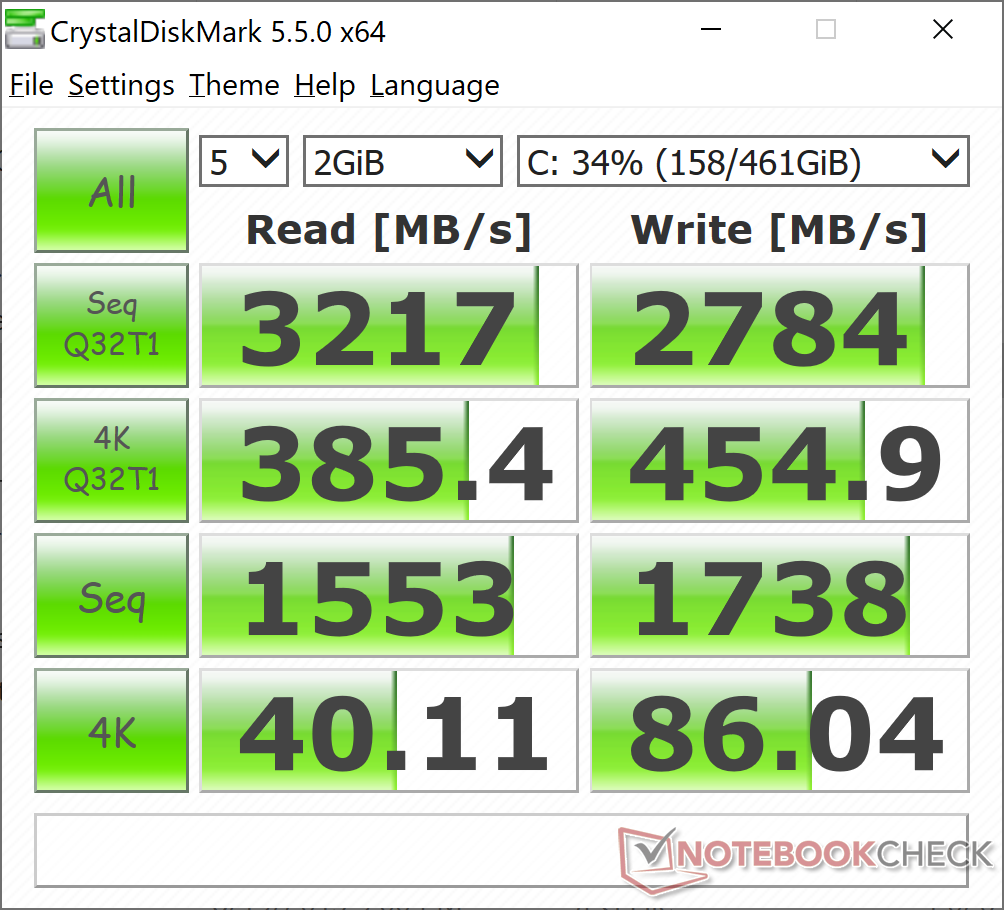
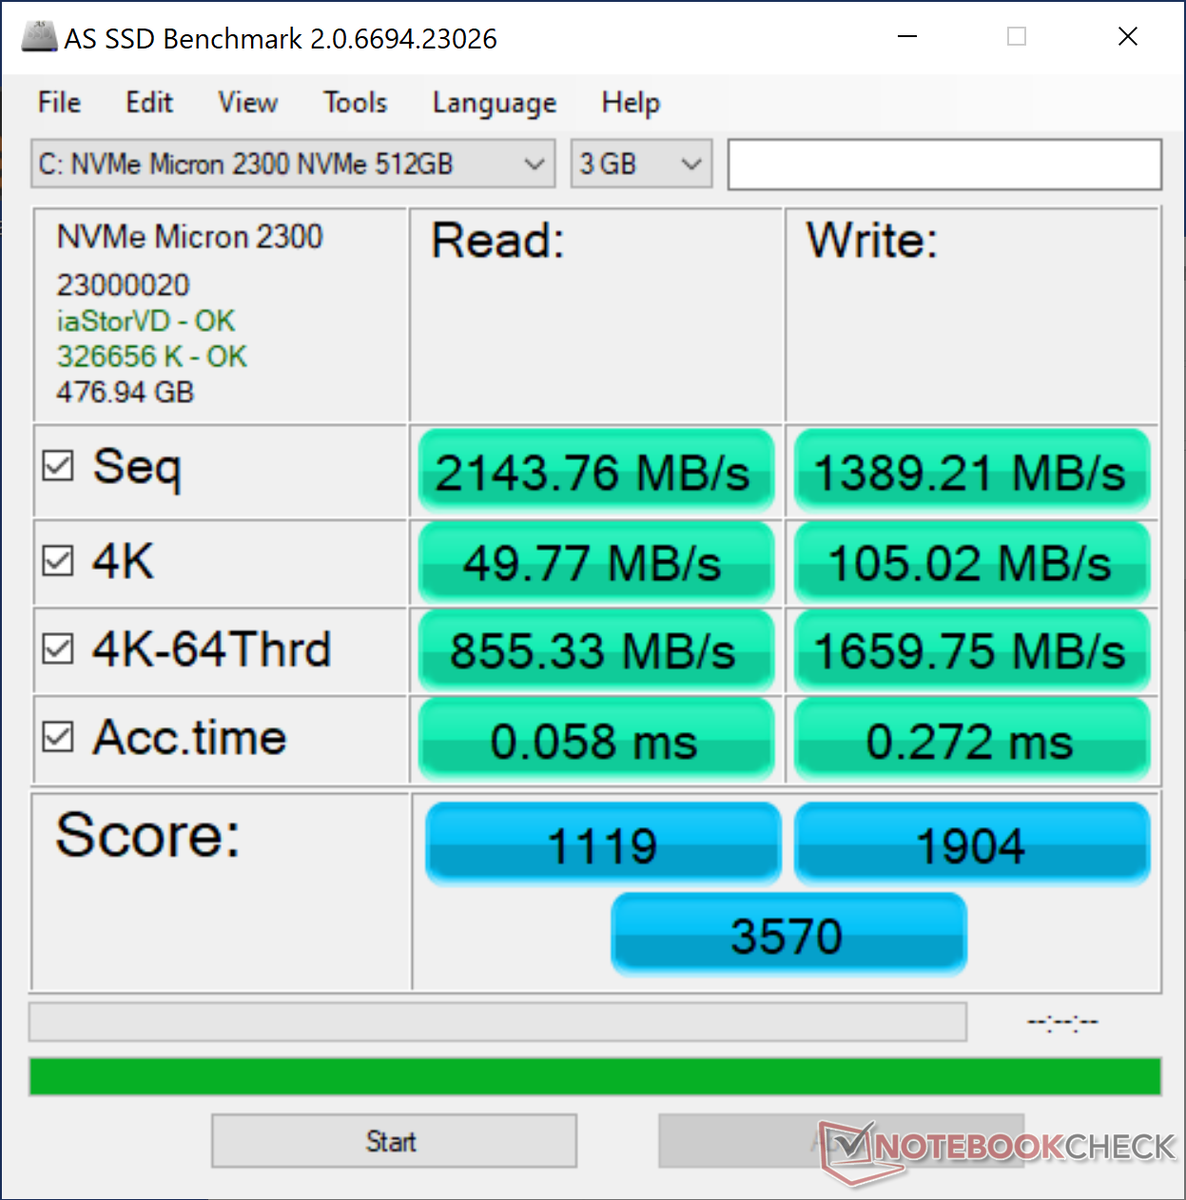
| Dell XPS 13 9310 Core i7 4K Micron 2300 512GB MTFDHBA512TDV | Asus Zenbook S UX393JA Intel SSD 660p 1TB SSDPEKNW010T8 | Huawei MateBook X Pro 2020 i7 Samsung PM981a MZVLB1T0HBLR | Dell XPS 13 9300 Core i7-1065G7 Intel SSDPEMKF512G8 NVMe SSD | Lenovo Yoga Slim 7-14ARE Samsung SSD PM981a MZVLB512HBJQ | HP Spectre x360 13-aw0013dx Intel Optane Memory H10 with Solid State Storage 32GB + 512GB HBRPEKNX0202A(L/H) | |
|---|---|---|---|---|---|---|
| AS SSD | -16% | 45% | -21% | 23% | -36% | |
| Seq Read (MB/s) | 2144 | 1405 -34% | 2737 28% | 1956 -9% | 1658 -23% | 1039 -52% |
| Seq Write (MB/s) | 1389 | 1062 -24% | 2530 82% | 1227 -12% | 2464 77% | 310.1 -78% |
| 4K Read (MB/s) | 49.77 | 50.8 2% | 54 8% | 63 27% | 59.5 20% | 76 53% |
| 4K Write (MB/s) | 105 | 124.9 19% | 152.5 45% | 156.6 49% | 128.6 22% | 118 12% |
| 4K-64 Read (MB/s) | 855 | 590 -31% | 2011 135% | 475.6 -44% | 1576 84% | 371.8 -57% |
| 4K-64 Write (MB/s) | 1660 | 840 -49% | 1260 -24% | 539 -68% | 1986 20% | 469.5 -72% |
| Access Time Read * (ms) | 0.058 | 0.041 29% | 0.066 -14% | 0.042 28% | 0.049 16% | 0.067 -16% |
| Access Time Write * (ms) | 0.272 | 0.118 57% | 0.024 91% | 0.105 61% | 0.087 68% | 0.138 49% |
| Score Read (Points) | 1119 | 781 -30% | 2339 109% | 734 -34% | 1802 61% | 552 -51% |
| Score Write (Points) | 1904 | 1071 -44% | 1666 -12% | 818 -57% | 2361 24% | 618 -68% |
| Score Total (Points) | 3570 | 2251 -37% | 5191 45% | 1915 -46% | 5133 44% | 1448 -59% |
| Copy ISO MB/s (MB/s) | 1929 | 1459 -24% | 1022 -47% | 1588 -18% | 764 -60% | |
| Copy Program MB/s (MB/s) | 1012 | 600 -41% | 302.8 -70% | 550 -46% | 465.8 -54% | |
| Copy Game MB/s (MB/s) | 1737 | 1411 -19% | 491.4 -72% | 1329 -23% | 764 -56% | |
| CrystalDiskMark 5.2 / 6 | -6% | 24% | 27% | 35% | 6% | |
| Write 4K (MB/s) | 86 | 129.5 51% | 165.6 93% | 186.8 117% | 146.1 70% | 112.6 31% |
| Read 4K (MB/s) | 40.11 | 54 35% | 50.2 25% | 71.4 78% | 47.18 18% | 131 227% |
| Write Seq (MB/s) | 1738 | 1265 -27% | 1905 10% | 1203 -31% | 2896 67% | 458.9 -74% |
| Read Seq (MB/s) | 1553 | 1410 -9% | 1669 7% | 2600 67% | 2754 77% | 1355 -13% |
| Write 4K Q32T1 (MB/s) | 454.9 | 420.3 -8% | 474.6 4% | 514 13% | 425.8 -6% | 341.3 -25% |
| Read 4K Q32T1 (MB/s) | 385.4 | 357.7 -7% | 508 32% | 570 48% | 514 33% | 320.6 -17% |
| Write Seq Q32T1 (MB/s) | 2784 | 1799 -35% | 3007 8% | 786 -72% | 2989 7% | 1219 -56% |
| Read Seq Q32T1 (MB/s) | 3217 | 1616 -50% | 3556 11% | 2947 -8% | 3568 11% | 2462 -23% |
| Media totale (Programma / Settaggio) | -11% /
-13% | 35% /
36% | 3% /
-4% | 29% /
27% | -15% /
-21% |
* ... Meglio usare valori piccoli

Throttling Disco: DiskSpd Read Loop, Queue Depth 8
Prestazioni della GPU
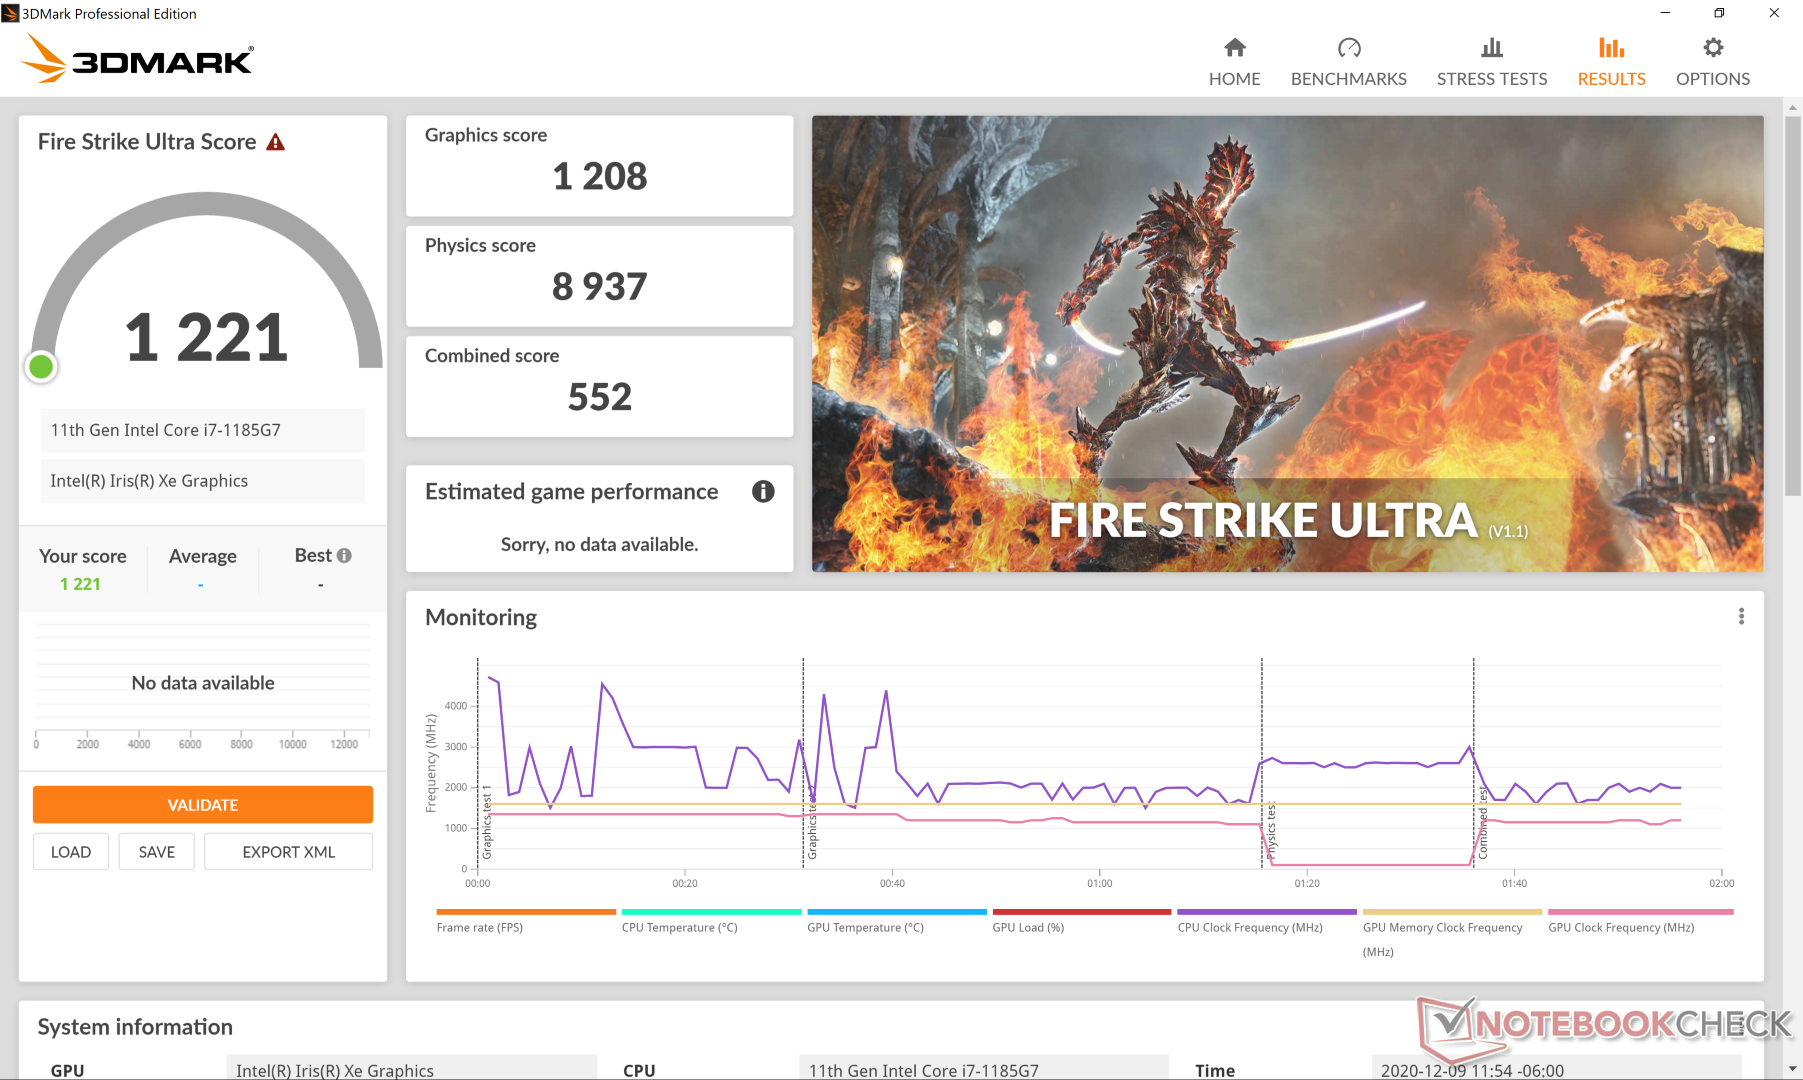
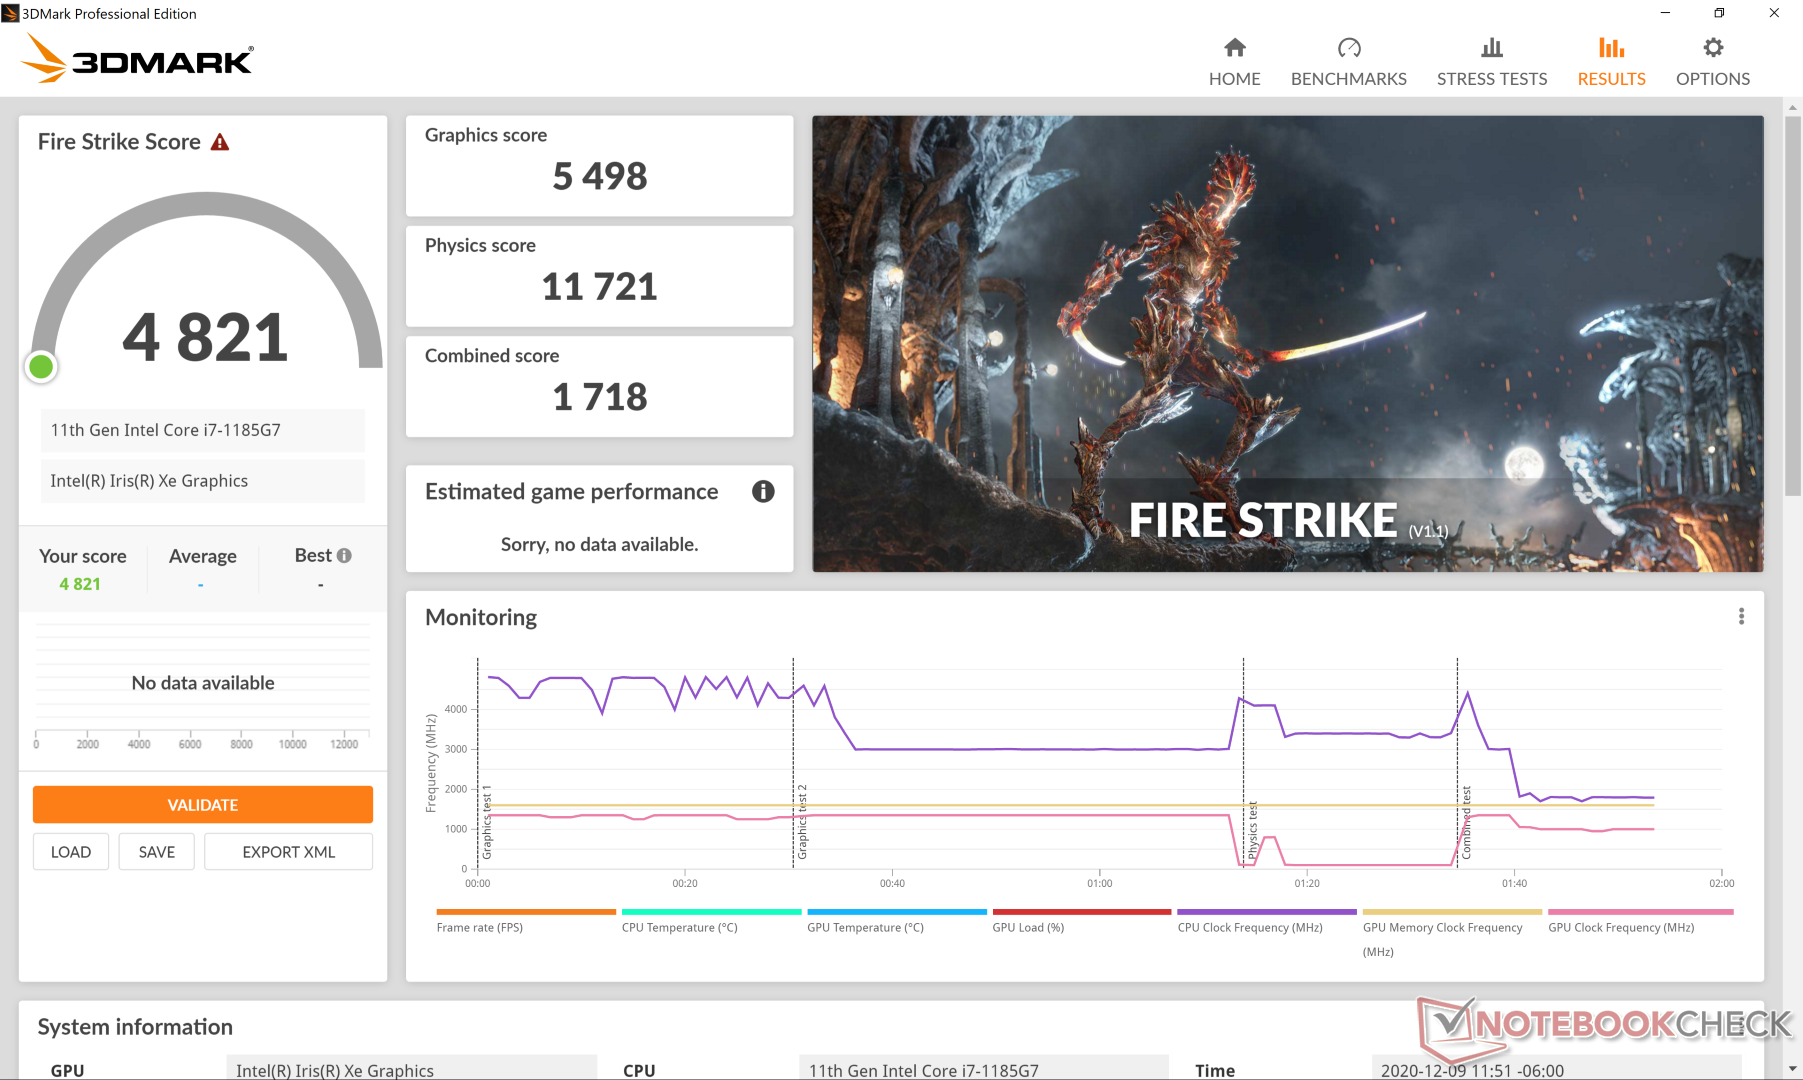
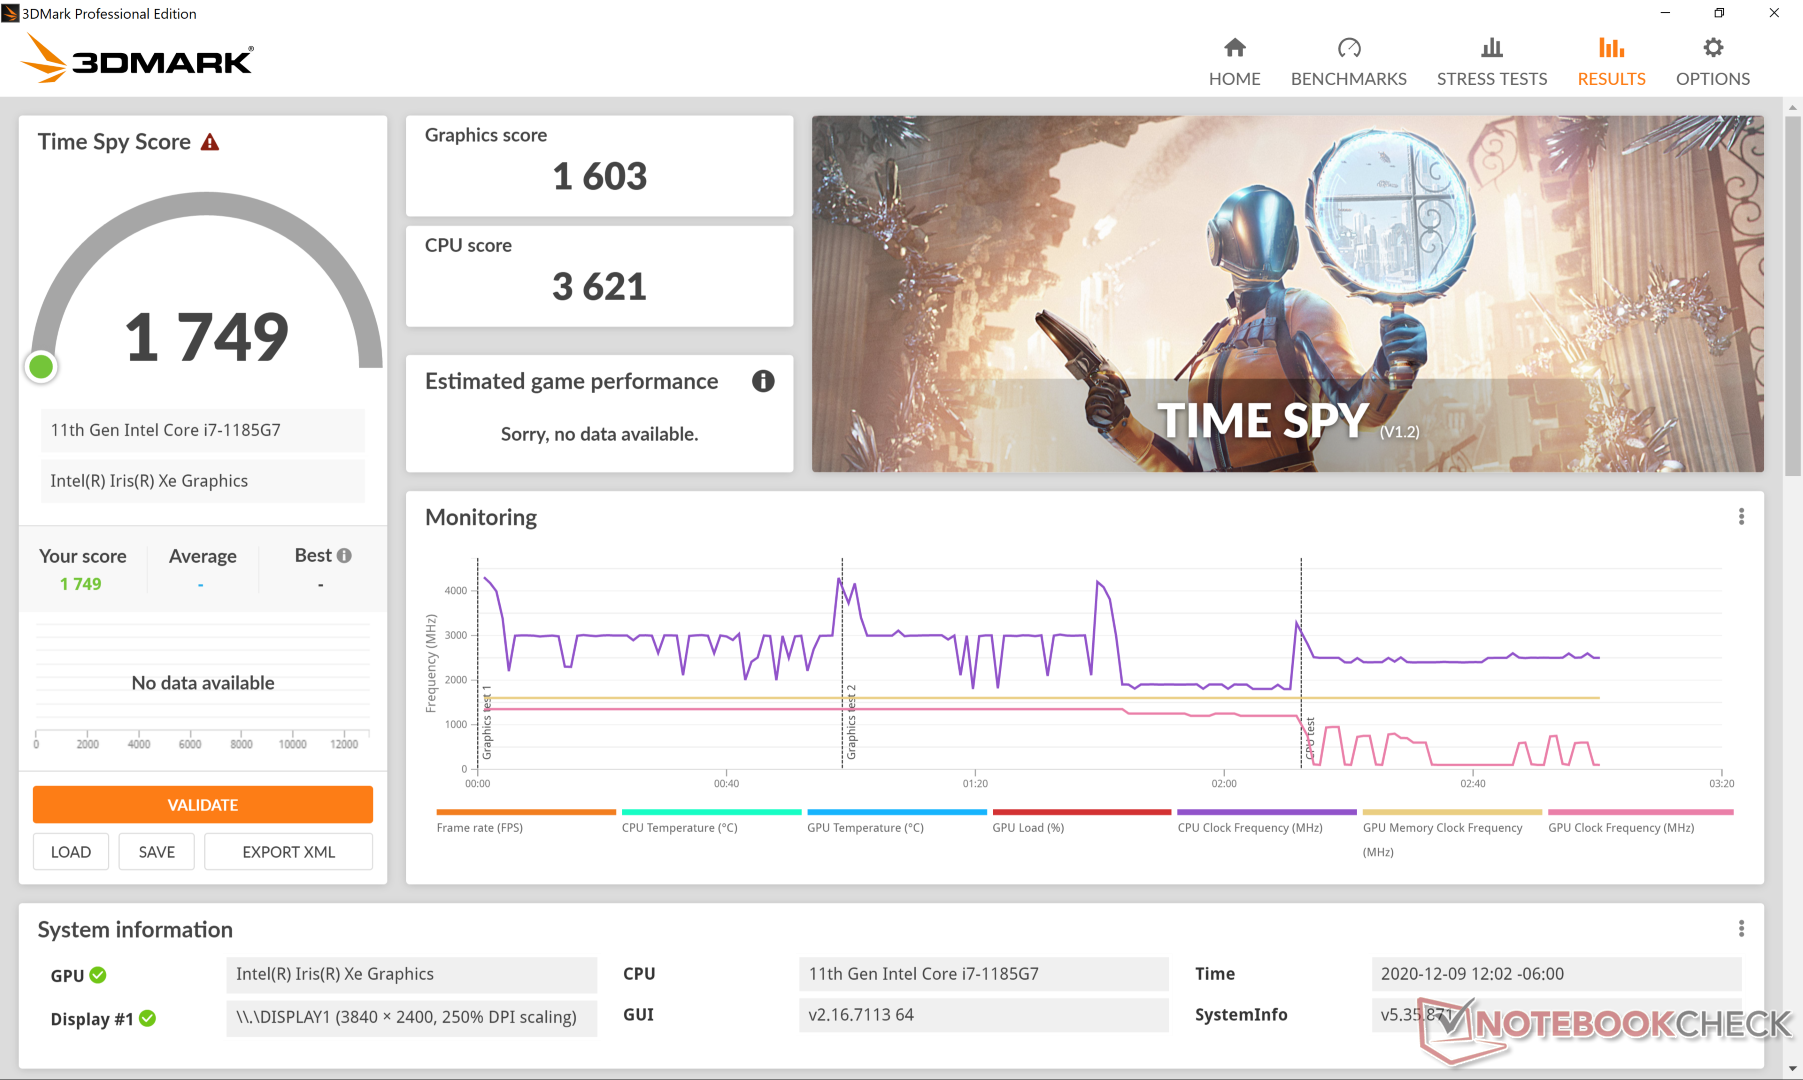
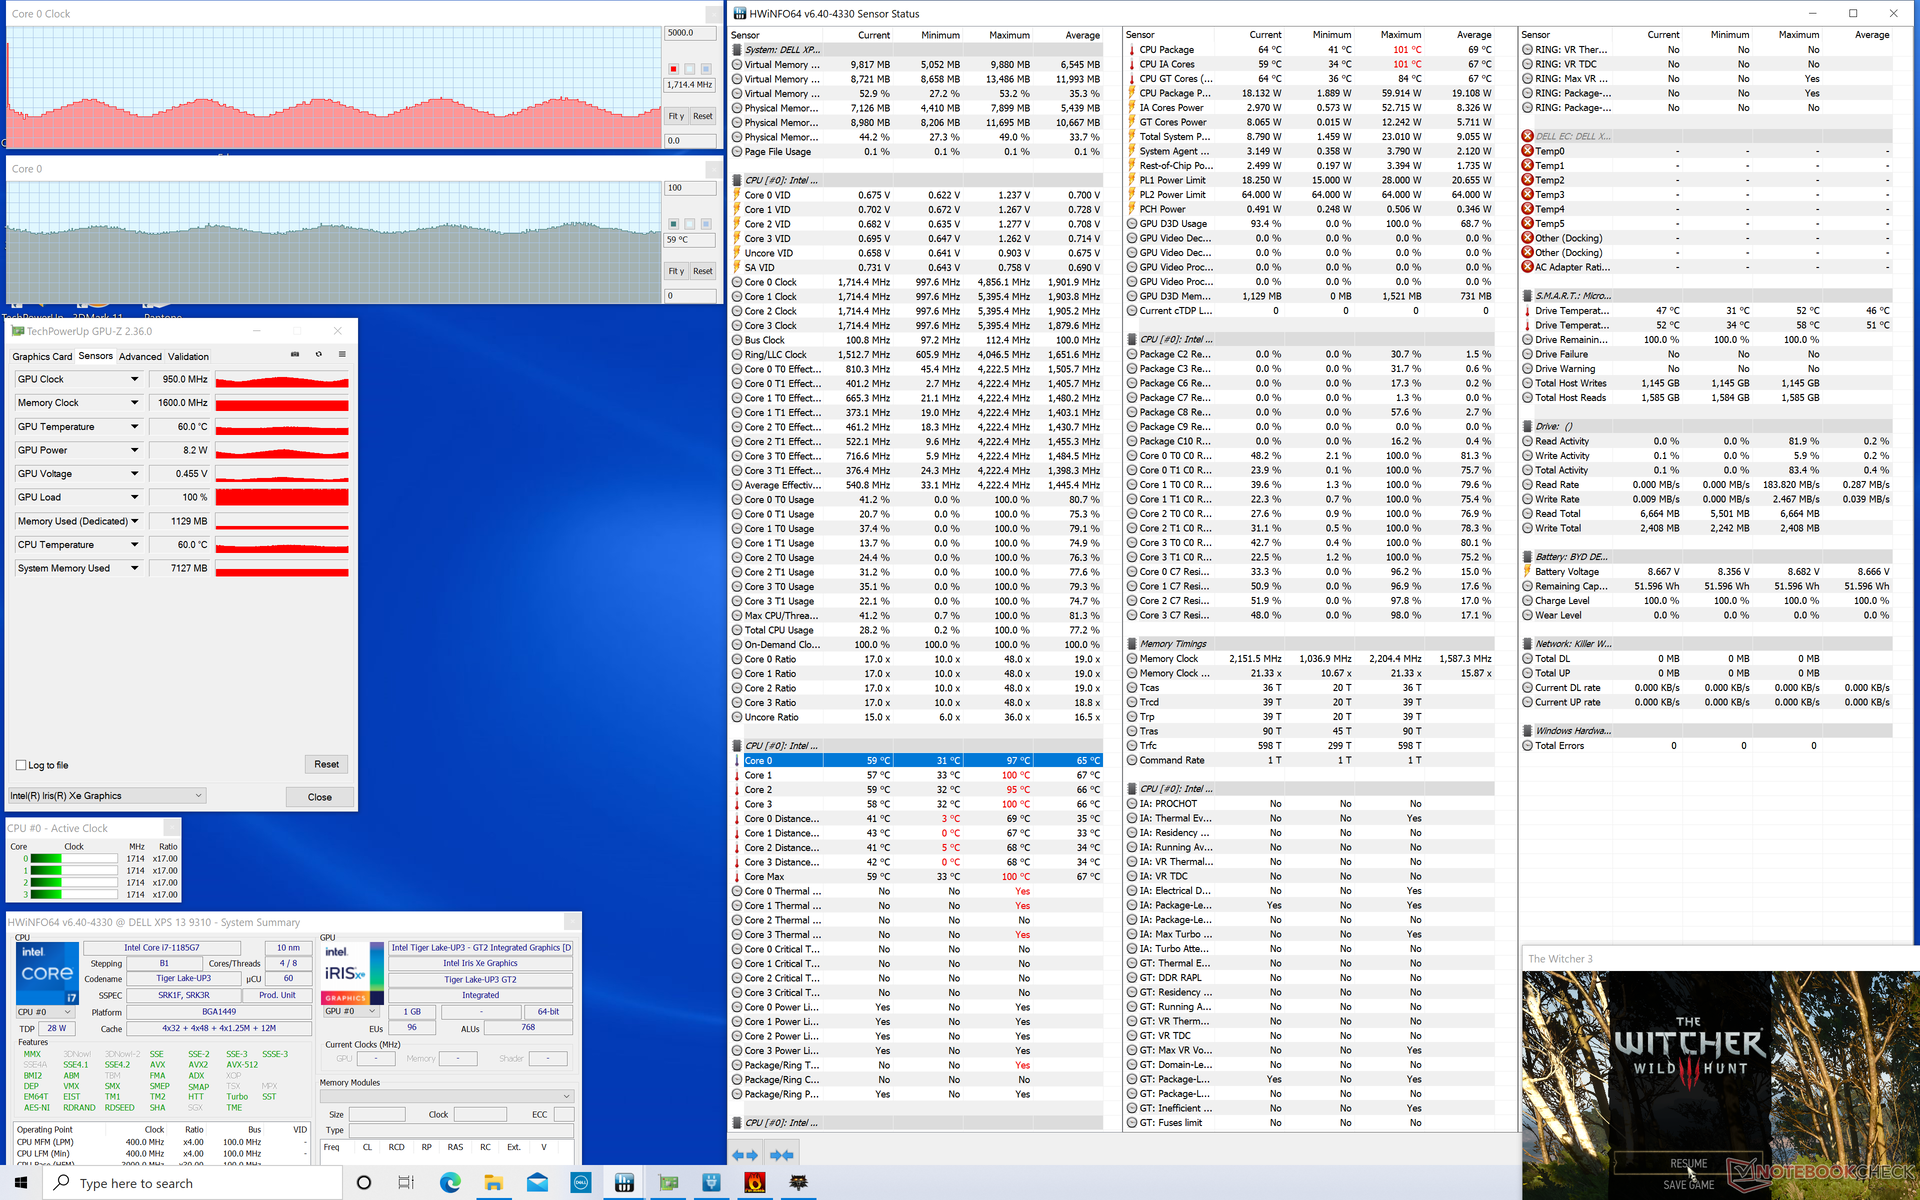
Stranamente, i risultati di 3DMark sono costantemente superiori a quelli registrati sull'XPS 13 Core i7-1165G7 anche se i giochi sembrano funzionare un po' più velocemente su quest'ultima versione. La grafica di Time Spy, ad esempio, è del 30% più alta per la nostra versione XPS 13 Core i7-1185G7 mentre i frame rates quando si eseguono giochi come DOTA 2, Final Fantasy XV e GTA V sono di qualche frame più bassi rispetto all'XPS 13 Core i7-1165G7. Non abbiamo una spiegazione precisa delle discrepanze, ma ciò significa che gli utenti dovrebbero aspettarsi circa le stesse prestazioni grafiche dell'XPS 13 Core i7-1165G7 in scenari più reali al di fuori di 3DMark. Sospettiamo che i valori di clock fluttuanti e le differenze di stato a freddo prima di eseguire i test possano aver influenzato i punteggi finali.
Al minimo su The Witcher 3 a basse impostazioni mostra le stesse fluttuazioni dei frame rates molto simili a quelle osservate nel test di loop dell'XPS 13 9310 Core i7-1165G7 e CineBench R15 xT di cui sopra. In questo esempio, i frame rates oscillano tra 50 FPS e 90 FPS a causa delle frequenze di clock ciclico.
Si veda la nostra pagina dedicata all'Iris Xe per maggiori informazioni tecniche e benchmarks di confronto.
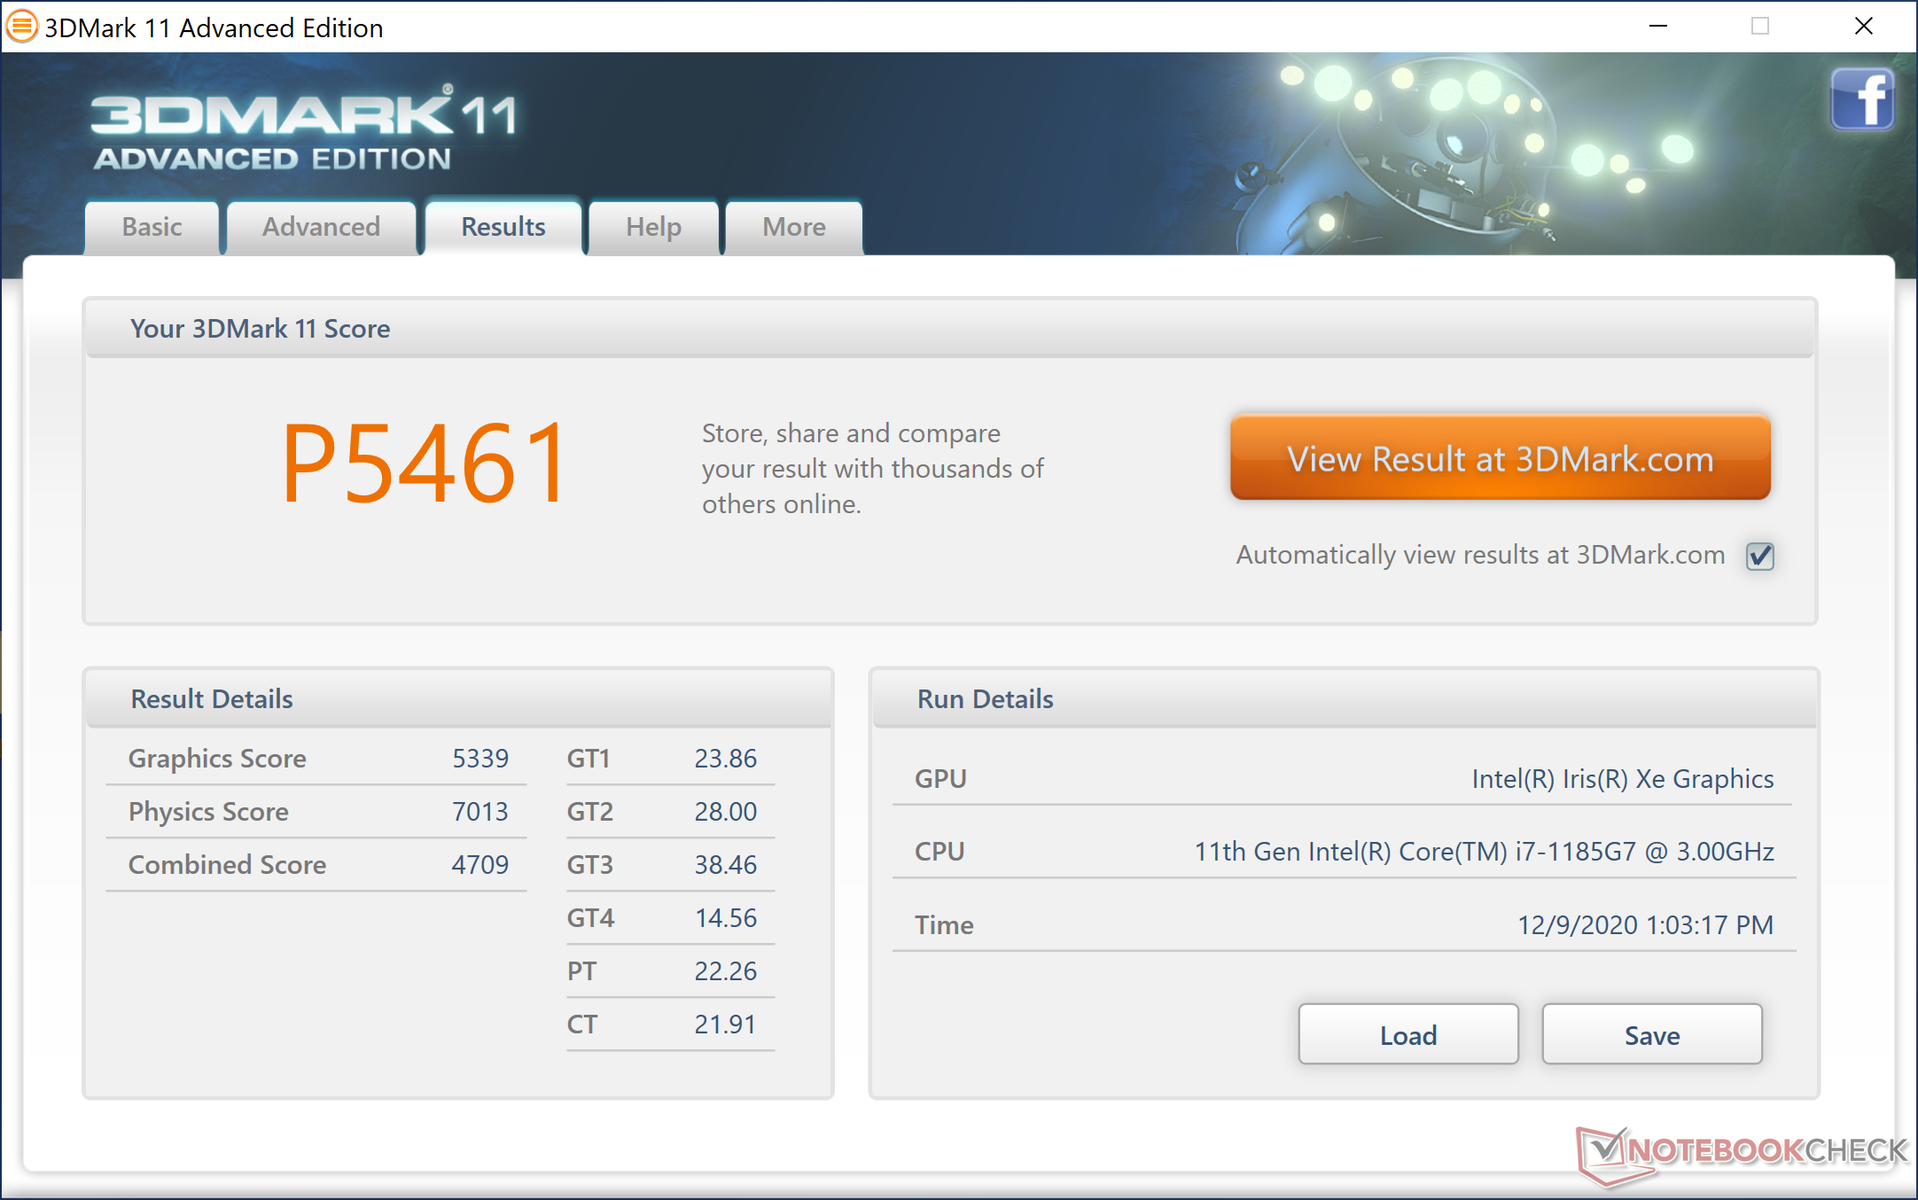
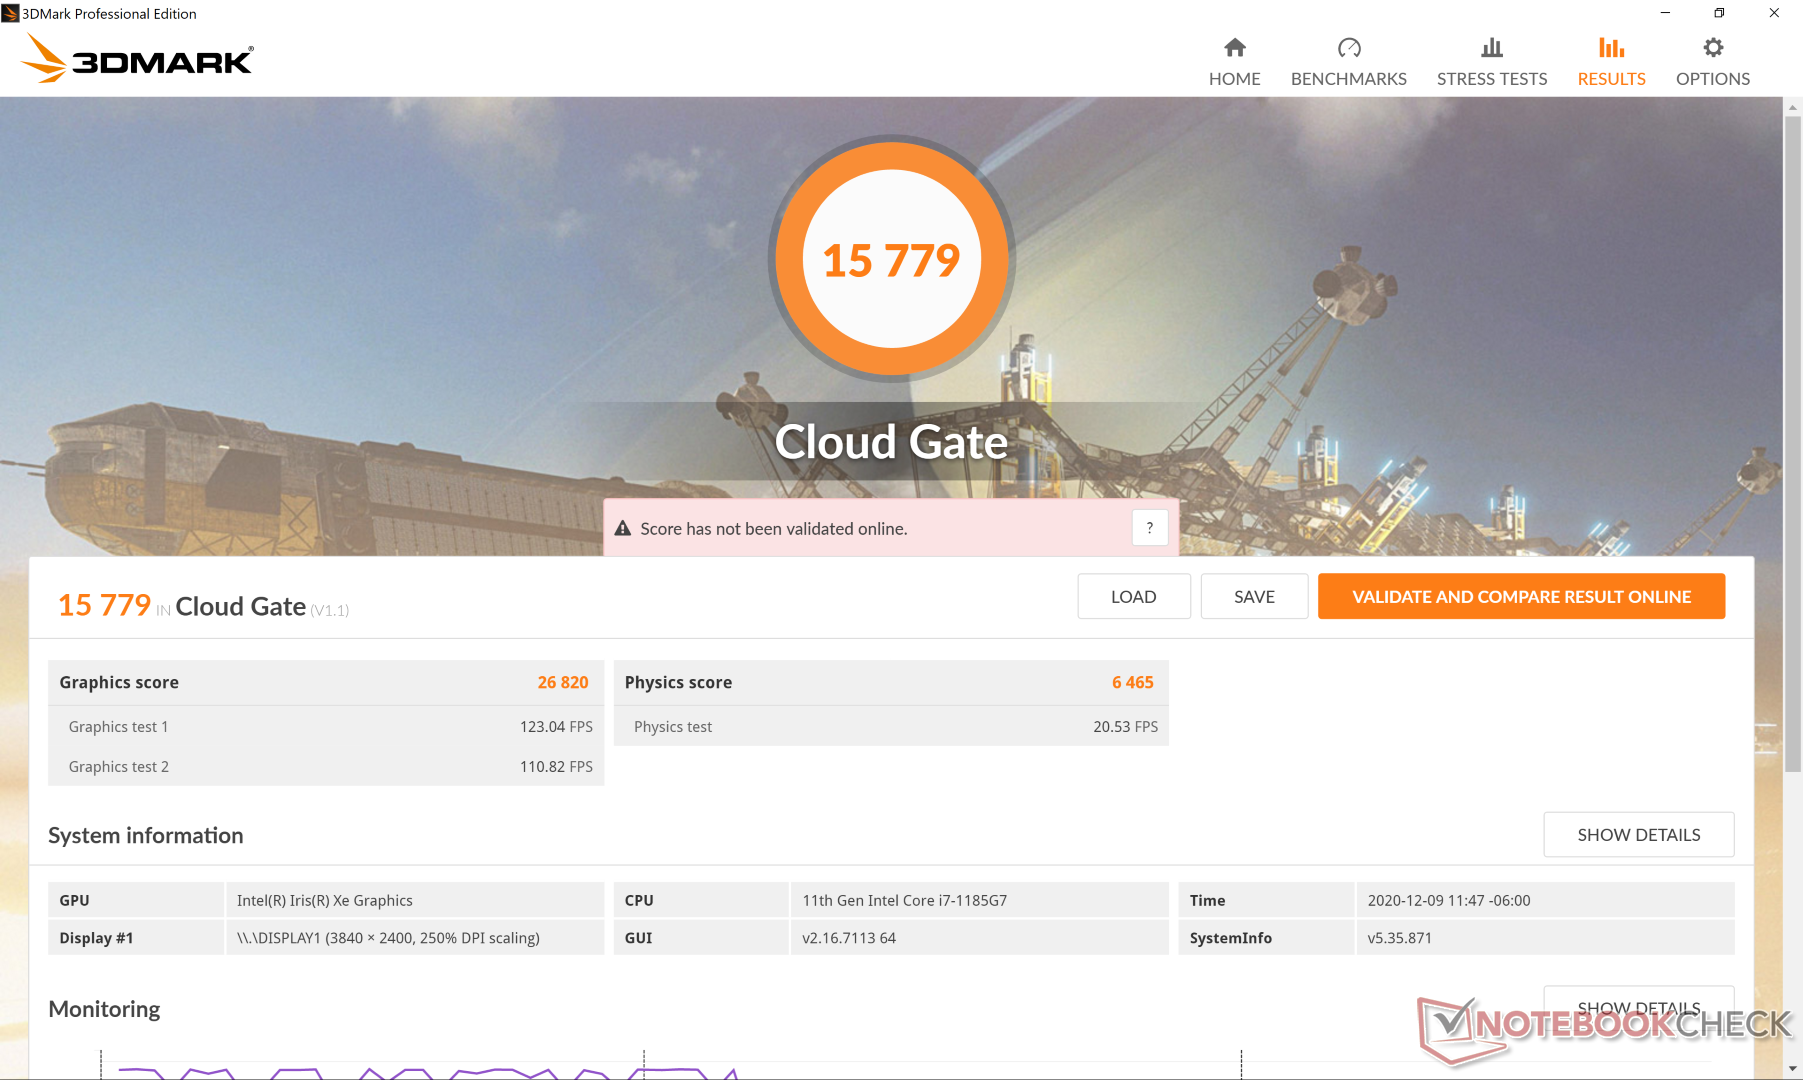
| 3DMark 11 Performance | 5461 punti | |
| 3DMark Cloud Gate Standard Score | 15779 punti | |
| 3DMark Fire Strike Score | 4821 punti | |
| 3DMark Time Spy Score | 1749 punti | |
Aiuto | ||
| GTA V | |
| 1024x768 Lowest Settings possible | |
| Lenovo Yoga Slim 7-14ARE | |
| Razer Book 13 FHD | |
| Media Intel Iris Xe Graphics G7 96EUs (52 - 166.4, n=168) | |
| Dell XPS 13 9310 Core i7 FHD | |
| Dell XPS 13 9310 Core i7 4K | |
| 1920x1080 Lowest Settings possible | |
| Media Intel Iris Xe Graphics G7 96EUs (34.7 - 132.1, n=141) | |
| Dell XPS 13 9310 Core i7 FHD | |
| Razer Book 13 FHD | |
| Lenovo Yoga Slim 7-14ARE | |
| Dell XPS 13 9310 Core i7 4K | |
| 1920x1080 Normal/Off AF:4x | |
| Lenovo Yoga Slim 7-14ARE | |
| Dell XPS 13 9310 Core i7 FHD | |
| Media Intel Iris Xe Graphics G7 96EUs (20 - 119.3, n=142) | |
| Razer Book 13 FHD | |
| Dell XPS 13 9310 Core i7 4K | |
| 1920x1080 High/On (Advanced Graphics Off) AA:2xMSAA + FX AF:8x | |
| Lenovo Yoga Slim 7-14ARE | |
| Razer Book 13 FHD | |
| Dell XPS 13 9310 Core i7 FHD | |
| Media Intel Iris Xe Graphics G7 96EUs (9.39 - 51.6, n=162) | |
| Dell XPS 13 9310 Core i7 4K | |
| 1920x1080 Highest AA:4xMSAA + FX AF:16x | |
| Razer Book 13 FHD | |
| Lenovo Yoga Slim 7-14ARE | |
| Dell XPS 13 9310 Core i7 FHD | |
| Dell XPS 13 9310 Core i7 4K | |
| Media Intel Iris Xe Graphics G7 96EUs (4.13 - 22.9, n=156) | |
| basso | medio | alto | ultra | QHD | 4K | |
|---|---|---|---|---|---|---|
| GTA V (2015) | 80.8 | 64.6 | 20.5 | 9.75 | ||
| The Witcher 3 (2015) | 107 | 61.9 | 34.5 | 15.3 | ||
| Dota 2 Reborn (2015) | 80.7 | 51.4 | 38.2 | 38.6 | 20 | |
| Final Fantasy XV Benchmark (2018) | 31.3 | 18.8 | 14.6 | 11.4 | 7.54 | |
| X-Plane 11.11 (2018) | 26 | 27.8 | 31.8 | 14.9 |
Emissions
Rumorosità del sistema
Anche se le frequenze di clock sono sempre fluttuanti quando sono sotto carico, il rumore della ventola rimane fortunatamente costante. Infatti, il sistema è sempre silenzioso o inudibile fino a quando non vengono introdotti carichi più pesanti come il gaming. Realisticamente, la maggior parte degli utenti non sentirà nulla oltre i 33 dB(A) a meno che il processore non venga stressato al massimo per periodi più lunghi.
| Dell XPS 13 9310 Core i7 4K Iris Xe G7 96EUs, i7-1185G7, Micron 2300 512GB MTFDHBA512TDV | Asus Zenbook S UX393JA Iris Plus Graphics G7 (Ice Lake 64 EU), i7-1065G7, Intel SSD 660p 1TB SSDPEKNW010T8 | Huawei MateBook X Pro 2020 i7 GeForce MX250, i7-10510U, Samsung PM981a MZVLB1T0HBLR | Dell XPS 13 9300 Core i7-1065G7 Iris Plus Graphics G7 (Ice Lake 64 EU), i7-1065G7, Intel SSDPEMKF512G8 NVMe SSD | Lenovo Yoga Slim 7-14ARE Vega 8, R7 4800U, Samsung SSD PM981a MZVLB512HBJQ | HP Spectre x360 13-aw0013dx Iris Plus Graphics G7 (Ice Lake 64 EU), i7-1065G7, Intel Optane Memory H10 with Solid State Storage 32GB + 512GB HBRPEKNX0202A(L/H) | |
|---|---|---|---|---|---|---|
| Noise | -10% | -12% | -7% | 0% | -2% | |
| off /ambiente * (dB) | 27.7 | 26.9 3% | 29.6 -7% | 28.3 -2% | 26.3 5% | 28.5 -3% |
| Idle Minimum * (dB) | 27.8 | 26.9 3% | 29.6 -6% | 28.3 -2% | 26.5 5% | 28.5 -3% |
| Idle Average * (dB) | 27.8 | 29 -4% | 29.6 -6% | 28.3 -2% | 26.5 5% | 28.5 -3% |
| Idle Maximum * (dB) | 27.8 | 31.1 -12% | 30.3 -9% | 28.3 -2% | 26.5 5% | 28.5 -3% |
| Load Average * (dB) | 27.9 | 37.7 -35% | 38 -36% | 32.5 -16% | 31.8 -14% | 28.5 -2% |
| Witcher 3 ultra * (dB) | 32.8 | 40.2 -23% | 38 -16% | 39.3 -20% | 35.9 -9% | 35.3 -8% |
| Load Maximum * (dB) | 37 | 38.1 -3% | 38 -3% | 39.3 -6% | 35.9 3% | 35.3 5% |
* ... Meglio usare valori piccoli
Rumorosità
| Idle |
| 27.8 / 27.8 / 27.8 dB(A) |
| Sotto carico |
| 27.9 / 37 dB(A) |
 | ||
30 dB silenzioso 40 dB(A) udibile 50 dB(A) rumoroso |
||
min: | ||
Temperatura
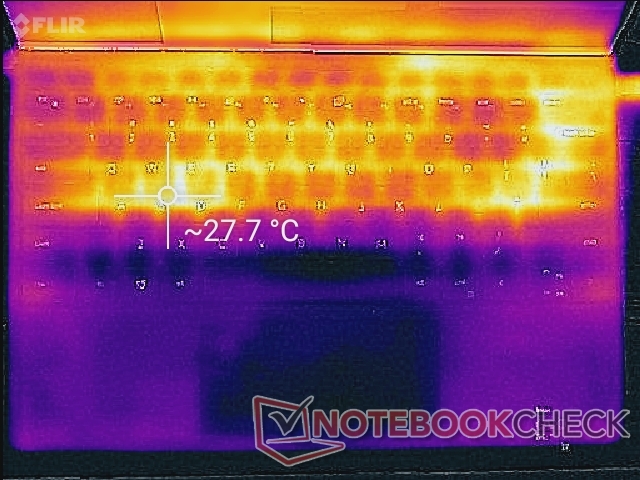
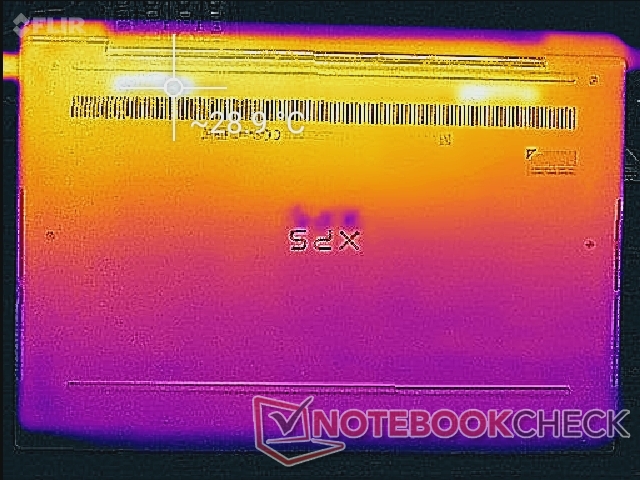
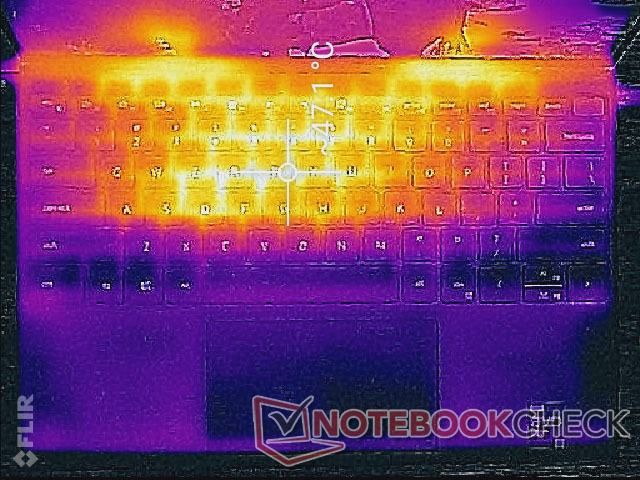
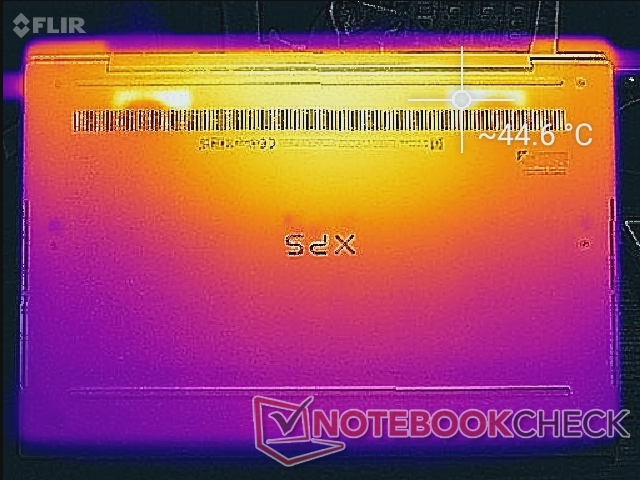
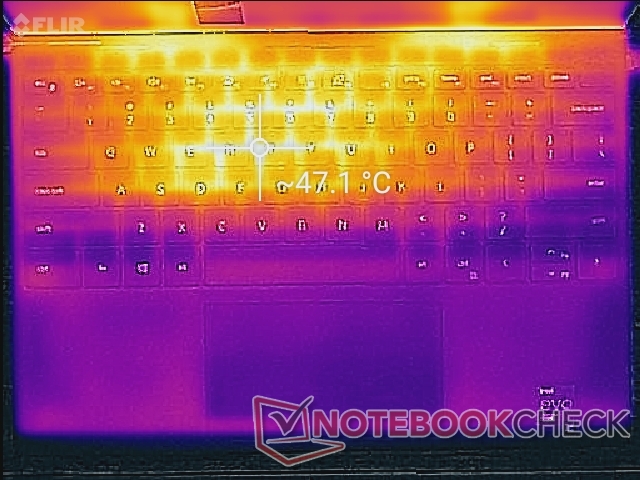
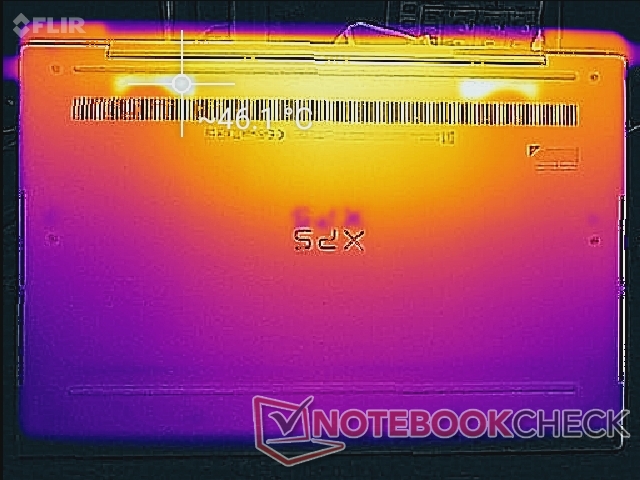
I punti caldi sono quasi gli stessi che abbiamo registrato sull'XPS 13 9310 con la CPU meno potente Core i7-1165G7. Quindi, l'aggiornamento all'opzione Core i7-1185G7 non significa necessariamente che il portatile sarà più caldo al tatto.
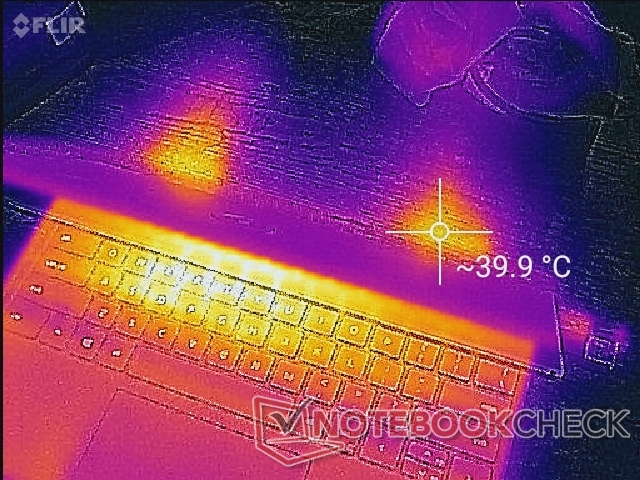
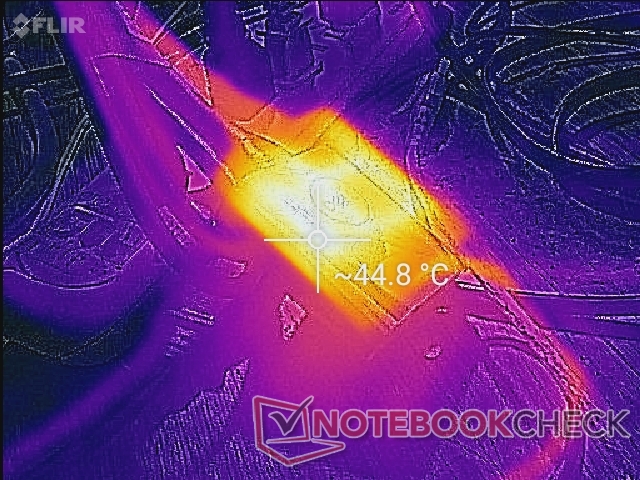
(-) La temperatura massima sul lato superiore è di 47 °C / 117 F, rispetto alla media di 35.9 °C / 97 F, che varia da 21.4 a 59 °C per questa classe Subnotebook.
(±) Il lato inferiore si riscalda fino ad un massimo di 45 °C / 113 F, rispetto alla media di 39.2 °C / 103 F
(+) In idle, la temperatura media del lato superiore è di 26.1 °C / 79 F, rispetto alla media deld ispositivo di 30.8 °C / 87 F.
(±) Riproducendo The Witcher 3, la temperatura media per il lato superiore e' di 34.4 °C / 94 F, rispetto alla media del dispositivo di 30.8 °C / 87 F.
(+) I poggiapolsi e il touchpad sono piu' freddi della temperatura della pelle con un massimo di 28.8 °C / 83.8 F e sono quindi freddi al tatto.
(±) La temperatura media della zona del palmo della mano di dispositivi simili e'stata di 28.2 °C / 82.8 F (-0.6 °C / -1 F).
Stress Test
Quando viene stressato con Prime95, il sistema si porta nella gamma da 3,9 GHz a 4,3 GHz per pochi secondi fino a raggiungere una temperatura del core di 101° C. In seguito, le frequenze di clock scendono costantemente fino ad iniziare ad oscillare a tempo indeterminato tra 2,1 GHz a 3 GHz e 63° C a 81° C. Queste frequenze sono molto vicine a quelle osservate sull'XPS 13 Core i7-1165G7, dove le frequenze di clock oscillano tra 1,9 GHz e 3,1 GHz nella gamma di temperatura del core da 71° C a 78° C
Le frequenze di clock della CPU e della GPU possono diventare cicliche elevate durante l'esecuzione di The Witcher 3 e pure hanno profondi effetti sui frame rates, come detto in precedenza. Anche la potenza della GPU oscilla tra i 5,7 W e i 9,2 W secondo la GPU-Z.
Non ci sono grandi deficit di prestazioni se si utilizza la batteria. Un test 3DMark 11 con la batteria restituisce putneggi di Physics e Graphics di 10181 e 6463 punti, rispettivamente, rispetto a 7013 e 5339 punti ottenuti con il collegamento alla rete elettrica. I punteggi più alti con la batteria possono essere attribuiti ad uno stato di sistema più freddo prima di eseguire il test.
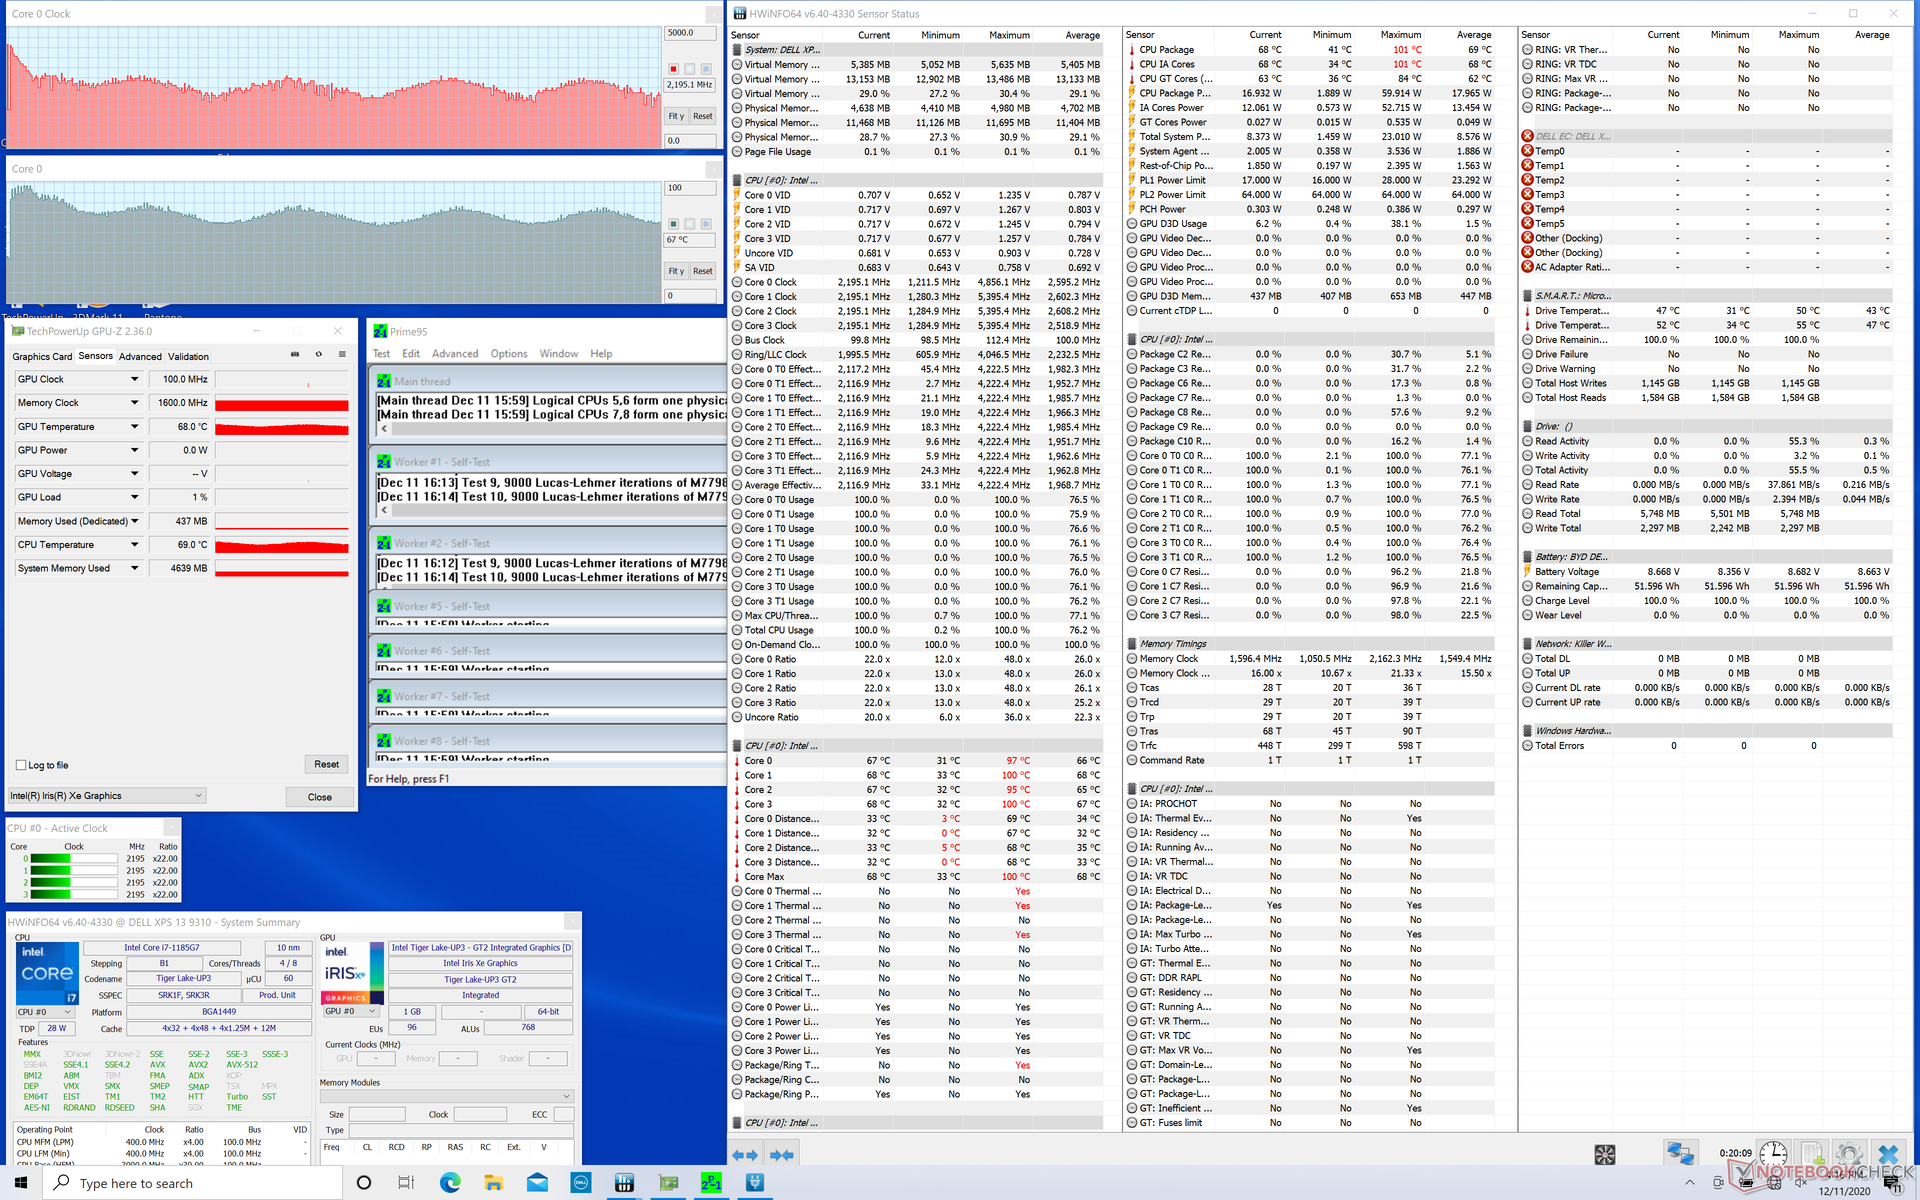
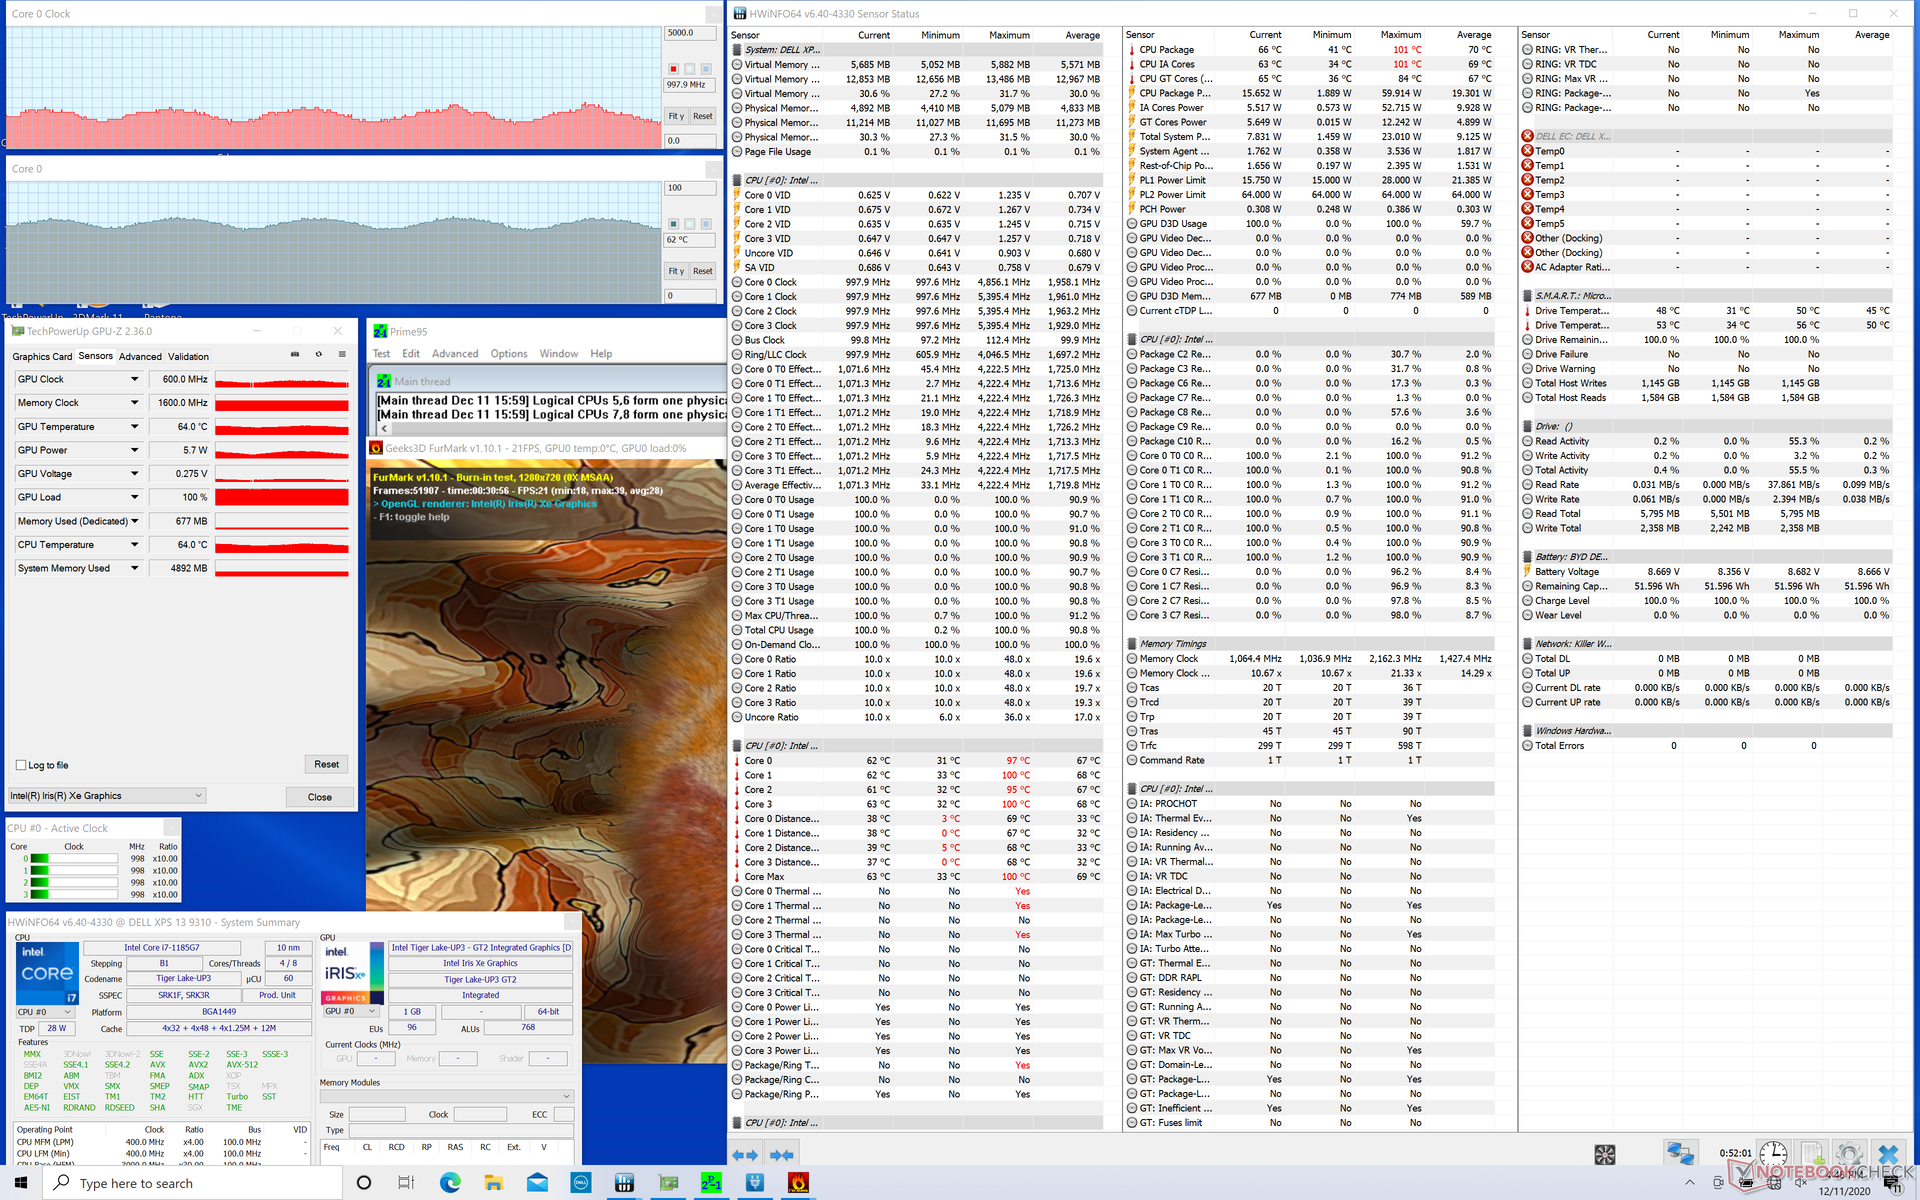
| Orologio PCU(GHz) | OrologioGPU(MHz) | Temperatura media dellaCPU (°C) | |
| Sistema inattivo | ------------41 | ||
| Prime95 Stress | 2.1 - 3 | -- | 63 - 81 |
| Prime95 + FurMark Stress | 0,9 - 1,8 | 600 - 1000 | 61 - 71 |
| Witcher 3 Stress | 1.3 - 2.1 | 700 - 1150 | 58 - 65 |
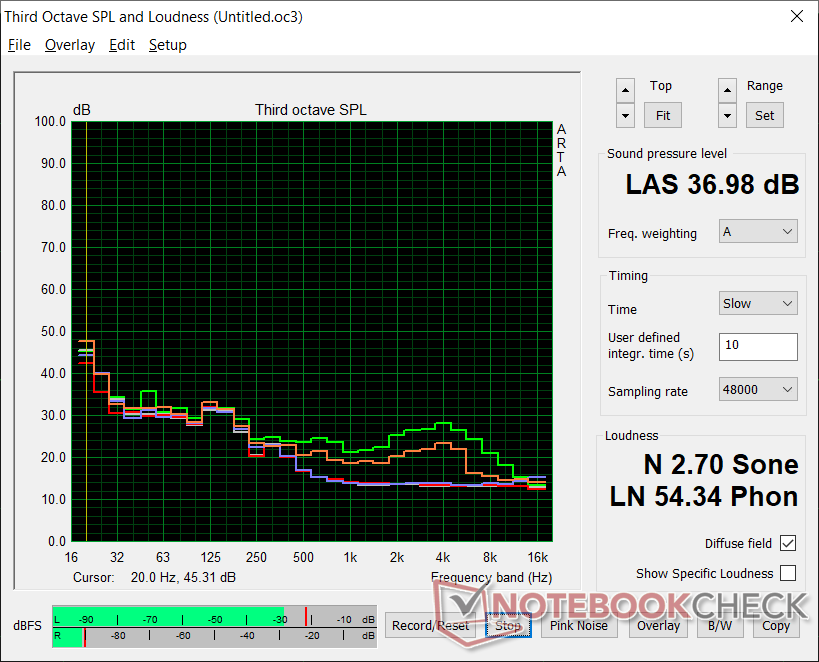
Altoparlanti
Dell XPS 13 9310 Core i7 4K analisi audio
(+) | gli altoparlanti sono relativamente potenti (84.6 dB)
Bassi 100 - 315 Hz
(±) | bassi ridotti - in media 13.1% inferiori alla media
(±) | la linearità dei bassi è media (11.1% delta rispetto alla precedente frequenza)
Medi 400 - 2000 Hz
(+) | medi bilanciati - solo only 4.3% rispetto alla media
(+) | medi lineari (4.2% delta rispetto alla precedente frequenza)
Alti 2 - 16 kHz
(+) | Alti bilanciati - appena 1.5% dalla media
(+) | alti lineari (3.8% delta rispetto alla precedente frequenza)
Nel complesso 100 - 16.000 Hz
(+) | suono nel complesso lineare (10.9% differenza dalla media)
Rispetto alla stessa classe
» 9% di tutti i dispositivi testati in questa classe è stato migliore, 3% simile, 88% peggiore
» Il migliore ha avuto un delta di 5%, medio di 18%, peggiore di 53%
Rispetto a tutti i dispositivi testati
» 6% di tutti i dispositivi testati in questa classe è stato migliore, 2% similare, 92% peggiore
» Il migliore ha avuto un delta di 4%, medio di 24%, peggiore di 134%
Apple MacBook 12 (Early 2016) 1.1 GHz analisi audio
(+) | gli altoparlanti sono relativamente potenti (83.6 dB)
Bassi 100 - 315 Hz
(±) | bassi ridotti - in media 11.3% inferiori alla media
(±) | la linearità dei bassi è media (14.2% delta rispetto alla precedente frequenza)
Medi 400 - 2000 Hz
(+) | medi bilanciati - solo only 2.4% rispetto alla media
(+) | medi lineari (5.5% delta rispetto alla precedente frequenza)
Alti 2 - 16 kHz
(+) | Alti bilanciati - appena 2% dalla media
(+) | alti lineari (4.5% delta rispetto alla precedente frequenza)
Nel complesso 100 - 16.000 Hz
(+) | suono nel complesso lineare (10.2% differenza dalla media)
Rispetto alla stessa classe
» 7% di tutti i dispositivi testati in questa classe è stato migliore, 2% simile, 91% peggiore
» Il migliore ha avuto un delta di 5%, medio di 18%, peggiore di 53%
Rispetto a tutti i dispositivi testati
» 5% di tutti i dispositivi testati in questa classe è stato migliore, 1% similare, 94% peggiore
» Il migliore ha avuto un delta di 4%, medio di 24%, peggiore di 134%
Gestione energetica
Consumo energetico
Il funzionamento a vuoto sul desktop con l'impostazione di luminosità più alta consuma circa 8,3 W - 8,8 W rispetto ai 5,9 W - 6,3 W della configurazione FHD. Il leggero aumento è probabilmente in parte attribuito al più impegnativo pannello di risoluzione 4K.
Il consumo di energia è generalmente più elevato rispetto agli altri Ultrabooks Core i7 alimentati da grafica integrata quando 3DMark 06. Siamo in grado di misurare una media di 46 W rispetto a soli 32 W a 37 W sugli HP Spectre x360 13, ZenBook S, o XPS 13 9310 ciascuno dotato del più lento Core i7-1065G7 dello scorso anno. Tuttavia, le prestazioni per watt sono ancora incredibili se paragonate ai vecchi sistemi Whiskey Lake-U o Comet Lake-U.
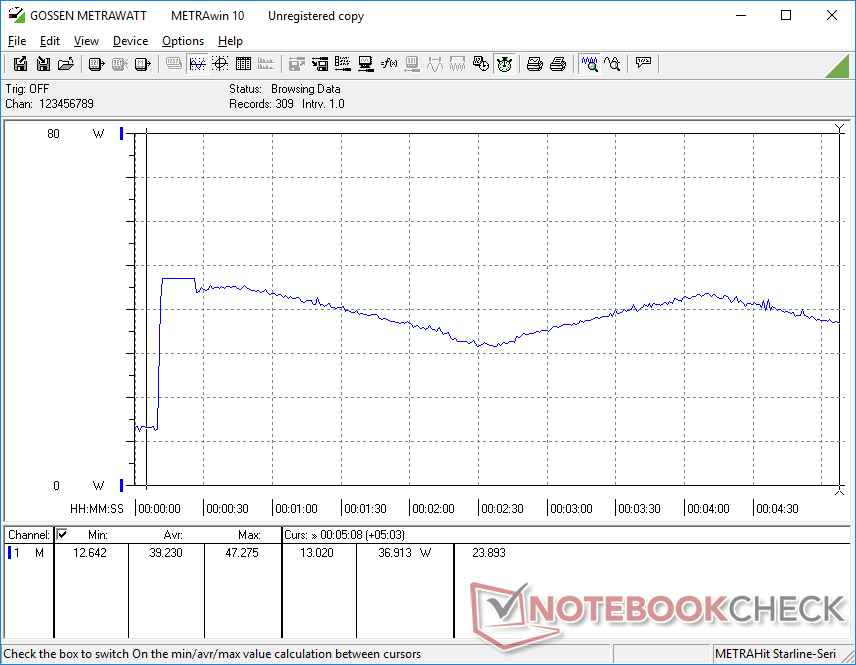
L'esecuzione di Prime95 comporta un assorbimento di 47 W dal piccolo (~6 x 5,5 x 2,3 cm) alimentatore da 45 W. Tuttavia, questo valore dura solo pochi secondi prima di iniziare ad oscillare, come mostrato dai nostri grafici qui sotto, confermando le osservazioni del nostro Stress Test sul valore di clock di cui parlavamo prima.
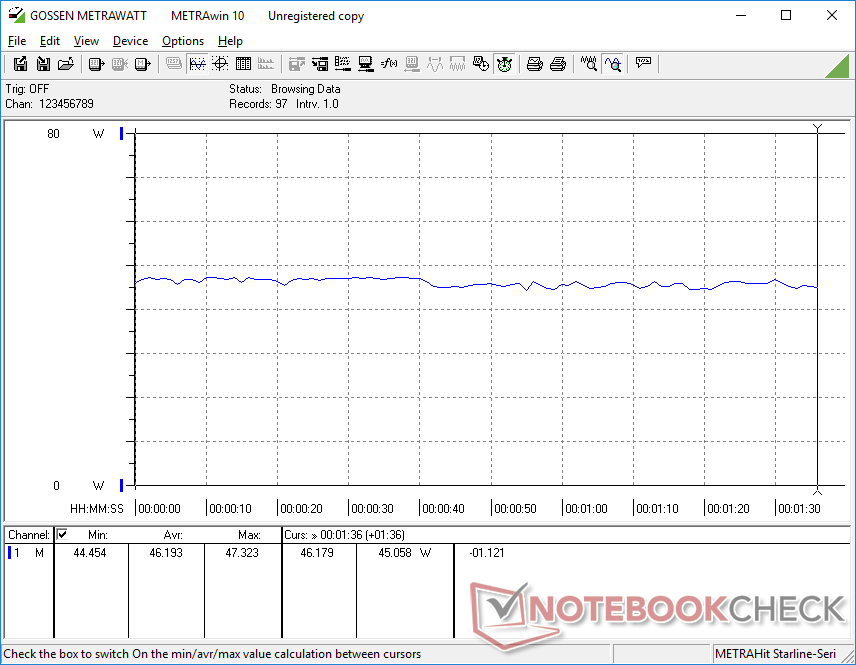
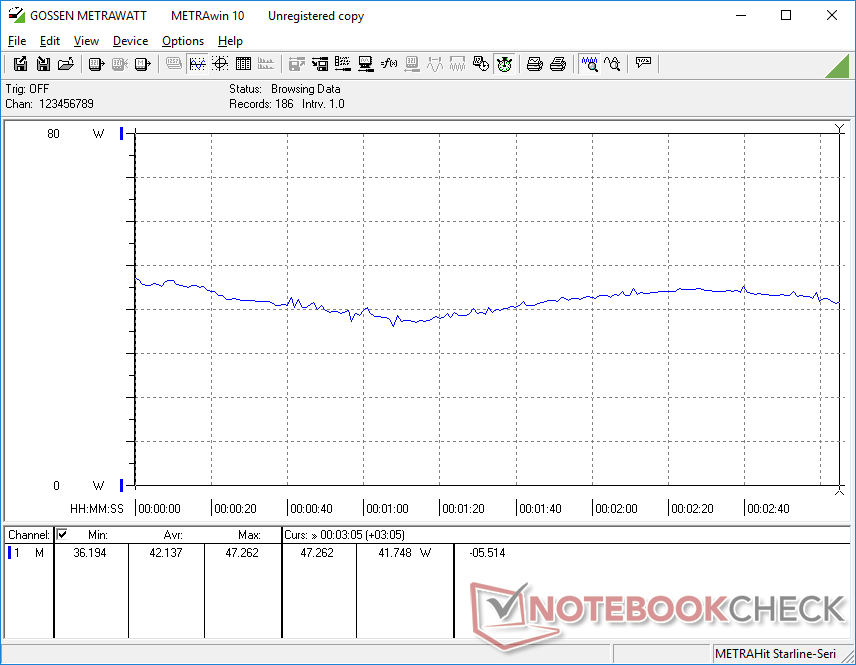
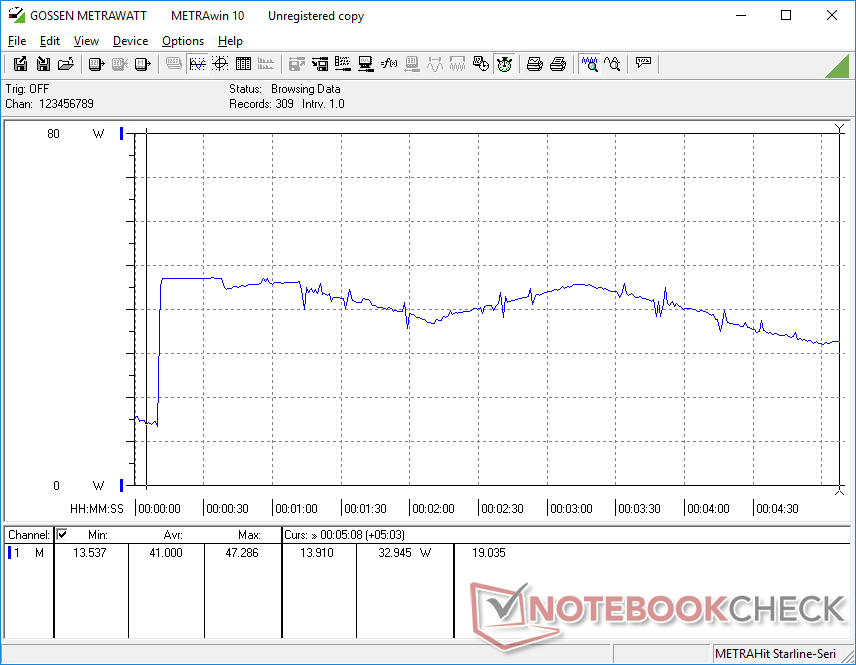
| Off / Standby | |
| Idle | |
| Sotto carico |
|
Leggenda:
min: | |
| Dell XPS 13 9310 Core i7 4K i7-1185G7, Iris Xe G7 96EUs, Micron 2300 512GB MTFDHBA512TDV, IPS, 3840x2400, 13.4" | Asus Zenbook S UX393JA i7-1065G7, Iris Plus Graphics G7 (Ice Lake 64 EU), Intel SSD 660p 1TB SSDPEKNW010T8, IPS, 3300x2200, 13.9" | Huawei MateBook X Pro 2020 i7 i7-10510U, GeForce MX250, Samsung PM981a MZVLB1T0HBLR, LTPS, 3000x2000, 13.9" | Dell XPS 13 9300 Core i7-1065G7 i7-1065G7, Iris Plus Graphics G7 (Ice Lake 64 EU), Intel SSDPEMKF512G8 NVMe SSD, IPS, 1920x1200, 13.4" | Lenovo Yoga Slim 7-14ARE R7 4800U, Vega 8, Samsung SSD PM981a MZVLB512HBJQ, IPS, 1920x1080, 14" | HP Spectre x360 13-aw0013dx i7-1065G7, Iris Plus Graphics G7 (Ice Lake 64 EU), Intel Optane Memory H10 with Solid State Storage 32GB + 512GB HBRPEKNX0202A(L/H), IPS, 1920x1080, 13.3" | |
|---|---|---|---|---|---|---|
| Power Consumption | 3% | -17% | 12% | 0% | 17% | |
| Idle Minimum * (Watt) | 4.3 | 4.1 5% | 4.3 -0% | 4.2 2% | 4 7% | 3.9 9% |
| Idle Average * (Watt) | 8.3 | 7.5 10% | 8.5 -2% | 6.9 17% | 6.3 24% | 6.3 24% |
| Idle Maximum * (Watt) | 8.8 | 8.5 3% | 12 -36% | 7.5 15% | 7.7 12% | 6.8 23% |
| Load Average * (Watt) | 46.2 | 36.8 20% | 54.8 -19% | 33.3 28% | 48.3 -5% | 32.6 29% |
| Witcher 3 ultra * (Watt) | 42.2 | 39.2 7% | 47.1 -12% | 37.1 12% | 49 -16% | 25.6 39% |
| Load Maximum * (Watt) | 47.3 | 61.6 -30% | 61.5 -30% | 48.4 -2% | 57.6 -22% | 59 -25% |
* ... Meglio usare valori piccoli
Durata della batteria
I tempi di autonomia sono molto più brevi di quelli registrati sull'XPS 13 FHD. Mentre la nostra unità FHD dura per oltre 12 ore di utilizzo della WLAN nel mondo reale, la nostra unità 4K resiste solo 7 ore quando è sullo stesso profilo di prestazioni Dell Optimized e sulla stessa impostazione di luminosità. Abbiamo persino ripetuto il test di durata della batteria solo per verificare eventuali discrepanze, ma il tempo di autonomia di circa 7 ore non è cambiato.
La ricarica completa è lenta da 2,5 a 3 ore. Molti altri Ultrabooks possono ricaricare quasi due volte più velocemente come il Razer Book 13.
| Dell XPS 13 9310 Core i7 4K i7-1185G7, Iris Xe G7 96EUs, 52 Wh | Asus Zenbook S UX393JA i7-1065G7, Iris Plus Graphics G7 (Ice Lake 64 EU), 67 Wh | Huawei MateBook X Pro 2020 i7 i7-10510U, GeForce MX250, 57.4 Wh | Dell XPS 13 9300 Core i7-1065G7 i7-1065G7, Iris Plus Graphics G7 (Ice Lake 64 EU), 52 Wh | Lenovo Yoga Slim 7-14ARE R7 4800U, Vega 8, 61 Wh | HP Spectre x360 13-aw0013dx i7-1065G7, Iris Plus Graphics G7 (Ice Lake 64 EU), 60 Wh | |
|---|---|---|---|---|---|---|
| Autonomia della batteria | 15% | 44% | 76% | 43% | 38% | |
| WiFi v1.3 (h) | 7.2 | 8.3 15% | 10.4 44% | 12.7 76% | 10.3 43% | 9.9 38% |
| Reader / Idle (h) | 38.4 | 27.1 | 37.1 | |||
| Load (h) | 2.7 | 2.4 | 1.3 | 2.7 |
Pro
Contro
Giudizio Complessivo

Dal punto di vista delle prestazioni, il Core i7-1185G7 non offre un grande miglioramento rispetto al Core i7-1165G7 e quindi si consiglia di risparmiare qualche dollaro optando per il Core i7-1165G7. Il denaro risparmiato può invece essere riversato sulla RAM o lo spazio di archiviazione aggiuntivo o verso l'opzione 4K a risoluzione più alta dove gli aggiornamenti sono più tangibili. La durata della batteria sarà comunque un paio d'ore più breve rispetto all'opzione FHD, che è il prezzo da pagare per i pixel più densi.
Se potessimo fare una modifica all'XPS 13 9310, sarebbe quella di includere un'opzione per un clock più costante in modalità High Performance. I valori di clock ciclici vanno bene per massimizzare le prestazioni medie della CPU quando la soluzione di raffreddamento è il fattore limitante, ma le fluttuazioni delle prestazioni che ne derivano possono essere fastidiose per alcune applicazioni.
Investire in più RAM o nello spazio di archiviazione o nel display 4K a risoluzione più alta sarebbe più conveniente rispetto al Core i7-1185G7 in quanto i guadagni di prestazioni sono minimi, nella migliore delle ipotesi, rispetto al Core i7-1165G7.
Dell XPS 13 9310 Core i7 4K
- 05/31/2021 v7 (old)
Allen Ngo
Price comparison
