Recensione del Laptop Dell XPS 13 9300 Core i7: Chassis con Design nuovo più entusiasmante della nuova CPU
Dell ha lanciato il primo portatile Ice Lake nel 2019 con il suo XPS 13 7390 2-in-1. Nel frattempo, l'XPS 13 7390 a conchiglia ha continuato a ricevere le opzioni Comet Lake-U a complemento del nuovo XPS 13 convertibile. Soltanto fino ad ora Dell offriva le stesse opzioni di CPU Ice Lake per la sua linea XPS 13 a conchiglia come si trovava nella linea XPS 13 convertibile dell'anno scorso.
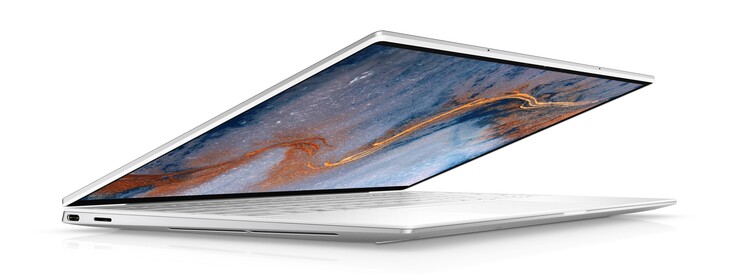
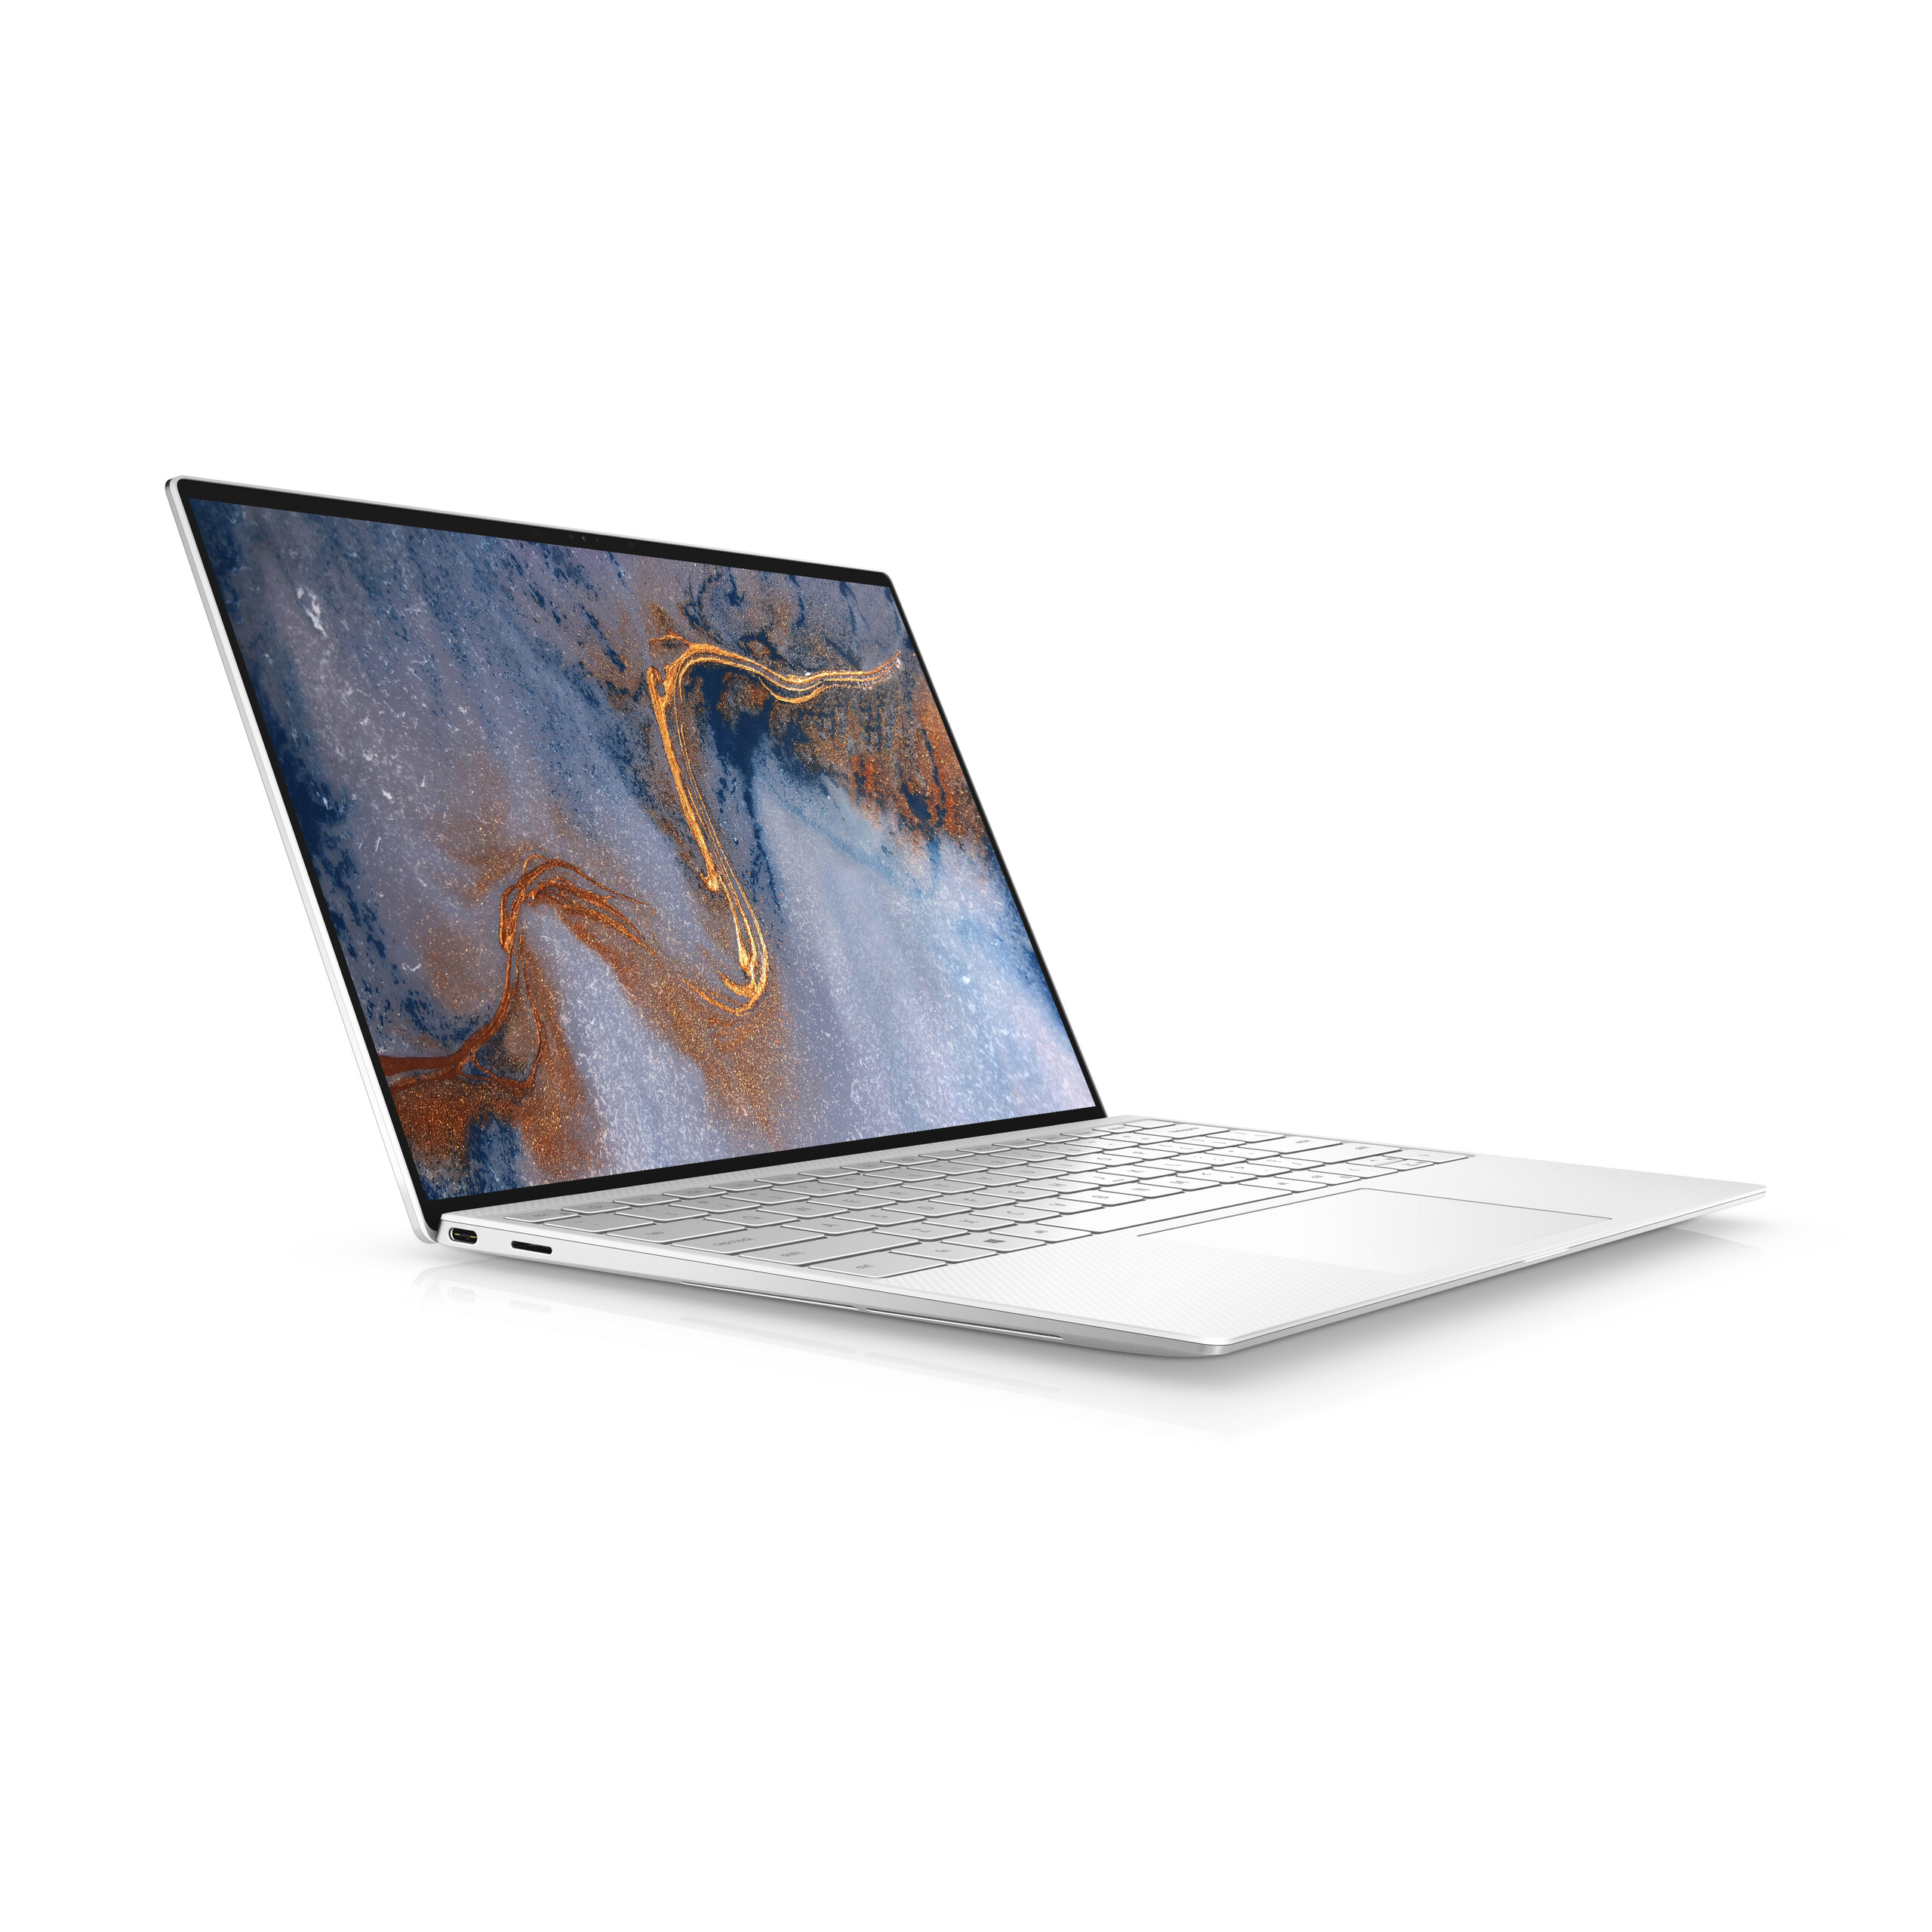
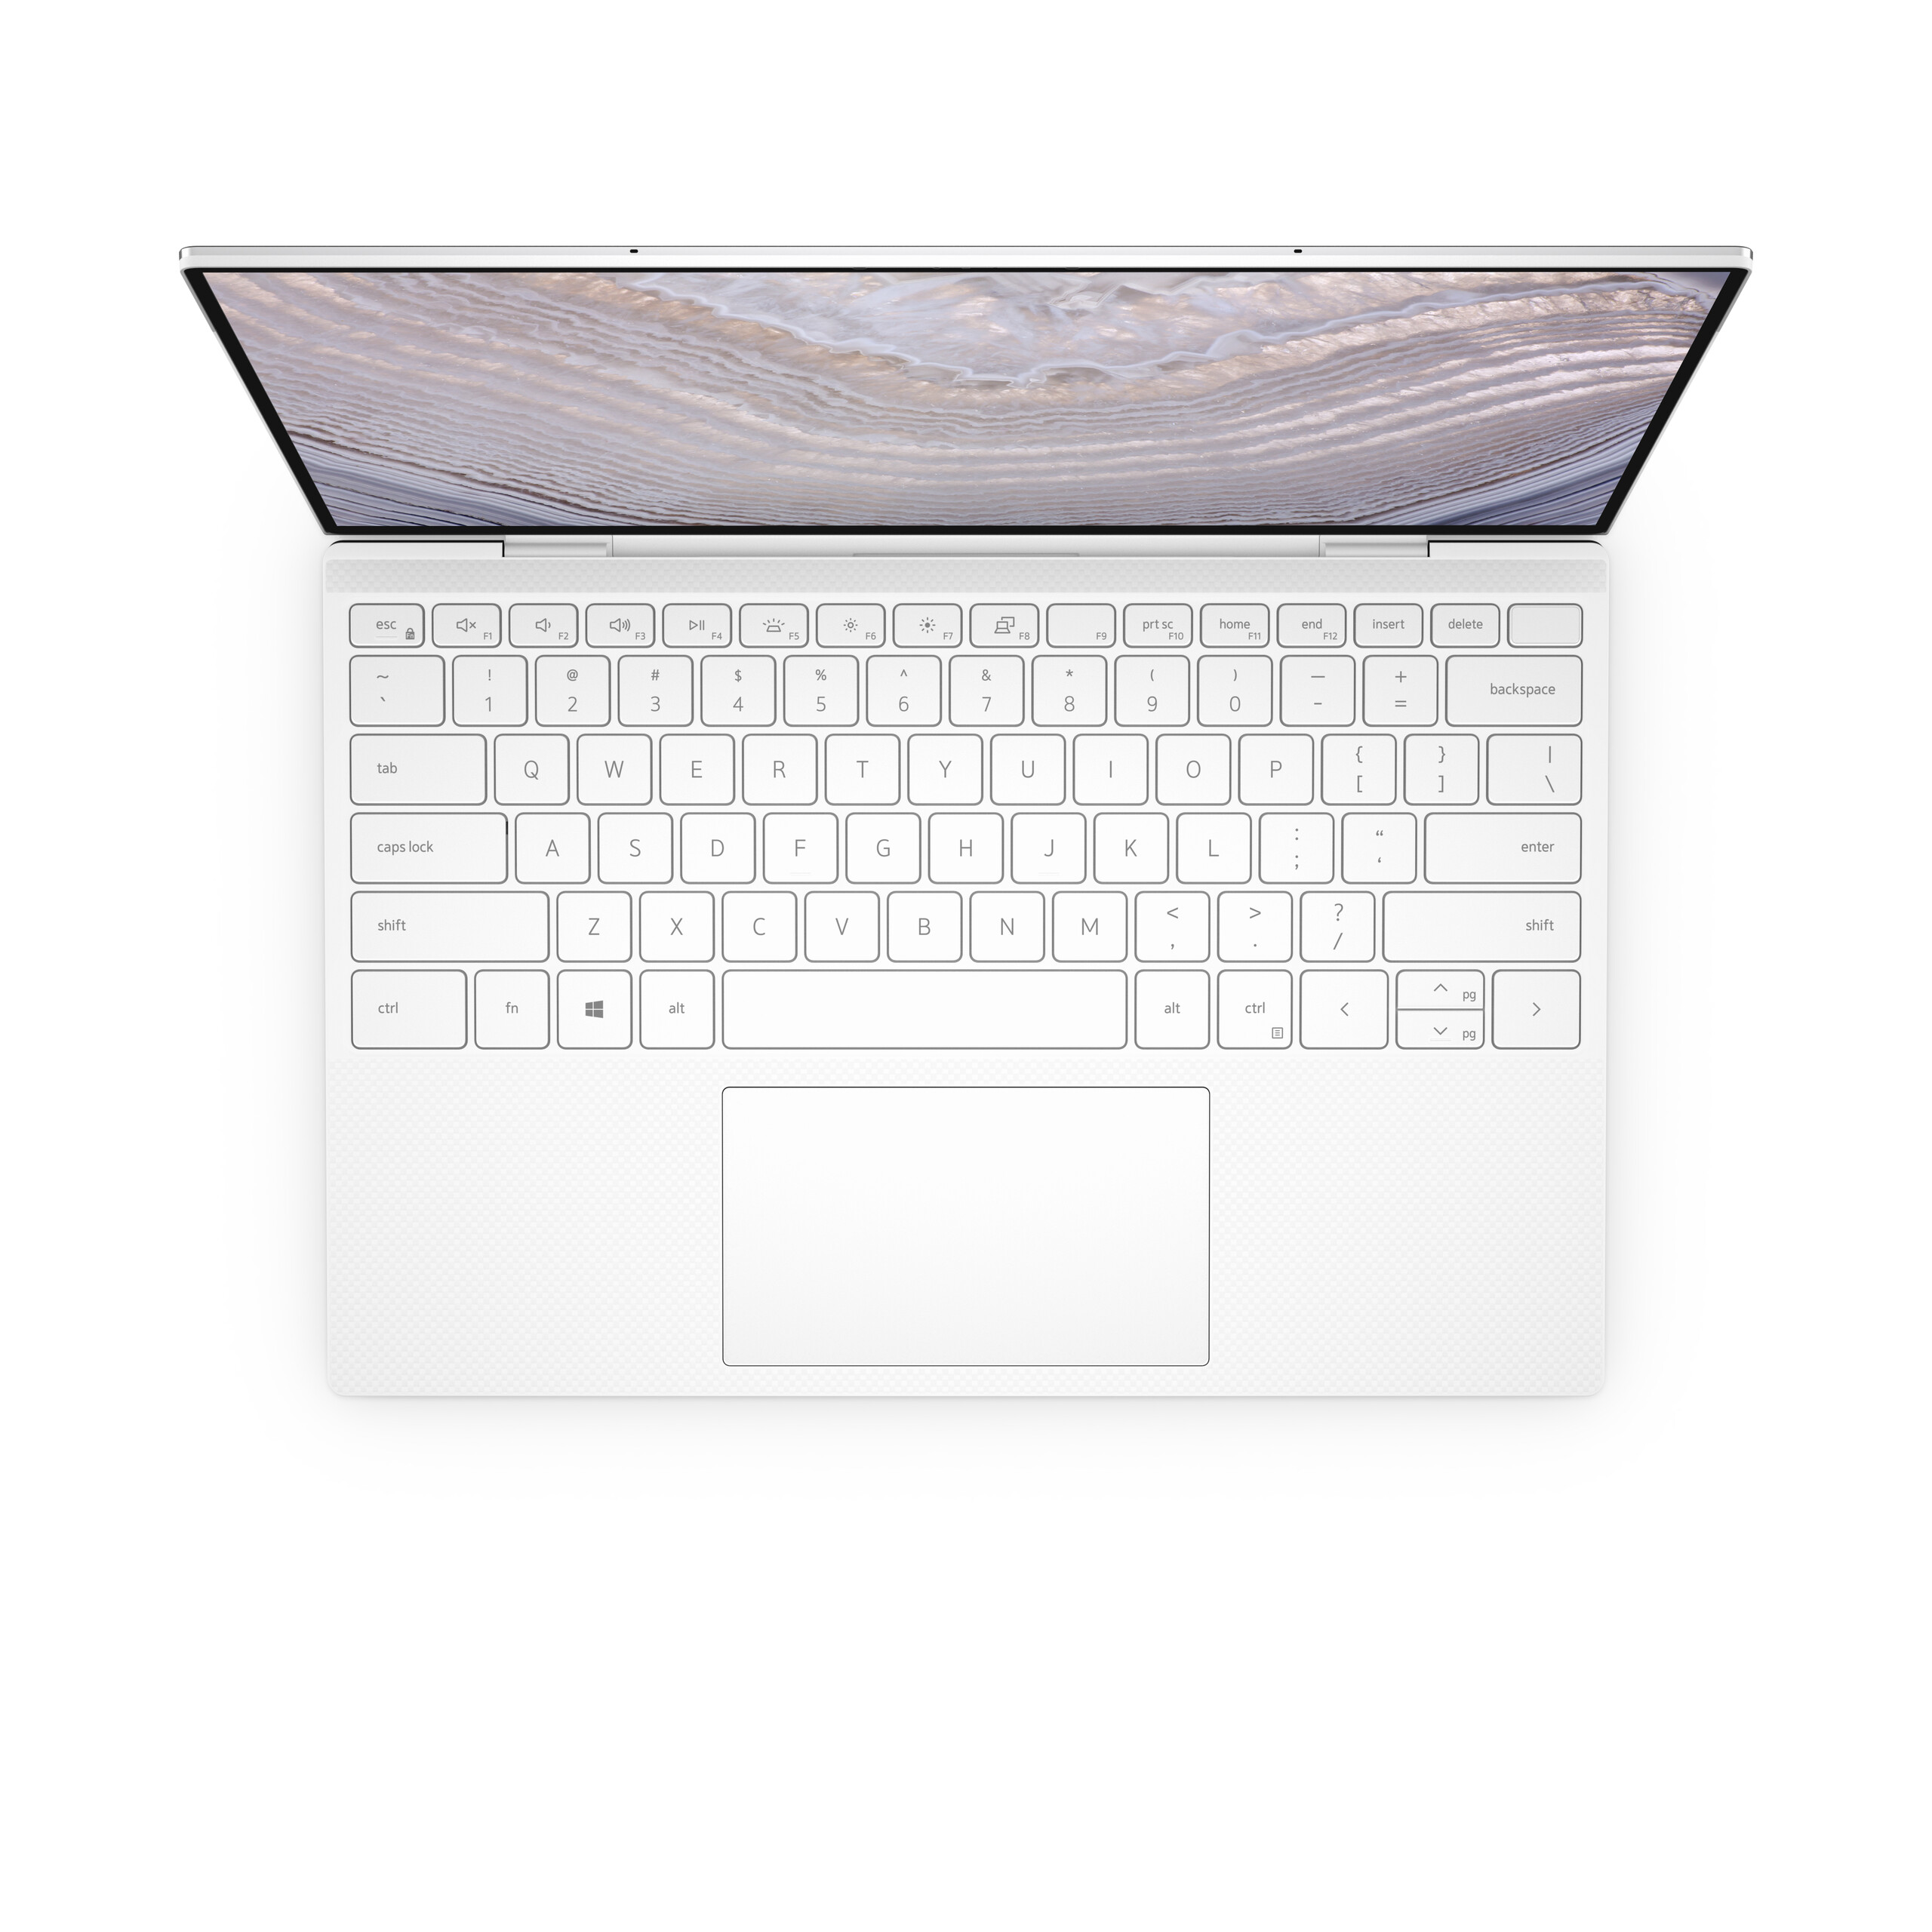
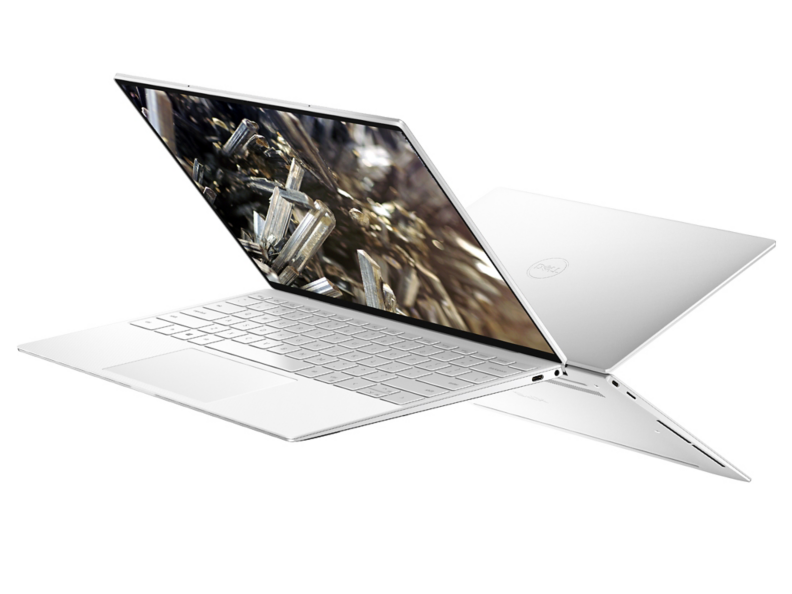
L'ultimo XPS 13 9300 a conchiglia riesce a sostituire l'XPS 13 7390 dell'anno scorso introducendo un nuovo design del telaio che è ancora più piccolo di prima, aumentando le dimensioni sia dello schermo che del clickpad. Maggiori dettagli sul telaio e sulle sue caratteristiche si possono trovare nella nostra attuale pagina della recensione dell'XPS 13 9300 Core i5 qui. La nostra unità di test oggi è la versione XPS 13 9300 Core i7 per vedere quali tipi di vantaggi o svantaggi ci possono essere tra questo e la SKU Core i5.
Altre recensioni Dell:
Punteggio | Data | Modello | Peso | Altezza | Dimensione | Risoluzione | Prezzo |
|---|---|---|---|---|---|---|---|
| 88.9 % v7 (old) | 03/2020 | Dell XPS 13 9300 Core i7-1065G7 i7-1065G7, Iris Plus Graphics G7 (Ice Lake 64 EU) | 1.2 kg | 14.8 mm | 13.40" | 1920x1200 | |
| 85.9 % v7 (old) | 11/2019 | Dell XPS 13 7390 Core i7-10710U i7-10710U, UHD Graphics 620 | 1.2 kg | 11.6 mm | 13.30" | 3840x2160 | |
| 86.3 % v7 (old) | 10/2019 | Dell XPS 13 7390 2-in-1 Core i7 i7-1065G7, Iris Plus Graphics G7 (Ice Lake 64 EU) | 1.3 kg | 13 mm | 13.40" | 1920x1200 | |
| 86.6 % v6 (old) | 05/2019 | Asus ZenBook S13 UX392FN i7-8565U, GeForce MX150 | 1.1 kg | 12.9 mm | 13.90" | 1920x1080 | |
| 84 % v7 (old) | 02/2020 | Microsoft Surface Laptop 3 13 Core i5-1035G7 i5-1035G7, Iris Plus Graphics G7 (Ice Lake 64 EU) | 1.3 kg | 14.5 mm | 13.50" | 2256x1504 |
Case

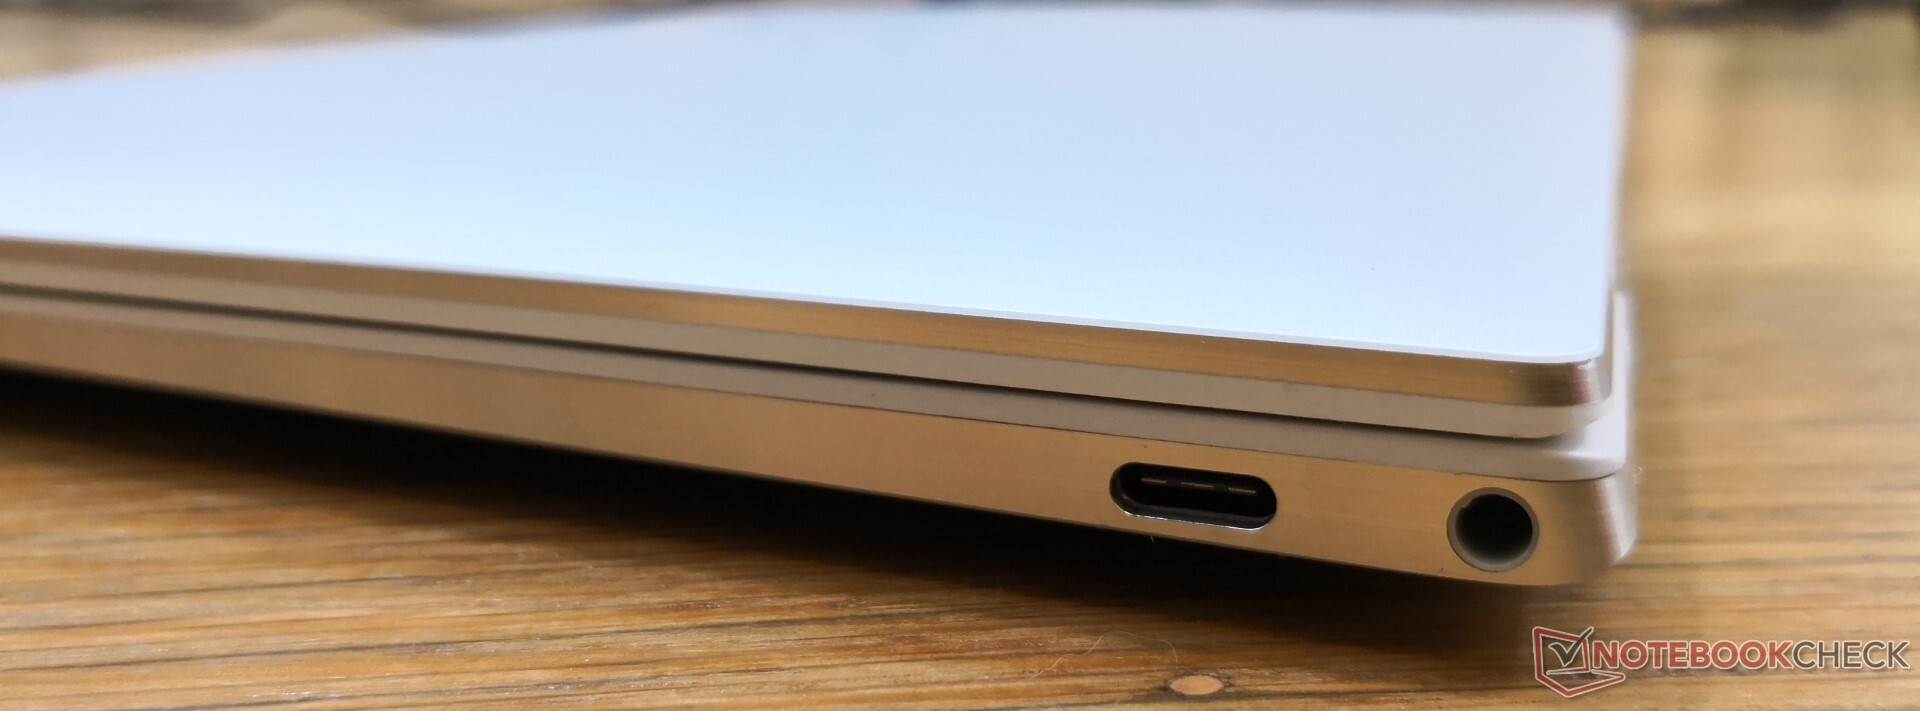
Connettività
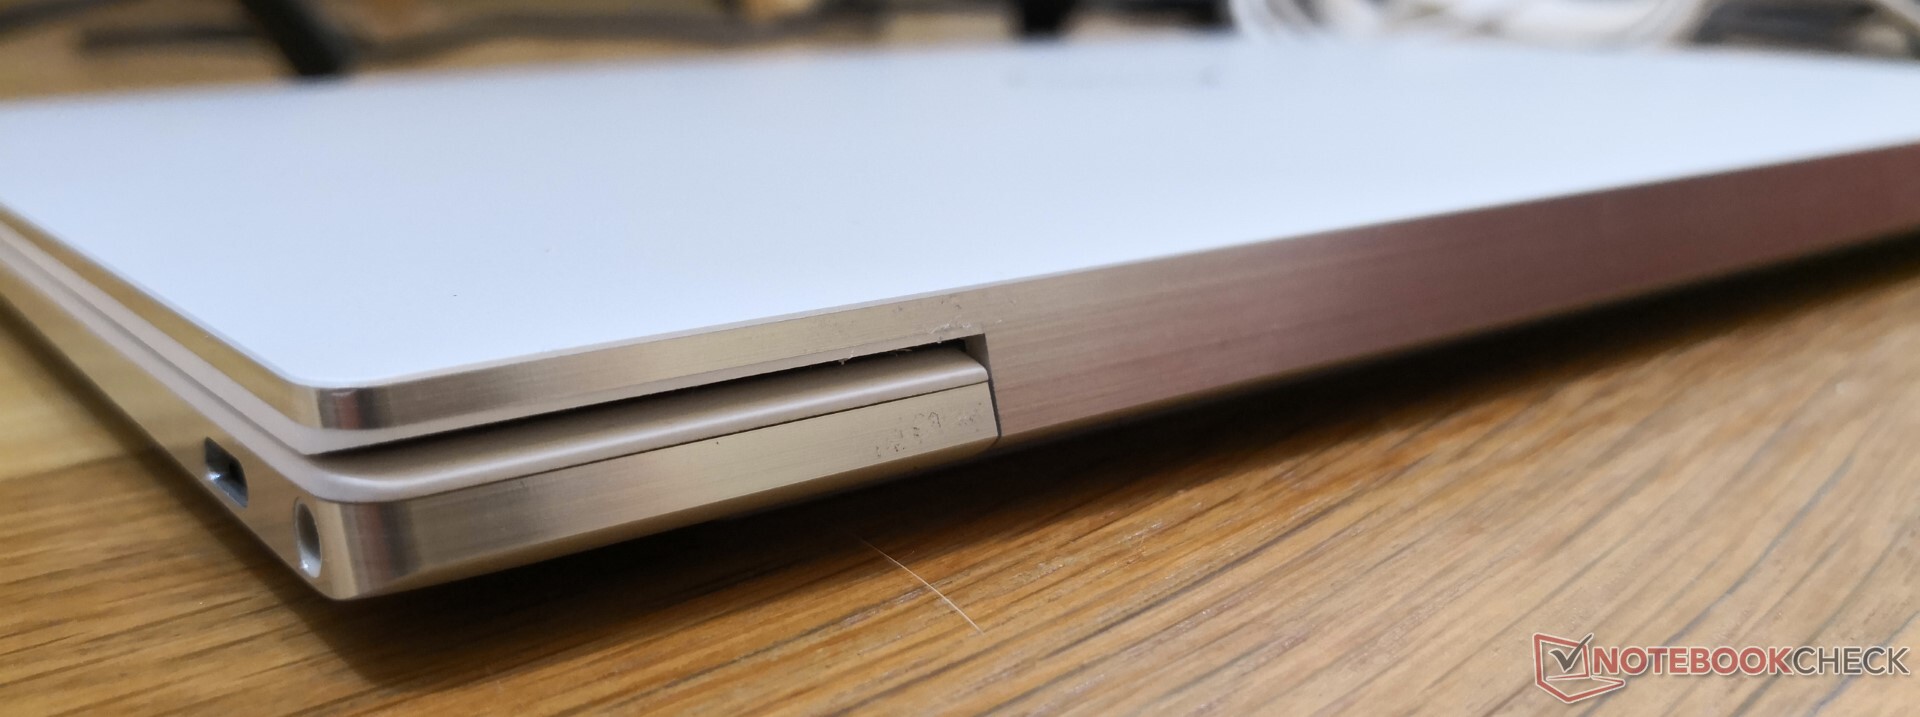
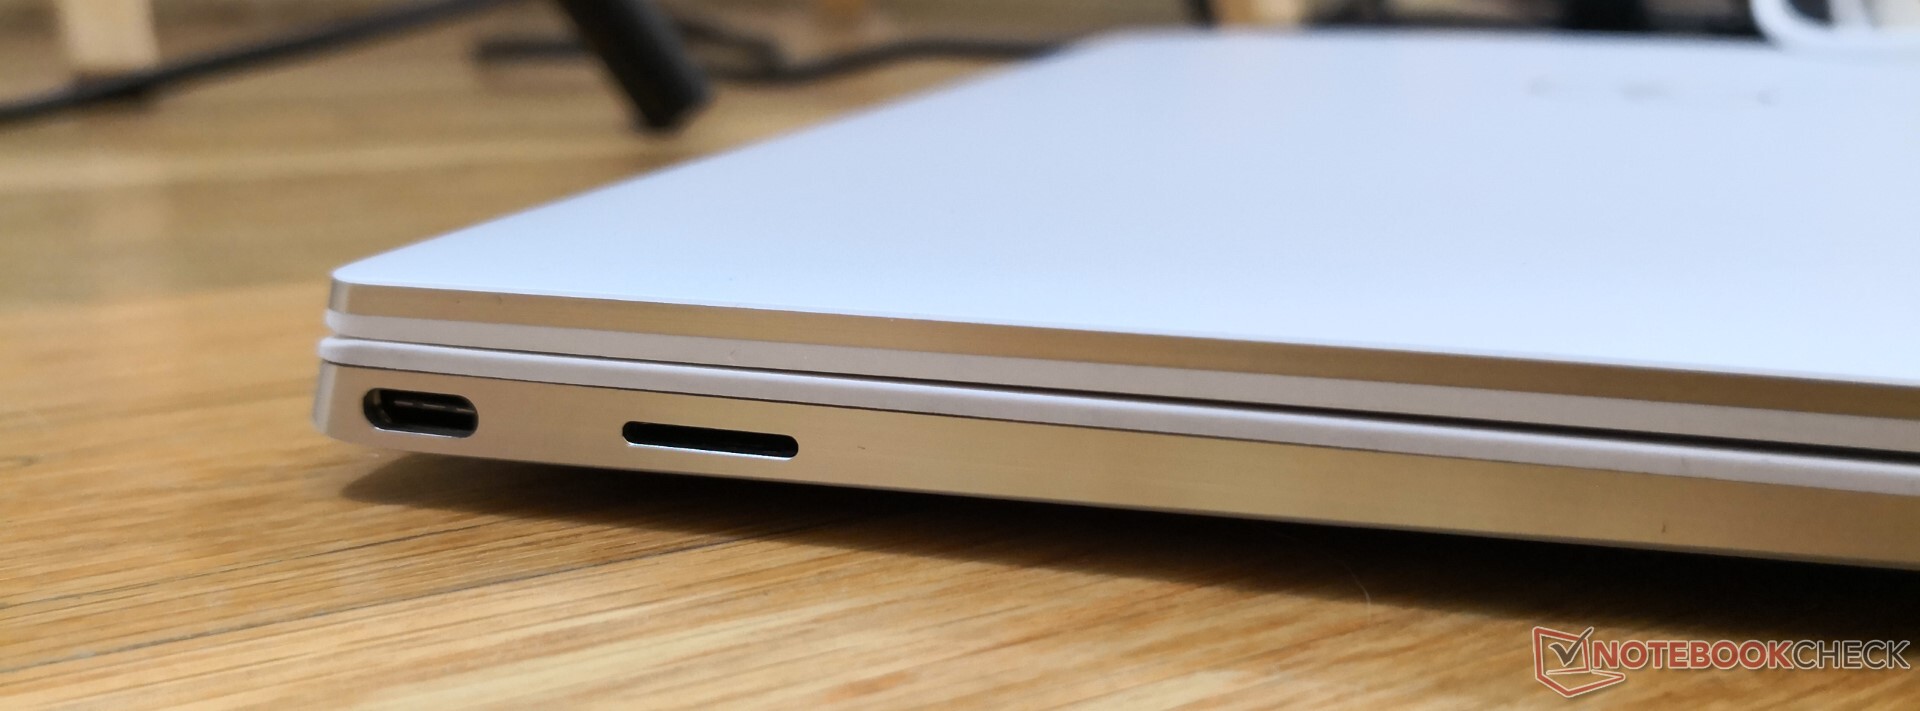
Lettore schede SD
| SD Card Reader | |
| average JPG Copy Test (av. of 3 runs) | |
| Dell XPS 13 7390 Core i7-10710U (Toshiba Exceria Pro M501 64 GB UHS-II) | |
| Dell XPS 13 9300 Core i7-1065G7 (Toshiba Exceria Pro M501 64 GB UHS-II) | |
| Dell XPS 13 7390 2-in-1 Core i7 (Toshiba Exceria Pro M501 64 GB UHS-II) | |
| Asus ZenBook S13 UX392FN (Toshiba Exceria Pro M501 64 GB UHS-II) | |
| maximum AS SSD Seq Read Test (1GB) | |
| Dell XPS 13 7390 Core i7-10710U (Toshiba Exceria Pro M501 64 GB UHS-II) | |
| Dell XPS 13 7390 2-in-1 Core i7 (Toshiba Exceria Pro M501 64 GB UHS-II) | |
| Dell XPS 13 9300 Core i7-1065G7 (Toshiba Exceria Pro M501 64 GB UHS-II) | |
| Asus ZenBook S13 UX392FN (Toshiba Exceria Pro M501 64 GB UHS-II) | |
Comunicazioni
La WLAN è fornita dall'Intel Killer 1650x, che è essenzialmente identica all'Intel AX200/201, ma con ulteriori funzioni software specifiche Killer. E' un po' eccessivo per un sistema XPS, dato che la Killer si rivolge maggiormente ad utenti avanzati come i gamers della serie Dell G o della serie Alienware. Siamo in grado di registrare velocità di trasferimento medie da 800 Mbps a 1400 Mbps quando ci troviamo a un metro di distanza dal nostro router Netgear RAX200 Wi-Fi 6-enabled. La velocità di trasmissione avrebbe potuto essere più stabile in quanto è scesa fino a 232 Mbps anche dopo un retest.
Webcam

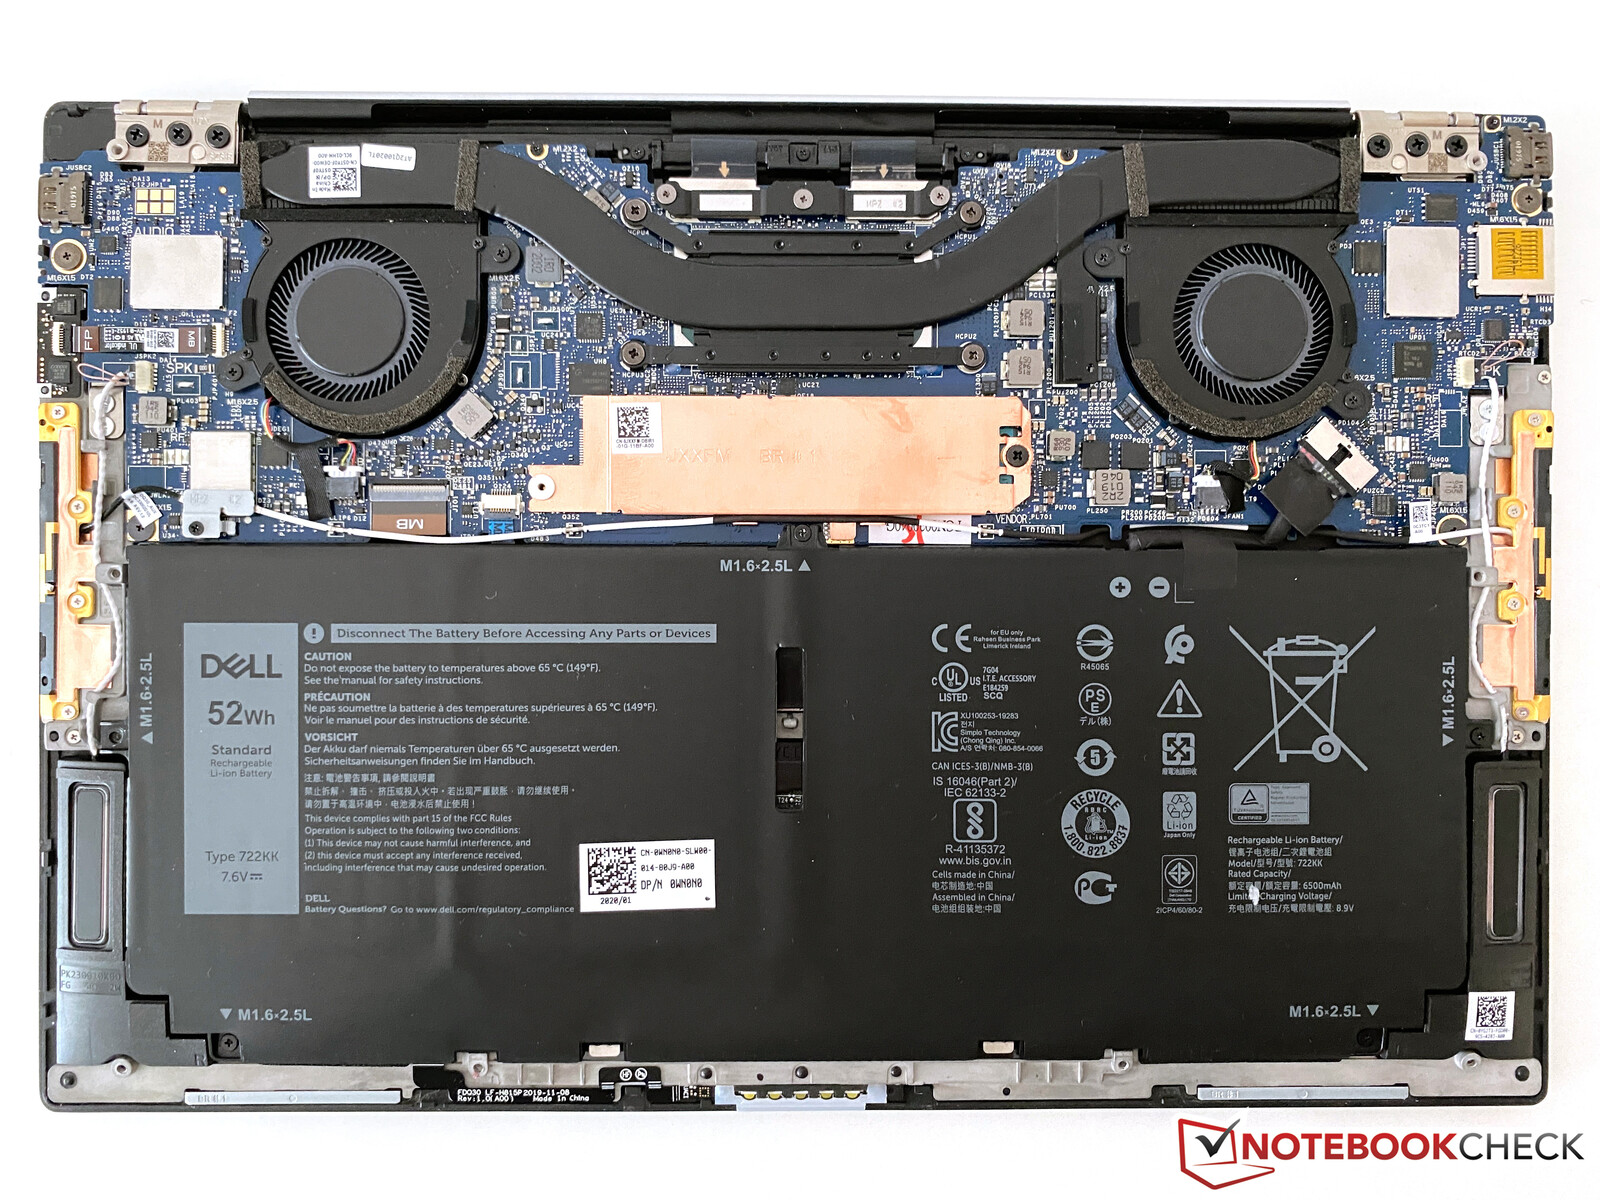
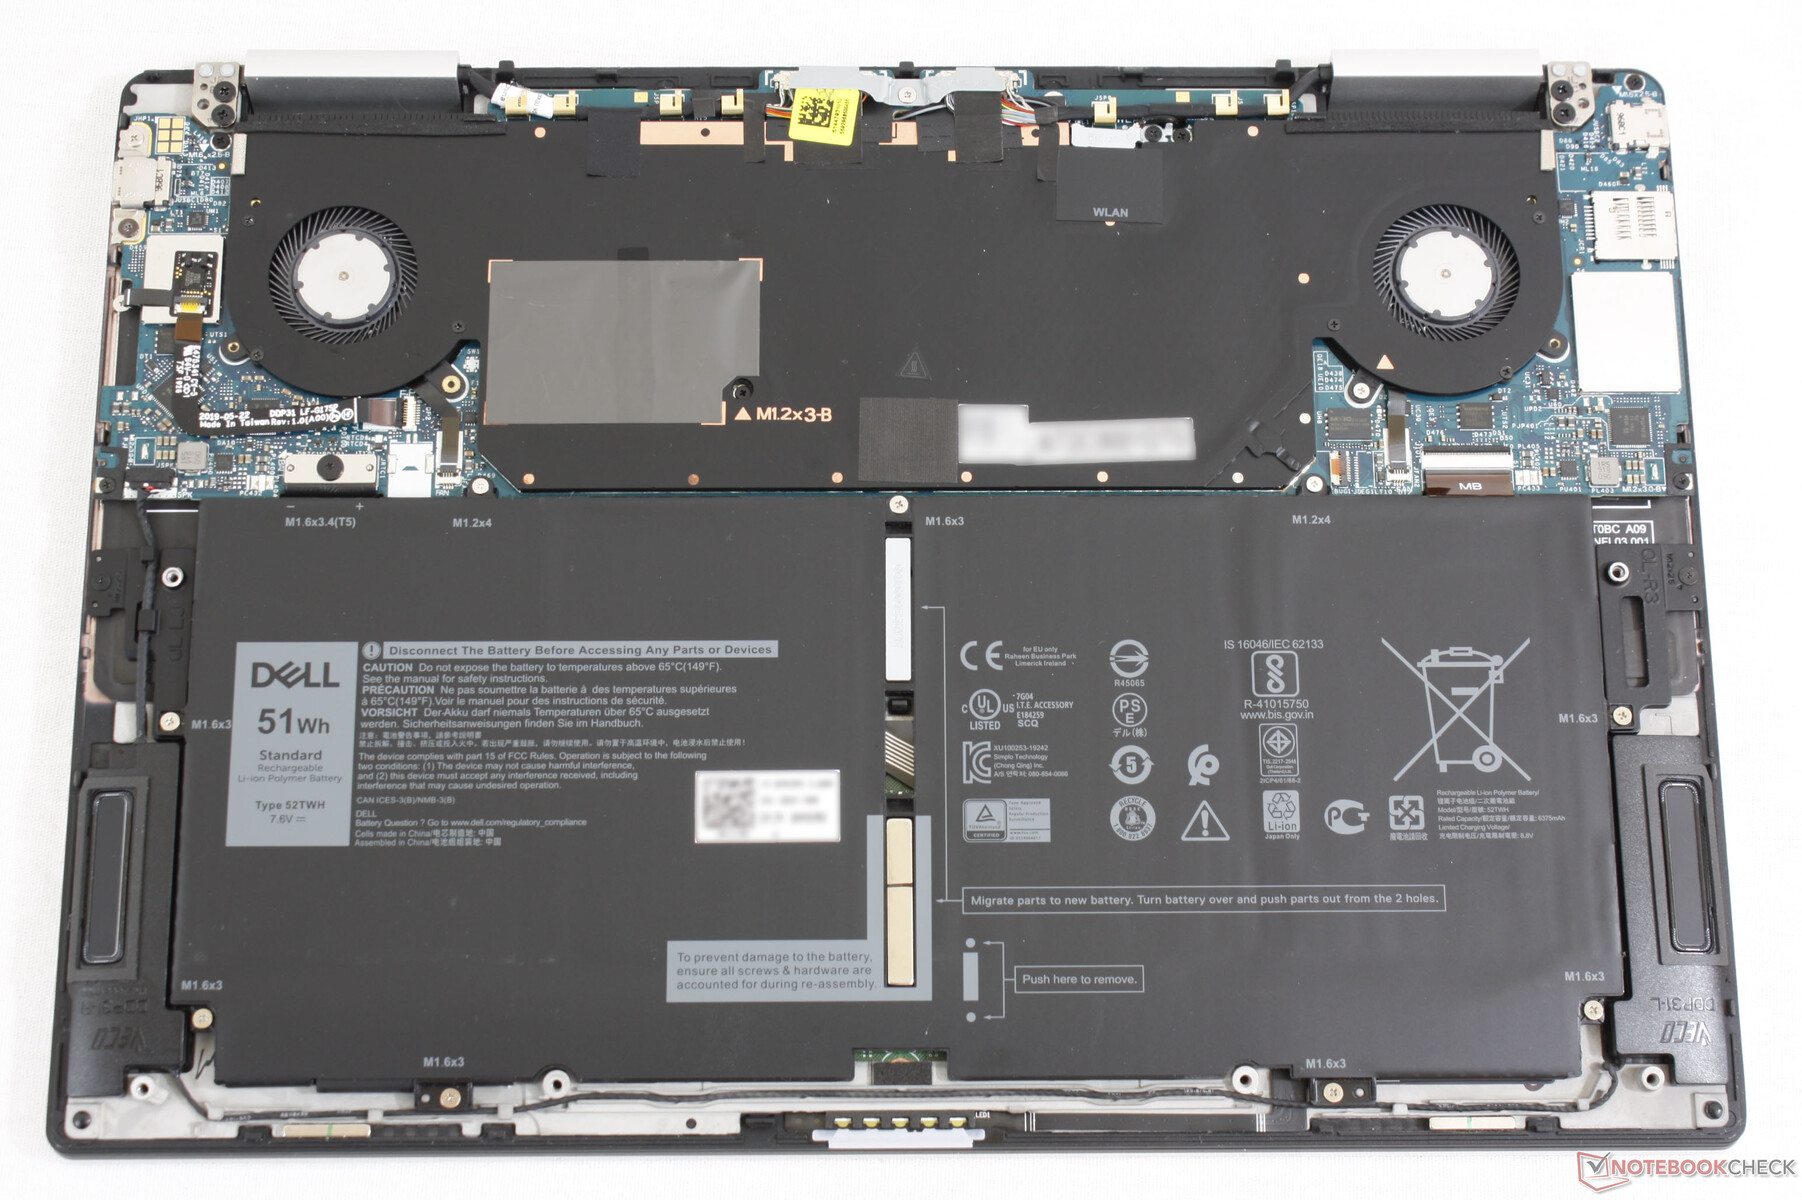
Manutenzione
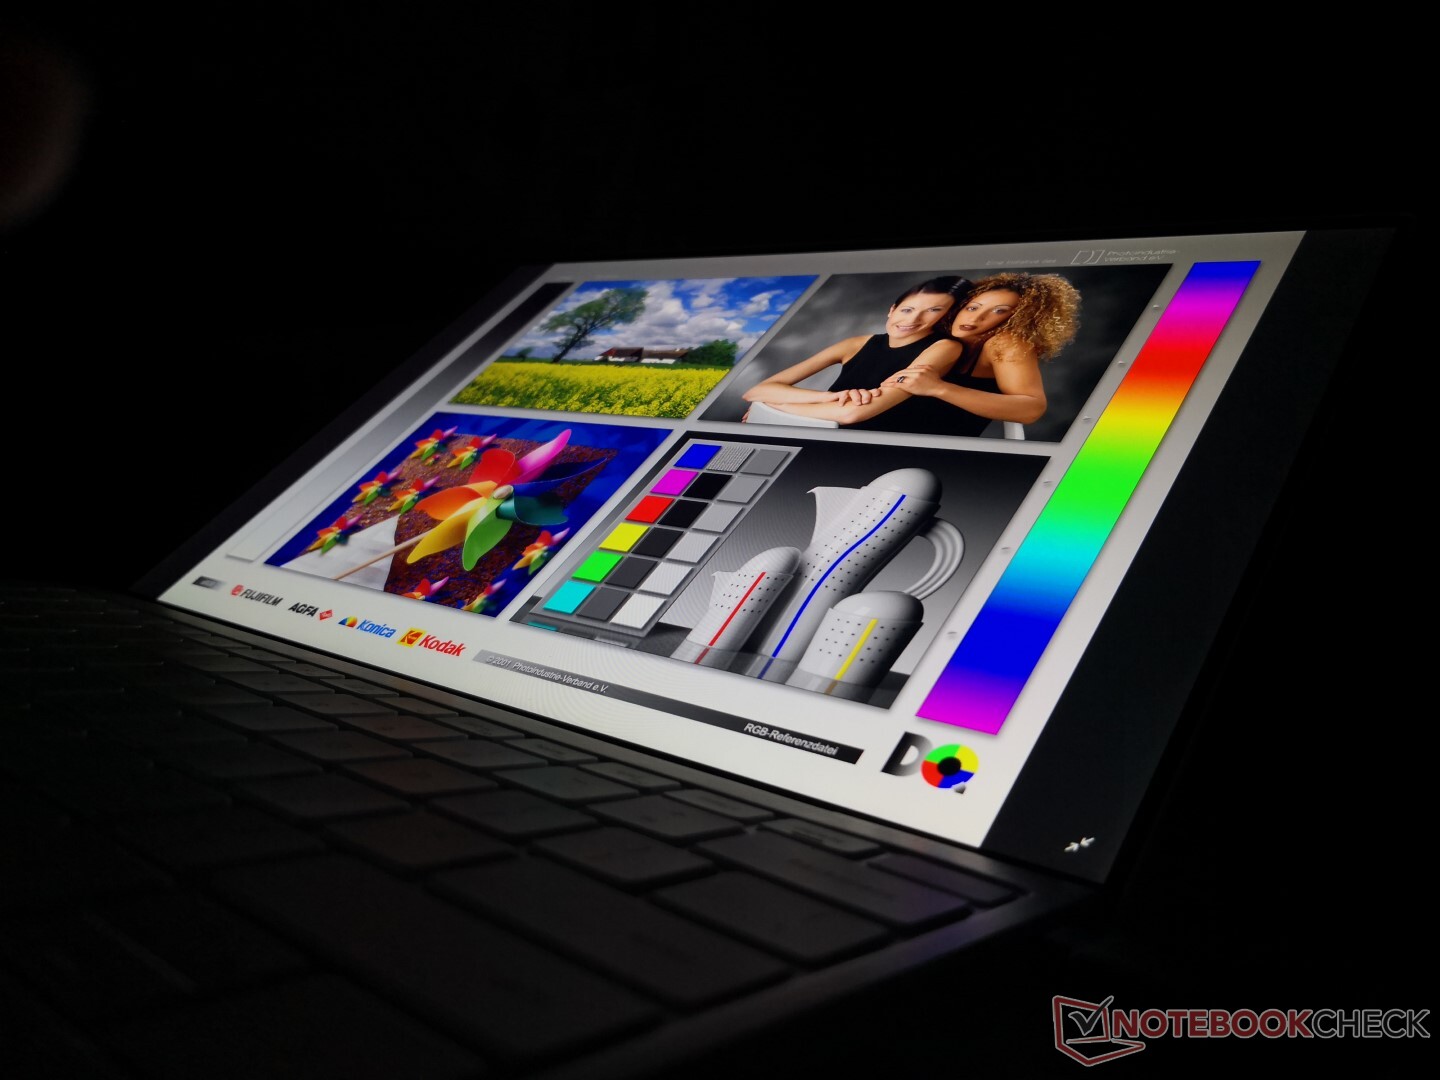
Display
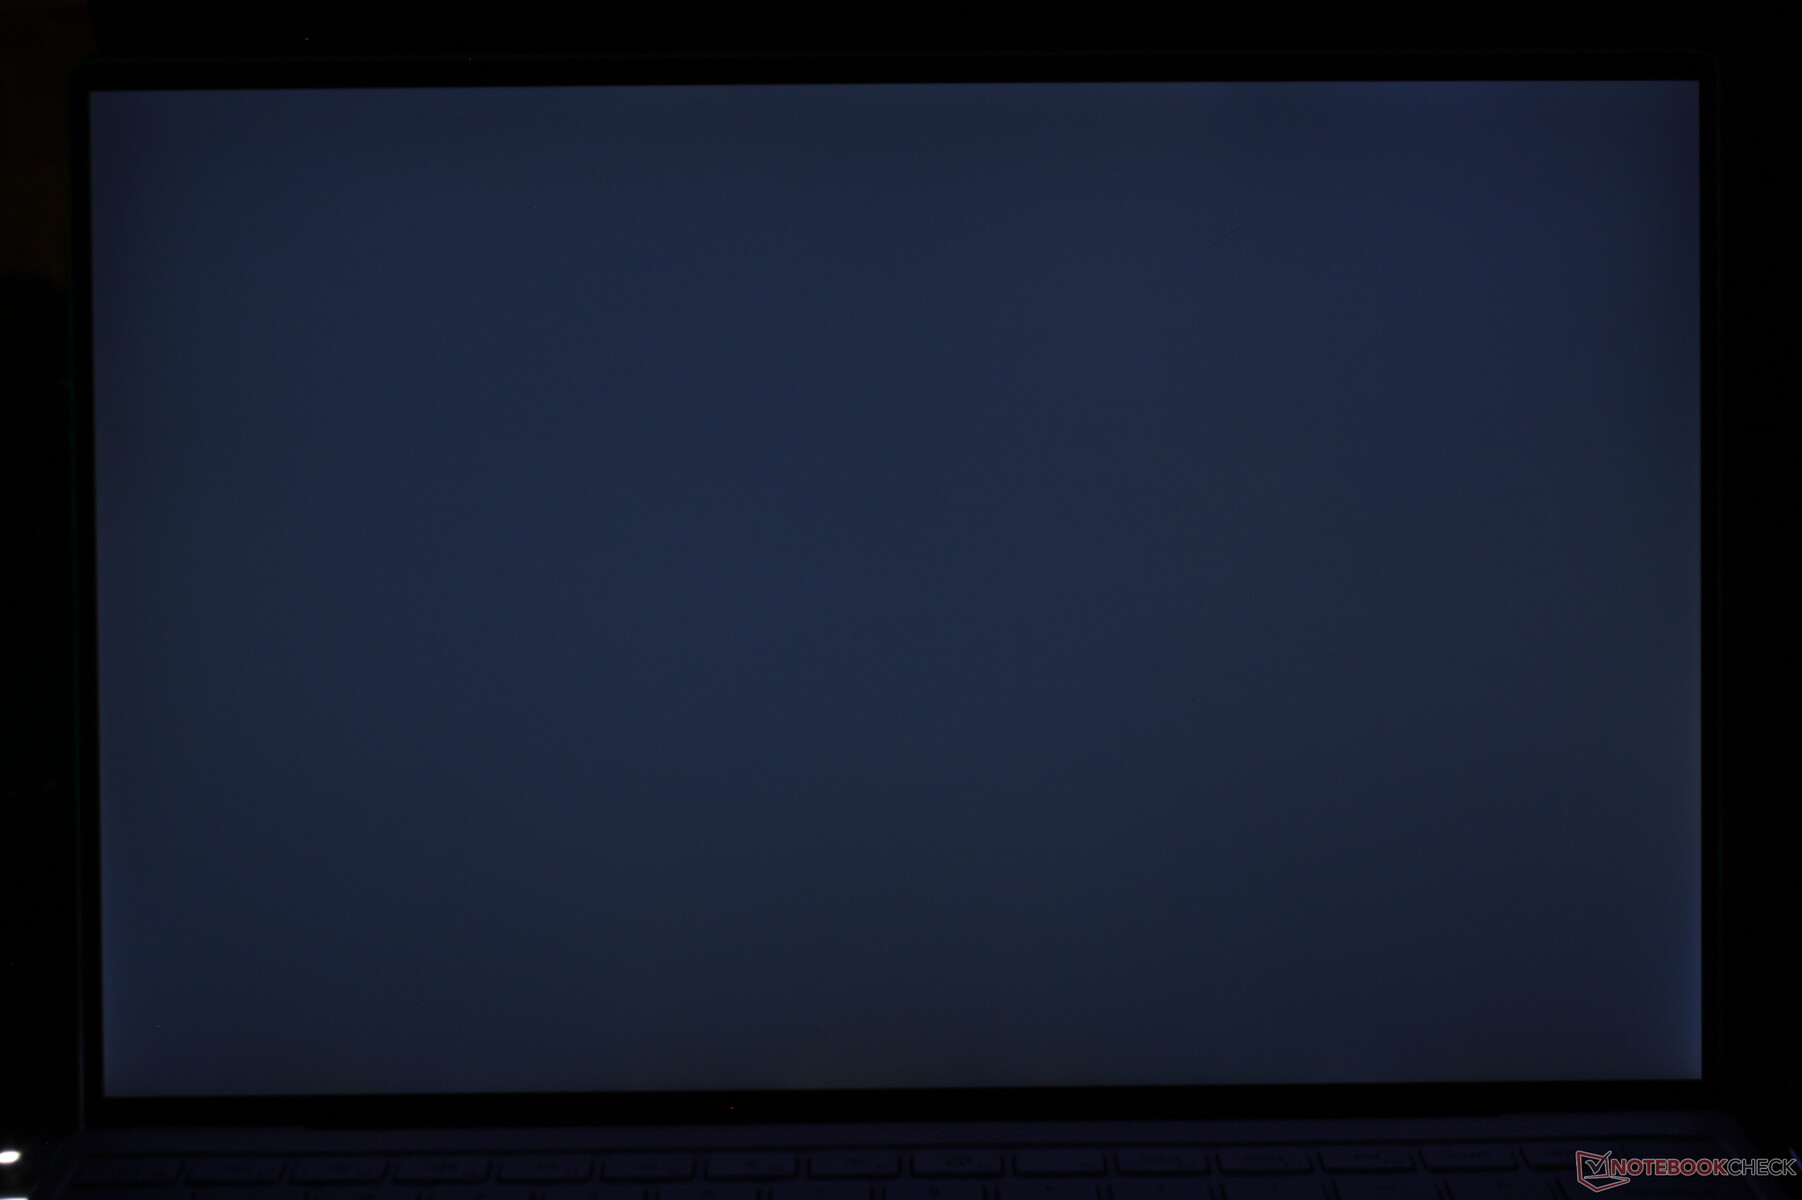
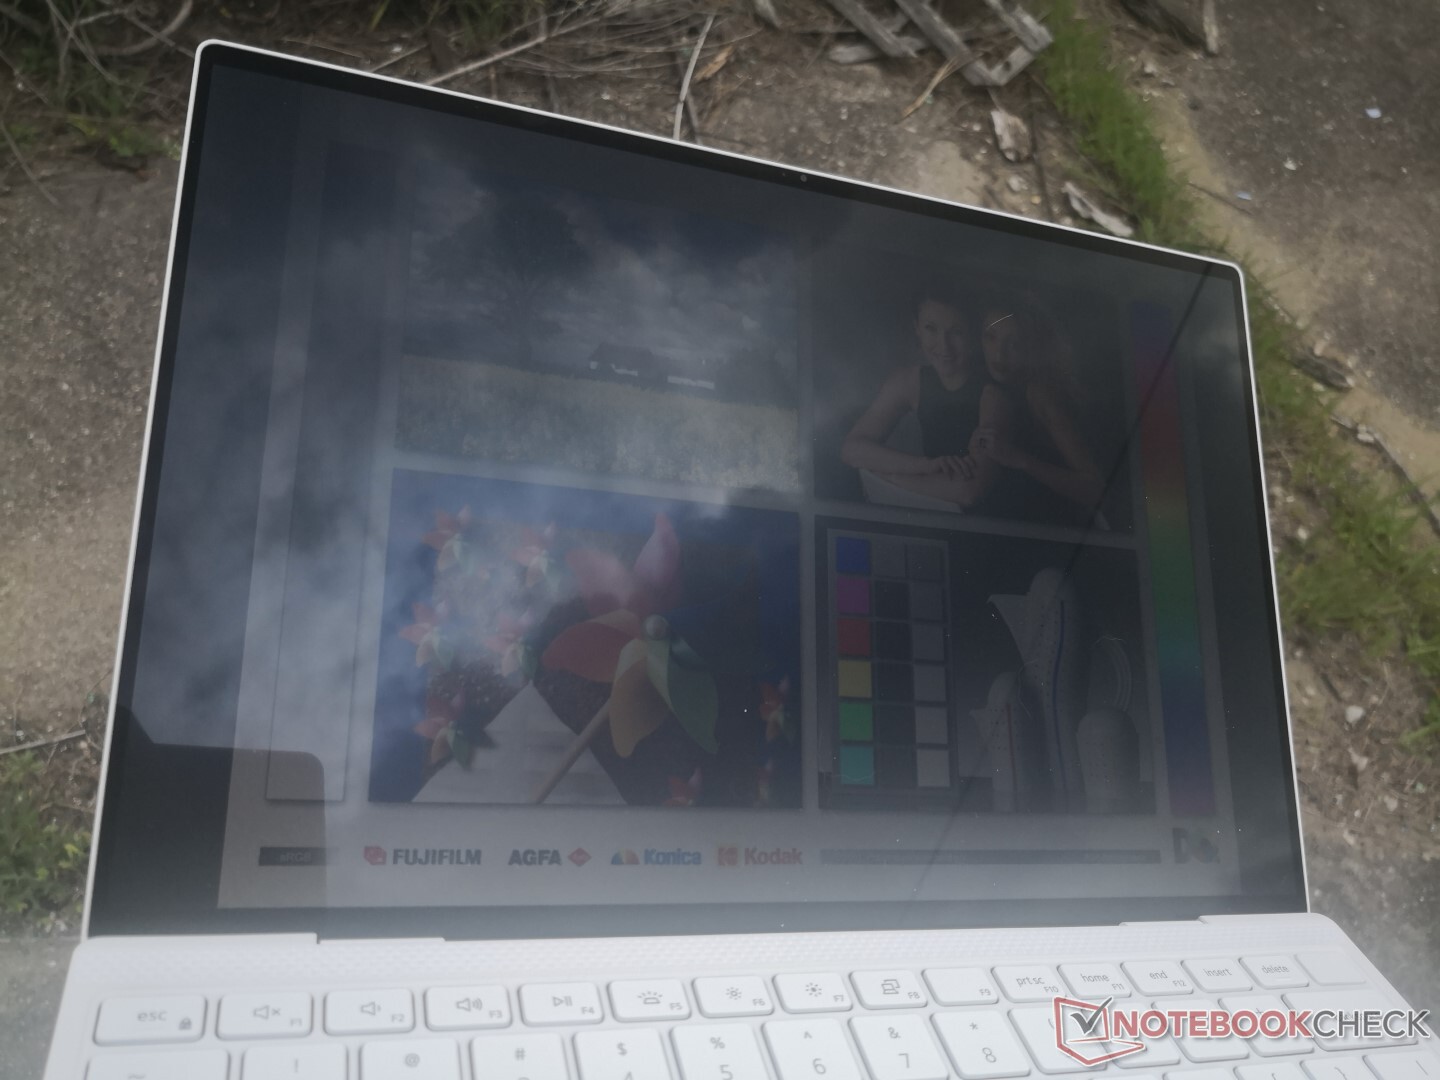
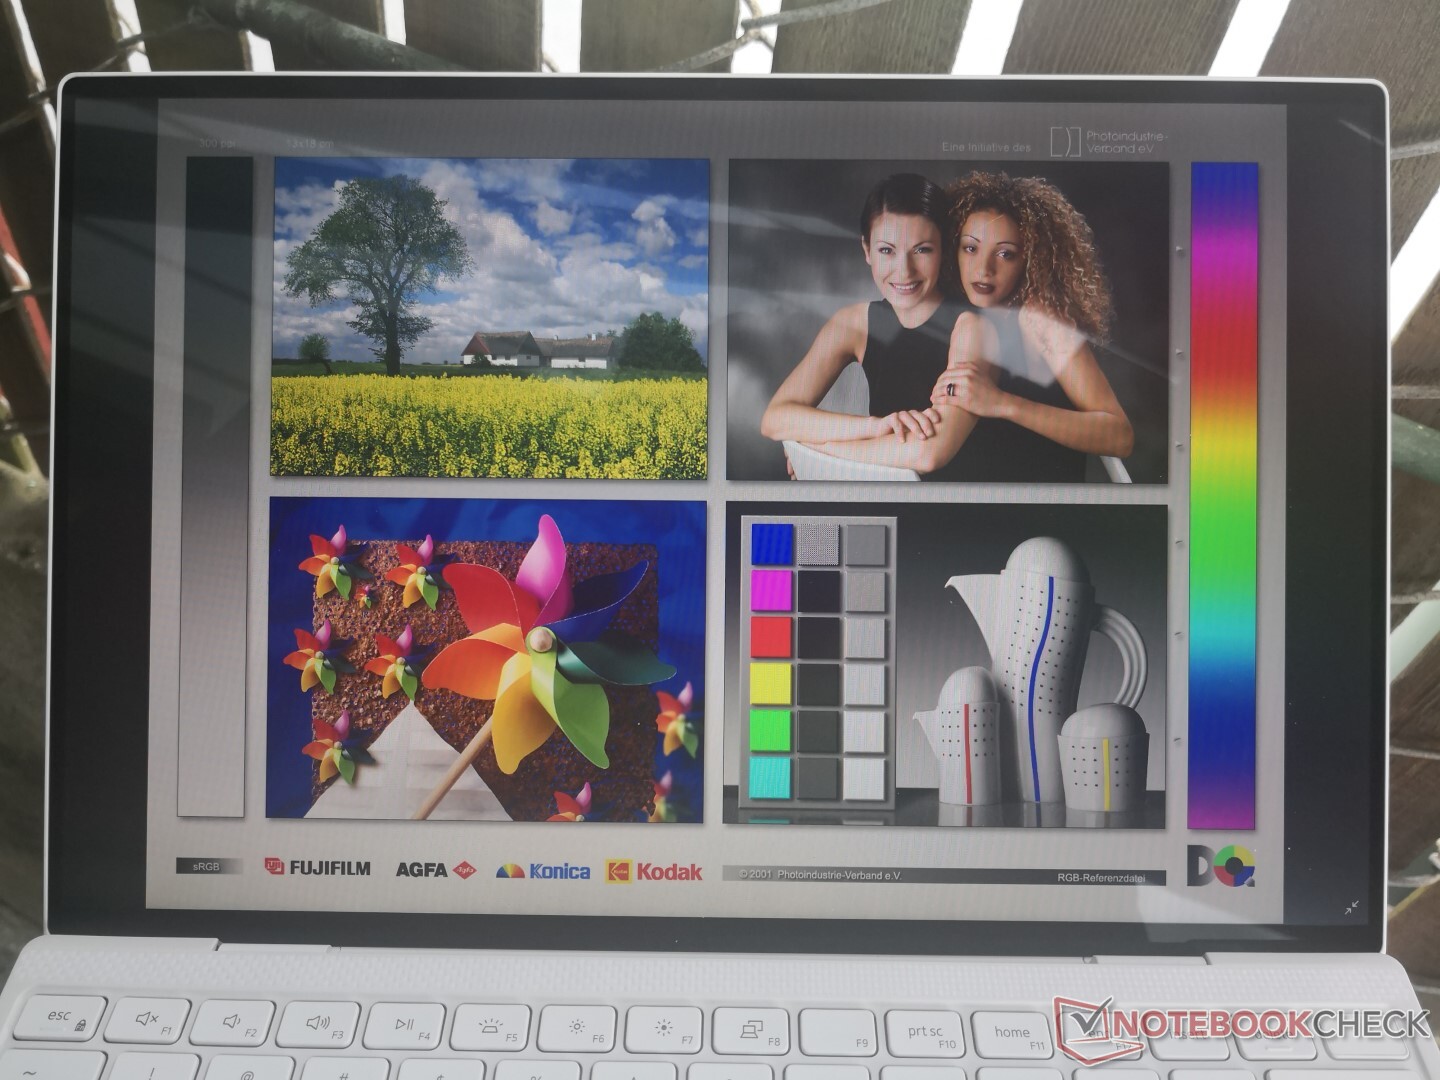
Dell dichiara una luminosità di 500 nits per le sue SKU XPS 13 9300 FHD. È interessante notare che siamo in grado di misurare una luminosità massima di 600 nits su due diverse SKU FHD risultand più luminose di ciò che Dell pubblicizza. Abbiamo scoperto che il display si oscura automaticamente fino a un massimo di 500 nits solo quando viene scollegato dalla presa di corrente e funziona a batteria.
Fortunatamente, è possibile ottenere i 600 nits quando si utilizza l'alimentazione a batteria con pochi clic, come descritto in dettaglio qui. Gli utenti dovranno disabilitare la luminosità adattiva tramite Windows, quindi disabilitare di nuovo la luminosità adattiva tramite il software Intel Graphics Control Center, abilitare il risparmio energetico del display e quindi disabilitare il risparmio energetico avanzato in questo ordine. Si tratta di un processo contorto che coinvolge più finestre quando avrebbe dovuto essere solo uno o due clic al massimo.
Vale la pena notare che l'XPS 13 9300 utilizza esattamente lo stesso pannello IPS da 13,4 pollici 16:10 Sharp LQ134N1 IPS visto sull'XPS 13 7390 2-in-1 ed entrambi i sistemi hanno caratteristiche molto simili. Anche le loro frequenze di modulazione della larghezza di impulso sono le stesse a 2500 Hz il che suggerisce che possono condividere altri componenti simili.


| |||||||||||||||||||||||||
Distribuzione della luminosità: 96 %
Al centro con la batteria: 607.6 cd/m²
Contrasto: 1519:1 (Nero: 0.4 cd/m²)
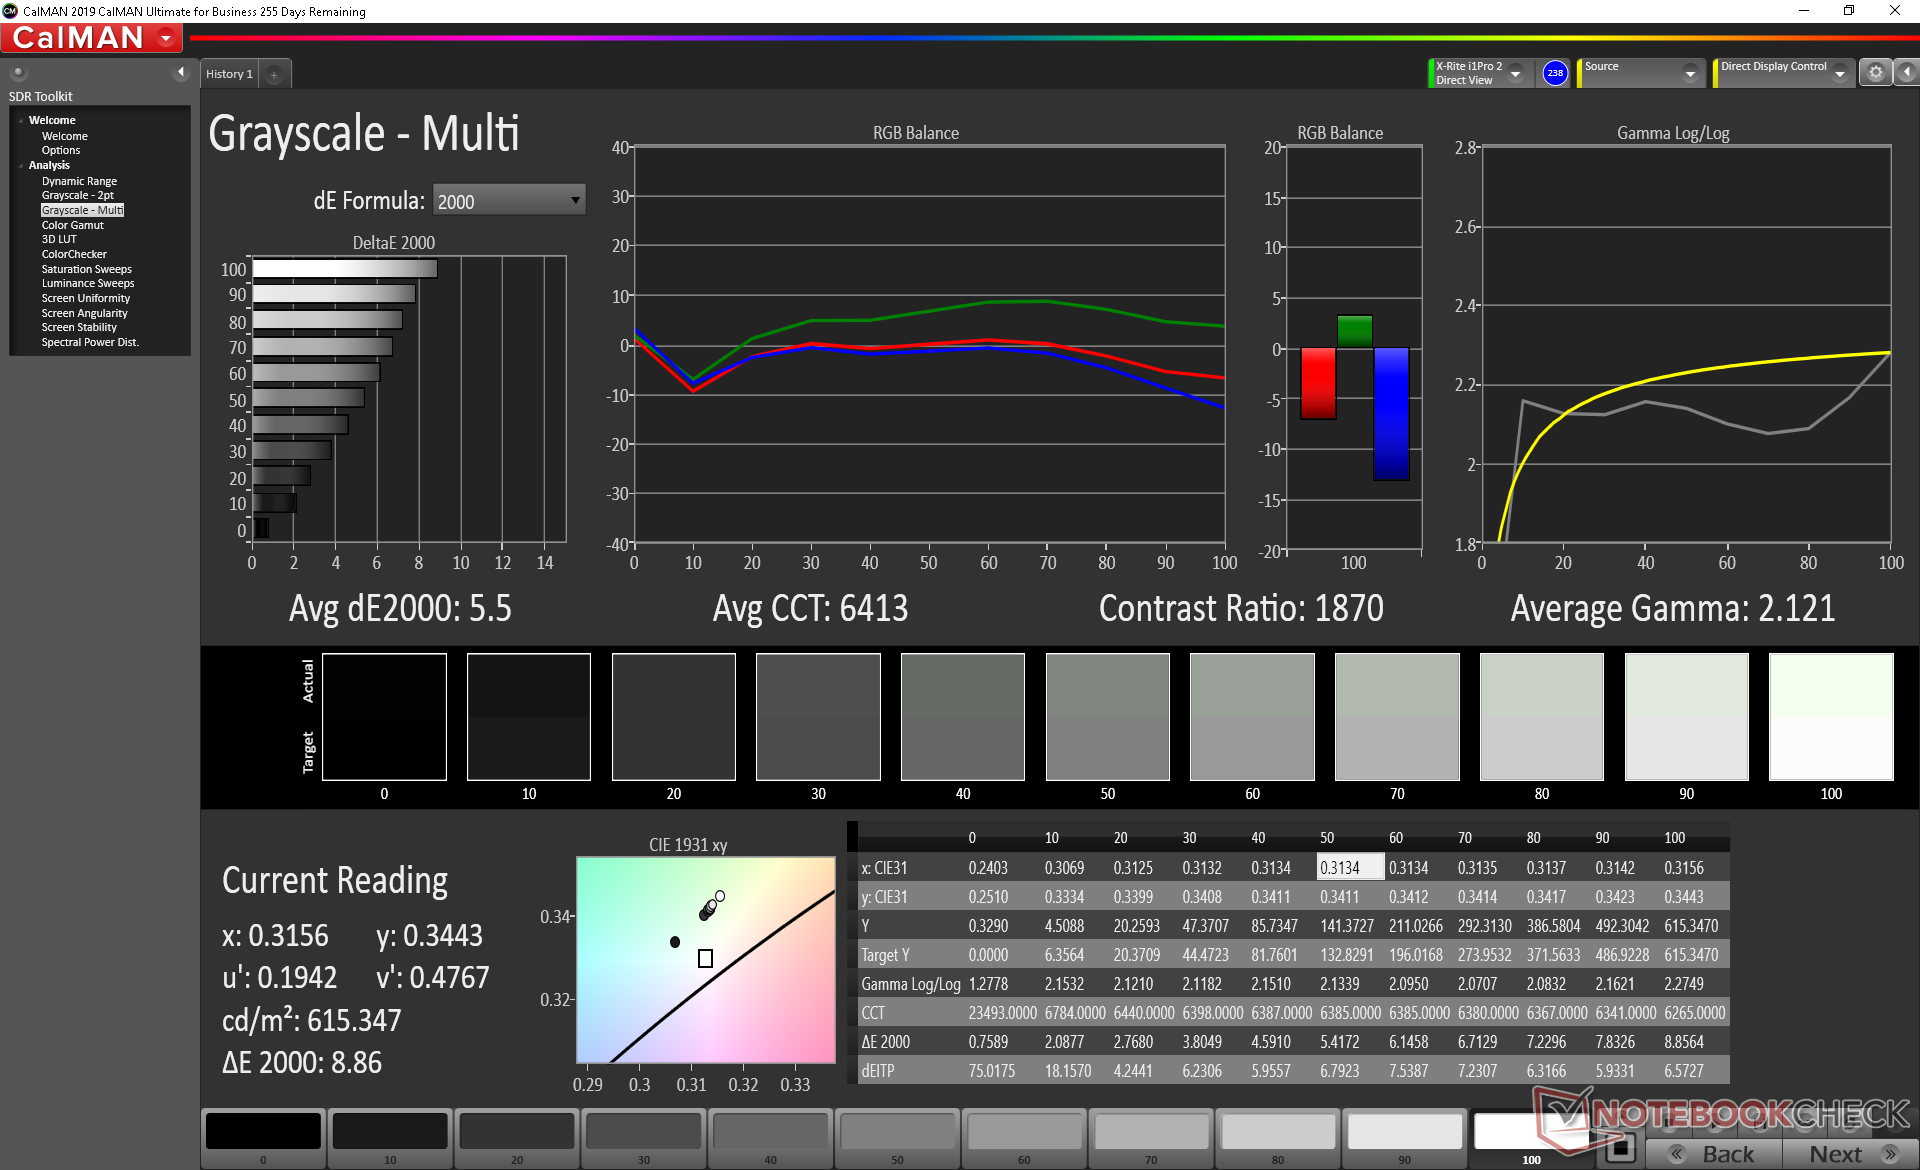
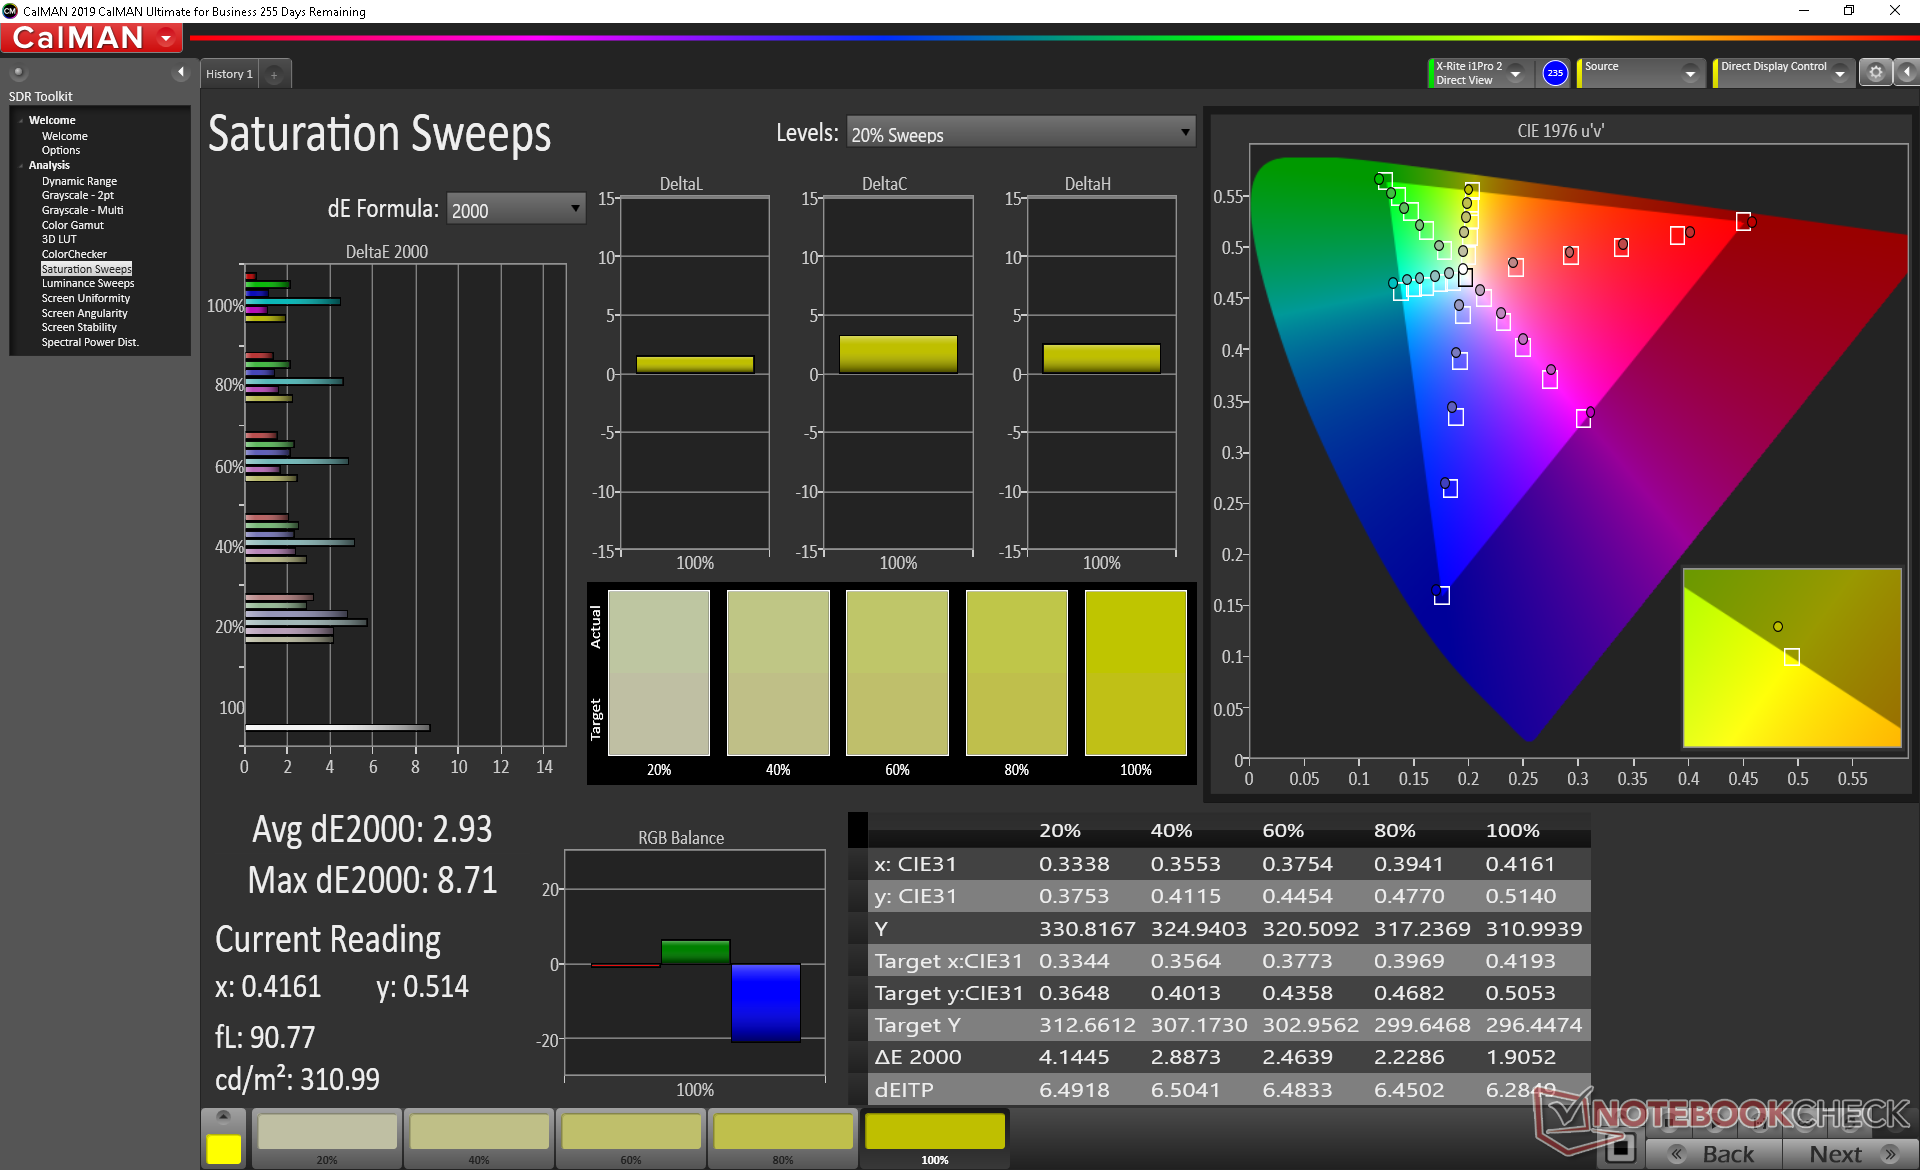
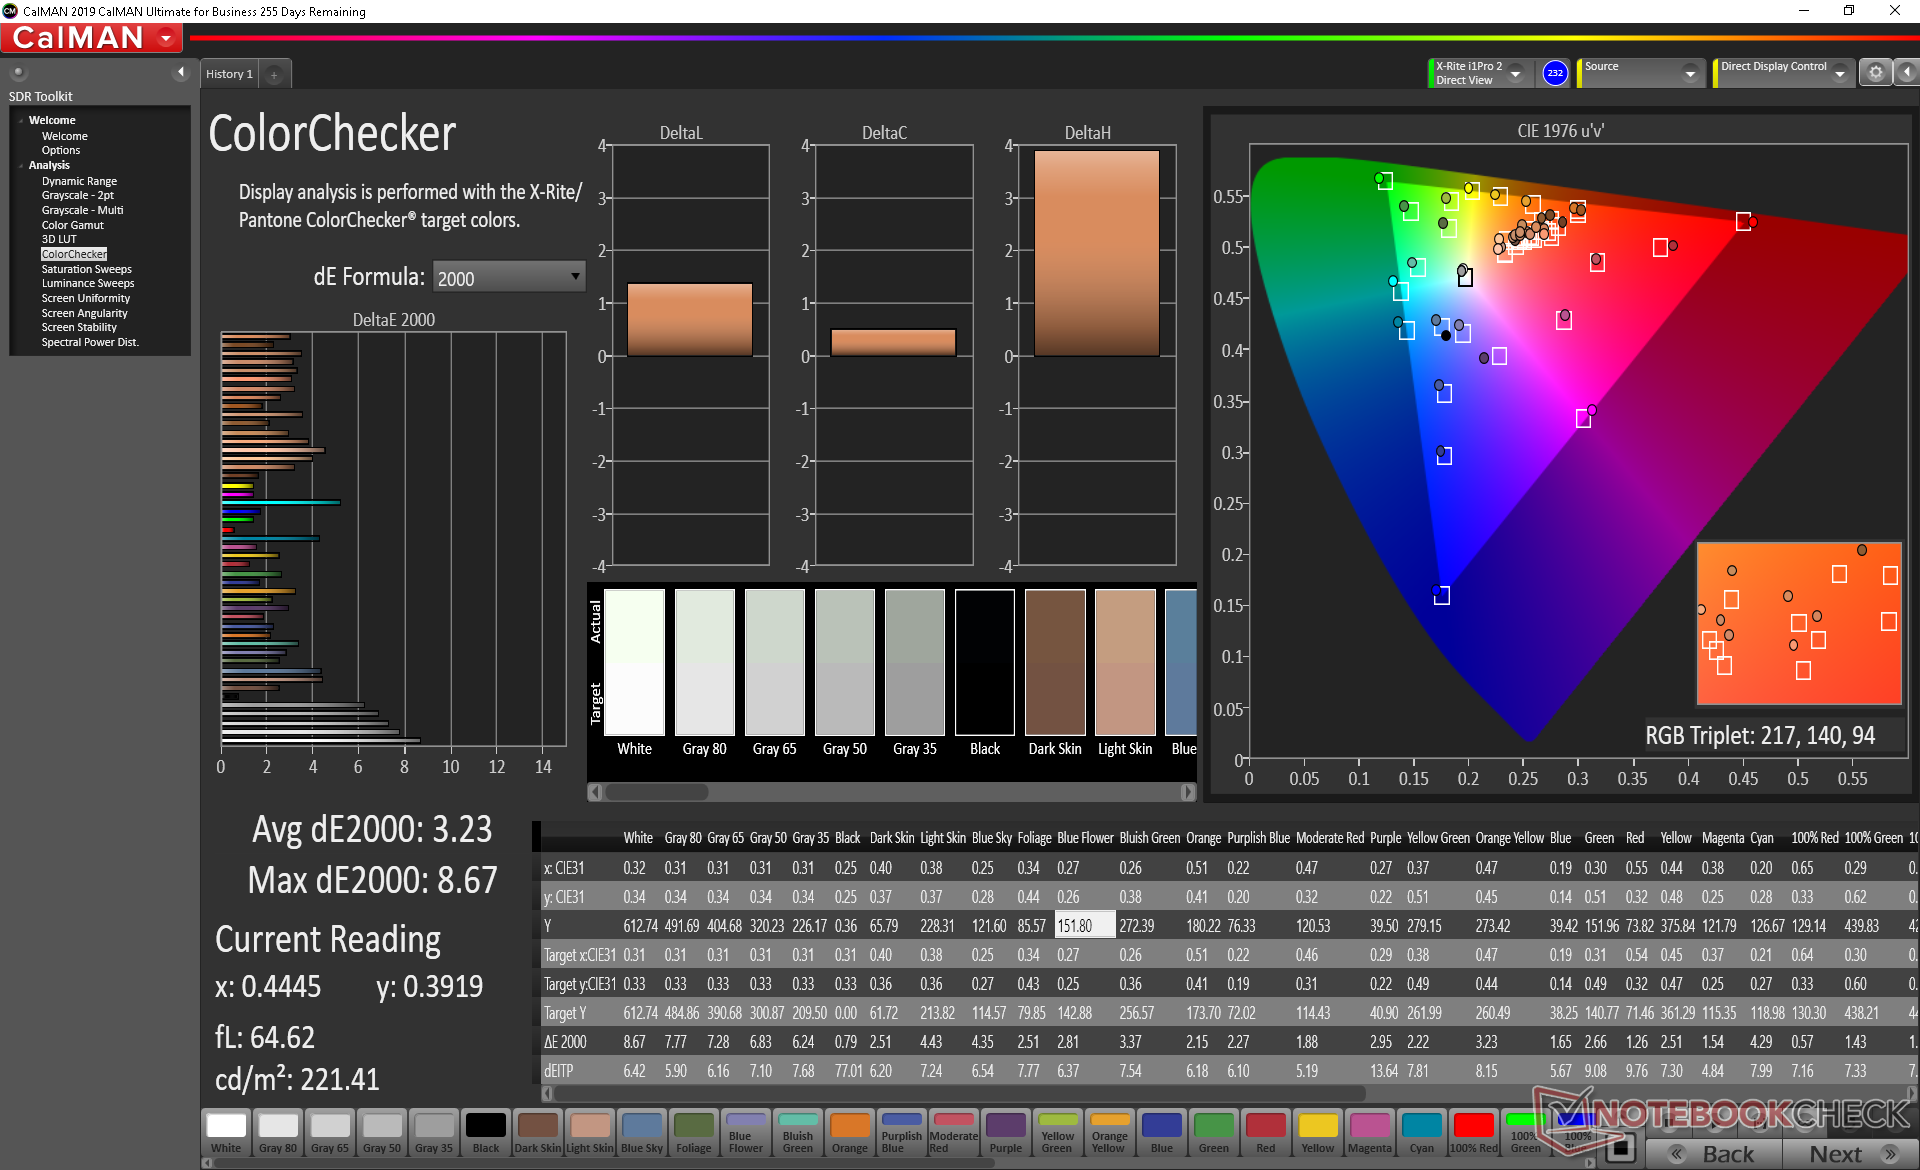
ΔE ColorChecker Calman: 3.23 | ∀{0.5-29.43 Ø4.72}
calibrated: 1.01
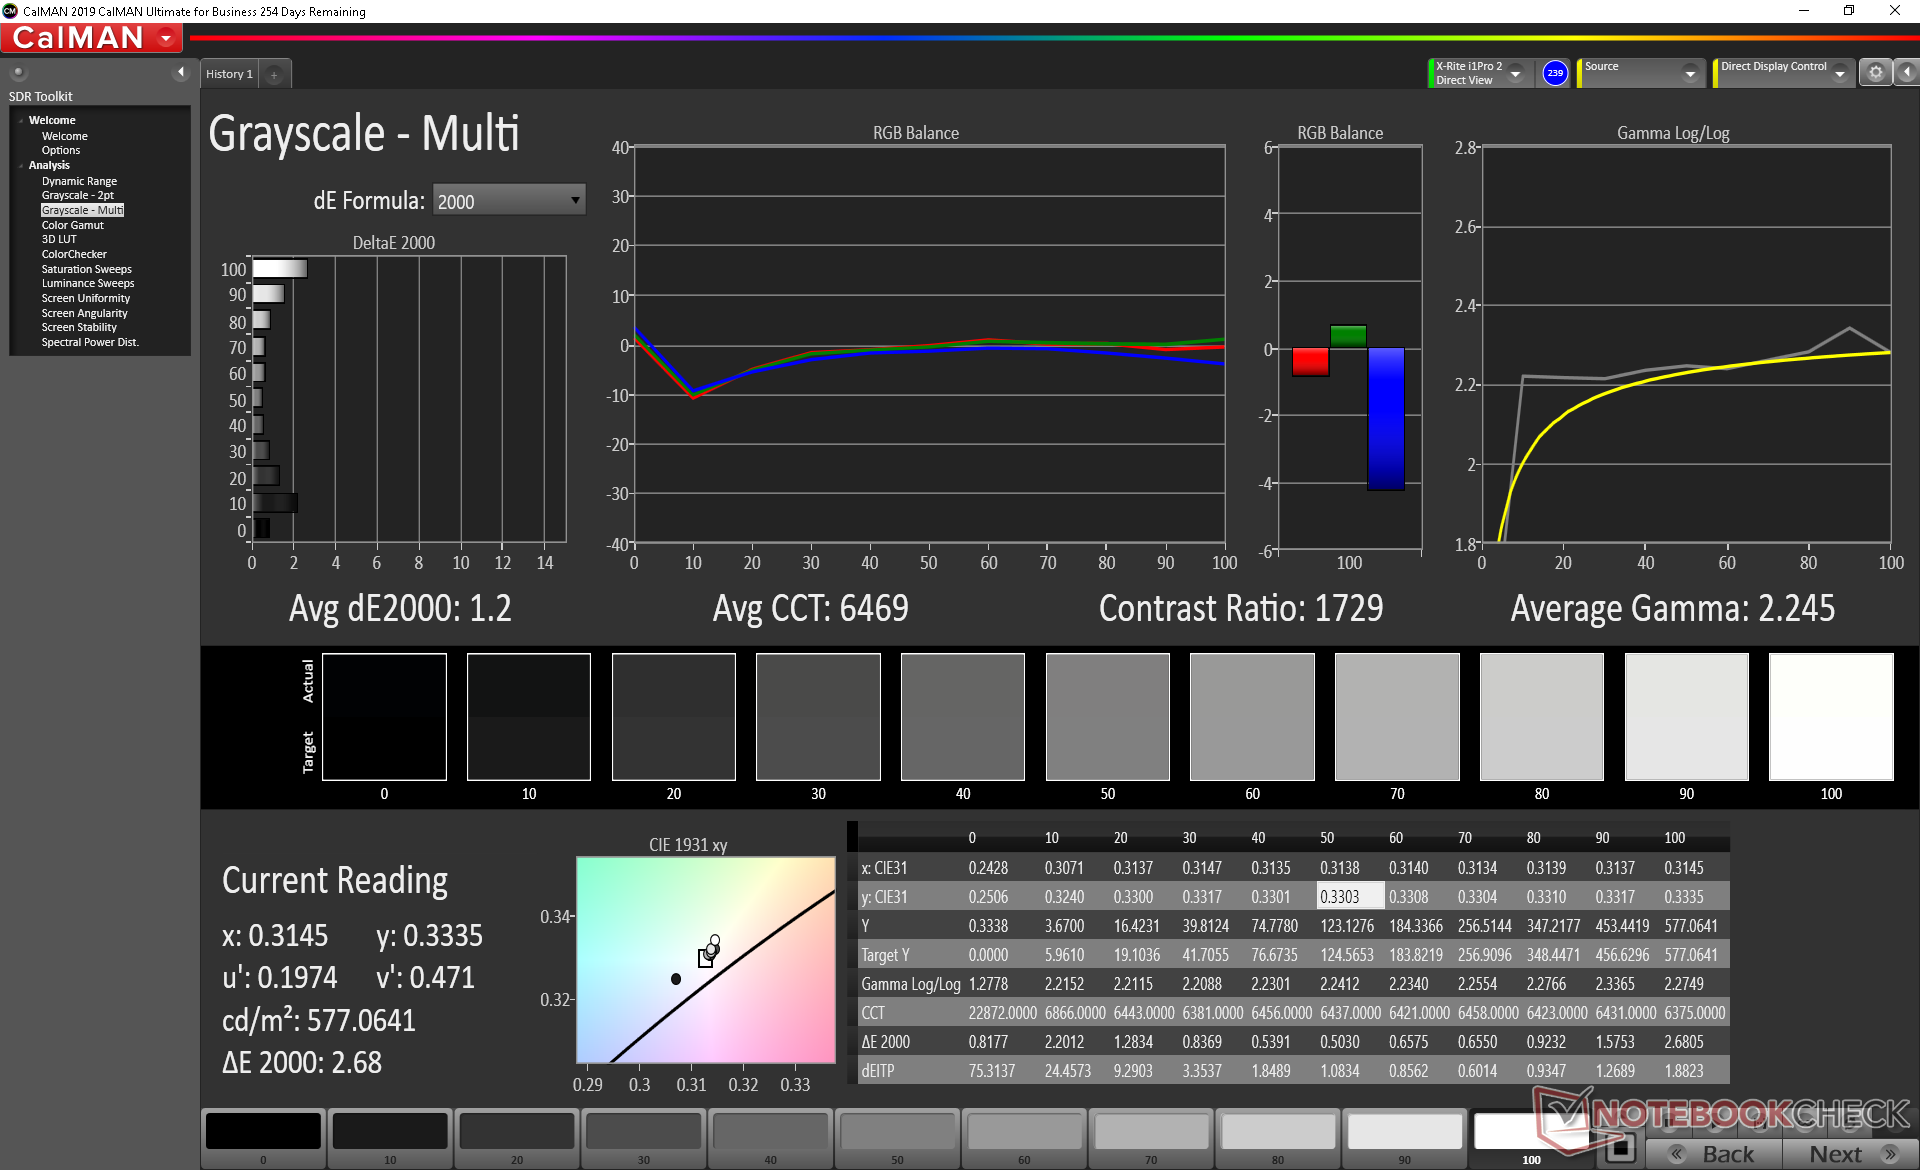
ΔE Greyscale Calman: 5.5 | ∀{0.09-98 Ø4.97}
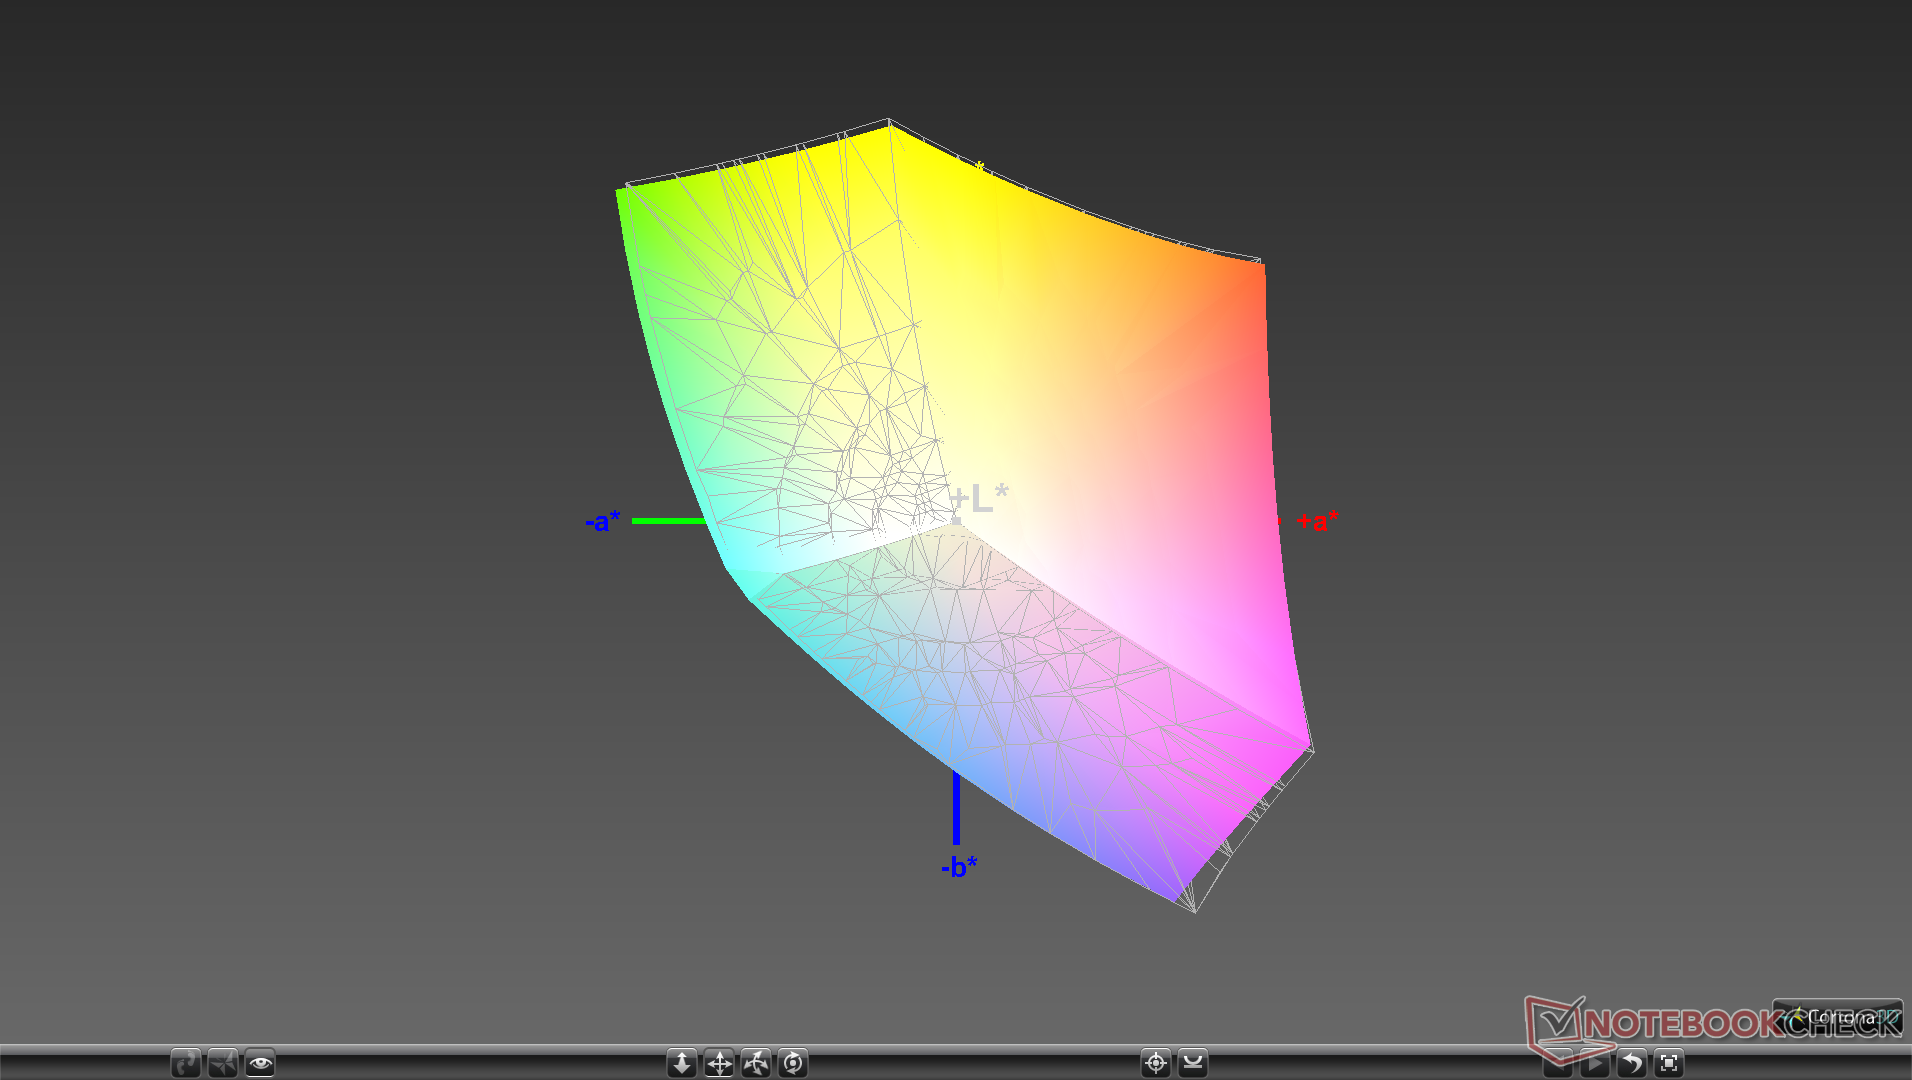
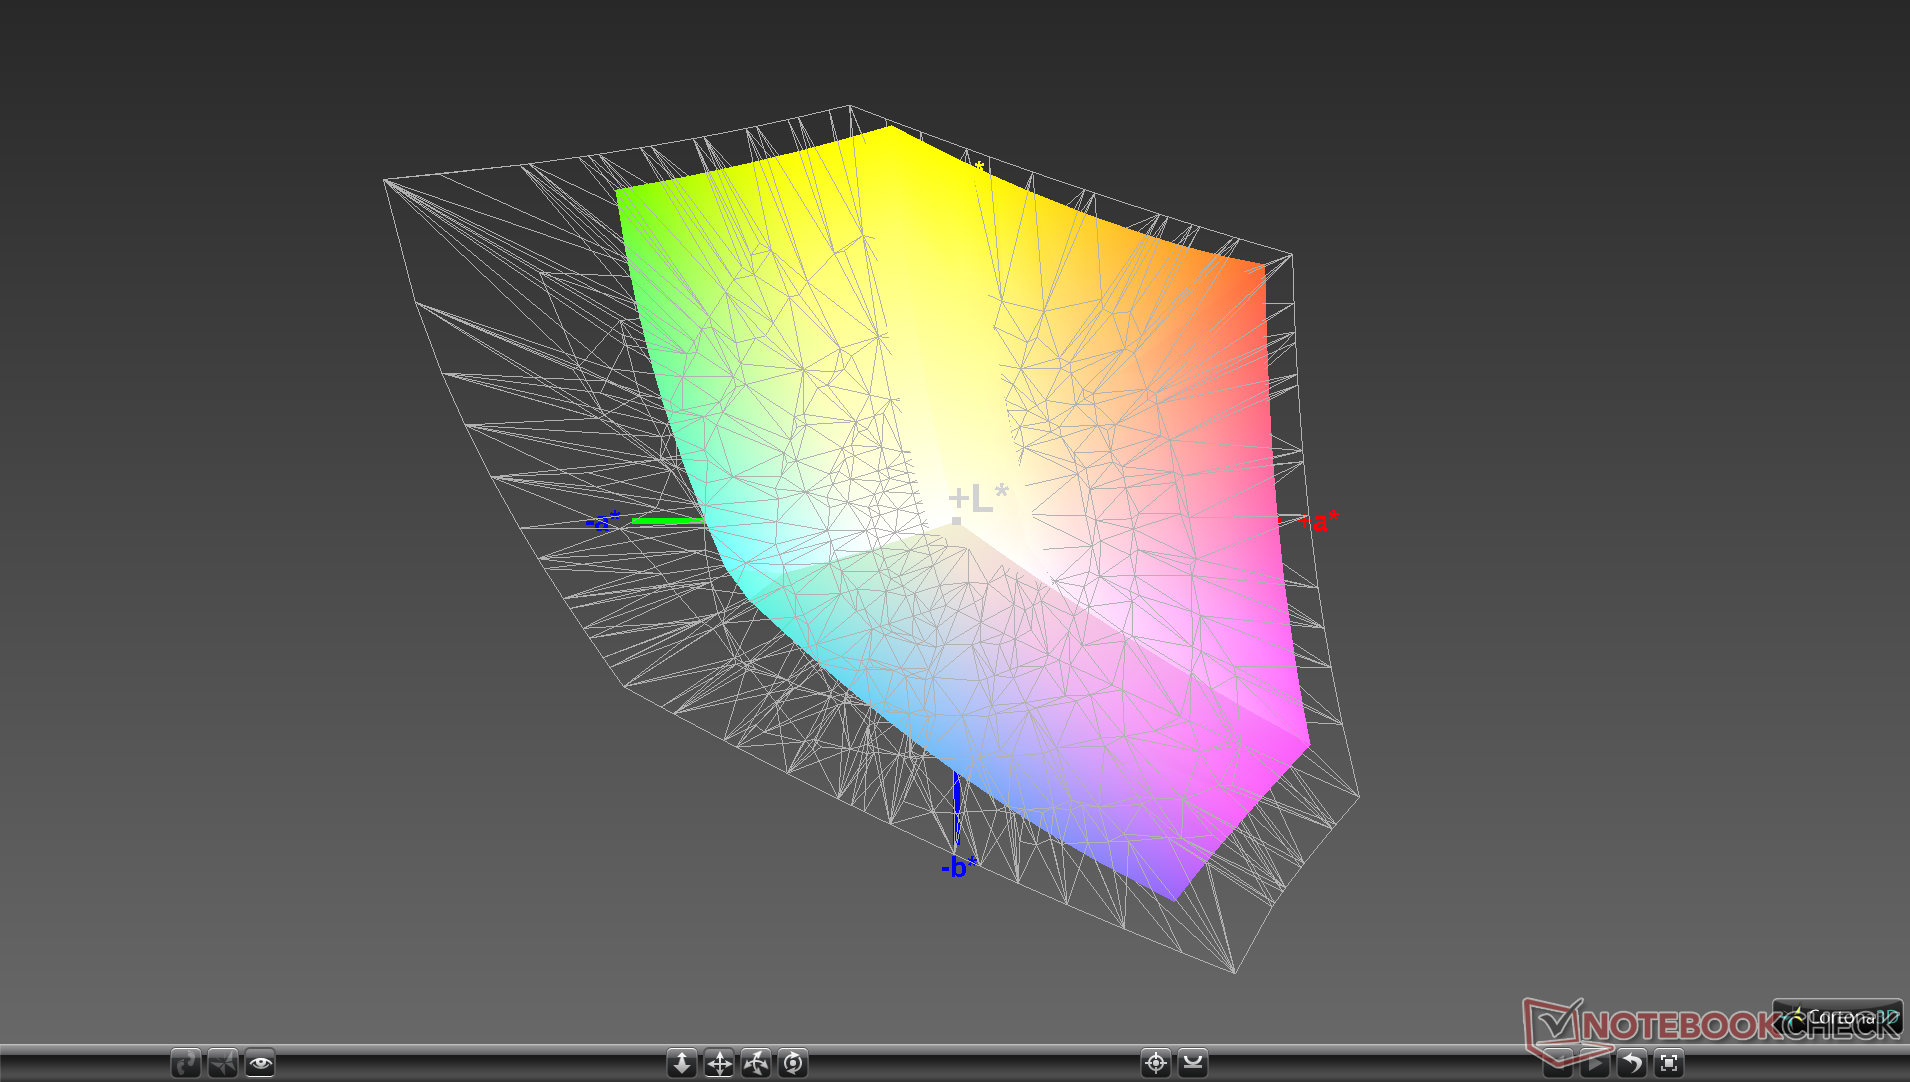
97.5% sRGB (Argyll 1.6.3 3D)
63% AdobeRGB 1998 (Argyll 1.6.3 3D)
68.5% AdobeRGB 1998 (Argyll 3D)
97.3% sRGB (Argyll 3D)
66.3% Display P3 (Argyll 3D)
Gamma: 2.12
CCT: 6413 K
| Dell XPS 13 9300 Core i7-1065G7 Sharp LQ134N1, IPS, 13.4", 1920x1200 | Dell XPS 13 7390 Core i7-10710U AU Optronics B133ZAN, Dell P/N: 90NTH, IPS, 13.3", 3840x2160 | Dell XPS 13 7390 2-in-1 Core i7 Sharp LQ134N1, IPS, 13.4", 1920x1200 | Huawei Matebook X Pro i5 Tianma XM, IPS, 13.9", 3000x2000 | Asus ZenBook S13 UX392FN Tianma XM, IPS, 13.9", 1920x1080 | Microsoft Surface Laptop 3 13 Core i5-1035G7 Sharp LQ135P1JX51, IPS, 13.5", 2256x1504 | |
|---|---|---|---|---|---|---|
| Display | -5% | 4% | -1% | 0% | -0% | |
| Display P3 Coverage (%) | 66.3 | 63.4 -4% | 69.9 5% | 65.9 -1% | 67.5 2% | 65.7 -1% |
| sRGB Coverage (%) | 97.3 | 93.7 -4% | 99.2 2% | 95.2 -2% | 95.8 -2% | 98.6 1% |
| AdobeRGB 1998 Coverage (%) | 68.5 | 64.3 -6% | 71.5 4% | 67.6 -1% | 69 1% | 67.8 -1% |
| Response Times | -2% | 9% | 21% | 16% | -22% | |
| Response Time Grey 50% / Grey 80% * (ms) | 50 ? | 51.6 ? -3% | 47.6 ? 5% | 40.4 ? 19% | 47.2 ? 6% | 59.2 ? -18% |
| Response Time Black / White * (ms) | 33.2 ? | 33.6 ? -1% | 29.2 ? 12% | 25.6 ? 23% | 24.8 ? 25% | 41.6 ? -25% |
| PWM Frequency (Hz) | 2500 ? | 2500 ? | 21740 ? | |||
| Screen | -30% | 7% | -8% | 2% | 13% | |
| Brightness middle (cd/m²) | 607.6 | 408.2 -33% | 549.8 -10% | 442.7 -27% | 466 -23% | 403.4 -34% |
| Brightness (cd/m²) | 595 | 399 -33% | 520 -13% | 428 -28% | 462 -22% | 397 -33% |
| Brightness Distribution (%) | 96 | 89 -7% | 86 -10% | 84 -12% | 90 -6% | 89 -7% |
| Black Level * (cd/m²) | 0.4 | 0.39 2% | 0.39 2% | 0.31 23% | 0.33 17% | 0.34 15% |
| Contrast (:1) | 1519 | 1047 -31% | 1410 -7% | 1428 -6% | 1412 -7% | 1186 -22% |
| Colorchecker dE 2000 * | 3.23 | 4.6 -42% | 2.12 34% | 2.24 31% | 1.93 40% | 0.94 71% |
| Colorchecker dE 2000 max. * | 8.67 | 11.84 -37% | 3.66 58% | 7.19 17% | 4.26 51% | 2.92 66% |
| Colorchecker dE 2000 calibrated * | 1.01 | 2.03 -101% | 1.37 -36% | 1.11 -10% | 1.99 -97% | 0.99 2% |
| Greyscale dE 2000 * | 5.5 | 7.5 -36% | 2.6 53% | 9.7 -76% | 1.7 69% | 0.9 84% |
| Gamma | 2.12 104% | 2.12 104% | 2.3 96% | 1.42 155% | 2.15 102% | 2.13 103% |
| CCT | 6413 101% | 7966 82% | 6884 94% | 6227 104% | 6382 102% | 6620 98% |
| Color Space (Percent of AdobeRGB 1998) (%) | 63 | 59.5 -6% | 65.4 4% | 61.6 -2% | 62.2 -1% | 62.3 -1% |
| Color Space (Percent of sRGB) (%) | 97.5 | 93.5 -4% | 99.7 2% | 95 -3% | 95.7 -2% | 98.7 1% |
| Media totale (Programma / Settaggio) | -12% /
-22% | 7% /
7% | 4% /
-3% | 6% /
3% | -3% /
6% |
* ... Meglio usare valori piccoli

Tempi di risposta del Display
| ↔ Tempi di risposta dal Nero al Bianco | ||
|---|---|---|
| 33.2 ms ... aumenta ↗ e diminuisce ↘ combinato | ↗ 16 ms Incremento | 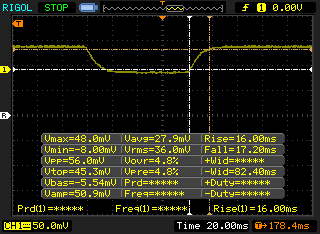 |
| ↘ 17.2 ms Calo | ||
| Lo schermo mostra tempi di risposta lenti nei nostri tests e sarà insoddisfacente per i gamers. In confronto, tutti i dispositivi di test variano da 0.1 (minimo) a 240 (massimo) ms. » 90 % di tutti i dispositivi è migliore. Questo significa che i tempi di risposta rilevati sono peggiori rispetto alla media di tutti i dispositivi testati (19.8 ms). | ||
| ↔ Tempo di risposta dal 50% Grigio all'80% Grigio | ||
| 50 ms ... aumenta ↗ e diminuisce ↘ combinato | ↗ 22 ms Incremento | 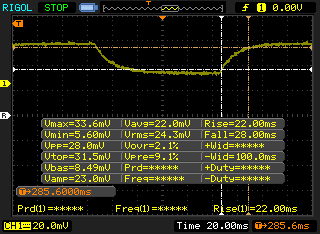 |
| ↘ 28 ms Calo | ||
| Lo schermo mostra tempi di risposta lenti nei nostri tests e sarà insoddisfacente per i gamers. In confronto, tutti i dispositivi di test variano da 0.165 (minimo) a 636 (massimo) ms. » 86 % di tutti i dispositivi è migliore. Questo significa che i tempi di risposta rilevati sono peggiori rispetto alla media di tutti i dispositivi testati (31 ms). | ||
Sfarfallio dello schermo / PWM (Pulse-Width Modulation)
| flickering dello schermo / PWM rilevato | 2500 Hz | ≤ 25 % settaggio luminosita' | 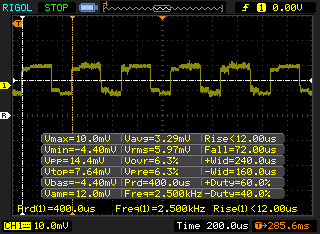 |
Il display sfarfalla a 2500 Hz (Probabilmente a causa dell'uso di PWM) Flickering rilevato ad una luminosita' di 25 % o inferiore. Non dovrebbe verificarsi flickering o PWM sopra questo valore di luminosita'. La frequenza di 2500 Hz è abbastanza alta, quindi la maggioranza degli utenti sensibili al PWM non dovrebbero notare alcun flickering. In confronto: 52 % di tutti i dispositivi testati non utilizza PWM per ridurre la luminosita' del display. Se è rilevato PWM, una media di 7769 (minimo: 5 - massimo: 343500) Hz è stata rilevata. | |||
Prestazioni
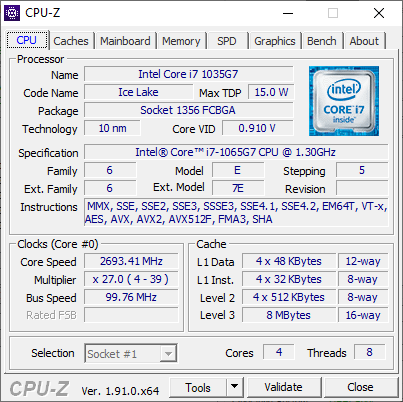
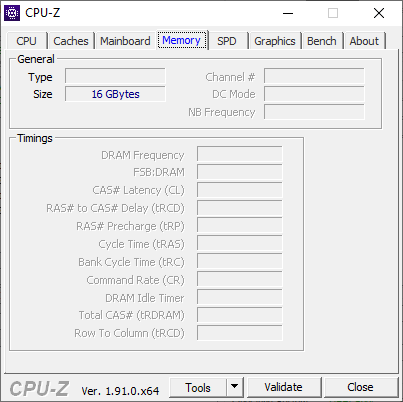
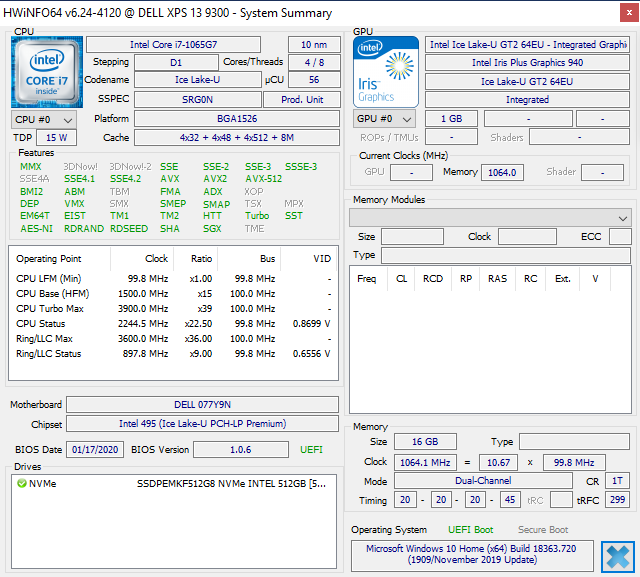
Attualmente, l'XPS 13 9300 viene fornito con il Core i5-1035G1 o Core i7-1065G7 senza opzioni Core i3 o Comet Lake-U. Non ci sono opzioni GPU dedicate, il che significa che gli utenti sceglieranno tra l'UHD Graphics G1 integrata o l'Iris Plus G7. La RAM varia da 8 GB a 16 GB di LPDDR4x a 3733 MHz saldata.
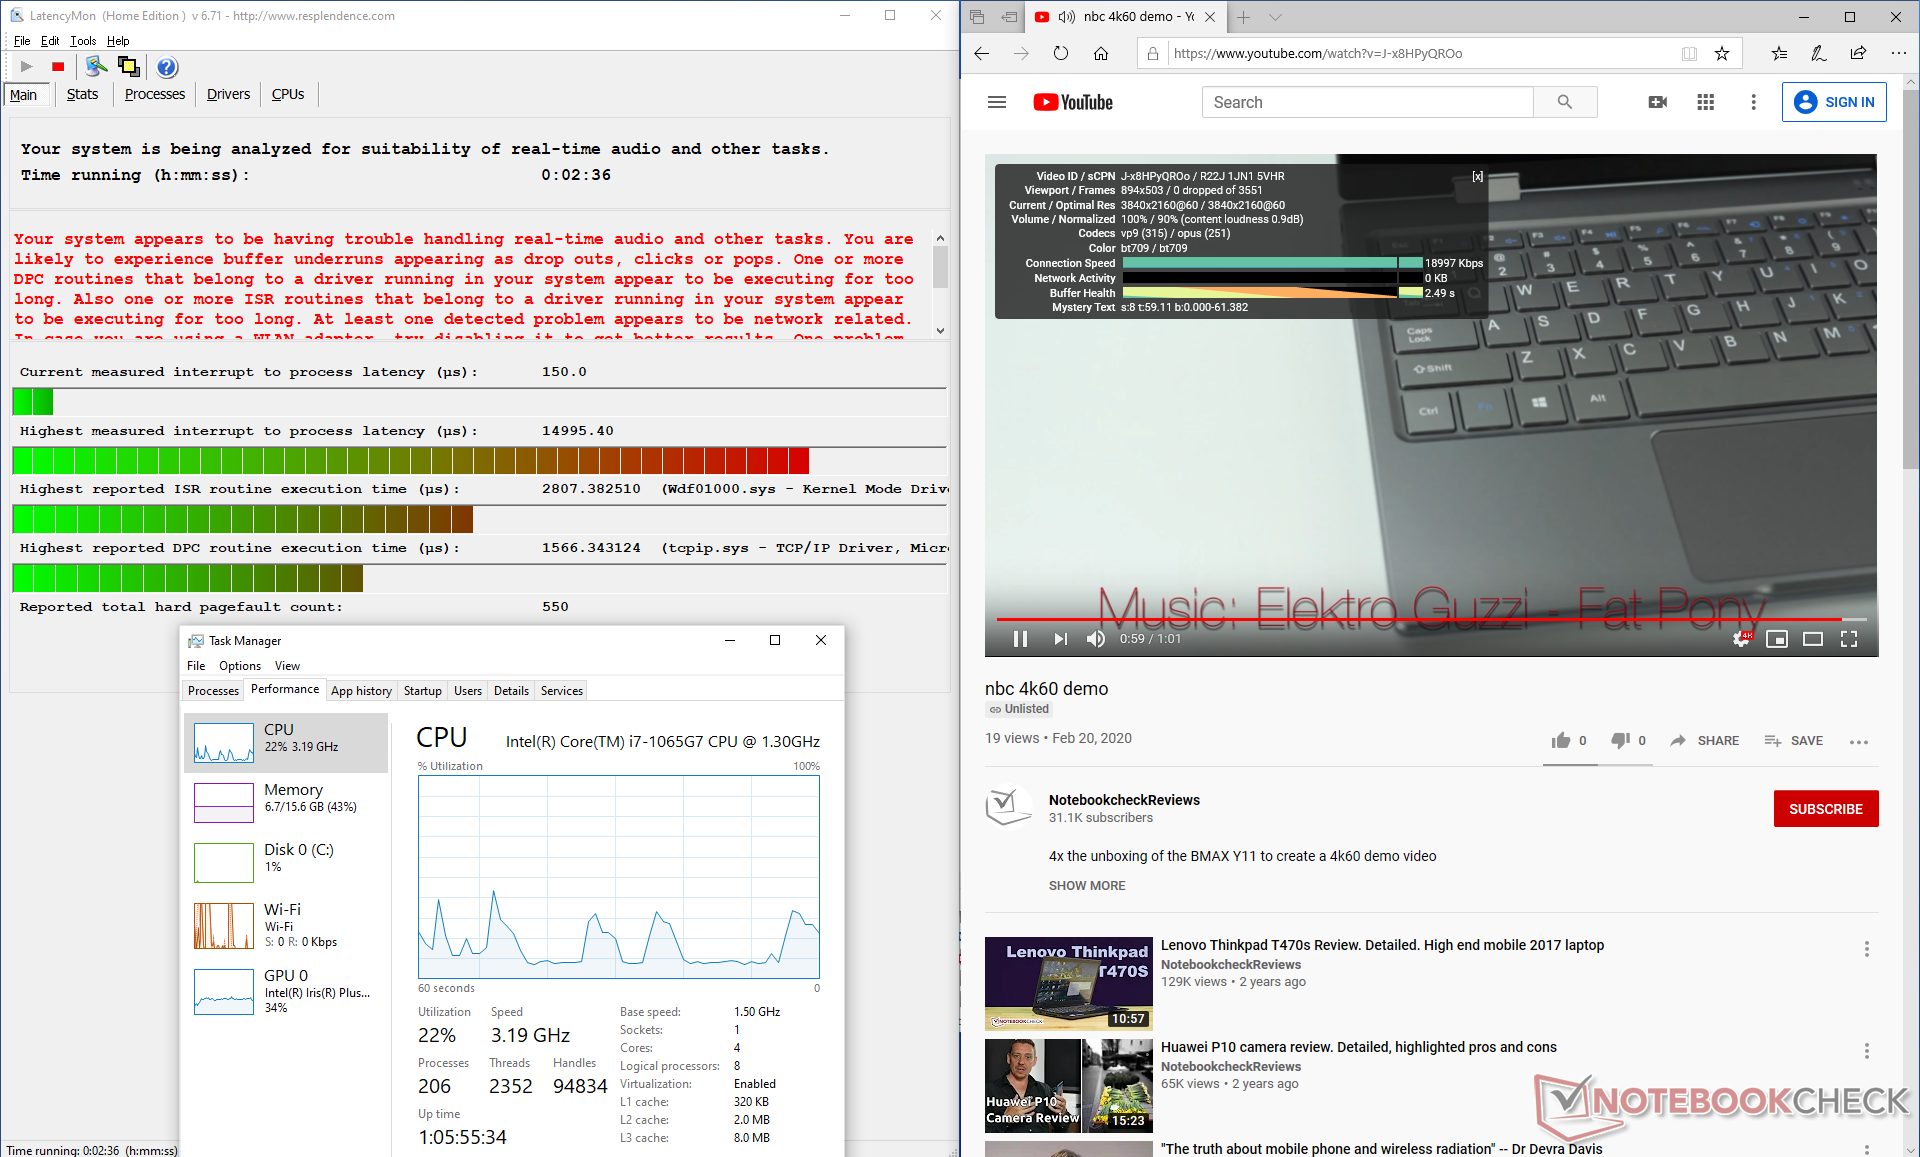
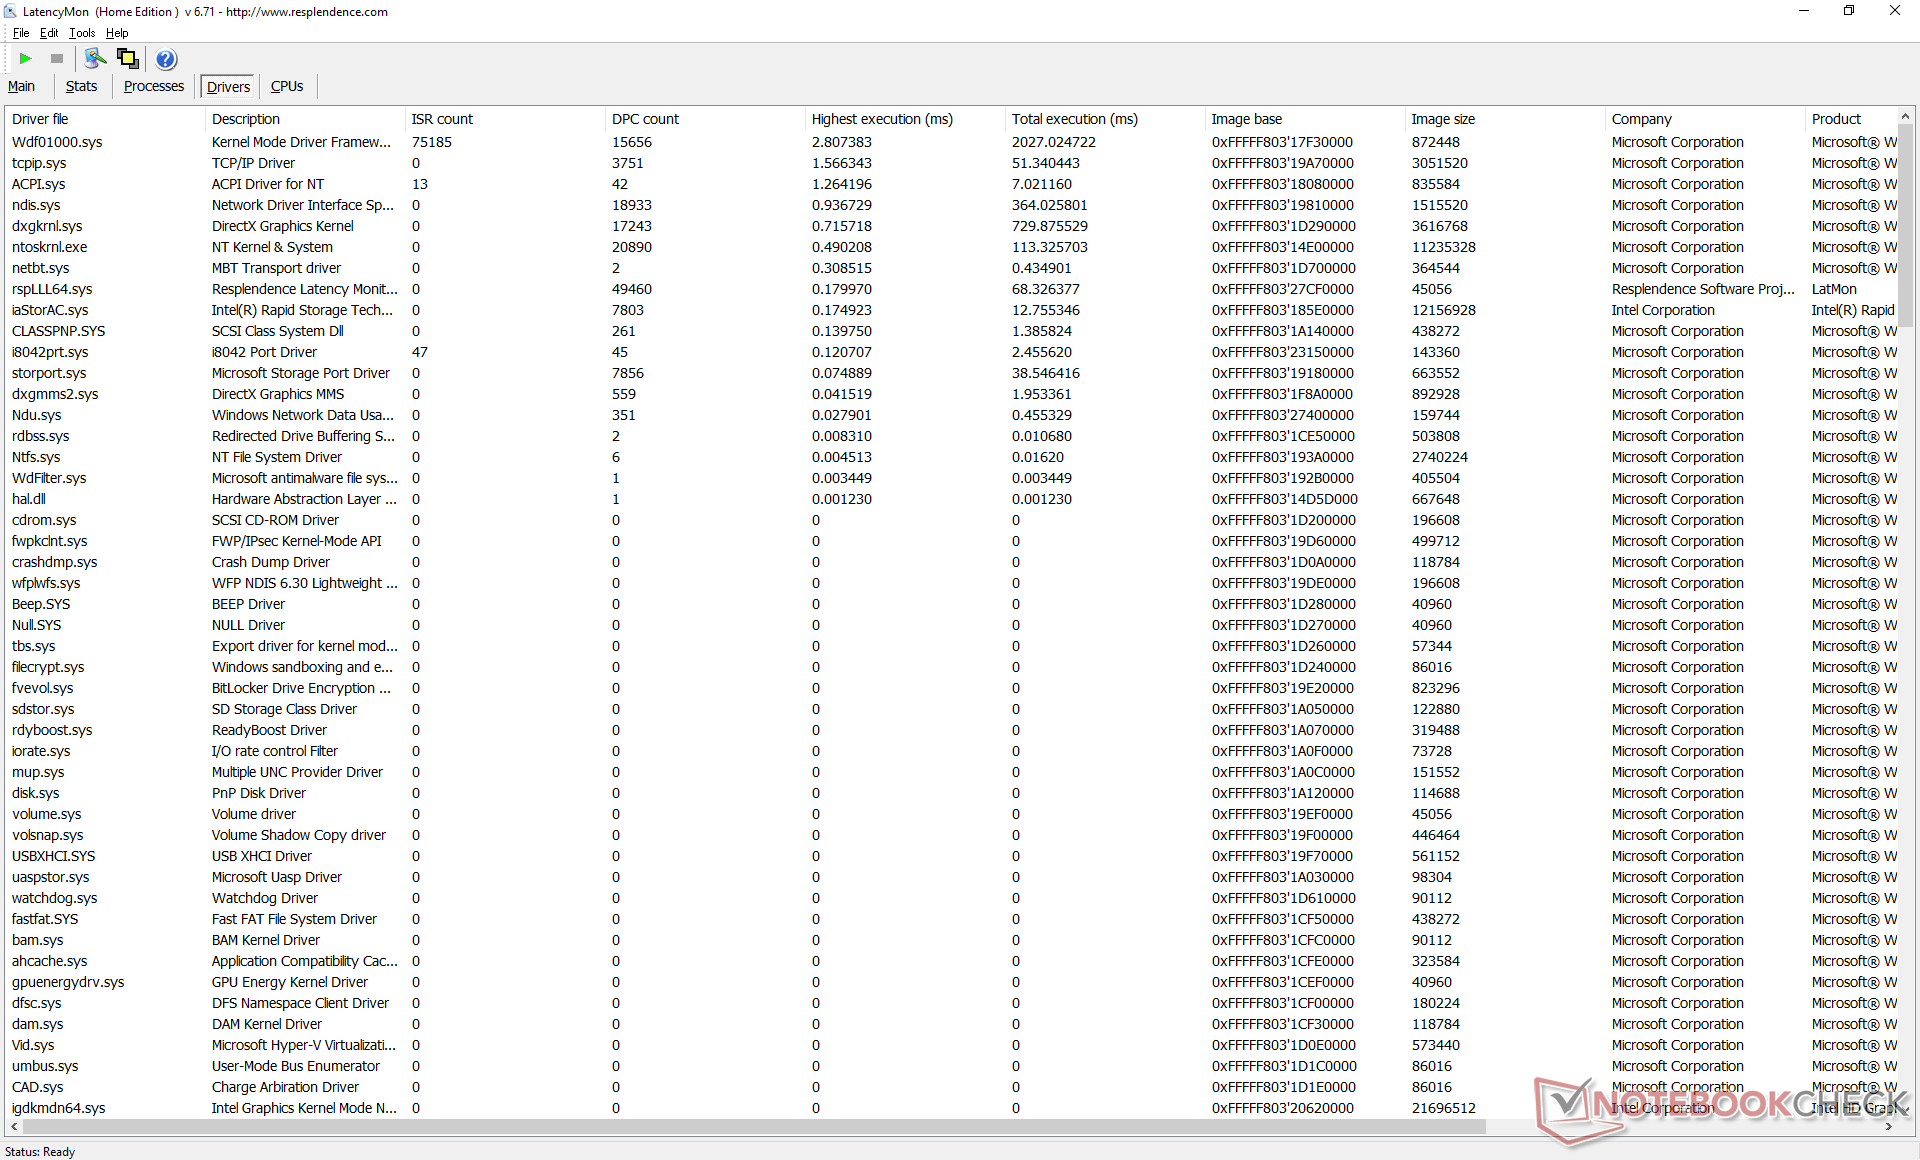
La nostra unità presenta problemi di latenza DPC quando si aprono più schede del browser, si esegue un video YouTube 4K60 e si esegue Prime95 in sequenza.
Processore
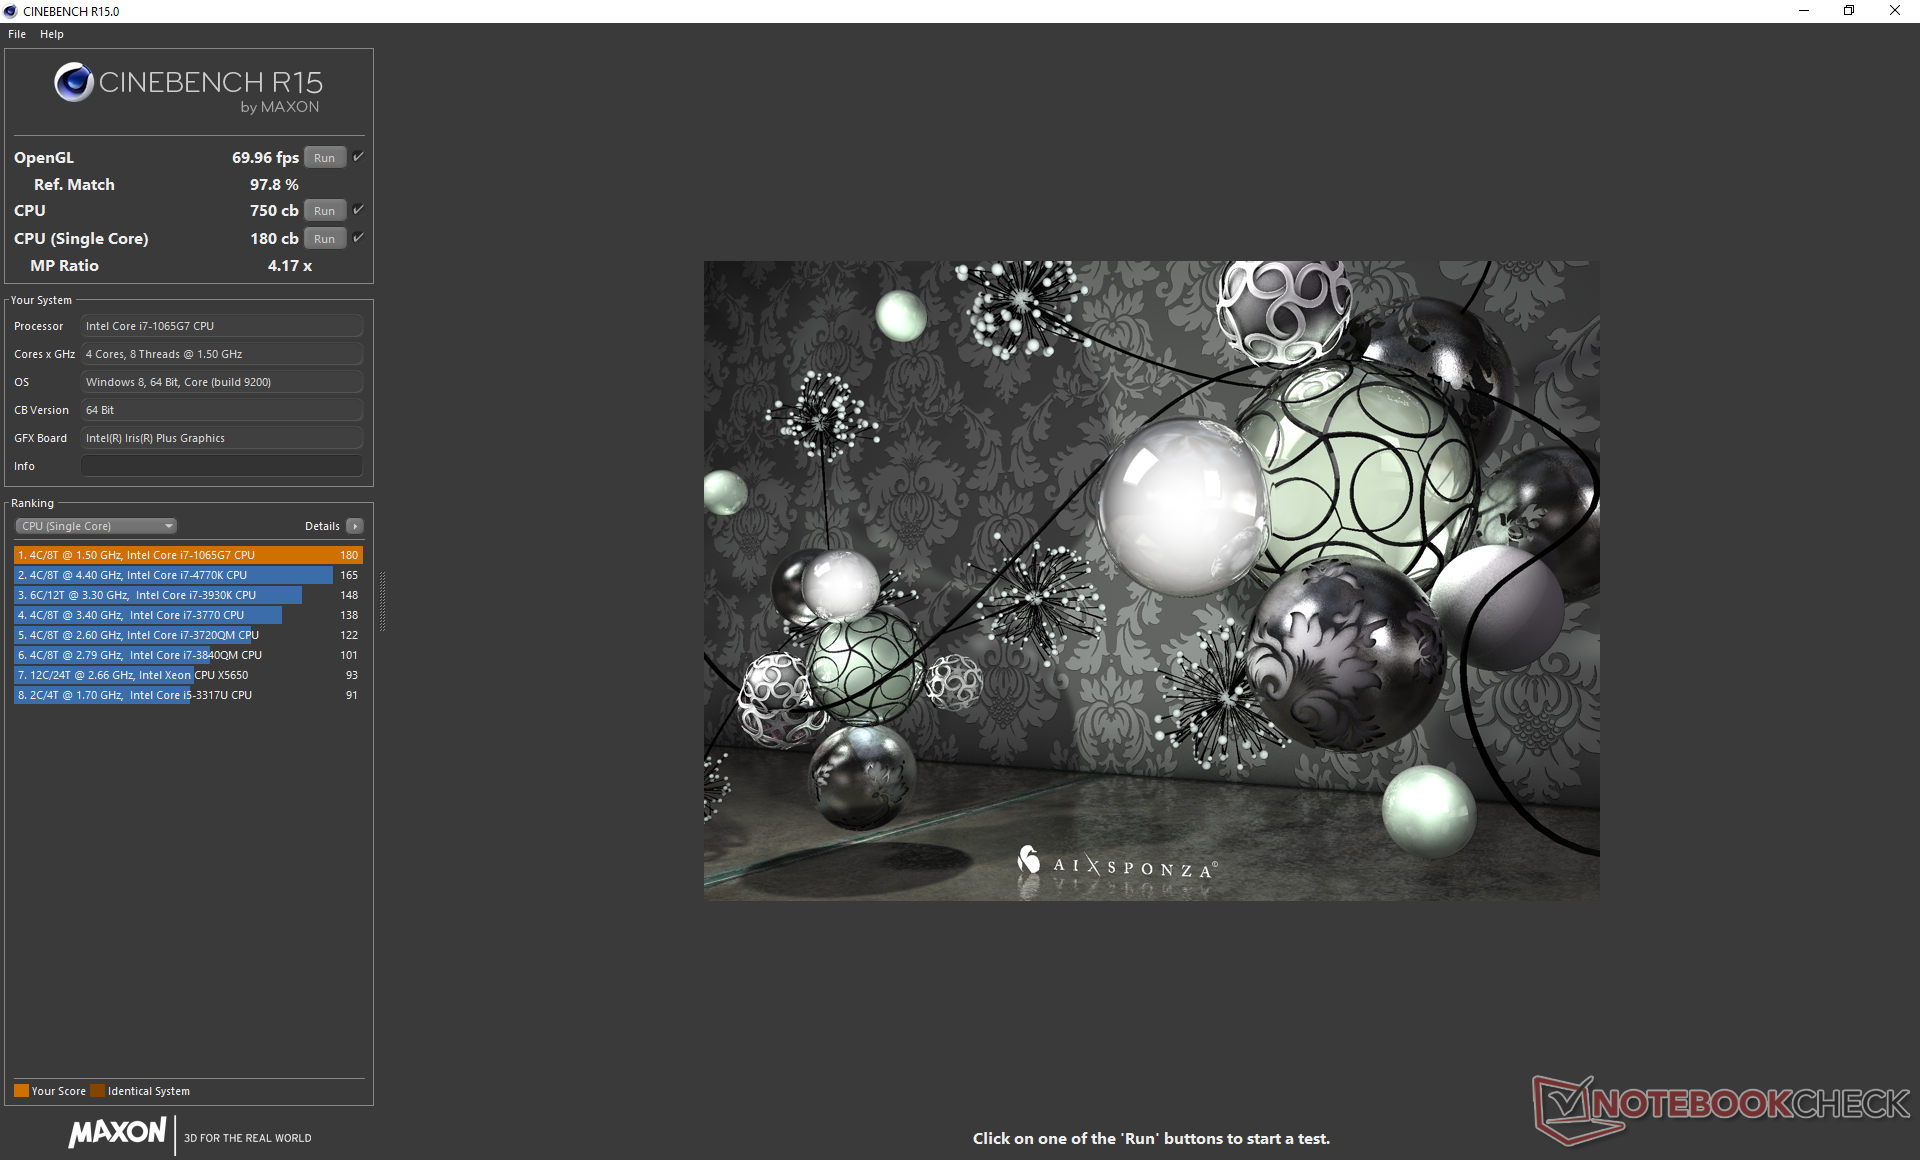
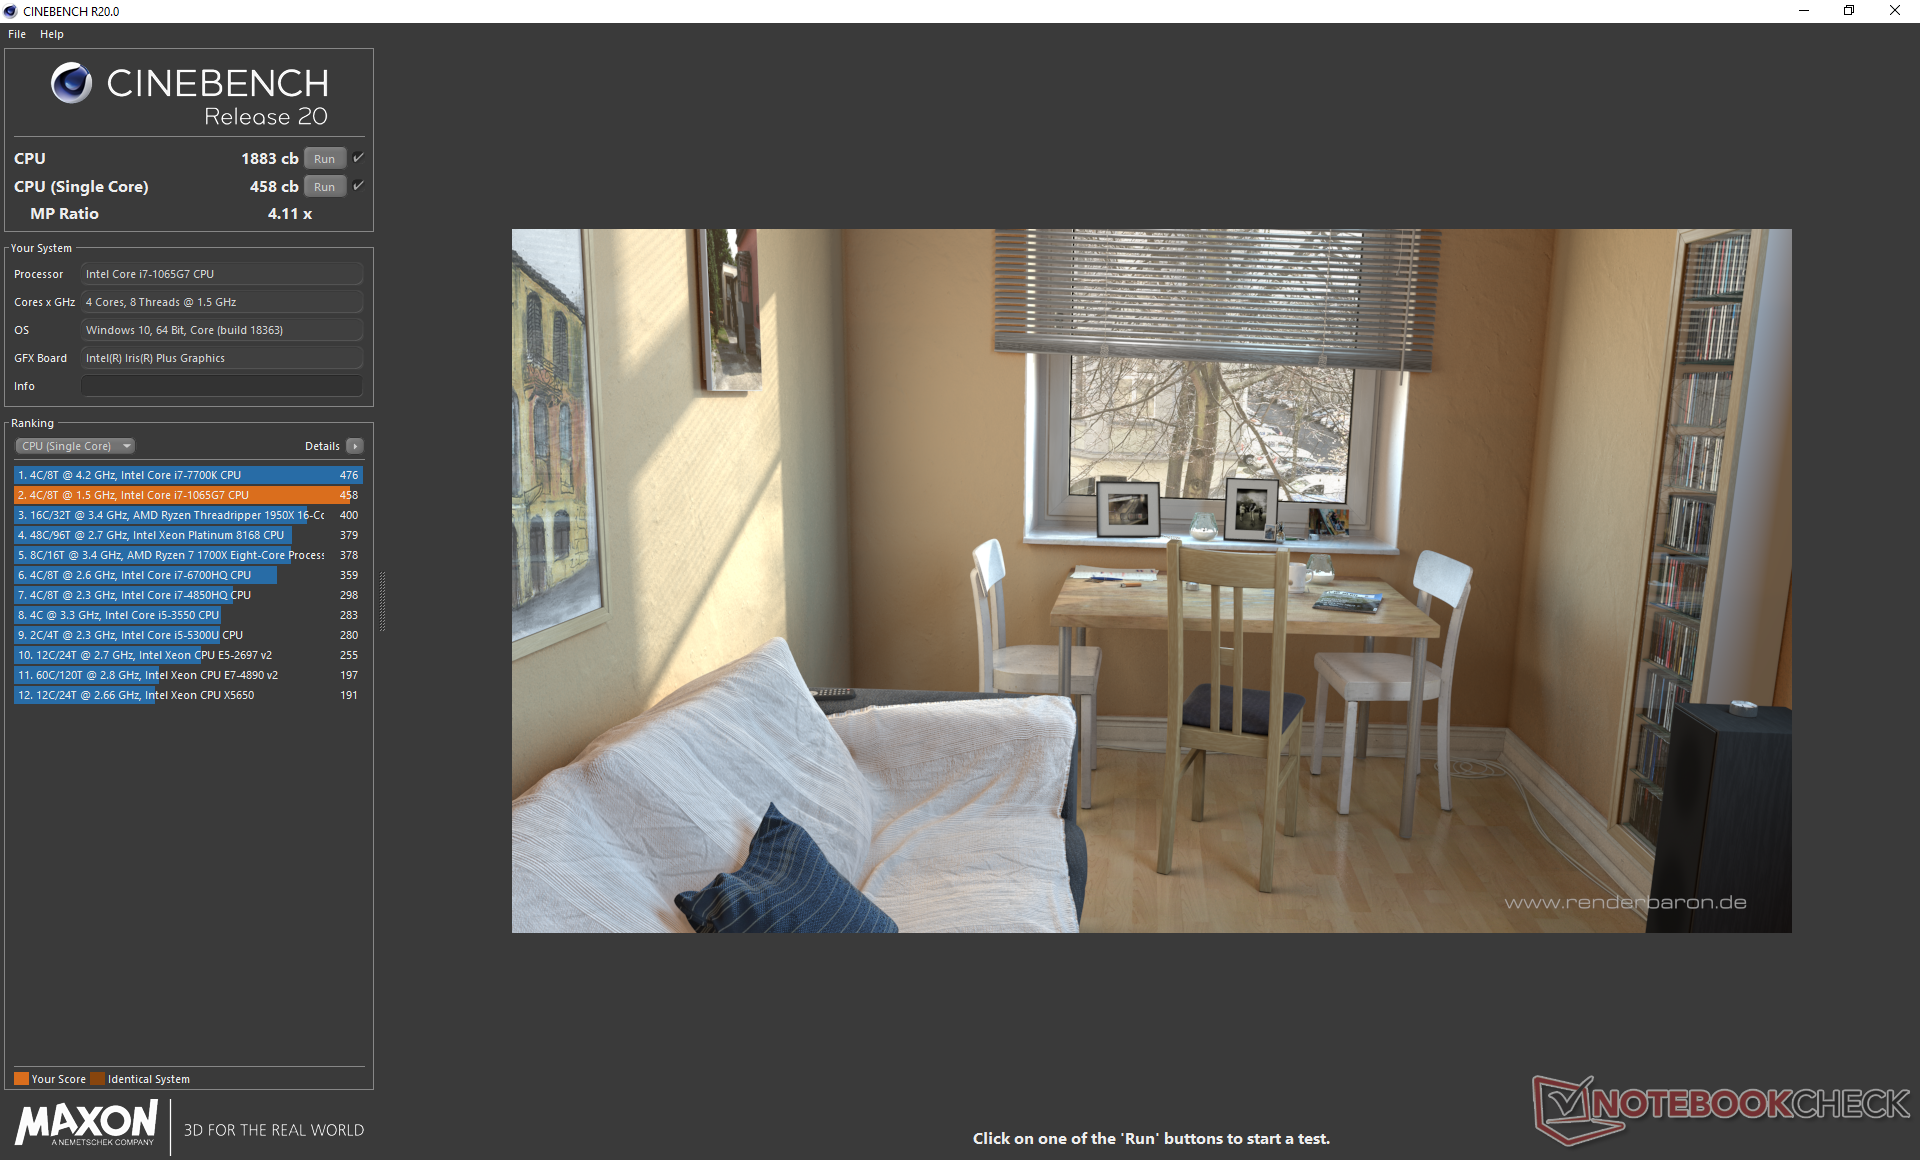
Per assicurarci di ottenere le prestazioni più veloci possibili dalla nostra unità di test, abbiamo impostato il sistema su Ultra Performance tramite il software Dell Power Manager preinstallato prima di eseguire uno dei test descritti di seguito. I risultati del CineBench sono circa dal 9 al 17% superiori rispetto alla media del Core i7-1065G7 nel nostro database preso da almeno altri 13 portatili. Tuttavia, questo non racconta tutta la storia, poiché gli Ultrabooks tendono a limitare le prestazioni nel tempo quando sono sottoposti a uno stress continuo. Per simulare questo, eseguiremmo CineBench R15 Multi-Thread in loop come mostrato dal grafico sottostante. Il punteggio iniziale di 811 punti è sceso nel tempo a circa 610 punti in media il che rappresenta un calo di prestazioni del 25%. È interessante notare che i punteggi oscillano tra i ~560 punti e i ~660 punti, il che implica un ciclo di clock della CPU in condizioni di elaborazione così estreme.
Le prestazioni complessive della CPU sono generalmente migliori di quelle del Core i7-8565U di ultima generazione, soprattutto quando il processore è freddo grazie alla sua maggiore velocità Turbo Boost. I suoi vantaggi iniziano a diminuire una volta che la CPU raggiunge un certo intervallo di temperatura in cui le frequenze di clock iniziano a scorrere.
Visitate la nostra pagina dedicata al Core i7-1065G7 per maggiori informazioni tecniche e confronti benchmark. Il Core i7-10710U hexa-core offre prestazioni multithread superiori, ma per ora è disponibile solo sull'XPS 13 7390.
| wPrime 2.10 - 1024m | |
| Dell XPS 13 7390 2-in-1 Core i3 | |
| Microsoft Surface Pro 7 Core i5-1035G4 | |
| Media Intel Core i7-1065G7 (233 - 354, n=3) | |
| Dell XPS 13 7390 Core i7-10710U | |
* ... Meglio usare valori piccoli
Prestazioni di sistema
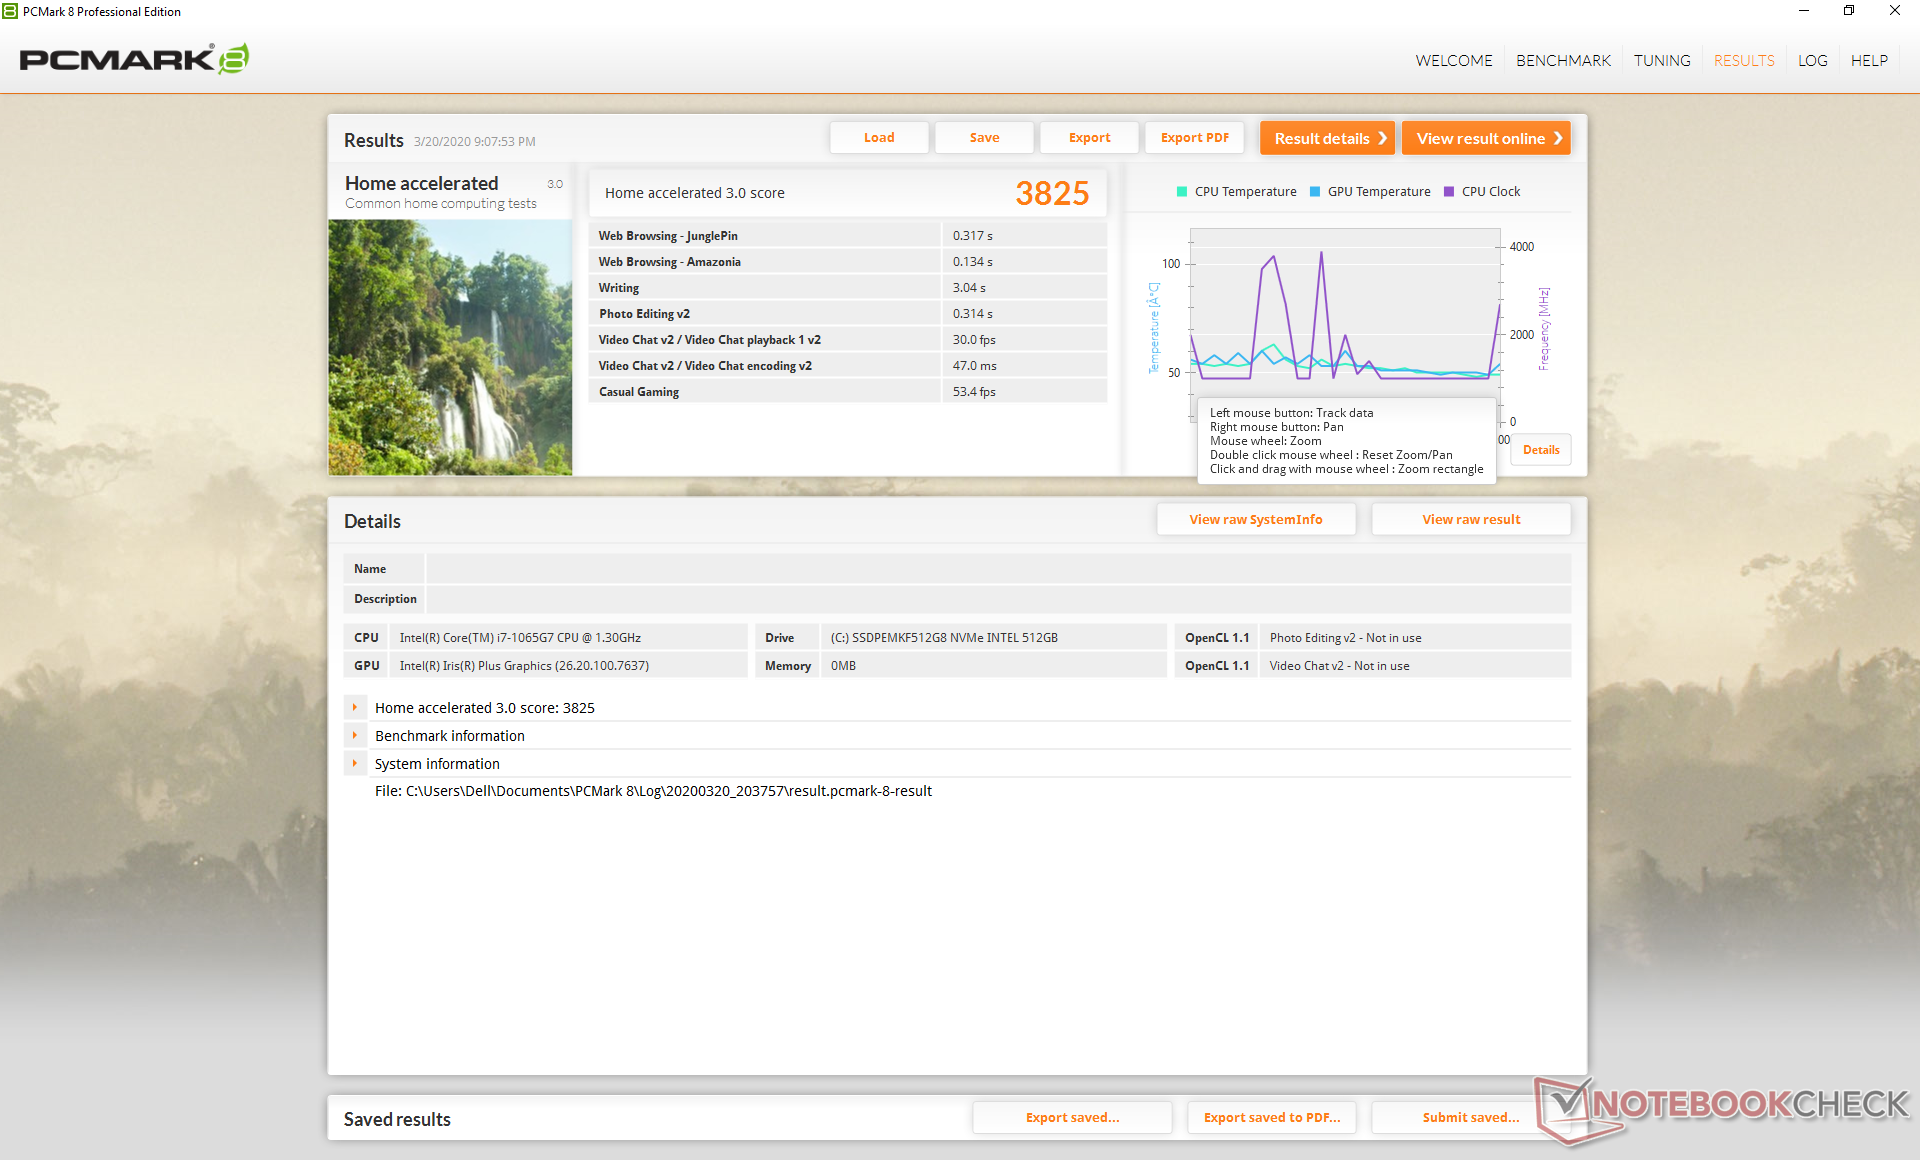
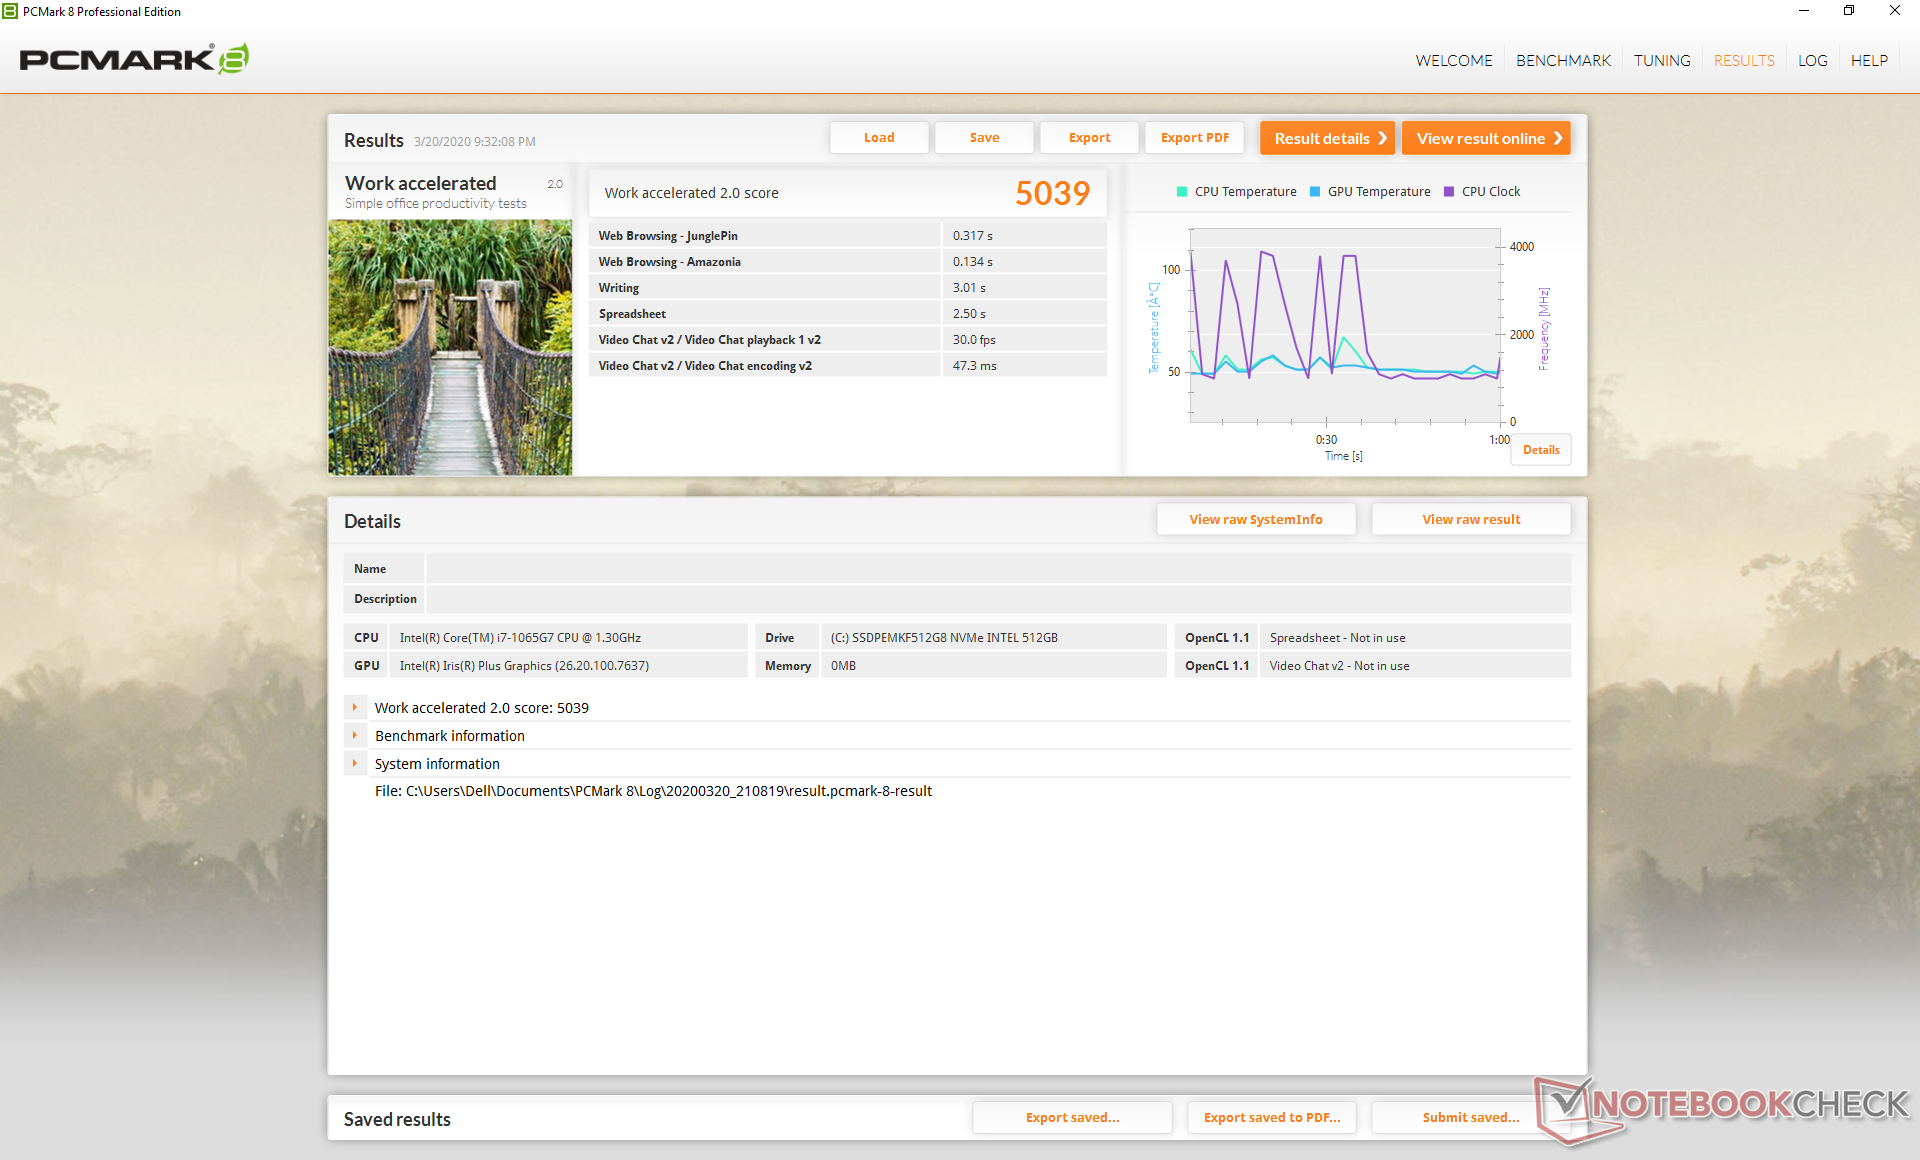
| PCMark 8 Home Score Accelerated v2 | 3825 punti | |
| PCMark 8 Work Score Accelerated v2 | 5039 punti | |
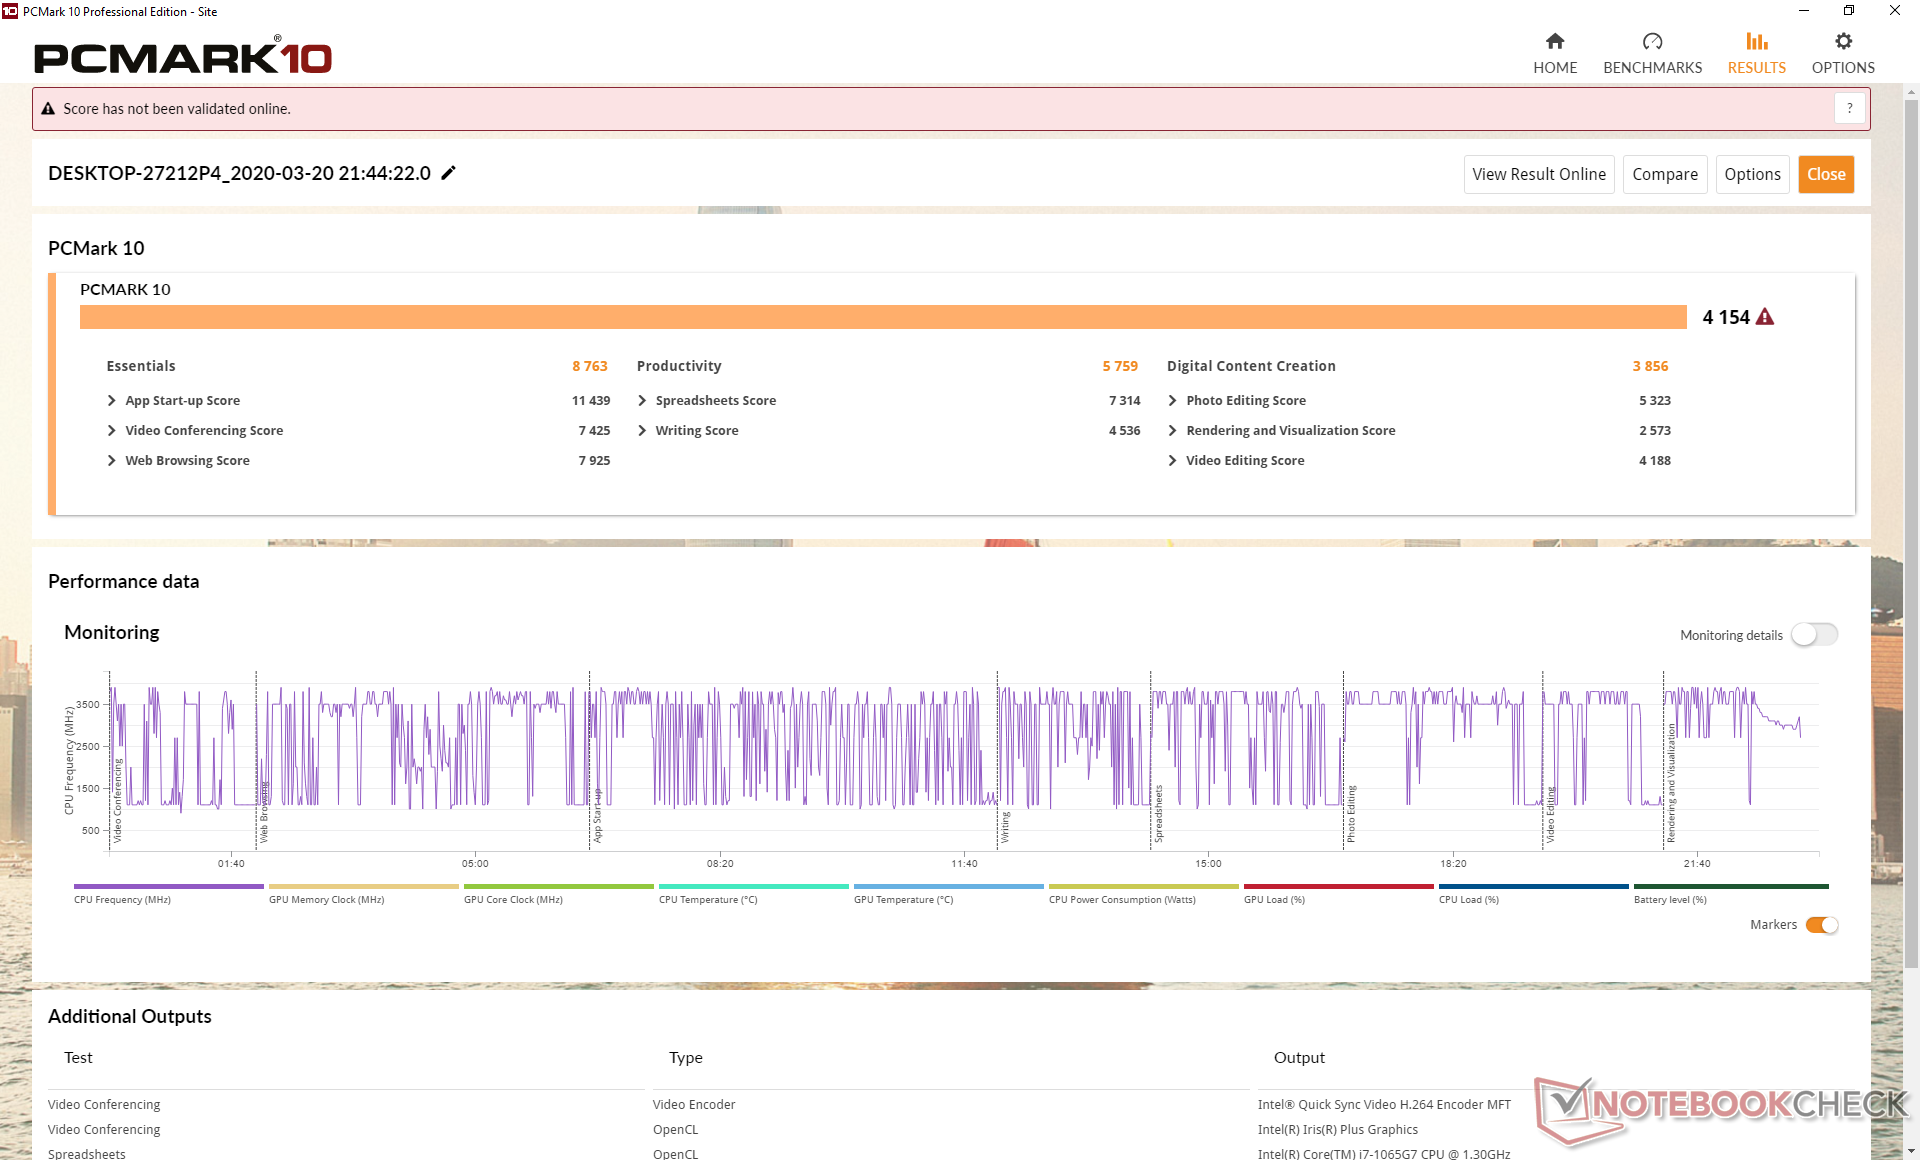
| PCMark 10 Score | 4154 punti | |
Aiuto | ||
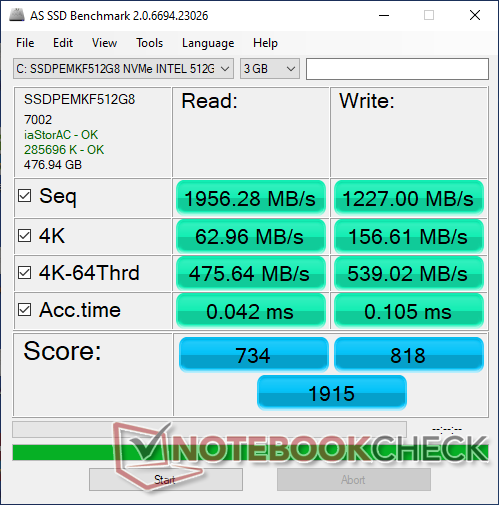
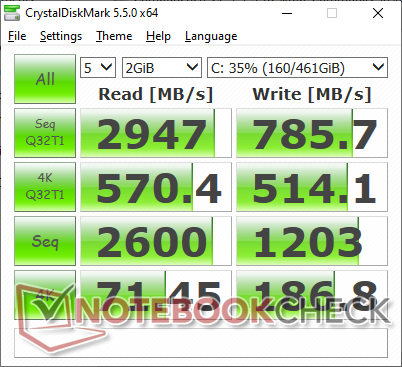
Dispositivi di archiviazione
A differenza della nostra prima SKU XPS 13 9300 Core i5 e del suo SSD Toshiba da 512 GB, la SKU XPS 13 9300 Core i7 viene invece fornita con un SSD Intel da 512 GB. I valori di lettura e scrittura sequenziale sono simili tra loro sia secondo CrystalDiskMark che secondo AS SSD, ma l'SSD Toshiba sembra essere molto più veloce quando affronta profondità di coda più elevate.
Consultate la nostra tabella di SSD ed HDD per ulteriori benchmarks.
| Dell XPS 13 9300 Core i7-1065G7 Intel SSDPEMKF512G8 NVMe SSD | Dell XPS 13 7390 Core i7-10710U SK Hynix PC601 NVMe 512 GB | Dell XPS 13 7390 2-in-1 Core i7 Toshiba BG4 KBG40ZPZ512G | Microsoft Surface Laptop 3 13 Core i5-1035G7 SK hynix BC501 HFM256GDGTNG | Asus ZenBook S13 UX392FN WDC PC SN520 SDAPNUW-512G | |
|---|---|---|---|---|---|
| AS SSD | 30% | -20% | -23% | 39% | |
| Seq Read (MB/s) | 1956 | 1804 -8% | 1801 -8% | 1387 -29% | 1224 -37% |
| Seq Write (MB/s) | 1227 | 1000 -19% | 1125 -8% | 504 -59% | 907 -26% |
| 4K Read (MB/s) | 63 | 45.1 -28% | 39.7 -37% | 42.35 -33% | 41.46 -34% |
| 4K Write (MB/s) | 156.6 | 115 -27% | 67 -57% | 120 -23% | 126.2 -19% |
| 4K-64 Read (MB/s) | 475.6 | 893 88% | 1253 163% | 497.4 5% | 1021 115% |
| 4K-64 Write (MB/s) | 539 | 732 36% | 209 -61% | 354.9 -34% | 1251 132% |
| Access Time Read * (ms) | 0.042 | 0.044 -5% | 0.069 -64% | 0.055 -31% | 0.053 -26% |
| Access Time Write * (ms) | 0.105 | 0.095 10% | 0.625 -495% | 0.093 11% | 0.027 74% |
| Score Read (Points) | 734 | 1119 52% | 1472 101% | 678 -8% | 1185 61% |
| Score Write (Points) | 818 | 947 16% | 388 -53% | 525 -36% | 1468 79% |
| Score Total (Points) | 1915 | 2608 36% | 2583 35% | 1520 -21% | 3250 70% |
| Copy ISO MB/s (MB/s) | 1022 | 1515 48% | 1293 27% | 764 -25% | 1404 37% |
| Copy Program MB/s (MB/s) | 302.8 | 535 77% | 560 85% | 256.1 -15% | 402.4 33% |
| Copy Game MB/s (MB/s) | 491.4 | 1211 146% | 927 89% | 368.4 -25% | 902 84% |
| CrystalDiskMark 5.2 / 6 | 12% | -13% | -35% | -9% | |
| Write 4K (MB/s) | 186.8 | 134 -28% | 106.7 -43% | 112.3 -40% | 149.2 -20% |
| Read 4K (MB/s) | 71.4 | 42.91 -40% | 49.94 -30% | 42.13 -41% | 47.18 -34% |
| Write Seq (MB/s) | 1203 | 1841 53% | 1223 2% | 630 -48% | 750 -38% |
| Read Seq (MB/s) | 2600 | 1707 -34% | 1801 -31% | 1023 -61% | 1137 -56% |
| Write 4K Q32T1 (MB/s) | 514 | 394.7 -23% | 325.3 -37% | 336.6 -35% | 749 46% |
| Read 4K Q32T1 (MB/s) | 570 | 398.5 -30% | 551 -3% | 399.6 -30% | 478.7 -16% |
| Write Seq Q32T1 (MB/s) | 786 | 2250 186% | 1224 56% | 821 4% | 1453 85% |
| Read Seq Q32T1 (MB/s) | 2947 | 3265 11% | 2350 -20% | 2030 -31% | 1713 -42% |
| Media totale (Programma / Settaggio) | 21% /
24% | -17% /
-18% | -29% /
-28% | 15% /
21% |
* ... Meglio usare valori piccoli

Prestazioni GPU
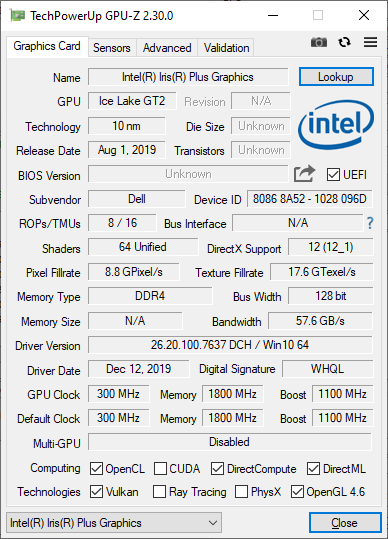
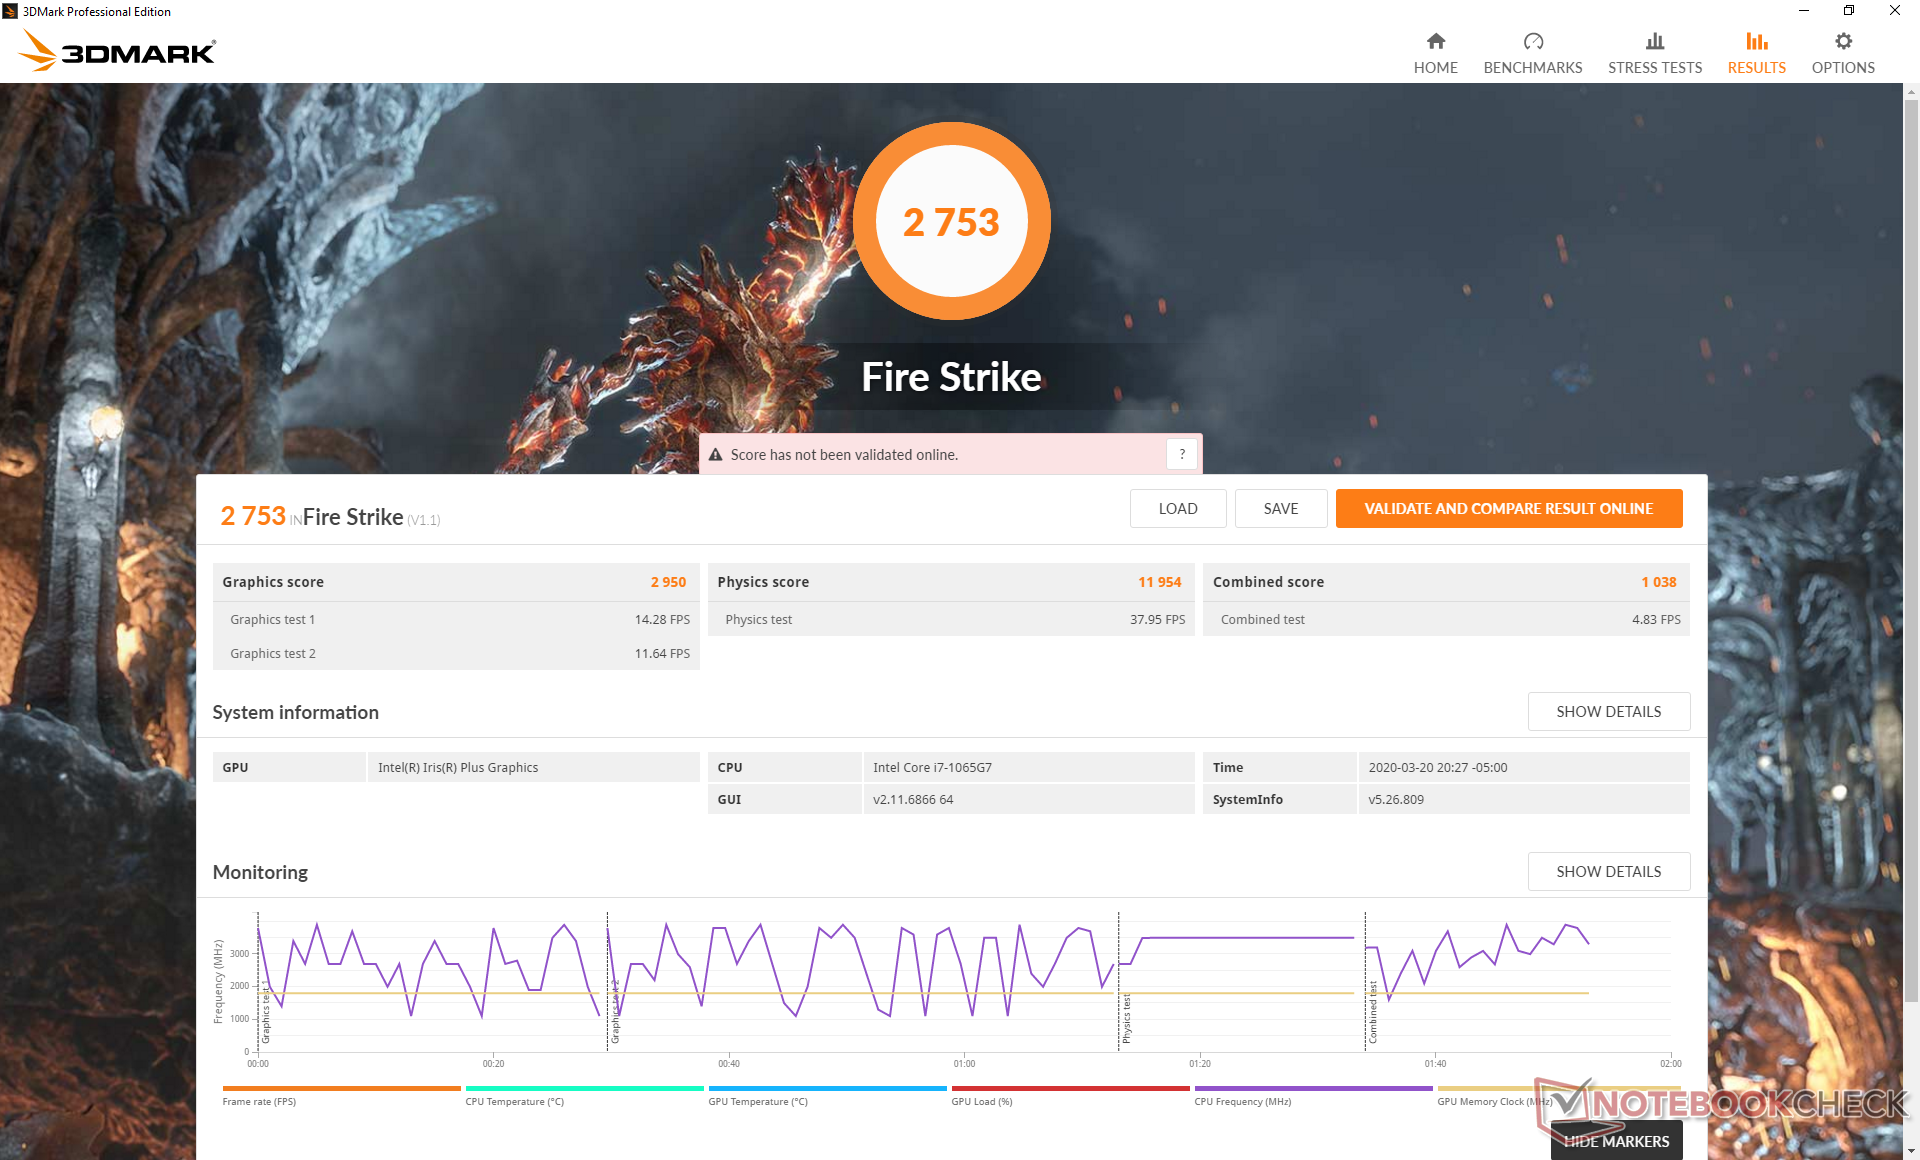
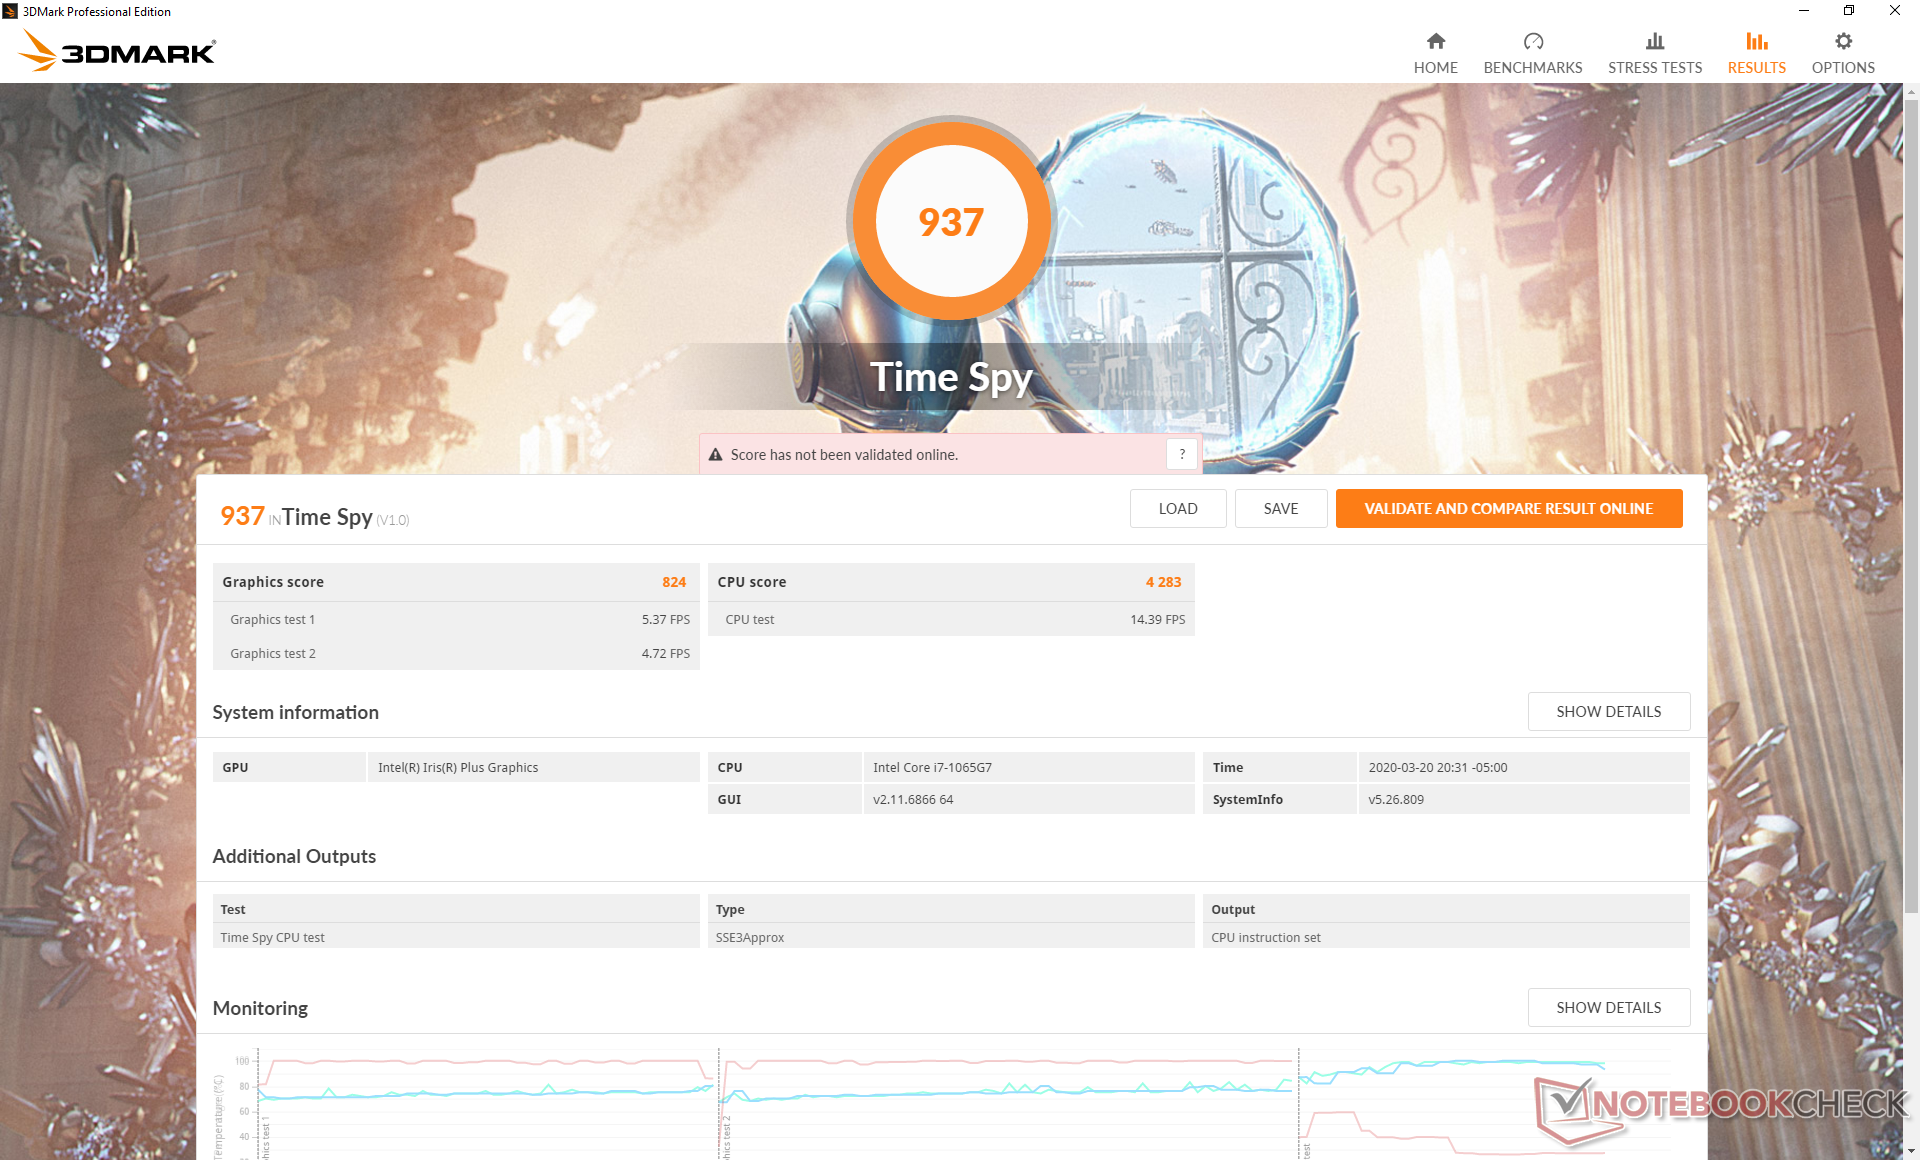
Le prestazioni nel gaming sono significativamente migliori rispetto all'ormai obsoleta UHD Graphics 620, ma ancora deludenti nel complesso se confrontate con le serie concorrenti RX Vega 8 o Vega 10. I benchmarks sintetici come 3DMark suggeriscono che la Iris Plus G7 è alla pari con la RX Vega 10, ma i benchmarks del mondo reale dei giochi mostrano ancora che la soluzione AMD supera la più recente soluzione Intel in alcuni giochi.
Forse più in particolare, il salto di prestazioni della GPU tra le SKU XPS 13 Core i5-1035G1 e Core i7-1065G7 è abbastanza significativo con circa il 70%, il che significa che gli utenti potrebbero voler considerare la SKU Core i7 se intendono sfruttare al meglio l'Intel Ice Lake.
Consultate la nostra pagina dedicata alla Iris Plus G7 per ulteriori benchmarks.
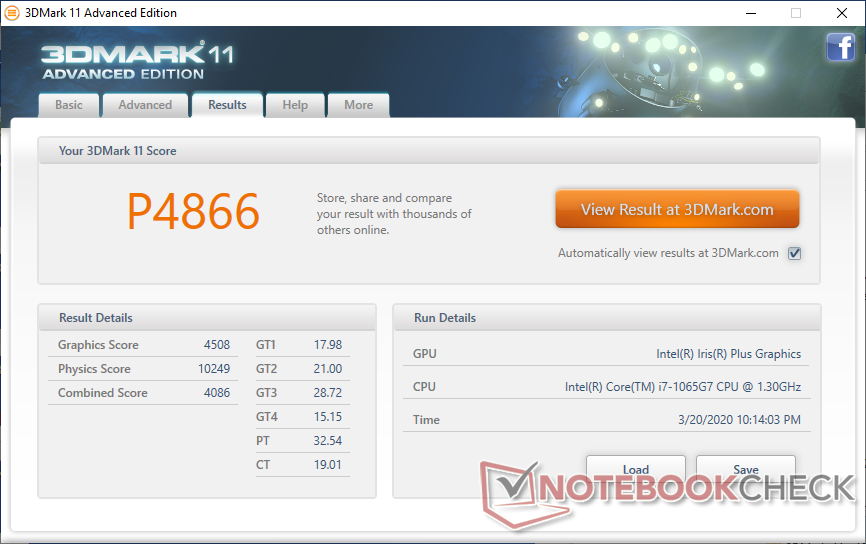
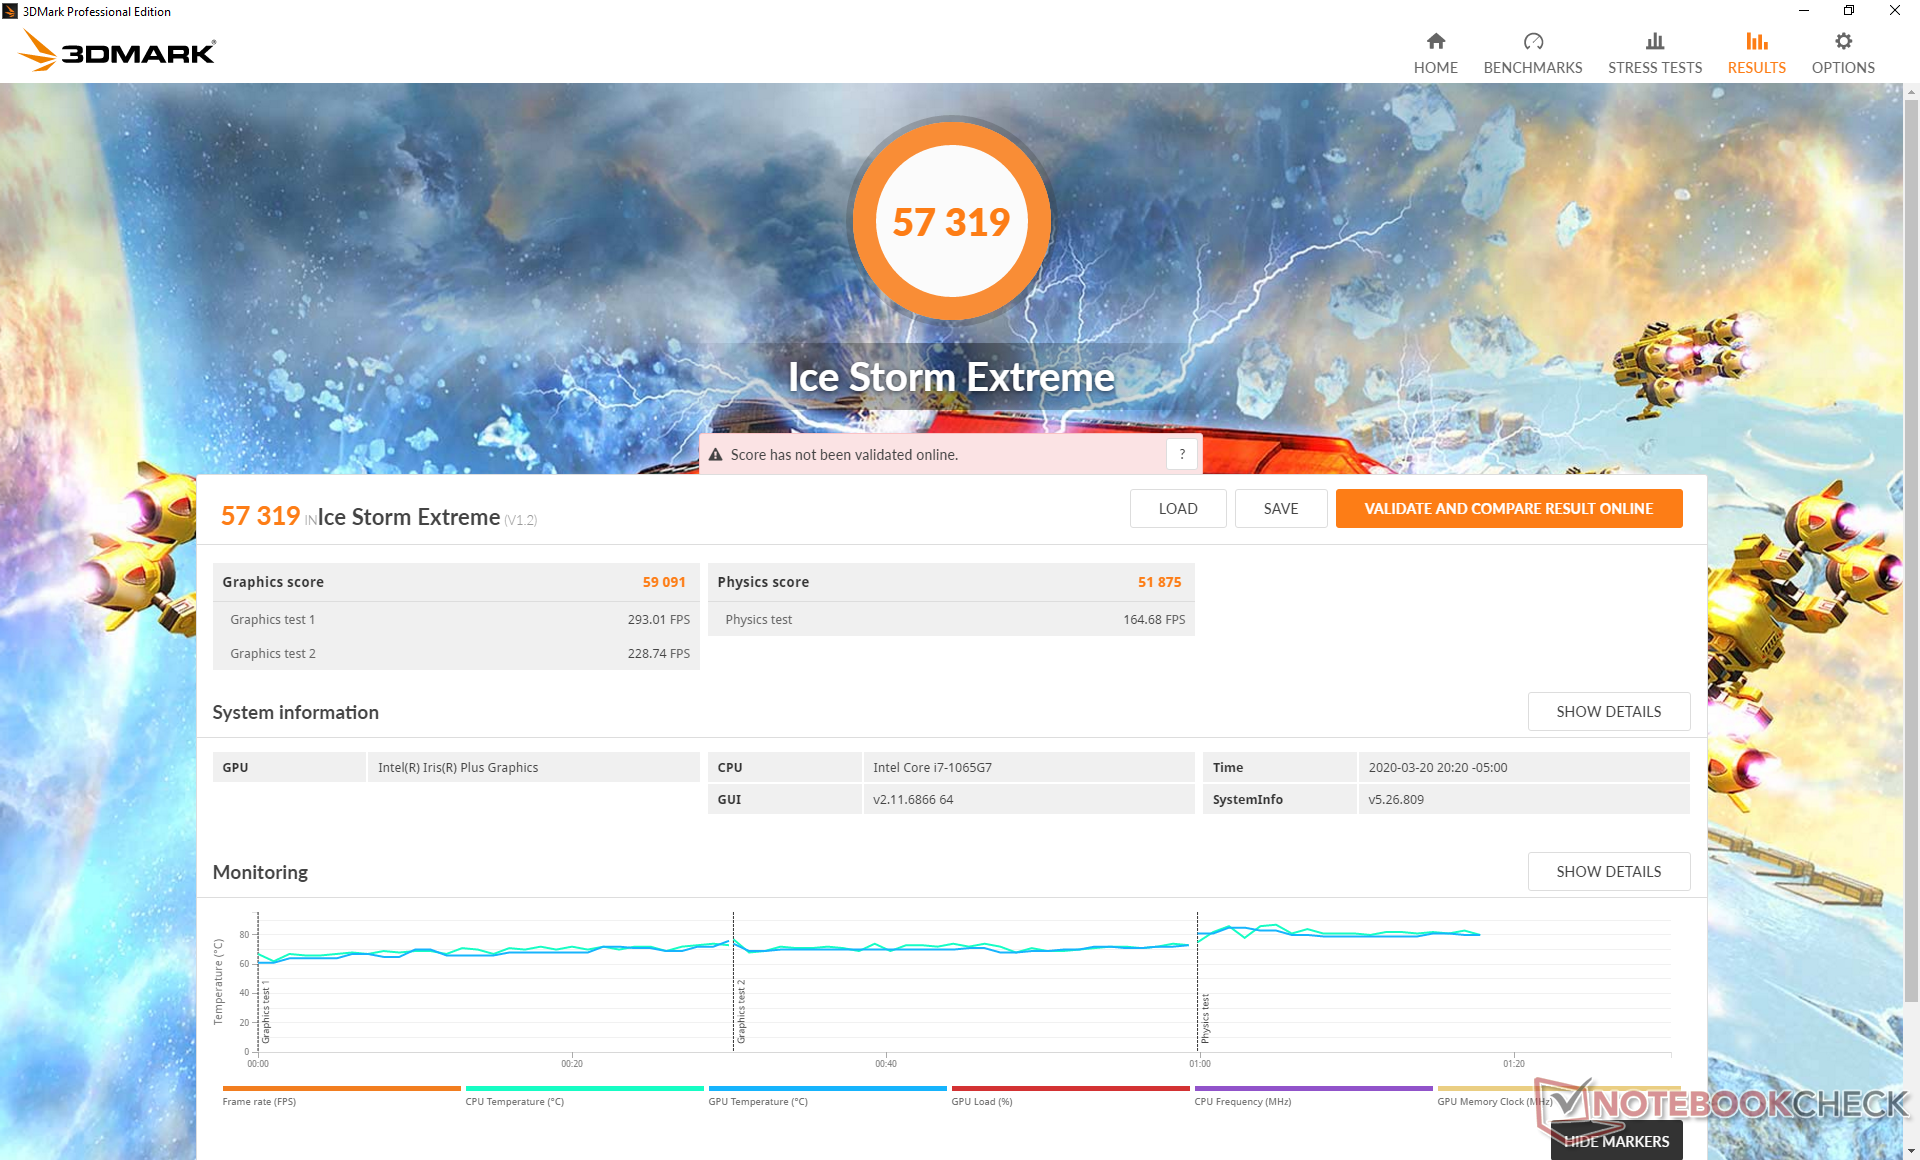
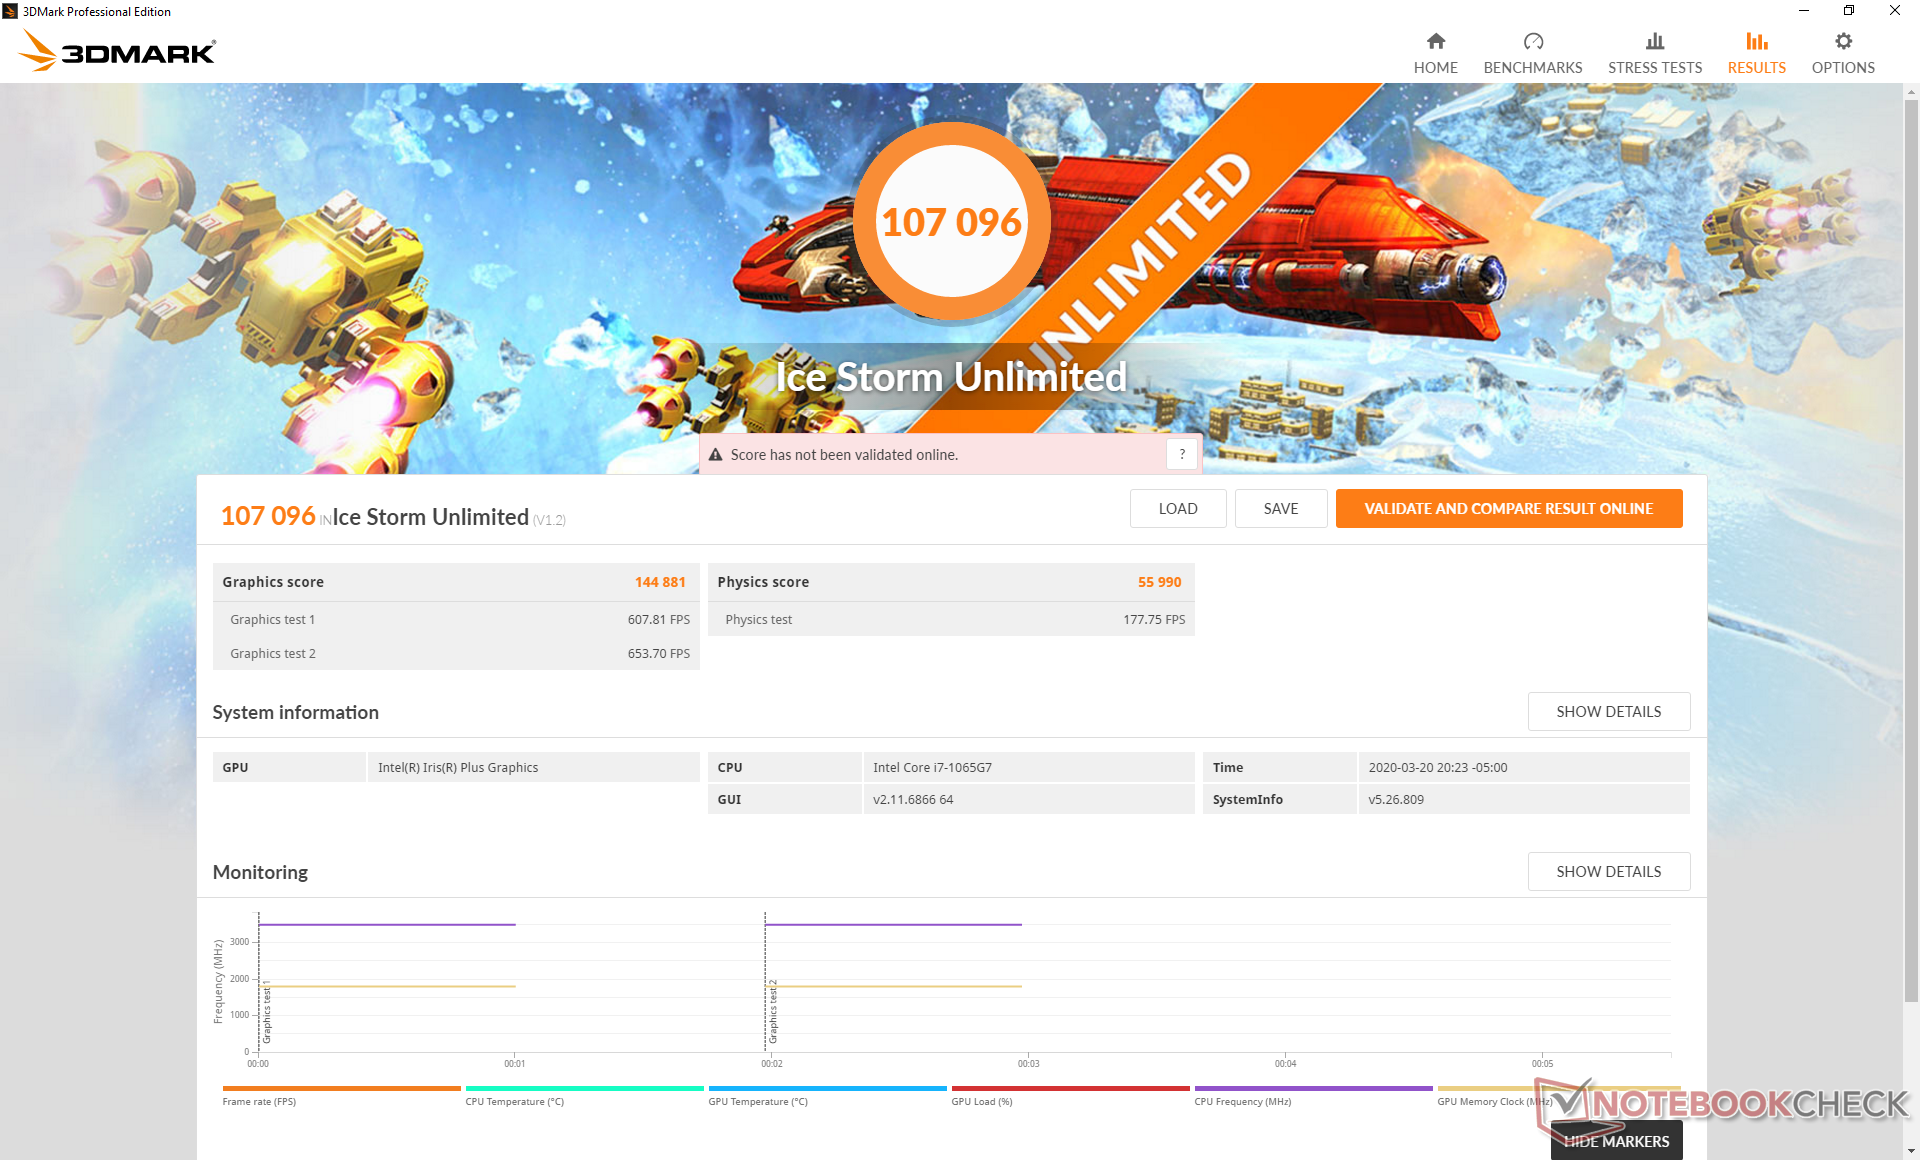
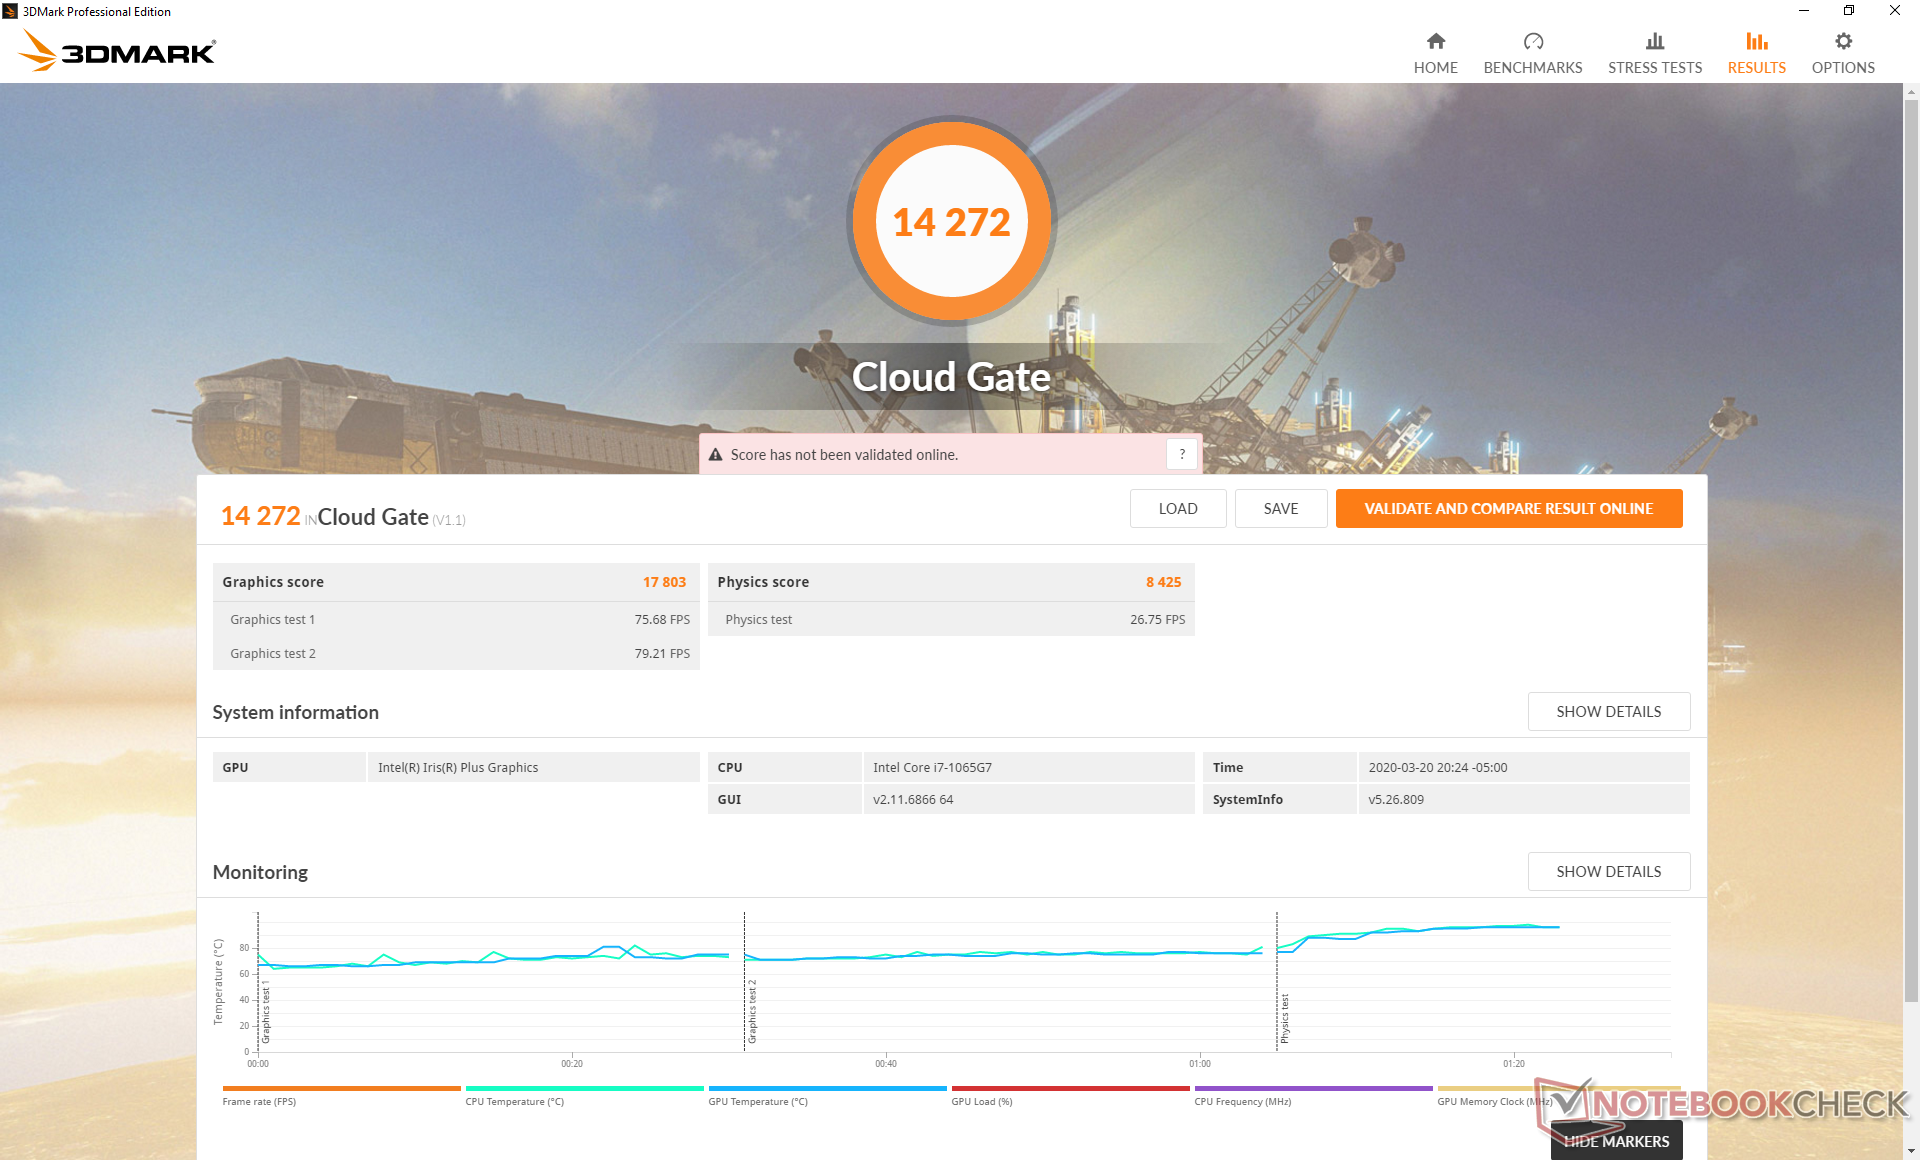
| 3DMark 11 Performance | 4866 punti | |
| 3DMark Ice Storm Standard Score | 67829 punti | |
| 3DMark Cloud Gate Standard Score | 14272 punti | |
| 3DMark Fire Strike Score | 2753 punti | |
| 3DMark Time Spy Score | 937 punti | |
Aiuto | ||
| Shadow of the Tomb Raider - 1280x720 Lowest Preset | |
| Desktop PC | |
| MSI Modern 15 A10RB | |
| Dell Inspiron 15 5000 5585 | |
| Dell XPS 13 9300 Core i7-1065G7 | |
| Media Intel Iris Plus Graphics G7 (Ice Lake 64 EU) (15.6 - 33, n=13) | |
| Dell XPS 13 7390 Core i7-10710U | |
| The Witcher 3 | |
| 1024x768 Low Graphics & Postprocessing | |
| Huawei MateBook 13 i7 | |
| MSI Modern 15 A10RB | |
| Dell Inspiron 15 5000 5585 | |
| Dell XPS 13 9300 Core i7-1065G7 | |
| Media Intel Iris Plus Graphics G7 (Ice Lake 64 EU) (28.2 - 58, n=20) | |
| Dell XPS 13 7390 Core i7-10710U | |
| HP Pavilion x360 15-dq0065cl | |
| 1366x768 Medium Graphics & Postprocessing | |
| MSI Modern 15 A10RB | |
| Huawei MateBook 13 i7 | |
| Dell XPS 13 9300 Core i7-1065G7 | |
| Media Intel Iris Plus Graphics G7 (Ice Lake 64 EU) (20.8 - 36.8, n=18) | |
| HP Pavilion x360 15-dq0065cl | |
| 1920x1080 High Graphics & Postprocessing (Nvidia HairWorks Off) | |
| HP Pavilion Gaming 15t-cx0000 | |
| MSI Modern 15 A10RB | |
| Huawei MateBook 13 i7 | |
| Dell Inspiron 15 5000 5585 | |
| Dell XPS 13 9300 Core i7-1065G7 | |
| Media Intel Iris Plus Graphics G7 (Ice Lake 64 EU) (10.9 - 20.1, n=18) | |
Da fermo con The Witcher 3 per oltre un'ora emerge l'incapacità del sistema di mantenere un frame rate costante. Come mostrato dal grafico sottostante, i frame rate sarebbero stabili a circa 50 FPS durante i primi 15 minuti circa prima di iniziare ad oscillare tra i 40 e i 60 fps. Al contrario, la maggior parte degli altri portatili funziona a frame rate più stabili dall'inizio alla fine. La velocità di clock della GPU ciclica che descriveremo in dettaglio nella sezione Stress Test qui sotto è il probabile colpevole di questo comportamento indesiderato durante l'esecuzione dei giochi.
| basso | medio | alto | ultra | |
|---|---|---|---|---|
| BioShock Infinite (2013) | 104.2 | 66.8 | 56.7 | 21.1 |
| The Witcher 3 (2015) | 50.7 | 33.5 | 18.4 | 9.1 |
| Rocket League (2017) | 85.5 | 53.6 | 38.3 | |
| Shadow of the Tomb Raider (2018) | 28 |
Emissioni
Rumorosità di sistema
Il rumore delle ventole è quasi inesistente durante i tipici carichi di lavoro quotidiani come la navigazione o lo streaming video. Riesce persino a restare silenzioso durante l'esecuzione di 3DMark 06 fino alla fine della prima scena di riferimento. Nel peggiore dei casi, aspettatevi un rumore della ventola di soli 32,5 dB(A) su uno sfondo di 28,3 dB(A) quando si esegue il multi-tasking per lunghi periodi.
Se si eseguono carichi molto elevati come il gaming, il rumore delle ventole salterà e si stabilizzerà a 39.3 dB(A). Il valore di 40 dB(A) è comune per gli Ultrabooks quando sono sottoposti ad un elevato stress di elaborazione, quindi questo non è inaspettato. Il rumore della ventola ad alta frequenza dell'XPS 13 9300, tuttavia, lo rende più evidente di quanto dovrebbe essere.
Siamo in grado di notare un leggero rumore elettronico dalla nostra unità di test quando mettiamo un orecchio vicino ai tasti della tastiera. Per fortuna non si nota quando si è seduti a una normale distanza dal sistema.
| Dell XPS 13 9300 Core i7-1065G7 Iris Plus Graphics G7 (Ice Lake 64 EU), i7-1065G7, Intel SSDPEMKF512G8 NVMe SSD | Dell XPS 13 7390 Core i7-10710U UHD Graphics 620, i7-10710U, SK Hynix PC601 NVMe 512 GB | Dell XPS 13 7390 2-in-1 Core i7 Iris Plus Graphics G7 (Ice Lake 64 EU), i7-1065G7, Toshiba BG4 KBG40ZPZ512G | Huawei Matebook X Pro i5 GeForce MX150, i5-8250U, Samsung PM961 MZVLW256HEHP | Microsoft Surface Laptop 3 13 Core i5-1035G7 Iris Plus Graphics G7 (Ice Lake 64 EU), i5-1035G7, SK hynix BC501 HFM256GDGTNG | Dell XPS 13 9300 i5 FHD UHD Graphics G1 (Ice Lake 32 EU), i5-1035G1, Toshiba XG6 KXG60ZNV512G | |
|---|---|---|---|---|---|---|
| Noise | -3% | -2% | -5% | 0% | 2% | |
| off /ambiente * (dB) | 28.3 | 28 1% | 28.1 1% | 27.9 1% | 28.5 -1% | 29.3 -4% |
| Idle Minimum * (dB) | 28.3 | 28 1% | 28.1 1% | 27.9 1% | 28.5 -1% | 29.3 -4% |
| Idle Average * (dB) | 28.3 | 28 1% | 28.1 1% | 27.9 1% | 28.5 -1% | 29.3 -4% |
| Idle Maximum * (dB) | 28.3 | 28 1% | 28.1 1% | 27.9 1% | 28.5 -1% | 29.3 -4% |
| Load Average * (dB) | 32.5 | 33.7 -4% | 31.7 2% | 36.2 -11% | 28.5 12% | 30 8% |
| Witcher 3 ultra * (dB) | 39.3 | 43.4 -10% | 45 -15% | 40.4 -3% | ||
| Load Maximum * (dB) | 39.3 | 46.5 -18% | 43.4 -10% | 45.2 -15% | 40.4 -3% | 32.4 18% |
* ... Meglio usare valori piccoli
Rumorosità
| Idle |
| 28.3 / 28.3 / 28.3 dB(A) |
| Sotto carico |
| 32.5 / 39.3 dB(A) |
 | ||
30 dB silenzioso 40 dB(A) udibile 50 dB(A) rumoroso |
||
min: | ||
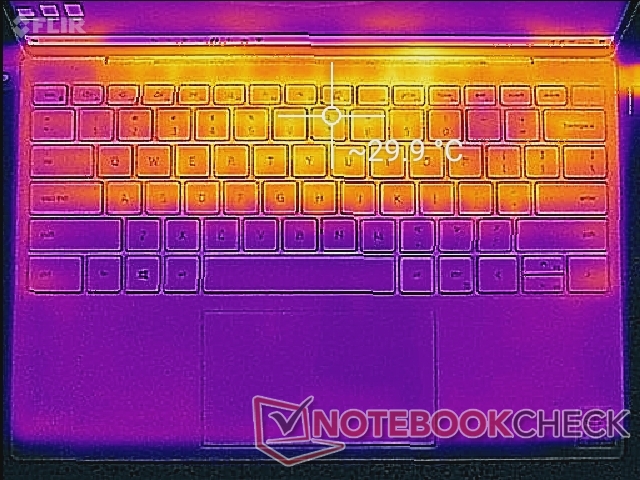
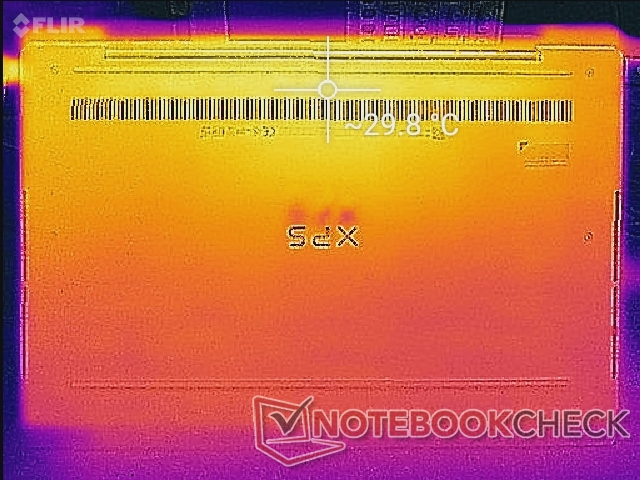
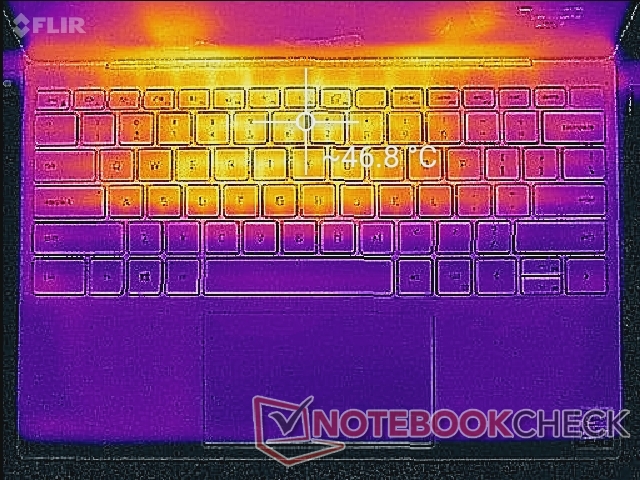
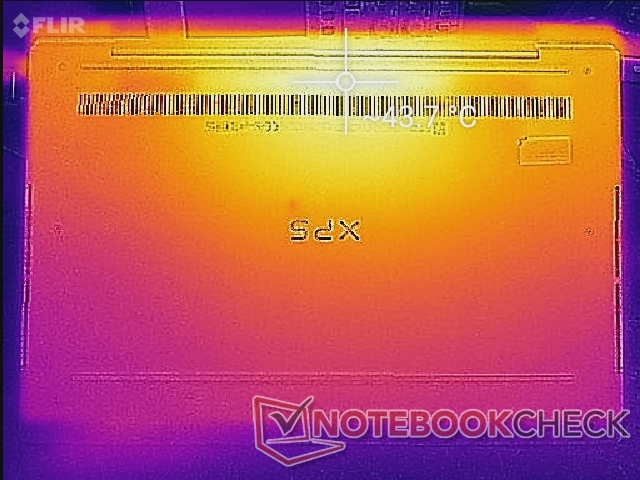
Temperature
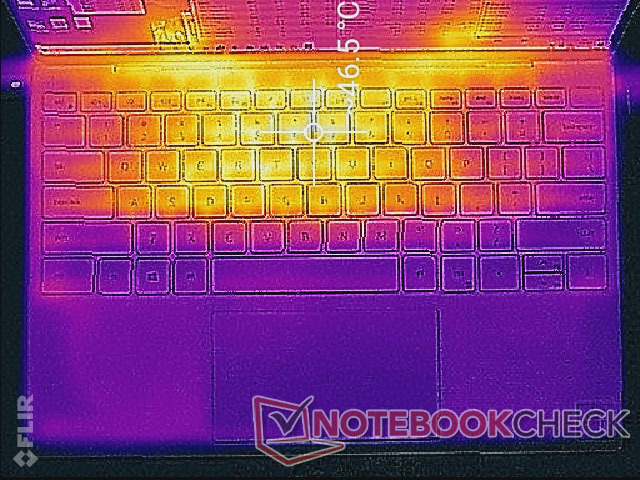
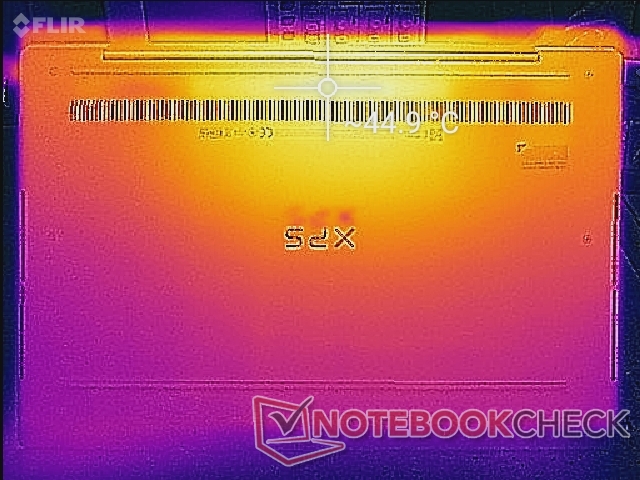
Le temperature di superficie al minimo vanno da 26 °C sui poggiapolsi a 30 °C sui punti caldi nella parte posteriore. Sotto carichi elevati, gli stessi punti caldi possono arrivare a 47 °C per avvicinandosi ai valori che abbiamo registrato sull'XPS 13 2-in-1 con la stessa CPU Core i7.
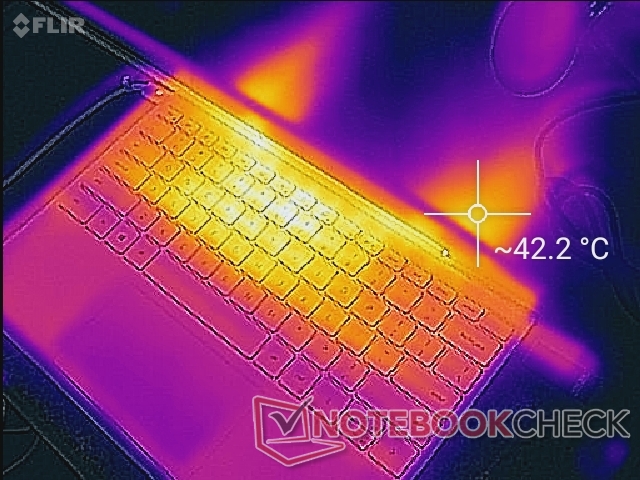
(-) La temperatura massima sul lato superiore è di 46.6 °C / 116 F, rispetto alla media di 35.9 °C / 97 F, che varia da 21.4 a 59 °C per questa classe Subnotebook.
(±) Il lato inferiore si riscalda fino ad un massimo di 44.8 °C / 113 F, rispetto alla media di 39.2 °C / 103 F
(+) In idle, la temperatura media del lato superiore è di 27.4 °C / 81 F, rispetto alla media deld ispositivo di 30.8 °C / 87 F.
(±) Riproducendo The Witcher 3, la temperatura media per il lato superiore e' di 33.9 °C / 93 F, rispetto alla media del dispositivo di 30.8 °C / 87 F.
(+) I poggiapolsi e il touchpad sono piu' freddi della temperatura della pelle con un massimo di 29.8 °C / 85.6 F e sono quindi freddi al tatto.
(±) La temperatura media della zona del palmo della mano di dispositivi simili e'stata di 28.2 °C / 82.8 F (-1.6 °C / -2.8 F).
Stress Test
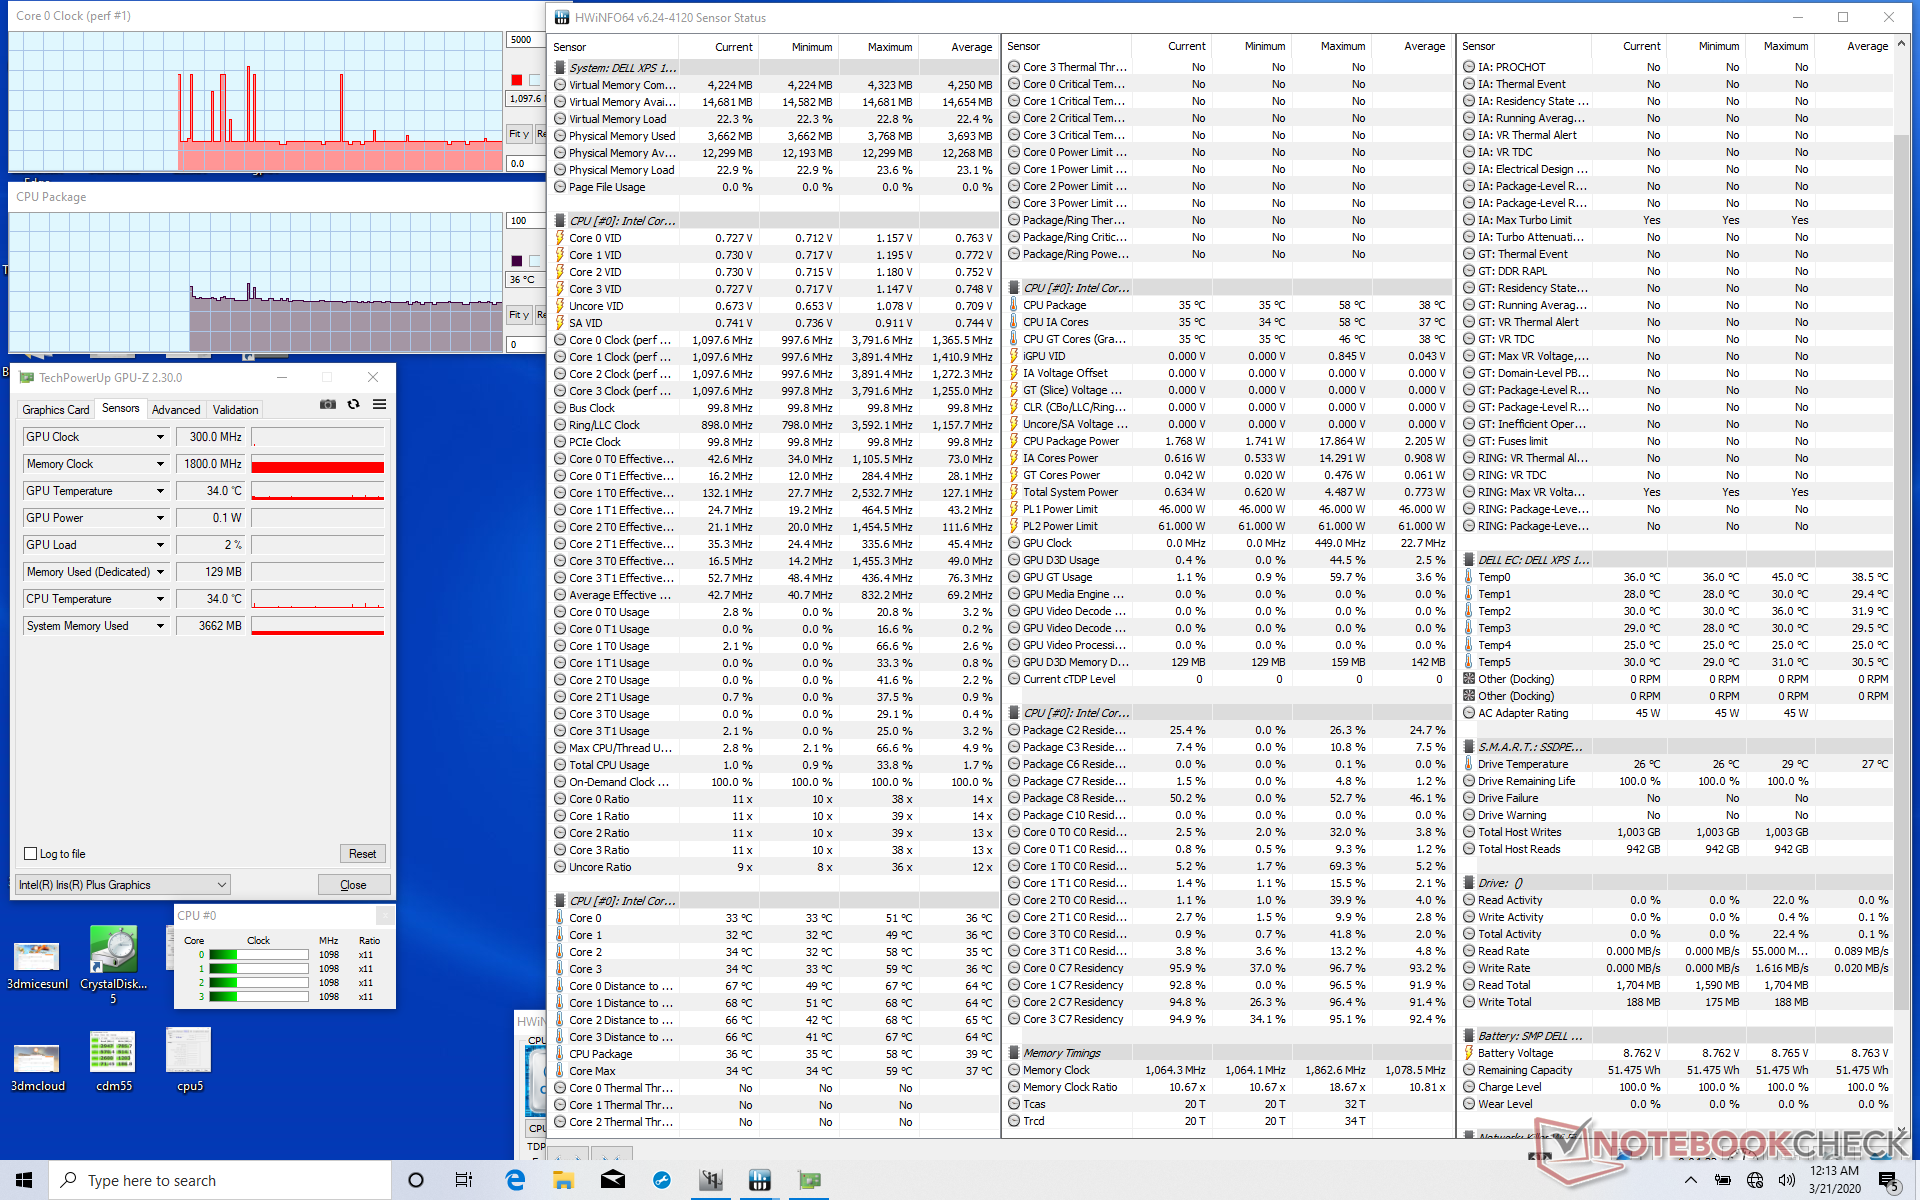
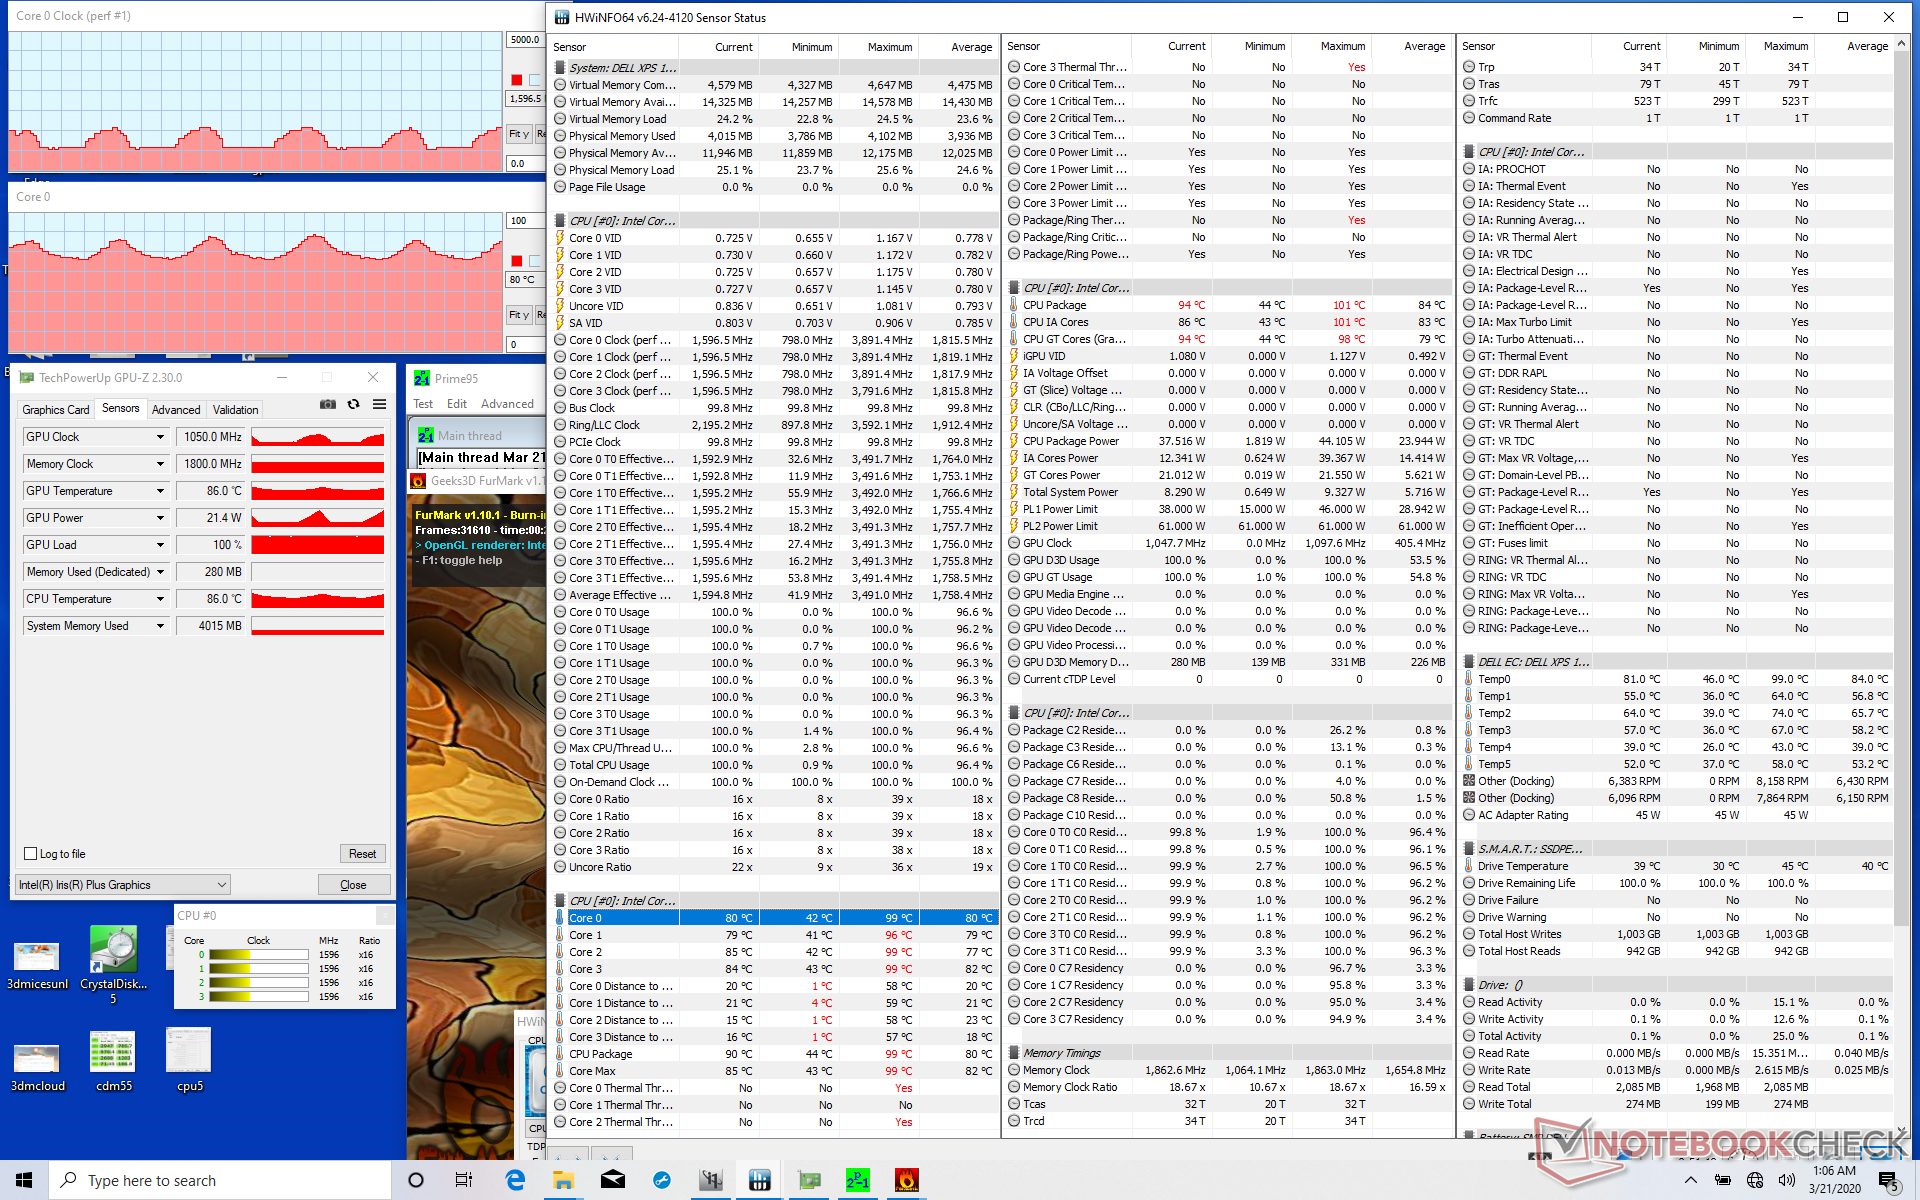
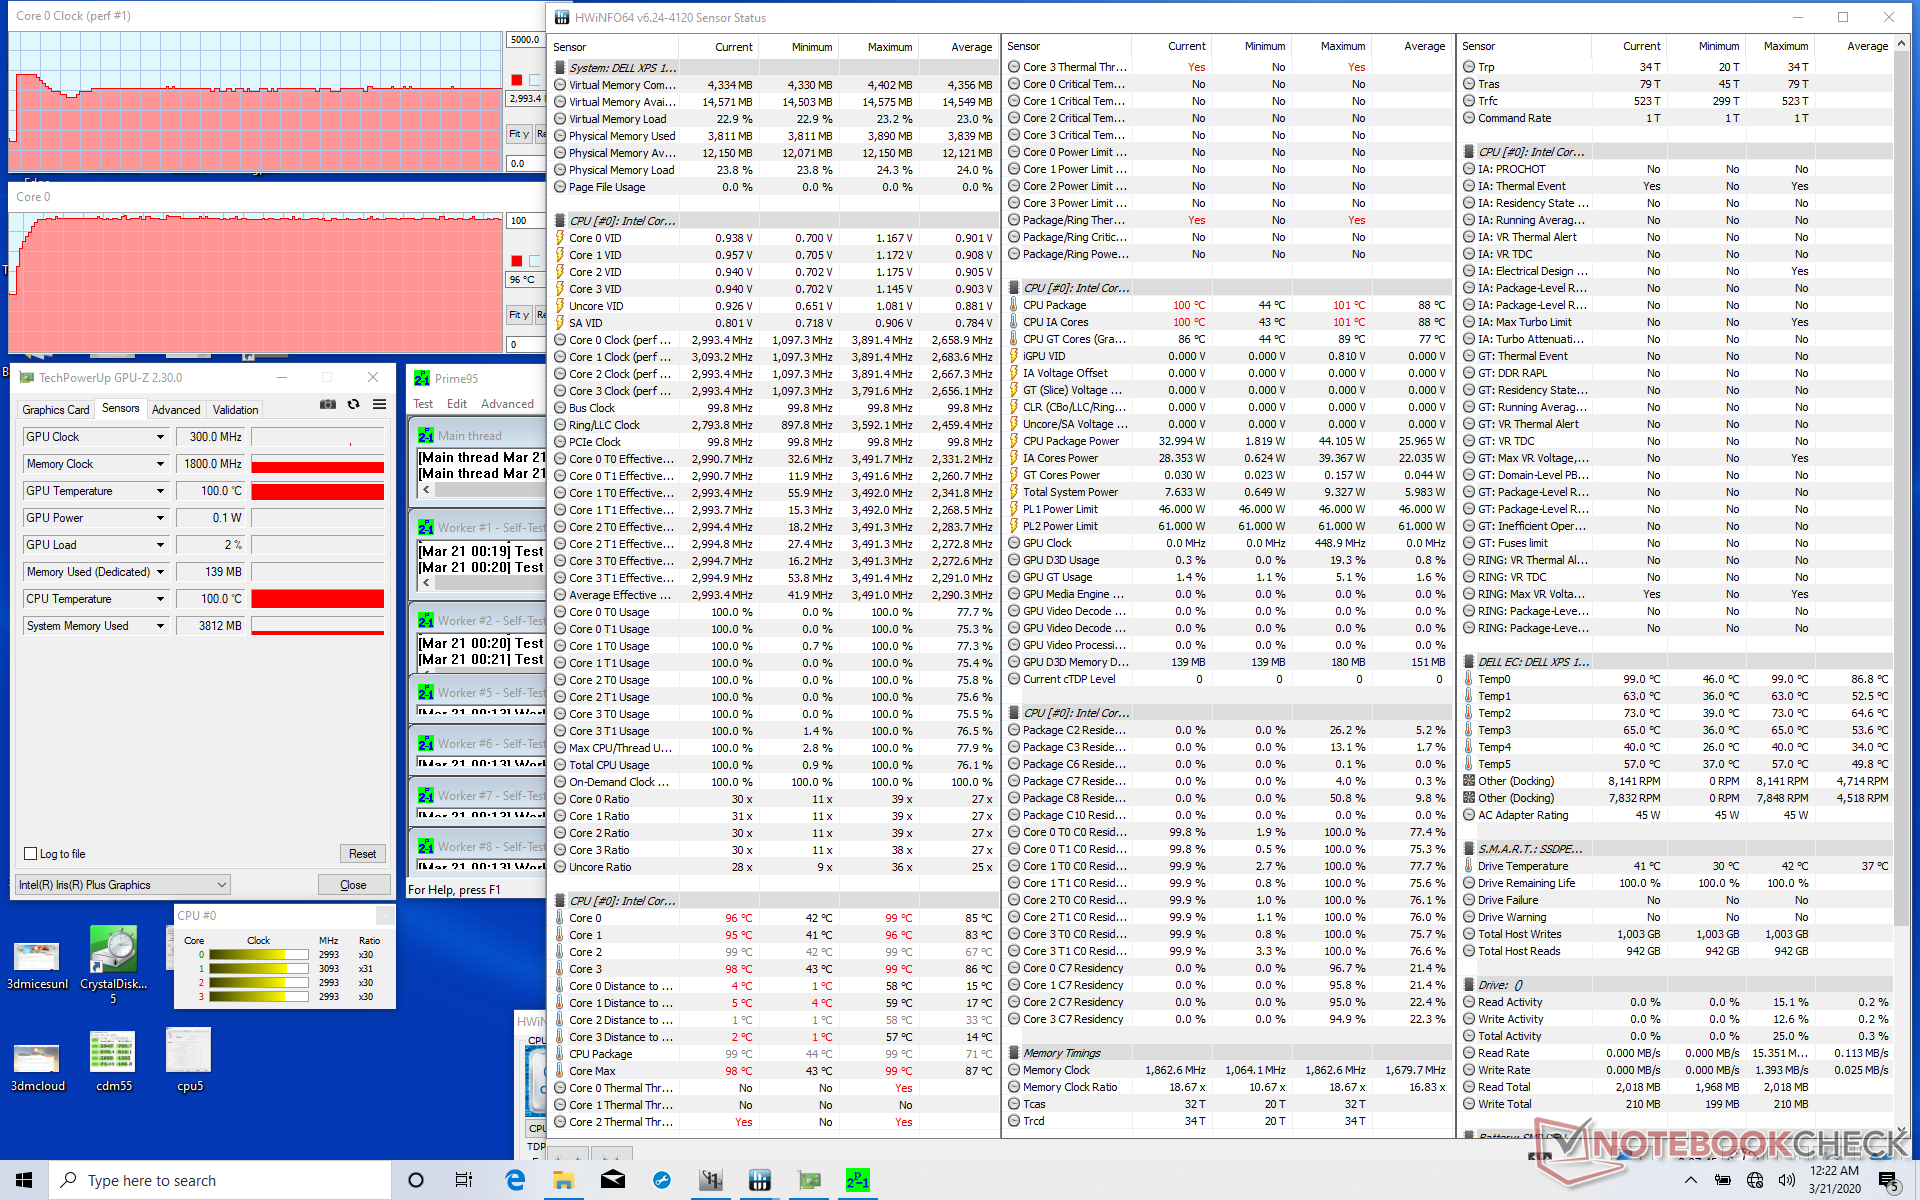
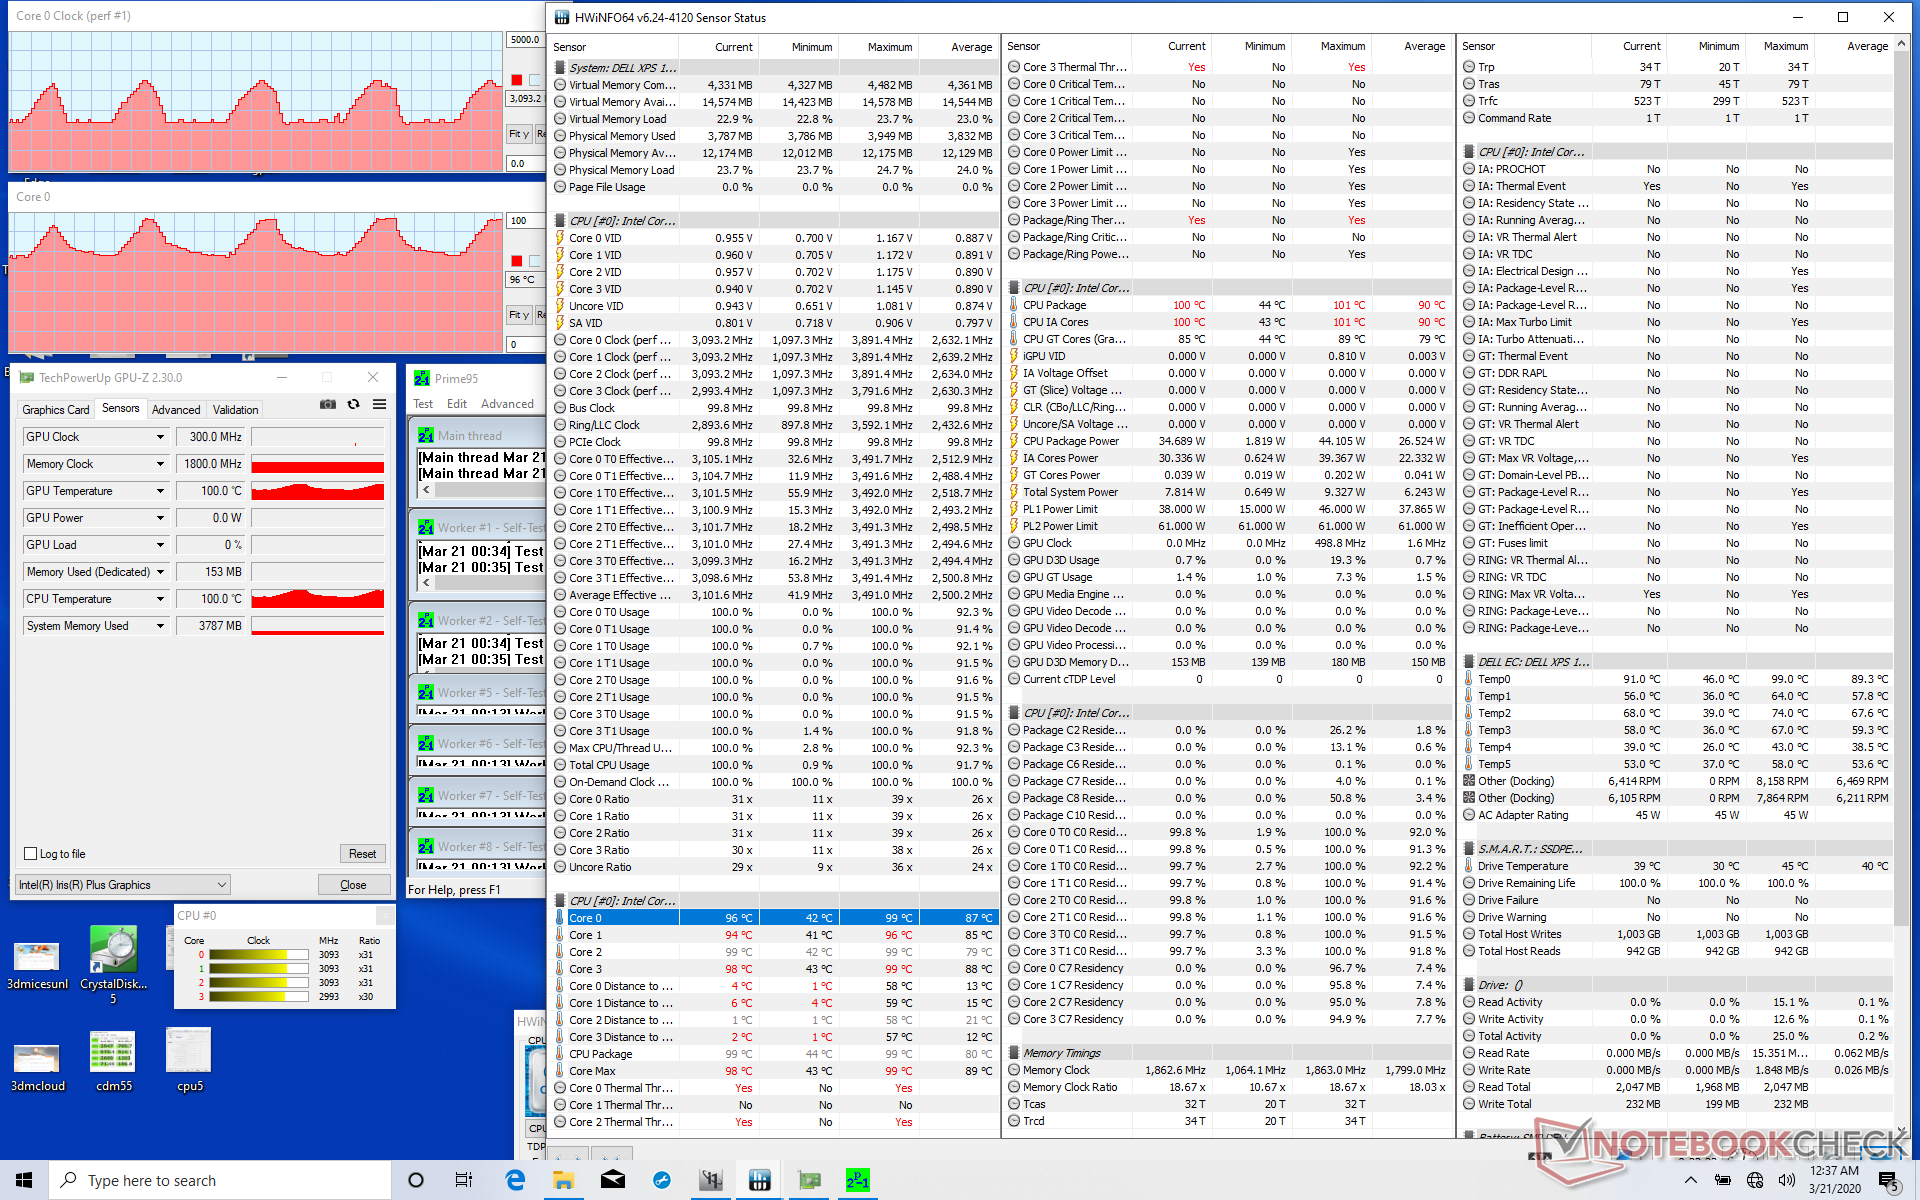
Stressiamo il sistema con carichi sintetici per identificare eventuali problemi di strozzamento o di stabilità. Quando si esegue Prime95, la CPU sale fino a 3,5 GHz per i primi 10 secondi circa fino a raggiungere una temperatura del core di 99 °C. In seguito, le velocità di clock e la temperatura scendono immediatamente e si stabilizzano a 3,0 GHz e ~96 °C, rispettivamente. Dopo pochi minuti, tuttavia, le frequenze di clock e la temperatura iniziano a passare rispettivamente da 1,8 GHz a 3,3 GHz e da 70 °C a 97 °C, come mostrano i nostri screenshots qui sotto. Questo comportamento garantisce che la temperatura interna non si mantenga a >95 °C al costo di una costante frequenza di clock. Anche se il processore non ralenta al di sotto della sua velocità di clock di base durante l'esecuzione di Prime95, non è in grado di mantenere una velocità di clock Turbo Boost fissa per periodi prolungati.
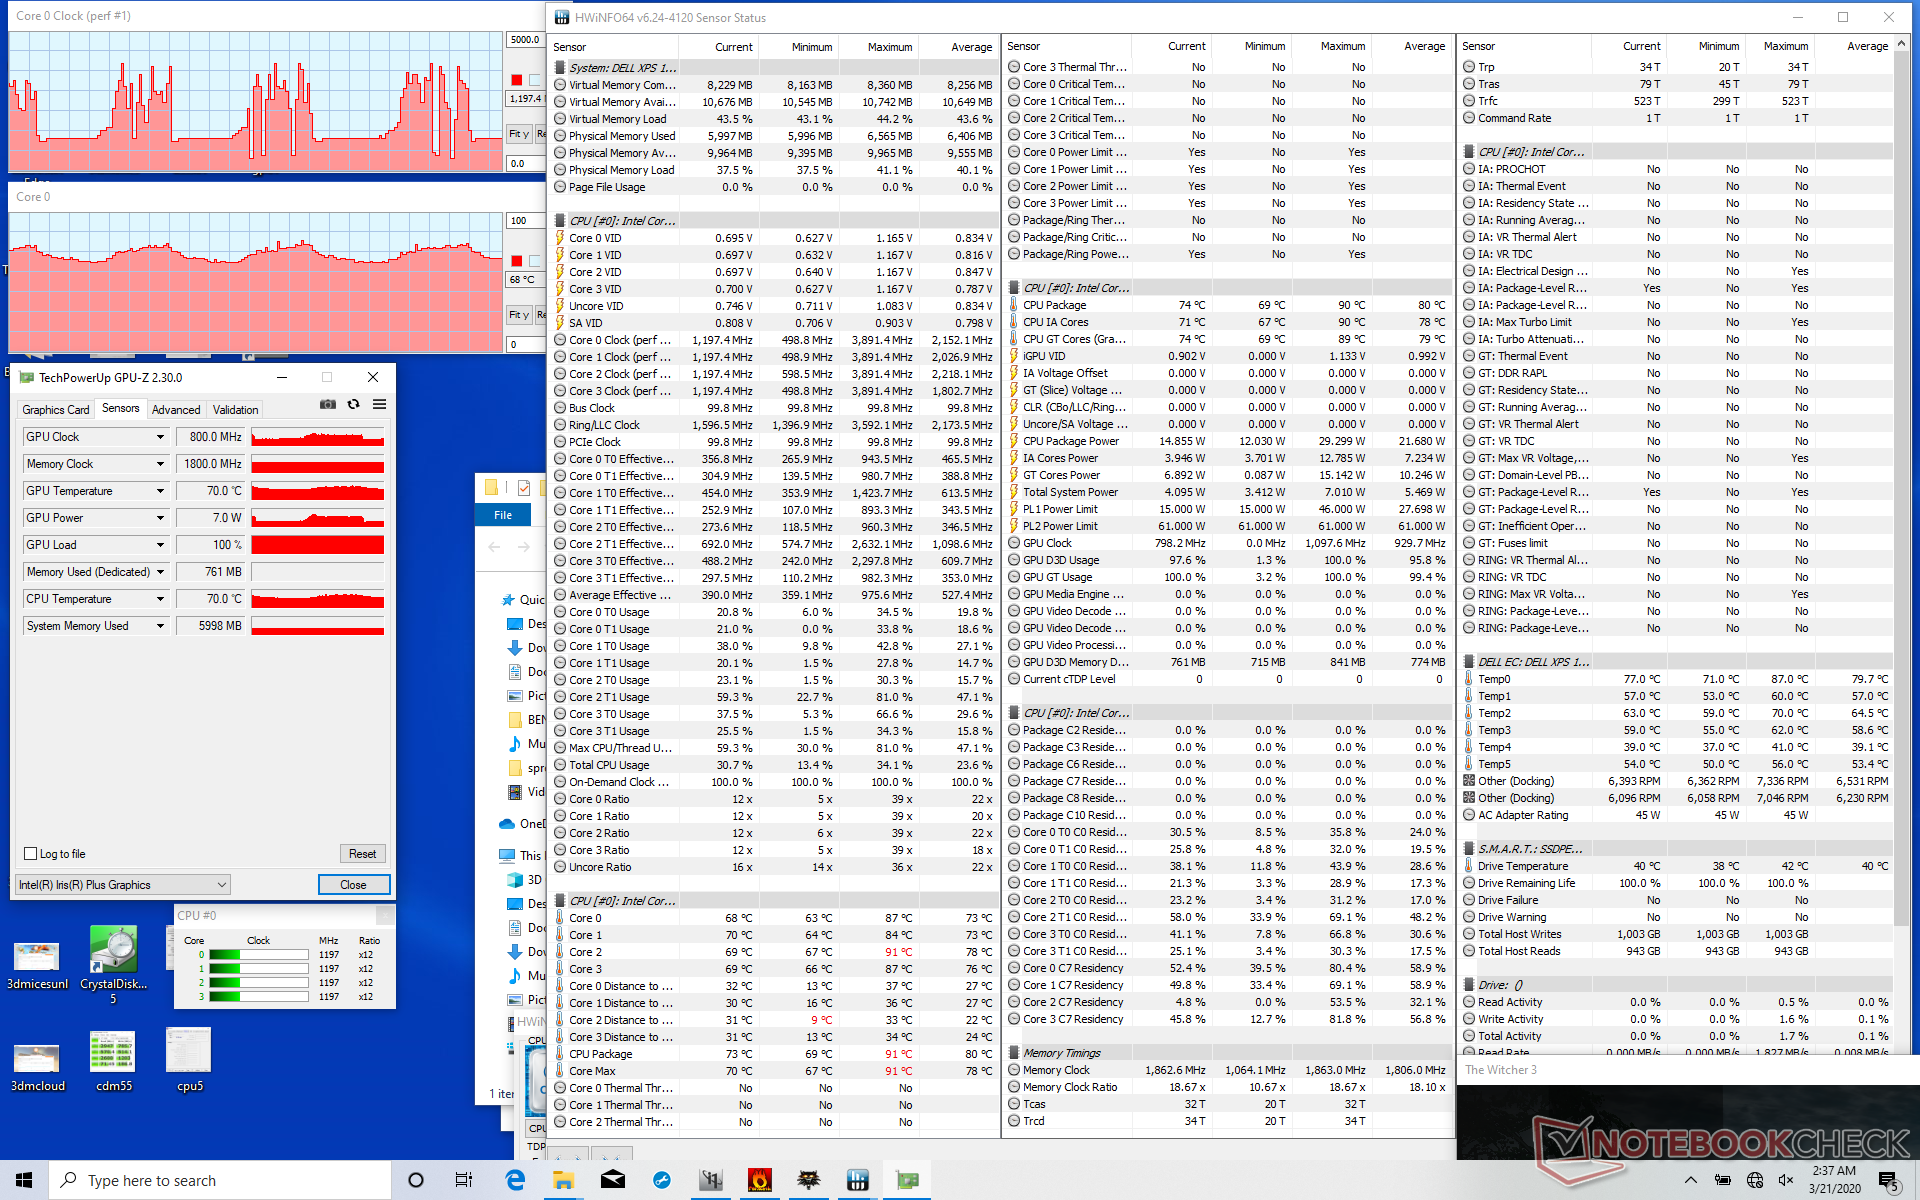
L'esecuzione di The Witcher 3 è più rappresentativa di carichi reali stressanti. In tali condizioni, la velocità di clock delle GPU si colloca tra i 750 e i 1000 MHz, il che, purtroppo, porta ai frame rate ciclici che abbiamo descritto in precedenza.
Usando la batteria si avrà un impatto sulle prestazioni. Un test 3DMark 11 usando la batteria restituisce i punteggi Physics e Graphics di 4680 e 1675 punti, rispettivamente, rispetto a 10249 e 4508 punti quando si è connessi alla rete elettrica.
| CPU Clock (GHz) | GPU Clock (MHz) | Average CPU Temperature (°C) | |
| System Idle | -- | -- | 35 |
| Prime95 Stress | 1.8 - 3.3 | -- | 70 - 97 |
| Prime95 + FurMark Stress | 0.9 - 1.6 | 550 - 1050 | 67 - 81 |
| Witcher 3 Stress | 1.2 - 3.8 | 750 - 1000 | 65 - 77 |
Gestione Energetica
Consumo Energetico
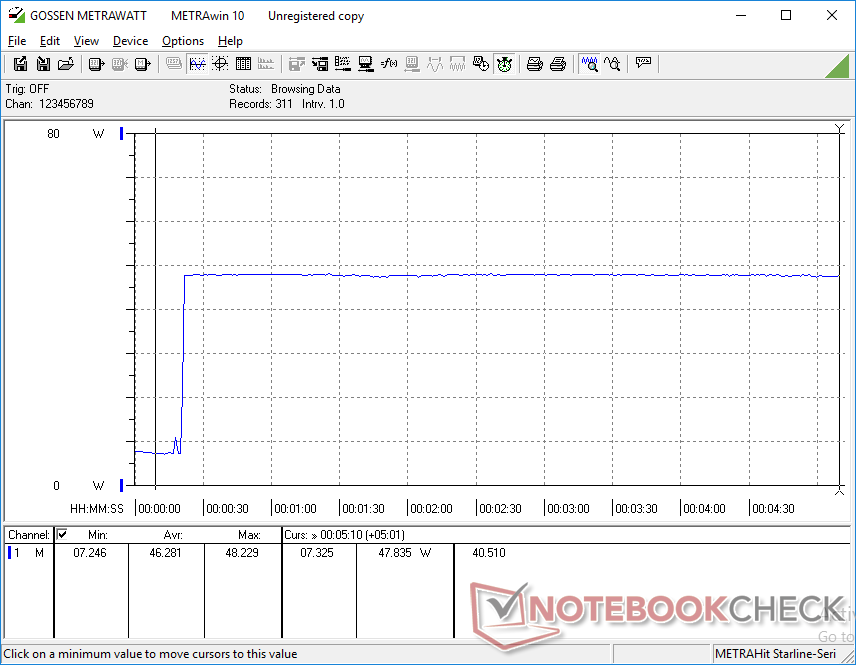
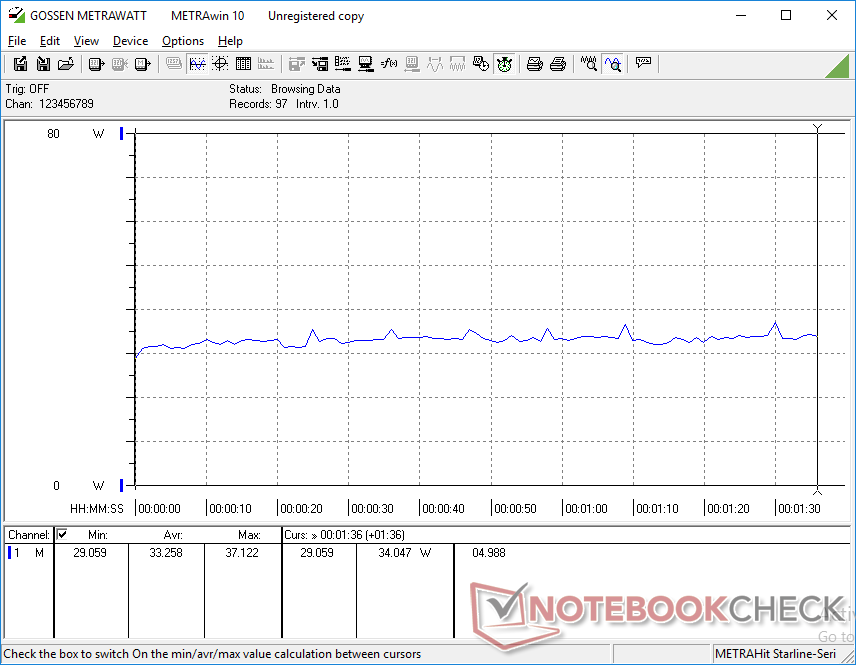
Il sistema consuma tra 4 W e 8 C quando è al minimo, a seconda del profilo di potenza e dell'impostazione della luminosità. Quando si eseguono carichi più elevati come i giochi, il consumo varia da 33 W a 37 W, non diversamente da quanto misurato sulla SKU XPS 13 Core i5 nonostante le notevoli differenze di prestazioni delle GPU. Pertanto, il Core i7-1065G7 è in grado di offrire prestazioni grafiche nettamente superiori rispetto alla SKU Core i5 senza necessariamente richiedere una maggiore potenza dalla presa elettrica.
Gli ultrabooks con le GeForce MX150 o MX250 consumeranno solo pochi watt in più ciascuno rispetto al nostro sistema Ice Lake quando si gioca. Le prestazioni per Watt sono ancora molto a favore di Nvidia, dato che le MX150/MX250 supereranno sempre le prestazioni dell'Iris Plus G7 quando si gioca con margini notevoli.
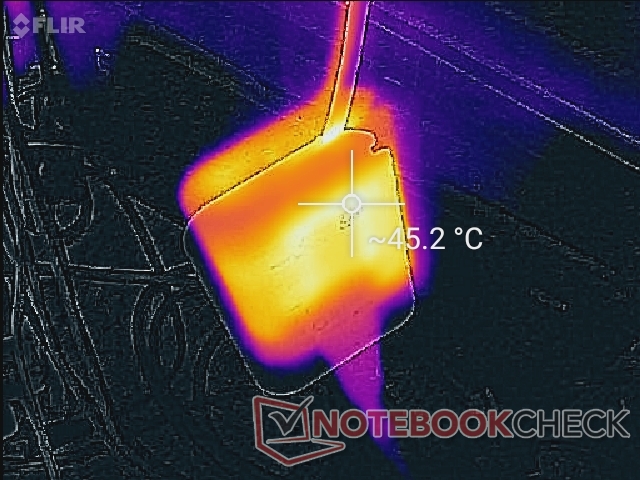
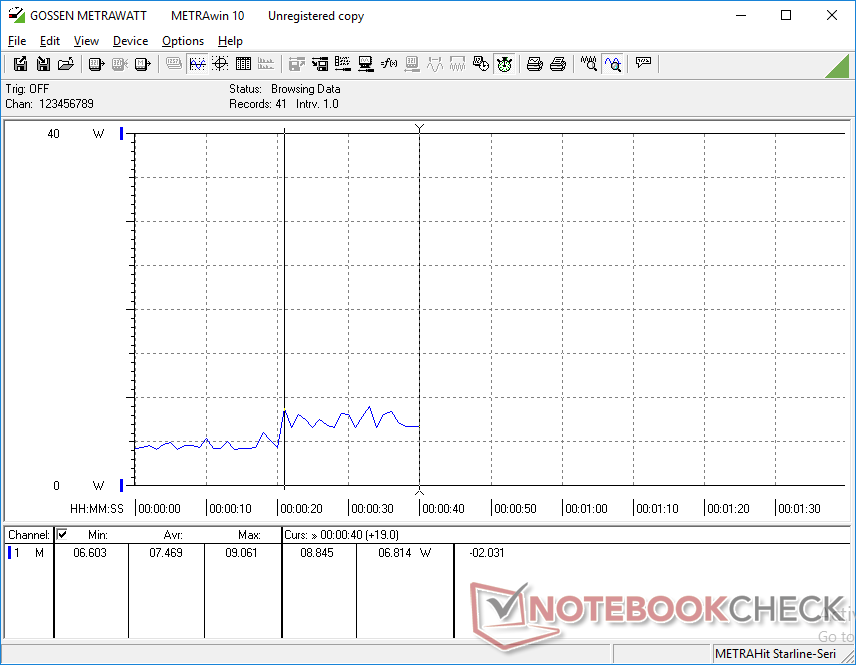
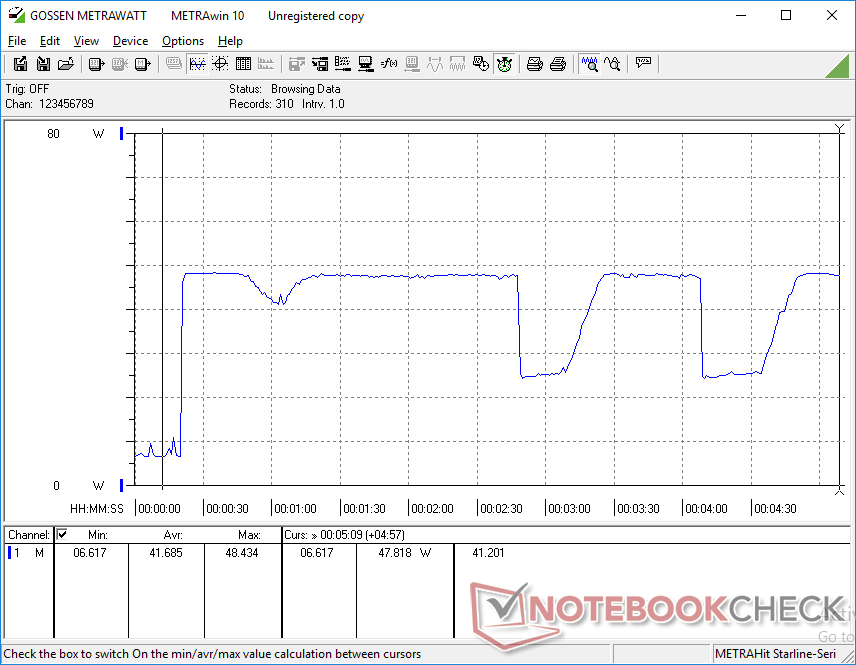
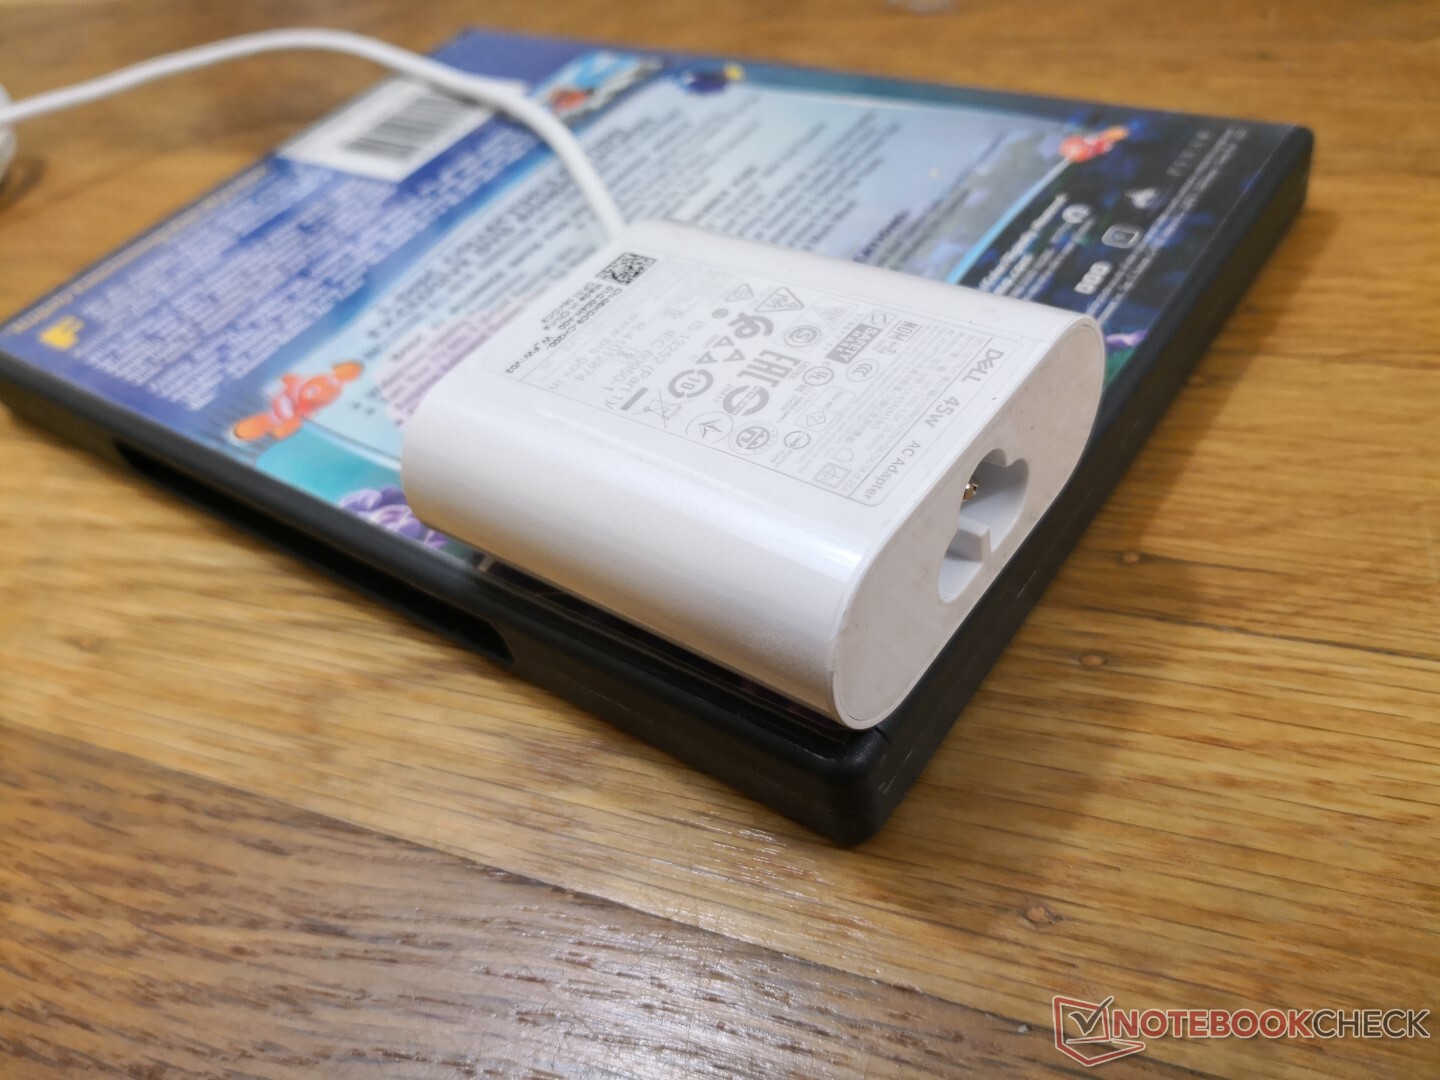
Siamo in grado di misurare un consumo massimo di 48,4 W dal piccolo (~6 x 5,5 x 3,2 cm) alimentatore da 45 W. Il consumo di energia può essere ciclico durante tali carichi estremi, come mostrano i nostri grafici qui sotto, che confermano i risultati del ciclo di clock e del CineBench loop di cui sopra.
| Off / Standby | |
| Idle | |
| Sotto carico |
|
Leggenda:
min: | |
| Dell XPS 13 9300 Core i7-1065G7 i7-1065G7, Iris Plus Graphics G7 (Ice Lake 64 EU), Intel SSDPEMKF512G8 NVMe SSD, IPS, 1920x1200, 13.4" | Dell XPS 13 7390 Core i7-10710U i7-10710U, UHD Graphics 620, SK Hynix PC601 NVMe 512 GB, IPS, 3840x2160, 13.3" | Dell XPS 13 7390 2-in-1 Core i7 i7-1065G7, Iris Plus Graphics G7 (Ice Lake 64 EU), Toshiba BG4 KBG40ZPZ512G, IPS, 1920x1200, 13.4" | Huawei Matebook X Pro i5 i5-8250U, GeForce MX150, Samsung PM961 MZVLW256HEHP, IPS, 3000x2000, 13.9" | Asus ZenBook S13 UX392FN i7-8565U, GeForce MX150, WDC PC SN520 SDAPNUW-512G, IPS, 1920x1080, 13.9" | Microsoft Surface Laptop 3 13 Core i5-1035G7 i5-1035G7, Iris Plus Graphics G7 (Ice Lake 64 EU), SK hynix BC501 HFM256GDGTNG, IPS, 2256x1504, 13.5" | Dell XPS 13 9300 i5 FHD i5-1035G1, UHD Graphics G1 (Ice Lake 32 EU), Toshiba XG6 KXG60ZNV512G, IPS, 1920x1200, 13.4" | |
|---|---|---|---|---|---|---|---|
| Power Consumption | -16% | 4% | -27% | -17% | -14% | -3% | |
| Idle Minimum * (Watt) | 4.2 | 4.7 -12% | 2.6 38% | 3.5 17% | 3.4 19% | 4.4 -5% | 3.4 19% |
| Idle Average * (Watt) | 6.9 | 8.3 -20% | 5.3 23% | 8.9 -29% | 6.3 9% | 7.5 -9% | 6 13% |
| Idle Maximum * (Watt) | 7.5 | 9 -20% | 7 7% | 12.3 -64% | 10.4 -39% | 7.8 -4% | 10.2 -36% |
| Load Average * (Watt) | 33.3 | 42 -26% | 43.1 -29% | 54.2 -63% | 51 -53% | 41.9 -26% | 36.6 -10% |
| Witcher 3 ultra * (Watt) | 37.1 | 43.1 -16% | 42.4 -14% | 39 -5% | 40.8 -10% | ||
| Load Maximum * (Watt) | 48.4 | 49 -1% | 49 -1% | 52.1 -8% | 62.7 -30% | 63.9 -32% | 49.3 -2% |
* ... Meglio usare valori piccoli
Autonomia della batteria
L'autonomia è simile a quella che abbiamo registrato sulla SKU XPS 13 9300 Core i5 con 12-13 ore di utilizzo della WLAN nel mondo reale. I risultati sono migliori degli Ultrabooks concorrenti, compreso l'HP Spectre x360 13 che utilizza la stessa CPU Ice Lake ma con una batteria più grande da 60 Wh.
La ricarica completa richiede circa due ore. Questo stesso adattatore può essere utilizzato per ricaricare altri dispositivi USB Type-C tra cui smartphone, tablet e Nintendo Switch.
| Dell XPS 13 9300 Core i7-1065G7 i7-1065G7, Iris Plus Graphics G7 (Ice Lake 64 EU), 52 Wh | Dell XPS 13 7390 Core i7-10710U i7-10710U, UHD Graphics 620, 52 Wh | Dell XPS 13 7390 2-in-1 Core i7 i7-1065G7, Iris Plus Graphics G7 (Ice Lake 64 EU), 51 Wh | Huawei Matebook X Pro i5 i5-8250U, GeForce MX150, 57.4 Wh | Asus ZenBook S13 UX392FN i7-8565U, GeForce MX150, 50 Wh | Microsoft Surface Laptop 3 13 Core i5-1035G7 i5-1035G7, Iris Plus Graphics G7 (Ice Lake 64 EU), 45 Wh | Dell XPS 13 9300 i5 FHD i5-1035G1, UHD Graphics G1 (Ice Lake 32 EU), 52 Wh | |
|---|---|---|---|---|---|---|---|
| Autonomia della batteria | -34% | -29% | -27% | -34% | -35% | -8% | |
| WiFi v1.3 (h) | 12.7 | 8.4 -34% | 9 -29% | 9.3 -27% | 8.4 -34% | 8.3 -35% | 11.7 -8% |
| Reader / Idle (h) | 20.7 | 28.5 | 34.4 | ||||
| Load (h) | 2.2 | 1.7 | 1.9 | 3.4 |
Pro
Contro
Giudizio Complessivo
Il salto dalla SKU Core i5-1035G1 alla SKU Core i7-1065G7 porterà circa il 23% in più di prestazioni della CPU e il 70% in più di prestazioni della GPU senza alcun costo aggiuntivo di potenza. Quindi, la ragione principale per scegliere la SKU Core i7 rispetto alla SKU Core i5 sarebbe per il vantaggio grafico in applicazioni come il fotoritocco leggero o il gioco occasionale di Rocket League o LoL. Se però le vostre attività principali riguardano l'elaborazione di testi, la navigazione sul web o lo streaming video, allora la configurazione del Core i5 sarà più che sufficiente. Infatti, si può anche considerare un vecchio Whiskey Lake-U Core i5-8265U o Core i7-8565U in quant il Core i5-1035G1 ha prestazioni molto simili a queste CPU di ultima generazione.
Le prestazioni della CPU iniziano a diminuire quando si eseguono carichi estremi per periodi prolungati. Questo probabilmente non interesserà il pubblico dei subnotebook, in quanto gli utenti dovrebbero prendere in considerazione computer portatili più potenti come XPS 15 o Asus ZenBook Pro.
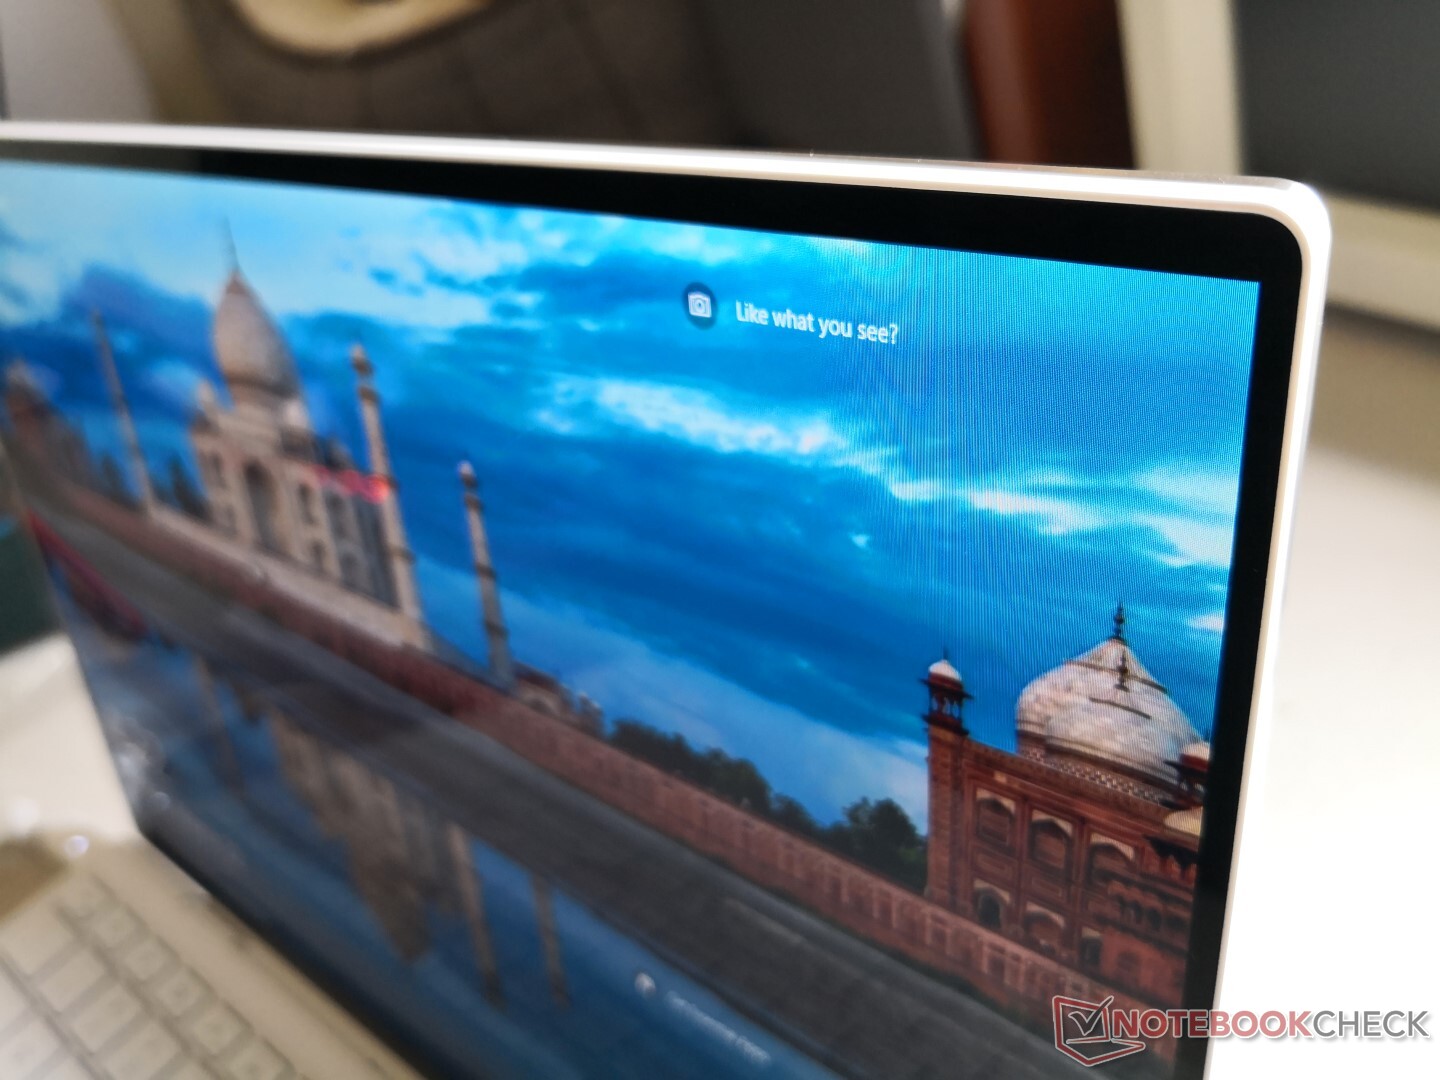
L'aspetto più allettante dell'XPS 13 9300 è il suo display 16:10 più grande, che avrà vantaggi più evidenti per l'utente rispetto agli aggiornamenti relativamente minori delle prestazioni. Questa è probabilmente una delle mosse più intelligenti di Dell se volevano attirare più utenti di MacBook Air o MacBook Pro 13 che hanno goduto di display 16:10 per anni. Troviamo che il rapporto d'aspetto sia un buon compromesso tra i tradizionali portatili 16:9 e i portatili da ufficio 3:2 come Huawei MateBook X Pro o la serie Microsoft Surface.
L'XPS 13 sta diventando ogni anno un'alternativa migliore al MacBook. La sua ultima riprogettazione aggiunge un display 16:10 più grande e un clickpad più grande senza sacrificare le caratteristiche principali del modello dell'anno scorso.
Dell XPS 13 9300 Core i7-1065G7
- 03/25/2020 v7 (old)
Allen Ngo
