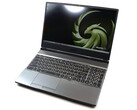
Recensione del Laptop MSI Prestige 15 A10SC: una delle migliori alternative al Dell XPS 15

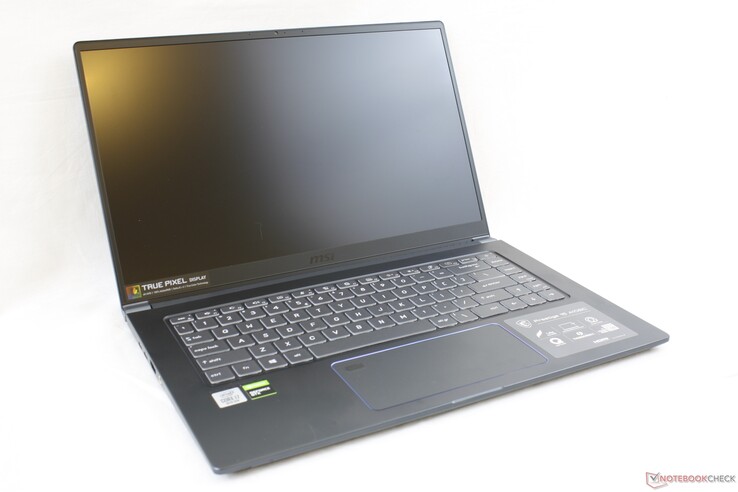
Cosa succederebbe se il Dell XPS 15 fosse dotato di una CPU Intel serie U invece che con una Intel serie H? L'MSI Prestige 15 può essere descritto al meglio come un'alternativa XPS 15 più leggera ed efficiente dal punto di vista energetico, che offre opzioni grafiche più veloci rispetto alla maggior parte degli altri Ultrabooks grazie alla GPU GeForce GTX 1650 Max-Q. A differenza della serie di workstation professionali MSI W o della più nota serie di gioco MSI G Series, la serie MSI Prestige di fascia alta si rivolge agli utenti tradizionali dell'ufficio che desiderano una maggiore potenza grafica in un fattore di forma più leggero.
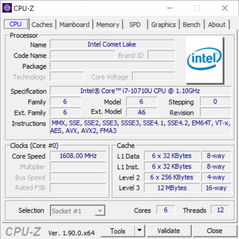
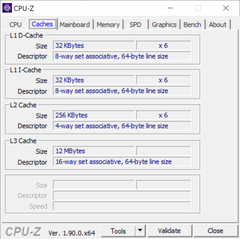
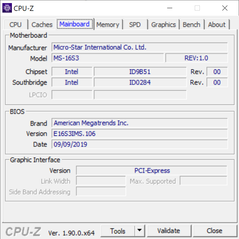
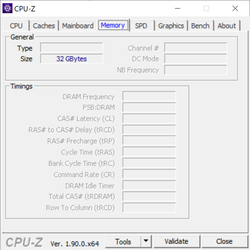
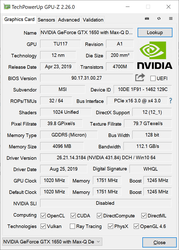
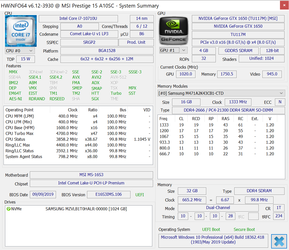
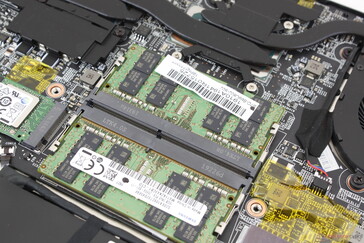
Il sistema Prestige 15 che abbiamo oggi è la SKU di fascia alta equipaggiata con la nuovissima CPU Intel hexa-core Comet Lake-U Core i7-10710U, l'insolita GPU GeForce GTX 1650 Max-Q, display 4K UHD IPS, 32 GB di RAM DDR4 e un SSD da 1 TB per un prezzo al dettaglio di $1800 USD. Una SKU inferiore con metà dello spazio di archiviazione, metà della RAM e un display FHD può essere trovata anche a $1400. Si noti che il più piccolo Prestige 14 pollici viene fornito con le stesse opzioni di CPU e GPU del Prestige 15 nonostante le loro differenze di dimensioni.
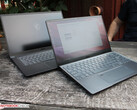
I concorrenti diretti del Prestige 15 includono la maggior parte dei computer portatili multimediali di fascia alta da 15 pollici come l'Asus ZenBook 15 UX534, il Dell XPS 15, il Lenovo IdeaPad S740, l'Apple MacBook Pro 15, e le serie Microsoft Surface Book o Surface Laptop.
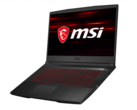
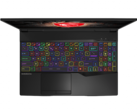
Altre recensioni MSI:
I nostri Top 10
» Top 10 Portatili Multimedia
» Top 10 Portatili Gaming
» Top 10 Portatili Gaming Leggeri
» Top 10 Portatili da Ufficio e Business economici
» Top 10 Portatili Premium da Ufficio/Business
» Top 10 Portatili sotto i 300 Euro
» Top 10 Portatili sotto i 500 Euro
» Top 10 dei Portatili Workstation
» Top 10 Subnotebooks
» Top 10 Ultrabooks
» Top 10 Convertibili
» Top 10 Tablets
» Top 10 Tablets Windows
» Top 10 Smartphones
Punteggio | Data | Modello | Peso | Altezza | Dimensione | Risoluzione | Prezzo |
|---|---|---|---|---|---|---|---|
| 85.2 % v7 (old) | 11/2019 | MSI Prestige 15 A10SC i7-10710U, GeForce GTX 1650 Max-Q | 1.7 kg | 16 mm | 15.60" | 3840x2160 | |
| 82.9 % v7 (old) | 11/2019 | Microsoft Surface Laptop 3 15 Ryzen 5 3580U R5 3580U, Vega 9 | 1.5 kg | 14.7 mm | 15.00" | 2496x1664 | |
| 86.6 % v7 (old) | 07/2019 | Lenovo ThinkPad T590-20N4002VGE i7-8565U, GeForce MX250 | 1.9 kg | 19.95 mm | 15.60" | 1920x1080 | |
| 83.1 % v7 (old) | 10/2019 | Asus ZenBook 15 UX534FT-DB77 i7-8565U, GeForce GTX 1650 Max-Q | 1.7 kg | 18.9 mm | 15.60" | 1920x1080 | |
| 86.3 % v7 (old) | 10/2019 | Dell XPS 15 7590 i5 iGPU FHD i5-9300H, UHD Graphics 630 | 1.9 kg | 17 mm | 15.60" | 1920x1080 |
Case
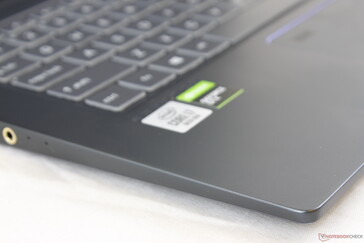
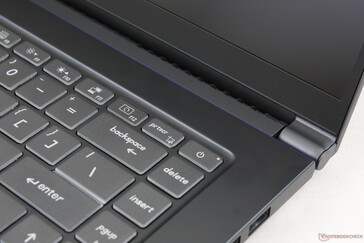
A differenza dell'MSI P65 Creator che è essenzialmente un MSI GS65 con una mano di vernice bianca, il Prestige 15 ha un design originale del telaio che si rivolge maggiormente agli utenti dell'ufficio e ai professionisti. Sostituisce le caratteristiche sgargianti e da gamer-y del GS65 per un look più semplice e piacevole, completo di superfici in alluminio opaco liscio e bordi e angoli cromati.
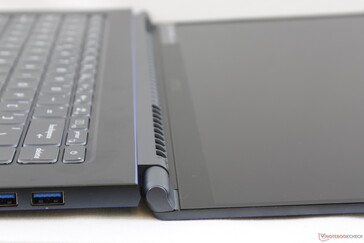
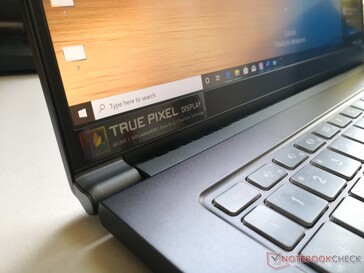
Mentre le immagini eleganti e attraenti sono probabilmente alla pari con HP Spectre x360 15, Asus ZenBook 15, o Dell XPS 15, la rigidità del telaio è un po' inferiore. Le superfici sono più sottili e non così rigide come su una qualsiasi delle alternative citate. Il tentativo di torcere la base o la cover dai loro bordi, ad esempio, si traduce in una deformazione più evidente. Le piccole cerniere ci preoccupano un po' anche per la loro durata rispetto alle cerniere più rigide soluzioni HP o Dell.
Il sistema MSI è da 100 g a 200 g più leggero della maggior parte degli altri portatili multimediali da 15 pollici, compresi i popolari XPS 15, MacBook Pro 15, ZenBook 15 e HP Spectre x360 15. L'inconveniente più evidente del peso più leggero è il telaio più flessibile menzionato in precedenza; il Prestige 15 è più incline alla deformazione e alla flessione rispetto alla concorrenza.
Connessioni
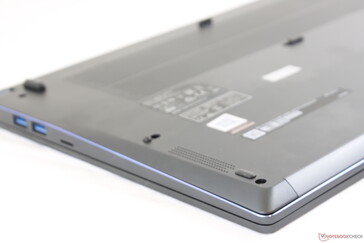
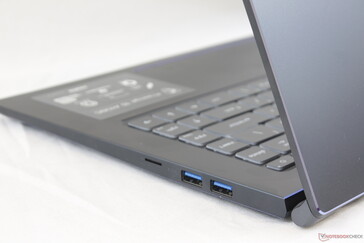
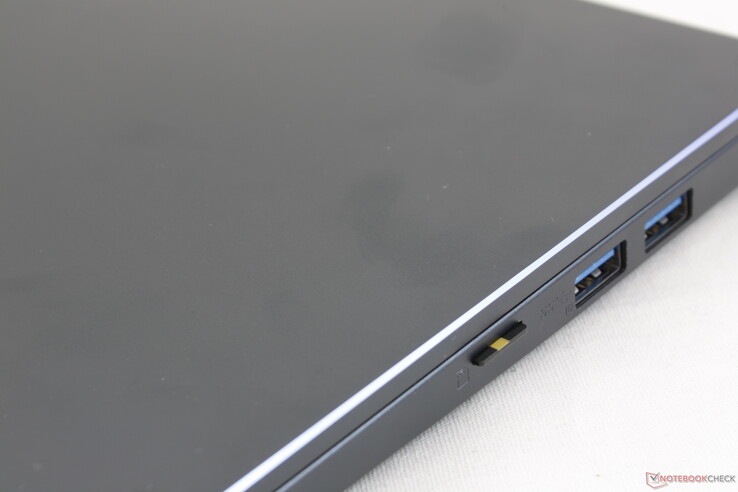
Tutte le porte del Prestige 14 si trovano qui sul Prestige 15 ma con l'aggiunta di una porta HDMI. E' un po' deludente non trovare nessun Kensington lock mentre il posizionamento delle porte avrebbe potuto essere migliore in quanto non ci sono porte USB di tipo A lungo il bordo sinistro.
Lettore schede SD
| SD Card Reader | |
| average JPG Copy Test (av. of 3 runs) | |
| Dell Latitude 5500 (Toshiba Exceria Pro M501 64 GB UHS-II) | |
| Dell Precision 5530 Xeon E-2176M (Toshiba Exceria Pro SDXC 64 GB UHS-II) | |
| MSI Prestige 15 A10SC (Toshiba Exceria Pro M501 UHS-II) | |
| Lenovo ThinkPad T590-20N4002VGE (Toshiba Exceria Pro M501 UHS-II) | |
| maximum AS SSD Seq Read Test (1GB) | |
| Dell Latitude 5500 (Toshiba Exceria Pro M501 64 GB UHS-II) | |
| MSI Prestige 15 A10SC (Toshiba Exceria Pro M501 UHS-II) | |
| Dell Precision 5530 Xeon E-2176M (Toshiba Exceria Pro SDXC 64 GB UHS-II) | |
| Lenovo ThinkPad T590-20N4002VGE (Toshiba Exceria Pro M501 UHS-II) | |
Comunicazioni
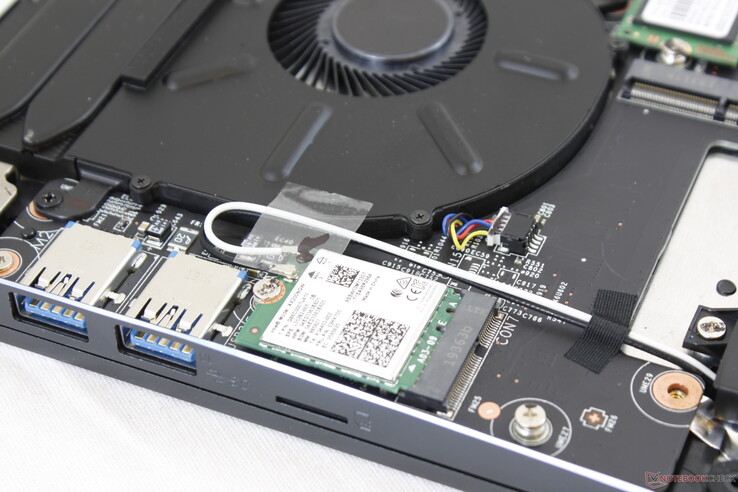
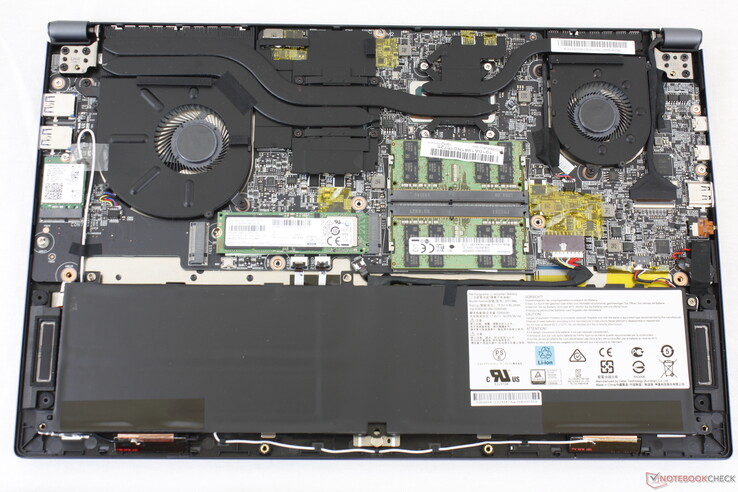
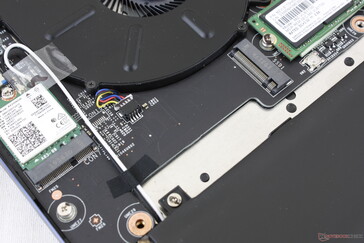
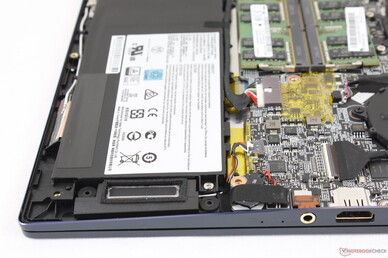
Manutenzione
Accessori e Garanzia
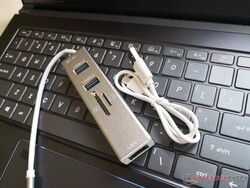
Gli extra inclusi sono una custodia in ecopelle e un dock USB Type-C con 2 porte USB Type-A, lettore SD full-size, lettore MicroSD, porta RJ-45 e porta di alimentazione Micro-USB. E' sicuramente bello vedere questi accessori nella confezione al dettaglio, dato che la maggior parte degli altri OEM non include mai qualcosa al di fuori del solito alimentatore.
Si applica la garanzia limitata standard di un anno.
Dispositivi di Input
Tastiera
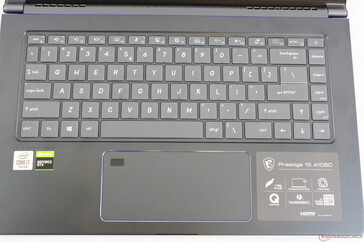
Le dimensioni dei tasti e il layout sono simili a quelli del GS65 con alcune differenze estetiche. Il carattere dei tasti Prestige 15 è leggermente diverso, mentre il pulsante di accensione è ora all'angolo non diversamente da alcuni portatili Asus VivoBook. Anche se apprezziamo il fatto che la tastiera sembra spaziosa da usare, il feedback dei tasti è più leggero di quanto vorremmo. I tasti dell'XPS 15 o dello Spectre x360 15 sono più nitidi e soddisfacenti che sull'MSI. Gli utenti abituati ai tasti generalmente poco profondi e leggeri della maggior parte degli Ultrabooks dovrebbero sentirsi a proprio agio con la tastiera del Prestige 15.
Touchpad
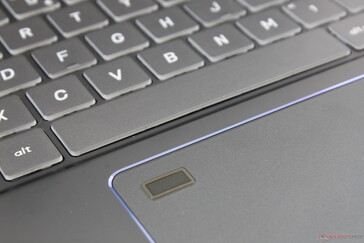
Il clickpad (14 x 6,5 cm) è lo stesso che appare sul GS65 9SG. La sua ampia superficie lo rende più comodo per gli input multi-touch rispetto alla maggior parte degli altri computer portatili. Perché è così ampia, tuttavia, aspettatevi qualche input accidentali ogni tanto. I tasti del mouse integrati sono morbidi come feedback, poco profondi e relativamente silenziosi. I tasti mouse dedicati avrebbero fornito sia una migliore precisione che un migliore feedback.
Display
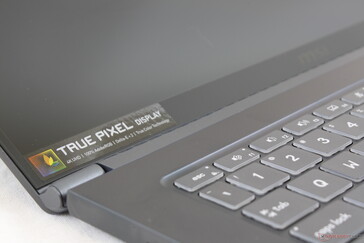
MSI offre opzioni FHD e 4K UHD per il Prestige 15. La nostra specifica unità di test è dotata di un pannello 4K UHD Sharp LQ156D1JW42 IPS che non si trova su nessun altro computer portatile del nostro database. Il più generale Sharp LQ156D1, tuttavia, può essere trovato sul Lenovo ThinkPad P50 e Dell XPS 15 9570 che presentano un rapporto di contrasto e caratteristiche di spazio colore simili a quelli della nostra unità MSI.
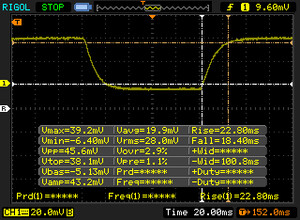
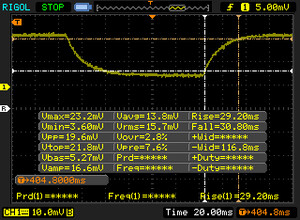
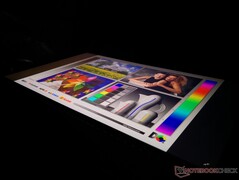
La qualità del display è eccellente con colori che brillano e solo un livello minore di granulosità nonostante la sovrapposizione opaca. La sua retroilluminazione, in particolare, è alla pari con la retroilluminazione dell'XPS 15, che è più luminosa rispetto alla maggior parte degli altri Ultrabooks. Lo svantaggio maggiore del display è la lentezza dei tempi di risposta in bianco e nero e grigio-grigio per una maggiore evidenza dei fantasmi.
| |||||||||||||||||||||||||
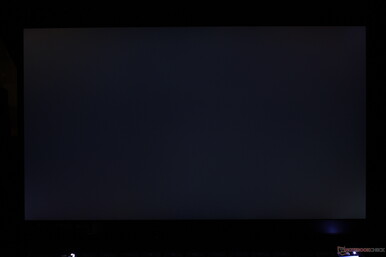
Distribuzione della luminosità: 92 %
Al centro con la batteria: 464.5 cd/m²
Contrasto: 929:1 (Nero: 0.5 cd/m²)
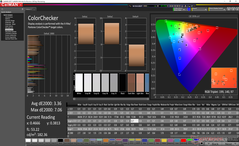
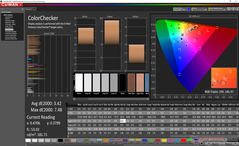
ΔE ColorChecker Calman: 3.36 | ∀{0.5-29.43 Ø4.76}
calibrated: 3.42
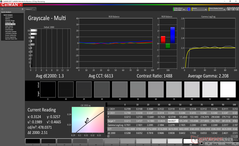
ΔE Greyscale Calman: 1.3 | ∀{0.09-98 Ø5}
98.3% sRGB (Argyll 1.6.3 3D)
84.8% AdobeRGB 1998 (Argyll 1.6.3 3D)
96.2% AdobeRGB 1998 (Argyll 3D)
98.3% sRGB (Argyll 3D)
82% Display P3 (Argyll 3D)
Gamma: 2.14
CCT: 6596 K
| MSI Prestige 15 A10SC Sharp LQ156D1JW42, IPS, 15.6", 3840x2160 | Microsoft Surface Laptop 3 15 Ryzen 5 3580U Sharp LQ150P1JX51, IPS, 15", 2496x1664 | MSI P65 Creator 9SF-657 AU Optronics AUO41EB, IPS, 15.6", 3840x2160 | Dell Precision 5530 Xeon E-2176M Sharp SHP148D / LQ156D1, IGZO, 15.6", 3840x2160 | Dell Latitude 5500 LGD05FF 156WFD, IPS, 15.6", 1920x1080 | Lenovo ThinkPad T590-20N4002VGE LP156WFC-SPD1, aSi IPS LED, 15.6", 1920x1080 | |
|---|---|---|---|---|---|---|
| Display | -17% | 2% | -9% | -52% | -51% | |
| Display P3 Coverage (%) | 82 | 66.9 -18% | 84.4 3% | 76.5 -7% | 38.07 -54% | 38.79 -53% |
| sRGB Coverage (%) | 98.3 | 99.3 1% | 100 2% | 98.4 0% | 57.3 -42% | 58.3 -41% |
| AdobeRGB 1998 Coverage (%) | 96.2 | 63.7 -34% | 98.5 2% | 76.4 -21% | 39.33 -59% | 40.11 -58% |
| Response Times | 16% | 20% | 19% | 34% | 36% | |
| Response Time Grey 50% / Grey 80% * (ms) | 60 ? | 47.2 ? 21% | 51 ? 15% | 48 ? 20% | 37.6 ? 37% | 37.2 ? 38% |
| Response Time Black / White * (ms) | 41.2 ? | 36.8 ? 11% | 31 ? 25% | 33.6 ? 18% | 28.4 ? 31% | 27.2 ? 34% |
| PWM Frequency (Hz) | 26040 ? | 21370 ? | 1000 | |||
| Screen | 4% | -31% | -16% | -39% | -43% | |
| Brightness middle (cd/m²) | 464.5 | 416.9 -10% | 445 -4% | 451.7 -3% | 234 -50% | 276 -41% |
| Brightness (cd/m²) | 451 | 389 -14% | 462 2% | 440 -2% | 229 -49% | 262 -42% |
| Brightness Distribution (%) | 92 | 86 -7% | 83 -10% | 90 -2% | 93 1% | 88 -4% |
| Black Level * (cd/m²) | 0.5 | 0.4 20% | 0.5 -0% | 0.4 20% | 0.23 54% | 0.23 54% |
| Contrast (:1) | 929 | 1042 12% | 890 -4% | 1129 22% | 1017 9% | 1200 29% |
| Colorchecker dE 2000 * | 3.36 | 2.75 18% | 4.75 -41% | 3.11 7% | 5.2 -55% | 5.6 -67% |
| Colorchecker dE 2000 max. * | 7.06 | 6.64 6% | 7.79 -10% | 8.62 -22% | 14.7 -108% | 16.4 -132% |
| Colorchecker dE 2000 calibrated * | 3.42 | 0.71 79% | 3.07 10% | 4.6 -35% | 4.7 -37% | |
| Greyscale dE 2000 * | 1.3 | 1.8 -38% | 4.49 -245% | 3.7 -185% | 2.5 -92% | 3 -131% |
| Gamma | 2.14 103% | 2.09 105% | 2.49 88% | 2.11 104% | 2.44 90% | 2.18 101% |
| CCT | 6596 99% | 6646 98% | 7374 88% | 6492 100% | 6649 98% | 7075 92% |
| Color Space (Percent of AdobeRGB 1998) (%) | 84.8 | 63.4 -25% | 87 3% | 69 -19% | 36.2 -57% | 36.9 -56% |
| Color Space (Percent of sRGB) (%) | 98.3 | 99.4 1% | 100 2% | 98 0% | 57 -42% | 58.1 -41% |
| Media totale (Programma / Settaggio) | 1% /
1% | -3% /
-17% | -2% /
-10% | -19% /
-32% | -19% /
-34% |
* ... Meglio usare valori piccoli
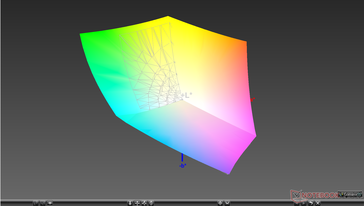
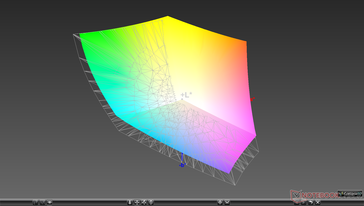
Lo spazio colore è quasi identico a quello del P65 Creator e più ampio rispetto alla maggior parte dei computer portatili inferiori a 4K, compreso il Microsoft Surface Laptop 3 15. MSI rivendica la piena copertura AdobeRGB cosa che possiamo confermare con le nostre misure indipendenti.
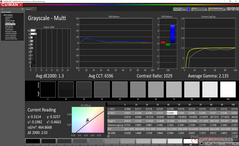
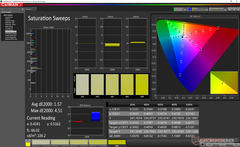
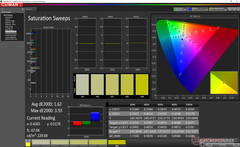
MSI dichiara un valore DeltaE inferiore a 2 - un'affermazione audace quando la maggior parte dei display dei laptop fa fatica ad essere precisi. Fortunatamente, le nostre misure possono confermare i valori di scala di grigi e deltaE di saturazione deltaE di soli 1.3 e 1.57, rispettivamente. La calibrazione dell'utente finale non sarà necessaria anche se i colori potrebbero essere leggermente più precisi quando i livelli di saturazione sono più bassi.
Tempi di risposta del Display
| ↔ Tempi di risposta dal Nero al Bianco | ||
|---|---|---|
| 41.2 ms ... aumenta ↗ e diminuisce ↘ combinato | ↗ 22.8 ms Incremento | |
| ↘ 18.4 ms Calo | ||
| Lo schermo mostra tempi di risposta lenti nei nostri tests e sarà insoddisfacente per i gamers. In confronto, tutti i dispositivi di test variano da 0.1 (minimo) a 240 (massimo) ms. » 98 % di tutti i dispositivi è migliore. Questo significa che i tempi di risposta rilevati sono peggiori rispetto alla media di tutti i dispositivi testati (20.1 ms). | ||
| ↔ Tempo di risposta dal 50% Grigio all'80% Grigio | ||
| 60 ms ... aumenta ↗ e diminuisce ↘ combinato | ↗ 29.2 ms Incremento | |
| ↘ 30.8 ms Calo | ||
| Lo schermo mostra tempi di risposta lenti nei nostri tests e sarà insoddisfacente per i gamers. In confronto, tutti i dispositivi di test variano da 0.165 (minimo) a 636 (massimo) ms. » 96 % di tutti i dispositivi è migliore. Questo significa che i tempi di risposta rilevati sono peggiori rispetto alla media di tutti i dispositivi testati (31.5 ms). | ||
Sfarfallio dello schermo / PWM (Pulse-Width Modulation)
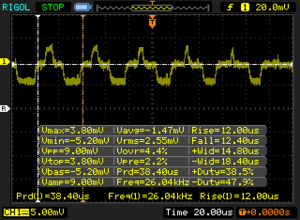
| flickering dello schermo / PWM rilevato | 26040 Hz | ≤ 24 % settaggio luminosita' | |
Il display sfarfalla a 26040 Hz (Probabilmente a causa dell'uso di PWM) Flickering rilevato ad una luminosita' di 24 % o inferiore. Non dovrebbe verificarsi flickering o PWM sopra questo valore di luminosita'. La frequenza di 26040 Hz è abbastanza alta, quindi la maggioranza degli utenti sensibili al PWM non dovrebbero notare alcun flickering. In confronto: 53 % di tutti i dispositivi testati non utilizza PWM per ridurre la luminosita' del display. Se è rilevato PWM, una media di 8039 (minimo: 5 - massimo: 343500) Hz è stata rilevata. | |||
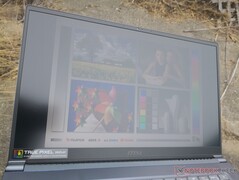
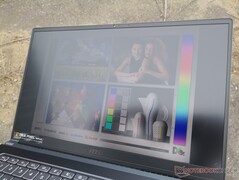
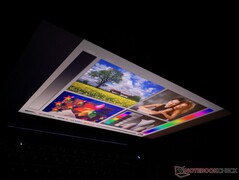
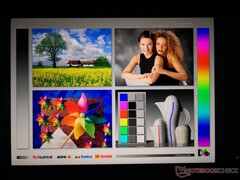
La visibilità all'aperto è buona come sul P65 Creator, poiché la luminosità è quasi la stessa. Il display è molto più luminoso di quello del ThinkPad T590 e degli Ultrabooks più economici. Gli angoli di visualizzazione sono ampi come ci si aspetterebbe da un pannello IPS.
Prestazioni
Pur essendo relativamente sottile e con una CPU della serie Intel U, il Prestige 15 si rivolge agli utenti che vogliono alte prestazioni con la CPU hexa-core Core i7-10710U e la grafica discreta GeForce GTX 1650 Max-Q per sostituire rispettivamente l'ultima generazione di core quad-core Core i7-8565U and GeForce GTX 1050. Al momento non ci sono opzioni per Core i3/i5 o GPU integrate.
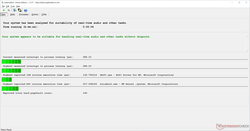
Nvidia Optimus viene fornito di serie per il passaggio automatico alla UHD Graphics 620. LatencyMon non mostra problemi di latenza DPC anche quando il wireless è abilitato a differenza dell'XPS 15.
Processore
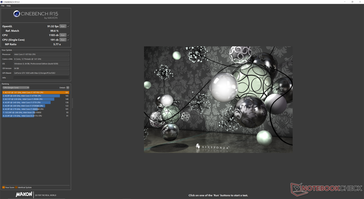
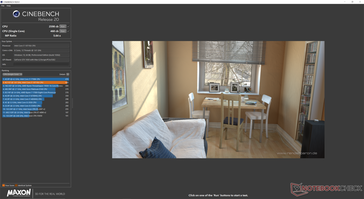
I risultati di CineBench sono impressionanti in quanto i punteggi multi-thread sono da collo a collo con entrambi i quad-core Core i7-8750H e Core i7-9750H. La sostenibilità delle prestazioni è eccellente, come dimostrato dal nostro test CineBench R15 Multi-Thread loop di seguito, specialmente se confrontato con quello che abbiamo osservato sul Dell XPS 13 7390 con la stessa CPU hexa-core. Gli utenti possono aspettarsi prestazioni più veloci del 30-35% rispetto al Core i7-1065G7, Core i5-8300H e Core i5-9300H o circa il 60% più veloci rispetto al Core i7-8565U.
Tuttavia, gli eccellenti punteggi di CineBench possono essere fuorvianti. Il nostro Prime95 Stress Test mostrerà che i valori di clock possono rimbalzare e rallentare molto quando la CPU è soggetta a un utilizzo ininterrotto al 100%.
Vedere la nostra pagina dedicata al Core i7-10710U per maggiori informazioni tecniche e confronti con i benchmarks.
| wPrime 2.10 - 1024m | |
| Dell XPS 13 7390 2-in-1 Core i7 | |
| Media Intel Core i7-10710U (171.1 - 177.4, n=2) | |
| MSI GE75 9SG | |
* ... Meglio usare valori piccoli
Prestazioni di sistema
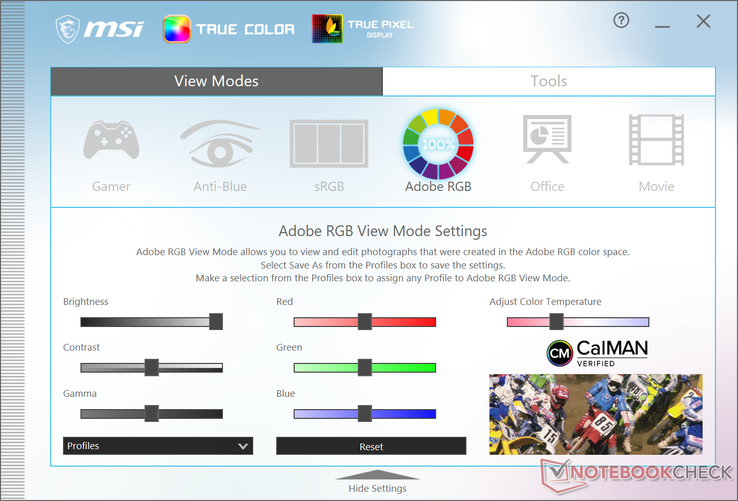
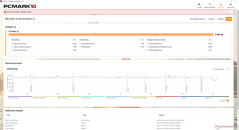
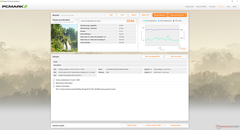
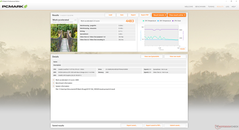
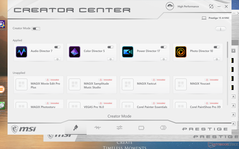
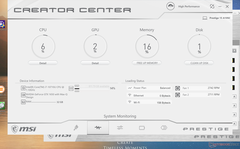
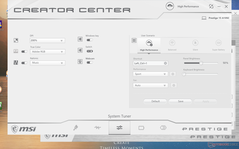
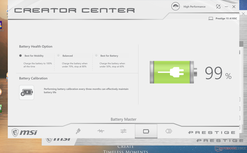
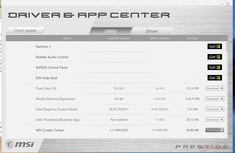
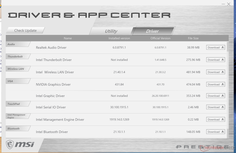
I risultati di PCMark sono eccellenti e superiori a quelli del tipico computer portatile aziendale ULV quad-core, incluso il Lenovo ThinkPad T590 o l'ultimo Surface Laptop 3 15 di Microsoft. Non abbiamo avuto problemi di software o hardware durante il tempo trascorso con l'unità di test. Tuttavia, si consiglia ai di familiarizzare con le applicazioni MSI precaricate come Creator Center, True Color e Driver and App Center, dove si possono trovare tutte le caratteristiche principali e le impostazioni uniche del Prestige 15.
| PCMark 8 Home Score Accelerated v2 | 3546 punti | |
| PCMark 8 Work Score Accelerated v2 | 4483 punti | |
| PCMark 10 Score | 5009 punti | |
Aiuto | ||
Dispositivi di archiviazione
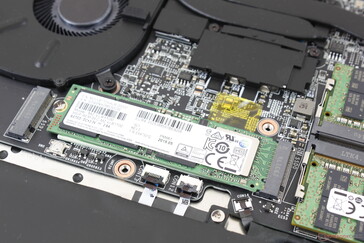
Sono disponibili due slot interni M.2 2280. Mentre la nostra particolare unità viene fornita con un 1 TB Samsung SSD PM981, è probabile che i rivenditori includeranno SSD di altri produttori. La velocità di lettura e scrittura sequenziale si aggira intorno ai 1300 MB/s eac secondo AS SSD risultando più lenta dei Toshiba XG6 da 512 GB.
Guardate la nostra tabella delle unità SSDs e HDD per ulteriori confronti tra i benchmarks.
| MSI Prestige 15 A10SC Samsung SSD PM981 MZVLB1T0HALR | Microsoft Surface Laptop 3 15 Ryzen 5 3580U SK hynix BC501 HFM256GDGTNG | Lenovo ThinkPad T590-20N4002VGE Toshiba XG6 KXG60ZNV512G | Dell Latitude 5500 Toshiba XG6 KXG60ZNV1T02 | HP EliteBook 755 G5 3UN79EA Toshiba XG5 KXG50ZNV512G | Dell Precision 5530 Xeon E-2176M SK hynix PC400 512 GB | MSI P65 Creator 9SF-657 2x Samsung SSD PM981 MZVLB512HAJQ (RAID 0) | |
|---|---|---|---|---|---|---|---|
| AS SSD | -52% | 13% | 2% | -149% | -18% | 20% | |
| Seq Read (MB/s) | 1274 | 1122 -12% | 2551 100% | 1287 1% | 1810 42% | 2169 70% | 2860 124% |
| Seq Write (MB/s) | 1395 | 514 -63% | 2376 70% | 1280 -8% | 261.4 -81% | 1022 -27% | 2604 87% |
| 4K Read (MB/s) | 50.3 | 34.98 -30% | 52.7 5% | 49.57 -1% | 24.38 -52% | 38.43 -24% | 45.15 -10% |
| 4K Write (MB/s) | 119.8 | 96.8 -19% | 153 28% | 158 32% | 5.77 -95% | 92.8 -23% | 100.2 -16% |
| 4K-64 Read (MB/s) | 1599 | 492 -69% | 1406 -12% | 1043 -35% | 528 -67% | 970 -39% | 1428 -11% |
| 4K-64 Write (MB/s) | 1455 | 339.9 -77% | 1439 -1% | 1415 -3% | 90.7 -94% | 926 -36% | 1401 -4% |
| Access Time Read * (ms) | 0.044 | 0.056 -27% | 0.067 -52% | 0.039 11% | 0.2 -355% | 0.073 -66% | 0.049 -11% |
| Access Time Write * (ms) | 0.092 | 0.11 -20% | 0.027 71% | 0.027 71% | 0.748 -713% | 0.053 42% | 0.037 60% |
| Score Read (Points) | 1777 | 639 -64% | 1714 -4% | 1221 -31% | 733 -59% | 1226 -31% | 1759 -1% |
| Score Write (Points) | 1714 | 488 -72% | 1829 7% | 1701 -1% | 123 -93% | 1121 -35% | 1762 3% |
| Score Total (Points) | 4411 | 1434 -67% | 4418 0% | 3558 -19% | 1157 -74% | 2922 -34% | 4411 0% |
| Copy ISO MB/s (MB/s) | 2830 | 828 -71% | 2625 -7% | ||||
| Copy Program MB/s (MB/s) | 609 | 200.5 -67% | 495.9 -19% | ||||
| Copy Game MB/s (MB/s) | 1424 | 387.4 -73% | 1384 -3% |
* ... Meglio usare valori piccoli
Prestazioni GPU
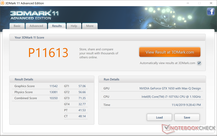
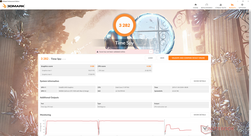
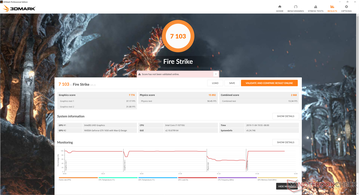
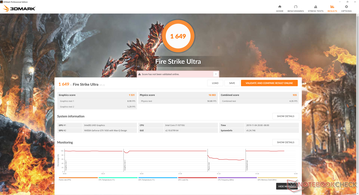
Anche se la GeForce 1650 Max-Q è una GPU non comune, ci piacerebbe vederla su più computer portatili. I benchmarks di 3DMark la collocano appena il 15% dietro alla "vera" desktop GTX 1650 o circa il 15 - 50% più veloce della GeForce GTX 1050 Ti. Nvidia Turing è ottimizzato per i titoli DX12, il che significa che quando si eseguono i giochi DX12 più recenti, si vedrà un aumento delle prestazioni rispetto alla vecchia GTX 1050 Ti. Si noti che questa è la stessa GPU che viene fornita con il recente Razer Blade Stealth.
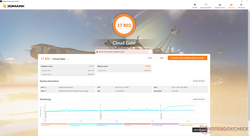
I punteggi di Cloud Gate sono bassi, probabilmente a causa della CPU ULV. La maggior parte degli altri computer portatili con grafica GeForce GTX o Max-Q tendono ad essere forniti con CPU di classe H Intel.
| 3DMark | |
| 1280x720 Cloud Gate Standard Graphics | |
| Lenovo Legion Y740-17IRH | |
| Razer Blade 15 GTX 1660 Ti | |
| Asus FX503VM-EH73 | |
| MSI GT72S-6QEG16SR421BW | |
| Acer Nitro 5 AN515-54-78TL | |
| Gainward GeForce GTX 1650 4 GB | |
| HP Pavilion Gaming 15-cx0003ng | |
| Media NVIDIA GeForce GTX 1650 Max-Q (21759 - 53981, n=12) | |
| Lenovo Yoga 730-15IKB | |
| MSI Prestige 15 A10SC | |
| 1920x1080 Fire Strike Graphics | |
| Lenovo Legion Y740-17IRH | |
| Razer Blade 15 GTX 1660 Ti | |
| Asus FX503VM-EH73 | |
| MSI GT72S-6QEG16SR421BW | |
| Acer Nitro 5 AN515-54-78TL | |
| Gainward GeForce GTX 1650 4 GB | |
| Media NVIDIA GeForce GTX 1650 Max-Q (6985 - 8618, n=12) | |
| MSI Prestige 15 A10SC | |
| HP Pavilion Gaming 15-cx0003ng | |
| Lenovo Yoga 730-15IKB | |
| 2560x1440 Time Spy Graphics | |
| Lenovo Legion Y740-17IRH | |
| Razer Blade 15 GTX 1660 Ti | |
| Asus FX503VM-EH73 | |
| Gainward GeForce GTX 1650 4 GB | |
| Acer Nitro 5 AN515-54-78TL | |
| MSI Prestige 15 A10SC | |
| Media NVIDIA GeForce GTX 1650 Max-Q (2836 - 3238, n=10) | |
| MSI GT72S-6QEG16SR421BW | |
| HP Pavilion Gaming 15-cx0003ng | |
| Lenovo Yoga 730-15IKB | |
| 3DMark 11 | |
| 1280x720 Performance GPU | |
| Lenovo Legion Y740-17IRH | |
| Razer Blade 15 GTX 1660 Ti | |
| Asus FX503VM-EH73 | |
| Gainward GeForce GTX 1650 4 GB | |
| MSI GT72S-6QEG16SR421BW | |
| MSI Prestige 15 A10SC | |
| Media NVIDIA GeForce GTX 1650 Max-Q (10248 - 12259, n=14) | |
| HP Pavilion Gaming 15-cx0003ng | |
| Lenovo Yoga 730-15IKB | |
| 1280x720 Performance Combined | |
| Lenovo Legion Y740-17IRH | |
| Gainward GeForce GTX 1650 4 GB | |
| Razer Blade 15 GTX 1660 Ti | |
| MSI Prestige 15 A10SC | |
| MSI GT72S-6QEG16SR421BW | |
| Media NVIDIA GeForce GTX 1650 Max-Q (6409 - 10846, n=13) | |
| HP Pavilion Gaming 15-cx0003ng | |
| Asus FX503VM-EH73 | |
| Lenovo Yoga 730-15IKB | |
| 3DMark 11 Performance | 11613 punti | |
| 3DMark Cloud Gate Standard Score | 17802 punti | |
| 3DMark Fire Strike Score | 7103 punti | |
| 3DMark Time Spy Score | 3282 punti | |
Aiuto | ||
Prestazioni Gaming
I titoli più recenti possono essere eseguiti a 1080p e 30+ FPS nativi con la maggior parte delle impostazioni su High to Ultra - non male per un laptop con CPU ULV e GPU Max-Q. Raggiungere una stabilità di 60 FPS può essere ancora difficile al di fuori di titoli poco impegnativi come Rocket League, Overwatch, LoL o Fortnite.
Consulta la nostra pagina dedicata alla GeForce GTX 1650 Max-Q per ulteriori confronti con i benchmarks di gioco.
| Shadow of the Tomb Raider | |
| 1280x720 Lowest Preset | |
| MSI GE75 9SG | |
| Gainward GeForce GTX 1650 4 GB | |
| Razer Blade Pro 17 4K UHD 120 Hz | |
| Lenovo Legion Y740-17IRH | |
| Alienware m15 P79F | |
| Media NVIDIA GeForce GTX 1650 Max-Q (92 - 151, n=5) | |
| Razer Blade 15 GTX 1660 Ti | |
| MSI Prestige 15 A10SC | |
| Dell G3 3590 | |
| Asus GL753VD | |
| Asus TUF FX705GE-EW096T | |
| Dell Inspiron 15 5000 5585 | |
| Microsoft Surface Laptop 3 15 Ryzen 5 3580U | |
| Dell XPS 13 7390 2-in-1 Core i7 | |
| 1920x1080 Highest Preset AA:T | |
| MSI GE75 9SG | |
| Razer Blade Pro 17 4K UHD 120 Hz | |
| Alienware m15 P79F | |
| Lenovo Legion Y740-17IRH | |
| Razer Blade 15 GTX 1660 Ti | |
| Gainward GeForce GTX 1650 4 GB | |
| Media NVIDIA GeForce GTX 1650 Max-Q (33 - 45, n=6) | |
| MSI Prestige 15 A10SC | |
| Asus TUF FX705GE-EW096T | |
| Asus GL753VD | |
| basso | medio | alto | ultra | |
|---|---|---|---|---|
| BioShock Infinite (2013) | 296.3 | 215.1 | 188.4 | 77 |
| The Witcher 3 (2015) | 155.4 | 94.1 | 54.8 | 30.8 |
| Rocket League (2017) | 196 | 128.2 | 88 | |
| Shadow of the Tomb Raider (2018) | 113 | 51 | 42 | 35 |
Emissioni
Rumrosità di sistema
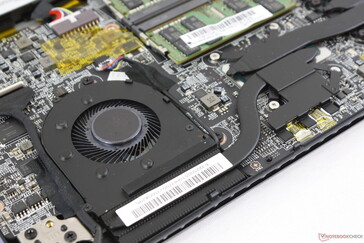
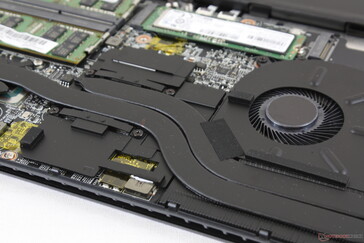
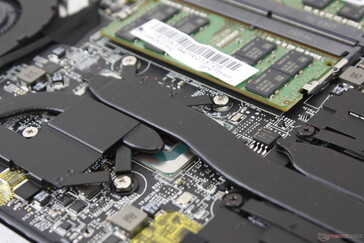
La soluzione di raffreddamento è costituita da due ventole asimmetrica (~40 mm + ~50 mm) e tre tubi di calore. Le ventole non sono mai veramente inattive anche se impostate in modalità Silenziosa, ma il rumore è appena percettibile quando nella maggior parte delle condizioni ambientali. Siamo in grado di registrare un rumore di soli 30.2 dB(A) contro uno sfondo di 29.3 dB(A) quando si è al minimo, sulla scrivania o navigando sul web.
Il rumore della ventola rimane sorprendentemente silenzioso quando si naviga più pesantemente o con carichi in streaming. L'esecuzione di 3DMark 06, ad esempio, si traduce in un rumore della ventola di soli 31,5 dB(A) rispetto ai 40,9 dB(A) del più potente MSI P65. Aspettatevi un livello di rumore costante di circa 37 dB(A) quando si gioca per essere più silenziosi della maggior parte dei computer portatili da gioco dedicati. Nel peggiore dei casi, siamo in grado di registrare un livello di rumore di 47 dB(A) quando si utilizzano contemporaneamente sia Prime95 che FurMark.
Non possiamo notare alcun rumore elettronico o coil whine dalla nostra unità di test.
| MSI Prestige 15 A10SC GeForce GTX 1650 Max-Q, i7-10710U, Samsung SSD PM981 MZVLB1T0HALR | Microsoft Surface Laptop 3 15 Ryzen 5 3580U Vega 9, R5 3580U, SK hynix BC501 HFM256GDGTNG | MSI P65 Creator 9SF-657 GeForce RTX 2070 Max-Q, i9-9880H, 2x Samsung SSD PM981 MZVLB512HAJQ (RAID 0) | Lenovo ThinkPad T590-20N4002VGE GeForce MX250, i7-8565U, Toshiba XG6 KXG60ZNV512G | Dell Latitude 5500 UHD Graphics 620, i7-8665U, Toshiba XG6 KXG60ZNV1T02 | HP EliteBook 755 G5 3UN79EA Vega 10, R7 2700U, Toshiba XG5 KXG50ZNV512G | Dell Precision 5530 Xeon E-2176M Quadro P2000, E-2176M, SK hynix PC400 512 GB | |
|---|---|---|---|---|---|---|---|
| Noise | 6% | -9% | 4% | 9% | 0% | -7% | |
| off /ambiente * (dB) | 29.3 | 28 4% | 30.2 -3% | 29.4 -0% | 28.8 2% | 30.5 -4% | 28.4 3% |
| Idle Minimum * (dB) | 30.1 | 28 7% | 32.8 -9% | 29.3 3% | 28.8 4% | 30.5 -1% | 28.4 6% |
| Idle Average * (dB) | 30.2 | 28 7% | 32.8 -9% | 29.3 3% | 28.8 5% | 30.5 -1% | 28.4 6% |
| Idle Maximum * (dB) | 30.2 | 28 7% | 33.6 -11% | 31.8 -5% | 28.8 5% | 30.5 -1% | 28.4 6% |
| Load Average * (dB) | 31.5 | 29.2 7% | 40.9 -30% | 33.5 -6% | 30.3 4% | 37.5 -19% | 46.5 -48% |
| Witcher 3 ultra * (dB) | 37 | 39 -5% | 33.5 9% | 46.5 -26% | |||
| Load Maximum * (dB) | 47 | 41.4 12% | 42.7 9% | 35.8 24% | 32.6 31% | 35 26% | 46.5 1% |
* ... Meglio usare valori piccoli
Rumorosità
| Idle |
| 30.1 / 30.2 / 30.2 dB(A) |
| Sotto carico |
| 31.5 / 47 dB(A) |
 | ||
30 dB silenzioso 40 dB(A) udibile 50 dB(A) rumoroso |
||
min: | ||
Temperature
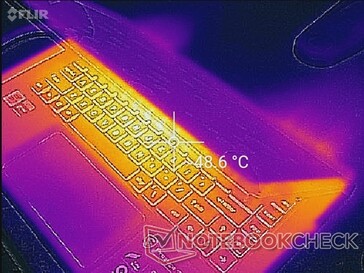
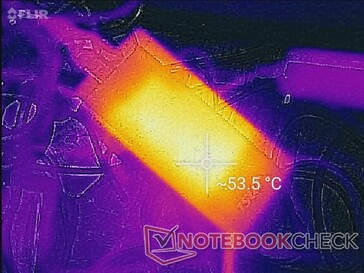
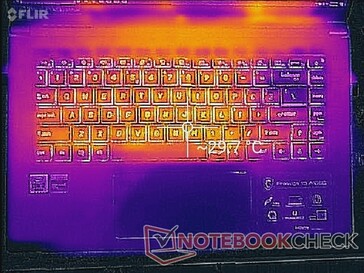
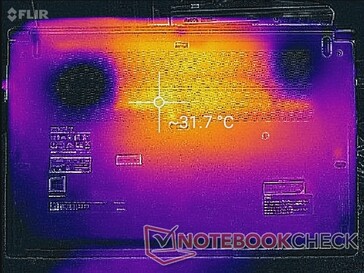
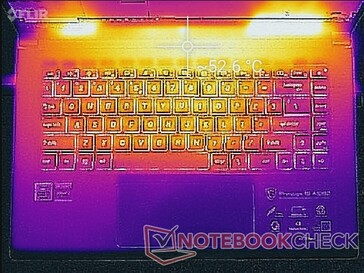
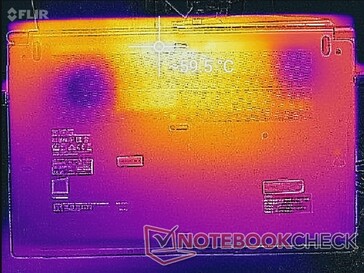
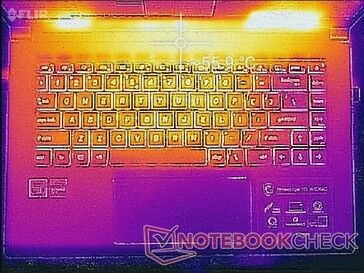
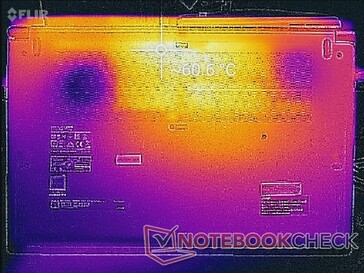
Le temperature di superficie raggiungono il picco di circa 31 °C verso il centro del laptop durante i carichi bassi o al minimo. Quando si gioca o si eseguono carichi elevati, le superfici possono riscaldarsi fino a 55°C - 60°C, come mostrato dalle nostre mappe di temperatura riportate di seguito. Questi punti caldi sono fortunatamente al di sopra della prima fila di tasti della tastiera, dove è improbabile che gli utenti tocchino.
(-) La temperatura massima sul lato superiore è di 56 °C / 133 F, rispetto alla media di 36.9 °C / 98 F, che varia da 21.1 a 71 °C per questa classe Multimedia.
(-) Il lato inferiore si riscalda fino ad un massimo di 60.6 °C / 141 F, rispetto alla media di 39.2 °C / 103 F
(+) In idle, la temperatura media del lato superiore è di 27.2 °C / 81 F, rispetto alla media deld ispositivo di 31.3 °C / 88 F.
(-) Riproducendo The Witcher 3, la temperatura media per il lato superiore e' di 39.4 °C / 103 F, rispetto alla media del dispositivo di 31.3 °C / 88 F.
(+) I poggiapolsi e il touchpad raggiungono la temperatura massima della pelle (34.6 °C / 94.3 F) e quindi non sono caldi.
(-) La temperatura media della zona del palmo della mano di dispositivi simili e'stata di 28.7 °C / 83.7 F (-5.9 °C / -10.6 F).
Stress Test
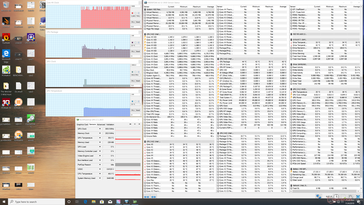
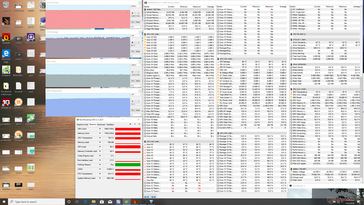
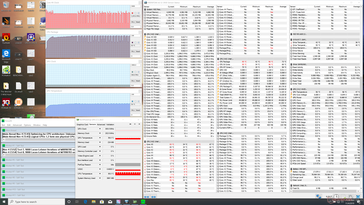
Stressiamo il laptop per identificare eventuali problemi di strozzamento o di stabilità. Quando si esegue Prime95, la velocità di clock della CPU sale fino a 3,6 GHz per i primi secondi fino a quando la temperatura interna raggiunge i 92 °C. Successivamente, la velocità di clock scende nella gamma da 3,0 a 3,2 GHz per mantenere una temperatura interna nella gamma da 90 °C a 95 °C. Dopo circa 4,5 minuti, tuttavia, la frequenza di clock e la temperatura oscilleranno tra 0,8 e 3,3 GHz e 67 °C e 95 °C, rispettivamente. Questo comportamento è strano perché non si verifica durante lo stress test CineBench di cui sopra, eppure si verifica qui su Prime95 anche dopo ripetute esecuzioni. Confermeremo presto le nostre osservazioni di throttling con una seconda unità Prestige 15.
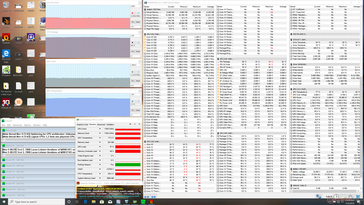
L'esecuzione di The Witcher 3 si traduce in temperature stabili della CPU e della GPU rispettivamente di 85 °C e 80 °C, il che è di più di quello che abbiamo rilevato sul più potente XPS 15 7590 quando si trovano in condizioni simili. La CPU e la GPU possono essere processori a bassa potenza, ma le loro temperature di funzionamento sono tutt'altro.
L'alimentazione a batteria limiterà le prestazioni. Un Fire Strike eseguito usando la batteria restituisce punteggi Physics e Graphics di 8865 e 7323 punti, rispettivamente, rispetto ai 15892 e 7774 punti quando si usa l'alimentazione da rete elettrica.
| CPU Clock (GHz) | GPU Clock (MHz) | Average CPU Temperature (°C) | Average GPU Temperature (°C) | |
| System Idle | -- | -- | 35 | 35 |
| Prime95 Stress | 0.8 - 3.3 | 67 - 95 | 56 | |
| Prime95 + FurMark Stress | 2.2 | 1185 | 85 | 77 |
| Witcher 3 Stress | 3.9 | 1680 | 85 | 80 |
Altoparlanti
La qualità audio è decente, con una riproduzione dei bassi di media qualità sufficiente per le chiamate in conferenza, ma carente per la riproduzione multimediale. Un volume più alto farà vibrare leggermente al tatto i poggiapolsi.
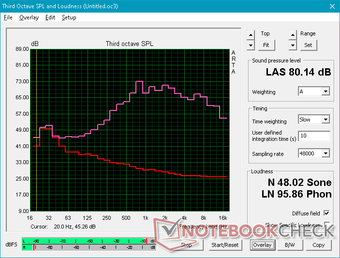
MSI Prestige 15 A10SC analisi audio
(±) | potenza degli altiparlanti media ma buona (80.1 dB)
Bassi 100 - 315 Hz
(±) | bassi ridotti - in media 12.8% inferiori alla media
(+) | bassi in lineaa (6.4% delta rispetto alla precedente frequenza)
Medi 400 - 2000 Hz
(+) | medi bilanciati - solo only 4.6% rispetto alla media
(±) | linearità dei medi adeguata (10% delta rispetto alla precedente frequenza)
Alti 2 - 16 kHz
(+) | Alti bilanciati - appena 2.4% dalla media
(+) | alti lineari (6.4% delta rispetto alla precedente frequenza)
Nel complesso 100 - 16.000 Hz
(±) | la linearità complessiva del suono è media (20.2% di differenza rispetto alla media
Rispetto alla stessa classe
» 66% di tutti i dispositivi testati in questa classe è stato migliore, 8% simile, 25% peggiore
» Il migliore ha avuto un delta di 5%, medio di 17%, peggiore di 45%
Rispetto a tutti i dispositivi testati
» 52% di tutti i dispositivi testati in questa classe è stato migliore, 8% similare, 40% peggiore
» Il migliore ha avuto un delta di 4%, medio di 24%, peggiore di 134%
Apple MacBook 12 (Early 2016) 1.1 GHz analisi audio
(+) | gli altoparlanti sono relativamente potenti (83.6 dB)
Bassi 100 - 315 Hz
(±) | bassi ridotti - in media 11.3% inferiori alla media
(±) | la linearità dei bassi è media (14.2% delta rispetto alla precedente frequenza)
Medi 400 - 2000 Hz
(+) | medi bilanciati - solo only 2.4% rispetto alla media
(+) | medi lineari (5.5% delta rispetto alla precedente frequenza)
Alti 2 - 16 kHz
(+) | Alti bilanciati - appena 2% dalla media
(+) | alti lineari (4.5% delta rispetto alla precedente frequenza)
Nel complesso 100 - 16.000 Hz
(+) | suono nel complesso lineare (10.2% differenza dalla media)
Rispetto alla stessa classe
» 7% di tutti i dispositivi testati in questa classe è stato migliore, 2% simile, 91% peggiore
» Il migliore ha avuto un delta di 5%, medio di 18%, peggiore di 53%
Rispetto a tutti i dispositivi testati
» 4% di tutti i dispositivi testati in questa classe è stato migliore, 1% similare, 94% peggiore
» Il migliore ha avuto un delta di 4%, medio di 24%, peggiore di 134%
Gestione energetica
Consumo Energetico
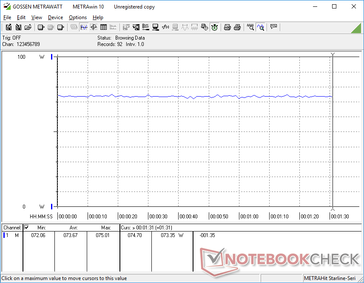
Da fermo sulla scrivania richiede tra i 6 W e i 20 W a seconda del livello di luminosità e del profilo di potenza similmente a quello che abbiamo scoperto su P65 Creator. I risultati più interessanti si ottengono quando si eseguono carichi più elevati, come nel caso dei giochi. In idle con The Witcher 3 consuma solo 74 W rispetto ai 94 W del Dell G3 3590 con grafica GTX 1650 o 124 W del Lenovo Legion Y7000 con grafica GTX 1060. Le prestazioni per Watt sono impressionanti per un laptop che accoppia una CPU ULV con una GPU Max-Q.
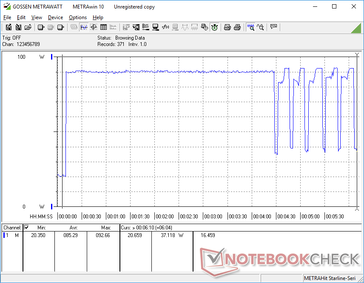
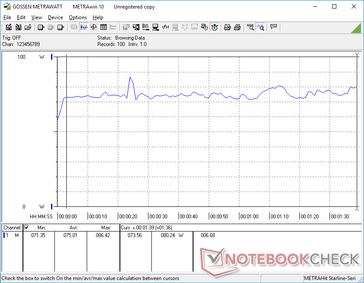
Quando si esegue Prime95, il consumo raggiunge i 90 W per i primi minuti, come mostra il grafico sottostante. Dopo un po' di tempo, tuttavia, il consumo oscillerebbe tra i 40 W e i 90 W invece di diminuire costantemente come sulla maggior parte degli altri computer portatili. Questo comportamento indesiderato corrisponde alle nostre osservazioni del Prime95 Stress Test, al di sopra del quale le frequenze di clock oscillerebbero tra 1,1 GHz e 3,3 GHz.
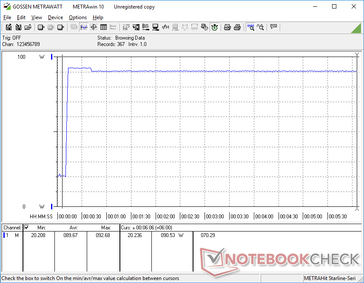
Al massimo, siamo in grado di registrare un consumo di 92 W quando si eseguono contemporaneamente sia Prime95 che FurMark dall'adattatore da 90 W di piccole e medie dimensioni (~13 x 6 x 2,8 cm). Tenete presente che la ricarica si arresta quando si eseguono contemporaneamente carichi elevati.
| Off / Standby | |
| Idle | |
| Sotto carico |
|
Leggenda:
min: | |
| MSI Prestige 15 A10SC i7-10710U, GeForce GTX 1650 Max-Q, Samsung SSD PM981 MZVLB1T0HALR, IPS, 3840x2160, 15.6" | Microsoft Surface Laptop 3 15 Ryzen 5 3580U R5 3580U, Vega 9, SK hynix BC501 HFM256GDGTNG, IPS, 2496x1664, 15" | Lenovo ThinkPad T590-20N4002VGE i7-8565U, GeForce MX250, Toshiba XG6 KXG60ZNV512G, aSi IPS LED, 1920x1080, 15.6" | Dell Latitude 5500 i7-8665U, UHD Graphics 620, Toshiba XG6 KXG60ZNV1T02, IPS, 1920x1080, 15.6" | HP EliteBook 755 G5 3UN79EA R7 2700U, Vega 10, Toshiba XG5 KXG50ZNV512G, IPS, 1920x1080, 15.6" | MSI P65 Creator 9SF-657 i9-9880H, GeForce RTX 2070 Max-Q, 2x Samsung SSD PM981 MZVLB512HAJQ (RAID 0), IPS, 3840x2160, 15.6" | Dell Precision 5530 Xeon E-2176M E-2176M, Quadro P2000, SK hynix PC400 512 GB, IGZO, 3840x2160, 15.6" | |
|---|---|---|---|---|---|---|---|
| Power Consumption | 46% | 29% | 40% | 33% | -53% | -24% | |
| Idle Minimum * (Watt) | 6.1 | 3.3 46% | 4.1 33% | 4.4 28% | 5 18% | 9.4 -54% | 9.8 -61% |
| Idle Average * (Watt) | 13.2 | 7.1 46% | 8.3 37% | 6.9 48% | 10.6 20% | 17.4 -32% | 16.8 -27% |
| Idle Maximum * (Watt) | 19.2 | 7.2 62% | 11.8 39% | 7.7 60% | 12.9 33% | 19.6 -2% | 16.9 12% |
| Load Average * (Watt) | 75 | 44.8 40% | 61.6 18% | 43.6 42% | 40.6 46% | 103 -37% | 102.3 -36% |
| Witcher 3 ultra * (Watt) | 74 | 45.1 39% | 54.4 26% | 76.5 -3% | |||
| Load Maximum * (Watt) | 89.7 | 53 41% | 69.4 23% | 69.1 23% | 46.6 48% | 216 -141% | 114.5 -28% |
* ... Meglio usare valori piccoli
Autonomia della batteria
La capacità della batteria è identica a quella del P65 Creator a 82 Wh. I tempi di autonomia sono più lunghi di quelli registrati sul P65, poiché quest'ultimo utilizza componenti più potenti. Gli utenti possono aspettarsi circa 7,5 ore di utilizzo della WLAN nel mondo reale quando usano la batteria.
La ricarica completa richiede circa 1,5 ore quando i carichi di elaborazione sono bassi o poco impegnativi.
| MSI Prestige 15 A10SC i7-10710U, GeForce GTX 1650 Max-Q, 82 Wh | Microsoft Surface Laptop 3 15 Ryzen 5 3580U R5 3580U, Vega 9, 45 Wh | Lenovo ThinkPad T590-20N4002VGE i7-8565U, GeForce MX250, 57 Wh | Dell Latitude 5500 i7-8665U, UHD Graphics 620, 68 Wh | HP EliteBook 755 G5 3UN79EA R7 2700U, Vega 10, 56 Wh | MSI P65 Creator 9SF-657 i9-9880H, GeForce RTX 2070 Max-Q, 82 Wh | Dell Precision 5530 Xeon E-2176M E-2176M, Quadro P2000, 97 Wh | |
|---|---|---|---|---|---|---|---|
| Autonomia della batteria | -0% | 53% | 62% | -16% | -40% | -6% | |
| Reader / Idle (h) | 19.1 | 18.7 -2% | 11.9 -38% | 9.6 -50% | 16.5 -14% | ||
| WiFi v1.3 (h) | 7.6 | 9.1 20% | 10.5 38% | 12.3 62% | 8.3 9% | 6 -21% | 8.4 11% |
| Load (h) | 2.1 | 1.7 -19% | 3.5 67% | 1.7 -19% | 1.1 -48% | 1.8 -14% |
Pro
Contro
Giudizio Complessivo
Il Prestige 15 è la prova che MSI può fare di più di semplici prodotti gaming. È probabilmente attraente dal punto di vista estetico quanto l'XPS 15, ZenBook 15 o lo Spectre x360 15, pur essendo più leggero e generalmente più versatile per i viaggi grazie al suo caricabatterie USB Type-C. La CPU hexa-core Comet Lake-U funziona molto bene come alternativa al quad-core Coffee Lake-H a condizione che i programmi in esecuzione possano sfruttare appieno i sei cores fisici disponibili. Nel frattempo, il display 4K UHD è più luminoso e più accurato rispetto a quello che la maggior parte degli Ultrabooks da 15,6 pollici possono offrire, compresi i suddetti Asus e HP. Il rumore della ventola ha meno probabilità di pulsazioni durante i carichi più elevati, anche se confrontato con gli Ultrabooks con processori Intel serie H più esigenti.
C'è ancora molto che MSI può fare per rendere il Prestige 15 ancora migliore. La mancanza sia di un Kensington Lock che di una fotocamera IR, ad esempio, sono strane omissioni su un laptop da ufficio di fascia alta. Il case potrebbe essere reso più rigido in quanto non sembra così robusto come le ammiraglie Dell o HP. Il throttling della CPU quando si trova sotto il 100% di utilizzo potrebbe essere gestito meglio. Anche se il sistema utilizza sia una CPU Intel ULV che una GPU Max-Q Nvidia, le temperature interne sono ancora molto elevate quando è sotto carico. il feedback della tastiera e del clickpad in particolare potrebbe essere più nitido e meno spugnoso.
L'MSI Prestige 15 raggiunge un eccellente equilibrio tra peso, qualità del display, prestazioni della CPU, prestazioni della GPU e opzioni di porta. La rigidità del telaio, il feedback di tastiera e clickpad, il throttling della CPU e alcune funzioni di sicurezza mancanti potrebbero, si spera, essere affrontate nelle prossime versioni.
MSI Prestige 15 A10SC
- 11/14/2019 v7 (old)
Allen Ngo


