Recensione del Laptop Dell Latitude 5500: un portatile business con molte opzioni
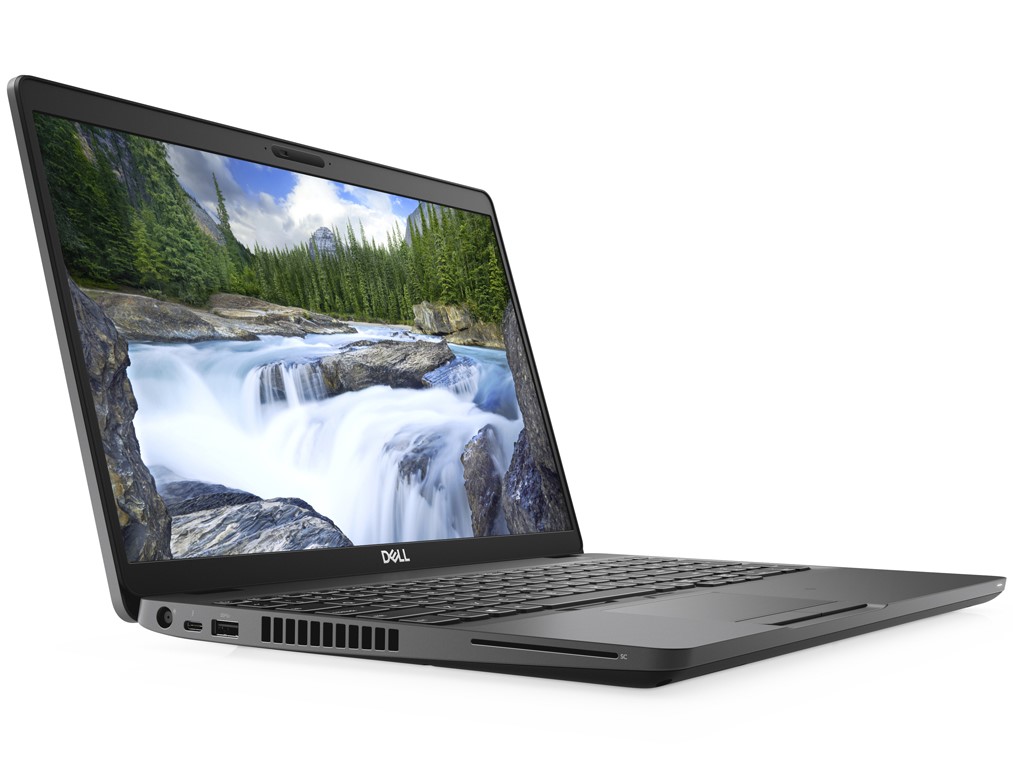
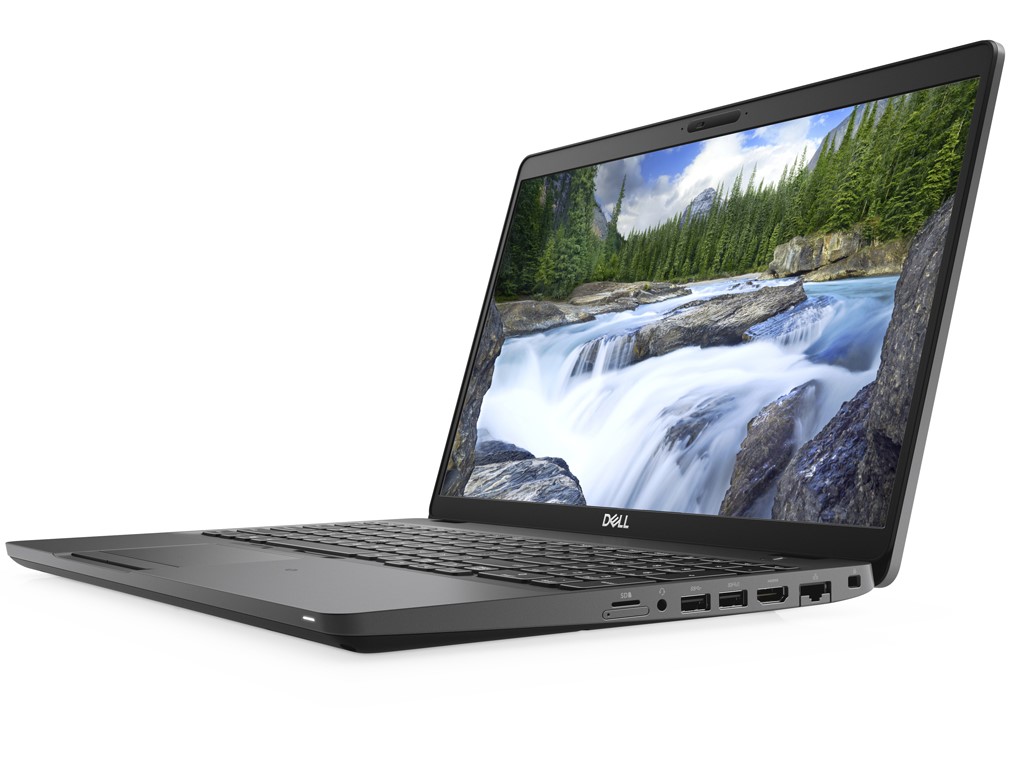
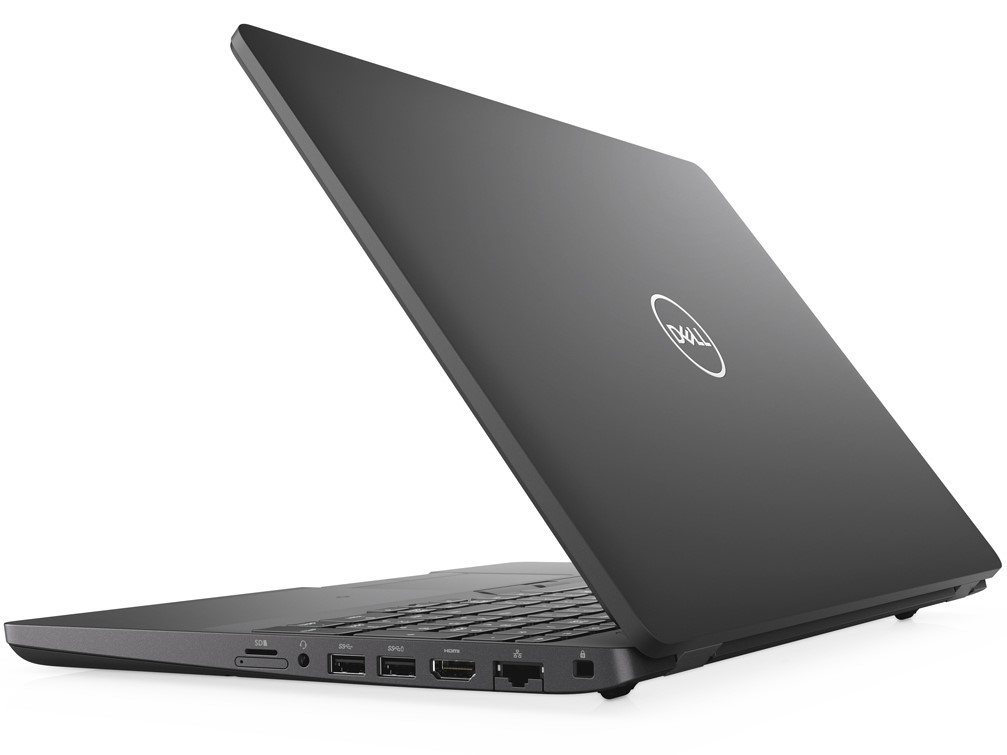
Connection Equipment


| SD Card Reader | |
| average JPG Copy Test (av. of 3 runs) | |
| Dell Latitude 5500 (Toshiba Exceria Pro M501 64 GB UHS-II) | |
| Lenovo ThinkPad T580-20L9001AUS (Toshiba Exceria Pro SDXC 64 GB UHS-II) | |
| Media della classe Office (19.8 - 198.5, n=22, ultimi 2 anni) | |
| maximum AS SSD Seq Read Test (1GB) | |
| Dell Latitude 5500 (Toshiba Exceria Pro M501 64 GB UHS-II) | |
| Lenovo ThinkPad T580-20L9001AUS (Toshiba Exceria Pro SDXC 64 GB UHS-II) | |
| Media della classe Office (27.4 - 249, n=21, ultimi 2 anni) | |
| |||||||||||||||||||||||||
Distribuzione della luminosità: 93 %
Al centro con la batteria: 233 cd/m²
Contrasto: 1017:1 (Nero: 0.23 cd/m²)
ΔE ColorChecker Calman: 5.2 | ∀{0.5-29.43 Ø4.73}
calibrated: 4.6
ΔE Greyscale Calman: 2.5 | ∀{0.09-98 Ø4.97}
57% sRGB (Argyll 1.6.3 3D)
36.2% AdobeRGB 1998 (Argyll 1.6.3 3D)
39.33% AdobeRGB 1998 (Argyll 3D)
57.3% sRGB (Argyll 3D)
38.07% Display P3 (Argyll 3D)
Gamma: 2.44
CCT: 6649 K
| Dell Latitude 5500 LGD05FF 156WFD, , 1920x1080, 15.6" | Lenovo ThinkPad T580-20L9001AUS B156HAK02.0, , 1920x1080, 15.6" | Acer Swift 5 SF515-51T-76B6 LG Philips LP156WFA-SPG2, , 1920x1080, 15.6" | HP EliteBook 755 G5 3UN79EA BOE074E, , 1920x1080, 15.6" | |
|---|---|---|---|---|
| Display | -3% | 73% | 67% | |
| Display P3 Coverage (%) | 38.07 | 36.94 -3% | 66.8 75% | 66.9 76% |
| sRGB Coverage (%) | 57.3 | 55.3 -3% | 98 71% | 90.2 57% |
| AdobeRGB 1998 Coverage (%) | 39.33 | 38.16 -3% | 67.8 72% | 66.1 68% |
| Response Times | 8% | 6% | -9% | |
| Response Time Grey 50% / Grey 80% * (ms) | 37.6 ? | 33.2 ? 12% | 38 ? -1% | 39 ? -4% |
| Response Time Black / White * (ms) | 28.4 ? | 27.6 ? 3% | 25 ? 12% | 32 ? -13% |
| PWM Frequency (Hz) | 21000 ? | |||
| Screen | -5% | 38% | -20% | |
| Brightness middle (cd/m²) | 234 | 254.5 9% | 341 46% | 456 95% |
| Brightness (cd/m²) | 229 | 238 4% | 319 39% | 410 79% |
| Brightness Distribution (%) | 93 | 87 -6% | 87 -6% | 84 -10% |
| Black Level * (cd/m²) | 0.23 | 0.27 -17% | 0.31 -35% | 0.62 -170% |
| Contrast (:1) | 1017 | 943 -7% | 1100 8% | 735 -28% |
| Colorchecker dE 2000 * | 5.2 | 4.58 12% | 2.01 61% | 7.09 -36% |
| Colorchecker dE 2000 max. * | 14.7 | 17.99 -22% | 4.74 68% | 12.64 14% |
| Colorchecker dE 2000 calibrated * | 4.6 | 4.34 6% | 1.11 76% | |
| Greyscale dE 2000 * | 2.5 | 3.3 -32% | 2.01 20% | 9.15 -266% |
| Gamma | 2.44 90% | 2.403 92% | 2.52 87% | 2.31 95% |
| CCT | 6649 98% | 6355 102% | 6704 97% | 7195 90% |
| Color Space (Percent of AdobeRGB 1998) (%) | 36.2 | 35 -3% | 63 74% | 59 63% |
| Color Space (Percent of sRGB) (%) | 57 | 55 -4% | 98 72% | 90 58% |
| Media totale (Programma / Settaggio) | 0% /
-3% | 39% /
41% | 13% /
-1% |
* ... Meglio usare valori piccoli
Tempi di risposta del Display
| ↔ Tempi di risposta dal Nero al Bianco | ||
|---|---|---|
| 28.4 ms ... aumenta ↗ e diminuisce ↘ combinato | ↗ 17.2 ms Incremento | 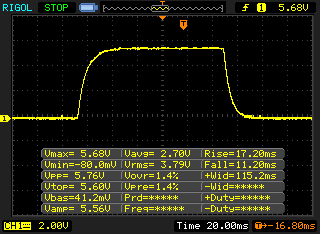 |
| ↘ 11.2 ms Calo | ||
| Lo schermo mostra tempi di risposta relativamente lenti nei nostri tests e potrebbe essere troppo lento per i gamers. In confronto, tutti i dispositivi di test variano da 0.1 (minimo) a 240 (massimo) ms. » 75 % di tutti i dispositivi è migliore. Questo significa che i tempi di risposta rilevati sono peggiori rispetto alla media di tutti i dispositivi testati (19.9 ms). | ||
| ↔ Tempo di risposta dal 50% Grigio all'80% Grigio | ||
| 37.6 ms ... aumenta ↗ e diminuisce ↘ combinato | ↗ 19.6 ms Incremento | 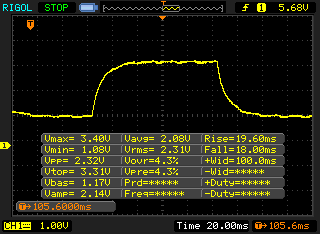 |
| ↘ 18 ms Calo | ||
| Lo schermo mostra tempi di risposta lenti nei nostri tests e sarà insoddisfacente per i gamers. In confronto, tutti i dispositivi di test variano da 0.165 (minimo) a 636 (massimo) ms. » 54 % di tutti i dispositivi è migliore. Questo significa che i tempi di risposta rilevati sono peggiori rispetto alla media di tutti i dispositivi testati (31.1 ms). | ||
Sfarfallio dello schermo / PWM (Pulse-Width Modulation)
| flickering dello schermo / PWM non rilevato | 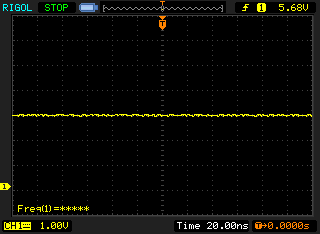 | ||
In confronto: 52 % di tutti i dispositivi testati non utilizza PWM per ridurre la luminosita' del display. Se è rilevato PWM, una media di 7791 (minimo: 5 - massimo: 343500) Hz è stata rilevata. | |||
| PCMark 8 Home Score Accelerated v2 | 3959 punti | |
| PCMark 10 Score | 4515 punti | |
Aiuto | ||
| Dell Latitude 5500 Toshiba XG6 KXG60ZNV1T02 | Lenovo ThinkPad T580-20L9001AUS Samsung SSD PM981 MZVLB512HAJQ | Acer Swift 5 SF515-51T-76B6 SK Hynix BC501 HFM512GDJTNG | HP EliteBook 755 G5 3UN79EA Toshiba XG5 KXG50ZNV512G | Lenovo ThinkPad X1 Carbon 2019-20QE000VGE WDC PC SN720 SDAQNTW-512G | Media Toshiba XG6 KXG60ZNV1T02 | Media della classe Office | |
|---|---|---|---|---|---|---|---|
| CrystalDiskMark 5.2 / 6 | -21% | -25% | -14% | 37% | 23% | 79% | |
| Write 4K (MB/s) | 149 | 122.1 -18% | 109.6 -26% | 119.9 -20% | 196.9 32% | 136.3 ? -9% | 151.4 ? 2% |
| Read 4K (MB/s) | 48.26 | 44.61 -8% | 41.15 -15% | 30.39 -37% | 51.3 6% | 50.7 ? 5% | 72.8 ? 51% |
| Write Seq (MB/s) | 1772 | 826 -53% | 747 -58% | 558 -69% | 1715 -3% | 1869 ? 5% | 2558 ? 44% |
| Read Seq (MB/s) | 1200 | 811 -32% | 1134 -5% | 1689 41% | 2464 105% | 1984 ? 65% | 3237 ? 170% |
| Write 4K Q32T1 (MB/s) | 414.5 | 293.9 -29% | 321.5 -22% | 265.9 -36% | 429.1 4% | 435 ? 5% | 424 ? 2% |
| Read 4K Q32T1 (MB/s) | 393 | 374.8 -5% | 354 -10% | 329.5 -16% | 542 38% | 439 ? 12% | 509 ? 30% |
| Write Seq Q32T1 (MB/s) | 2941 | 1714 -42% | 872 -70% | 710 -76% | 2521 -14% | 3019 ? 3% | 3999 ? 36% |
| Read Seq Q32T1 (MB/s) | 1510 | 1772 17% | 1639 9% | 2984 98% | 3481 131% | 3016 ? 100% | 5962 ? 295% |
| AS SSD | -6% | -26% | -328% | 26% | 4% | 17% | |
| Seq Read (MB/s) | 1287 | 1454 13% | 1446 12% | 1810 41% | 2978 131% | 2385 ? 85% | 4254 ? 231% |
| Seq Write (MB/s) | 1280 | 1324 3% | 708 -45% | 261.4 -80% | 2287 79% | 1491 ? 16% | 2704 ? 111% |
| 4K Read (MB/s) | 49.57 | 50.8 2% | 44.27 -11% | 24.38 -51% | 47.39 -4% | 47.9 ? -3% | 57.1 ? 15% |
| 4K Write (MB/s) | 158 | 106.2 -33% | 124.8 -21% | 5.77 -96% | 175.6 11% | 129.5 ? -18% | 162.4 ? 3% |
| 4K-64 Read (MB/s) | 1043 | 1140 9% | 788 -24% | 528 -49% | 1209 16% | 1099 ? 5% | 919 ? -12% |
| 4K-64 Write (MB/s) | 1415 | 1325 -6% | 737 -48% | 90.7 -94% | 1148 -19% | 1440 ? 2% | 1624 ? 15% |
| Access Time Read * (ms) | 0.039 | 0.047 -21% | 0.2 -413% | 0.05787 ? -48% | 0.08503 ? -118% | ||
| Access Time Write * (ms) | 0.027 | 0.035 -30% | 0.033 -22% | 0.748 -2670% | 0.023 15% | 0.03213 ? -19% | 0.05781 ? -114% |
| Score Read (Points) | 1221 | 1336 9% | 977 -20% | 733 -40% | 1554 27% | 1386 ? 14% | 1402 ? 15% |
| Score Write (Points) | 1701 | 1564 -8% | 932 -45% | 123 -93% | 1553 -9% | 1718 ? 1% | 2056 ? 21% |
| Score Total (Points) | 3558 | 3587 1% | 2384 -33% | 1157 -67% | 3874 9% | 3776 ? 6% | 4110 ? 16% |
| Copy ISO MB/s (MB/s) | 955 | 1986 ? | 2515 ? | ||||
| Copy Program MB/s (MB/s) | 327.1 | 564 ? | 788 ? | ||||
| Copy Game MB/s (MB/s) | 700 | 1110 ? | 1603 ? | ||||
| Media totale (Programma / Settaggio) | -14% /
-12% | -26% /
-25% | -171% /
-196% | 32% /
31% | 14% /
12% | 48% /
43% |
* ... Meglio usare valori piccoli

| 3DMark 11 Performance | 2277 punti | |
Aiuto | ||
| basso | medio | alto | ultra | |
|---|---|---|---|---|
| BioShock Infinite (2013) | 90.2 | 42.62 | 35.9 | 11.69 |
| Dota 2 Reborn (2015) | 83 | 54.8 | 23.2 | 20.2 |
| X-Plane 11.11 (2018) | 17.8 | 12.4 | 10.7 |
Rumorosità
| Idle |
| 28.8 / 28.8 / 28.8 dB(A) |
| Sotto carico |
| 30.3 / 32.6 dB(A) |
 | ||
30 dB silenzioso 40 dB(A) udibile 50 dB(A) rumoroso |
||
min: | ||
(±) La temperatura massima sul lato superiore è di 41 °C / 106 F, rispetto alla media di 34.3 °C / 94 F, che varia da 21.2 a 62.5 °C per questa classe Office.
(-) Il lato inferiore si riscalda fino ad un massimo di 46.4 °C / 116 F, rispetto alla media di 36.8 °C / 98 F
(+) In idle, la temperatura media del lato superiore è di 23.2 °C / 74 F, rispetto alla media deld ispositivo di 29.5 °C / 85 F.
(+) I poggiapolsi e il touchpad sono piu' freddi della temperatura della pelle con un massimo di 29.2 °C / 84.6 F e sono quindi freddi al tatto.
(±) La temperatura media della zona del palmo della mano di dispositivi simili e'stata di 27.5 °C / 81.5 F (-1.7 °C / -3.1 F).
Dell Latitude 5500 analisi audio
(±) | potenza degli altiparlanti media ma buona (80.3 dB)
Bassi 100 - 315 Hz
(-) | quasi nessun basso - in media 25.8% inferiori alla media
(±) | la linearità dei bassi è media (7.6% delta rispetto alla precedente frequenza)
Medi 400 - 2000 Hz
(+) | medi bilanciati - solo only 3.7% rispetto alla media
(±) | linearità dei medi adeguata (7.2% delta rispetto alla precedente frequenza)
Alti 2 - 16 kHz
(+) | Alti bilanciati - appena 3.5% dalla media
(+) | alti lineari (2.5% delta rispetto alla precedente frequenza)
Nel complesso 100 - 16.000 Hz
(±) | la linearità complessiva del suono è media (20.5% di differenza rispetto alla media
Rispetto alla stessa classe
» 46% di tutti i dispositivi testati in questa classe è stato migliore, 10% simile, 45% peggiore
» Il migliore ha avuto un delta di 7%, medio di 21%, peggiore di 53%
Rispetto a tutti i dispositivi testati
» 54% di tutti i dispositivi testati in questa classe è stato migliore, 8% similare, 38% peggiore
» Il migliore ha avuto un delta di 4%, medio di 24%, peggiore di 134%
Apple MacBook 12 (Early 2016) 1.1 GHz analisi audio
(+) | gli altoparlanti sono relativamente potenti (83.6 dB)
Bassi 100 - 315 Hz
(±) | bassi ridotti - in media 11.3% inferiori alla media
(±) | la linearità dei bassi è media (14.2% delta rispetto alla precedente frequenza)
Medi 400 - 2000 Hz
(+) | medi bilanciati - solo only 2.4% rispetto alla media
(+) | medi lineari (5.5% delta rispetto alla precedente frequenza)
Alti 2 - 16 kHz
(+) | Alti bilanciati - appena 2% dalla media
(+) | alti lineari (4.5% delta rispetto alla precedente frequenza)
Nel complesso 100 - 16.000 Hz
(+) | suono nel complesso lineare (10.2% differenza dalla media)
Rispetto alla stessa classe
» 7% di tutti i dispositivi testati in questa classe è stato migliore, 2% simile, 91% peggiore
» Il migliore ha avuto un delta di 5%, medio di 18%, peggiore di 53%
Rispetto a tutti i dispositivi testati
» 5% di tutti i dispositivi testati in questa classe è stato migliore, 1% similare, 94% peggiore
» Il migliore ha avuto un delta di 4%, medio di 24%, peggiore di 134%
| Off / Standby | |
| Idle | |
| Sotto carico |
|
Leggenda:
min: | |
Pro
Contro
Giudizio Complessivo - Il Latitude 5500 ha problemi di surriscaldamento
Nei nostri test, il Dell Latitude 5500 si presenta come un notebook business solido con molte funzioni e una buona connettività. Da un lettore di impronte digitali fino a un lettore di smartcard e NFC, sono disponibili molte opzioni che garantiscono la sicurezza anche oltre il TPM 2.0. Chi desidera essere preparato per il Wi-Fi 6 o utilizzare Internet mobile per strada troverà l'attrezzatura adatta con la corrispondente scheda WLAN e LTE. L'hardware è aggiornato e può anche essere ampliato facilmente. Inoltre, anche la durata della batteria è molto buona.
Gli utenti business avranno una moltitudine di opzioni con il Dell Latitude 5500, ma devono anche convivere con un sistema di raffreddamento che non è in grado di affrontare un carico molto pesante.
Tuttavia, tutti i vantaggi sono annullati da un problema critico. Il controllo della ventola non è in grado di gestire carichi improvvisi e pesanti del sistema. A volte può succedere che un notebook si blocchi durante il nostro stress test, ma non dovrebbe bloccarsi durante i benchmarks PCMark. Non possiamo dire in questo momento se Dell risolverà ancora questo problema, ma forse il processore veloce con la sua alta velocità Turbo è semplicemente troppo per il sistema di raffreddamento. In caso di dubbio, un Core i5 Core "più piccolo" potrebbe essere la scelta migliore.
Dell Latitude 5500
- 09/02/2019 v7 (old)
Mike Wobker
Price comparison
