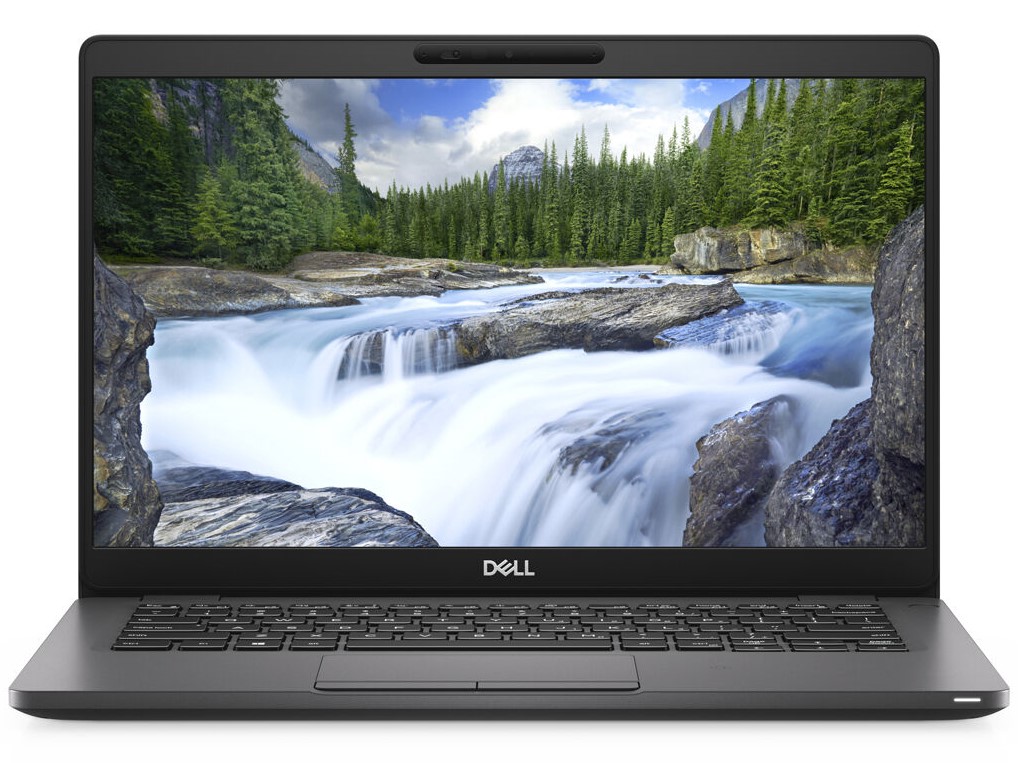
Recensione del Laptop Dell Latitude 5300: un piccolo computer portatile business con LTE
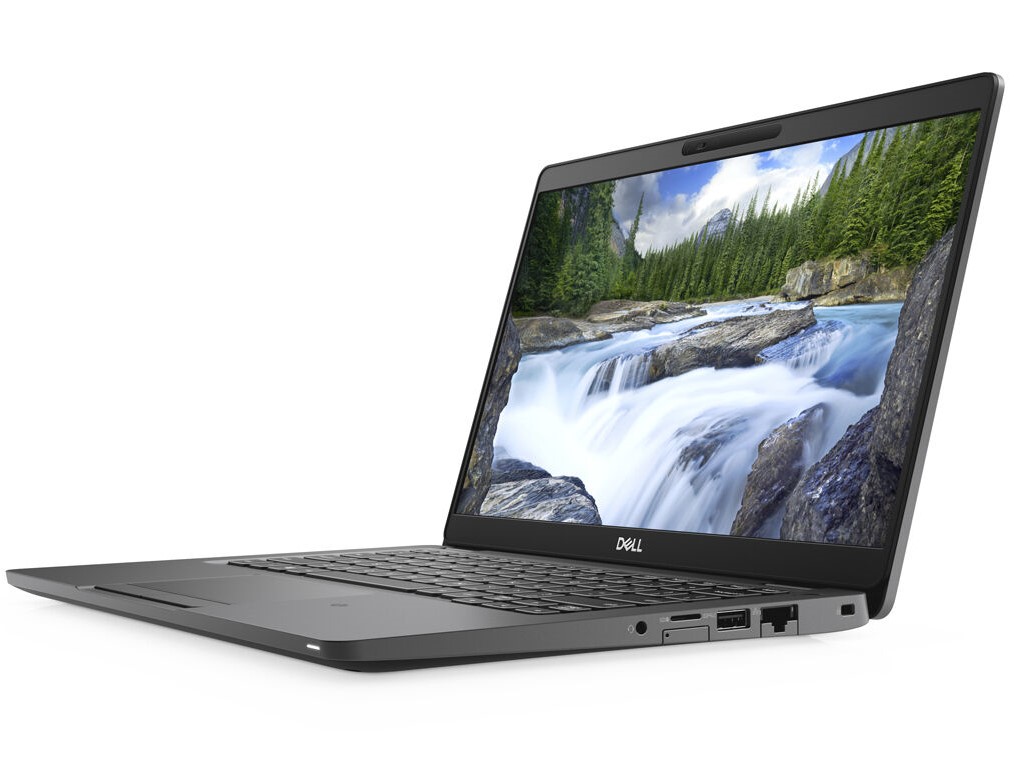
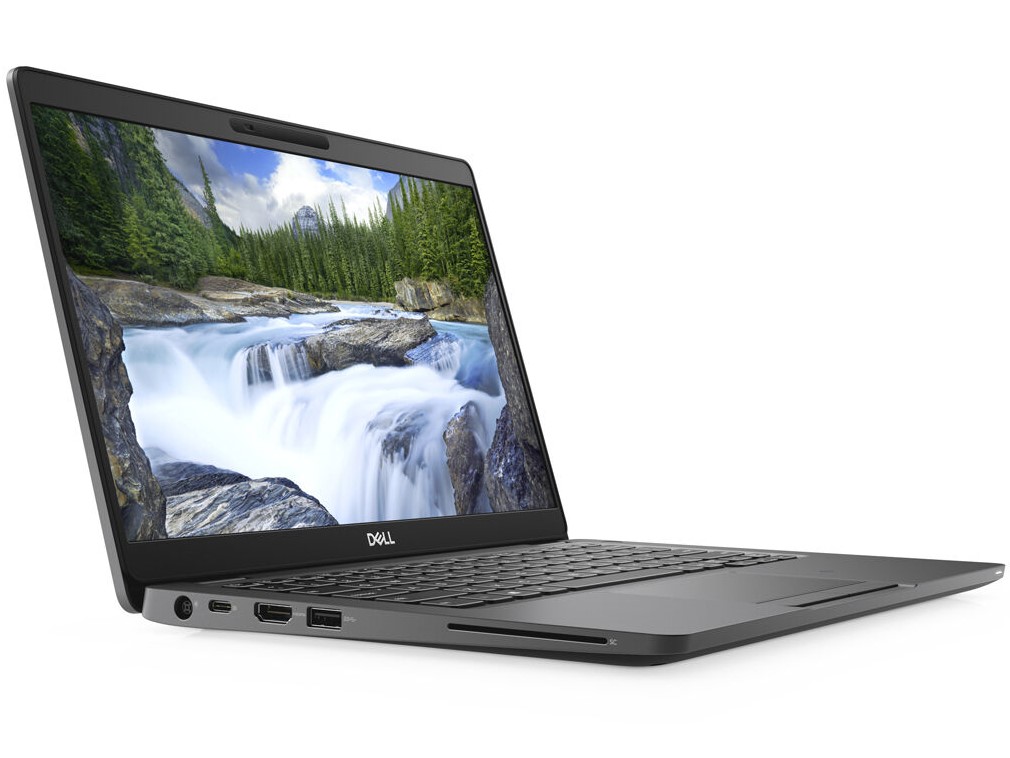
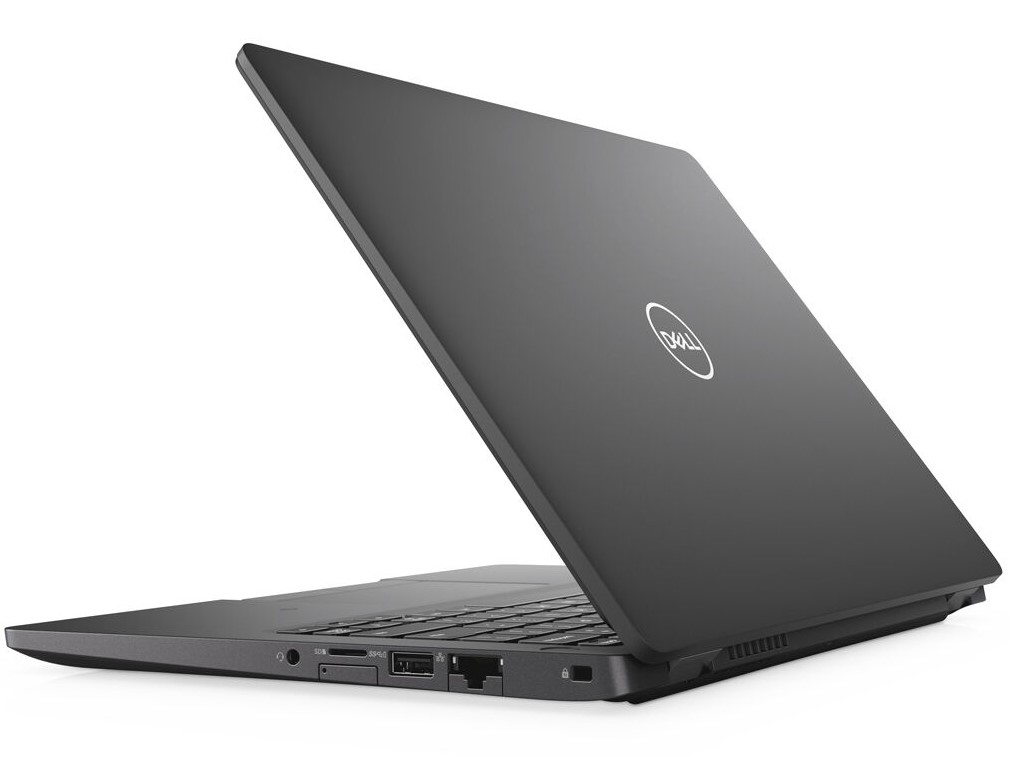
Connessioni


| SD Card Reader | |
| average JPG Copy Test (av. of 3 runs) | |
| Dell Latitude 5300 (Toshiba Exceria Pro M501 64 GB UHS-II) | |
| Asus ZenBook S13 UX392FN (Toshiba Exceria Pro M501 64 GB UHS-II) | |
| Media della classe Office (22.4 - 198.5, n=22, ultimi 2 anni) | |
| Dell Latitude 13 3390 (Toshiba Exceria Pro SDXC 64 GB UHS-II) | |
| maximum AS SSD Seq Read Test (1GB) | |
| Dell Latitude 5300 (Toshiba Exceria Pro M501 64 GB UHS-II) | |
| Asus ZenBook S13 UX392FN (Toshiba Exceria Pro M501 64 GB UHS-II) | |
| Media della classe Office (27.4 - 249, n=20, ultimi 2 anni) | |
| Dell Latitude 13 3390 (Toshiba Exceria Pro SDXC 64 GB UHS-II) | |
| |||||||||||||||||||||||||
Distribuzione della luminosità: 87 %
Al centro con la batteria: 327 cd/m²
Contrasto: 1207:1 (Nero: 0.27 cd/m²)
ΔE ColorChecker Calman: 3.2 | ∀{0.5-29.43 Ø4.73}
calibrated: 1.6
ΔE Greyscale Calman: 3.8 | ∀{0.09-98 Ø4.97}
94.8% sRGB (Argyll 1.6.3 3D)
63.8% AdobeRGB 1998 (Argyll 1.6.3 3D)
68.7% AdobeRGB 1998 (Argyll 3D)
94.4% sRGB (Argyll 3D)
68.2% Display P3 (Argyll 3D)
Gamma: 2.14
CCT: 6900 K
| Dell Latitude 5300 LGD05ED-133WF6, , 1920x1080, 13.3" | Dell Latitude 13 3390 BOE06A7, NV13FHM, , 1920x1080, 13.3" | Lenovo ThinkBook 13s-20R90071GE N133HCE-EN2, , 1920x1080, 13.3" | Huawei Matebook 13-53010FYW Chi Mei CMN8201, , 2160x1440, 13" | Asus ZenBook S13 UX392FN Tianma XM, , 1920x1080, 13.9" | |
|---|---|---|---|---|---|
| Display | -38% | 1% | 2% | 0% | |
| Display P3 Coverage (%) | 68.2 | 40.9 -40% | 67 -2% | 68.1 0% | 67.5 -1% |
| sRGB Coverage (%) | 94.4 | 61.3 -35% | 99.1 5% | 99.3 5% | 95.8 1% |
| AdobeRGB 1998 Coverage (%) | 68.7 | 42.29 -38% | 69.2 1% | 69.7 1% | 69 0% |
| Response Times | -15% | -6% | -13% | -8% | |
| Response Time Grey 50% / Grey 80% * (ms) | 38 ? | 42 ? -11% | 40.4 ? -6% | 43.2 ? -14% | 47.2 ? -24% |
| Response Time Black / White * (ms) | 27.2 ? | 32 ? -18% | 28.8 ? -6% | 30.4 ? -12% | 24.8 ? 9% |
| PWM Frequency (Hz) | 208 ? | 25000 ? | 60240 ? | ||
| Screen | -69% | 8% | -8% | 17% | |
| Brightness middle (cd/m²) | 326 | 276 -15% | 319 -2% | 356 9% | 466 43% |
| Brightness (cd/m²) | 313 | 274 -12% | 309 -1% | 346 11% | 462 48% |
| Brightness Distribution (%) | 87 | 82 -6% | 92 6% | 86 -1% | 90 3% |
| Black Level * (cd/m²) | 0.27 | 0.29 -7% | 0.28 -4% | 0.35 -30% | 0.33 -22% |
| Contrast (:1) | 1207 | 952 -21% | 1139 -6% | 1017 -16% | 1412 17% |
| Colorchecker dE 2000 * | 3.2 | 5.84 -83% | 2.4 25% | 3.3 -3% | 1.93 40% |
| Colorchecker dE 2000 max. * | 6.3 | 26.72 -324% | 6.3 -0% | 8.7 -38% | 4.26 32% |
| Colorchecker dE 2000 calibrated * | 1.6 | 5.15 -222% | 0.6 63% | 1.1 31% | 1.99 -24% |
| Greyscale dE 2000 * | 3.8 | 3.54 7% | 3.8 -0% | 5.8 -53% | 1.7 55% |
| Gamma | 2.14 103% | 2.43 91% | 2.16 102% | 2.21 100% | 2.15 102% |
| CCT | 6900 94% | 6747 96% | 7335 89% | 6670 97% | 6382 102% |
| Color Space (Percent of AdobeRGB 1998) (%) | 63.8 | 39 -39% | 63.5 0% | 64.1 0% | 62.2 -3% |
| Color Space (Percent of sRGB) (%) | 94.8 | 61 -36% | 99.1 5% | 99.4 5% | 95.7 1% |
| Media totale (Programma / Settaggio) | -41% /
-56% | 1% /
5% | -6% /
-7% | 3% /
11% |
* ... Meglio usare valori piccoli
Tempi di risposta del Display
| ↔ Tempi di risposta dal Nero al Bianco | ||
|---|---|---|
| 27.2 ms ... aumenta ↗ e diminuisce ↘ combinato | ↗ 16 ms Incremento | 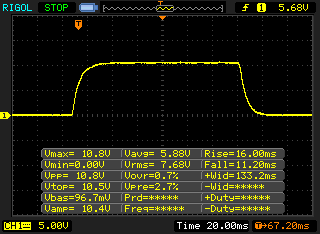 |
| ↘ 11.2 ms Calo | ||
| Lo schermo mostra tempi di risposta relativamente lenti nei nostri tests e potrebbe essere troppo lento per i gamers. In confronto, tutti i dispositivi di test variano da 0.1 (minimo) a 240 (massimo) ms. » 69 % di tutti i dispositivi è migliore. Questo significa che i tempi di risposta rilevati sono peggiori rispetto alla media di tutti i dispositivi testati (19.9 ms). | ||
| ↔ Tempo di risposta dal 50% Grigio all'80% Grigio | ||
| 38 ms ... aumenta ↗ e diminuisce ↘ combinato | ↗ 19.6 ms Incremento | 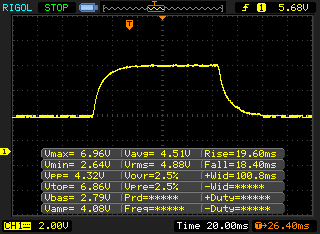 |
| ↘ 18.4 ms Calo | ||
| Lo schermo mostra tempi di risposta lenti nei nostri tests e sarà insoddisfacente per i gamers. In confronto, tutti i dispositivi di test variano da 0.165 (minimo) a 636 (massimo) ms. » 55 % di tutti i dispositivi è migliore. Questo significa che i tempi di risposta rilevati sono peggiori rispetto alla media di tutti i dispositivi testati (31.1 ms). | ||
Sfarfallio dello schermo / PWM (Pulse-Width Modulation)
| flickering dello schermo / PWM non rilevato | 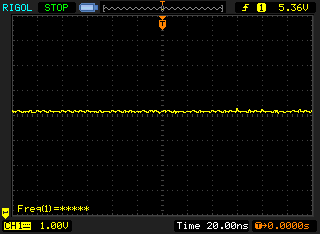 | ||
In confronto: 52 % di tutti i dispositivi testati non utilizza PWM per ridurre la luminosita' del display. Se è rilevato PWM, una media di 7798 (minimo: 5 - massimo: 343500) Hz è stata rilevata. | |||
| PCMark 8 Home Score Accelerated v2 | 3546 punti | |
| PCMark 10 Score | 4086 punti | |
Aiuto | ||
| Dell Latitude 5300 SK Hynix PC401 512GB M.2 (HFS512GD9TNG) | Dell Latitude 13 3390 SK hynix SC311 SATA | Lenovo ThinkBook 13s-20R90071GE SK hynix BC501 HFM512GDHTNG-8310A | Huawei Matebook 13-53010FYW WDC PC SN520 SDAPNUW-512G | Asus ZenBook S13 UX392FN WDC PC SN520 SDAPNUW-512G | Media SK Hynix PC401 512GB M.2 (HFS512GD9TNG) | Media della classe Office | |
|---|---|---|---|---|---|---|---|
| CrystalDiskMark 5.2 / 6 | -52% | -24% | 47% | 8% | 14% | 84% | |
| Write 4K (MB/s) | 119.2 | 52.4 -56% | 89.3 -25% | 191.2 60% | 149.2 25% | 143.3 ? 20% | 151.4 ? 27% |
| Read 4K (MB/s) | 41.43 | 24.71 -40% | 37.4 -10% | 53.1 28% | 47.18 14% | 45.3 ? 9% | 72.8 ? 76% |
| Write Seq (MB/s) | 1240 | 484.1 -61% | 608 -51% | 1768 43% | 750 -40% | 1514 ? 22% | 2558 ? 106% |
| Read Seq (MB/s) | 1668 | 548 -67% | 1019 -39% | 1710 3% | 1137 -32% | 1758 ? 5% | 3237 ? 94% |
| Write 4K Q32T1 (MB/s) | 381.7 | 329.9 -14% | 487.9 28% | 575 51% | 749 96% | 425 ? 11% | 424 ? 11% |
| Read 4K Q32T1 (MB/s) | 371.5 | 250.7 -33% | 284.8 -23% | 654 76% | 478.7 29% | 459 ? 24% | 509 ? 37% |
| Write Seq Q32T1 (MB/s) | 1369 | 508 -63% | 872 -36% | 2544 86% | 1453 6% | 1531 ? 12% | 3999 ? 192% |
| Read Seq Q32T1 (MB/s) | 2652 | 550 -79% | 1635 -38% | 3433 29% | 1713 -35% | 2895 ? 9% | 5962 ? 125% |
| Write 4K Q8T8 (MB/s) | 350.5 | 387.3 | 918 ? | 901 ? | |||
| Read 4K Q8T8 (MB/s) | 359.7 | 757 | 819 ? | 1317 ? | |||
| AS SSD | -61% | -8% | 57% | 16% | 10% | 59% | |
| Seq Read (MB/s) | 2123 | 479.5 -77% | 1264 -40% | 2934 38% | 1224 -42% | 2266 ? 7% | 4258 ? 101% |
| Seq Write (MB/s) | 744 | 354.9 -52% | 518 -30% | 2407 224% | 907 22% | 1137 ? 53% | 2707 ? 264% |
| 4K Read (MB/s) | 43.02 | 23.88 -44% | 40.31 -6% | 48.31 12% | 41.46 -4% | 43.2 ? 0% | 57.3 ? 33% |
| 4K Write (MB/s) | 117.4 | 51.3 -56% | 119.1 1% | 179.7 53% | 126.2 7% | 118.8 ? 1% | 163 ? 39% |
| 4K-64 Read (MB/s) | 680 | 294.8 -57% | 772 14% | 1296 91% | 1021 50% | 819 ? 20% | 924 ? 36% |
| 4K-64 Write (MB/s) | 1039 | 217.5 -79% | 672 -35% | 1459 40% | 1251 20% | 956 ? -8% | 1631 ? 57% |
| Access Time Read * (ms) | 0.057 | 0.093 -63% | 0.046 19% | 0.103 -81% | 0.053 7% | 0.04909 ? 14% | 0.08483 ? -49% |
| Access Time Write * (ms) | 0.051 | 0.071 -39% | 0.031 39% | 0.021 59% | 0.027 47% | 0.04845 ? 5% | 0.05741 ? -13% |
| Score Read (Points) | 935 | 367 -61% | 939 0% | 1638 75% | 1185 27% | 1089 ? 16% | 1407 ? 50% |
| Score Write (Points) | 1230 | 304 -75% | 843 -31% | 1879 53% | 1468 19% | 1188 ? -3% | 2065 ? 68% |
| Score Total (Points) | 2586 | 860 -67% | 2234 -14% | 4334 68% | 3250 26% | 2787 ? 8% | 4127 ? 60% |
| Copy ISO MB/s (MB/s) | 294 | 943 | 1404 | 1286 ? | 2527 ? | ||
| Copy Program MB/s (MB/s) | 137.4 | 292.2 | 402.4 | 470 ? | 793 ? | ||
| Copy Game MB/s (MB/s) | 202.2 | 374.1 | 902 | 837 ? | 1607 ? | ||
| Media totale (Programma / Settaggio) | -57% /
-57% | -16% /
-15% | 52% /
53% | 12% /
13% | 12% /
12% | 72% /
69% |
* ... Meglio usare valori piccoli

| 3DMark 11 Performance | 2165 punti | |
Aiuto | ||
| basso | medio | alto | ultra | |
|---|---|---|---|---|
| BioShock Infinite (2013) | 80.3 | 41.71 | 35.34 | 11.36 |
| Dota 2 Reborn (2015) | 81 | 51.4 | 22.5 | 19.7 |
| X-Plane 11.11 (2018) | 25.1 | 16.3 | 14.4 |
Rumorosità
| Idle |
| 28.8 / 28.8 / 29.8 dB(A) |
| Sotto carico |
| 31.7 / 33.2 dB(A) |
 | ||
30 dB silenzioso 40 dB(A) udibile 50 dB(A) rumoroso |
||
min: | ||
(±) La temperatura massima sul lato superiore è di 43 °C / 109 F, rispetto alla media di 34.3 °C / 94 F, che varia da 21.2 a 62.5 °C per questa classe Office.
(-) Il lato inferiore si riscalda fino ad un massimo di 53 °C / 127 F, rispetto alla media di 36.8 °C / 98 F
(+) In idle, la temperatura media del lato superiore è di 23.3 °C / 74 F, rispetto alla media deld ispositivo di 29.5 °C / 85 F.
(+) I poggiapolsi e il touchpad sono piu' freddi della temperatura della pelle con un massimo di 27.5 °C / 81.5 F e sono quindi freddi al tatto.
(±) La temperatura media della zona del palmo della mano di dispositivi simili e'stata di 27.5 °C / 81.5 F (0 °C / 0 F).
Dell Latitude 5300 analisi audio
(±) | potenza degli altiparlanti media ma buona (74.6 dB)
Bassi 100 - 315 Hz
(±) | bassi ridotti - in media 13.4% inferiori alla media
(±) | la linearità dei bassi è media (10.5% delta rispetto alla precedente frequenza)
Medi 400 - 2000 Hz
(+) | medi bilanciati - solo only 4.7% rispetto alla media
(±) | linearità dei medi adeguata (7.9% delta rispetto alla precedente frequenza)
Alti 2 - 16 kHz
(+) | Alti bilanciati - appena 2.5% dalla media
(±) | la linearità degli alti è media (8.7% delta rispetto alla precedente frequenza)
Nel complesso 100 - 16.000 Hz
(±) | la linearità complessiva del suono è media (17.2% di differenza rispetto alla media
Rispetto alla stessa classe
» 25% di tutti i dispositivi testati in questa classe è stato migliore, 8% simile, 68% peggiore
» Il migliore ha avuto un delta di 7%, medio di 21%, peggiore di 53%
Rispetto a tutti i dispositivi testati
» 32% di tutti i dispositivi testati in questa classe è stato migliore, 8% similare, 60% peggiore
» Il migliore ha avuto un delta di 4%, medio di 24%, peggiore di 134%
Apple MacBook 12 (Early 2016) 1.1 GHz analisi audio
(+) | gli altoparlanti sono relativamente potenti (83.6 dB)
Bassi 100 - 315 Hz
(±) | bassi ridotti - in media 11.3% inferiori alla media
(±) | la linearità dei bassi è media (14.2% delta rispetto alla precedente frequenza)
Medi 400 - 2000 Hz
(+) | medi bilanciati - solo only 2.4% rispetto alla media
(+) | medi lineari (5.5% delta rispetto alla precedente frequenza)
Alti 2 - 16 kHz
(+) | Alti bilanciati - appena 2% dalla media
(+) | alti lineari (4.5% delta rispetto alla precedente frequenza)
Nel complesso 100 - 16.000 Hz
(+) | suono nel complesso lineare (10.2% differenza dalla media)
Rispetto alla stessa classe
» 7% di tutti i dispositivi testati in questa classe è stato migliore, 2% simile, 91% peggiore
» Il migliore ha avuto un delta di 5%, medio di 18%, peggiore di 53%
Rispetto a tutti i dispositivi testati
» 5% di tutti i dispositivi testati in questa classe è stato migliore, 1% similare, 94% peggiore
» Il migliore ha avuto un delta di 4%, medio di 24%, peggiore di 134%
| Off / Standby | |
| Idle | |
| Sotto carico |
|
Leggenda:
min: | |
Pro
Contro
Giudizio Complessivo - Buon Laptop Business per l'utilizzo quotidiano in ufficio
Il Dell Latitude 5300 nel nostro test si rivela un solido compagno di lavoro quotidiano. Per gli utenti aziendali, le numerose funzioni di sicurezza e le opzioni di connettività sono particolarmente interessanti. Le possibilità di manutenzione e il buon funzionamento del sistema contribuiscono ad una buona impressione iniziale. I dispositivi di input non sono premium, ma comunque molto buoni.
Il Dell Latitude 5300 offre molte funzioni aziendali, ma non utilizza la batteria in modo ottimale.
Tuttavia, dobbiamo criticare la gestione del calore e la durata relativamente breve della batteria. Anche se il Latitude 5300 durerà un'intera giornata di lavoro senza alimentazione esterna, la dimensione della batteria dovrebbe consentire almeno due ore in più. Questo laptop aziendale è silenzioso nel funzionamento quotidiano grazie al suo controllo della ventola. D'altra parte, quando il carico è più pesante, le temperature salgono rapidamente in un intervallo critico e ci sono notevoli limitazioni delle frequenze di clock. Nel normale funzionamento dell'ufficio, tuttavia, questo non dovrebbe essere un problema.
Dell Latitude 5300
- 10/29/2019 v7 (old)
Mike Wobker