Recensione del Laptop Dell XPS 13 9310 Core i7: La differenza della Tiger Lake 11° Gen
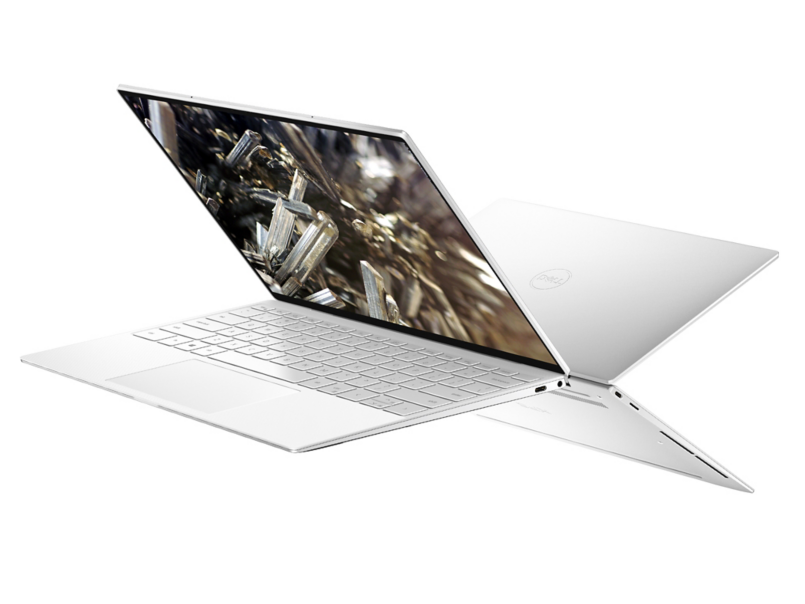
Il Dell XPS 13 9300 ha appena un anno di vita e il suo successore è già disponibile. Chiamato XPS 13 9310, il modello più recente sostituisce la CPU Intel Ice Lake di decima generazione con le opzioni Tiger Lake di undicesima generazione, oltre a velocità di clock di memoria più elevate. Per il resto, l'XPS 13 9310 è esteticamente identico al suo diretto predecessore.
Per questa recensione, confronteremo le prestazioni del 9310 con quelle del 9300 per vedere quanto guadagno gli utenti possono aspettarsi e come le temperature, l'autonomia, la qualità del display o il consumo di energia possono essere diversi tra loro - se del caso. Maggiori informazioni sullo chassis e su altre caratteristiche fisiche possono essere trovate qui sulla nostra recensione dell'XPS 13 9300.
Altre recensioni Dell:
Punteggio | Data | Modello | Peso | Altezza | Dimensione | Risoluzione | Prezzo |
|---|---|---|---|---|---|---|---|
| 88.1 % v7 (old) | 10/2020 | Dell XPS 13 9310 Core i7 FHD i7-1165G7, Iris Xe G7 96EUs | 1.3 kg | 14.8 mm | 13.40" | 1920x1200 | |
| 88.9 % v7 (old) | 03/2020 | Dell XPS 13 9300 Core i7-1065G7 i7-1065G7, Iris Plus Graphics G7 (Ice Lake 64 EU) | 1.2 kg | 14.8 mm | 13.40" | 1920x1200 | |
| 92.1 % v7 (old) | 06/2020 | Apple MacBook Pro 13 2020 2GHz i5 10th-Gen i5-1038NG7, Iris Plus Graphics G7 (Ice Lake 64 EU) | 1.4 kg | 15.6 mm | 13.30" | 2560x1600 | |
| 87.4 % v7 (old) | 06/2020 | Huawei MateBook X Pro 2020 i7 i7-10510U, GeForce MX250 | 1.3 kg | 14.6 mm | 13.90" | 3000x2000 | |
| 85.3 % v7 (old) | 09/2020 | Lenovo Yoga Slim 7-14ARE R7 4800U, Vega 8 | 1.4 kg | 14.9 mm | 14.00" | 1920x1080 | |
| 88.4 % v7 (old) | 12/2019 | HP Spectre x360 13-aw0013dx i7-1065G7, Iris Plus Graphics G7 (Ice Lake 64 EU) | 1.2 kg | 16.9 mm | 13.30" | 1920x1080 |
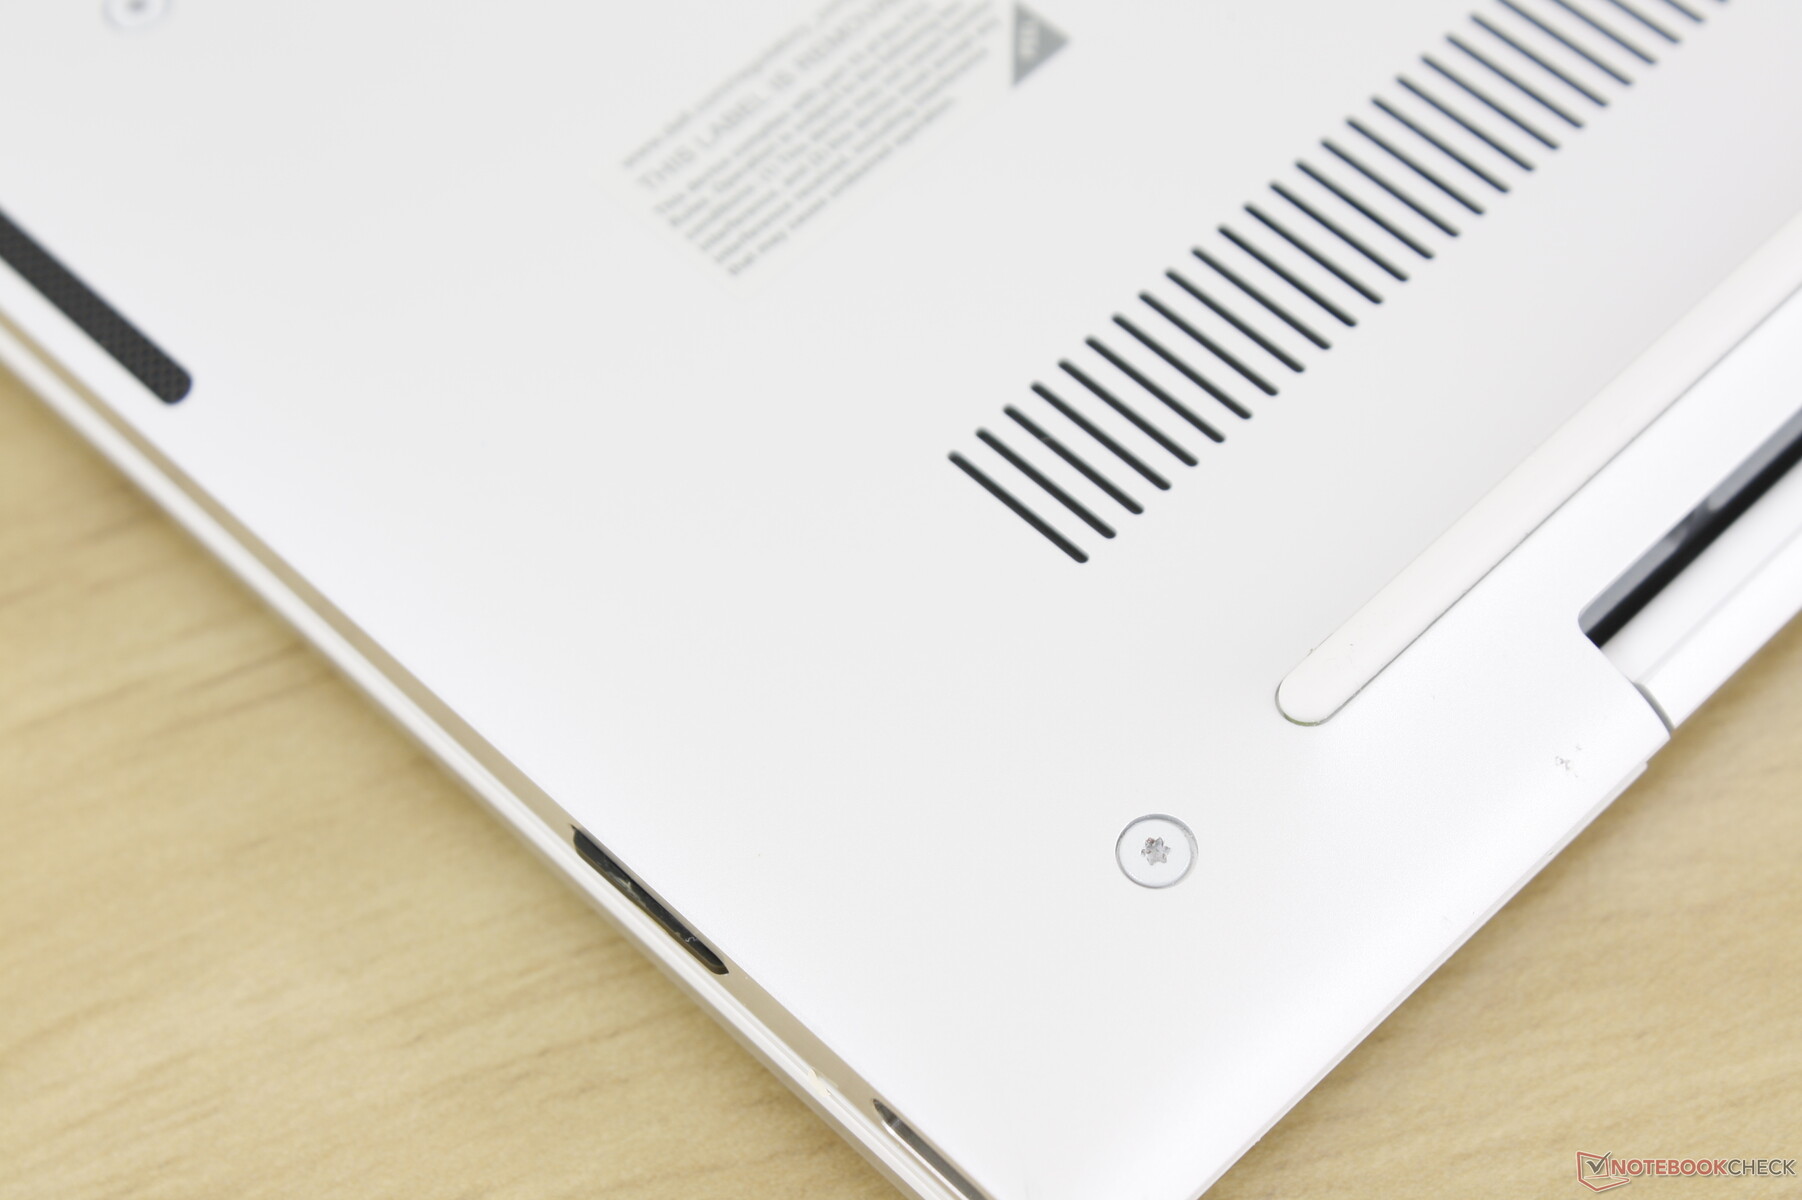
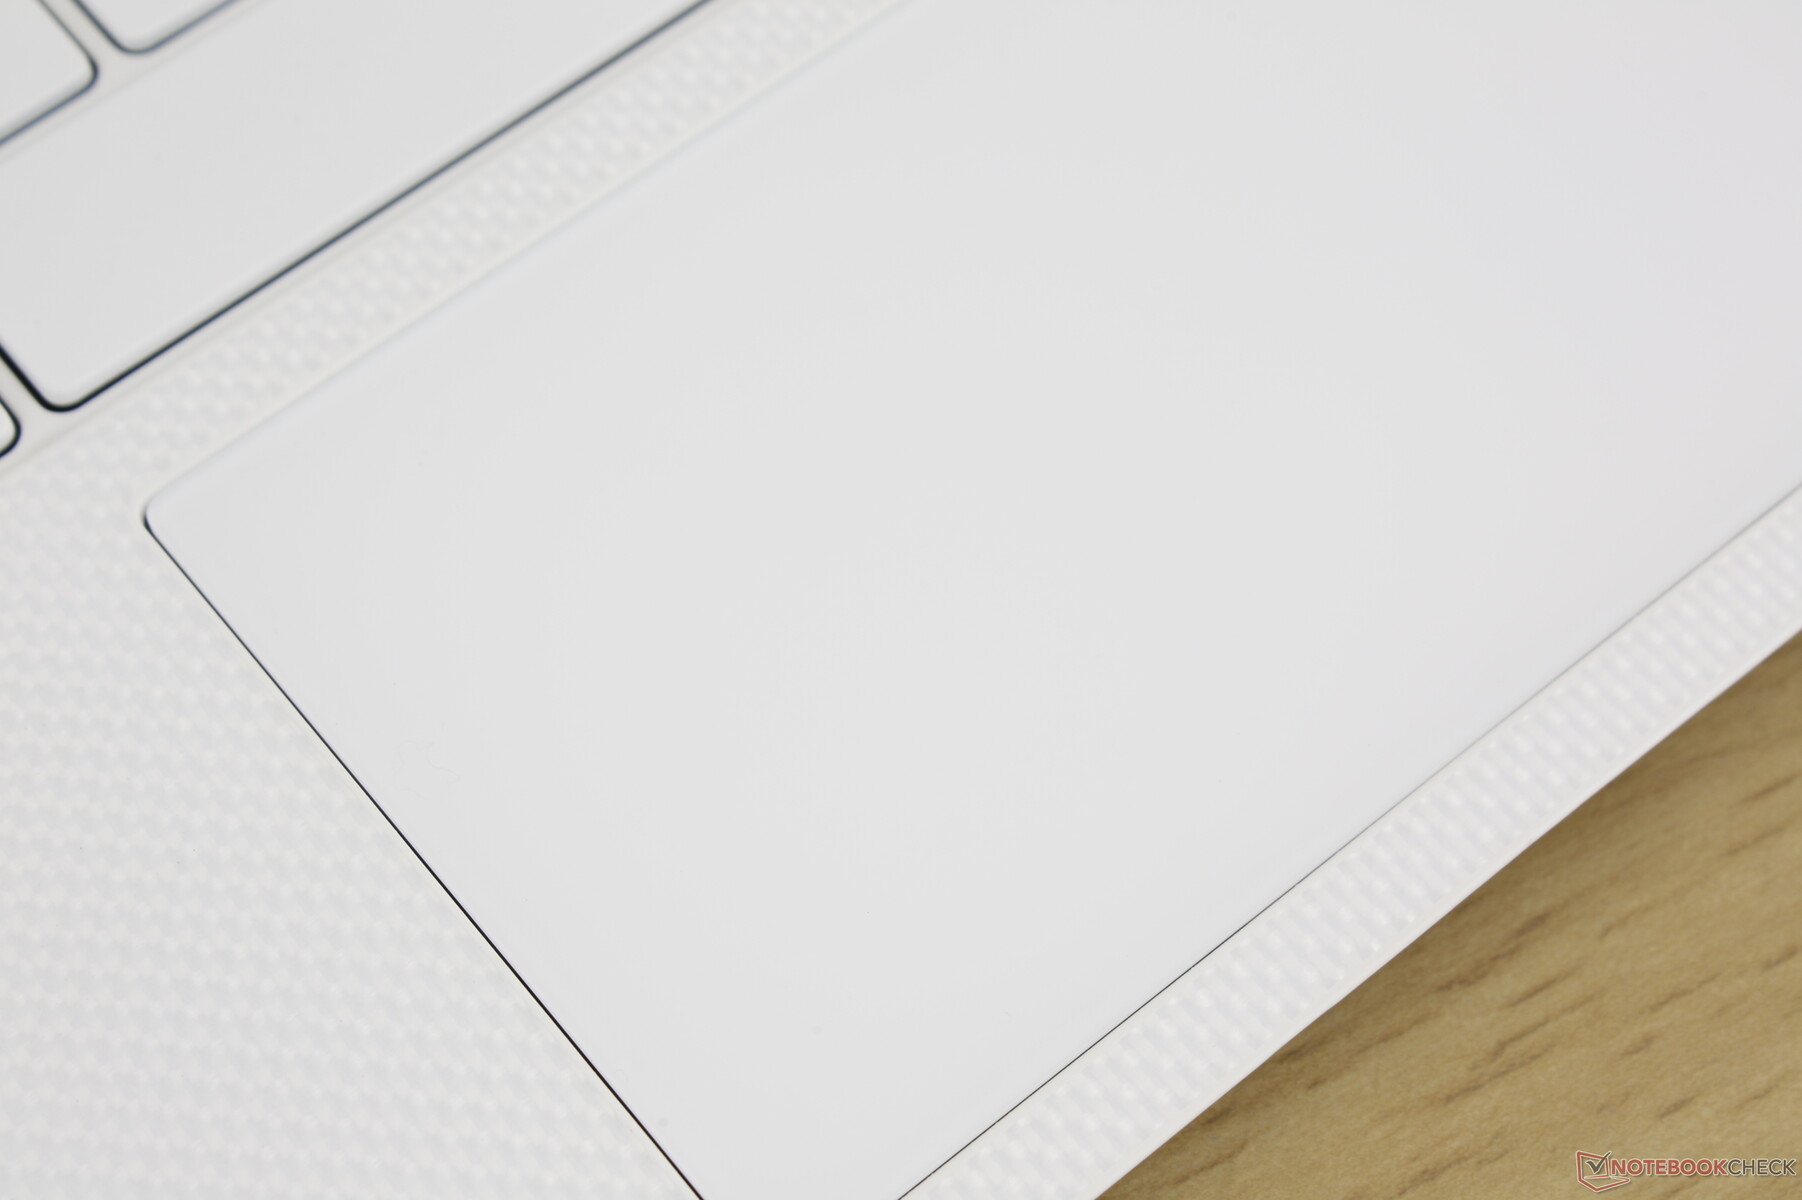
Case
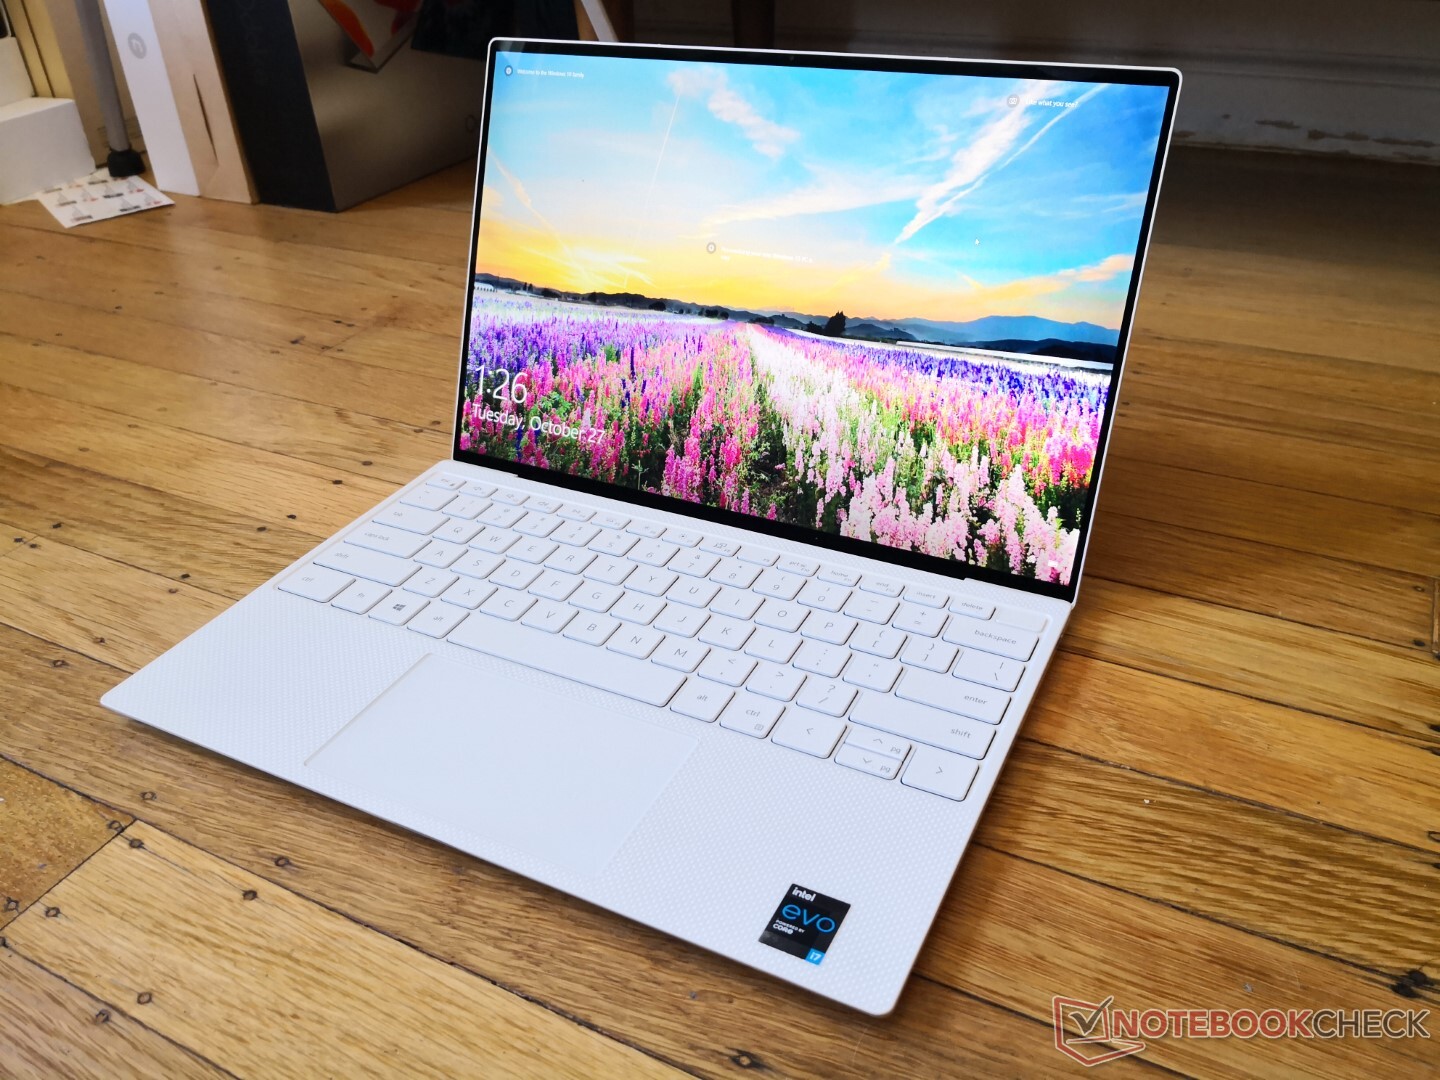
Dell ha introdotto l'attuale design 16:10 XPS 13 all'inizio di quest'anno con l'XPS 13 9300 e quindi l'XPS 13 9310 è ancora relativamente nuovo anche se non ci sono grandi aggiornamenti estetici. Forse la cosa più importante è che è tornata l'opzione di colore bianco intrecciato in vetro della vecchia serie 16:9 XPS 13, mentre l'XPS 9300 era disponibile solo in nero. Il fascino principale dell'opzione bianca è per lo più estetico, così l'antiestetico accumulo di ditate non sarà così evidente.
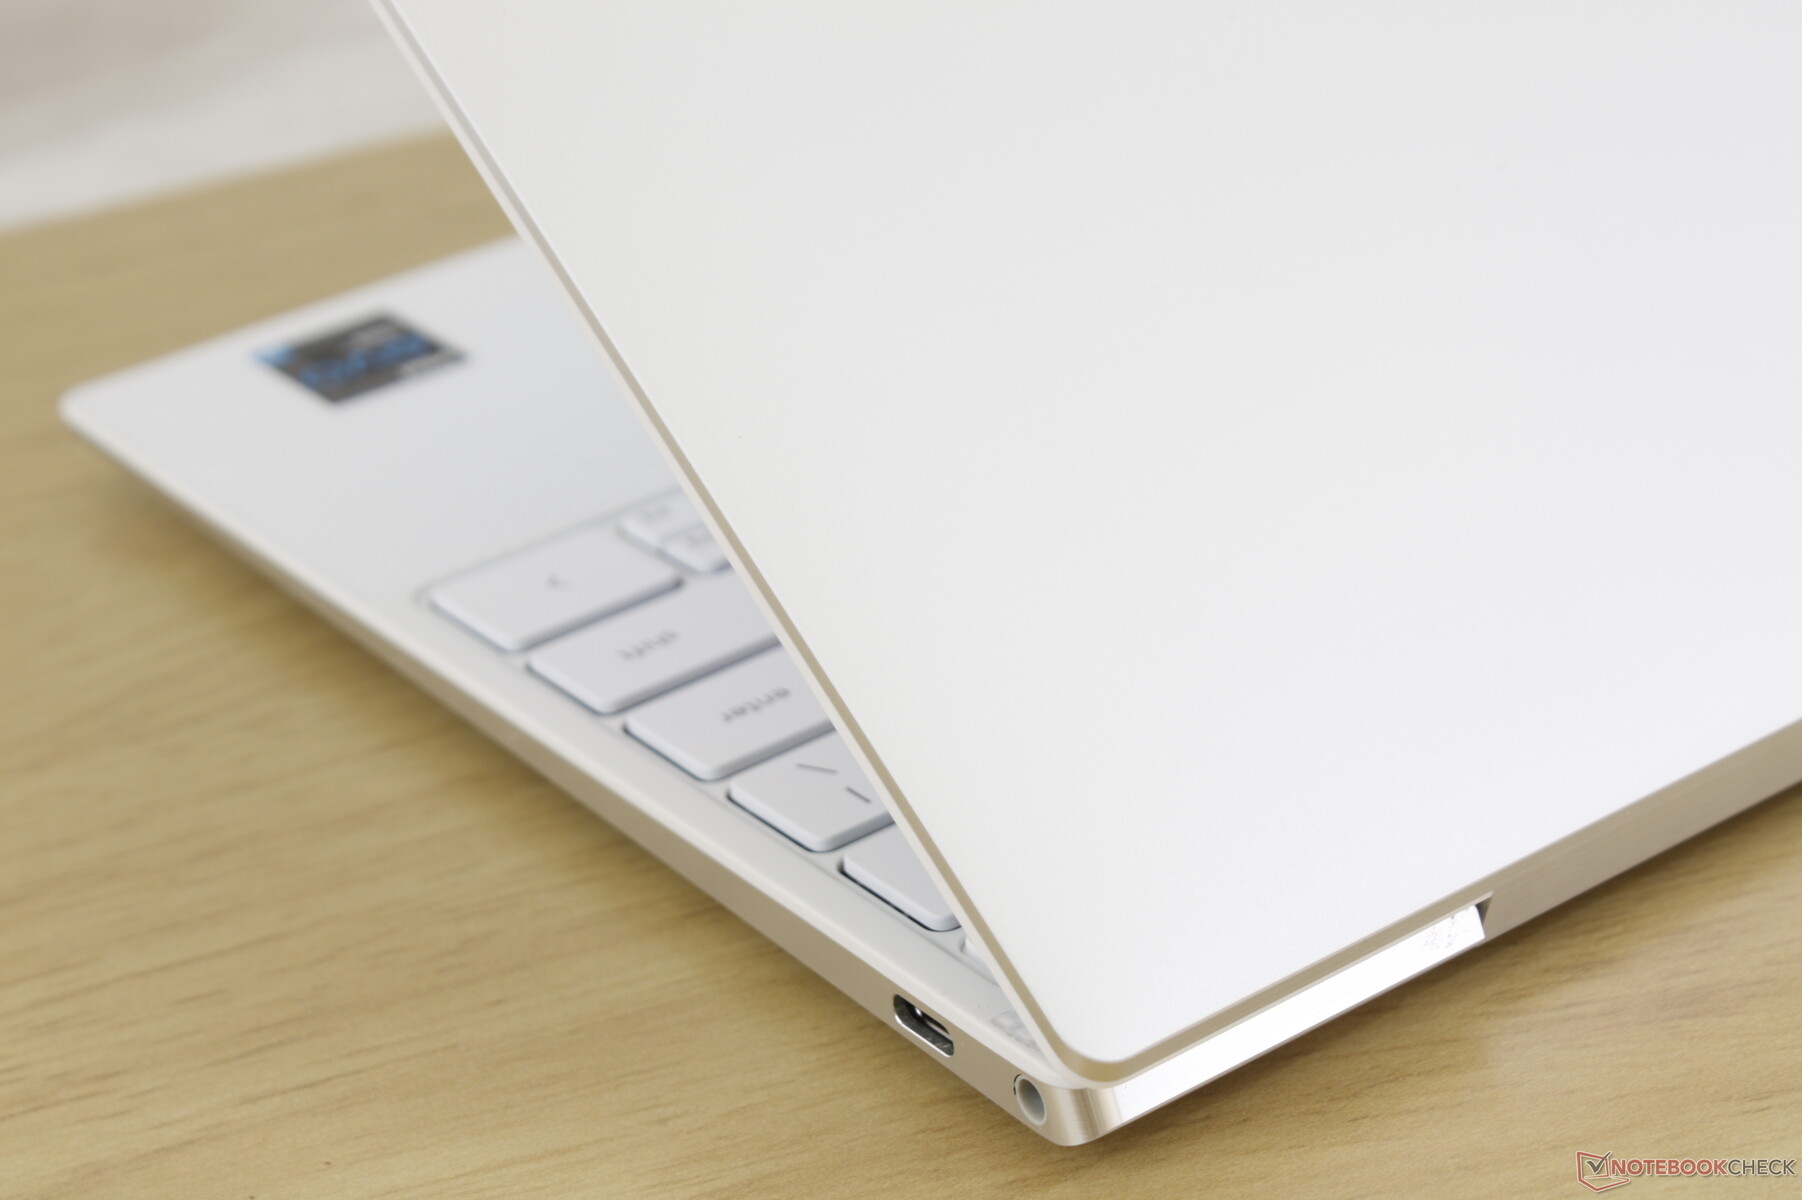
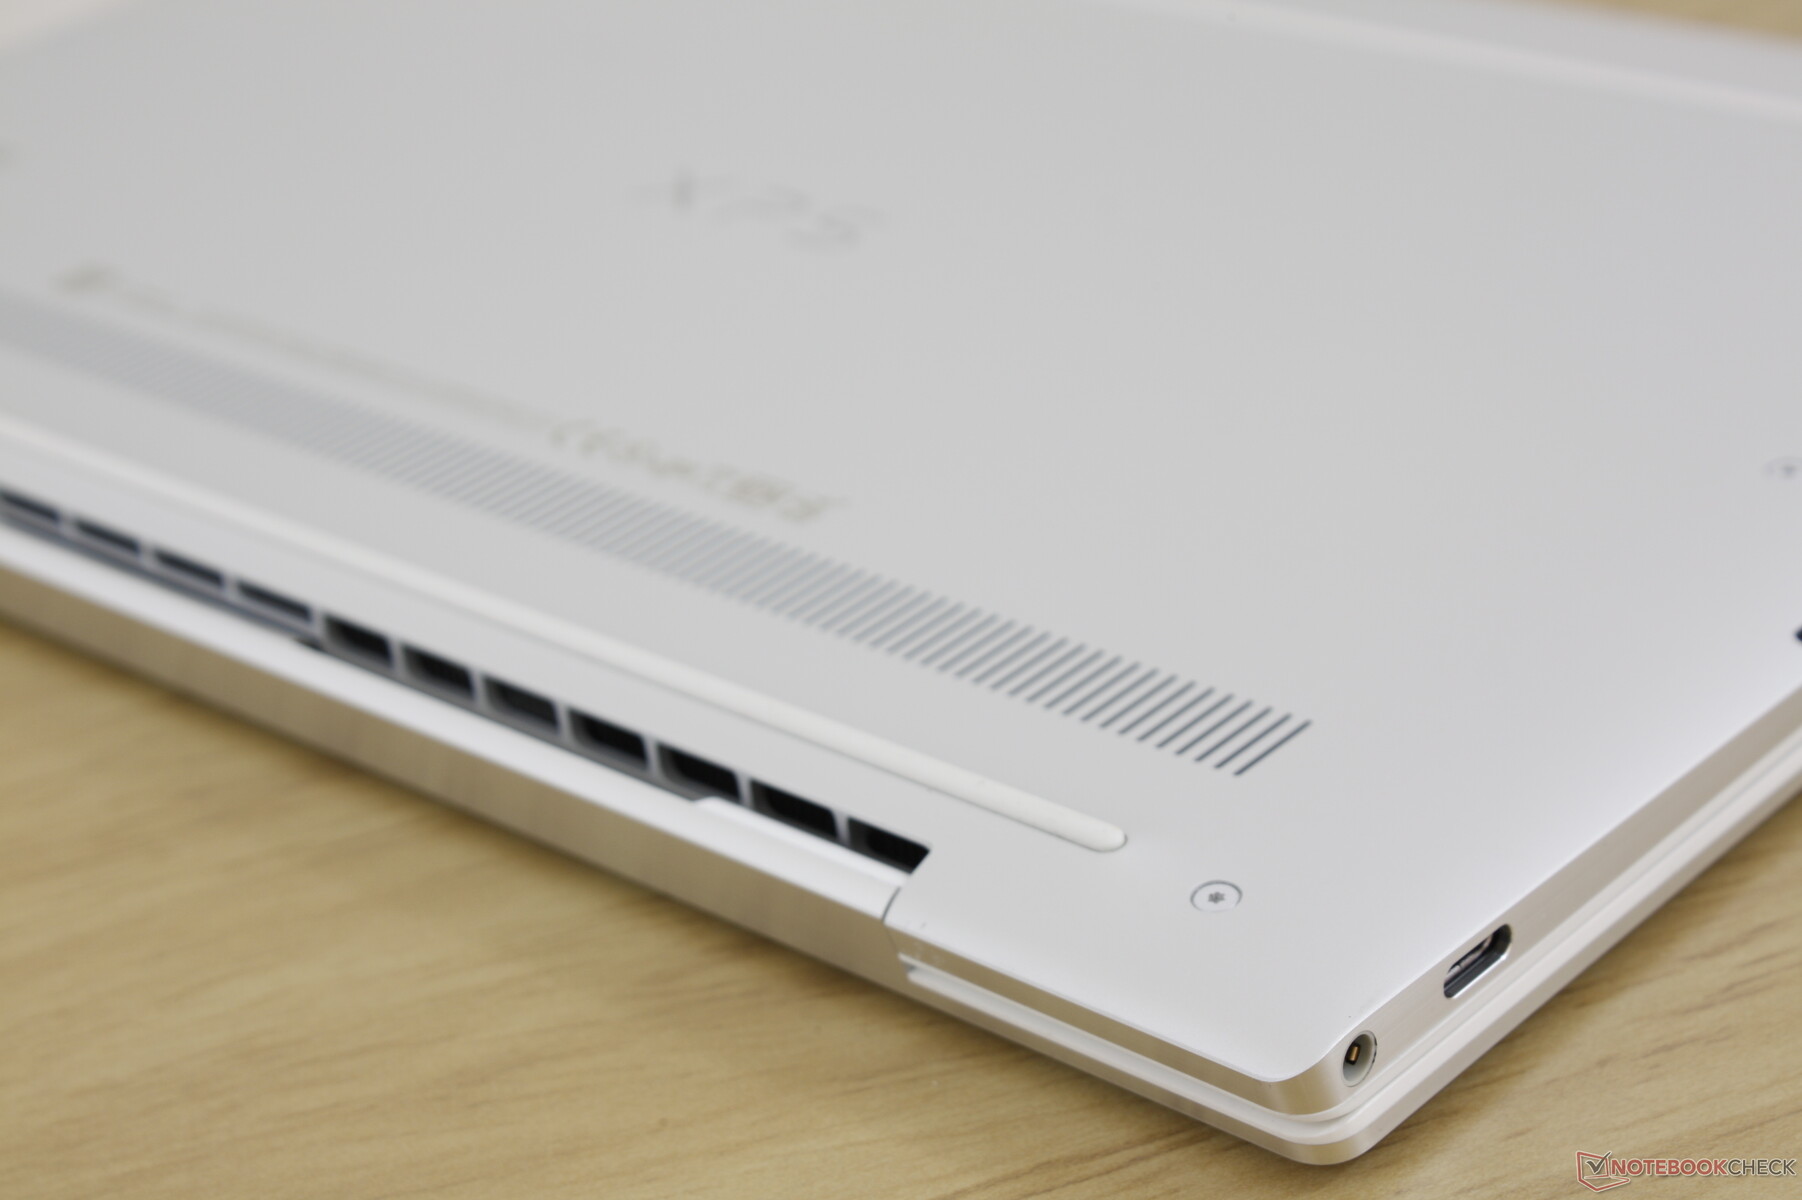
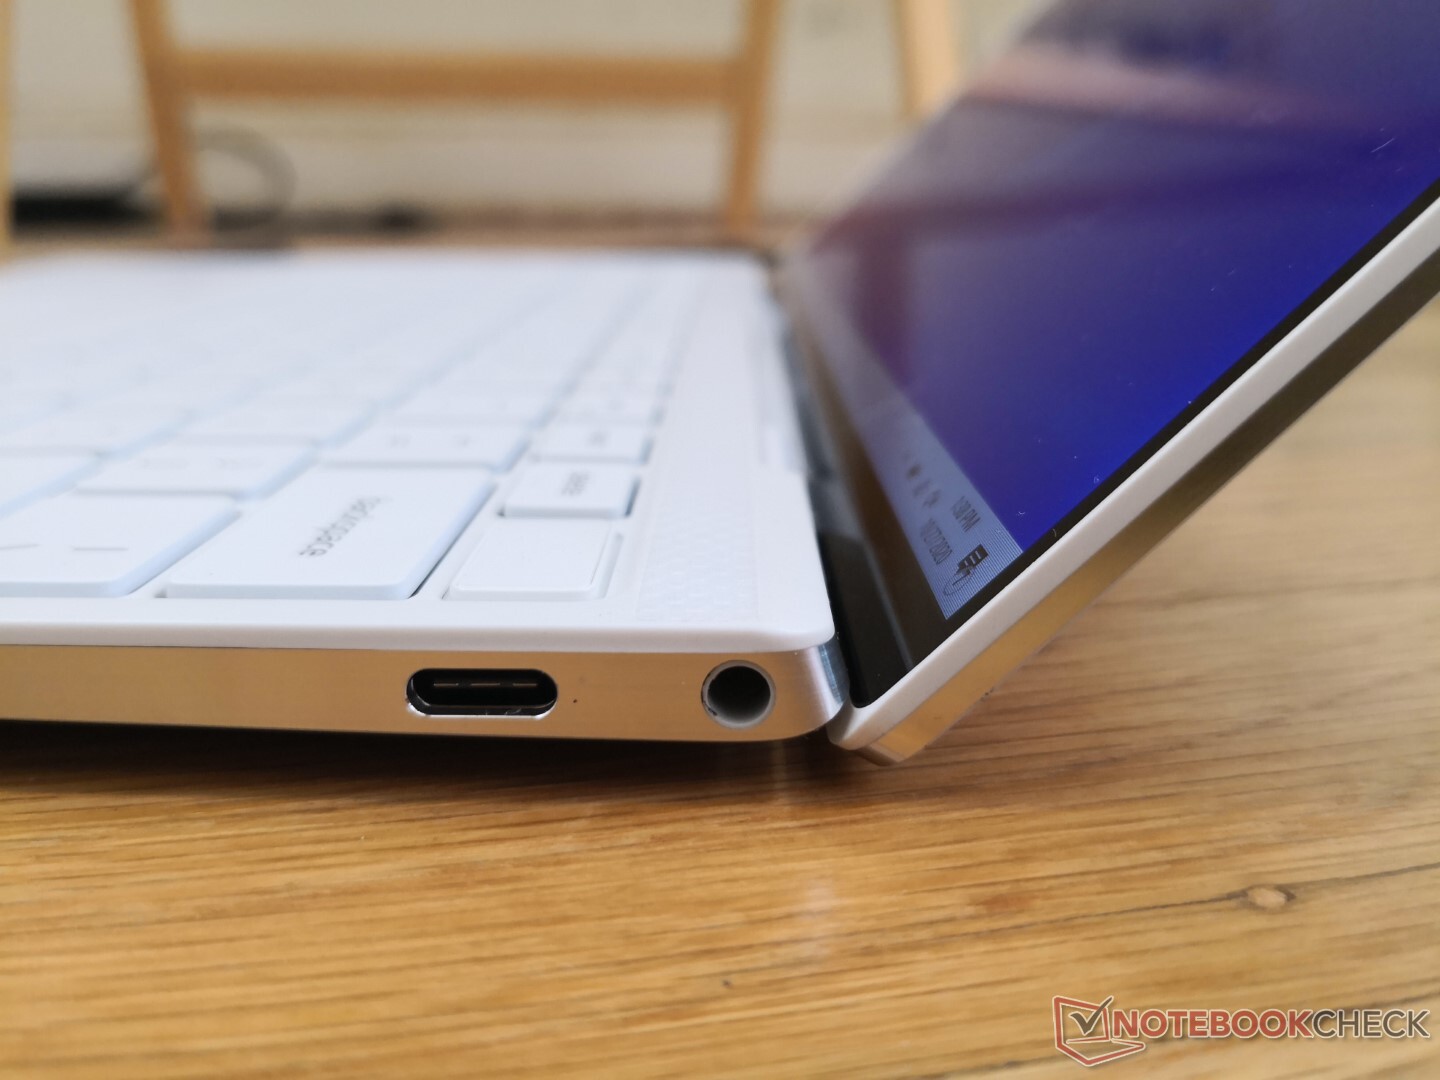
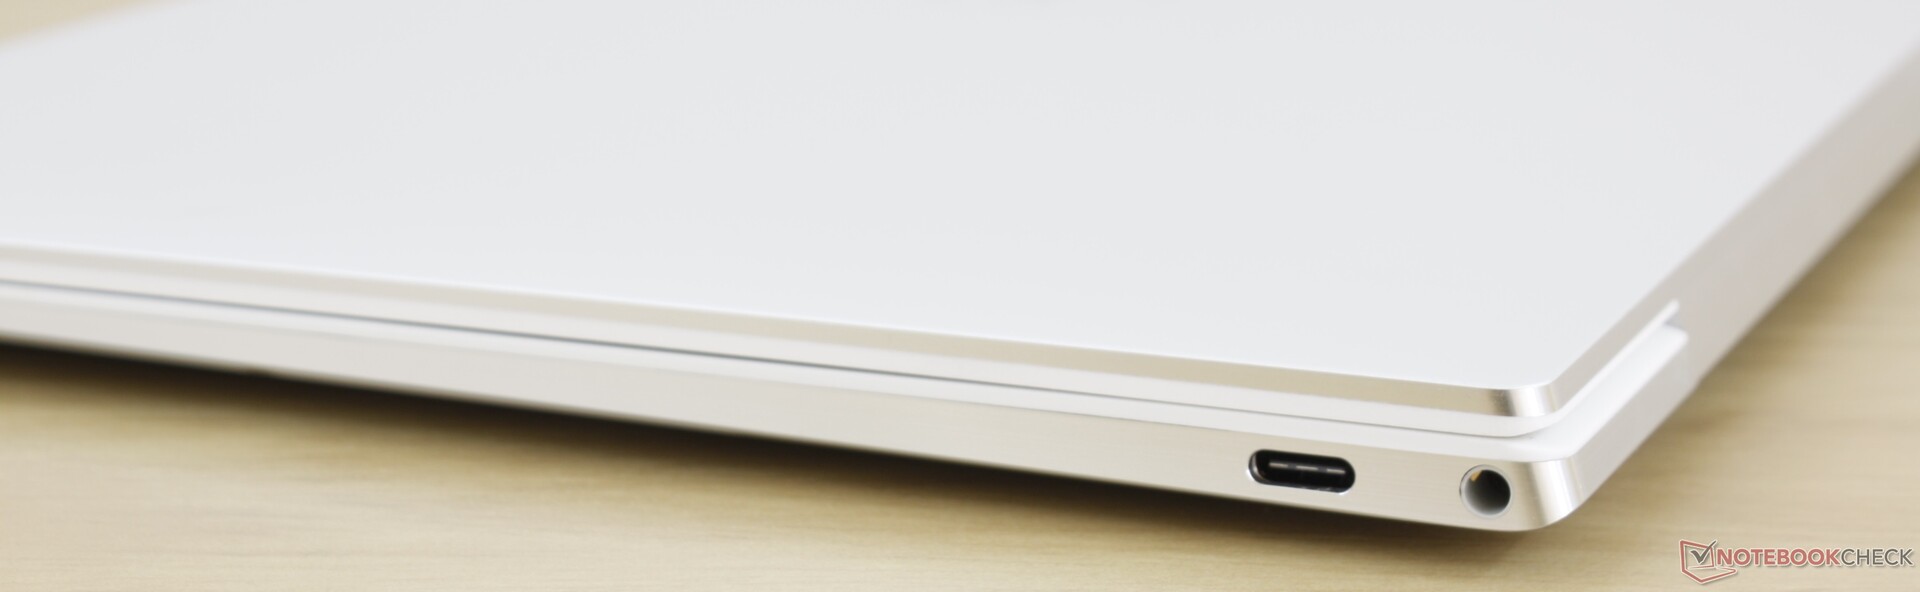
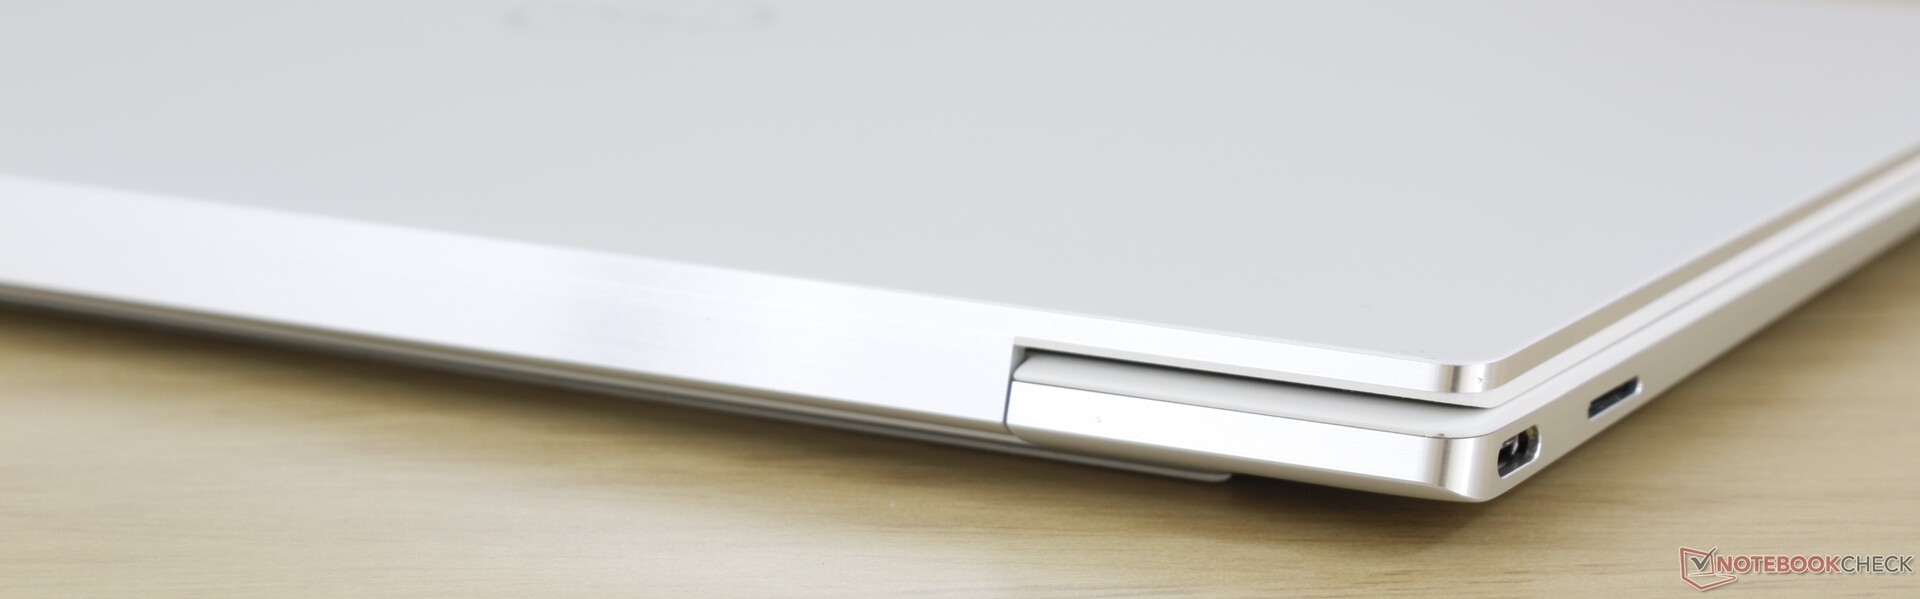
Connessioni

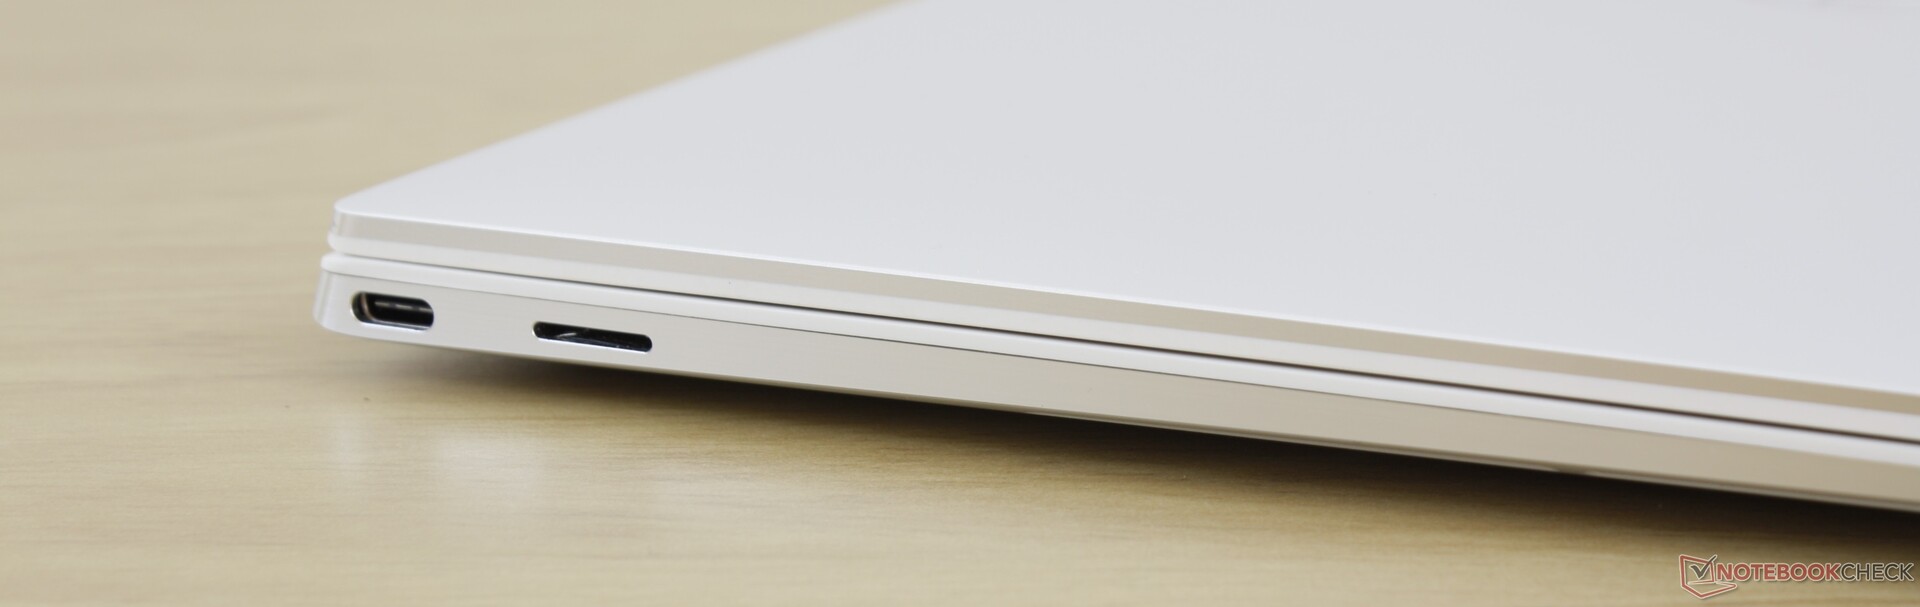
Lettore Schede SD
| SD Card Reader | |
| average JPG Copy Test (av. of 3 runs) | |
| Dell XPS 13 9310 Core i7 FHD (Toshiba Exceria Pro M501 64 GB UHS-II) | |
| HP Spectre x360 13-aw0013dx (Toshiba Exceria Pro M501 microSDXC 64GB) | |
| Dell XPS 13 9300 Core i7-1065G7 (Toshiba Exceria Pro M501 64 GB UHS-II) | |
| Lenovo Yoga Slim 7-14ARE (Toshiba Exceria Pro M501 64 GB UHS-II) | |
| maximum AS SSD Seq Read Test (1GB) | |
| Dell XPS 13 9310 Core i7 FHD (Toshiba Exceria Pro M501 64 GB UHS-II) | |
| Dell XPS 13 9300 Core i7-1065G7 (Toshiba Exceria Pro M501 64 GB UHS-II) | |
| HP Spectre x360 13-aw0013dx (Toshiba Exceria Pro M501 microSDXC 64GB) | |
| Lenovo Yoga Slim 7-14ARE (Toshiba Exceria Pro M501 64 GB UHS-II) | |
Comunicazioni
L'Intel Killer AX1650s viene fornito di serie ancora una volta per la connessione Wi-Fi 6 e Bluetooth 5.1. Anche se non abbiamo avuto problemi di connessione quando ci siamo collegati al nostro router Netgear RAX200, le velocità di trasmissione non sono così elevate come le velocità di ricezione per un secondo anno di fila.
Webcam


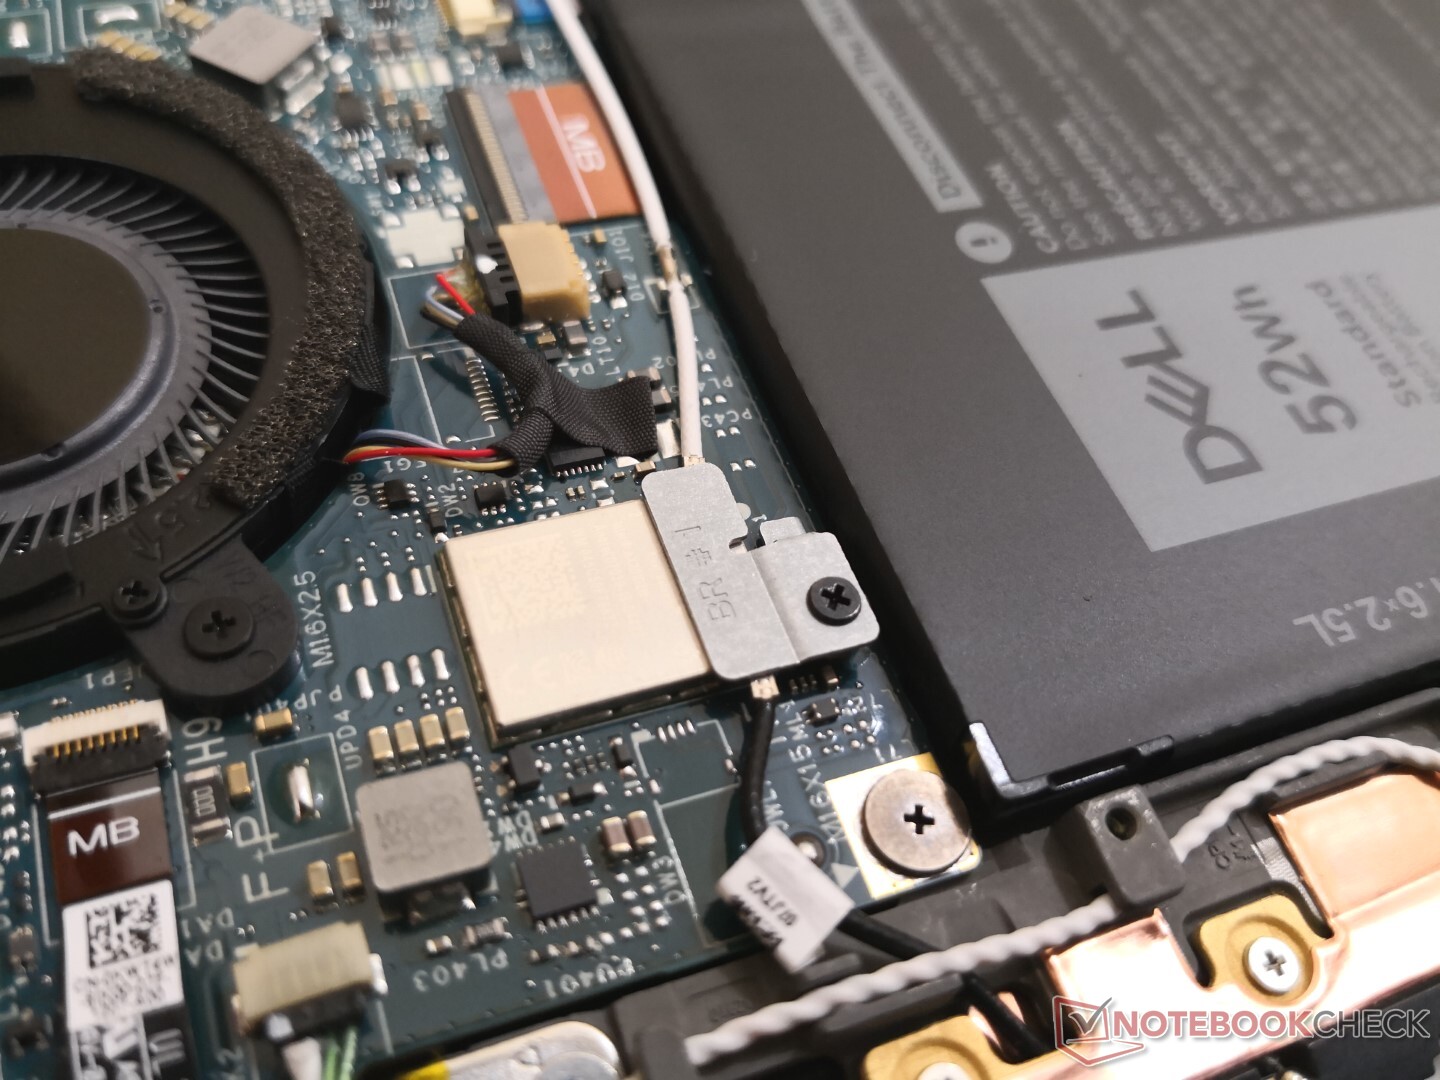
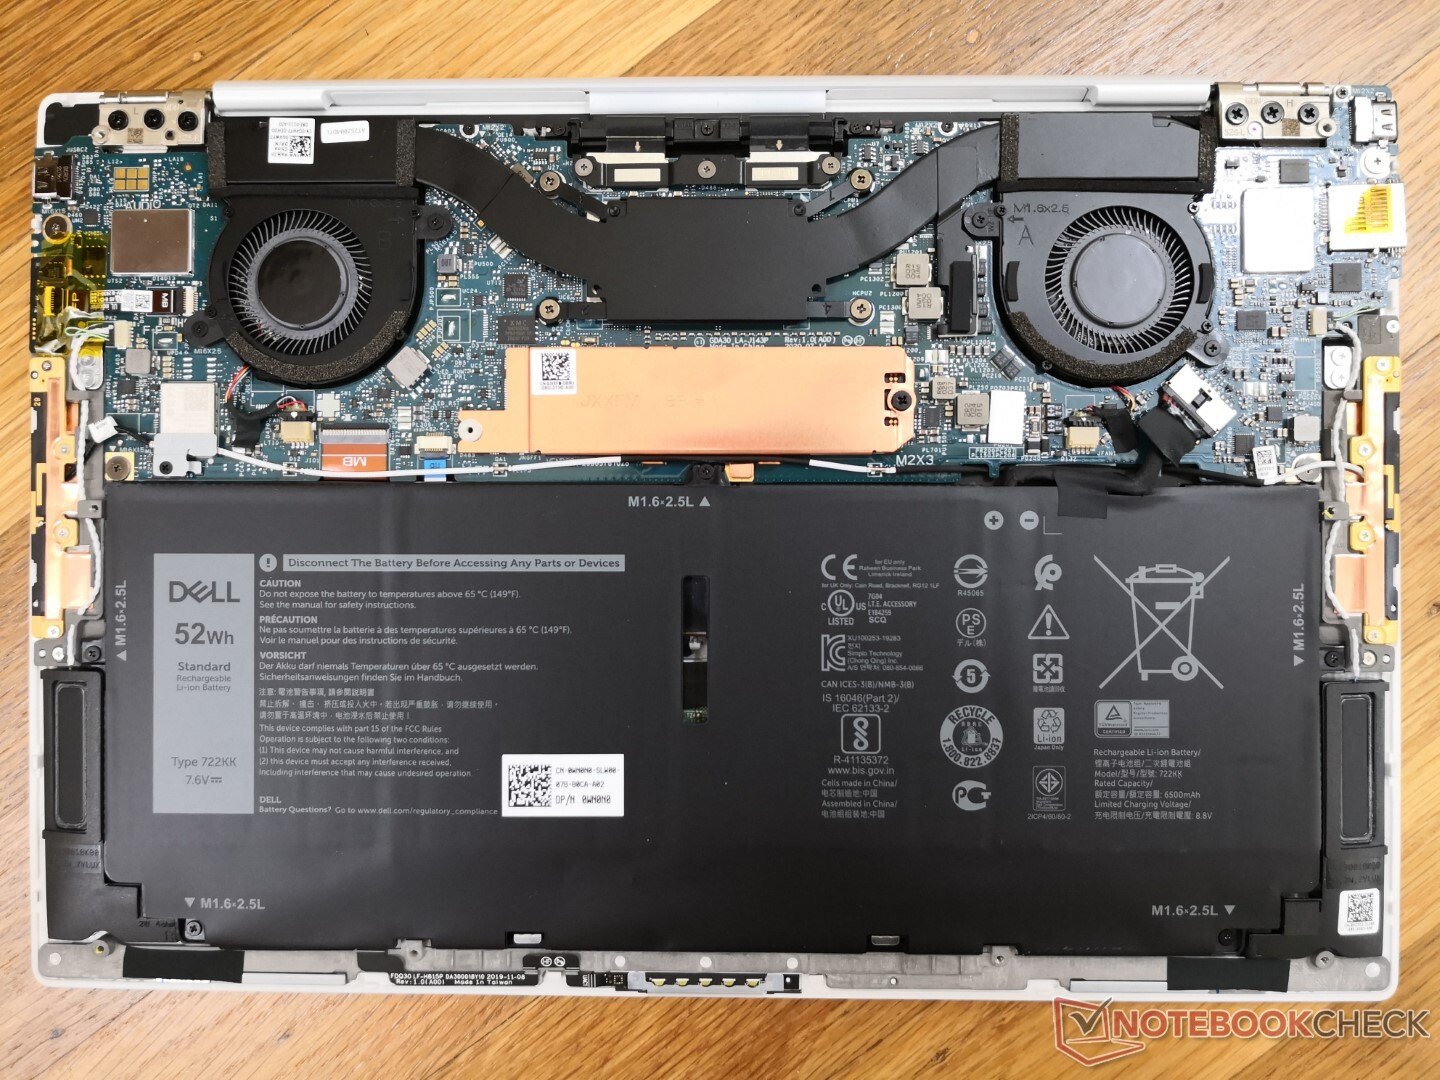
Manutenzione
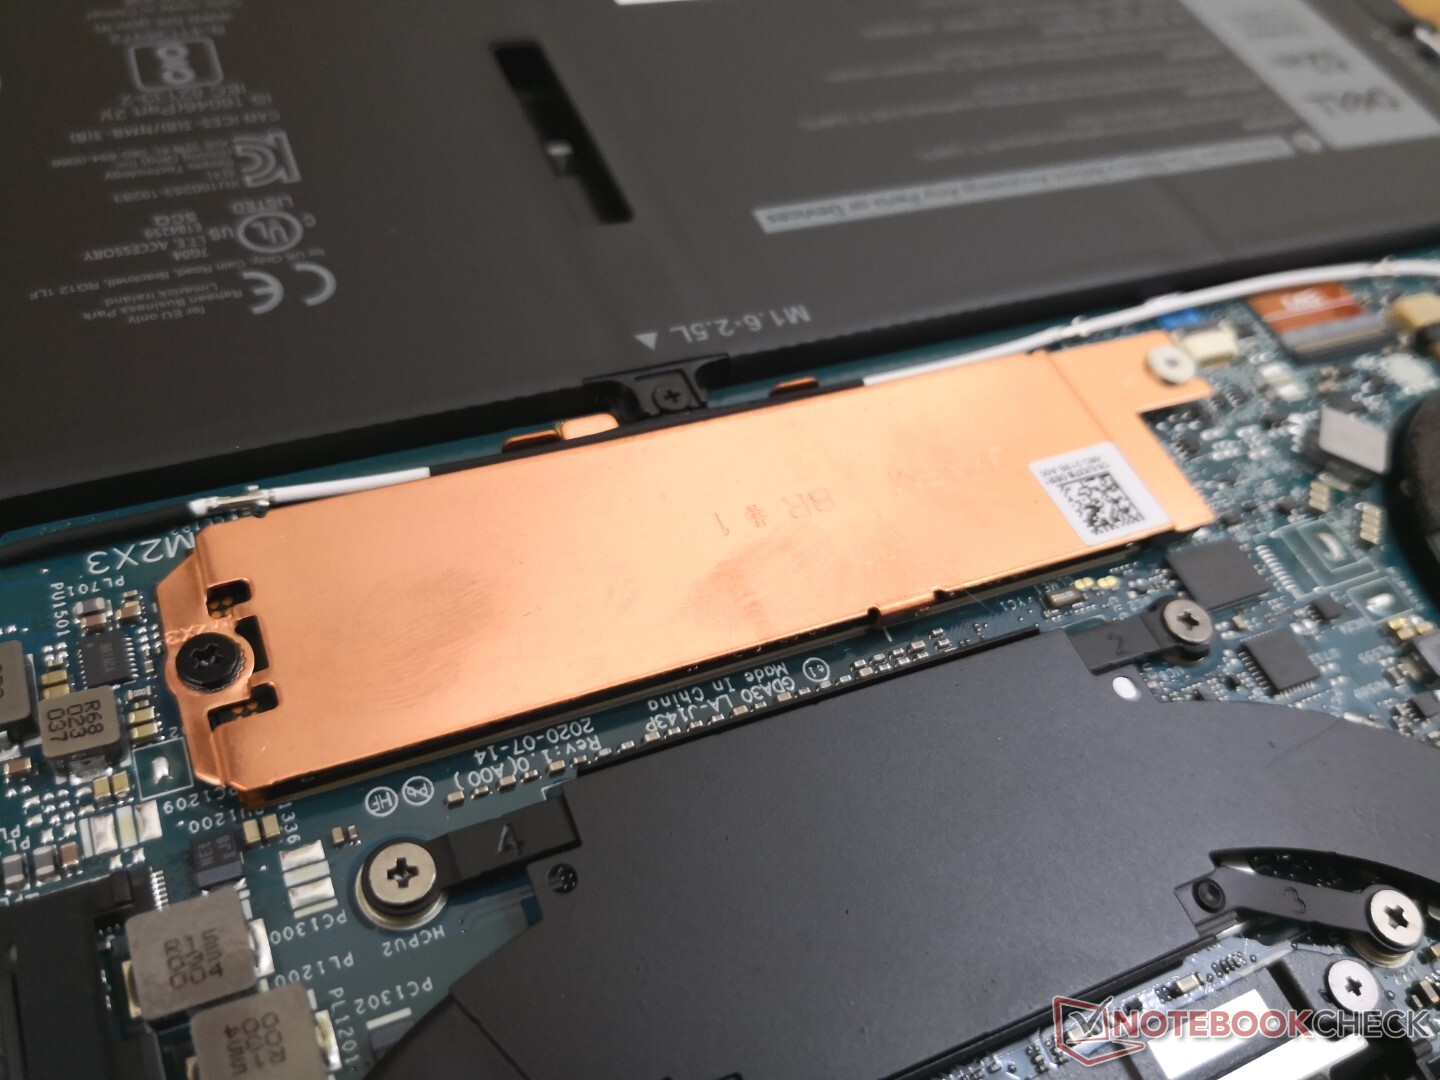
Nessuna modifica importante all'interno del sistema
Accessori
La confezione include un adattatore da USB-C a USB-A e un pratico adattatore per cavi di alimentazione, in modo da non dover portare con sé un cavo di alimentazione a due o tre poli negli spostamenti.
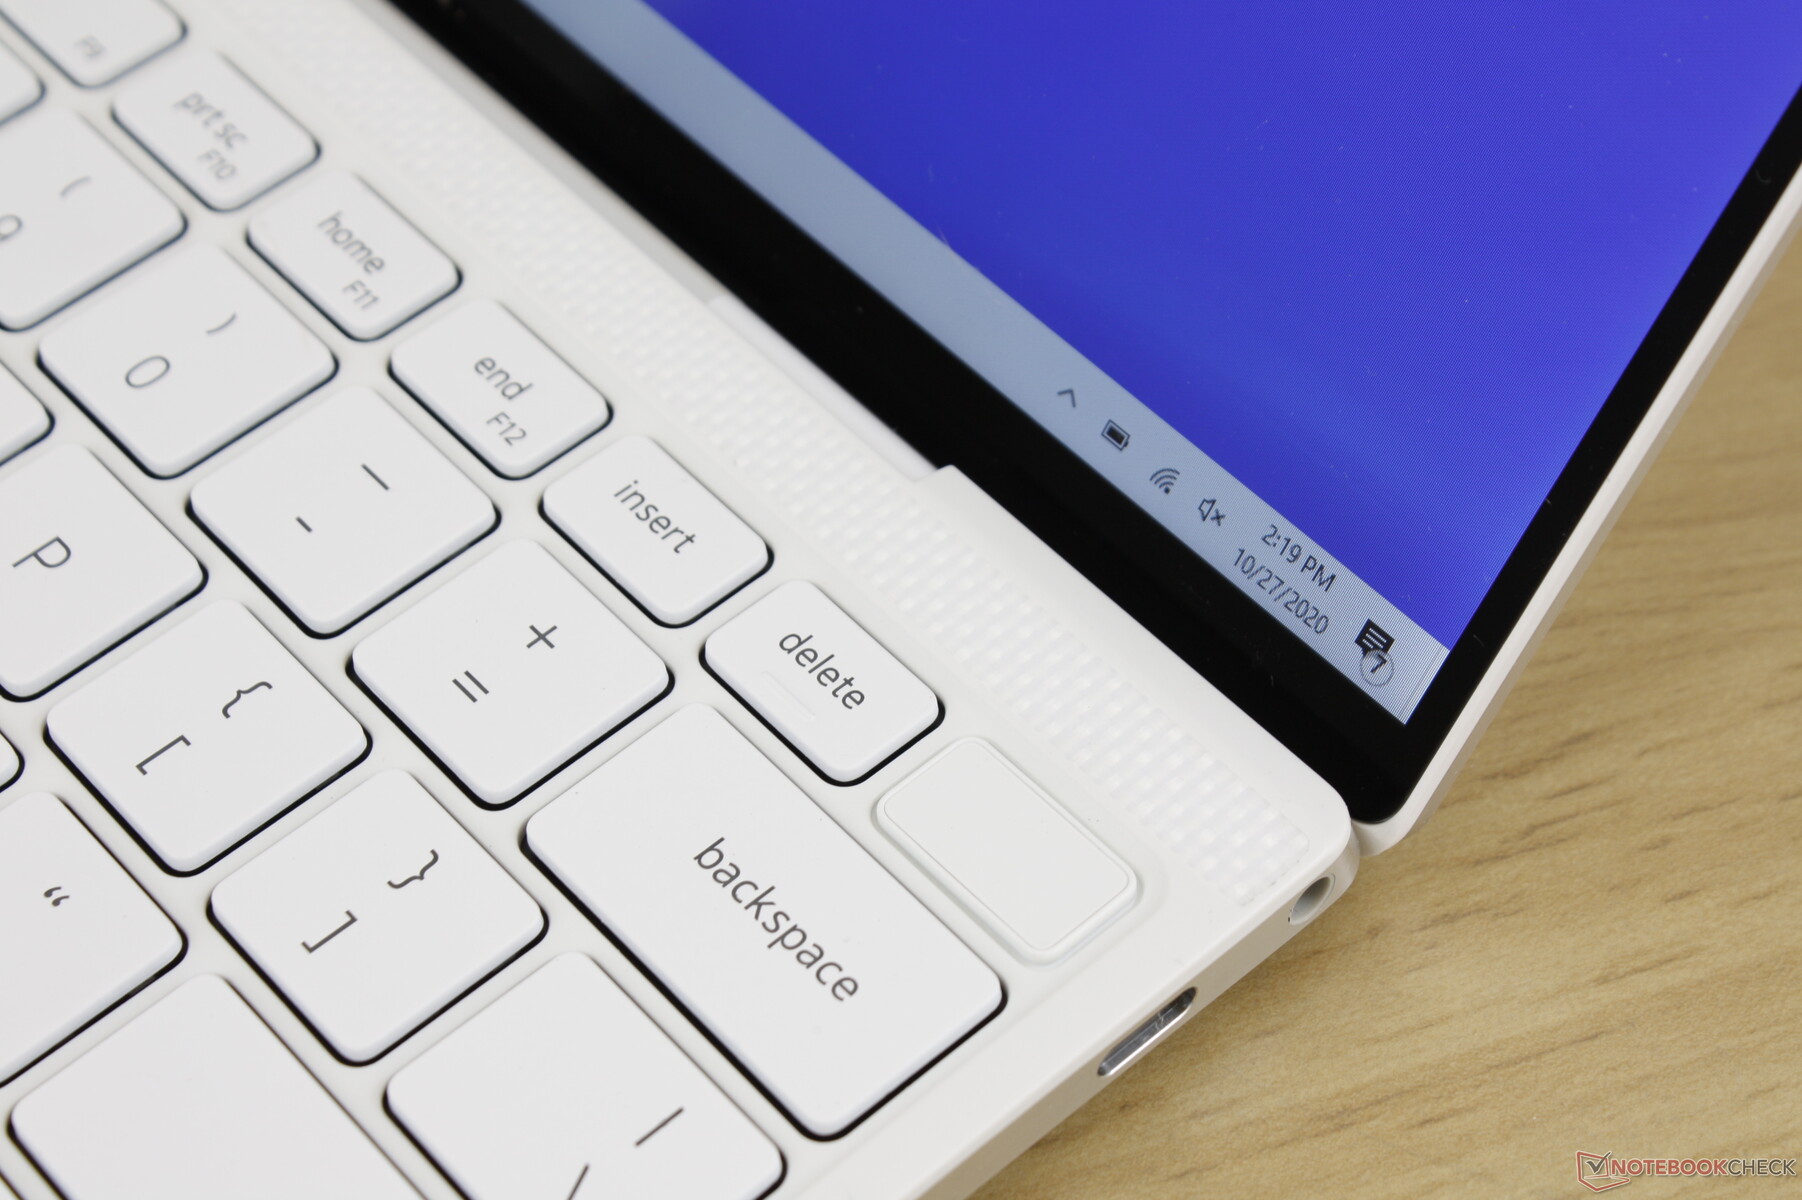
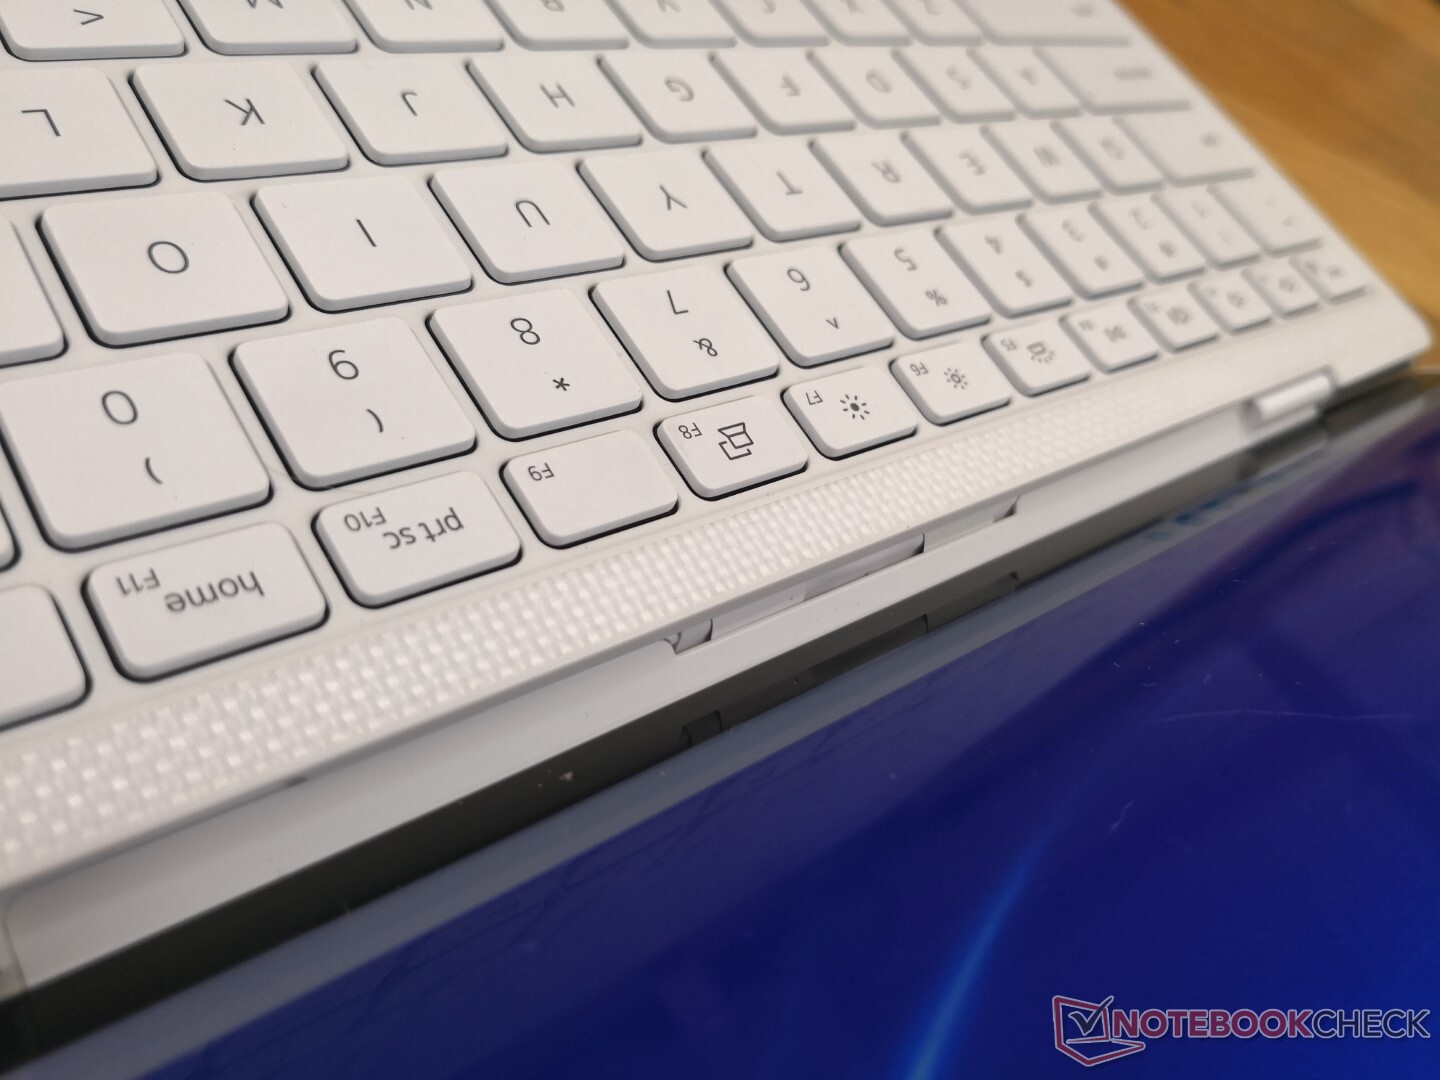
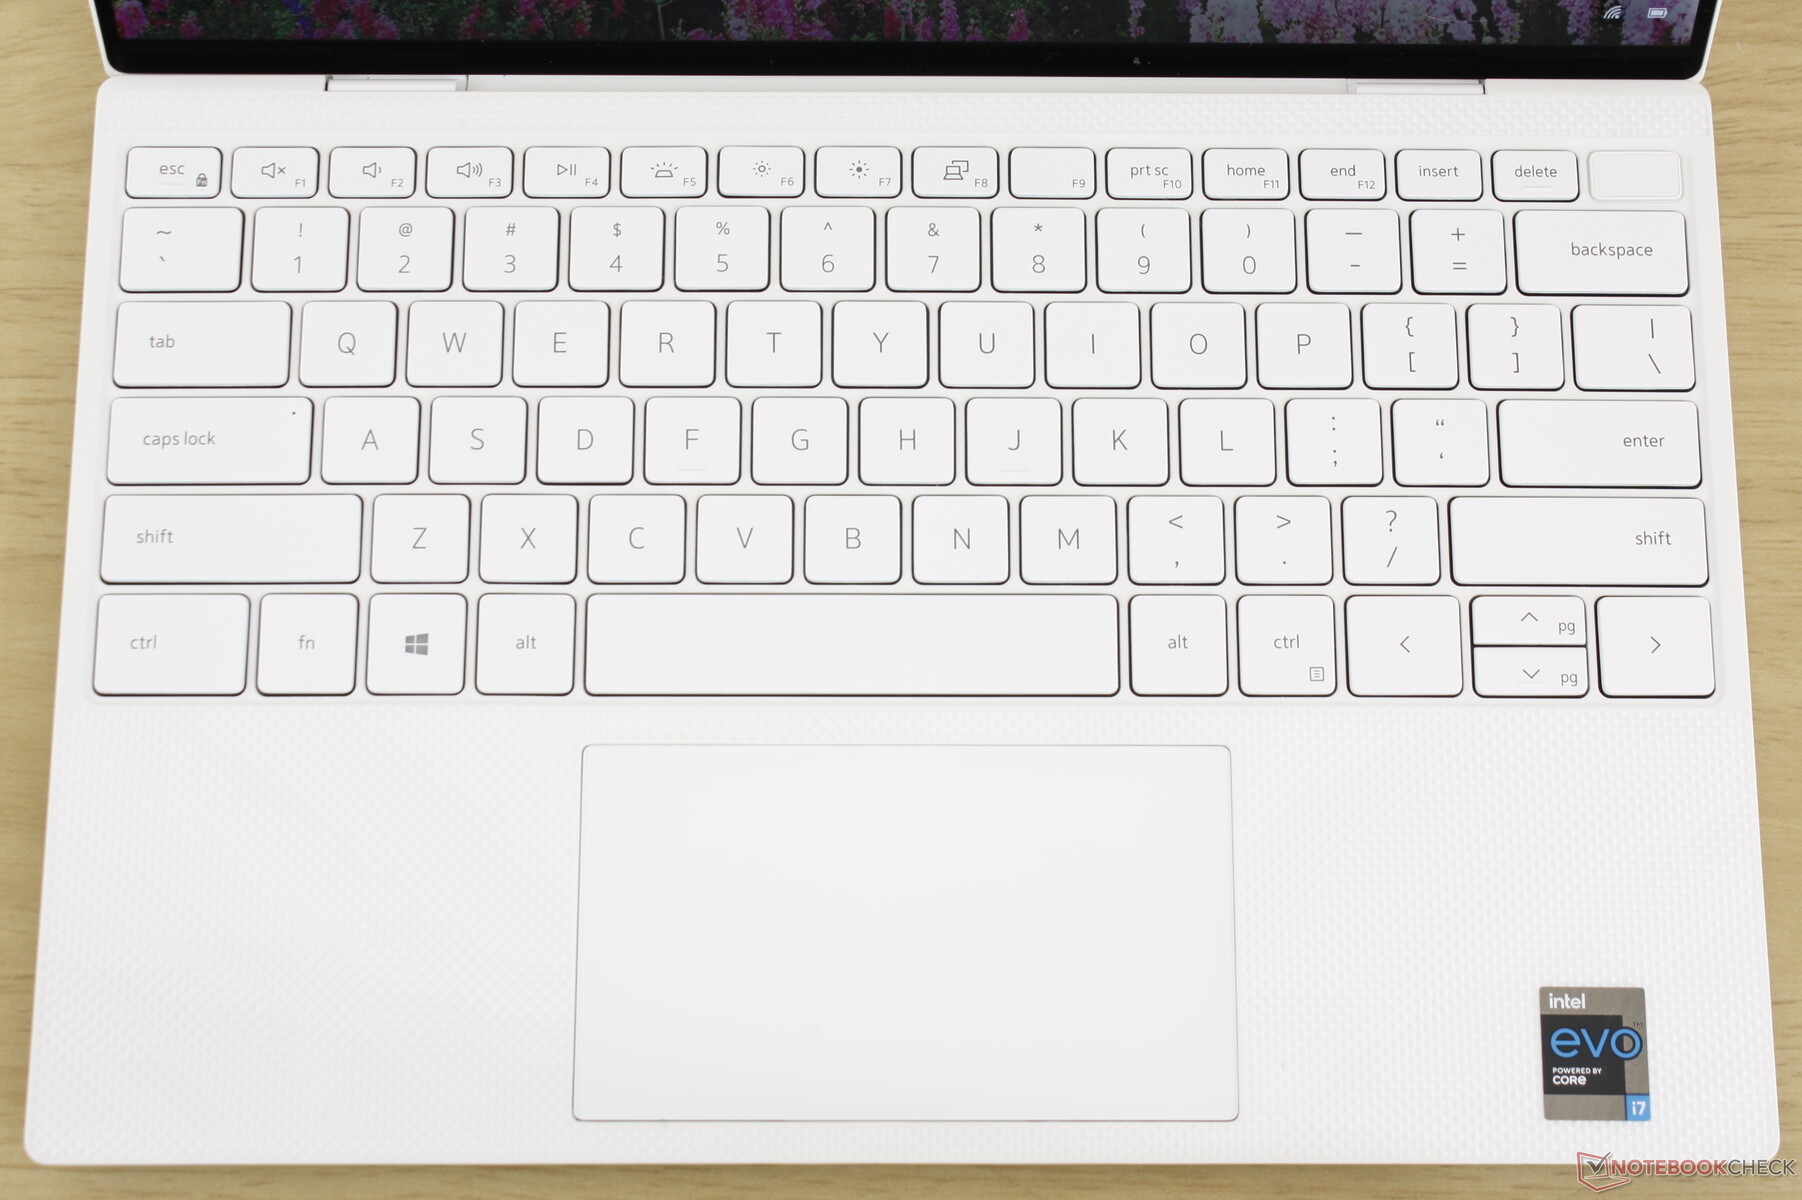
Dispositivi Input


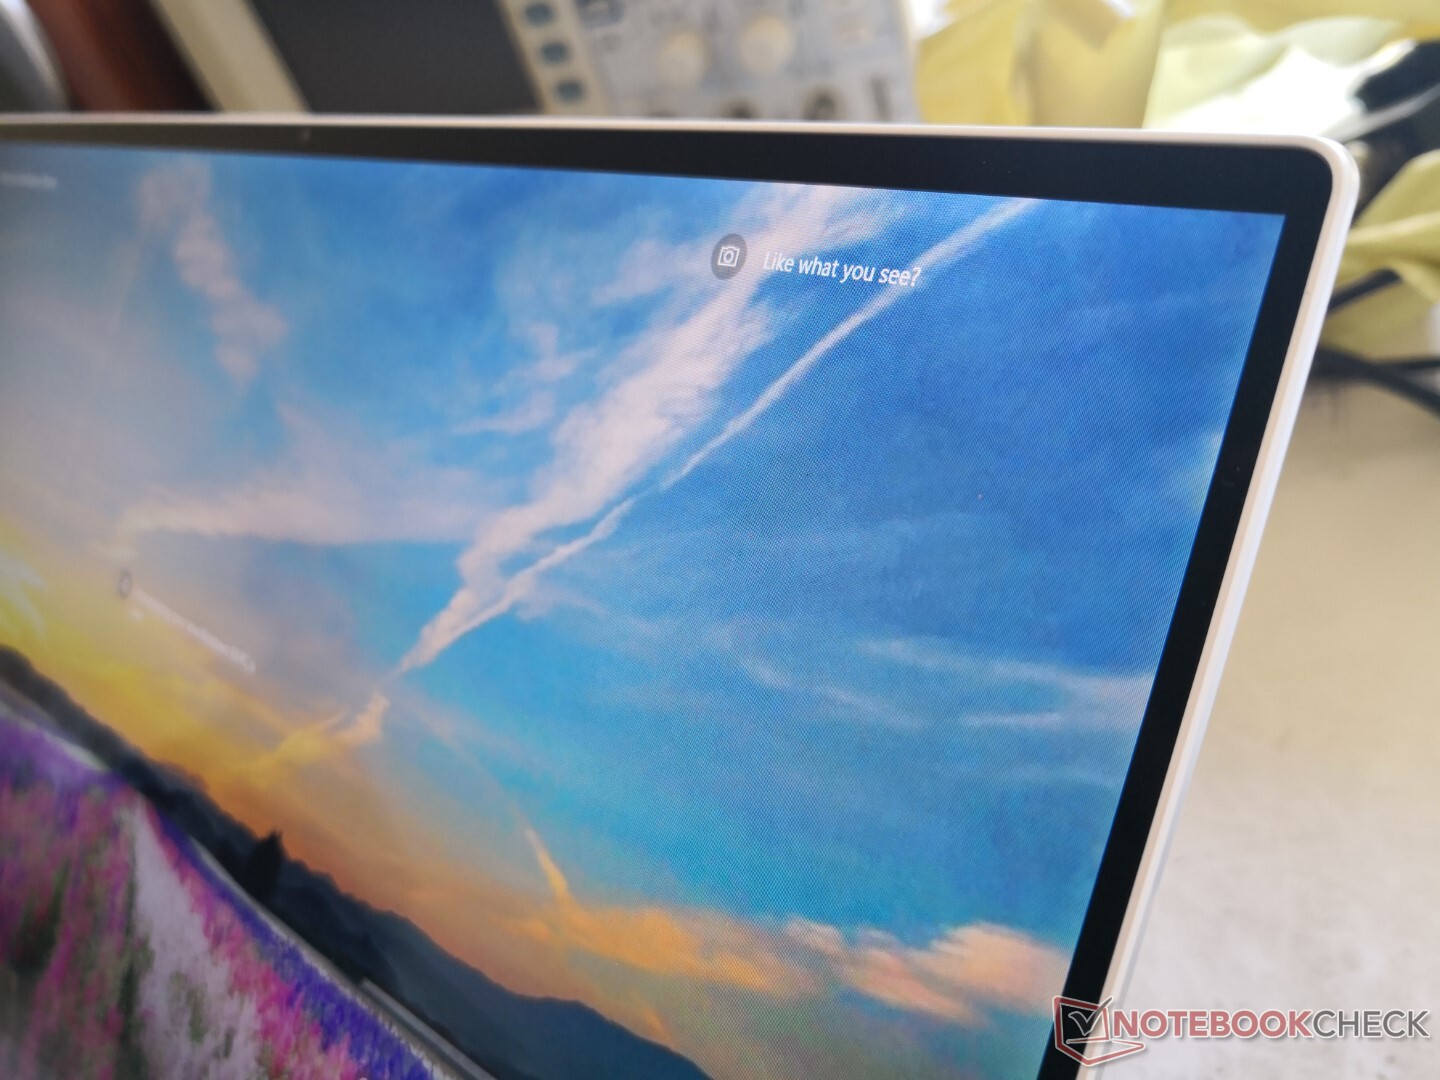
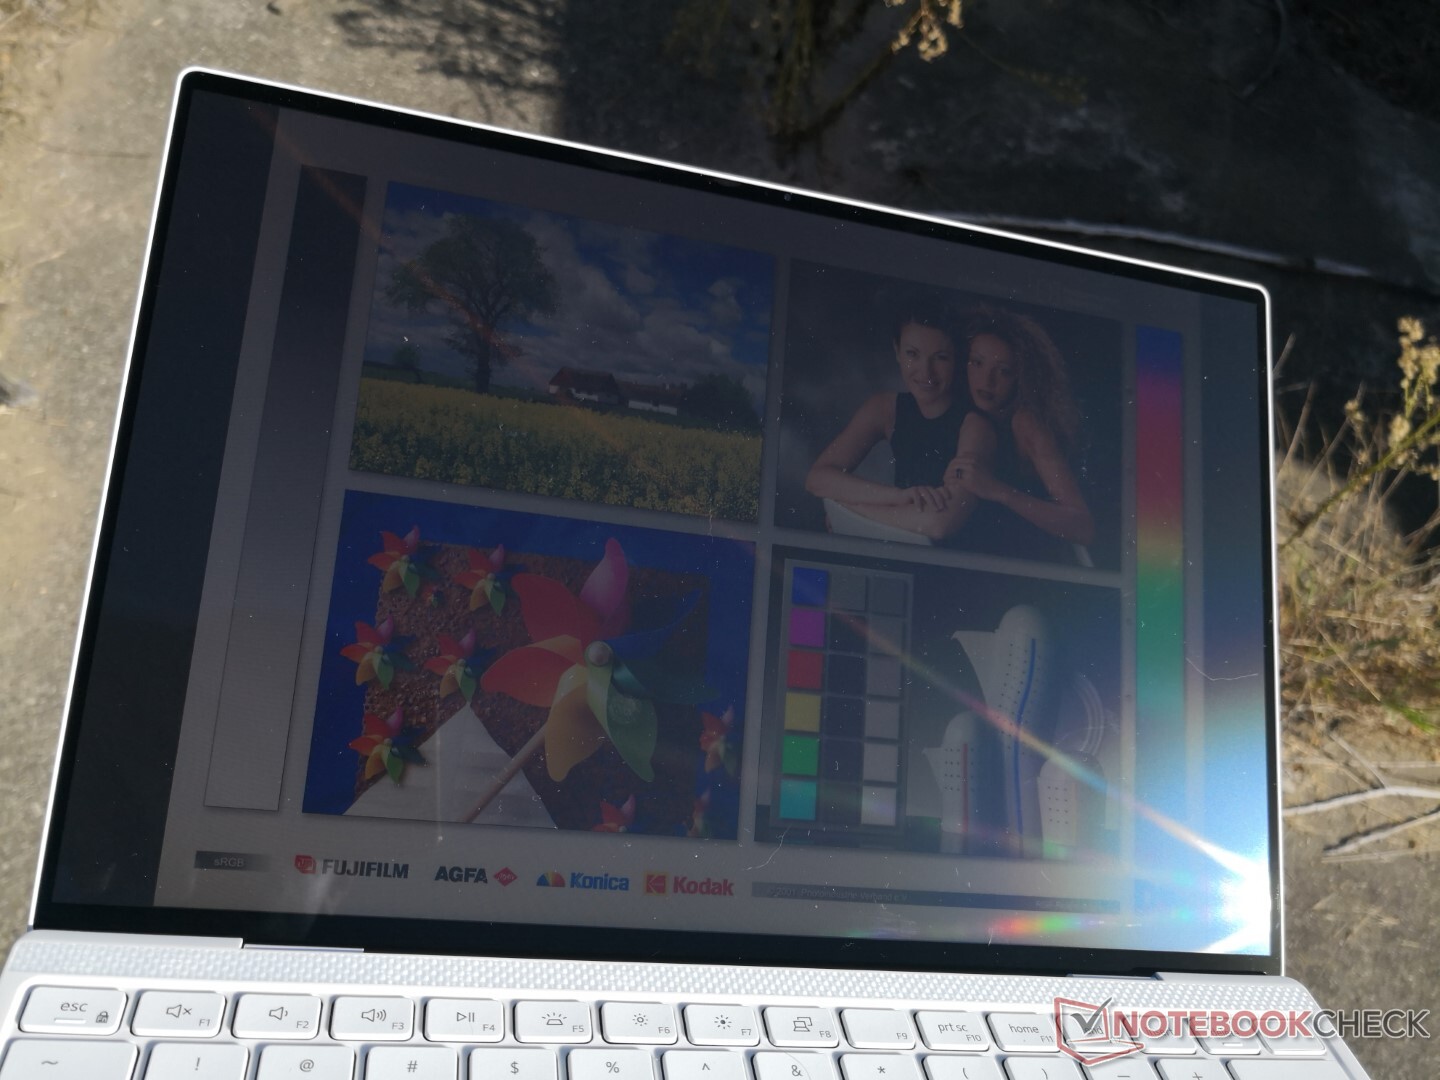
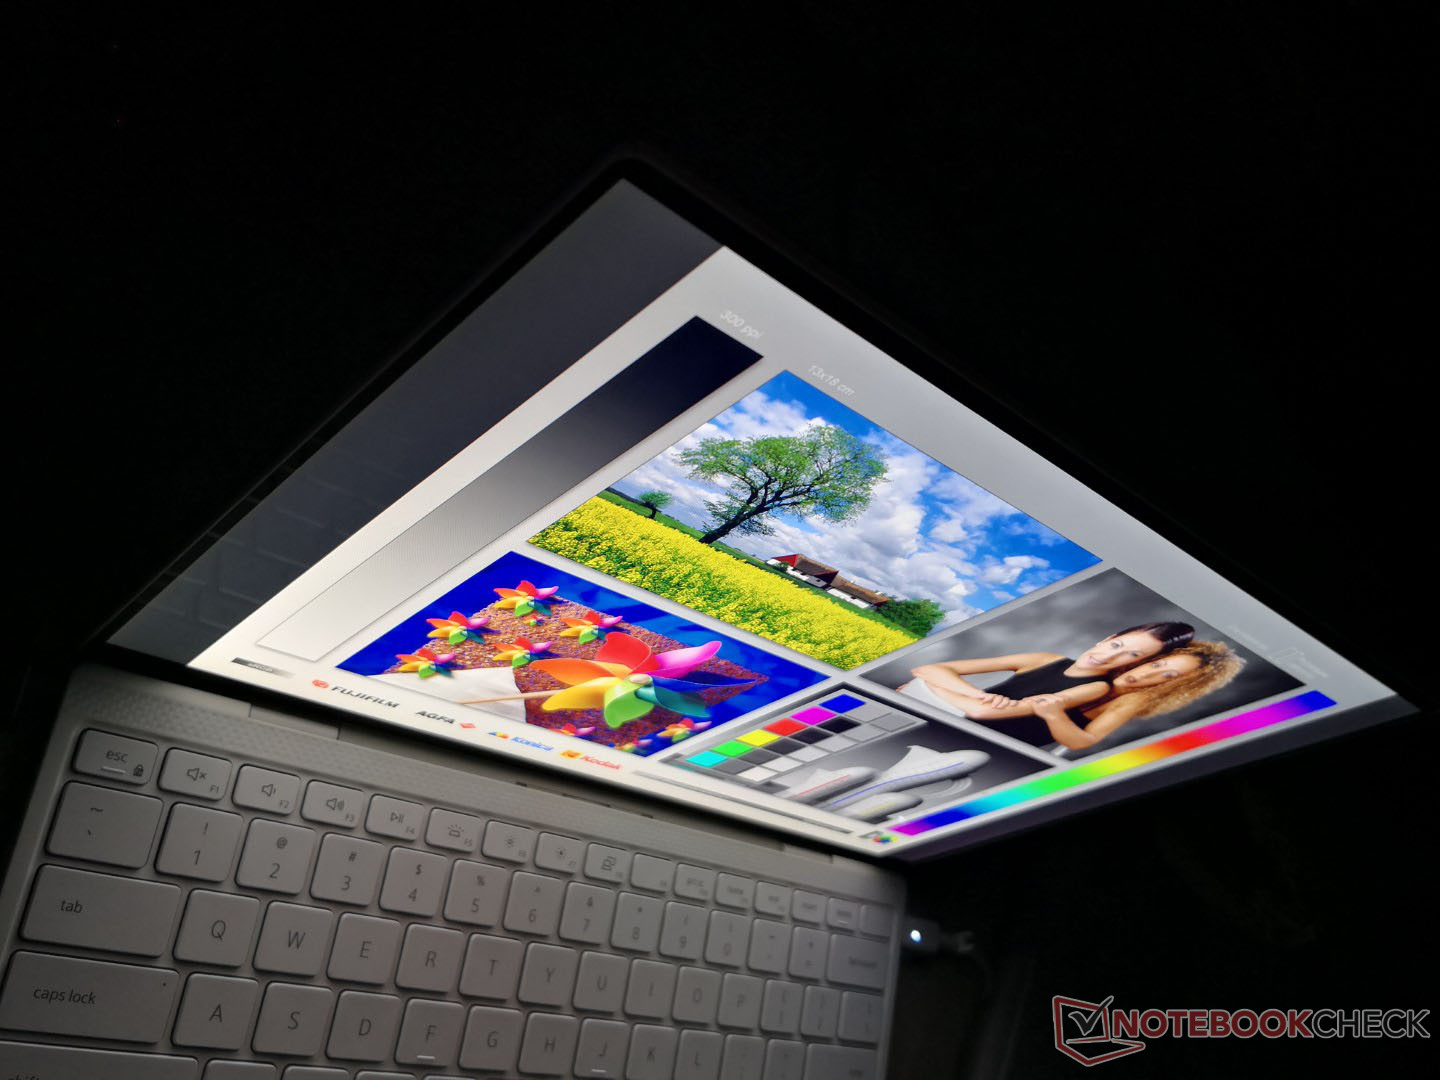
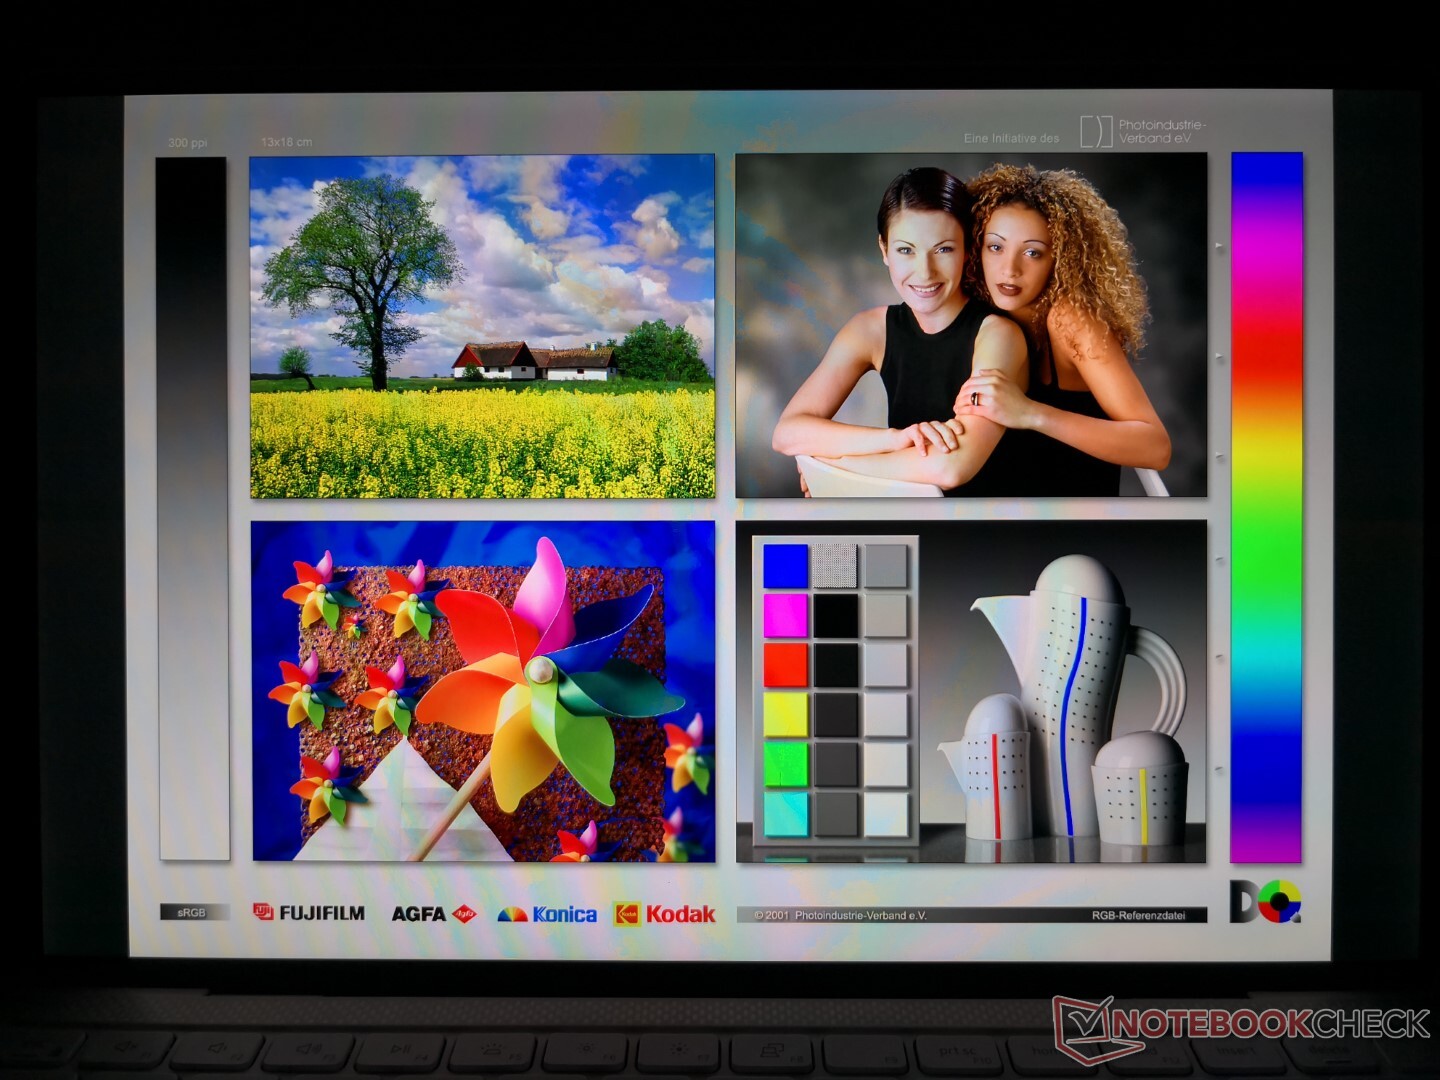
Display
Il 9310 utilizza lo stesso pannello IPS Sharp LQ134N1 come quello di XPS 13 9300, ma con livelli di luminosità e valori di PWM leggermente diversi. I display sui portatili XPS sono sempre stati tra i migliori nelle rispettive categorie e questo rimane vero sul 9310. Gli svantaggi principali continuano ad essere i tempi di risposta relativamente lenti e la mancanza di opzioni di sincronizzazione adattiva e di OLED. Il Lenovo Yoga Slim 7 alimentato con AMD, ad esempio, è dotato di sincronizzazione adattiva per ridurre lo sfarfallio dello schermo.

| |||||||||||||||||||||||||
Distribuzione della luminosità: 92 %
Al centro con la batteria: 543.3 cd/m²
Contrasto: 1430:1 (Nero: 0.38 cd/m²)
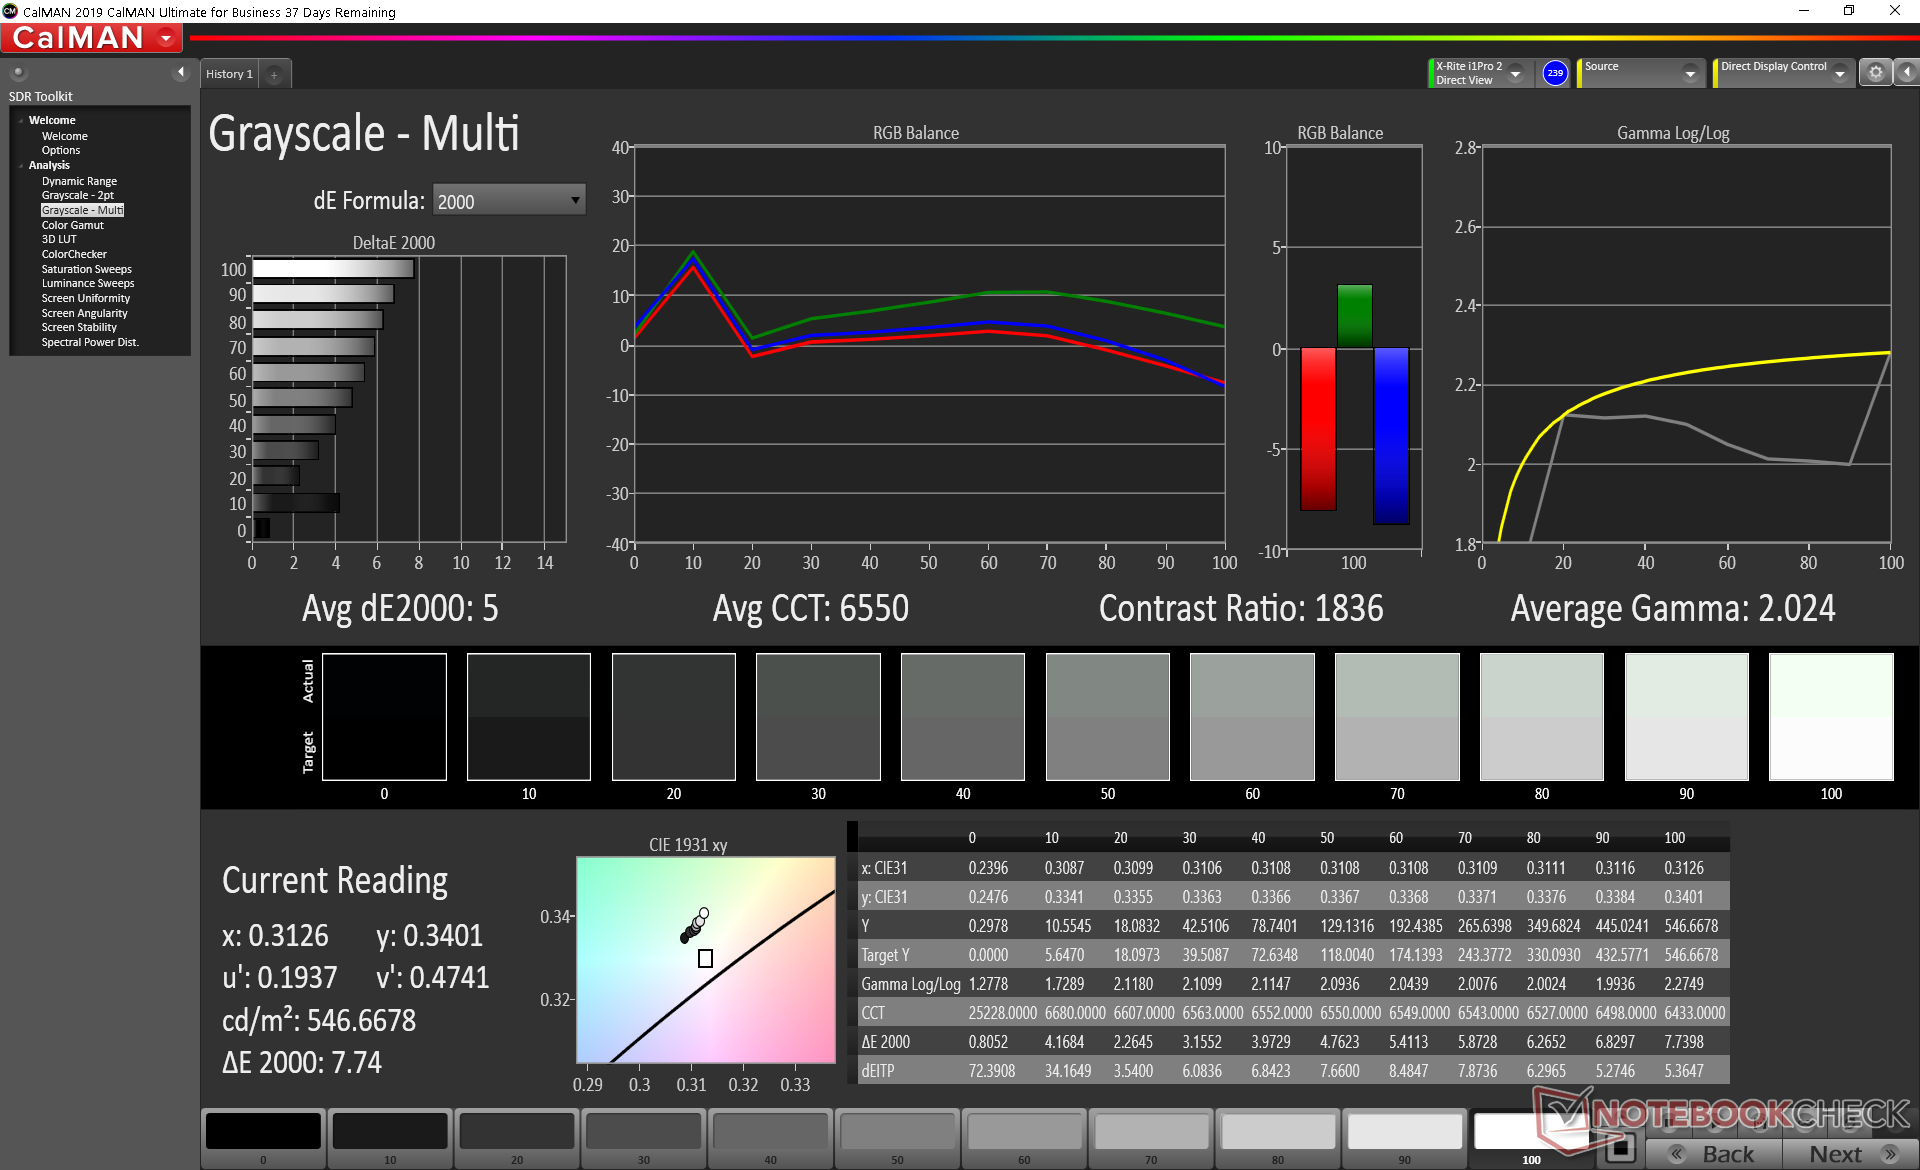
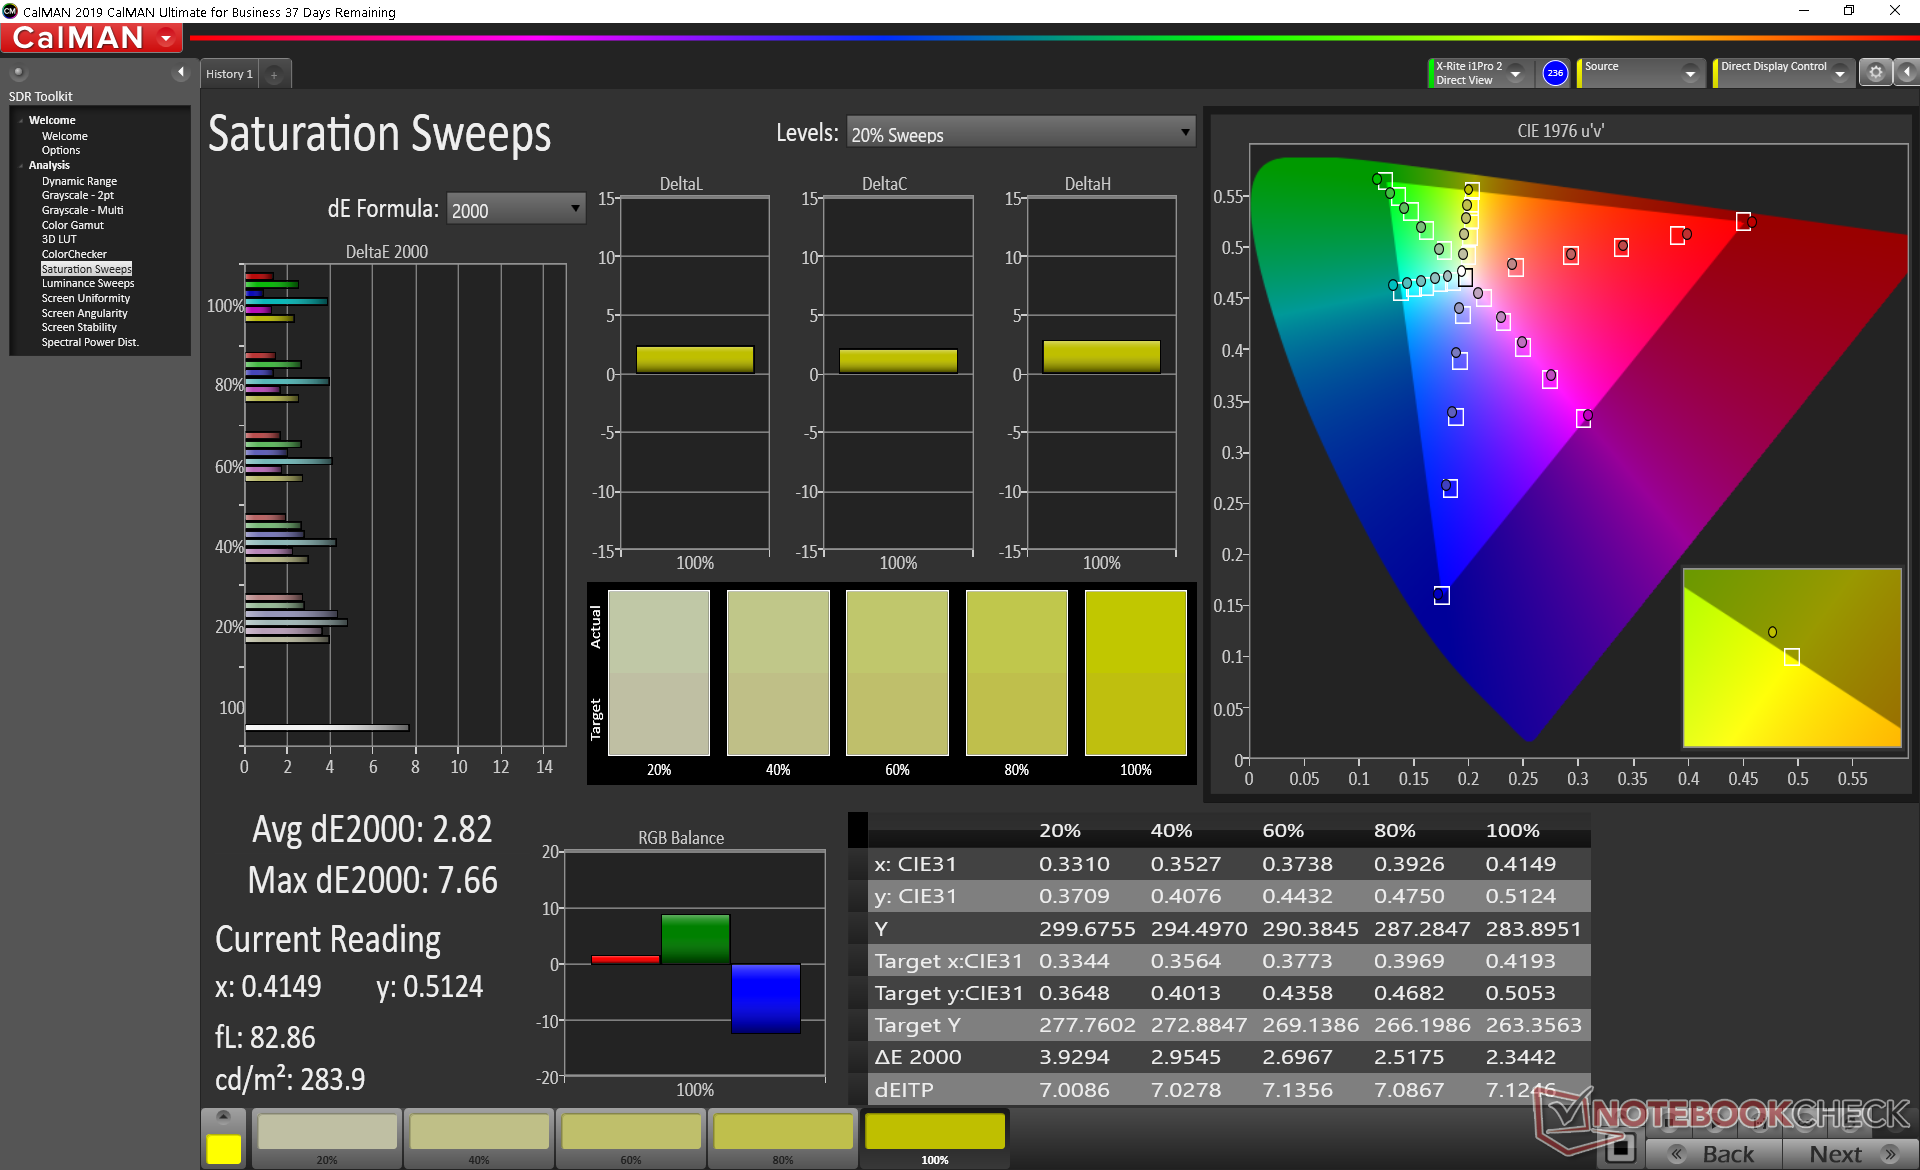
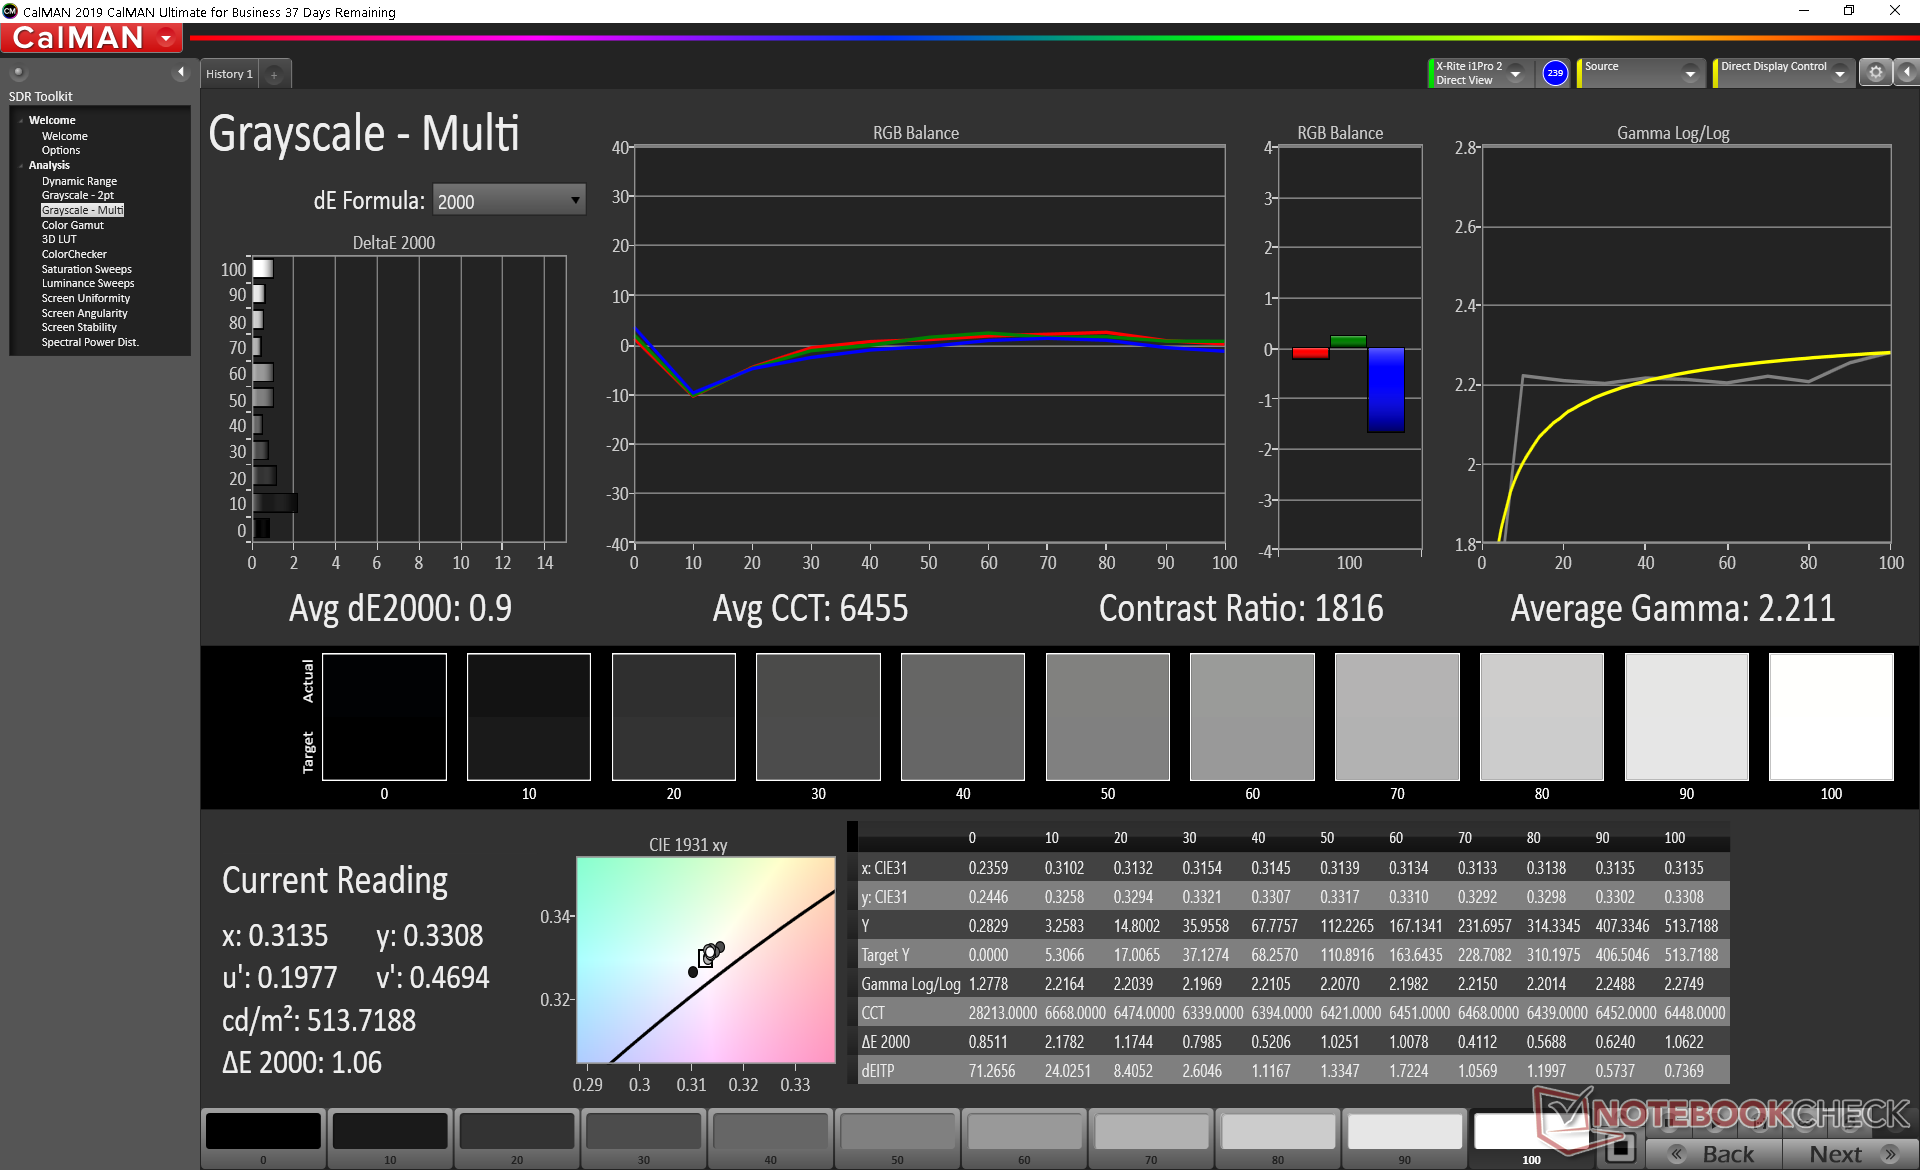
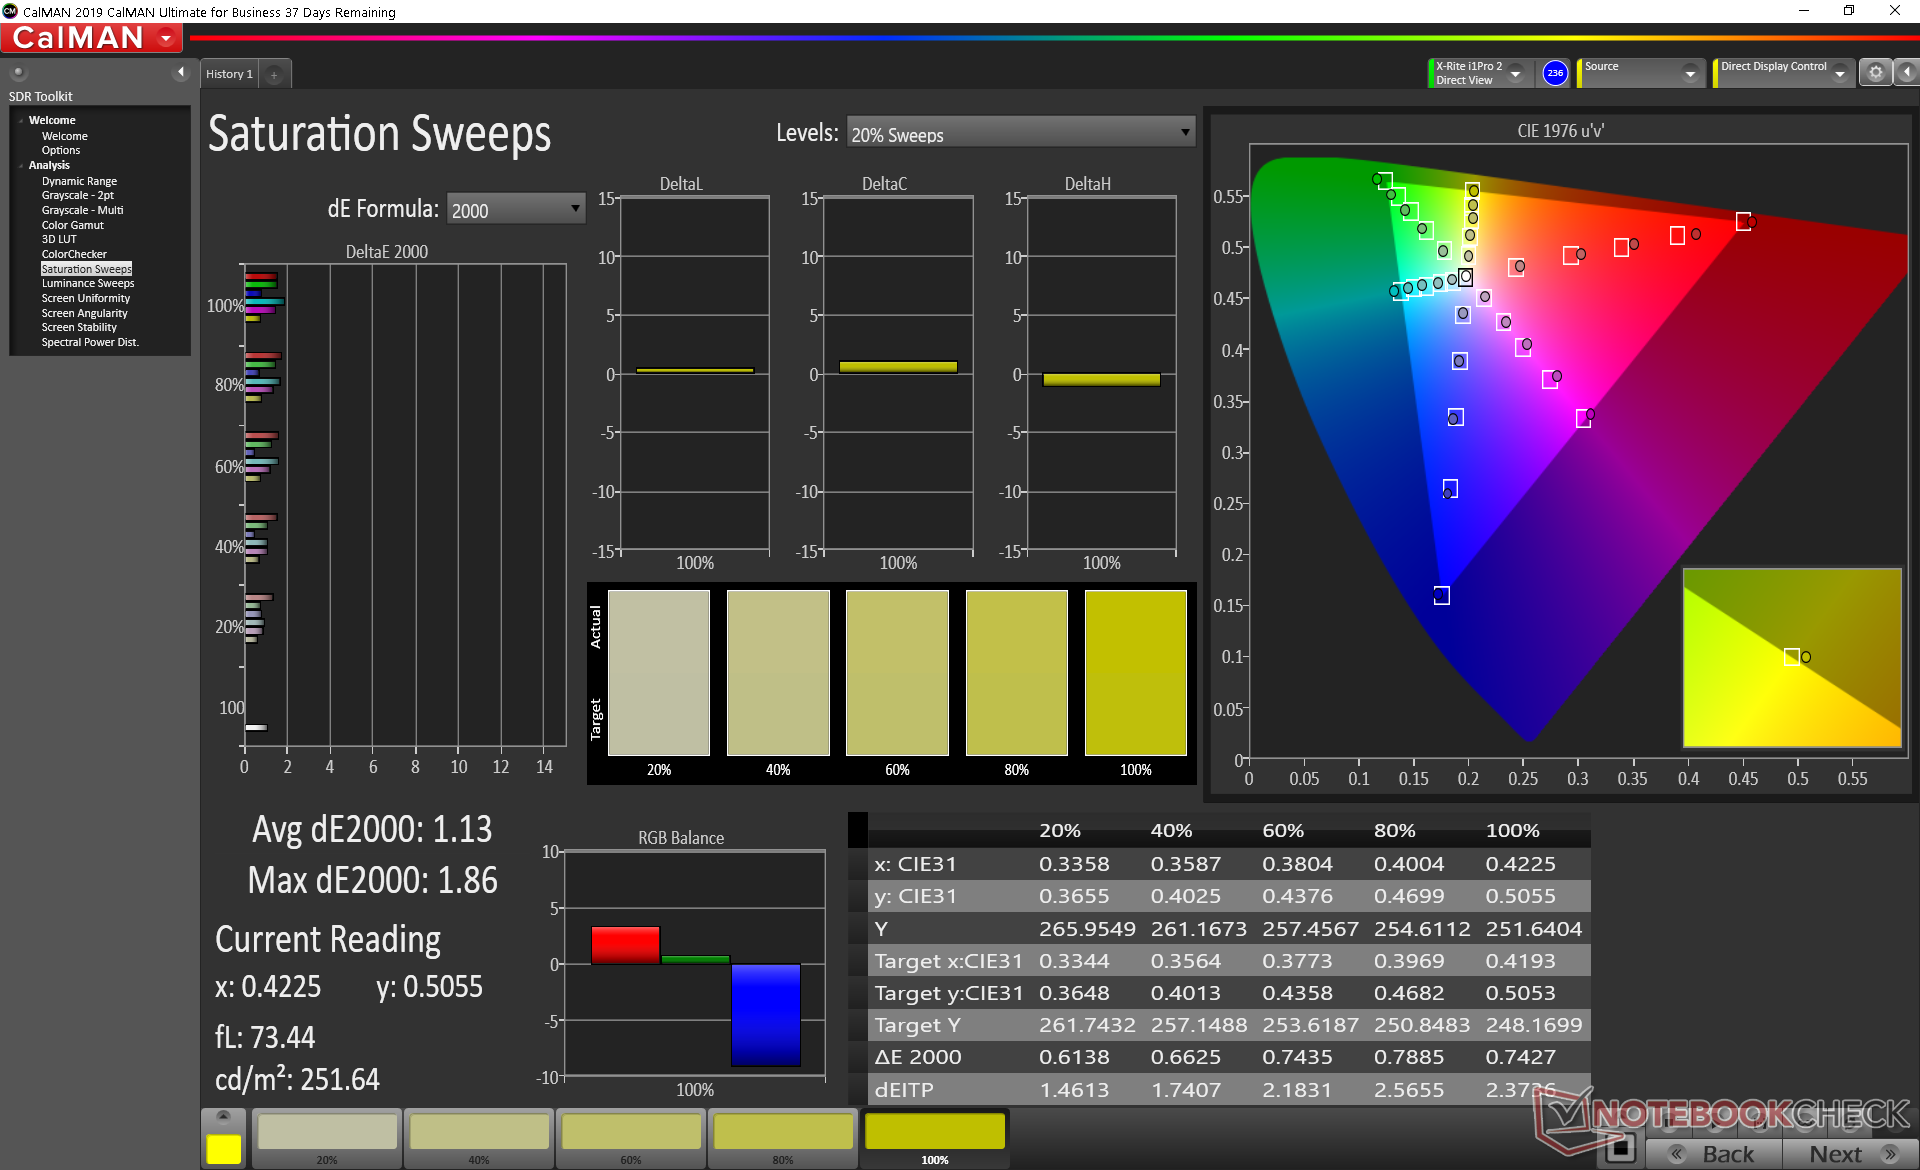
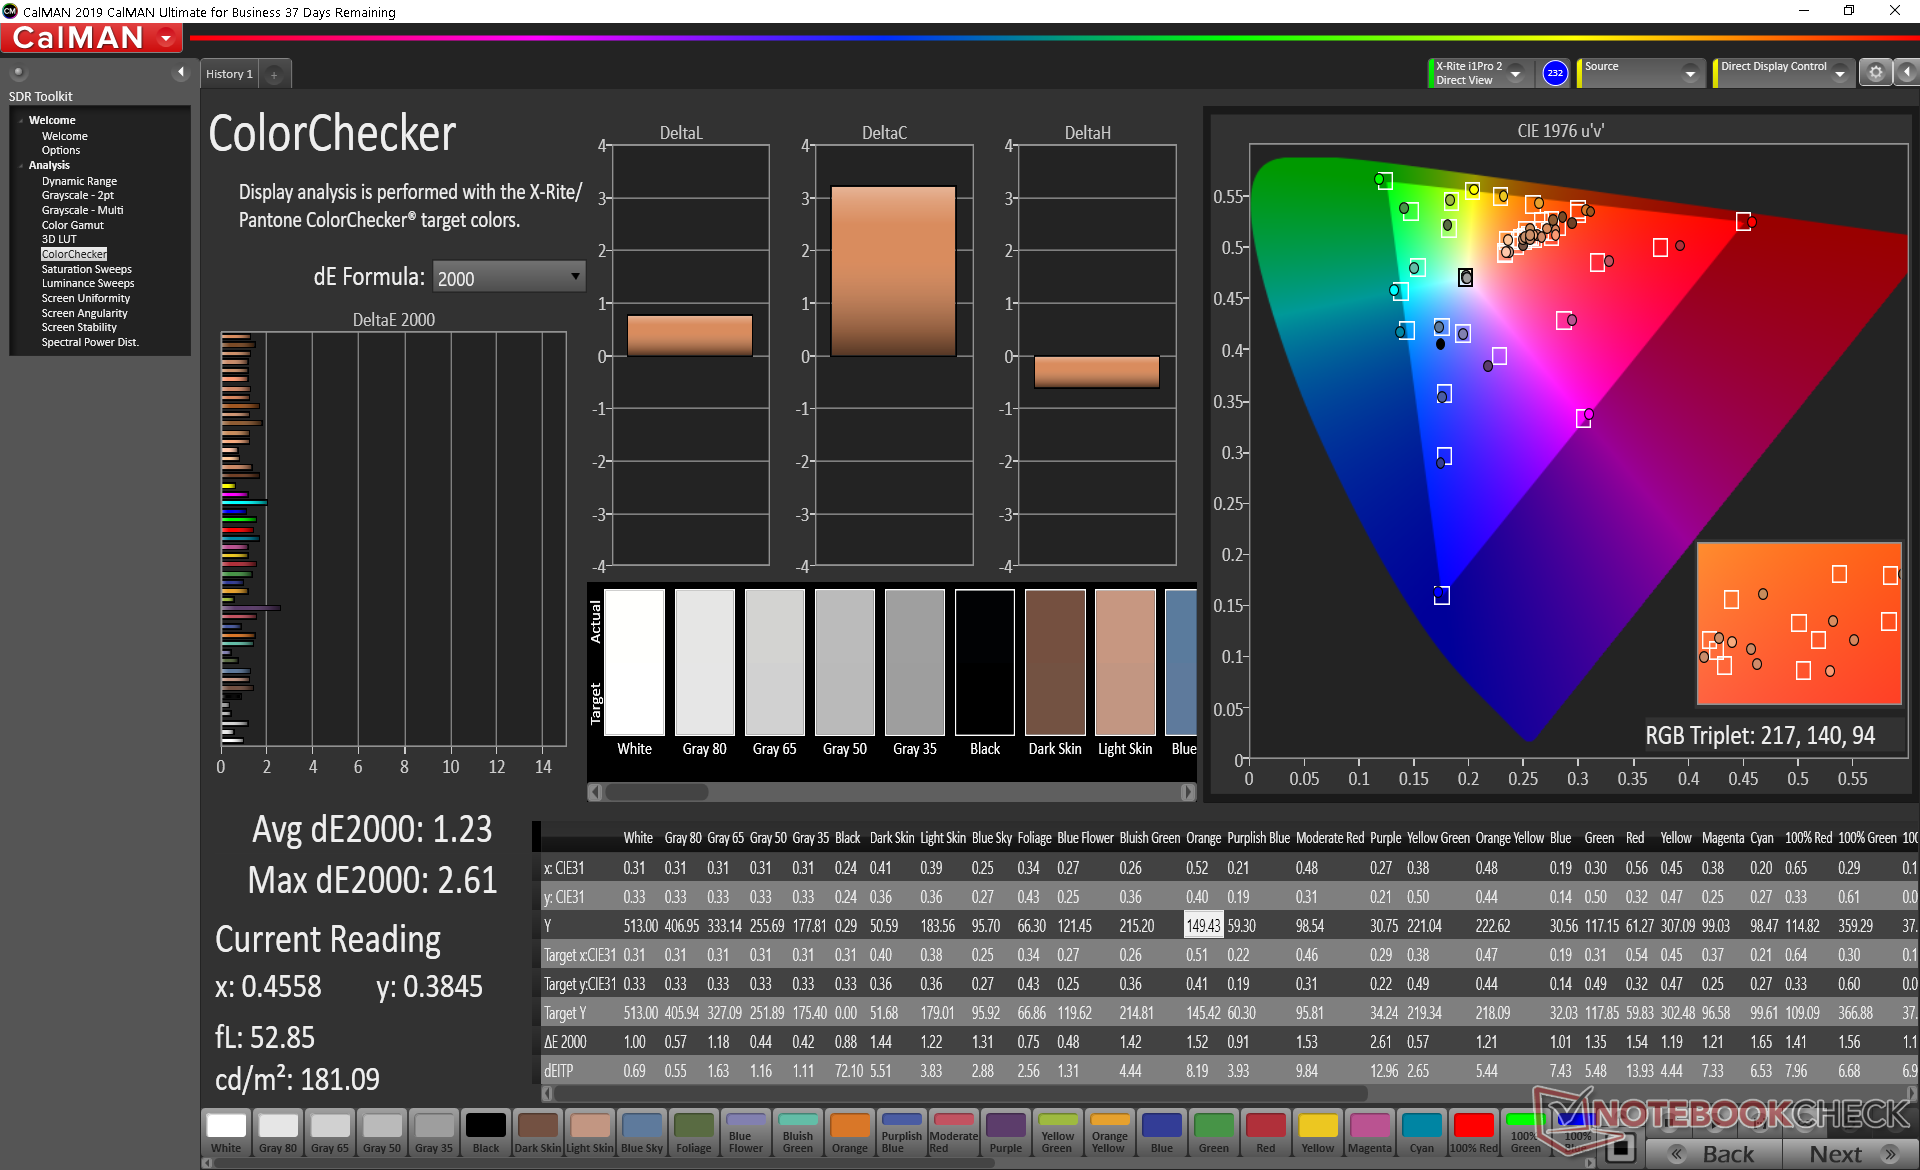
ΔE ColorChecker Calman: 3.02 | ∀{0.5-29.43 Ø4.73}
calibrated: 1.23
ΔE Greyscale Calman: 5 | ∀{0.09-98 Ø4.97}
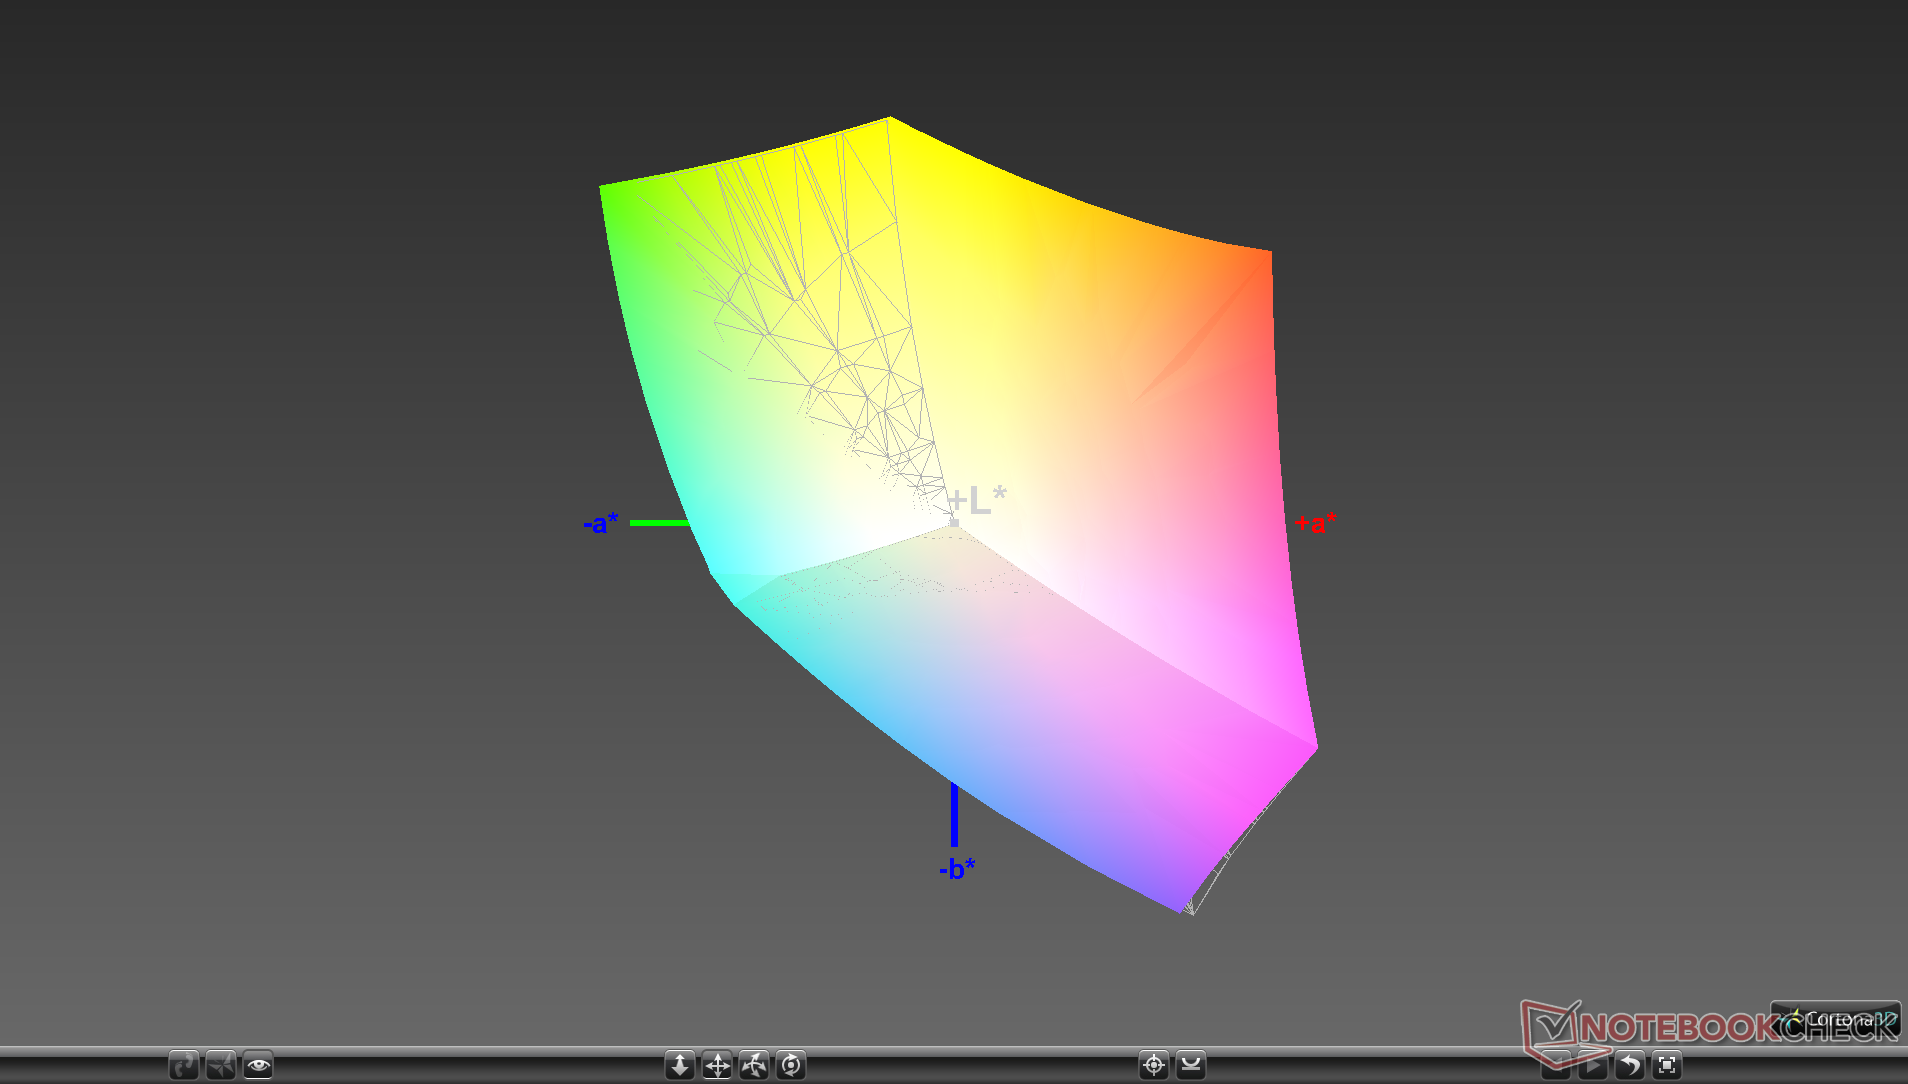
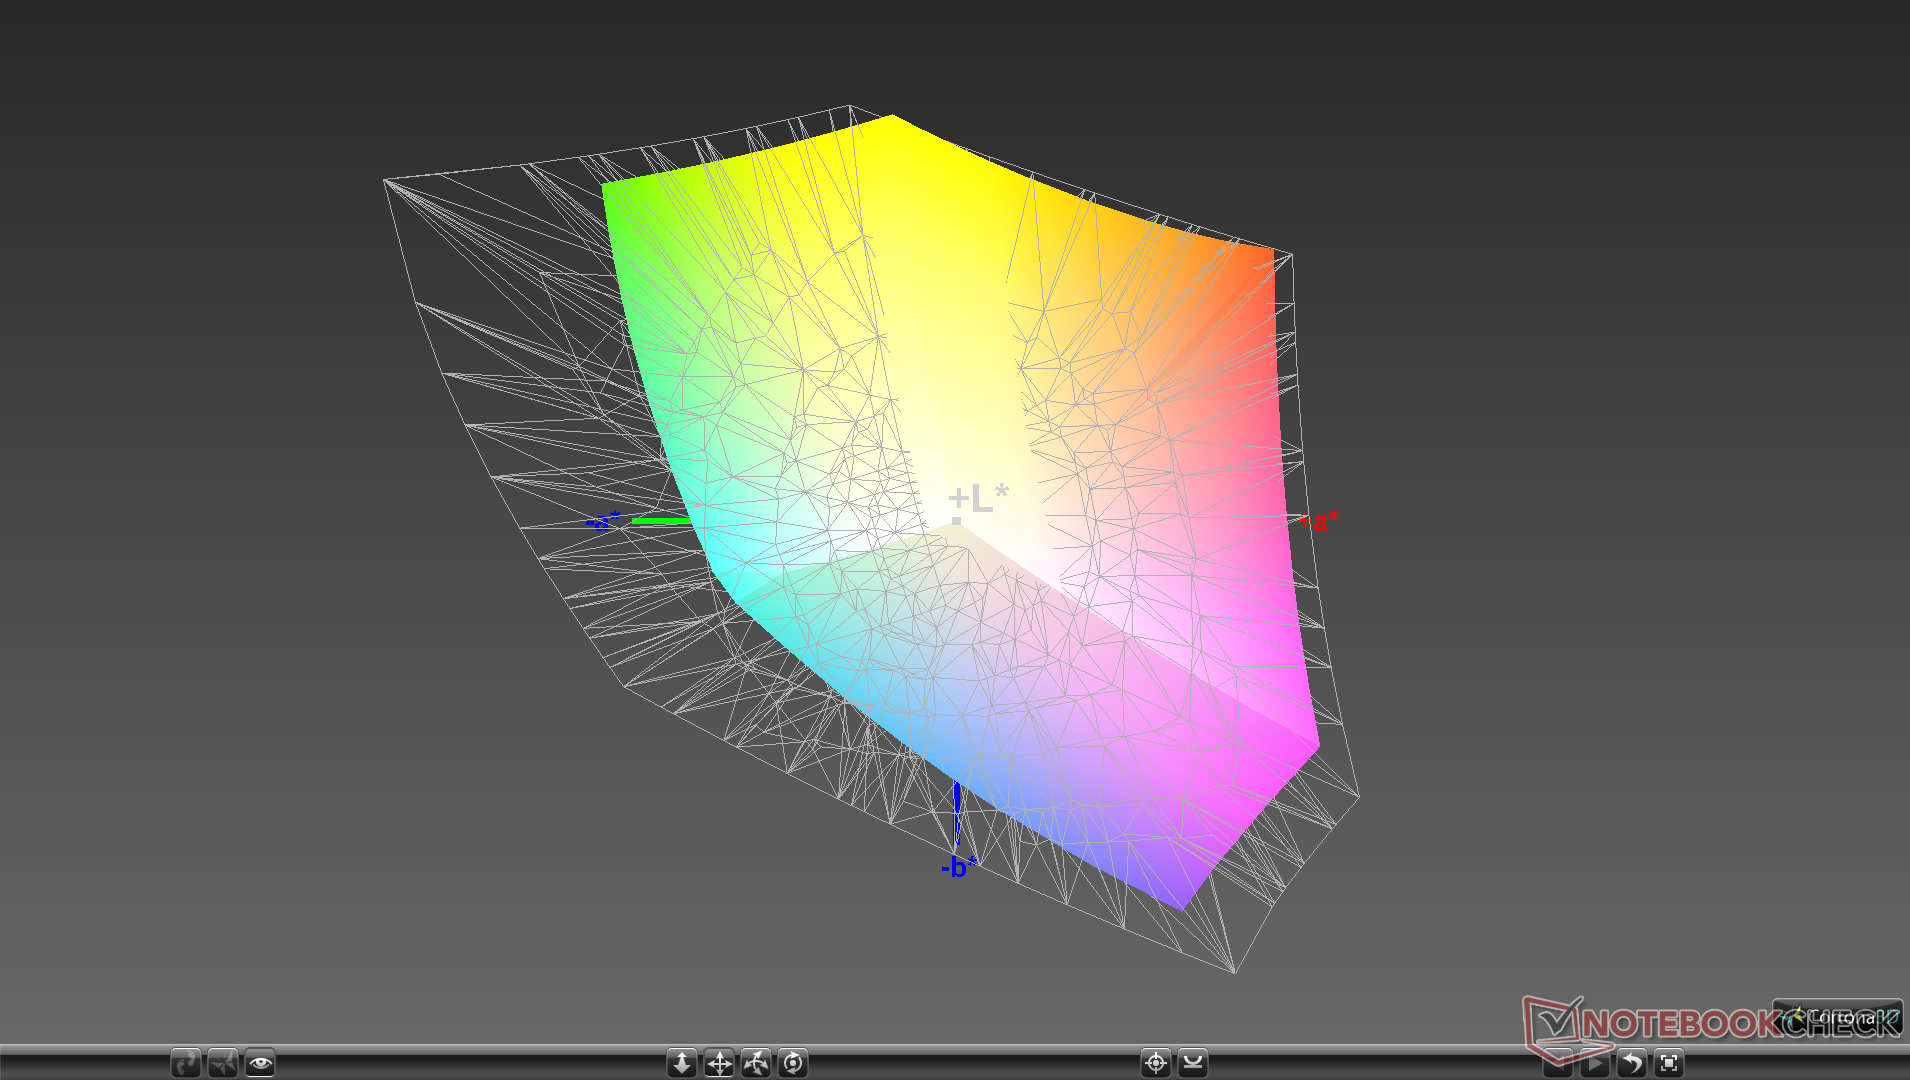
99.6% sRGB (Argyll 1.6.3 3D)
66.8% AdobeRGB 1998 (Argyll 1.6.3 3D)
72.9% AdobeRGB 1998 (Argyll 3D)
99.1% sRGB (Argyll 3D)
70.9% Display P3 (Argyll 3D)
Gamma: 2.02
CCT: 6550 K
| Dell XPS 13 9310 Core i7 FHD Sharp LQ134N1, IPS, 13.4", 1920x1200 | Dell XPS 13 9300 Core i7-1065G7 Sharp LQ134N1, IPS, 13.4", 1920x1200 | Apple MacBook Pro 13 2020 2GHz i5 10th-Gen APPA03D, IPS, 13.3", 2560x1600 | Huawei MateBook X Pro 2020 i7 JDI LPM139M422A, LTPS, 13.9", 3000x2000 | Lenovo Yoga Slim 7-14ARE AU Optronics B140HAN06.8, IPS, 14", 1920x1080 | HP Spectre x360 13-aw0013dx AU Optronics AUO5E2D, IPS, 13.3", 1920x1080 | |
|---|---|---|---|---|---|---|
| Display | -5% | 20% | -4% | 0% | -1% | |
| Display P3 Coverage (%) | 70.9 | 66.3 -6% | 98.8 39% | 66.6 -6% | 71.7 1% | 69.6 -2% |
| sRGB Coverage (%) | 99.1 | 97.3 -2% | 99.9 1% | 99.4 0% | 99.3 0% | 98.9 0% |
| AdobeRGB 1998 Coverage (%) | 72.9 | 68.5 -6% | 86.4 19% | 68.6 -6% | 72.9 0% | 71.5 -2% |
| Response Times | 2% | 7% | 6% | 12% | -14% | |
| Response Time Grey 50% / Grey 80% * (ms) | 52 ? | 50 ? 4% | 46 ? 12% | 49.6 ? 5% | 45.6 ? 12% | 60.8 ? -17% |
| Response Time Black / White * (ms) | 33.2 ? | 33.2 ? -0% | 32.4 ? 2% | 30.8 ? 7% | 29.6 ? 11% | 36.8 ? -11% |
| PWM Frequency (Hz) | 2475 ? | 2500 ? | 113600 ? | 29070 ? | ||
| Screen | 1% | 19% | 23% | -9% | -11% | |
| Brightness middle (cd/m²) | 543.3 | 607.6 12% | 512 -6% | 557 3% | 399.6 -26% | 447.4 -18% |
| Brightness (cd/m²) | 524 | 595 14% | 491 -6% | 532 2% | 385 -27% | 420 -20% |
| Brightness Distribution (%) | 92 | 96 4% | 91 -1% | 87 -5% | 89 -3% | 85 -8% |
| Black Level * (cd/m²) | 0.38 | 0.4 -5% | 0.32 16% | 0.33 13% | 0.37 3% | 0.31 18% |
| Contrast (:1) | 1430 | 1519 6% | 1600 12% | 1688 18% | 1080 -24% | 1443 1% |
| Colorchecker dE 2000 * | 3.02 | 3.23 -7% | 1.7 44% | 1.4 54% | 3.2 -6% | 4.23 -40% |
| Colorchecker dE 2000 max. * | 7.61 | 8.67 -14% | 3.4 55% | 2.5 67% | 6.44 15% | 9.34 -23% |
| Colorchecker dE 2000 calibrated * | 1.23 | 1.01 18% | 1 19% | 0.7 43% | 1.73 -41% | 1.32 -7% |
| Greyscale dE 2000 * | 5 | 5.5 -10% | 1.9 62% | 2 60% | 4.7 6% | 6.1 -22% |
| Gamma | 2.02 109% | 2.12 104% | 2.19 100% | 2.14 103% | 2.21 100% | 2.11 104% |
| CCT | 6550 99% | 6413 101% | 6817 95% | 6689 97% | 7184 90% | 6136 106% |
| Color Space (Percent of AdobeRGB 1998) (%) | 66.8 | 63 -6% | 77.4 16% | 62.5 -6% | 66.3 -1% | 64.8 -3% |
| Color Space (Percent of sRGB) (%) | 99.6 | 97.5 -2% | 99.9 0% | 99.5 0% | 99.5 0% | 98.9 -1% |
| Media totale (Programma / Settaggio) | -1% /
0% | 15% /
18% | 8% /
16% | 1% /
-5% | -9% /
-10% |
* ... Meglio usare valori piccoli
Tutte le versioni XPS 13 9300/9310 superano al 100% la copertura sRGB senza opzioni per AdobeRGB o DCI-P3, a differenza della serie XPS 15. Questo non dovrebbe essere un problema per chi non è un editor grafico professionale.
Il valore gamma out-of-the-box di 2.0 avrebbe potuto essere migliore. Calibrando noi stessi il display con un colorimetro X-Rite, la gamma si avvicina al target 2.2 con una conseguente migliore scala di grigi e colori su tutta la linea.

Tempi di risposta del Display
| ↔ Tempi di risposta dal Nero al Bianco | ||
|---|---|---|
| 33.2 ms ... aumenta ↗ e diminuisce ↘ combinato | ↗ 19.2 ms Incremento | 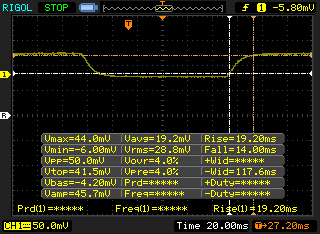 |
| ↘ 14 ms Calo | ||
| Lo schermo mostra tempi di risposta lenti nei nostri tests e sarà insoddisfacente per i gamers. In confronto, tutti i dispositivi di test variano da 0.1 (minimo) a 240 (massimo) ms. » 90 % di tutti i dispositivi è migliore. Questo significa che i tempi di risposta rilevati sono peggiori rispetto alla media di tutti i dispositivi testati (19.9 ms). | ||
| ↔ Tempo di risposta dal 50% Grigio all'80% Grigio | ||
| 52 ms ... aumenta ↗ e diminuisce ↘ combinato | ↗ 27.6 ms Incremento | 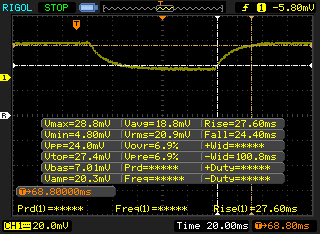 |
| ↘ 24.4 ms Calo | ||
| Lo schermo mostra tempi di risposta lenti nei nostri tests e sarà insoddisfacente per i gamers. In confronto, tutti i dispositivi di test variano da 0.165 (minimo) a 636 (massimo) ms. » 88 % di tutti i dispositivi è migliore. Questo significa che i tempi di risposta rilevati sono peggiori rispetto alla media di tutti i dispositivi testati (31.1 ms). | ||
Sfarfallio dello schermo / PWM (Pulse-Width Modulation)
| flickering dello schermo / PWM rilevato | 2475 Hz | ≤ 20 % settaggio luminosita' | 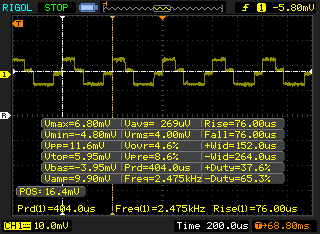 |
Il display sfarfalla a 2475 Hz (Probabilmente a causa dell'uso di PWM) Flickering rilevato ad una luminosita' di 20 % o inferiore. Non dovrebbe verificarsi flickering o PWM sopra questo valore di luminosita'. La frequenza di 2475 Hz è abbastanza alta, quindi la maggioranza degli utenti sensibili al PWM non dovrebbero notare alcun flickering. In confronto: 52 % di tutti i dispositivi testati non utilizza PWM per ridurre la luminosita' del display. Se è rilevato PWM, una media di 7791 (minimo: 5 - massimo: 343500) Hz è stata rilevata. | |||


Performance
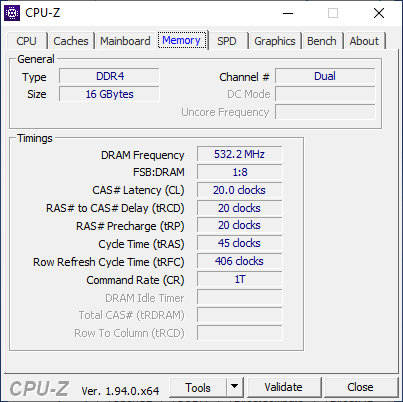
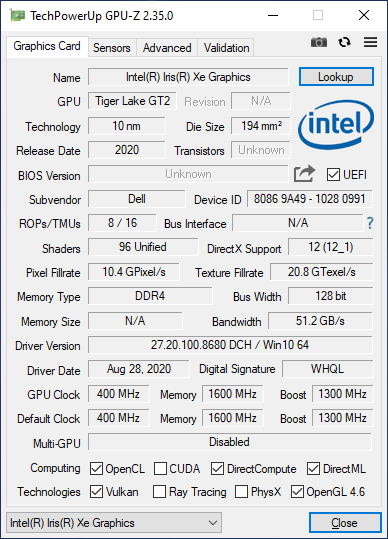
Tutte le versioni XPS 13 9310 sono dotate di CPU Core i3-1115G4, Core i5-1135G7, o Core i7-1165G7 con 8 GB a 32 GB di RAM a 4267 MHz. La grafica integrata Iris Xe viene fornita di serie su tutte le configurazioni, ma si prevede che funzioni più lentamente e con meno EU sull'opzione Core i3-1115G4.
Se non diversamente specificato, i nostri test qui sotto sono stati eseguiti in modalità Ultra Performance per ottenere i punteggi più alti possibili dal sistema. I profili di potenza si trovano tutti all'interno del software Dell Power Manager preinstallato.
Processore
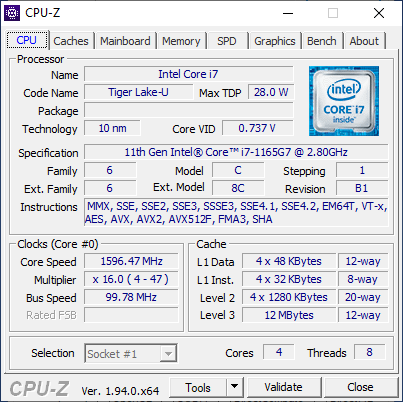
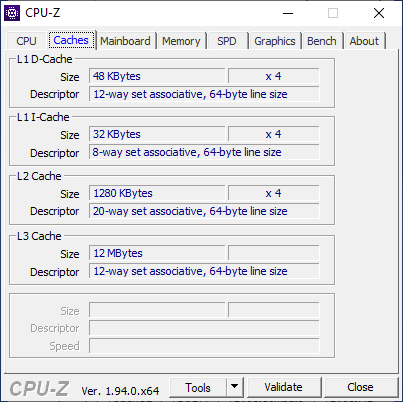
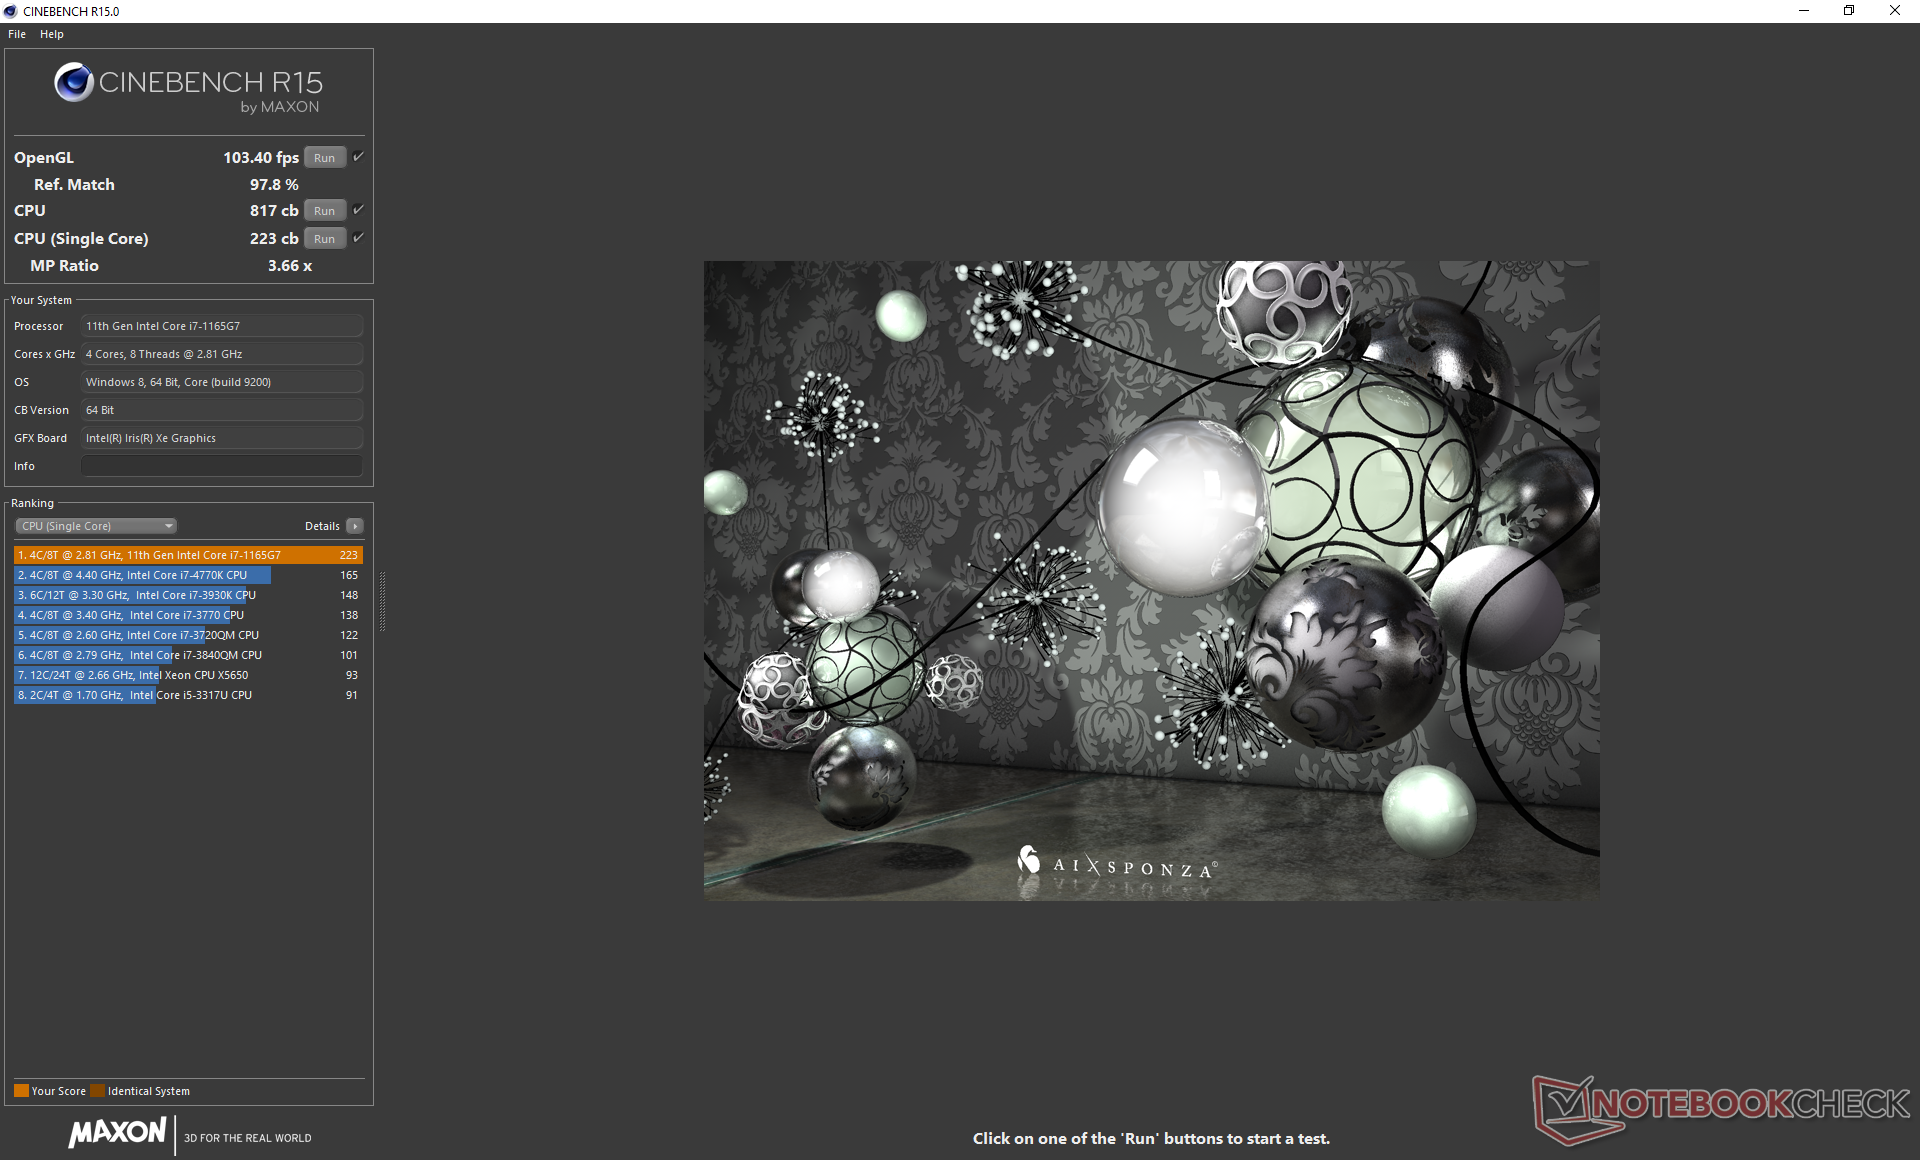
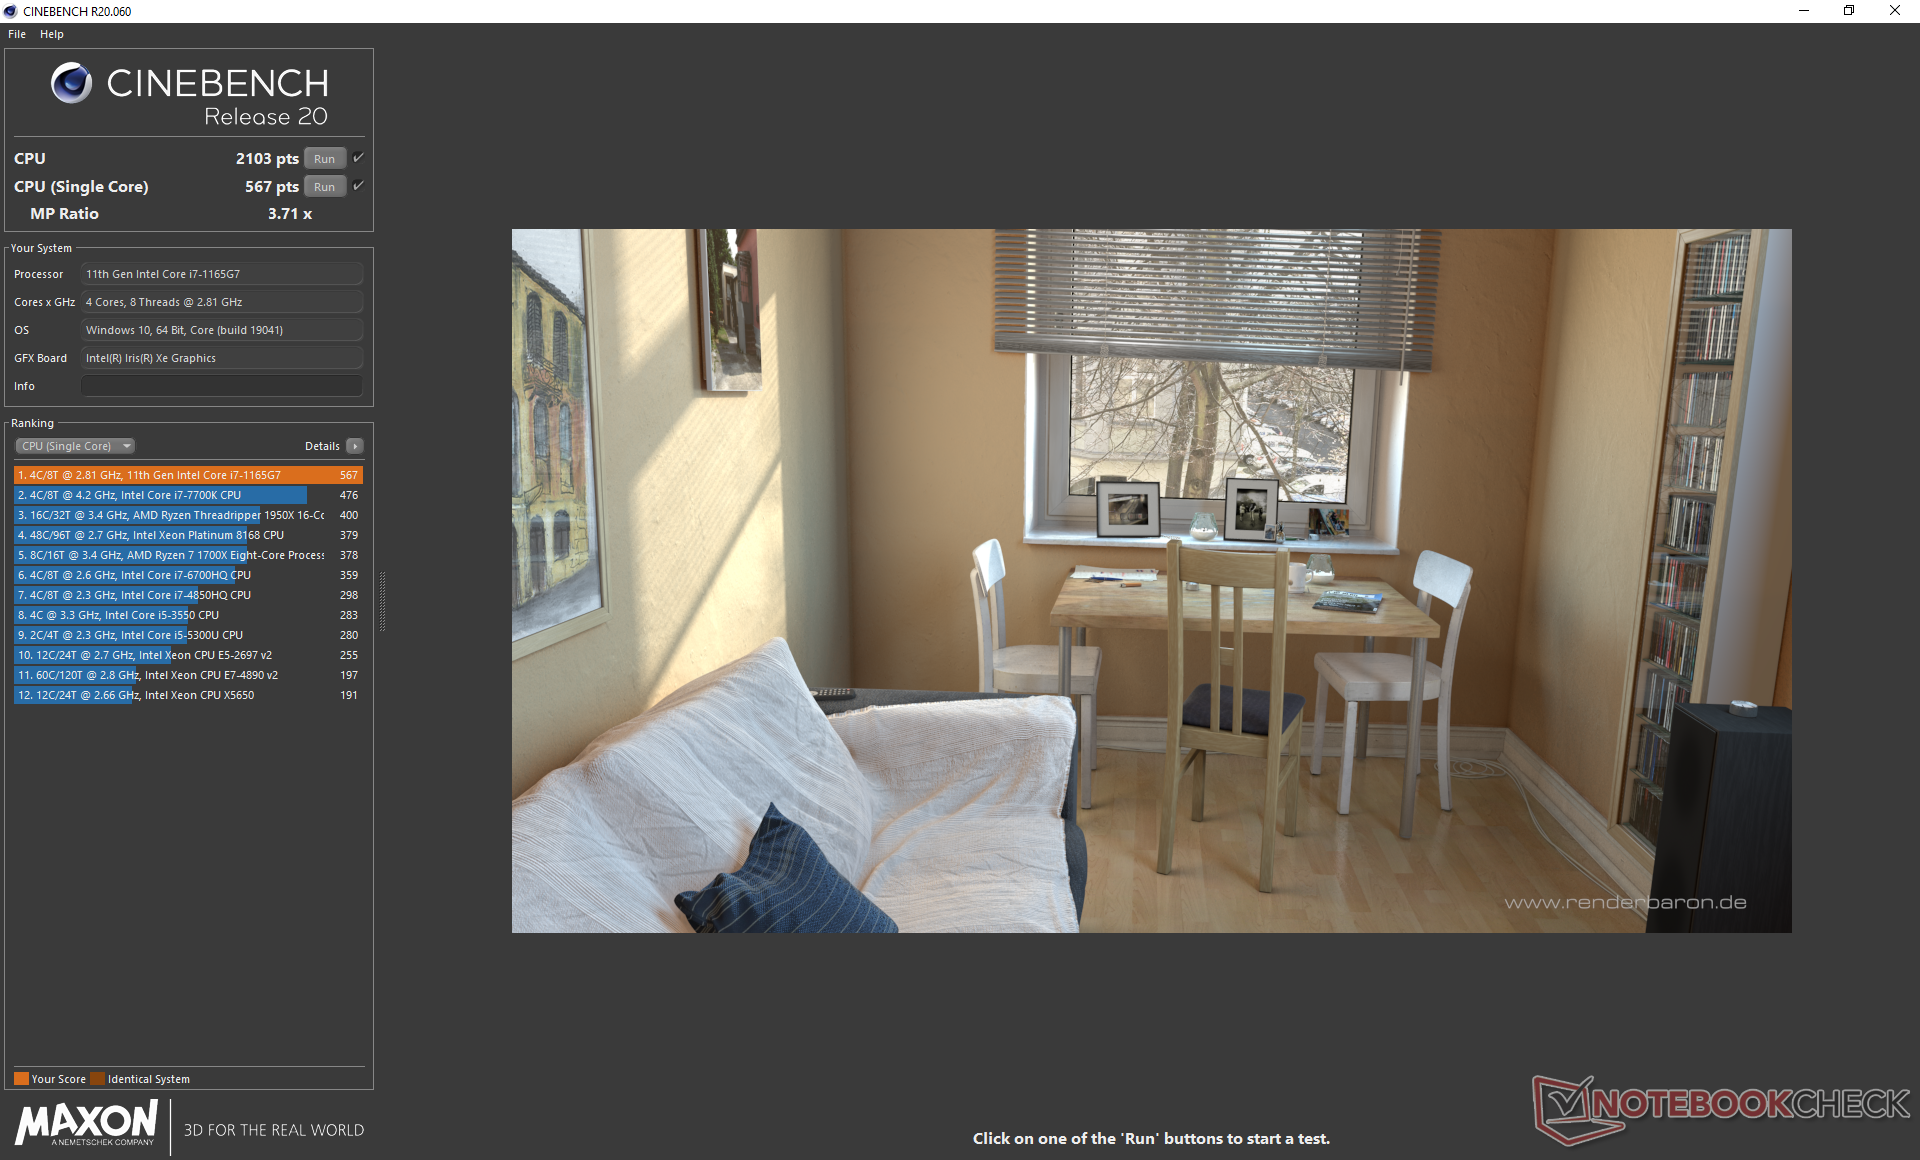
Essendo il quarto laptop del nostro database dotato del Core i7-1165G7, l'XPS 13 9310 sta funzionando come ci aspettiamo che sia entro pochi punti percentuali della media. Sfortunatamente, questo significa anche che i guadagni di prestazioni grezze rispetto al Core i7-1065G7 dell'anno scorso sono relativamente scarsi.
Dell continua ad affidarsi al Dynamic Tuning per ottenere il massimo delle prestazioni dal processore entro le capacità della soluzione di raffreddamento sovrastante. Questo è esemplificato dai punteggi ciclici di CineBench R15 xT quando si esegue il benchmark in un loop, come mostrato dal grafico sottostante rispetto ai punteggi più bassi della serie Asus ZenBook 14 della Asus ZenBook 14 che usa la stessa CPU. I punteggi di CineBench R20 sul Core i7 XPS 13 9300 possono variare da 1396 punti a 1883 punti a causa delle diverse velocità di clock. Esploriamo ulteriormente questo aspetto nella sezione Stress Test di seguito.
Cinebench R15: CPU Multi 64Bit | CPU Single 64Bit
Blender: v2.79 BMW27 CPU
7-Zip 18.03: 7z b 4 -mmt1 | 7z b 4
Geekbench 5.5: Single-Core | Multi-Core
HWBOT x265 Benchmark v2.2: 4k Preset
LibreOffice : 20 Documents To PDF
R Benchmark 2.5: Overall mean
Cinebench R15: CPU Multi 64Bit | CPU Single 64Bit
Blender: v2.79 BMW27 CPU
7-Zip 18.03: 7z b 4 -mmt1 | 7z b 4
Geekbench 5.5: Single-Core | Multi-Core
HWBOT x265 Benchmark v2.2: 4k Preset
LibreOffice : 20 Documents To PDF
R Benchmark 2.5: Overall mean
* ... Meglio usare valori piccoli
Perfomance di sistema
I benchmarks PCMark sono costantemente più alti rispetto all'XPS 13 9300 dell'anno scorso alimentato da Ice Lake-powered XPS 13 9300 di almeno due punti percentuali a due cifre, probabilmente grazie alla GPU integrata più veloce. Il Lenovo Yoga Slim 7, meno costoso e alimentato da AMD, tuttavia, è ancora in cima alla classifica.
Durante il nostro periodo di tempo con l'unità di test, il sistema si è riavviato casualmente una notte per aggiornare il BIOS. Si sarebbe poi bloccato sulla schermata di avvio per quasi 20 minuti prima di entrare finalmente in modalità sicura di Windows. Il sistema era tornato alla normalità dopo il riavvio da lì, ma l'intero processo è stato sicuramente un'esperienza indesiderabile, soprattutto su un nuovo portatile di punta.
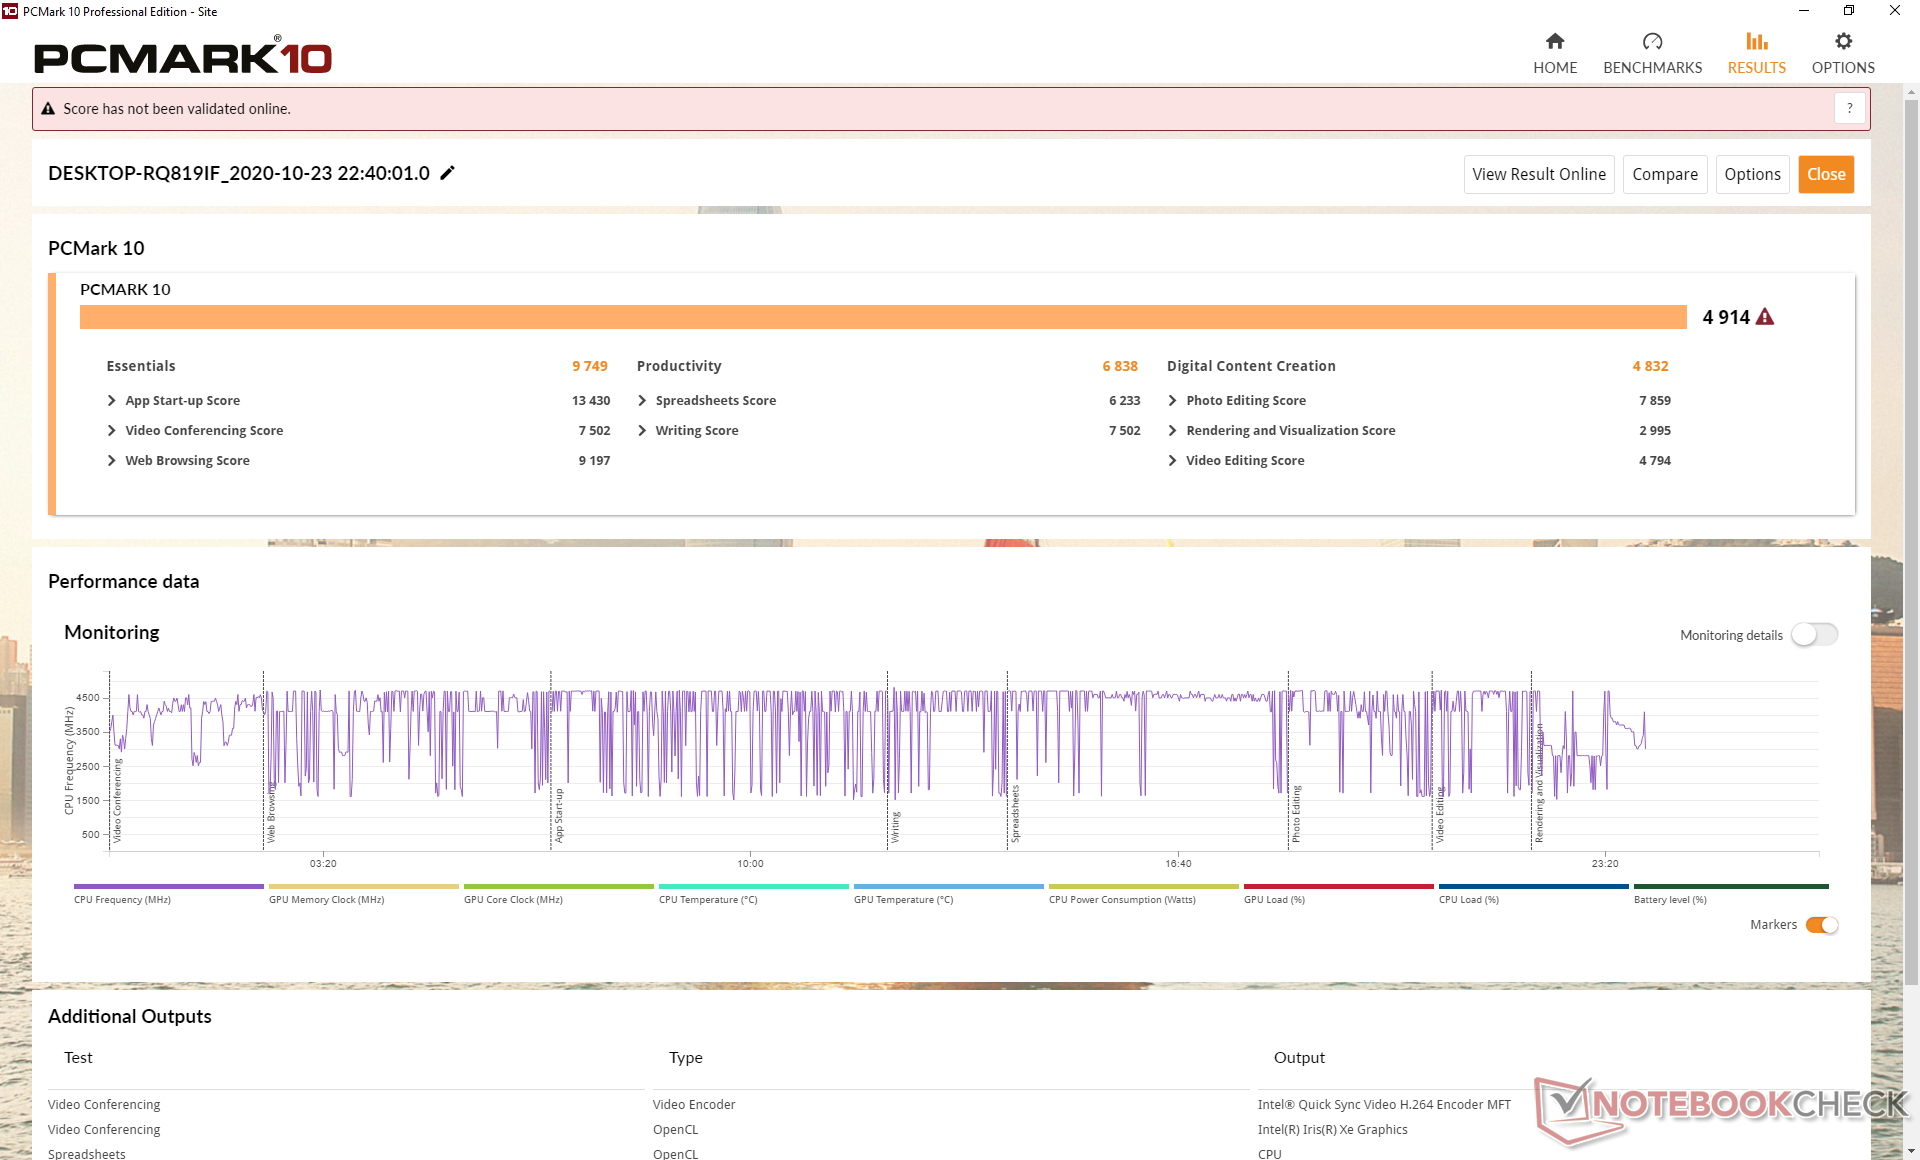
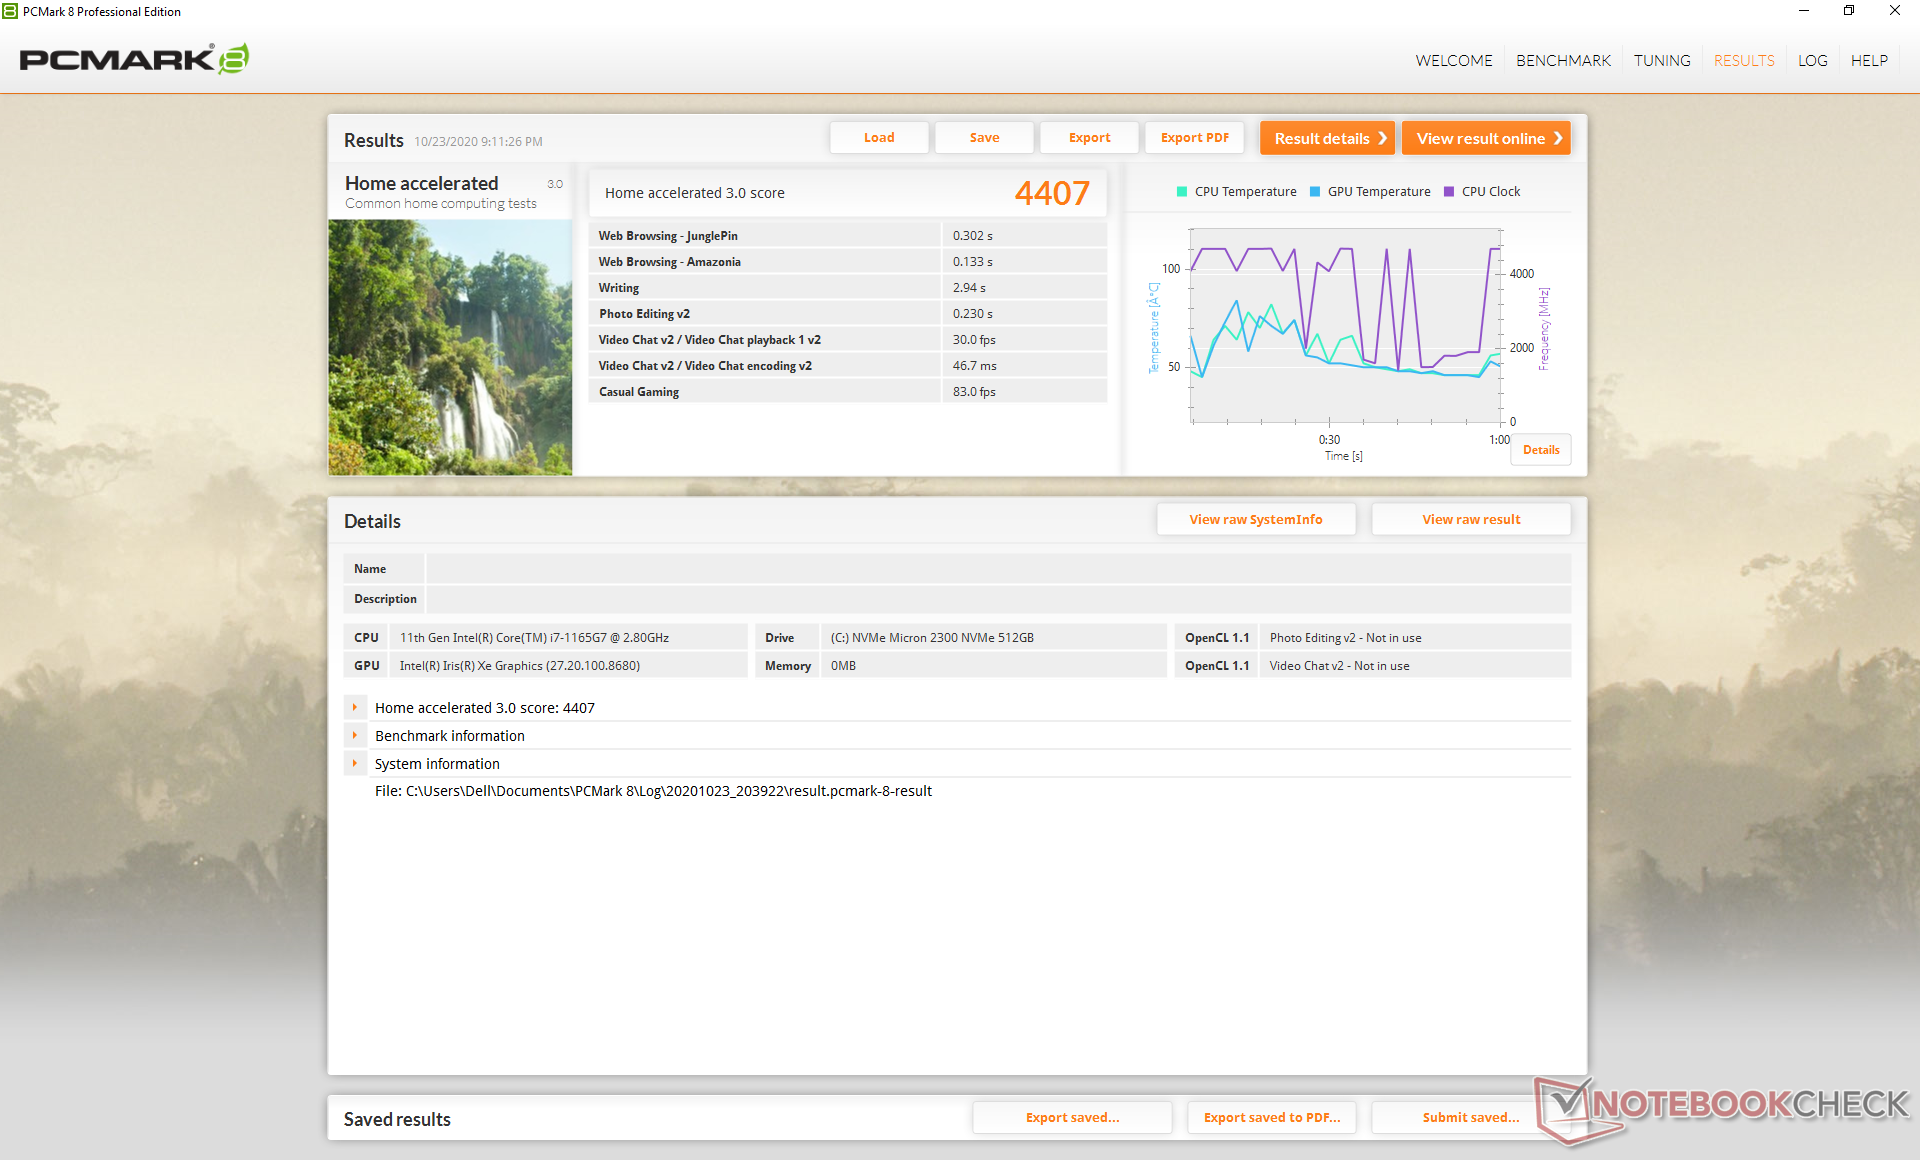
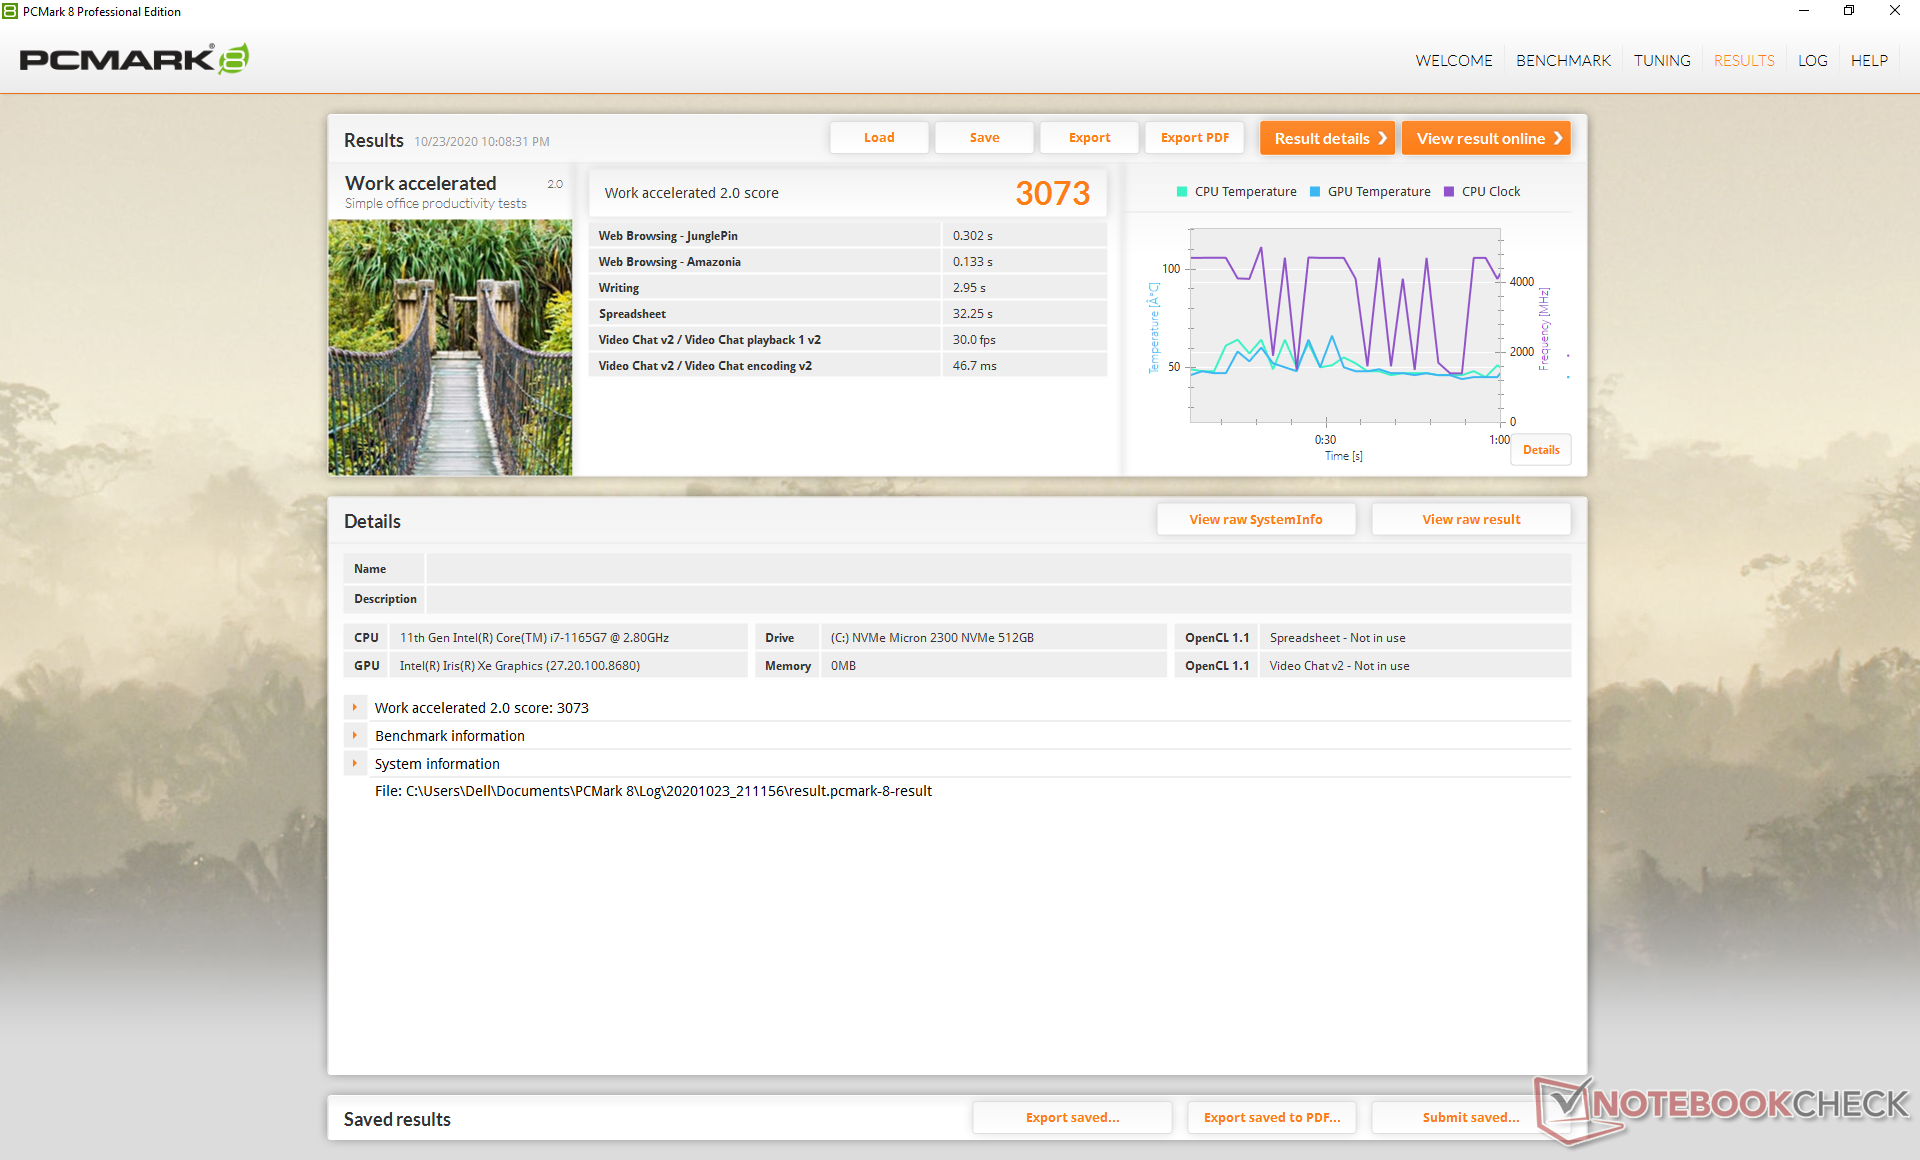
| PCMark 8 Home Score Accelerated v2 | 4407 punti | |
| PCMark 8 Work Score Accelerated v2 | 3073 punti | |
| PCMark 10 Score | 4914 punti | |
Aiuto | ||
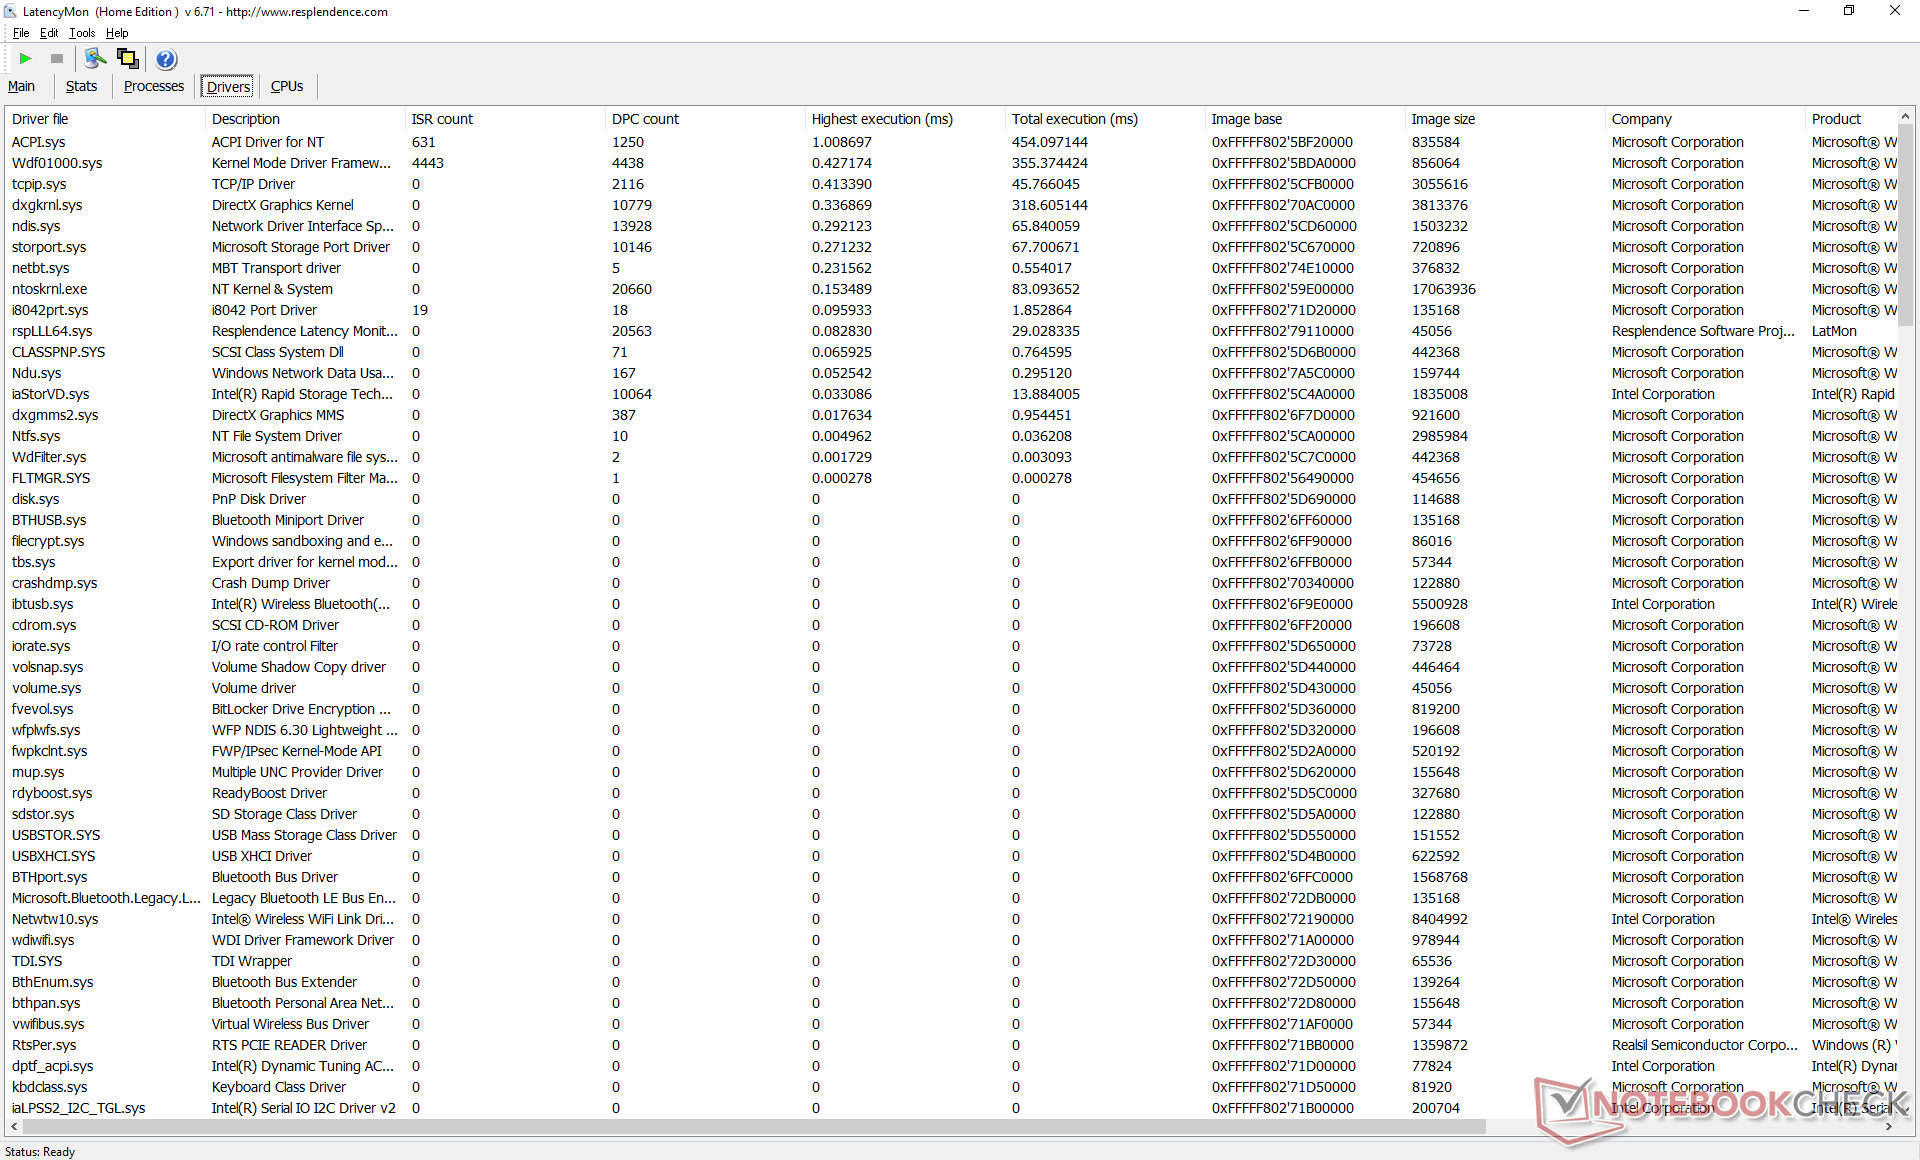
Latenze DPC
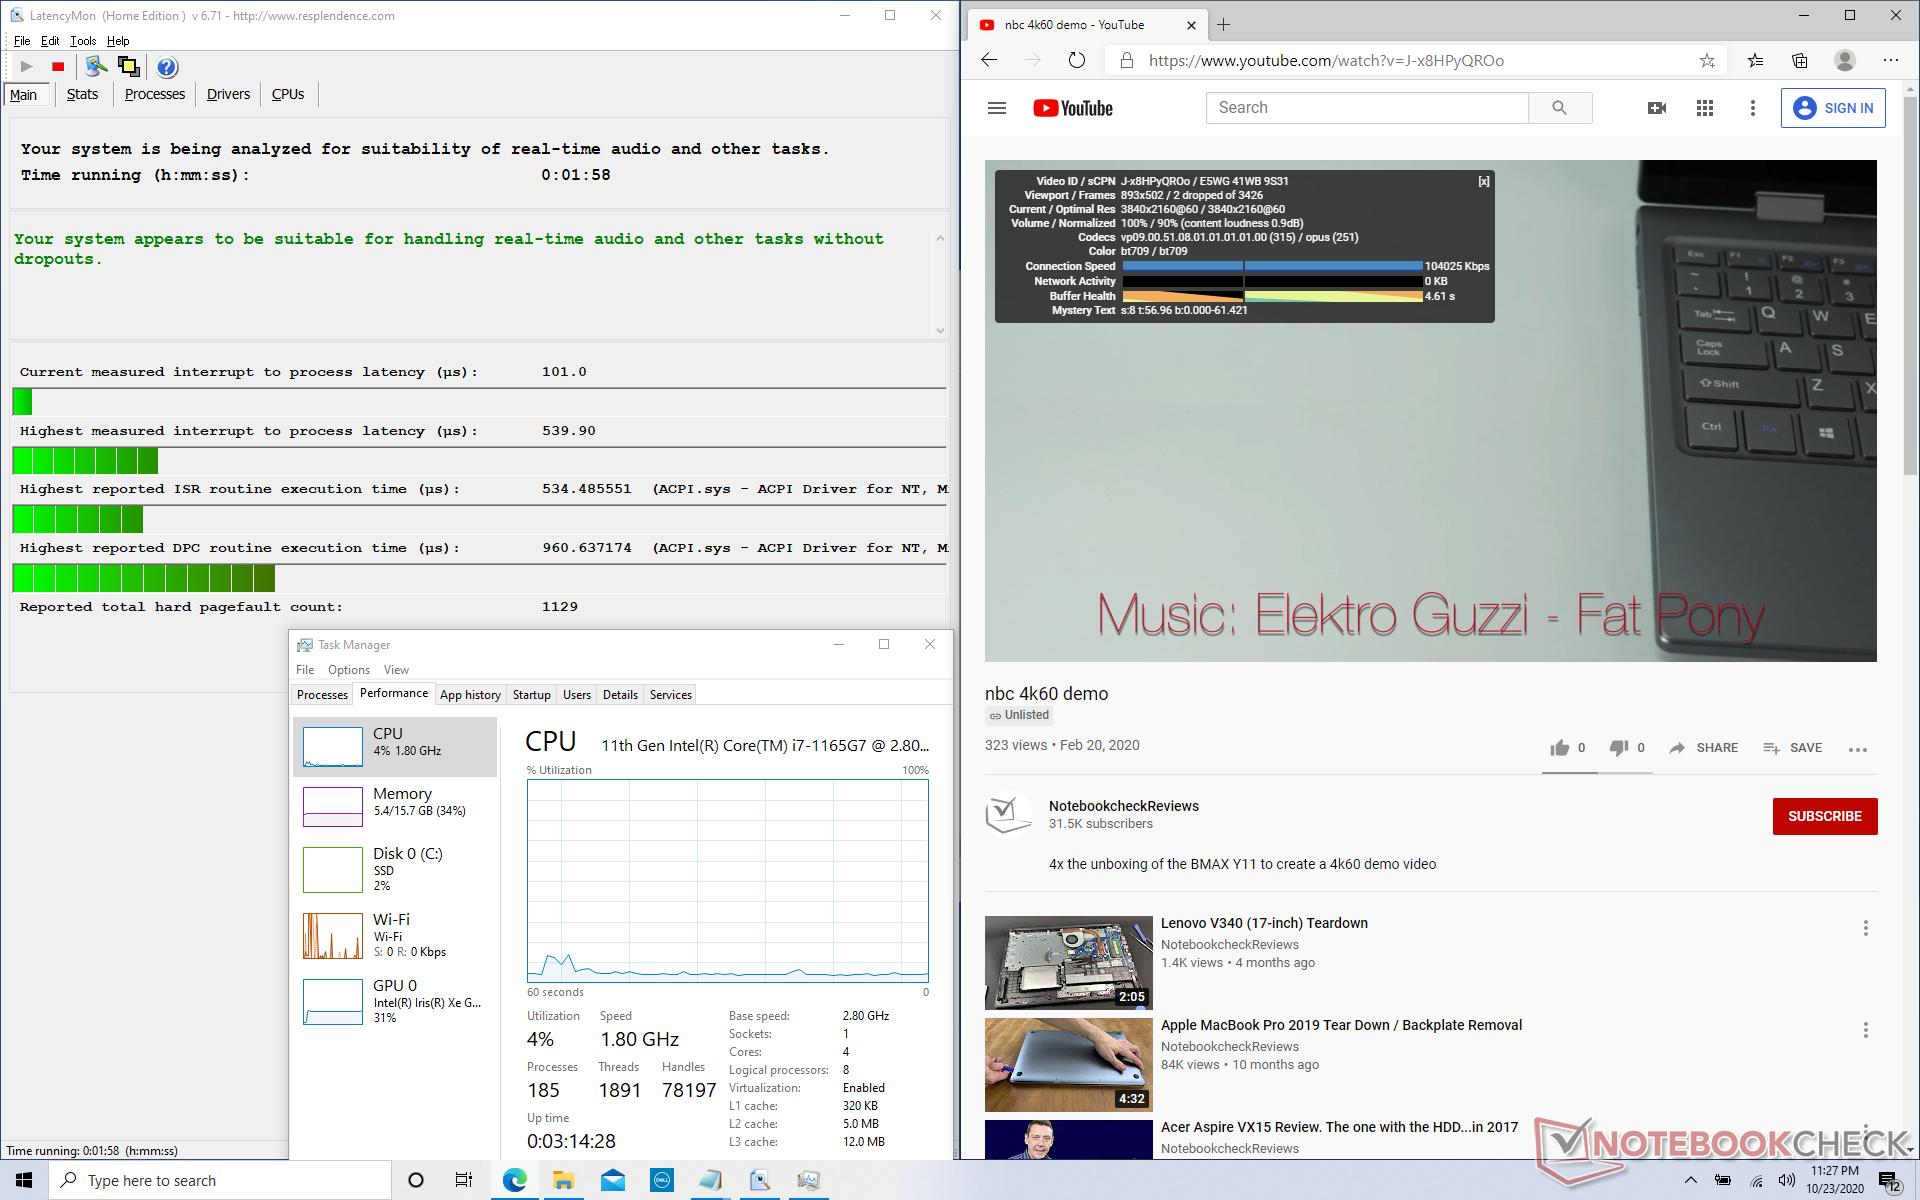
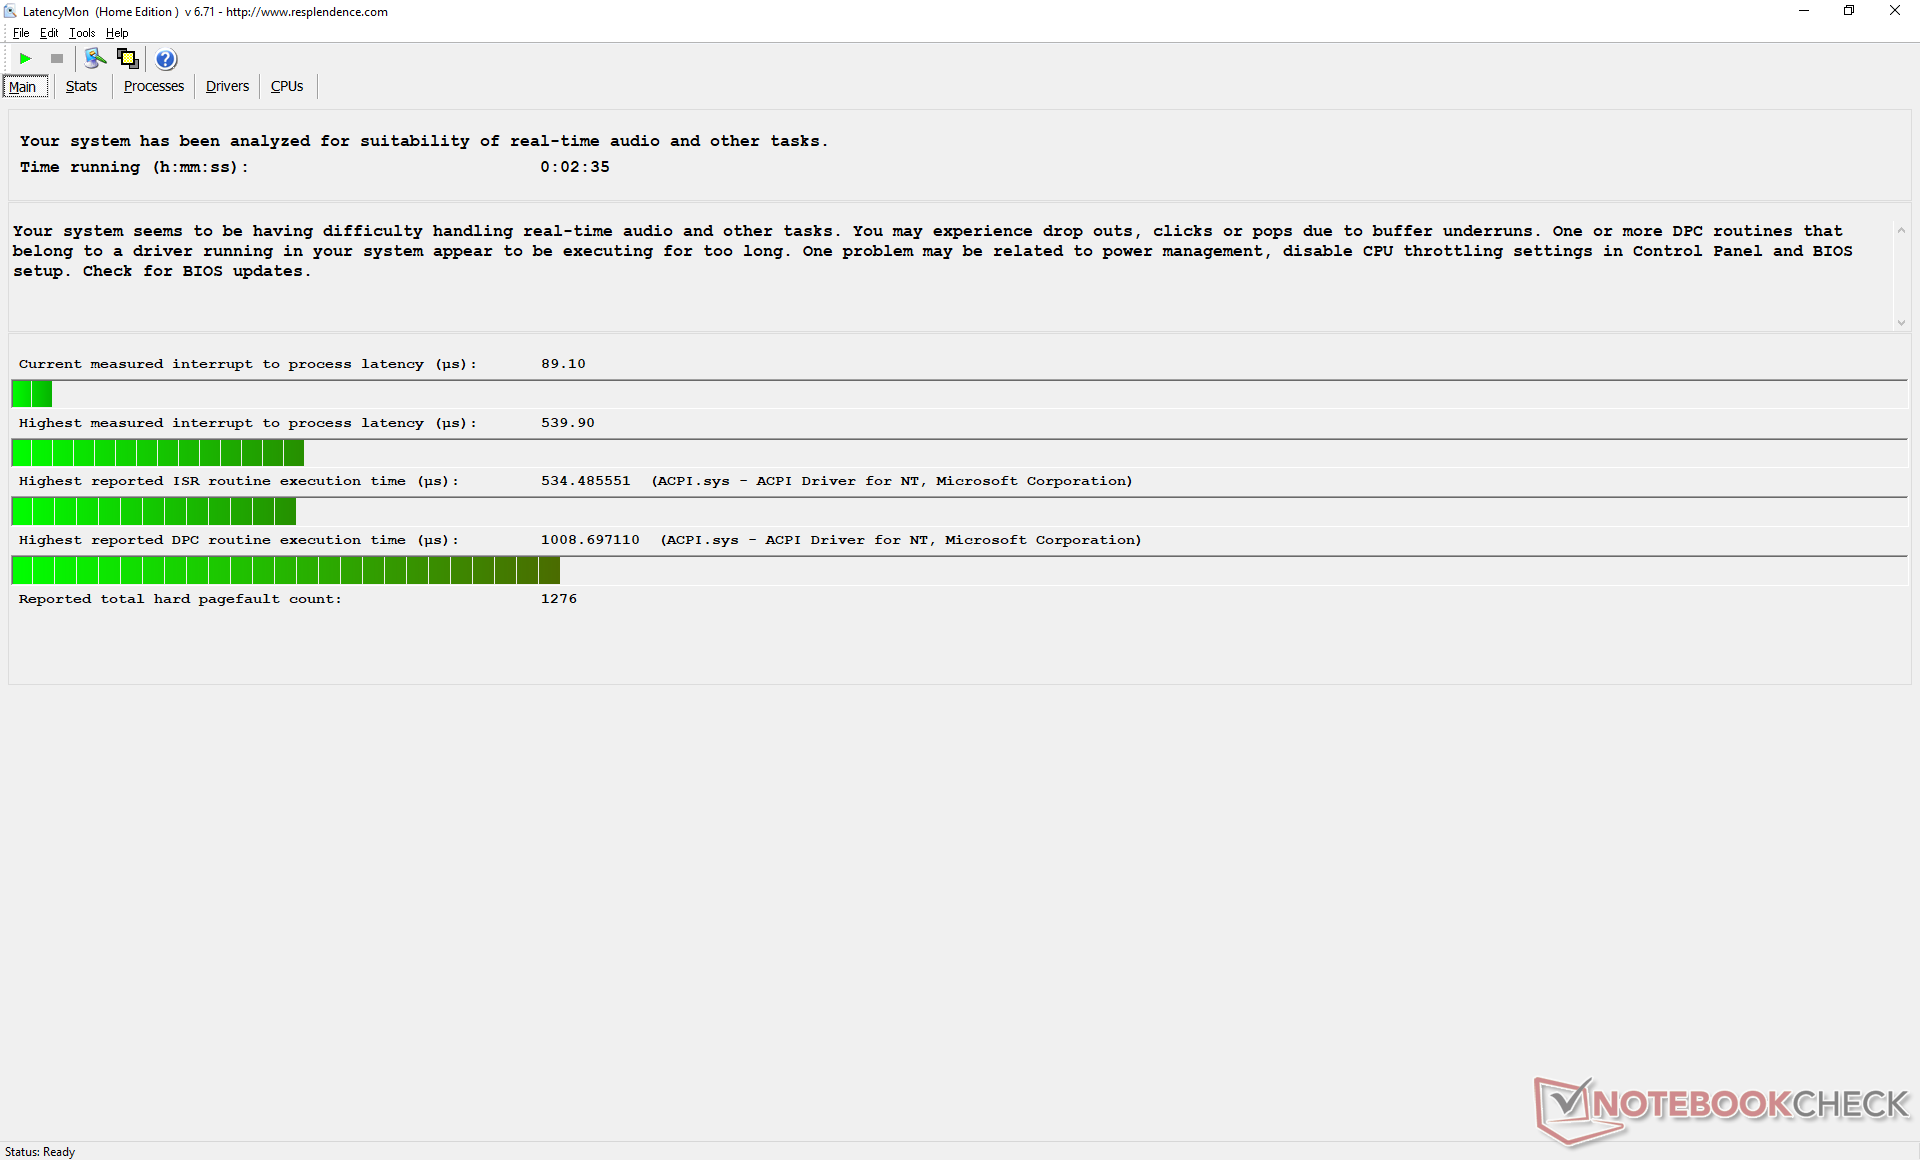
L'apertura di più schede del browser sulla nostra homepage non comporta alcun problema di ritardo del DPC secondo LatencyMon. L'avvio di Prime95, tuttavia, causa lievi ritardi. La riproduzione di 4K60 è fluida con solo due fotogrammi persi durante il nostro video di prova di YouTube di pochi minuti.
| DPC Latencies / LatencyMon - interrupt to process latency (max), Web, Youtube, Prime95 | |
| Dell XPS 13 9300 Core i7-1065G7 | |
| Lenovo Yoga Slim 7-14ARE | |
| Dell XPS 13 9310 Core i7 FHD | |
* ... Meglio usare valori piccoli
Dispositivi di archiviazione
Mentre i precedenti modelli XPS 13 sono stati forniti con SSD M.2 NVMe di Samsung, SK Hynix, Intel o Toshiba, la nostra ultima unità viene fornita con uno di Micron. Si tratta più o meno di una scommessa su quale SSD riceverete quando acquisterete un XPS 13 in un dato momento.
Fortunatamente per noi, il Micron 2200 è un drive NVMe di fascia alta con velocità di lettura e scrittura sequenziale che si avvicinano rispettivamente a 3300 MB/s e 2700 MB/s, per essere vicini alla popolare serie PM981 di Samsung. Tuttavia, non saremmo sorpresi se gli utenti ricevessero unità completamente diverse se ordinassero versioni di dimensioni SSD diverse.
Altri benchmarks per la memoria sono disponibili nella nostra tabella di SSDs e HDDs.
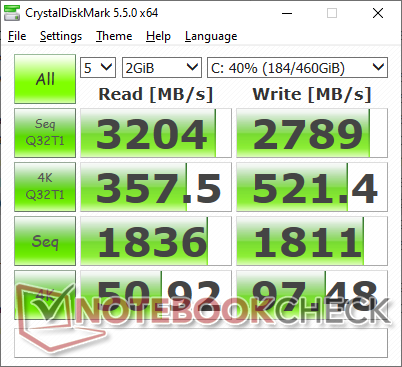
| Dell XPS 13 9310 Core i7 FHD Micron 2300 512GB MTFDHBA512TDV | Dell XPS 13 9300 Core i7-1065G7 Intel SSDPEMKF512G8 NVMe SSD | Apple MacBook Pro 13 2020 2GHz i5 10th-Gen Apple SSD SM0512F | Huawei MateBook X Pro 2020 i7 Samsung PM981a MZVLB1T0HBLR | HP Spectre x360 13-aw0013dx Intel Optane Memory H10 with Solid State Storage 32GB + 512GB HBRPEKNX0202A(L/H) | |
|---|---|---|---|---|---|
| AS SSD | -16% | -49% | 48% | -30% | |
| Seq Read (MB/s) | 2091 | 1956 -6% | 1300 -38% | 2737 31% | 1039 -50% |
| Seq Write (MB/s) | 1396 | 1227 -12% | 1518 9% | 2530 81% | 310.1 -78% |
| 4K Read (MB/s) | 49.29 | 63 28% | 14.09 -71% | 54 10% | 76 54% |
| 4K Write (MB/s) | 104.2 | 156.6 50% | 24.25 -77% | 152.5 46% | 118 13% |
| 4K-64 Read (MB/s) | 827 | 475.6 -42% | 725 -12% | 2011 143% | 371.8 -55% |
| 4K-64 Write (MB/s) | 1636 | 539 -67% | 169.6 -90% | 1260 -23% | 469.5 -71% |
| Access Time Read * (ms) | 0.066 | 0.042 36% | 0.172 -161% | 0.066 -0% | 0.067 -2% |
| Access Time Write * (ms) | 0.365 | 0.105 71% | 0.155 58% | 0.024 93% | 0.138 62% |
| Score Read (Points) | 1086 | 734 -32% | 869 -20% | 2339 115% | 552 -49% |
| Score Write (Points) | 1880 | 818 -56% | 346 -82% | 1666 -11% | 618 -67% |
| Score Total (Points) | 3499 | 1915 -45% | 1667 -52% | 5191 48% | 1448 -59% |
| Copy ISO MB/s (MB/s) | 1544 | 1022 -34% | 764 -51% | ||
| Copy Program MB/s (MB/s) | 613 | 302.8 -51% | 465.8 -24% | ||
| Copy Game MB/s (MB/s) | 1451 | 491.4 -66% | 764 -47% | ||
| CrystalDiskMark 5.2 / 6 | 15% | -31% | 14% | -7% | |
| Write 4K (MB/s) | 97.5 | 186.8 92% | 28.16 -71% | 165.6 70% | 112.6 15% |
| Read 4K (MB/s) | 50.9 | 71.4 40% | 17.5 -66% | 50.2 -1% | 131 157% |
| Write Seq (MB/s) | 1811 | 1203 -34% | 1195 -34% | 1905 5% | 458.9 -75% |
| Read Seq (MB/s) | 1836 | 2600 42% | 1470 -20% | 1669 -9% | 1355 -26% |
| Write 4K Q32T1 (MB/s) | 521 | 514 -1% | 205 -61% | 474.6 -9% | 341.3 -34% |
| Read 4K Q32T1 (MB/s) | 357.5 | 570 59% | 692 94% | 508 42% | 320.6 -10% |
| Write Seq Q32T1 (MB/s) | 2879 | 786 -73% | 1475 -49% | 3007 4% | 1219 -58% |
| Read Seq Q32T1 (MB/s) | 3204 | 2947 -8% | 1920 -40% | 3556 11% | 2462 -23% |
| Media totale (Programma / Settaggio) | -1% /
-5% | -40% /
-41% | 31% /
34% | -19% /
-22% |
* ... Meglio usare valori piccoli

Throttling Disco: DiskSpd Read Loop, Queue Depth 8
Prestazioni GPU
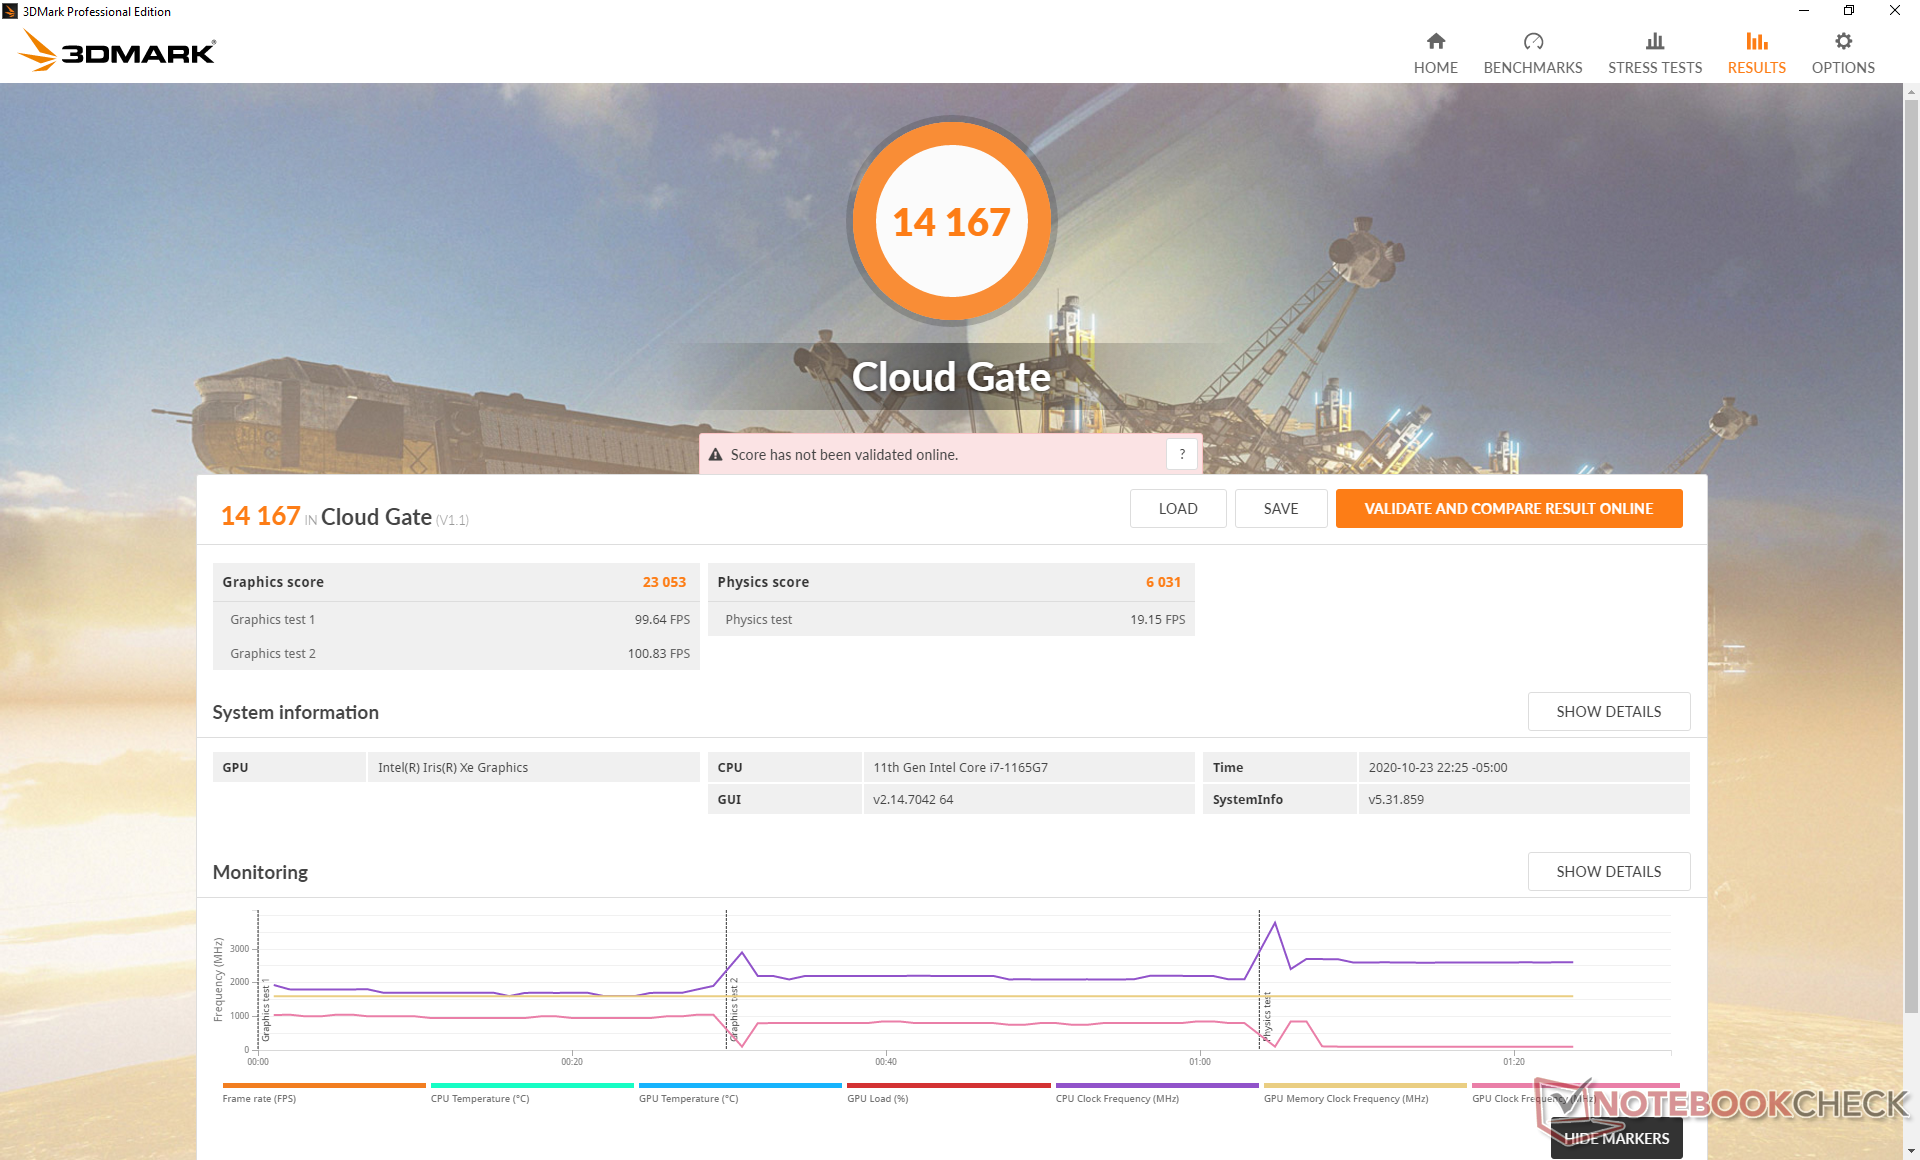
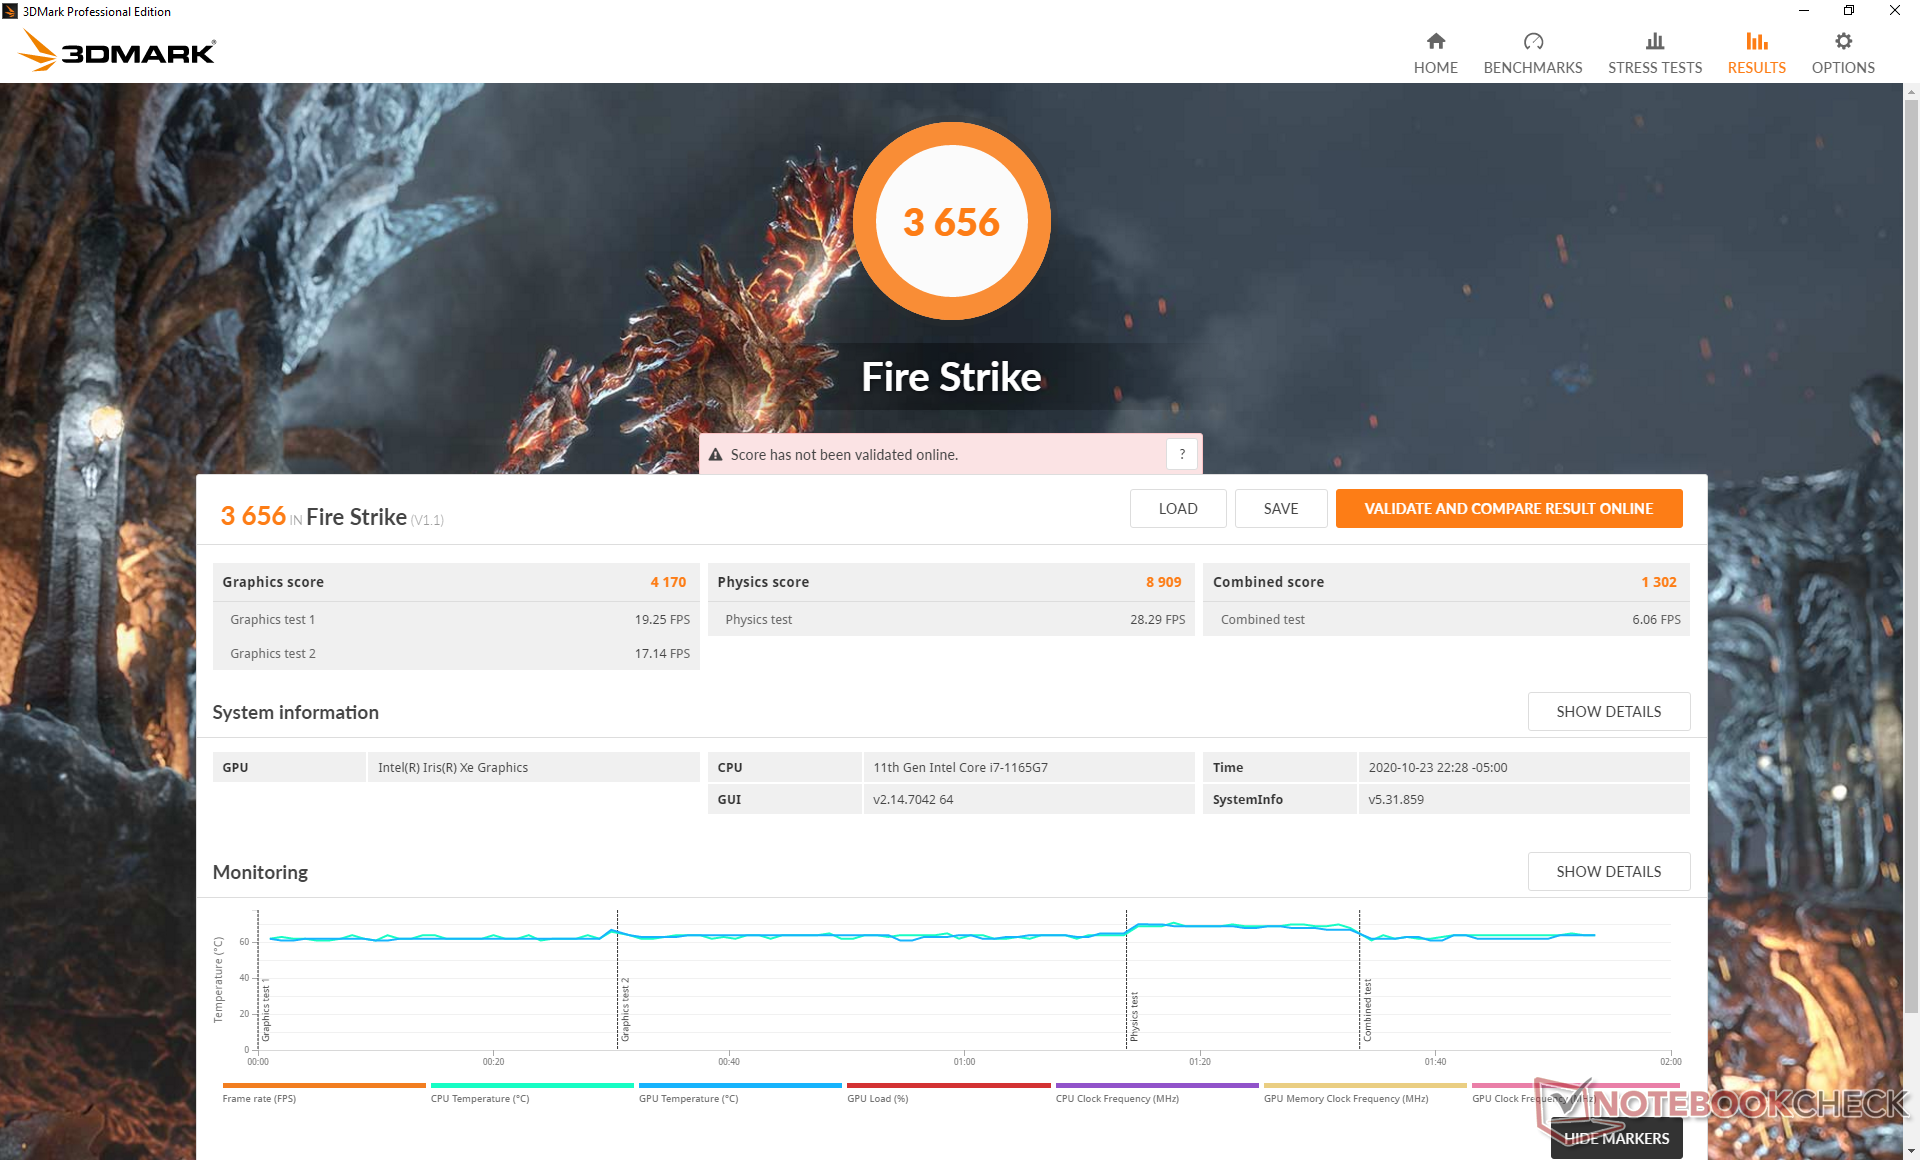
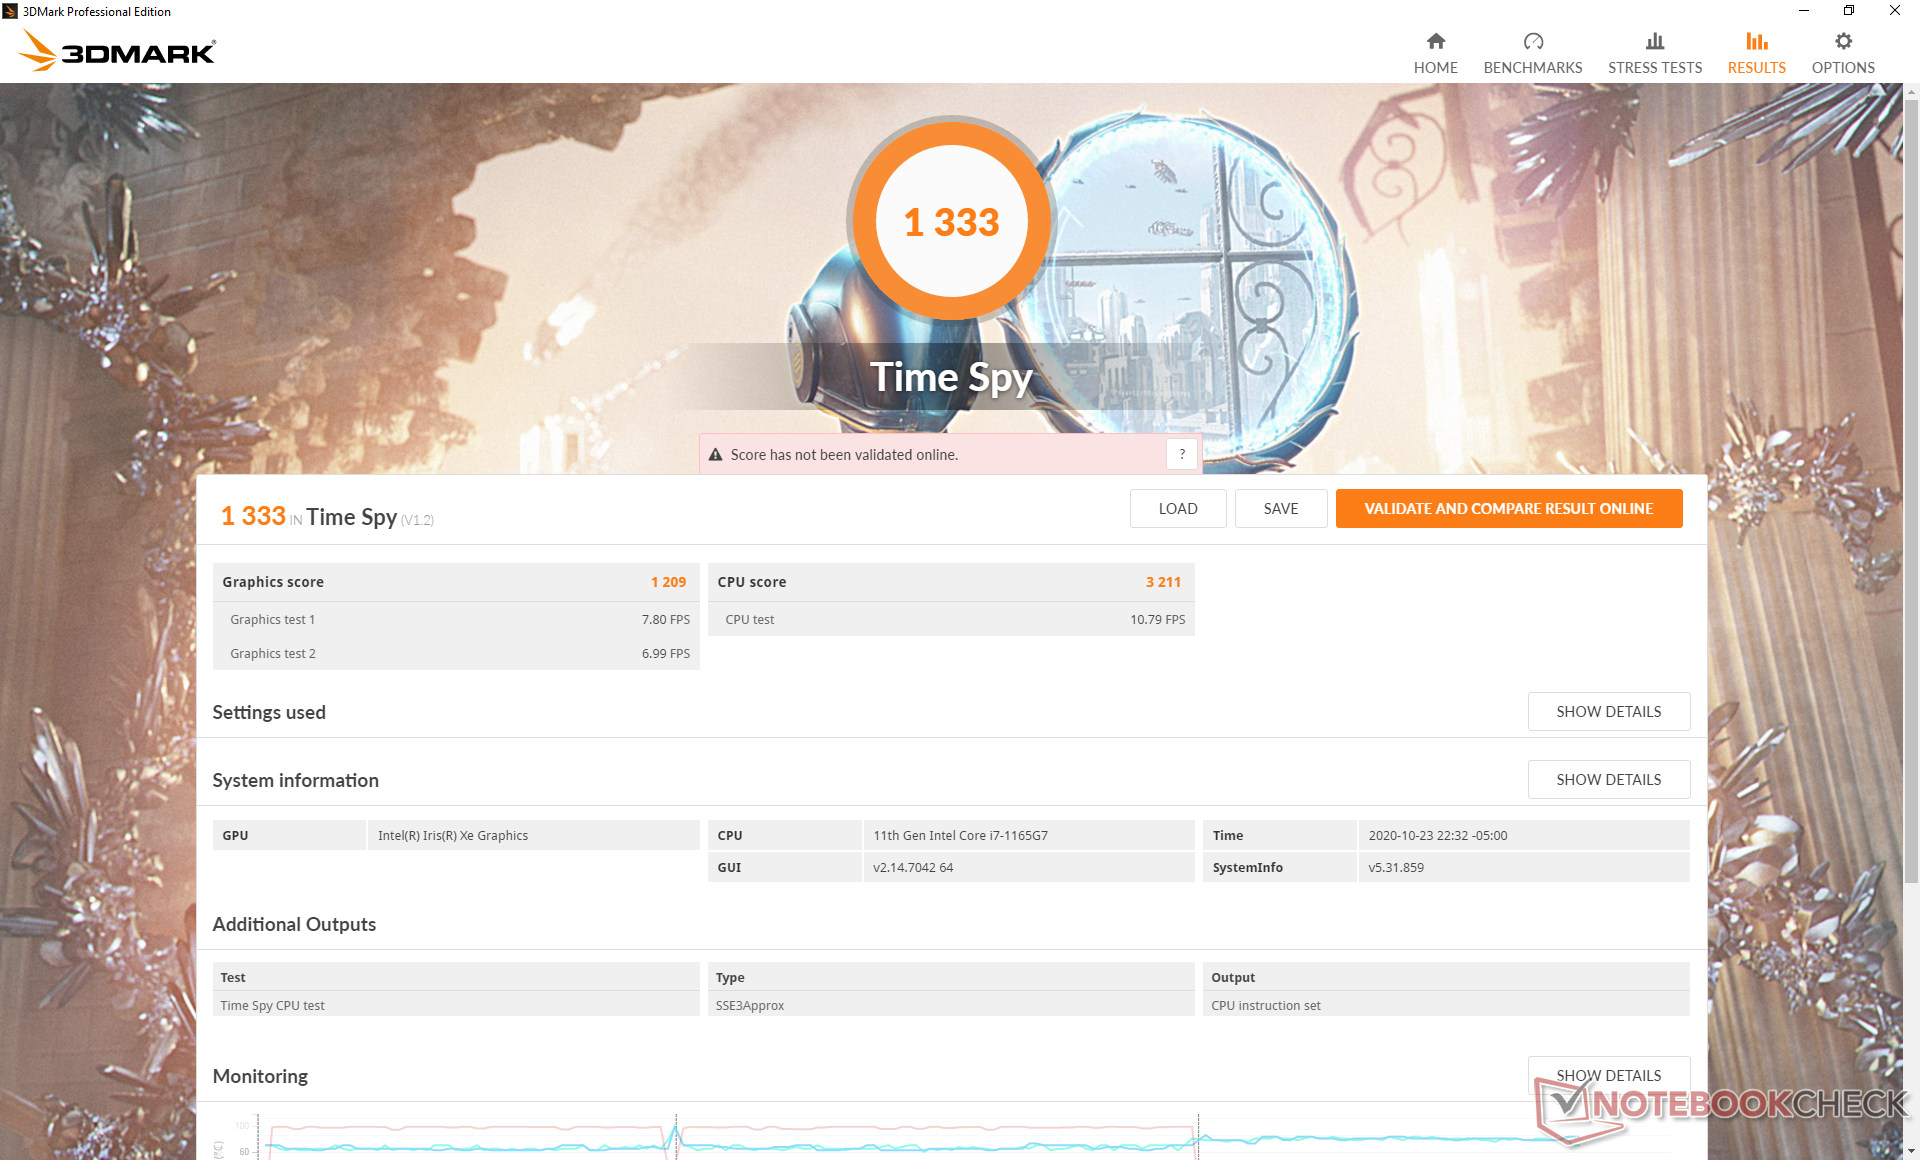
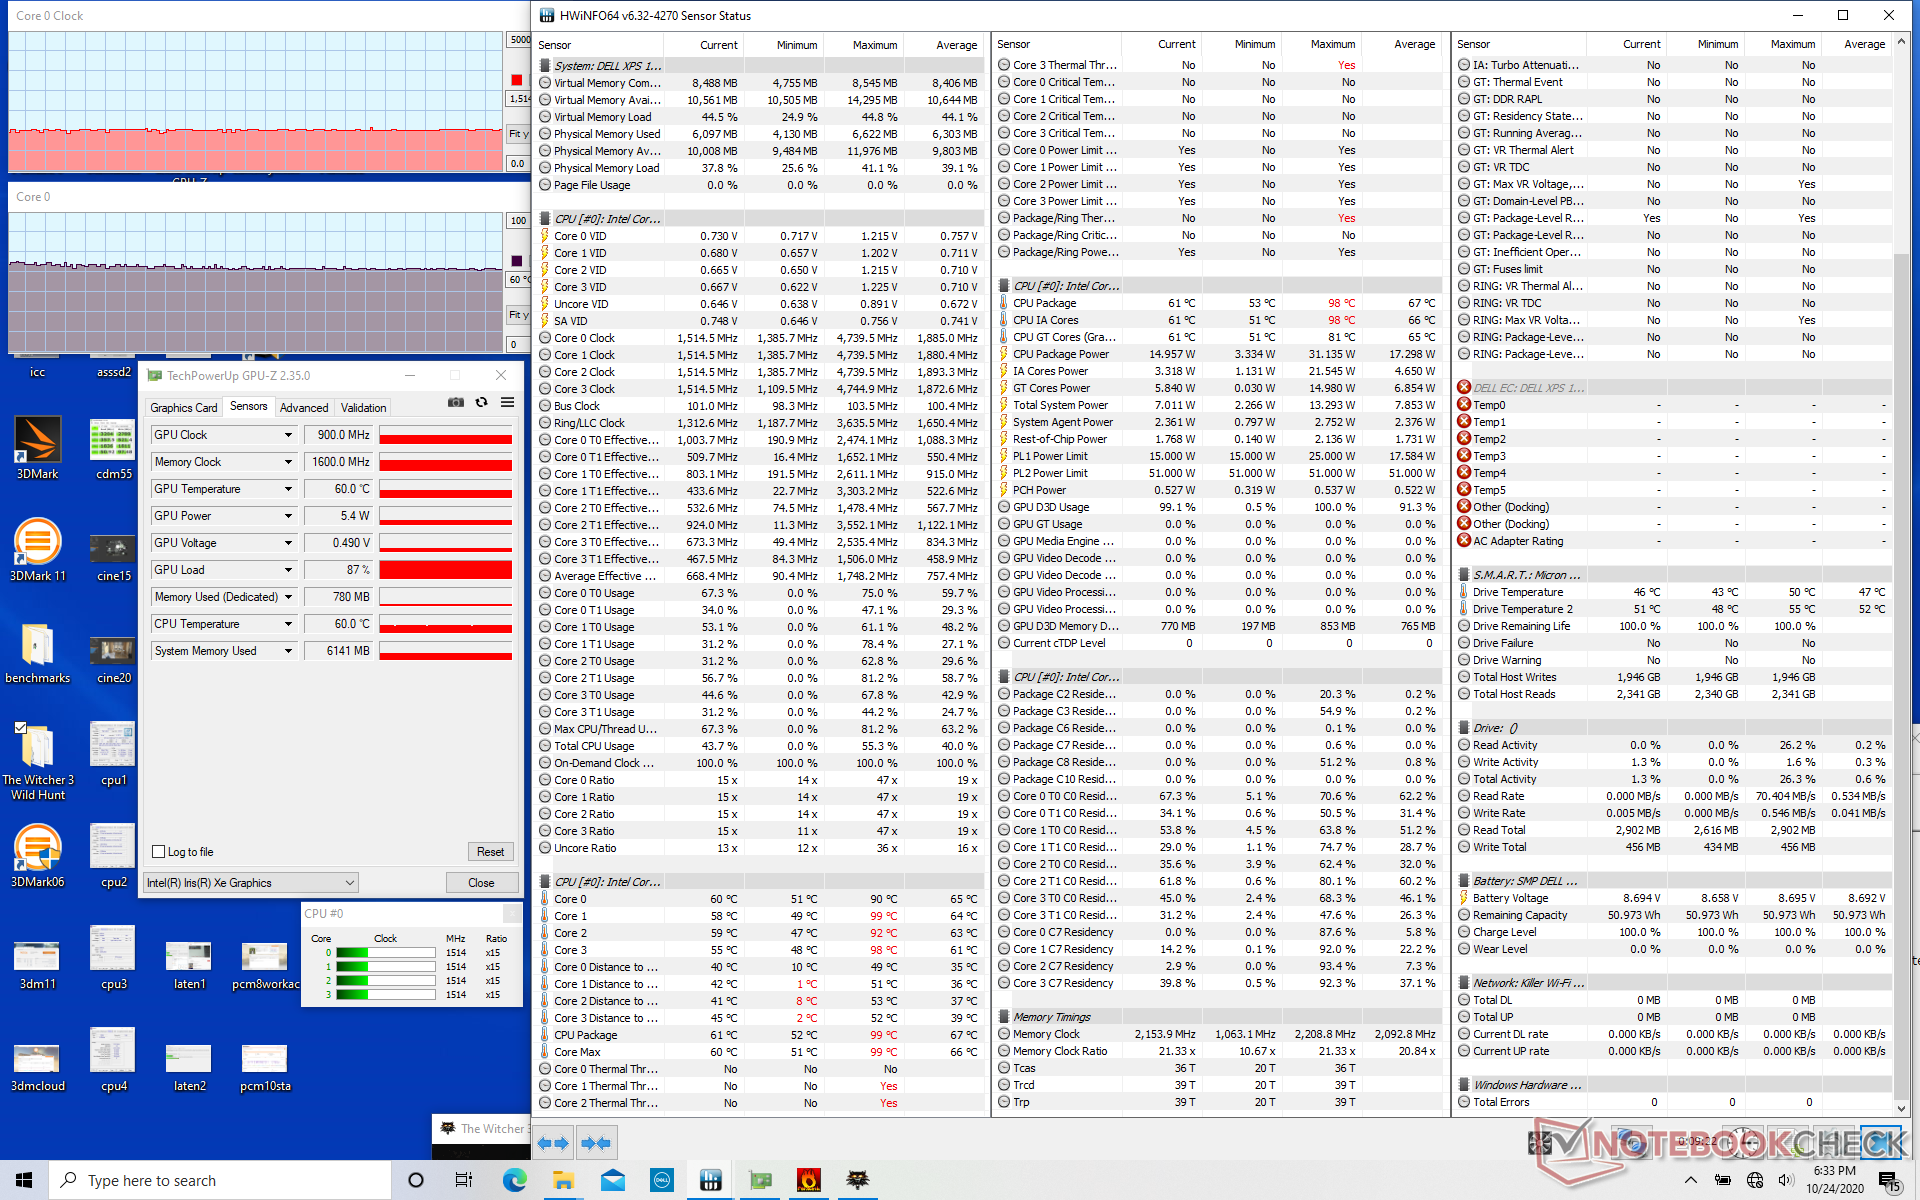
I risultati di 3DMark sono impressionanti per una GPU integrata con punteggi che sono dal 30 al 35% superiori anche alla GeForce MX250 dedicata o quasi il 50% superiori a quelli di Iris Plus G7 nell'XPS 13 9300. Come abbiamo già dimostrato, tuttavia, questi risultati sintetici non si traducono bene in prestazioni gaming reali e quindi gli utenti non dovrebbero aspettarsi frame rate dal 30 al 35% superiori rispetto a un portatile GeForce MX250. Final Fantasy 15, Strange Brigade e Witcher 3, per esempio, girano più veloci sul nostro XPS 13 9310 rispetto al nostro ZenBook 14 alimentato da MX250, mentre il contrario è vero per DOTA 2 Reborn, X-Plane 11.11 e GTA V.
Si noti che la sintonizzazione dinamica di Dell ha un effetto negativo sui frame rate. Quando si ruota al minimo sul Witcher 3 alle impostazioni più basse, ad esempio, i frame rate oscillerebbero tra 61 e 80 FPS come mostrato dal nostro grafico di seguito, mentre i frame rate sarebbero più costanti e stabili sulla maggior parte degli altri portatili.
Per ulteriori informazioni tecniche e benchmarks di confronto, consultare la nostra pagina su Intel Iris Xe . Ci aspettiamo che le prestazioni complessive di gioco migliorino nel tempo grazie agli aggiornamenti dei drivers.
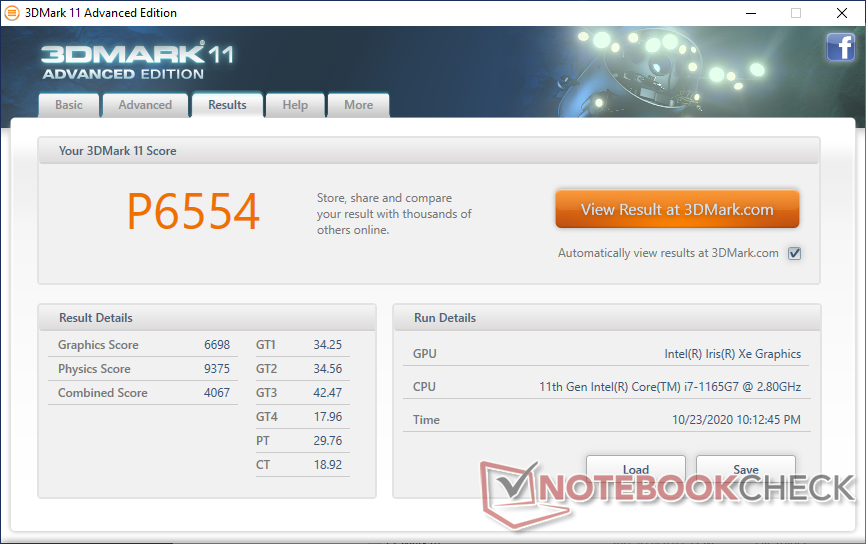
| 3DMark 11 Performance | 6554 punti | |
| 3DMark Cloud Gate Standard Score | 14167 punti | |
| 3DMark Fire Strike Score | 3656 punti | |
| 3DMark Time Spy Score | 1333 punti | |
Aiuto | ||
| basso | medio | alto | ultra | |
|---|---|---|---|---|
| GTA V (2015) | 84.3 | 76.8 | 24.7 | 10.5 |
| The Witcher 3 (2015) | 97.7 | 58.4 | 32.7 | 14.3 |
| Dota 2 Reborn (2015) | 77.5 | 54.3 | 40.5 | 42.5 |
| Final Fantasy XV Benchmark (2018) | 33.7 | 19.6 | 15.4 | |
| X-Plane 11.11 (2018) | 48 | 37.3 | 32.5 | |
| Strange Brigade (2018) | 94.4 | 38.5 | 30.4 | 24 |
Emissioni
Rumorosità
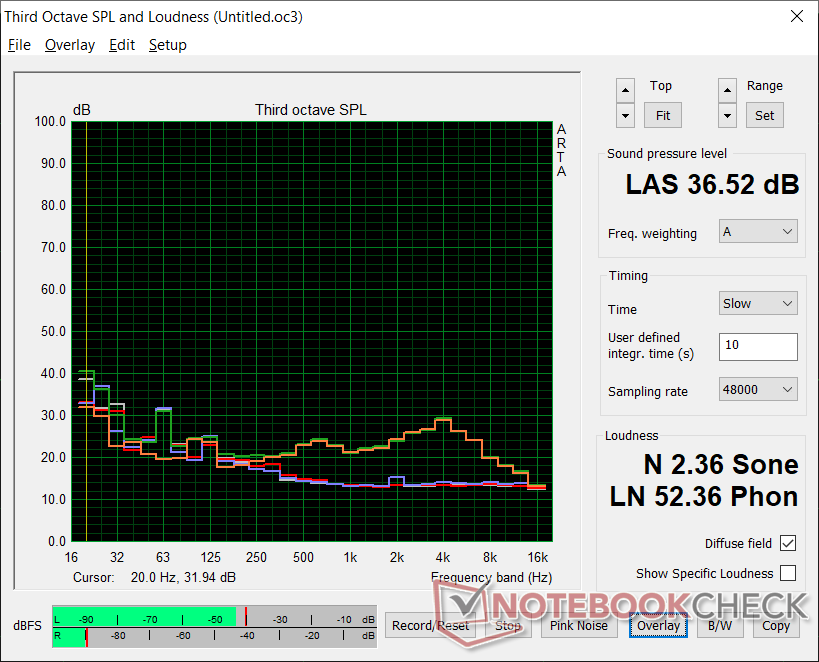
Le caratteristiche di rumore della ventola sono in gran parte le stesse se confrontate con l'XPS 9300. La cosa più importante è che gli RPM delle ventole sono costanti nonostante le velocità di clock della CPU in continuo cambiamento quando sono sottoposte a carichi elevati. Il sistema è in grado di rimanere quasi completamente silenzioso anche durante tutta la prima scena di 90 secondi del benchmark 3DMark 06.
| Dell XPS 13 9310 Core i7 FHD Iris Xe G7 96EUs, i7-1165G7, Micron 2300 512GB MTFDHBA512TDV | Dell XPS 13 9300 Core i7-1065G7 Iris Plus Graphics G7 (Ice Lake 64 EU), i7-1065G7, Intel SSDPEMKF512G8 NVMe SSD | Apple MacBook Pro 13 2020 2GHz i5 10th-Gen Iris Plus Graphics G7 (Ice Lake 64 EU), i5-1038NG7, Apple SSD SM0512F | Huawei MateBook X Pro 2020 i7 GeForce MX250, i7-10510U, Samsung PM981a MZVLB1T0HBLR | Lenovo Yoga Slim 7-14ARE Vega 8, R7 4800U, Samsung SSD PM981a MZVLB512HBJQ | |
|---|---|---|---|---|---|
| Noise | -11% | -15% | -16% | -4% | |
| off /ambiente * (dB) | 25.7 | 28.3 -10% | 29.6 -15% | 29.6 -15% | 26.3 -2% |
| Idle Minimum * (dB) | 25.7 | 28.3 -10% | 29.6 -15% | 29.6 -15% | 26.5 -3% |
| Idle Average * (dB) | 25.7 | 28.3 -10% | 29.6 -15% | 29.6 -15% | 26.5 -3% |
| Idle Maximum * (dB) | 25.9 | 28.3 -9% | 29.6 -14% | 30.3 -17% | 26.5 -2% |
| Load Average * (dB) | 26.2 | 32.5 -24% | 34.4 -31% | 38 -45% | 31.8 -21% |
| Witcher 3 ultra * (dB) | 36.5 | 39.3 -8% | 36.1 1% | 38 -4% | 35.9 2% |
| Load Maximum * (dB) | 36.6 | 39.3 -7% | 42.1 -15% | 38 -4% | 35.9 2% |
* ... Meglio usare valori piccoli
Rumorosità
| Idle |
| 25.7 / 25.7 / 25.9 dB(A) |
| Sotto carico |
| 26.2 / 36.6 dB(A) |
 | ||
30 dB silenzioso 40 dB(A) udibile 50 dB(A) rumoroso |
||
min: | ||
Temperature
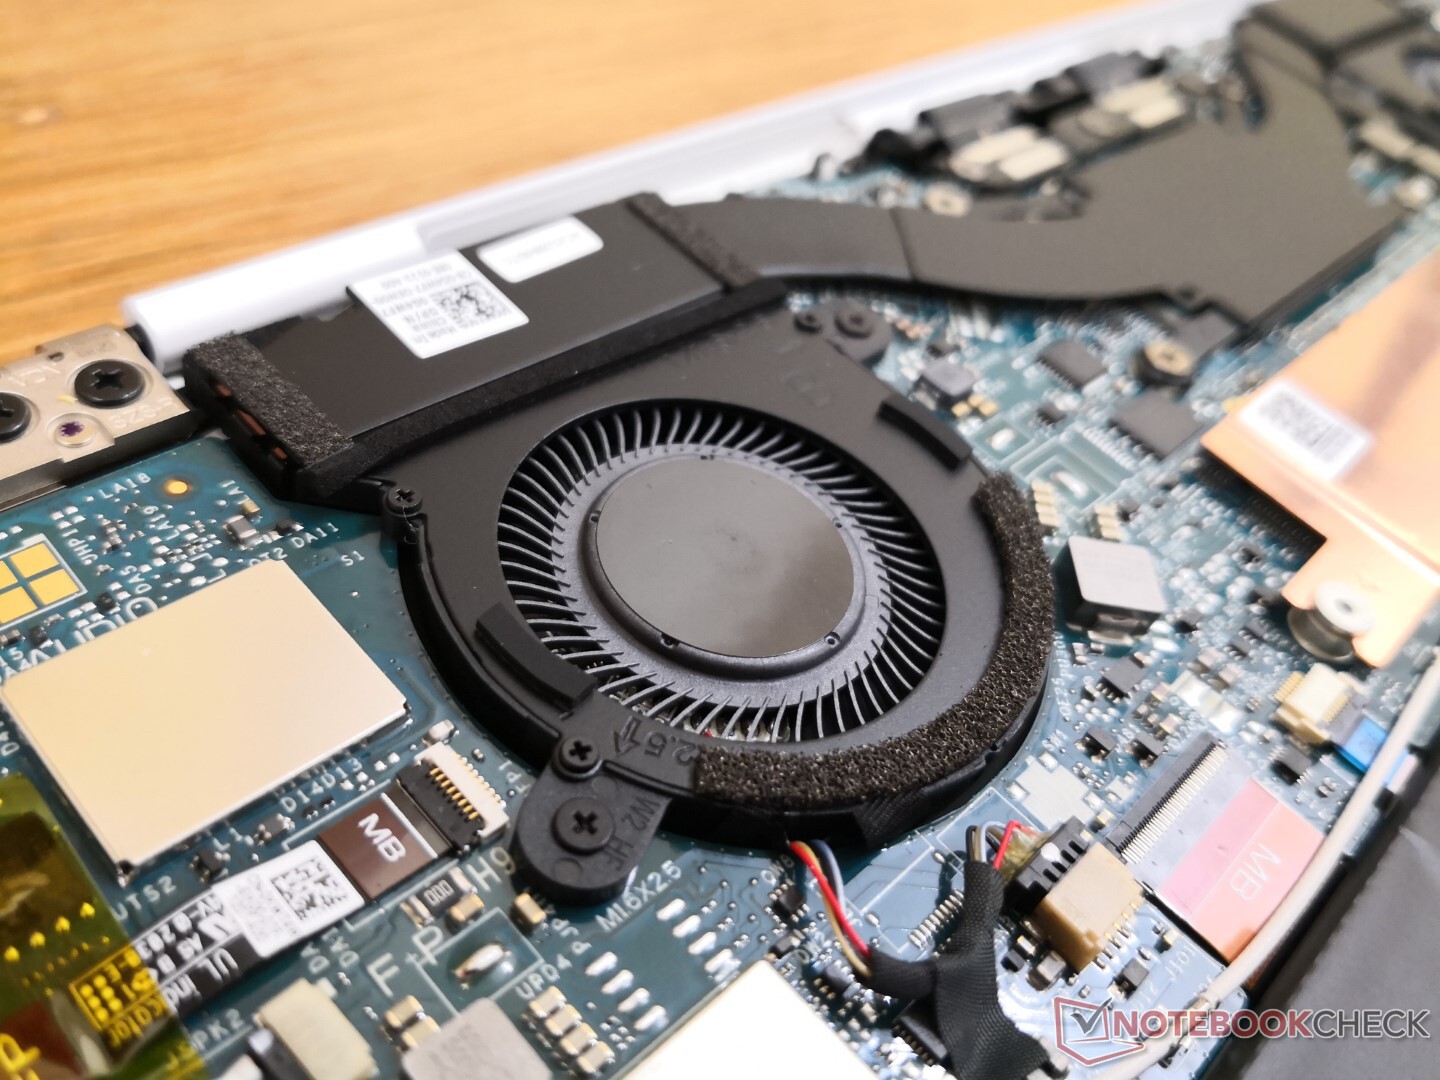
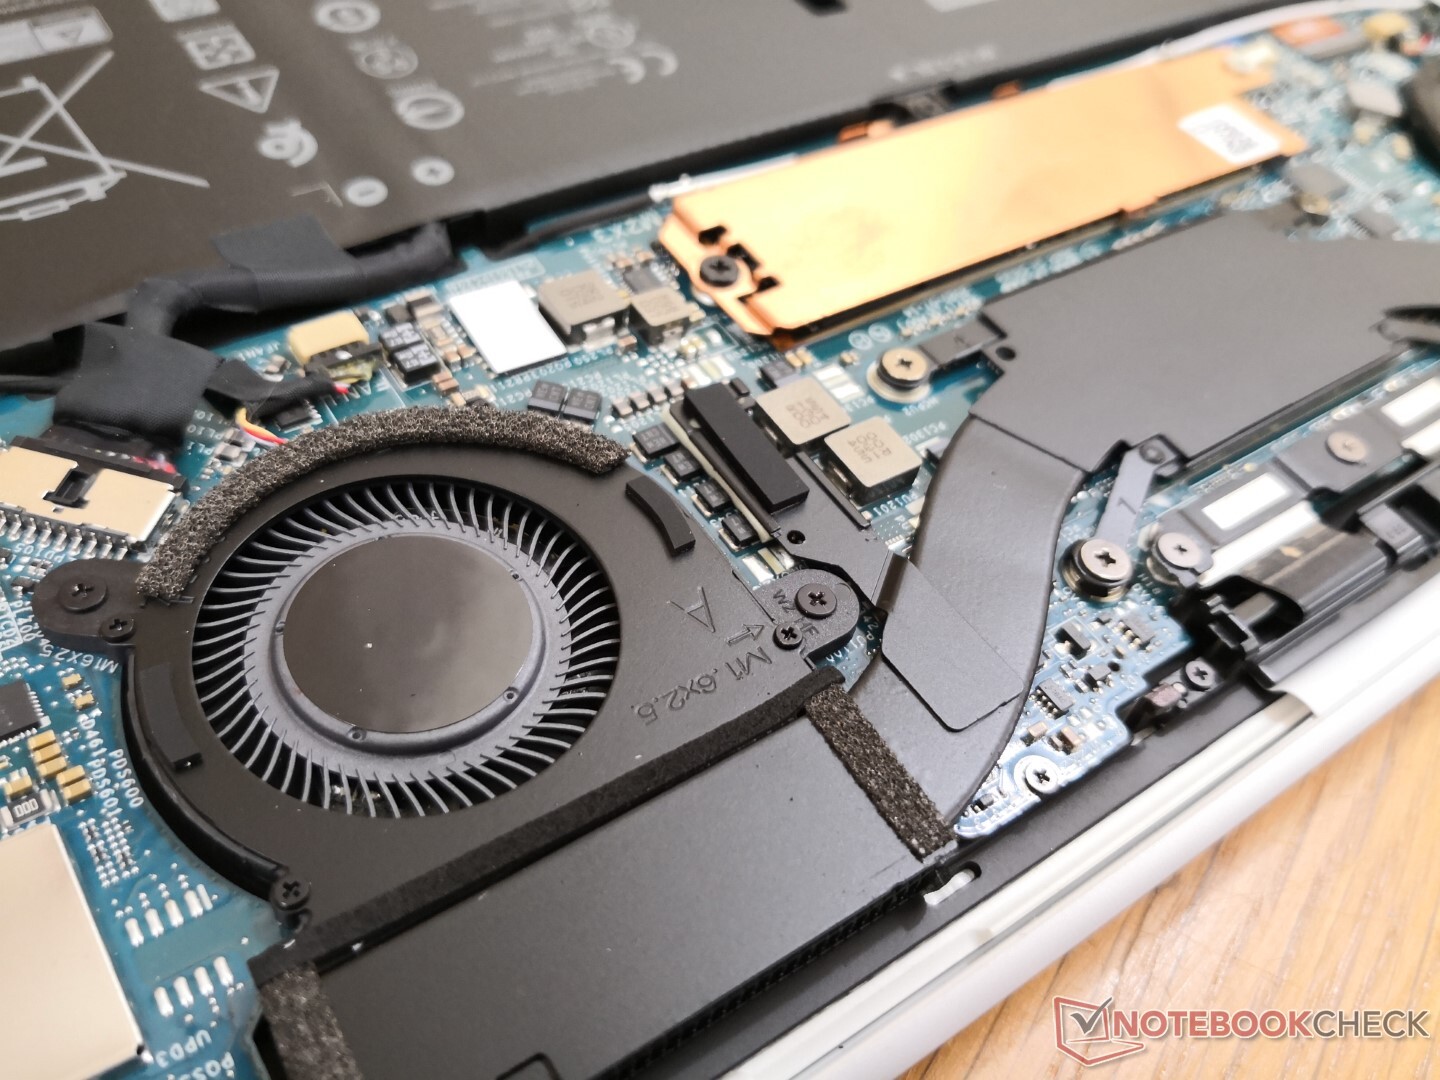
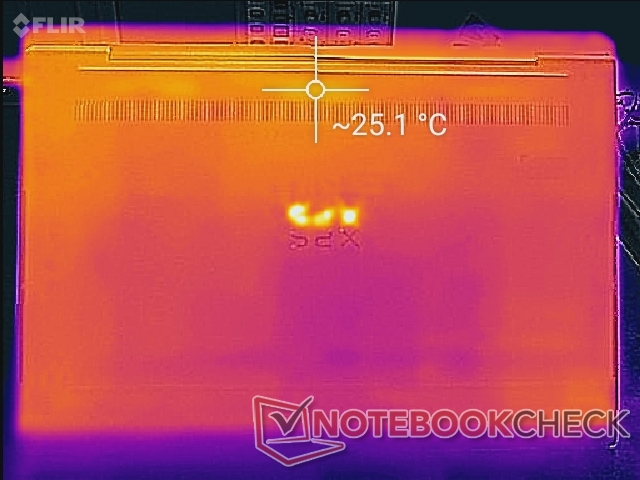
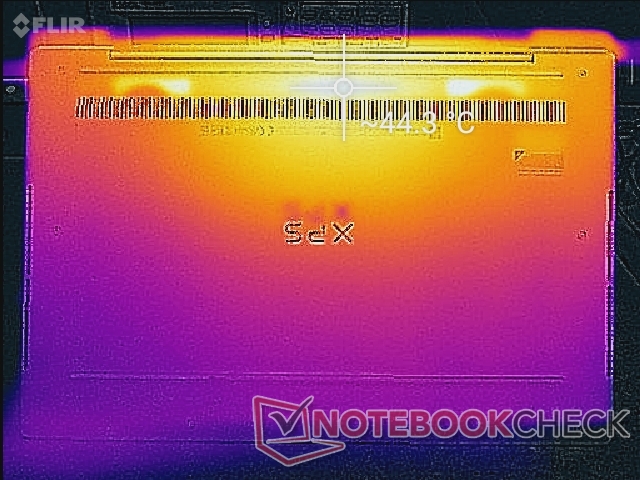
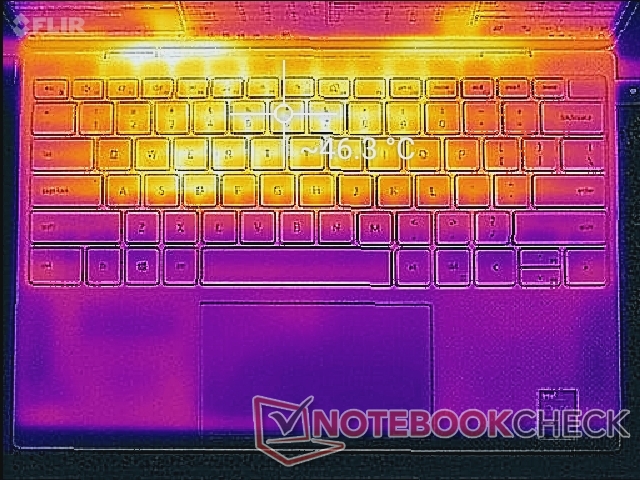
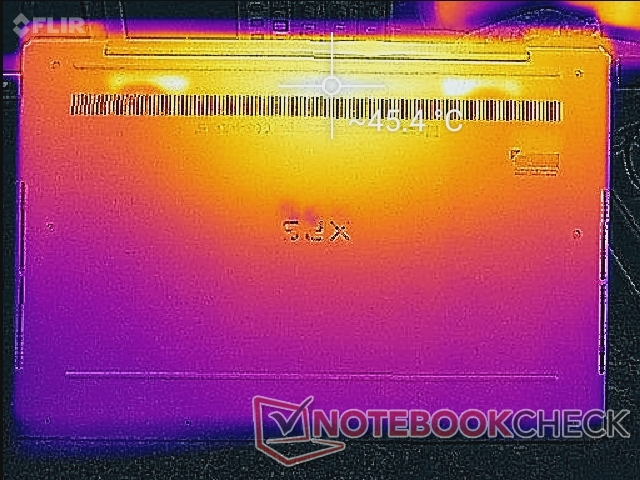
Le temperature di superficie sono quasi identiche a quelle dell'XPS 13 9300 dell'anno scorso, nonostante il passaggio a un processore di nuova generazione con una grafica integrata più veloce. A differenza della maggior parte degli Ultrabooks più economici che hanno una sola ventola interna, il Dell ne integra due per un profilo di temperatura più simmetrico.
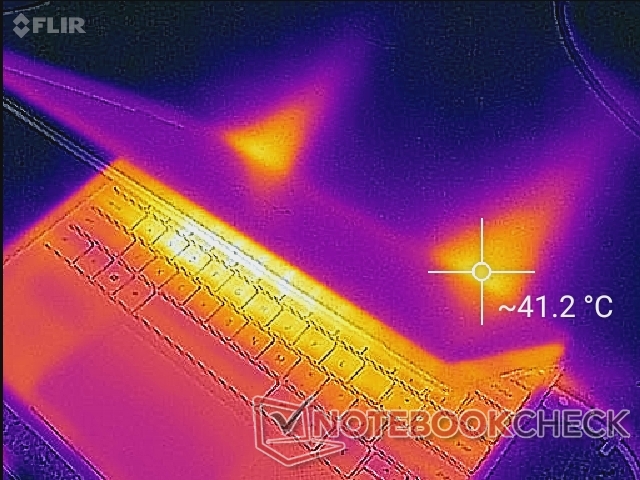
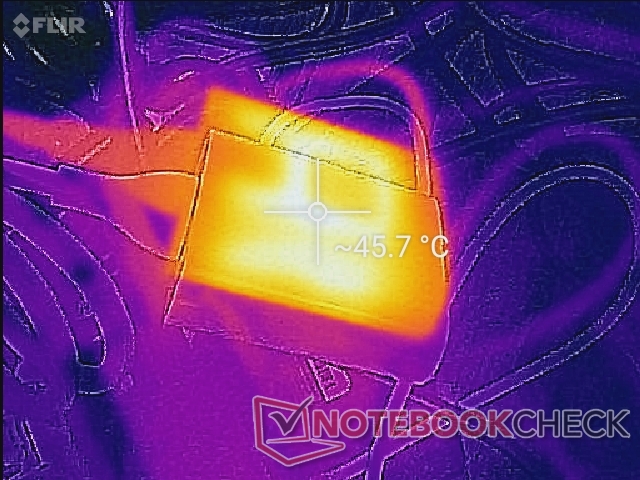
(-) La temperatura massima sul lato superiore è di 46.2 °C / 115 F, rispetto alla media di 35.9 °C / 97 F, che varia da 21.4 a 59 °C per questa classe Subnotebook.
(-) Il lato inferiore si riscalda fino ad un massimo di 46 °C / 115 F, rispetto alla media di 39.2 °C / 103 F
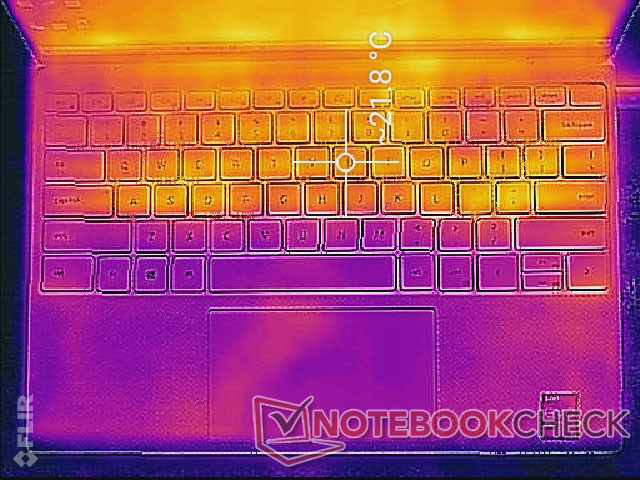
(+) In idle, la temperatura media del lato superiore è di 20.7 °C / 69 F, rispetto alla media deld ispositivo di 30.8 °C / 87 F.
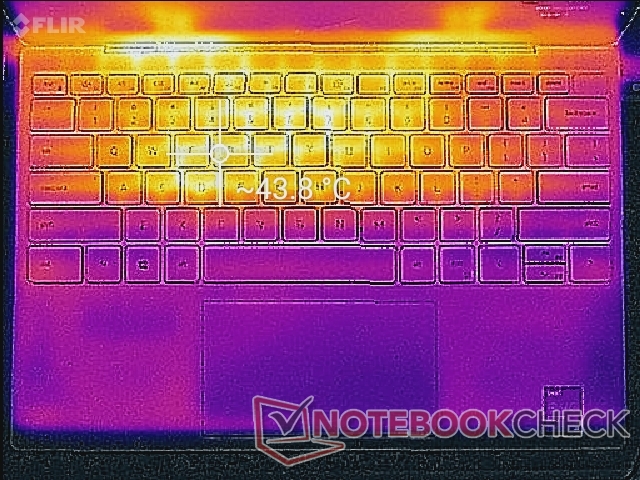
(±) Riproducendo The Witcher 3, la temperatura media per il lato superiore e' di 34.2 °C / 94 F, rispetto alla media del dispositivo di 30.8 °C / 87 F.
(+) I poggiapolsi e il touchpad raggiungono la temperatura massima della pelle (32 °C / 89.6 F) e quindi non sono caldi.
(-) La temperatura media della zona del palmo della mano di dispositivi simili e'stata di 28.2 °C / 82.8 F (-3.8 °C / -6.8 F).
Stress Test
L'esecuzione di Prime95 rivela perché i nostri punteggi e i frame rates registrati su CineBench sono instabili. Le frequenze di clock aumentano prima a 4,1 GHz durante i primi secondi di test, ma poi oscillano tra 2,5 GHz a 3,1 GHz e 71 °C a 78 °C, rispettivamente, rispetto a un piatto a 2,3 GHz e 68 °C dell'Asus ZenBook 14 UX425 con lo stesso processore Core i7-1165G7. In altre parole, la sintonizzazione dinamica di Dell consente di ottenere prestazioni mediamente più rapide a costi di clock e temperature costanti. Questo approccio può essere utile quando si eseguono compiti pesanti per la CPU, ma può essere uno scenario da incubo per i giochi.
Ad esempio, l'esecuzione di The Witcher 3 su impostazioni basse porrta i clocks di CPU e GPU ad oscillare tra 1,4 GHz e 2,0 GHz e 850 MHz e 1100 MHz, rispettivamente, per frame rates non uniformi. L'attivazione di v-sync può alleviare il frame pacing irregolare a seconda del gioco e delle impostazioni.
Il funzionamento a batteria avrà un impatto maggiore sulle prestazioni grafiche rispetto a quelle della CPU. Un test 3DMark 11 sulle batterie restituisce punteggi Physics e Graphics di 10904 e 6093 punti, rispettivamente, rispetto a 9375 e 6698 punti con l'alimentazione da rete elettrica.
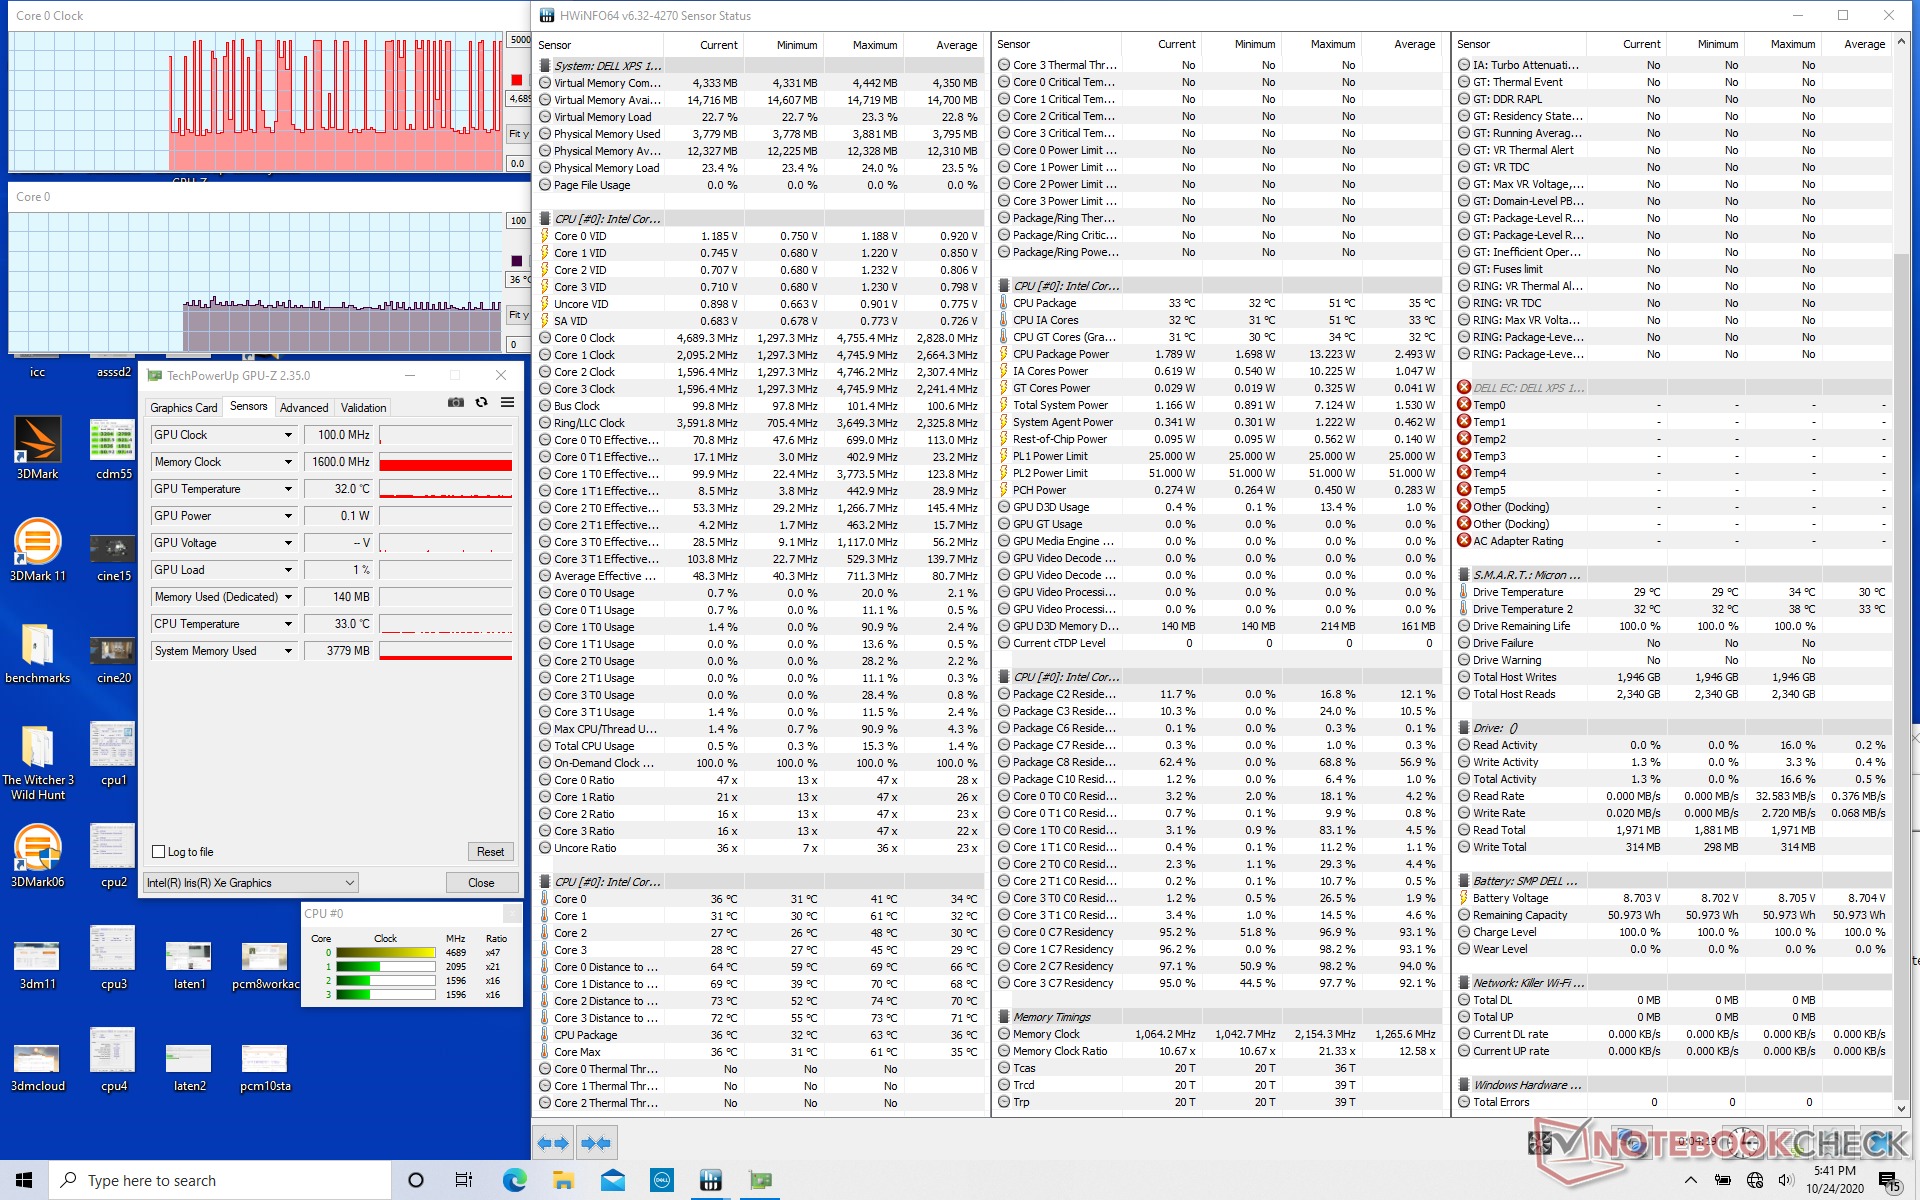
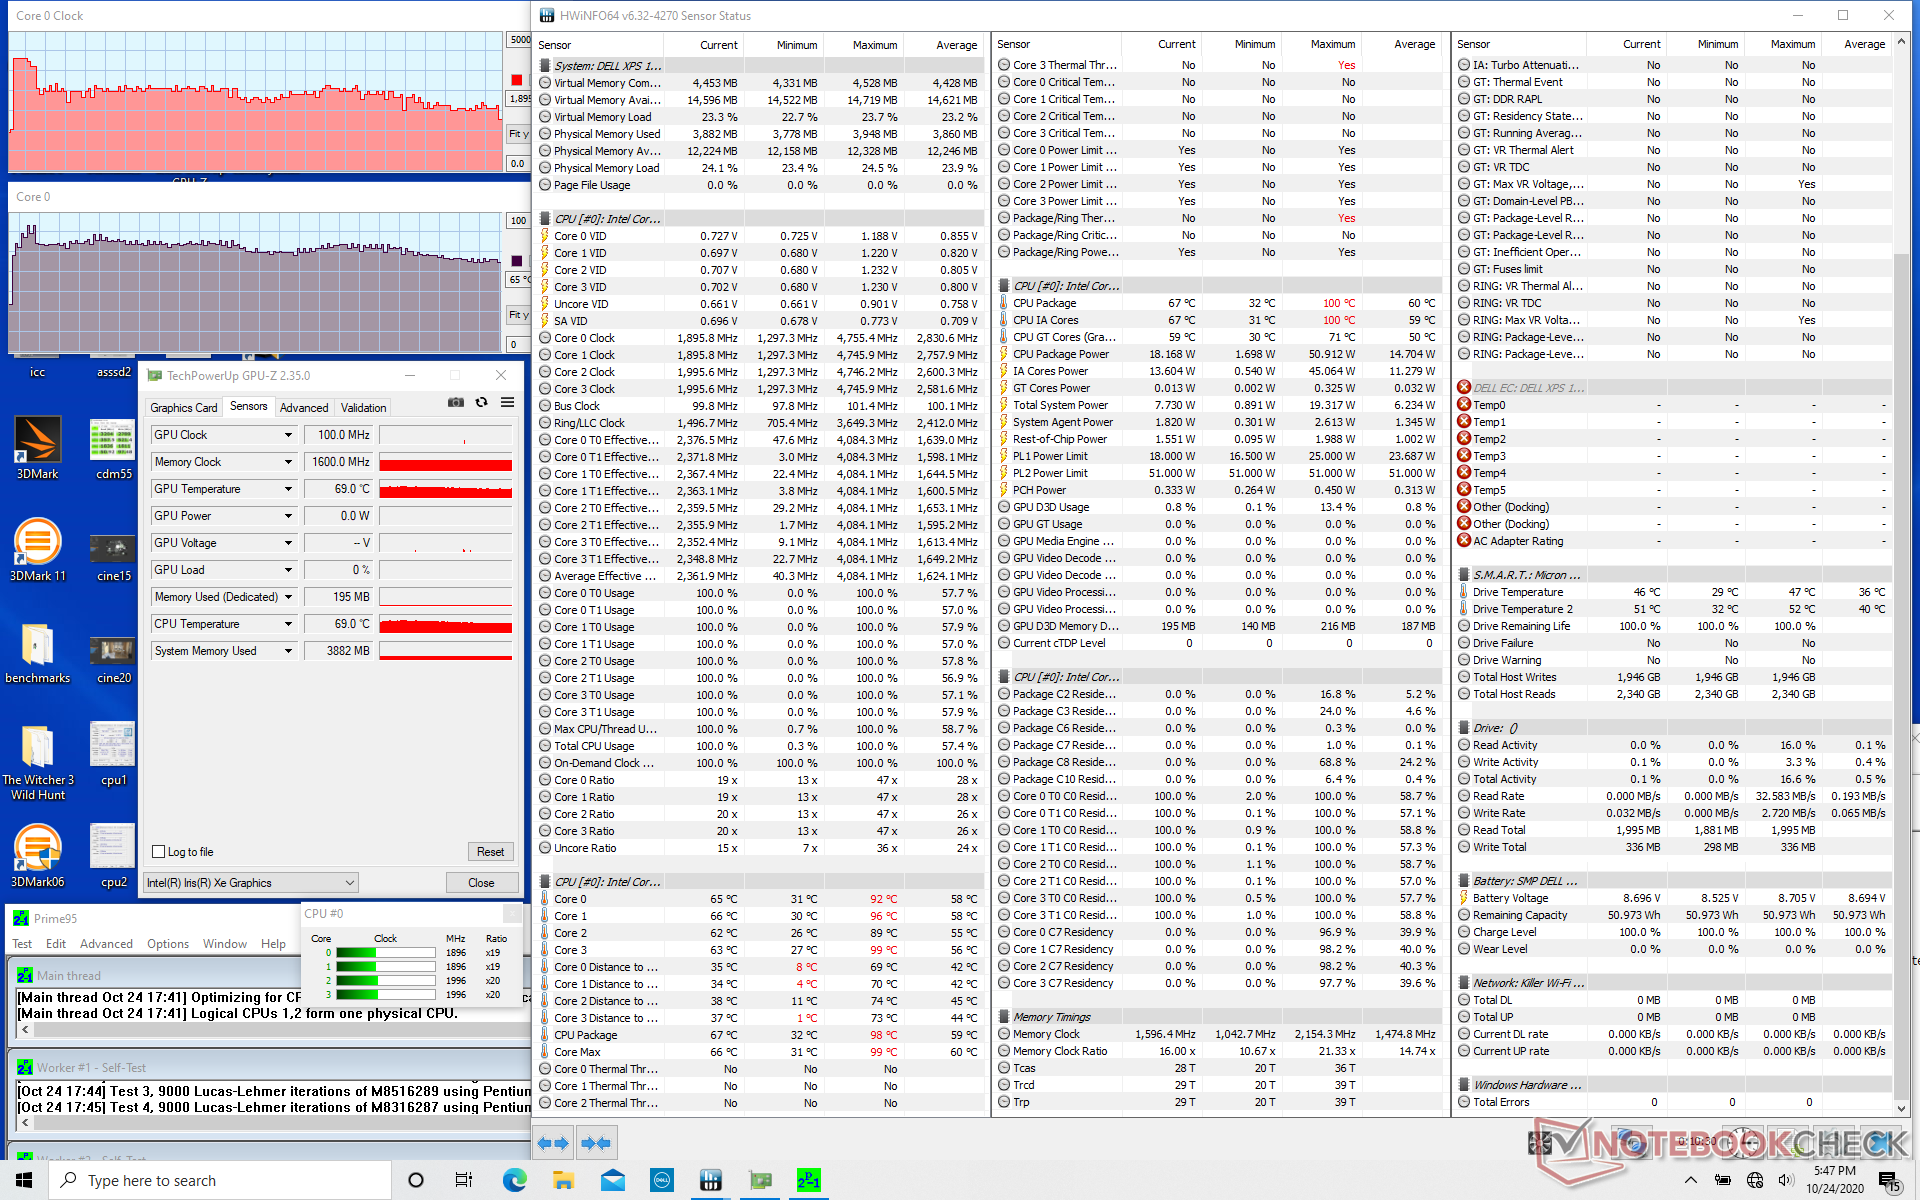
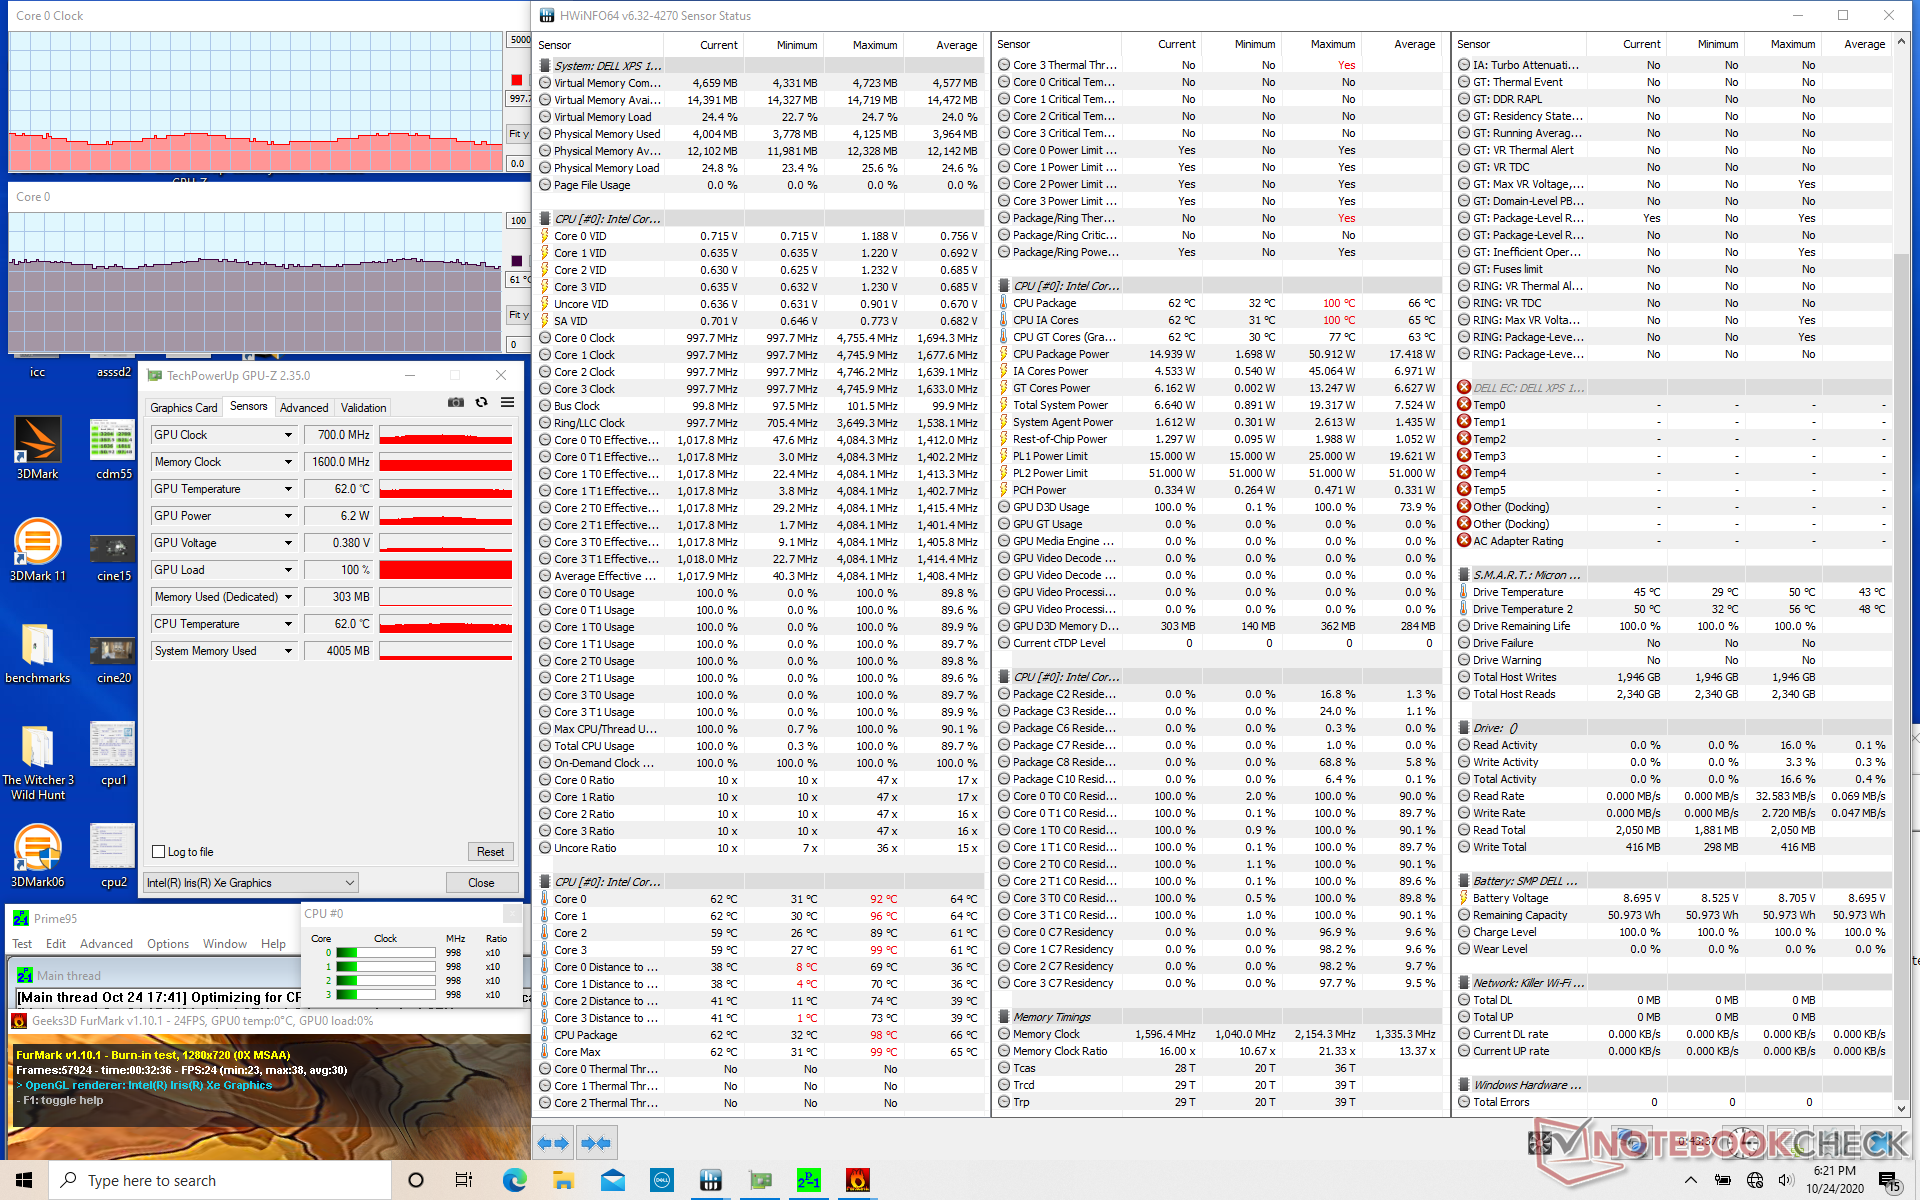
| CPU Clock (GHz) | GPU Clock (MHz) | Average CPU Temperature (°C) | |
| System Idle | -- | -- | 36 |
| Prime95 Stress | 2.5 - 3.1 | -- | 71 - 78 |
| Prime95 + FurMark Stress | 1.2 - 1.6 | 700 - 850 | 61 - 69 |
| Witcher 3 Stress | 1.4 - 2.0 | 850 - 1100 | 61 - 65 |
Altoparlanti


Dell XPS 13 9310 Core i7 FHD analisi audio
(+) | gli altoparlanti sono relativamente potenti (84.6 dB)
Bassi 100 - 315 Hz
(-) | quasi nessun basso - in media 16.1% inferiori alla media
(±) | la linearità dei bassi è media (13.1% delta rispetto alla precedente frequenza)
Medi 400 - 2000 Hz
(+) | medi bilanciati - solo only 2.6% rispetto alla media
(+) | medi lineari (4.6% delta rispetto alla precedente frequenza)
Alti 2 - 16 kHz
(+) | Alti bilanciati - appena 1.3% dalla media
(+) | alti lineari (4% delta rispetto alla precedente frequenza)
Nel complesso 100 - 16.000 Hz
(+) | suono nel complesso lineare (10.7% differenza dalla media)
Rispetto alla stessa classe
» 9% di tutti i dispositivi testati in questa classe è stato migliore, 3% simile, 88% peggiore
» Il migliore ha avuto un delta di 5%, medio di 18%, peggiore di 53%
Rispetto a tutti i dispositivi testati
» 6% di tutti i dispositivi testati in questa classe è stato migliore, 2% similare, 93% peggiore
» Il migliore ha avuto un delta di 4%, medio di 24%, peggiore di 134%
Apple MacBook 12 (Early 2016) 1.1 GHz analisi audio
(+) | gli altoparlanti sono relativamente potenti (83.6 dB)
Bassi 100 - 315 Hz
(±) | bassi ridotti - in media 11.3% inferiori alla media
(±) | la linearità dei bassi è media (14.2% delta rispetto alla precedente frequenza)
Medi 400 - 2000 Hz
(+) | medi bilanciati - solo only 2.4% rispetto alla media
(+) | medi lineari (5.5% delta rispetto alla precedente frequenza)
Alti 2 - 16 kHz
(+) | Alti bilanciati - appena 2% dalla media
(+) | alti lineari (4.5% delta rispetto alla precedente frequenza)
Nel complesso 100 - 16.000 Hz
(+) | suono nel complesso lineare (10.2% differenza dalla media)
Rispetto alla stessa classe
» 7% di tutti i dispositivi testati in questa classe è stato migliore, 2% simile, 91% peggiore
» Il migliore ha avuto un delta di 5%, medio di 18%, peggiore di 53%
Rispetto a tutti i dispositivi testati
» 5% di tutti i dispositivi testati in questa classe è stato migliore, 1% similare, 94% peggiore
» Il migliore ha avuto un delta di 4%, medio di 24%, peggiore di 134%
Gestione Energetica
Consumo Energetico
La nostra unità Tiger Lake richiede circa la stessa potenza della vecchia unità Ice Lake, nonostante i miglioramenti della grafica integrata gen-to-gen. Così, l'Iris Xe G7 è in grado di fornire prestazioni grafiche aggiuntive "gratuitamente" senza dover assorbire di più dalla presa di corrente.
Le prestazioni per watt sono eccellenti se paragonate ai sistemi concorrenti con GeForce MX250 o Radeon Vega 8 come il MateBook X Pro o Lenovo Yoga Slim 7, rispettivamente, che consumano circa 10 W - 15 W in più ciascuno se sottoposti a carichi simili e impegnativi.
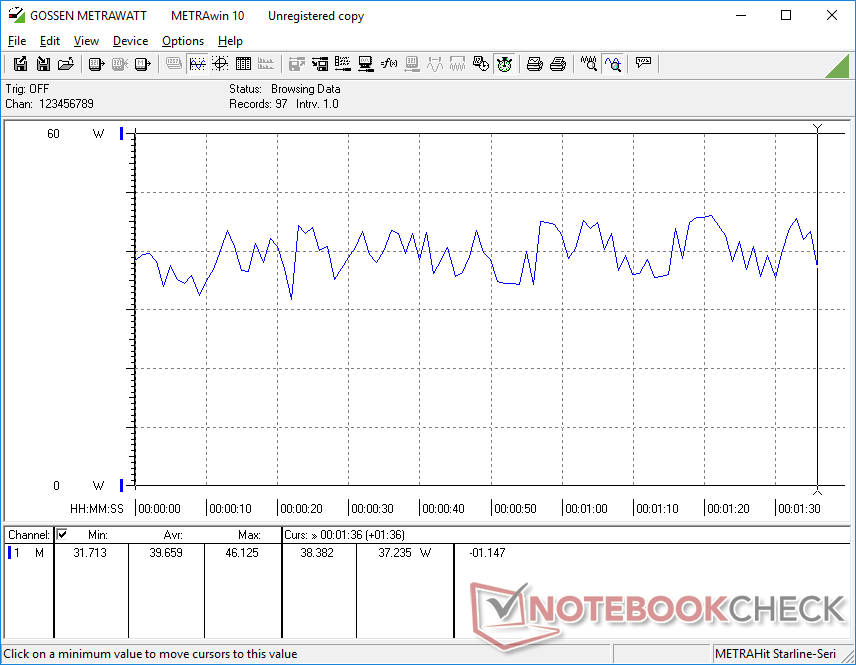
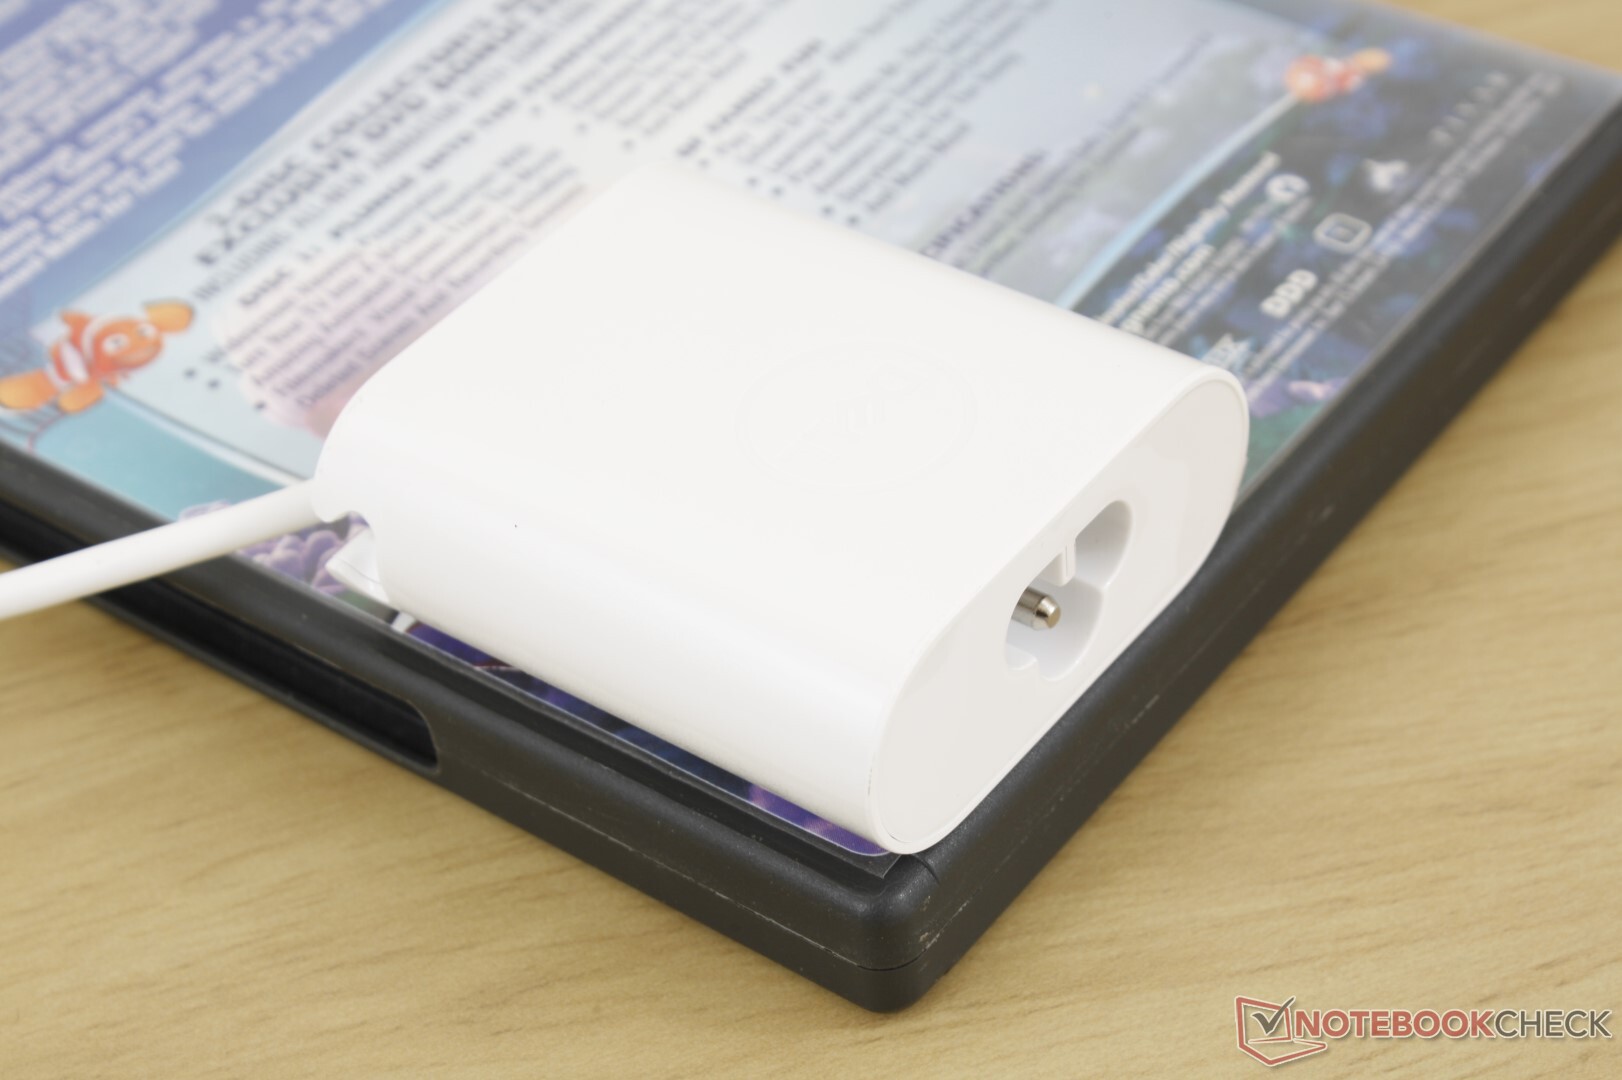
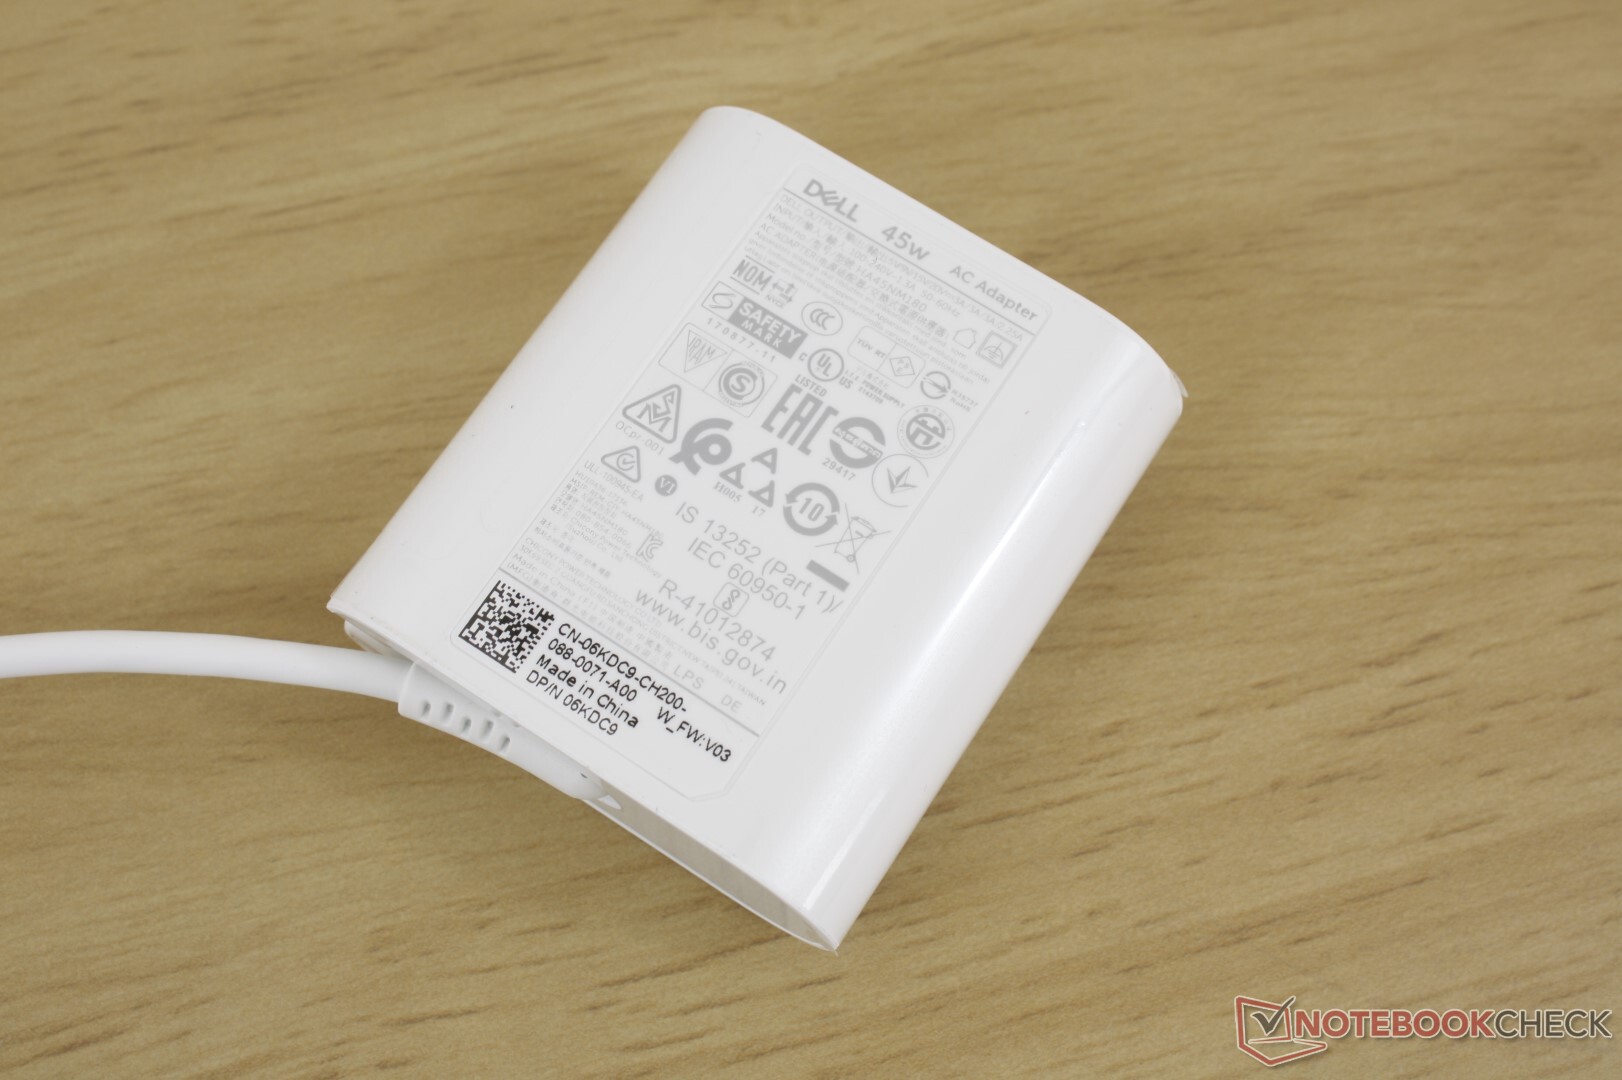
Siamo in grado di misurare un consumo massimo di 47,5 W dal piccolo (~6,0 x 5,5 x 2,2 cm) alimentatore da 45 W. La batteria del sistema si ricaricherà comunque, poiché questo valore massimo non è costante come mostrato dai nostri grafici qui sotto.
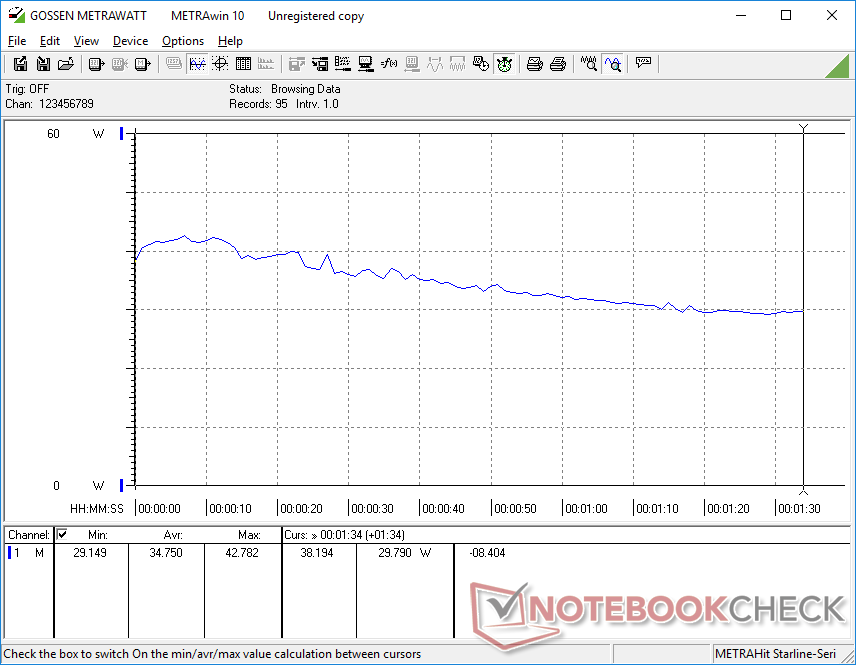
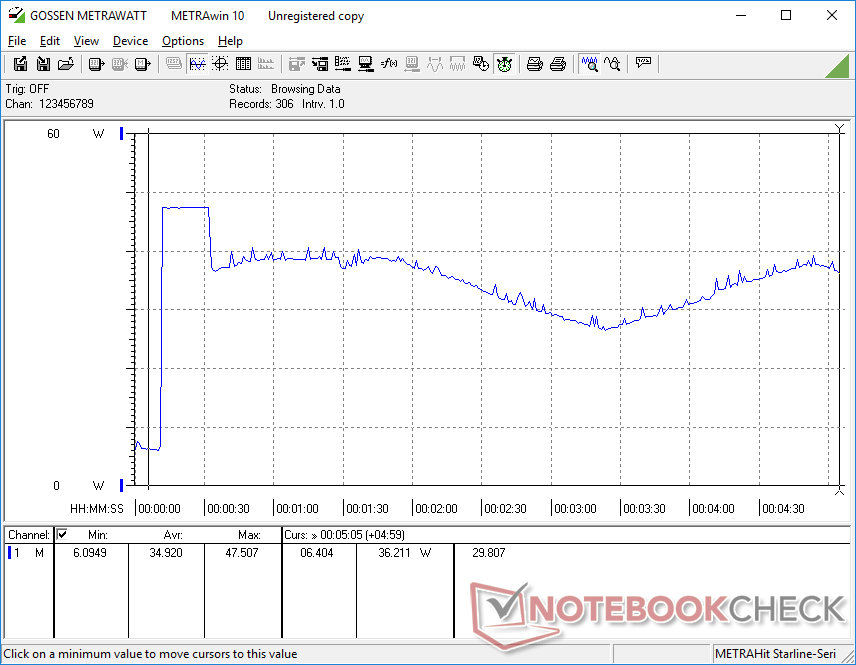
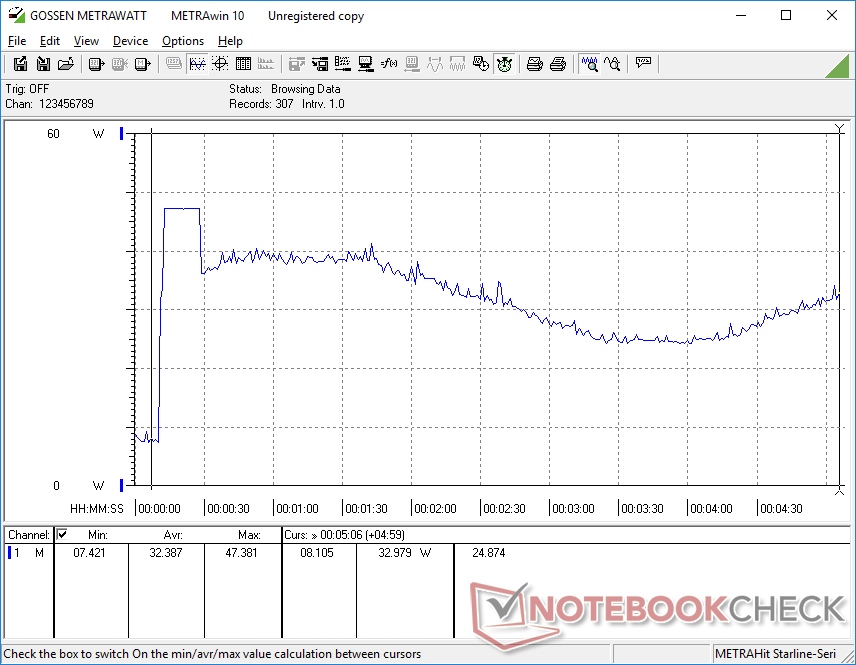
| Off / Standby | |
| Idle | |
| Sotto carico |
|
Leggenda:
min: | |
| Dell XPS 13 9310 Core i7 FHD i7-1165G7, Iris Xe G7 96EUs, Micron 2300 512GB MTFDHBA512TDV, IPS, 1920x1200, 13.4" | Dell XPS 13 9300 Core i7-1065G7 i7-1065G7, Iris Plus Graphics G7 (Ice Lake 64 EU), Intel SSDPEMKF512G8 NVMe SSD, IPS, 1920x1200, 13.4" | Apple MacBook Pro 13 2020 2GHz i5 10th-Gen i5-1038NG7, Iris Plus Graphics G7 (Ice Lake 64 EU), Apple SSD SM0512F, IPS, 2560x1600, 13.3" | Huawei MateBook X Pro 2020 i7 i7-10510U, GeForce MX250, Samsung PM981a MZVLB1T0HBLR, LTPS, 3000x2000, 13.9" | Lenovo Yoga Slim 7-14ARE R7 4800U, Vega 8, Samsung SSD PM981a MZVLB512HBJQ, IPS, 1920x1080, 14" | HP Spectre x360 13-aw0013dx i7-1065G7, Iris Plus Graphics G7 (Ice Lake 64 EU), Intel Optane Memory H10 with Solid State Storage 32GB + 512GB HBRPEKNX0202A(L/H), IPS, 1920x1080, 13.3" | |
|---|---|---|---|---|---|---|
| Power Consumption | -6% | -36% | -41% | -19% | 1% | |
| Idle Minimum * (Watt) | 3.9 | 4.2 -8% | 3.8 3% | 4.3 -10% | 4 -3% | 3.9 -0% |
| Idle Average * (Watt) | 5.9 | 6.9 -17% | 8.6 -46% | 8.5 -44% | 6.3 -7% | 6.3 -7% |
| Idle Maximum * (Watt) | 6.3 | 7.5 -19% | 10.3 -63% | 12 -90% | 7.7 -22% | 6.8 -8% |
| Load Average * (Watt) | 39.7 | 33.3 16% | 52.1 -31% | 54.8 -38% | 48.3 -22% | 32.6 18% |
| Witcher 3 ultra * (Watt) | 34.8 | 37.1 -7% | 48.2 -39% | 47.1 -35% | 49 -41% | 25.6 26% |
| Load Maximum * (Watt) | 47.5 | 48.4 -2% | 65.2 -37% | 61.5 -29% | 57.6 -21% | 59 -24% |
* ... Meglio usare valori piccoli
Autonomia della batteria
La durata della batteria non è poi così diversa da quella dell'XPS 13 9300. Infatti, secondo i nostri test, potrebbe essere leggermente più breve. Tuttavia, 11 ore di utilizzo della WLAN nel mondo reale dovrebbero essere più che sufficienti per la maggior parte degli utenti.
La ricarica completa richiede poco più di 2 ore rispetto a 1,5 ore nella maggior parte degli altri Ultrabooks.
| Dell XPS 13 9310 Core i7 FHD i7-1165G7, Iris Xe G7 96EUs, 52 Wh | Dell XPS 13 9300 Core i7-1065G7 i7-1065G7, Iris Plus Graphics G7 (Ice Lake 64 EU), 52 Wh | Apple MacBook Pro 13 2020 2GHz i5 10th-Gen i5-1038NG7, Iris Plus Graphics G7 (Ice Lake 64 EU), 58 Wh | Huawei MateBook X Pro 2020 i7 i7-10510U, GeForce MX250, 57.4 Wh | Lenovo Yoga Slim 7-14ARE R7 4800U, Vega 8, 61 Wh | HP Spectre x360 13-aw0013dx i7-1065G7, Iris Plus Graphics G7 (Ice Lake 64 EU), 60 Wh | |
|---|---|---|---|---|---|---|
| Autonomia della batteria | 15% | 10% | -15% | -25% | -1% | |
| Reader / Idle (h) | 30 | 27.1 -10% | 37.1 24% | |||
| WiFi v1.3 (h) | 11 | 12.7 15% | 12.1 10% | 10.4 -5% | 10.3 -6% | 9.9 -10% |
| Load (h) | 3.2 | 2.4 -25% | 1.3 -59% | 2.7 -16% |
Pro
Contro
Valutazione compessiva del Dell Latitude 14 5410
Se possedete già un computer portatile Ice Lake, allora non c'è molto motivo di passare al Tiger Lake. Le prestazioni complessive del sistema non sono sensibilmente migliori di quelle dell'XPS 13 9300, che non ha nemmeno un anno di vita. L'eccezione principale riguarda le prestazioni grafiche, in quanto l'Iris Xe integrato è molto più veloce dell'Iris Plus G7 senza richiedere maggiore potenza o la necessità di diventare più rumoroso o più caldo. Questo è particolarmente allettante per gli editor video o grafici che sanno di poter sfruttare la GPU per ottenere il massimo da XPS 13 9310 e dal suo nuovo processore.
Per tutti gli altri, il meno costoso XPS 13 9300 sarà più che sufficiente, soprattutto perché il divario di prestazioni della CPU tra la 10a generazione Core i7 e l'11a generazione Core i7 è marginale. Il vantaggio più evidente del Tiger Lake, che è la sua nuova GPU integrata, non è molto utile per i giocatori in questo caso, a parte i giocatori occasionali, perché i frame rate tendono ad essere meno stabili e a volte anche più lenti rispetto alla collaudata serie GeForce MX150/MX250. Inoltre, sia i tempi medi di risposta del display che la mancanza di sincronizzazione adattiva non fanno altro che cementare questo fatto. Sarebbe bello vedere miglioramenti in queste aree specifiche o almeno un otturatore della webcam per le future versioni dei modelli. Un'opzione software per alternare la sintonizzazione dinamica a favore di una costante velocità di clock sarebbe altrettanto interessante.
Non si può scegliere tra XPS 13 9300 o 9310? Per l'elaborazione di testi, lo streaming video e il casual gaming, l'XPS 13 9300 sarà veloce quanto il 9310. Per gli editor e le applicazioni grafiche intensive al di fuori del gaming, la potenza aggiuntiva della GPU e le elevate prestazioni per watt di Iris Xe dovrebbero rivelarsi utili.
Dell XPS 13 9310 Core i7 FHD
- 10/28/2020 v7 (old)
Allen Ngo
Price comparison
