Recensioni Notebook con NVIDIA GeForce MX250 la scheda grafica
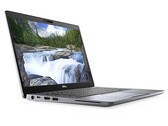
Recensione del Laptop Dell Latitude 14 5411: Computer portatile d'affari con CPU potente
Il Dell Latitude 14 5411 non è sottile, ma è potente. Con il Core i7-10850H di Intel e La GeForce MX250 di Nvidia, può essere usato anche per molto più che le sole applicazioni da ufficio. La nostra recensione mostra cosa può fare questo portatile per le piccole imprese nell'uso quotidiano.
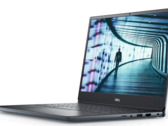
Intel Core i7-10850H, NVIDIA GeForce MX250, 14", 1.5 kgRecensione del Laptop Dell Vostro 14 5490: portatile business con GPU dedicata
Con la serie Vostro, Dell si rivolge principalmente alle piccole imprese che vogliono offrire un buon compromesso tra prestazioni e costi. Il Vostro 5490 da 14 pollici ha persino una scheda grafica dedicata, ma il controllo della ventola non è ben impostato.
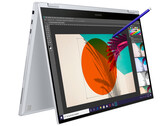
Intel Core i7-10510U, NVIDIA GeForce MX250, 14", 1.5 kgRecensione del Samsung Galaxy Book Flex NP950QCG: Display molto luminoso grazie alla modalità Outdoor+
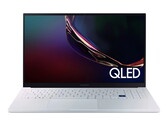
Questo convertibile Samsung da 15,6 pollici offre un cas compatto, un'ottima autonomia della batteria e un display molto luminoso con una luminosità fino a 600 nits. Il suo display touchscreen (QLED, IPS, FHD) non supporta solo l'input per le dita, ma anche l'input tramite la S Pen inclusa.
Intel Core i7-1065G7, NVIDIA GeForce MX250, 15.6", 1.6 kgRecensione del Laptop Samsung Galaxy Book Ion Aura Silver: ottimo Ultrabook da 15" con problemi di driver
Dopo il suo Modell Samsung da 13" ha ora introdotto una versione da 15" del suo laptop ultra leggero Ion. Abbiamo dato un'occhiata per scoprire se il modello più grande ha gli stessi problemi del fratello minore (ventole rumorose) e se il Galaxy Book Ion può davvero essere considerato un'alternativa decente all'ultra leggero LG Gram.
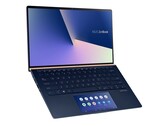
Intel Core i7-10510U, NVIDIA GeForce MX250, 15.6", 1.3 kgRecensione del Laptop Asus ZenBook 14 UX434FL: ScreenPad è qui per restare
Questo Ultrabook Asus è diverso da qualsiasi altro modello concorrente nella sua classe di dimensioni grazie al suo display secondario integrato. Sebbene sia fantastico da un punto di vista concettuale, esaminiamo alcuni inconvenienti nascosti che i potenziali proprietari dovrebbero conoscere.
Intel Core i7-8565U, NVIDIA GeForce MX250, 14", 1.3 kgAcer Aspire 3 A317-51G-72MD: Intel Core i7-10510U, 17.30", 2.8 kg
recensione » Recensione del laptop Acer Aspire 3 A317-51G: un tuttofare da 17.3" che offre 2 TB di spazio
HP ProBook 450 G7 8WC04UT: Intel Core i7-10510U, 15.60", 1.9 kg
recensione » Recensione del laptop HP ProBook 450 G7 Core i7: è migliore rispetto al ProBook 455 G7 Ryzen 7?
Asus VivoBook S14 S433FL: Intel Core i7-10510U, 14.00", 1.4 kg
recensione » Recensione del laptop Asus VivoBook S14 S433FL: computer portatile colorato con case stabile
Huawei MateBook X Pro 2020 i7: Intel Core i7-10510U, 13.90", 1.3 kg
recensione » Recensione del Laptop Huawei MateBook X Pro 2020 – Laptop compatto con problemi di prestazioni
Asus ZenBook Duo UX481FL: Intel Core i7-10510U, 14.00", 1.8 kg
recensione » Recensione del Laptop Asus ZenBook Duo UX481: simile all'Apple Touch Bar, e forse anche meglio.
Acer Aspire 5 A515-54G: Intel Core i5-10210U, 15.60", 1.7 kg
recensione » Recensione del Laptop Acer Aspire 5 A515-54G: un computer portatile per giocatori occasionali
MSI Modern 15 A10RB: Intel Core i7-10510U, 15.60", 1.6 kg
recensione » Recensione del Notebook MSI Modern 15 A10RB: un Dell XPS 15 Lite
MSI Modern 14 A10RB-459US: Intel Core i5-10210U, 14.00", 1.2 kg
recensione » Recensione del Laptop MSI Modern 14 A10RB: più leggero di quanto sembra
Lenovo Ideapad S540-15IML: Intel Core i5-10210U, 15.60", 1.9 kg
recensione » Recensione del Laptop Lenovo IdeaPad S540-15IML: una incredibile autonomia
HP Pavilion 14-ce3040ng: Intel Core i7-1065G7, 14.00", 1.6 kg
recensione » Recensione del Laptop HP Pavilion 14: un tuttofare bello e con un display luminoso
HP Spectre X360 15-5ZV31AV: Intel Core i7-10510U, 15.60", 2.1 kg
recensione » Recensione del Convertibile HP Spectre X360 15 Late 2019: Comet Lake Core i7 con grafica GeForce MX
HP Envy 17-ce1004ng: Intel Core i7-10510U, 17.30", 2.8 kg
recensione » Recensione del Laptop HP Envy 17-ce1002ng: A slim 17-inch machine with mixed performance
Lenovo ThinkPad T590-20N40009GE: Intel Core i7-8565U, 15.60", 1.8 kg
recensione » Recensione del Laptop Lenovo ThinkPad T590: Il display 4K offre un'eccellente qualità d'immagine ma richiede molta energia.
Lenovo ThinkPad T490-20N30000GE: Intel Core i7-8565U, 14.00", 1.5 kg
recensione » Recensione del Notebook Lenovo ThinkPad T490: Il pannello WQHD HDR ha convinto nei test, ma ha poco senso su un computer da lavoro
HP Envy 13-aq0003ng: Intel Core i7-8565U, 13.30", 1.2 kg
recensione » Recensione dell'HP Envy 13: un subnotebook completo con molte features
Asus VivoBook S15 S532F: Intel Core i7-8565U, 15.60", 1.8 kg
recensione » ScreenPad 2.0 Debut: Recensione del Computer portatile Asus VivoBook S15 S532FL
Lenovo ThinkPad T590-20N4002VGE: Intel Core i7-8565U, 15.60", 1.9 kg
recensione » Recensione del Computer portatile Business Lenovo ThinkPad T590: grande e leggero, ma lo schermo è deludente
Lenovo IdeaPad S540-14IWL: Intel Core i5-8265U, 14.00", 1.4 kg
recensione » Recensione del Computer portatile Lenovo IdeaPad S540: AMD o Intel? Lenovo offre ai consumatori la possibilità di scelta e noi confrontiamo entrambe le soluzioni.
Acer Swift 3 SF314-55G-768V: Intel Core i7-8565U, 14.00", 1.5 kg
recensione » Recensione del Computer Portatile Acer Swift 3 SF314 (i7-8565U, MX250)
Lenovo ThinkPad T490-20N3S02L00: Intel Core i7-8565U, 14.00", 1.5 kg
recensione » Recensione del Computer Portatile Lenovo ThinkPad T490 (i7, MX250, Low Power FHD)
Huawei MateBook 14 KLV-W29: Intel Core i7-8565U, 14.00", 1.5 kg
recensione » Recensione del Computer portatile Huawei MateBook 14 (i7-8565U, GeForce MX250)
HP Pavilion 15-cs2019ng: Intel Core i5-8265U, 15.60", 1.9 kg
recensione » Recensione del Computer Portatile HP Pavilion 15 (Core i5-8265U, GeForce MX250, 16 GB RAM)
Acer Aspire 5 A515-52G-723L: Intel Core i7-8565U, 15.60", 1.8 kg
recensione » Recensione del Computer Portatile Acer Aspire 5 A515-52G (i7-8565U, GeForce MX250, SSD, FHD)
HP 15s-du1031tx: Intel Core i7-10510U, 15.60", 1.8 kg
Recensioni esterne » HP 15s-du1031tx
Huawei Matebook D 14, i5-10210U MX250: Intel Core i5-10210U, 14.00", 1.4 kg
Recensioni esterne » Huawei Matebook D 14, i5-10210U MX250
Asus VivoBook S15 S533FL-BQ057T: Intel Core i7-10510U, 15.60", 1.8 kg
Recensioni esterne » Asus VivoBook S15 S533FL-BQ057T
Dell Latitude 14 5411-WJ40N: Intel Core i7-10850H, 14.00", 1.5 kg
Recensioni esterne » Dell Latitude 14 5411-WJ40N
Huawei MateBook X 2020 i5: Intel Core i5-10210U, 13.90", 1.3 kg
Recensioni esterne » Huawei MateBook X 2020 i5
Asus VivoBook S14 S433FL-EB180T: Intel Core i7-10510U, 14.00", 1.5 kg
Recensioni esterne » Asus VivoBook S14 S433FL-EB180T
HP EliteBook 850 G7, i7-10510U MX250: Intel Core i7-10510U, 15.60", 1.7 kg
Recensioni esterne » HP EliteBook 850 G7, i7-10510U MX250
Asus VivoBook S14 S433FL-EB181: Intel Core i7-10510U, 14.00", 1.4 kg
Recensioni esterne » Asus VivoBook S14 S433FL-EB181
Huawei MateBook 13 2020 MX250 i7: Intel Core i7-10510U, 13.00", 1.3 kg
Recensioni esterne » Huawei MateBook 13 2020 MX250 i7
Xiaomi Mi Notebook 14, i5-10210U MX250: Intel Core i5-10210U, 14.00", 1.5 kg
Recensioni esterne » Xiaomi Mi Notebook 14, i5-10210U MX250
Huawei MateBook 14 KLV-W29: Intel Core i7-8565U, 14.00", 1.5 kg
Recensioni esterne » Huawei MateBook 14 KLV-W29
Acer TravelMate P6 TMP614-51TG-G2: Intel Core i7-10510U, 14.00", 1.2 kg
Recensioni esterne » Acer TravelMate P6 TMP614-51TG-G2
Asus VivoBook S15 S533FL-BQ024T: Intel Core i7-10510U, 15.60", 1.8 kg
Recensioni esterne » Asus VivoBook S15 S533FL-BQ024T
Asus ZenBook 13 UX334FLC-A3167T: Intel Core i7-10510U, 13.30", 1.2 kg
Recensioni esterne » Asus ZenBook 13 UX334FLC-A3167T
HP Pavilion 15-cs3022ns: Intel Core i7-1065G7, 15.60", 1.9 kg
Recensioni esterne » HP Pavilion 15-cs3022ns
Asus VivoBook S15 S533F-LBQ536T: Intel Core i5-10210U, 15.60", 1.8 kg
Recensioni esterne » Asus VivoBook S15 S533F-LBQ536T
Acer Swift 3 SF314-58G-77JX: Intel Core i5-10210U, 14.00", 1.6 kg
Recensioni esterne » Acer Swift 3 SF314-58G-77JX
MSI Modern 15 A10RB: Intel Core i7-10510U, 15.60", 1.6 kg
Recensioni esterne » MSI Modern 15 A10RB
Huawei MateBook 13 2020 MX250: Intel Core i5-10210U, 13.00", 1.3 kg
Recensioni esterne » Huawei MateBook 13 2020 MX250
Acer Aspire 5 A514-52G-7045: Intel Core i7-10510U, 14.00", 1.6 kg
Recensioni esterne » Acer Aspire 5 A514-52G-7045
MSI Prestige 14 A10RB: Intel Core i7-10710U, 14.00", 1.3 kg
Recensioni esterne » MSI Prestige 14 A10RB
MSI PS42 Modern 8RA-280XES: Intel Core i7-8565U, 14.00", 1.2 kg
Recensioni esterne » MSI PS42 Modern 8RA-280XES
HP Pavilion 14-ce3013tx: Intel Core i7-1065G7, 14.00", 1.6 kg
Recensioni esterne » HP Pavilion 14-ce3013tx
Asus ZenBook Duo UX481FL: Intel Core i7-10510U, 14.00", 1.8 kg
Recensioni esterne » Asus ZenBook Duo UX481FL
Lenovo IdeaPad S540-15IML-81NG00A3GE: Intel Core i7-10510U, 15.60", 2 kg
Recensioni esterne » Lenovo IdeaPad S540-15IML-81NG00A3GE
Huawei MateBook X Pro 2020 i7: Intel Core i7-10510U, 13.90", 1.3 kg
Recensioni esterne » Huawei MateBook X Pro 2020 i7
HP Pavilion 15-cs2019ng: Intel Core i5-8265U, 15.60", 1.9 kg
Recensioni esterne » HP Pavilion 15-cs2019ng
Dell Inspiron 14 7490-D0R43: Intel Core i7-10510U, 14.00", 1.3 kg
Recensioni esterne » Dell Inspiron 14 7490-D0R43
Asus VivoBook S14 S432FL-EB074T: Intel Core i5-10210U, 14.00", 1.5 kg
Recensioni esterne » Asus VivoBook S14 S432FL-EB074T
Asus VivoBook S14 S433FL-EB008T: Intel Core i5-10210U, 14.00", 1.5 kg
Recensioni esterne » Asus VivoBook S14 S433FL-EB008T
Asus VivoBook S15 S532FL-BQ049T: Intel Core i5-8265U, 15.60", 1.8 kg
Recensioni esterne » Asus VivoBook S15 S532FL-BQ049T
Asus VivoBook S14 S433FL: Intel Core i7-10510U, 14.00", 1.4 kg
Recensioni esterne » Asus VivoBook S14 S433FL-EB029T
MSI Modern 14 A10RB: Intel Core i7-10710U, 14.00", 1.2 kg
Recensioni esterne » MSI Modern 14 A10RB
HP Pavilion 14-ce3005ns: Intel Core i7-1065G7, 14.00", 1.6 kg
Recensioni esterne » HP Pavilion 14-ce3005ns
Acer Swift 5 Pro SF514-54GT-54PK: Intel Core i5-1035G1, 14.00", 1 kg
Recensioni esterne » Acer Swift 5 Pro SF514-54GT-54PK
Asus VivoBook A512FL, i5 10210U, MX250: Intel Core i5-10210U, 15.60", 1.7 kg
Recensioni esterne » Asus VivoBook A512FL, i5 10210U, MX250
Asus VivoBook S15 S532FL-BN184T: Intel Core i7-10510U, 15.60", 1.8 kg
Recensioni esterne » Asus VivoBook S15 S532FL-BN184T
Lenovo IdeaPad S540-14IWL: Intel Core i5-8265U, 14.00", 1.4 kg
Recensioni esterne » Lenovo IdeaPad S540-14IWL
Asus ZenBook 14 UX434FLC-A5131R: Intel Core i7-10510U, 14.00", 1.3 kg
Recensioni esterne » Asus ZenBook 14 UX434FLC-A5131R
Asus ZenBook 14 UX431FL-AM049T: Intel Core i7-10510U, 14.00", 1.4 kg
Recensioni esterne » Asus ZenBook 14 UX431FL-AM049T
MSI Modern 14 A10RB-663XES: Intel Core i7-10510U, 14.00", 1.2 kg
Recensioni esterne » MSI Modern 14 A10RB-663XES
Acer Swift 5 SF514-54GT-762S: Intel Core i7-1065G7, 14.00", 1 kg
Recensioni esterne » Acer Swift 5 SF514-54GT-762S
Xiaomi RedmiBook 13, i5-10210U: Intel Core i5-10210U, 13.30", 1.2 kg
Recensioni esterne » Xiaomi RedmiBook 13, i5-10210U
Acer Aspire 5 A515-54G-54PC: Intel Core i5-10210U, 15.60", 1.9 kg
Recensioni esterne » Acer Aspire 5 A515-54G-54PC
MSI Modern 14 A10RB-665XES: Intel Core i7-10510U, 14.00", 1.2 kg
Recensioni esterne » MSI Modern 14 A10RB-665XES
Lenovo Ideapad S540-15IWL-81NE0040GE: Intel Core i7-8565U, 15.60", 2 kg
Recensioni esterne » Lenovo Ideapad S540-15IWL-81NE0040GE
Asus Zenbook Pro Duo UX481FL-BM044T: Intel Core i7-10510U, 14.00", 1.5 kg
Recensioni esterne » Asus Zenbook Pro Duo UX481FL-BM044T
Asus ZenBook 13 UX334FL-A4137T: Intel Core i7-8565U, 13.30", 1.2 kg
Recensioni esterne » Asus ZenBook 13 UX334FL-A4137T
Lenovo Yoga S740-14IIL-81RS0016GE: Intel Core i7-1065G7, 14.00", 1.4 kg
Recensioni esterne » Lenovo Yoga S740-14IIL-81RS0016GE
Asus ZenBook Duo UX481FL-BM039R: Intel Core i7-10510U, 14.00", 1.5 kg
Recensioni esterne » Asus ZenBook Duo UX481FL-BM039R
Dell Vostro 14 5490: Intel Core i7-10510U, 14.00", 1.5 kg
Recensioni esterne » Dell Vostro 14 5490, i7-10510U, MX250
Acer TravelMate P6 TMP614-51TG-792V: Intel Core i7-8565U, 14.00", 1.2 kg
Recensioni esterne » Acer TravelMate P6 TMP614-51TG-792V
HP Pavilion x360 14-dh0226ng: Intel Core i7-8565U, 14.00", 1.6 kg
Recensioni esterne » HP Pavilion x360 14-dh0226ng
Asus VivoBook 14 X412FL-EB151T: Intel Core i5-8265U, 14.00", 1.5 kg
Recensioni esterne » Asus VivoBook 14 X412FL-EB151T
Acer Aspire 3 A317-51G-7604: Intel Core i7-10510U, 17.30", 2.7 kg
Recensioni esterne » Acer Aspire 3 A317-51G-7604
Asus VivoBook S15 S512FL-BQ279T: Intel Core i7-8565U, 15.60", 1.8 kg
Recensioni esterne » Asus VivoBook S15 S512FL-BQ279T
Asus VivoBook S15 S532FL-BN010T: Intel Core i7-8565U, 15.60", 1.8 kg
Recensioni esterne » Asus VivoBook S15 S532FL-BN010T
Xiaomi RedmiBook 14 2019, i7-8565U: Intel Core i7-8565U, 14.00", 1.5 kg
Recensioni esterne » Xiaomi RedmiBook 14 2019, i7-8565U
Acer Swift 5 SF514-54GT-70SY: Intel Core i7-1065G7, 14.00", 1 kg
Recensioni esterne » Acer Swift 5 SF514-54GT-70SY
Asus Zenbook 14 UX434FL-A6015T: Intel Core i5-8265U, 14.00", 1.6 kg
Recensioni esterne » Asus Zenbook 14 UX434FL-A6015T
Acer Aspire 5 A514-52G-516T: Intel Core i5-10210U, 14.00", 1.6 kg
Recensioni esterne » Acer Aspire 5 A514-52G-516T
Acer Swift 3 SF314-56G-79D1: Intel Core i7-8565U, 14.00", 1.6 kg
Recensioni esterne » Acer Swift 3 SF314-56G-79D1
Asus ZenBook 14 UX431FL-AN012T: Intel Core i7-8565U, 14.00", 1.5 kg
Recensioni esterne » Asus ZenBook 14 UX431FL-AN012T
Dell Inspiron 15 7590 2-in-1: Intel Core i7-8565U, 15.60", 2 kg
Recensioni esterne » Dell Inspiron 15 7590 2-in-1
Asus VivoBook S15 S532F: Intel Core i7-8565U, 15.60", 1.8 kg
Recensioni esterne » Asus VivoBook S15 S532F
Asus VivoBook S15 S532FL-BN011T: Intel Core i5-8265U, 15.60", 1.8 kg
Recensioni esterne » Asus VivoBook S15 S532FL-BN011T
HP Envy 13-aq0003ng: Intel Core i7-8565U, 13.30", 1.2 kg
Recensioni esterne » HP Envy 13-aq0003ng
Lenovo Ideapad S340-15IWL-81N800CPGE: Intel Core i5-8265U, 15.60", 1.8 kg
Recensioni esterne » Lenovo Ideapad S340-15IWL-81N800CPGE
Asus VivoBook 15 A512FL: Intel Core i5-8265U, 15.60", 1.8 kg
Recensioni esterne » Asus VivoBook 15 A512FL
Asus VivoBook 15 X512FL-EJ205T: Intel Core i7-8565U, 15.60", 1.8 kg
Recensioni esterne » Asus VivoBook 15 X512FL-EJ205T
Acer Aspire 5 A515-54G-7895: Intel Core i7-8565U, 15.60", 1.8 kg
Recensioni esterne » Acer Aspire 5 A515-54G-7895
Asus ZenBook 14 UX434FL, i7-8565U: Intel Core i7-8565U, 14.00", 1.3 kg
Recensioni esterne » Asus ZenBook 14 UX434FL, i7-8565U
Lenovo Ideapad S540-15IWL-81NE003XGE: Intel Core i5-8265U, 15.60", 2 kg
Recensioni esterne » Lenovo Ideapad S540-15IWL-81NE003XGE
Asus ZenBook Edition 30 UX334FL, i7-8565U: Intel Core i7-8565U, 13.30", 1.3 kg
Recensioni esterne » Asus ZenBook Edition 30 UX334FL, i7-8565U
Asus VivoBook S14 S431FL, i7-8565U: Intel Core i7-8565U, 14.00", 1.4 kg
Recensioni esterne » Asus VivoBook S14 S431FL, i7-8565U
Asus VivoBook S15 S531FL, i7-8565U: Intel Core i7-8565U, 15.60", 1.8 kg
Recensioni esterne » Asus VivoBook S15 S531FA, i7-8565U
Asus ZenBook Pro Duo UX481: Intel Core i7-9750H, 14.00", 1.8 kg
Recensioni esterne » Asus ZenBook Pro Duo UX481
HP Envy 13-aq0005ng: Intel Core i7-8565U, 13.30", 1.2 kg
Recensioni esterne » HP Envy 13-aq0005ng
Huawei MateBook X Pro 2019, i7-8565U: Intel Core i7-8565U, 13.90", 1.3 kg
Recensioni esterne » Huawei MateBook X Pro 2019, i7-8565U
Huawei MateBook 14-KLV-W29B: Intel Core i7-8565U, 14.00", 1.5 kg
Recensioni esterne » Huawei MateBook 14-KLV-W29B
Huawei MateBook X Pro 2019, i5-8265U: Intel Core i5-8265U, 13.90", 1.3 kg
Recensioni esterne » Huawei MateBook X Pro 2019, i5-8265U
Huawei MateBook 14, i5 (KLV-W19): Intel Core i5-8265U, 14.00", 1.5 kg
Recensioni esterne » Huawei MateBook 14, i5 (KLV-W19)
Samsung Galaxy Book Ion Aura Silver: Intel Core i7-10510U, 15.60", 1.3 kg
» L'Ultrabook Samsung Galaxy Book Ion da 15" è eccellente - ma ha ancora alcuni problemi.