Notebookcheck Logo

Intel HD Graphics 5600

Intel HD Graphics 5600

L'Intel HD Graphics 5600 (GT2) è una scheda grafica integrata della generazione Broadwell. Si trova su CPUs standard voltage (47 W) ed offre 24 EUs (Execution Units). Il clock può variare in base al modello in cui è integrata (Core i7-5700HQ: max. 1050 MHz con Turbo Boost).

Architettura e Features

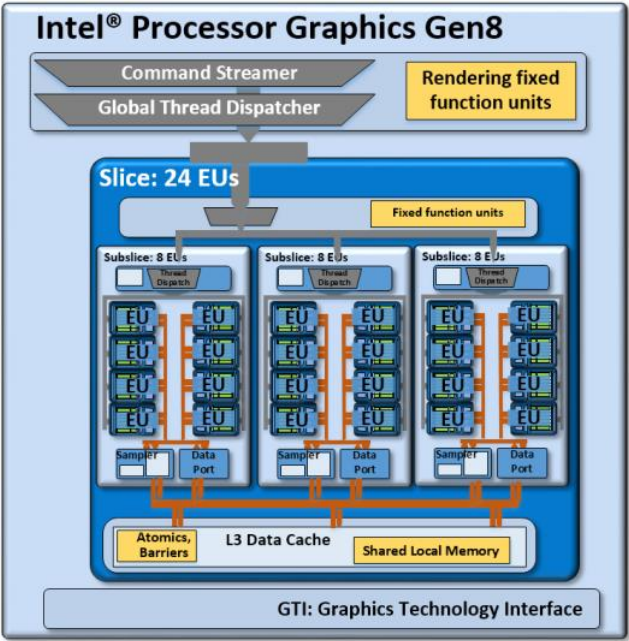
La Broadwell sfrutta GPU basate sull'architettura Intel Gen8, che è stata ottimizzata per vari aspetti rispetto alla precedente Gen7.5 (Haswell). Tra l'altro, gli arrays shader chiamati "subslice" sono stati riorganizzati ed ora offrono 8 Execution Units (EUs) ciascuno. Tre subslices formano uno "slice" per un totale di 24 EUs. Unitamente ad altri miglioramenti come caches L1 maggiore ed un frontend ottimizzato, la GPU integrata è diventata più veloce e più efficiente rispetto al suo predecessore.

L'HD Graphics 5600 rappresenta la versione mid-range della famiglia GPU Broadwell e consiste in uno slice con 24 EUs. Oltre questa, c'è anche una variante low-end (GT1, 12 EUs) e modelli higher-end (GT3/GT3e + eDRAM, 48 EUs).

Tutte le GPU Broadwell GPUs supportano OpenCL 2.0 e DirectX 12 (FL 11_1). Il motore video ora è in grado di decodificare H.265 utilizzando entrame le funzioni hardware oltre agli shaders GPU disponibili. E' possibile collegare fino a tre displays tramite DP 1.2/eDP 1.3 (max. 3840 x 2160 @ 60 Hz) o HDMI 1.4a (max. 3840 x 2160 @ 24 Hz). L'HDMI 2.0, tuttavia, non è supportata.

Performance

Grazie all'architettura migliorata e alle EUs aggiuntive, l'HD Graphics 5600 è di circa il 20 percento più veloce rispetto all'Haswell-based HD 4600 (20 EUs), ma ancora più lenta delle GPU low-end dedicate come la GeForce 920M o Radeon R7 M360. La maggioranza dei giochi 2014/2015 saranno utilizzabili solo con settaggi bassi (e a volte nemmeno).

Consumo energetico

L'intero chip Broadwell ha un TDP da 47 W (i7-5700HQ) pertanto è adatto per portatili a partire da 14".

HD Graphics Serie

HD Graphics P530 24 @ 0.35 - 1.05 GHz64/128 Bit
HD Graphics 5600 24 @ 0.3 - 1.05 GHz64/128 Bit
HD Graphics 6000 48 @ 0.3 - 1 GHz64/128 Bit
HD Graphics 4600 20 @ 0.2 - 1.35 GHz64/128 Bit
HD Graphics 5500 24 @ 0.3 - 0.95 GHz64/128 Bit
HD Graphics 5000 40 @ 0.2 - 1.1 GHz64/128 Bit
HD Graphics 4400 20 @ 0.2 - 1.1 GHz64/128 Bit
HD Graphics 5300 24 @ 0.1 - 0.9 GHz64/128 Bit
HD Graphics 4000 16 @ 0.35 - 1.35 GHz64/128 Bit
HD Graphics (Broadwell) 12 @ 0.1 - 0.85 GHz64/128 Bit
HD Graphics 4200 20 @ 0.2 - 0.85 GHz64/128 Bit
HD Graphics (Skylake) 12 @ 0.3 - 0.8 GHz64/128 Bit
HD Graphics 405 (Braswell) 16 @ 0.32 - 0.7 GHz64/128 Bit
HD Graphics (Braswell) 16 @ 0.32 - 0.7 GHz64/128 Bit
HD Graphics 400 (Braswell) 12 @ 0.32 - 0.64 GHz64/128 Bit
HD Graphics (Haswell) 10 @ 0.2 - 1 GHz64/128 Bit
HD Graphics (Cherry Trail) 16 @ 0.2 - 0.6 GHz64/128 Bit
HD Graphics 3000 12 @ 0.35 - 1.35 GHz64/128 Bit
HD Graphics 2500 6 @ 0.65 - 1.15 GHz64/128 Bit
HD Graphics (Ivy Bridge) 6 @ 0.35 - 1.1 GHz64/128 Bit
HD Graphics 2000 6 @ 0.85 - 1.35 GHz64/128 Bit
HD Graphics (Sandy Bridge) 6 @ 0.35 - 1.1 GHz64/128 Bit
HD Graphics (Bay Trail) 4 @ 0.31 - 0.9 GHz32/64/128 Bit
Nome in codiceBroadwell GT2
ArchitetturaGen. 8 Broadwell
Pipelines24 - unified
Velocità del core300 - 1050 (Boost) MHz
Larghezza del bus di memoria64/128 Bit
Memoria condivisasi
APIDirectX 12 (FL 11_1), OpenGL 4.3
tecnologia14 nm
CaratteristicheQuickSync
Data dell'annuncio02.06.2015
CPU in HD Graphics 5600GPU Base SpeedGPU Boost / Turbo
Intel Core i7-5700HQ4 x 2700 MHz, 47 W300 MHz1050 MHz

Benchmark

Performance Rating - 3DMark 11 + Fire Strike + Time Spy
0.5 pt (1%)
AMD Radeon HD 8180
0.06605 -85%
...
0.4123 -9%
0.4141 -8%
0.4148 -8%
0.415 -8%
0.42 -7%
0.4255 -6%
0.4259 -6%
0.4323 -4%
0.4332 -4%
Intel HD Graphics 5600
0.4514
AMD Radeon R5 (Carrizo)
0.456 1%
0.4574 1%
0.4615 2%
0.4628 3%
0.4656 3%
0.4662 3%
0.4765 6%
0.4833 7%
Intel HD Graphics 630
0.4861 8%
...
21.1 4574%
max:
33.3 7277%
0%
100%
3DMark - 3DMark Cloud Gate Score
7499 Points (8%)
3DMark - 3DMark Fire Strike Standard Score
944 Points (2%)
3DMark - 3DMark Fire Strike Standard Graphics
991 Points (1%)
3DMark - 3DMark Ice Storm Graphics
79039 Points (9%)
3DMark 11 - 3DM11 Performance GPU
1431 Points (1%)
171.8 -88%
...
1328 -7%
1346 -6%
1349 -6%
1350 -6%
1355 -5%
1361 -5%
1371 -4%
1372 -4%
1413 -1%
Intel HD Graphics 5600
1431
1452 1%
1458 2%
1470 3%
1478 3%
AMD Radeon HD 6720G2
1479 3%
1499 5%
AMD Radeon HD 6755G2
1529 7%
1539 8%
Intel UHD Graphics 617
1541 8%
...
59943 4089%
max:
106023 7309%
0%
100%
Cinebench R10 Cinebench R10 Shading (32bit) +
Cinebench R10 - Cinebench R10 Shading (32bit)
7445 punti (5%)
Cinebench R11.5 Cinebench R11.5 OpenGL 64 Bit +
Cinebench R15
Cinebench R15 OpenGL 64 Bit +
Power Consumption - Furmark Stress Test Power Consumption - external Monitor *
57.8 Watt (8%)
Power Consumption - The Witcher 3 Power Consumption - external Monitor *
44.6 Watt (6%)
- Valori di benchmark per questa scheda grafica
- Valori medi di benchmark per questa scheda grafica
* Numeri più piccoli rappresentano prestazioni supeiori

Benchmarks per i giochi

I seguenti benchmarks deirivano dai benchmarks dei portatili recensiti. Le prestazioni dipendono dalla scheda grafica utilizzata, dal clock rate, dal processore, dai settaggi di sistema, dai drivers, e dai sistemi operativi. Quindi i risultati non sono rappresentativi per i portatili con questa GPU. Per informazioni dettagliate sui risultati del benchmark, cliccate sul numero di fps.

basso 1280x720
15.1  fps    + Confronta
» Il Benchmark indica che il gioco non è utilizzabile con i settaggi testati.
Hitman 2

Hitman 2

2018
basso 1280x720
10.4  fps    + Confronta
» Il Benchmark indica che il gioco non è utilizzabile con i settaggi testati.
basso 1280x720
8.7  fps    + Confronta
» Il Benchmark indica che il gioco non è utilizzabile con i settaggi testati.
FIFA 18

FIFA 18

2017
basso 1280x720
71  fps    + Confronta
medio 1920x1080
0 (!)  fps    + Confronta
» Giocabile con tutti i portatili testati con dettagli basso.
basso 1280x720
103  fps    + Confronta
medio 1366x768
94  fps    + Confronta
alto 1920x1080
42  fps    + Confronta
ultra 1920x1080
15.4  fps    + Confronta
» Giocabile con tutti i portatili testati con dettagli alto.
Dirt 4

Dirt 4

2017
basso 1280x720
39.7  fps    + Confronta
» Giocabile con tutti i portatili testati con dettagli basso.
basso 1280x720
55.2  fps    + Confronta
medio 1920x1080
28.6  fps    + Confronta
» Giocabile con tutti i portatili testati con dettagli basso.
basso 1280x720
17.1  fps    + Confronta
» Il Benchmark indica che il gioco non è utilizzabile con i settaggi testati.
For Honor

For Honor

2017
basso 1280x720
21.9  fps    + Confronta
medio 1920x1080
8.5  fps    + Confronta
» Il Benchmark indica che il gioco non è utilizzabile con i settaggi testati.
Additional Benchmarks
Medium Preset 4xAF TAA 1366x768
14
basso 1280x720
14.9  fps    + Confronta
medio 1366x768
12.3  fps    + Confronta
» Il Benchmark indica che il gioco non è utilizzabile con i settaggi testati.
medio 1366x768
45.5  fps    + Confronta
alto 1920x1080
18.1  fps    + Confronta
» Giocabile con tutti i portatili testati con dettagli medio.
basso 1280x720
29.8  fps    + Confronta
medio 1366x768
19.3  fps    + Confronta
alto 1920x1080
8.8  fps    + Confronta
ultra 1920x1080
7.6  fps    + Confronta
» Il Benchmark indica che il gioco non è utilizzabile con i settaggi testati.
Mafia 3

Mafia 3

2016
basso 1280x720
8.3  fps    + Confronta
» Il Benchmark indica che il gioco non è utilizzabile con i settaggi testati.
FIFA 17

FIFA 17

2016
basso 1280x720
68 (!)  fps    + Confronta
medio 1366x768
50.4 (!)  fps    + Confronta
alto 1920x1080
28.1 (!)  fps    + Confronta
» Giocabile con tutti i portatili testati con dettagli medio.
Overwatch

Overwatch

2016
basso 1280x720
40  fps    + Confronta
medio 1366x768
28  fps    + Confronta
» Giocabile con tutti i portatili testati con dettagli basso.
basso 1280x768
5.8  fps    + Confronta
» Il Benchmark indica che il gioco non è utilizzabile con i settaggi testati.
basso 1280x720
17.4  fps    + Confronta
» Il Benchmark indica che il gioco non è utilizzabile con i settaggi testati.
basso 1280x720
16  fps    + Confronta
medio 1920x1080
8  fps    + Confronta
» Il Benchmark indica che il gioco non è utilizzabile con i settaggi testati.
Additional Benchmarks
Low Preset 1920x1080
9
XCOM 2

XCOM 2

2016
basso 1280x720
15.8  fps    + Confronta
» Il Benchmark indica che il gioco non è utilizzabile con i settaggi testati.
basso 1024x768
0 (!)  fps    + Confronta
basso 1024x768
0 (!)  fps    + Confronta
Fallout 4

Fallout 4

2015
basso 1280x720
17.9  fps    + Confronta
» Il Benchmark indica che il gioco non è utilizzabile con i settaggi testati.
basso 1024x768
31.2  fps    + Confronta
medio 1366x768
18.5  fps    + Confronta
» Il Benchmark indica che il gioco non è utilizzabile con i settaggi testati.
FIFA 16

FIFA 16

2015
basso 1280x720
70  fps    + Confronta
alto 1366x768
39.8  fps    + Confronta
ultra 1920x1080
20.8  fps    + Confronta
» Giocabile con tutti i portatili testati con dettagli alto.
basso 1366x768
74  fps    + Confronta
medio 1366x768
48  fps    + Confronta
alto 1920x1080
22.9  fps    + Confronta
ultra 1920x1080
16.5  fps    + Confronta
» Giocabile con tutti i portatili testati con dettagli medio.
basso 1024x768
31.2  fps    + Confronta
medio 1366x768
20.7  fps    + Confronta
alto 1920x1080
7.2  fps    + Confronta
» Il Benchmark indica che il gioco non è utilizzabile con i settaggi testati.
Mad Max

Mad Max

2015
medio 1366x768
16.4  fps    + Confronta
alto 1920x1080
7.6  fps    + Confronta
» Il Benchmark indica che il gioco non è utilizzabile con i settaggi testati.
basso 1280x720
12  fps    + Confronta
medio 1366x768
9  fps    + Confronta
alto 1920x1080
5  fps    + Confronta
» Il Benchmark indica che il gioco non è utilizzabile con i settaggi testati.
basso 1024x768
14.7  fps    + Confronta
medio 1366x768
9.6  fps    + Confronta
alto 1920x1080
5.6  fps    + Confronta
ultra 1920x1080
3.1  fps    + Confronta
» Il Benchmark indica che il gioco non è utilizzabile con i settaggi testati.
basso 1024x768
112.7  fps    + Confronta
medio 1366x768
27.4  fps    + Confronta
alto 1920x1080
12.9  fps    + Confronta
ultra 1920x1080
12.5  fps    + Confronta
» Giocabile con tutti i portatili testati con dettagli basso.
basso 1024x768
37.8  fps    + Confronta
medio 1366x768
26.8  fps    + Confronta
alto 1920x1080
10.8  fps    + Confronta
ultra 1920x1080
6  fps    + Confronta
» Giocabile con tutti i portatili testati con dettagli basso.
Evolve

Evolve

2015
basso 1024x768
19  fps    + Confronta
medio 1366x768
13.5  fps    + Confronta
alto 1920x1080
7.7  fps    + Confronta
ultra 1920x1080
6.7  fps    + Confronta
» Il Benchmark indica che il gioco non è utilizzabile con i settaggi testati.
basso 1024x768
32.1  fps    + Confronta
medio 1366x768
20.3  fps    + Confronta
alto 1920x1080
7.2  fps    + Confronta
ultra 1920x1080
4.2  fps    + Confronta
» Il Benchmark indica che il gioco non è utilizzabile con i settaggi testati.
Far Cry 4

Far Cry 4

2014
basso 1024x768
22.5  fps    + Confronta
medio 1366x768
16.3  fps    + Confronta
alto 1920x1080
8.4  fps    + Confronta
ultra 1920x1080
6.3  fps    + Confronta
» Il Benchmark indica che il gioco non è utilizzabile con i settaggi testati.
basso 1024x768
0 (!)  fps    + Confronta
medio 1366x768
0 (!)  fps    + Confronta
alto 1920x1080
0 (!)  fps    + Confronta
ultra 1920x1080
0 (!)  fps    + Confronta
basso 1024x768
44.6  fps    + Confronta
medio 1366x768
21.8  fps    + Confronta
alto 1920x1080
9.9  fps    + Confronta
ultra 1920x1080
5.2  fps    + Confronta
» Giocabile con tutti i portatili testati con dettagli basso.
F1 2014

F1 2014

2014
basso 1024x768
74  fps    + Confronta
medio 1366x768
49  fps    + Confronta
alto 1920x1080
25  fps    + Confronta
ultra 1920x1080
15  fps    + Confronta
» Giocabile con tutti i portatili testati con dettagli medio.
basso 1024x768
21.8  fps    + Confronta
medio 1366x768
14  fps    + Confronta
alto 1920x1080
6.7  fps    + Confronta
ultra 1920x1080
6.3  fps    + Confronta
» Il Benchmark indica che il gioco non è utilizzabile con i settaggi testati.
basso 1024x768
45.3  fps    + Confronta
medio 1366x768
28.3  fps    + Confronta
alto 1920x1080
14.4  fps    + Confronta
ultra 1920x1080
10.5  fps    + Confronta
» Giocabile con tutti i portatili testati con dettagli basso.
basso 1280x720
32  fps    + Confronta
medio 1344x756
19.9  fps    + Confronta
alto 1920x1080
10.5  fps    + Confronta
ultra 1920x1080
8.3  fps    + Confronta
» Il Benchmark indica che il gioco non è utilizzabile con i settaggi testati.
Fifa 15

Fifa 15

2014
basso 1280x720
65.3  fps    + Confronta
alto 1366x768
45.7  fps    + Confronta
ultra 1920x1080
24.7  fps    + Confronta
» Giocabile con tutti i portatili testati con dettagli alto.
Sims 4

Sims 4

2014
basso 1024x768
187.4  fps    + Confronta
medio 1366x768
52.6  fps    + Confronta
alto 1920x1080
25.2  fps    + Confronta
ultra 1920x1080
16.8  fps    + Confronta
» Giocabile con tutti i portatili testati con dettagli medio.
basso 1024x768
101.1  fps    + Confronta
medio 1366x768
44.9  fps    + Confronta
alto 1920x1080
22.9  fps    + Confronta
ultra 1920x1080
12.5  fps    + Confronta
» Giocabile con tutti i portatili testati con dettagli medio.
basso 1024x768
30.3  fps    + Confronta
medio 1366x768
17.9  fps    + Confronta
alto 1920x1080
5.9  fps    + Confronta
ultra 1920x1080
3.8  fps    + Confronta
» Il Benchmark indica che il gioco non è utilizzabile con i settaggi testati.
Thief

Thief

2014
basso 1024x768
27.7  fps    + Confronta
medio 1366x768
15.9  fps    + Confronta
alto 1366x768
12.7  fps    + Confronta
ultra 1920x1080
6.1  fps    + Confronta
» Il Benchmark indica che il gioco non è utilizzabile con i settaggi testati.
basso 1024x768
46.9  fps    + Confronta
medio 1366x768
30.9  fps    + Confronta
alto 1366x768
18.6  fps    + Confronta
ultra 1920x1080
6  fps    + Confronta
» Giocabile con tutti i portatili testati con dettagli basso.
basso 1024x768
32.9  fps    + Confronta
medio 1366x768
24  fps    + Confronta
alto 1366x768
15.8  fps    + Confronta
ultra 1920x1080
7.5  fps    + Confronta
» Il Benchmark indica che il gioco non è utilizzabile con i settaggi testati.
basso 1280x720
57.6  fps    + Confronta
medio 1366x768
30.3  fps    + Confronta
alto 1366x768
25  fps    + Confronta
ultra 1920x1080
7.5  fps    + Confronta
» Giocabile con tutti i portatili testati con dettagli basso.
basso 1024x768
81.6  fps    + Confronta
medio 1366x768
39.4  fps    + Confronta
alto 1366x768
25  fps    + Confronta
ultra 1920x1080
11.4  fps    + Confronta
» Giocabile con tutti i portatili testati con dettagli medio.
Crysis 3

Crysis 3

2013
basso 1024x768
30.8  fps    + Confronta
medio 1366x768
18.8  fps    + Confronta
alto 1366x768
12.4  fps    + Confronta
ultra 1920x1080
4.7  fps    + Confronta
» Il Benchmark indica che il gioco non è utilizzabile con i settaggi testati.
bassomedioaltoultraQHD4K
Fallout 7615.1
Hitman 210.4
Final Fantasy XV Benchmark8.7
FIFA 1871
Team Fortress 2103944215.4
Dirt 439.7
Rocket League55.228.6
Mass Effect Andromeda17.1
For Honor21.98.5
Watch Dogs 214.912.3
Dishonored 2
Farming Simulator 1745.518.1
Battlefield 129.819.38.87.6
Mafia 38.3
FIFA 176850.428.1
Overwatch4028
Ashes of the Singularity5.8
The Division17.4
Far Cry Primal168
XCOM 215.8
Rise of the Tomb Raider0
Just Cause 30
Fallout 417.9
Call of Duty: Black Ops 331.218.5
FIFA 167039.820.8
World of Warships744822.916.5
Metal Gear Solid V31.220.77.2
Mad Max16.47.6
Batman: Arkham Knight1295
The Witcher 314.79.65.63.1
Dirt Rally112.727.412.912.5
Battlefield Hardline37.826.810.86
Evolve1913.57.76.7
Dragon Age: Inquisition32.120.37.24.2
Far Cry 422.516.38.46.3
Assassin's Creed Unity0000
Call of Duty: Advanced Warfare44.621.89.95.2
F1 201474492515
Ryse: Son of Rome21.8146.76.3
Alien: Isolation45.328.314.410.5
Middle-earth: Shadow of Mordor3219.910.58.3
Fifa 1565.345.724.7
Sims 4187.452.625.216.8
GRID: Autosport101.144.922.912.5
Watch Dogs30.317.95.93.8
Thief27.715.912.76.1
Battlefield 446.930.918.66
Metro: Last Light32.92415.87.5
BioShock Infinite57.630.3257.5
Tomb Raider81.639.42511.4
Crysis 330.818.812.44.7
< 30 fps
< 60 fps
< 120 fps
≥ 120 fps
19
15
10
1
24
9
1
27
3

25


Per conoscere altri giochi che potrebbero essere utilizzabili e per una lista completa di tutti i giochi e delle schede grafiche visitate la nostra Gaming List

v1.26
log 05. 14:43:09

#0 no ids found in url (should be separated by "_") +0s ... 0s

#1 not redirecting to Ajax server +0s ... 0s

#2 did not recreate cache, as it is less than 5 days old! Created at Mon, 04 Mar 2024 05:34:43 +0100 +0.001s ... 0.001s

#3 no comparison url found in template nbc.compare_page_1 needed +0.041s ... 0.042s

#4 no comparison url found in template nbc.compare_page_1 needed +0s ... 0.043s

#5 no comparison url found in template nbc.compare_page_1 needed +0s ... 0.043s

#6 no comparison url found in template nbc.compare_page_1 needed +0s ... 0.043s

#7 no comparison url found in template nbc.compare_page_1 needed +0s ... 0.044s

#8 no comparison url found in template nbc.compare_page_1 needed +0s ... 0.044s

#9 no comparison url found in template nbc.compare_page_1 needed +0s ... 0.044s

#10 no comparison url found in template nbc.compare_page_1 needed +0s ... 0.045s

#11 no comparison url found in template nbc.compare_page_1 needed +0s ... 0.045s

#12 no comparison url found in template nbc.compare_page_1 needed +0s ... 0.045s

#13 no comparison url found in template nbc.compare_page_1 needed +0s ... 0.045s

#14 no comparison url found in template nbc.compare_page_1 needed +0s ... 0.046s

#15 no comparison url found in template nbc.compare_page_1 needed +0s ... 0.046s

#16 no comparison url found in template nbc.compare_page_1 needed +0s ... 0.046s

#17 no comparison url found in template nbc.compare_page_1 needed +0s ... 0.047s

#18 no comparison url found in template nbc.compare_page_1 needed +0s ... 0.047s

#19 no comparison url found in template nbc.compare_page_1 needed +0s ... 0.047s

#20 no comparison url found in template nbc.compare_page_1 needed +0s ... 0.047s

#21 no comparison url found in template nbc.compare_page_1 needed +0s ... 0.048s

#22 no comparison url found in template nbc.compare_page_1 needed +0s ... 0.048s

#23 no comparison url found in template nbc.compare_page_1 needed +0s ... 0.048s

#24 no comparison url found in template nbc.compare_page_1 needed +0.001s ... 0.049s

#25 composed specs +0s ... 0.049s

#26 did output specs +0s ... 0.049s

#27 start showIntegratedCPUs +0s ... 0.049s

#28 getting avg benchmarks for device 5949 +0.03s ... 0.079s

#29 got single benchmarks 5949 +0.008s ... 0.087s

#30 got avg benchmarks for devices +0s ... 0.087s

#31 min, max, avg, median took s +0.287s ... 0.374s

#32 before gaming benchmark output +0s ... 0.374s

#33 Got 142 rows for game benchmarks. +0.005s ... 0.379s

#34 composed SQL query for gamebenchmarks +0s ... 0.379s

#35 got data and put it in $dataArray +0.037s ... 0.416s

#36 benchmarks composed for output. +1.43s ... 1.846s

#37 no comparison url found in template nbc.compare_page_1 needed +0.004s ... 1.85s

#38 return log +0s ... 1.85s

Nessuna recensione trovato per questa scheda grafica

Please share our article, every link counts!

Classe 1

GeForce RTX 2080 Super Mobile

Classe 2

M1 Max 32-Core GPU *
GeForce RTX 2070 Super Mobile
M1 Max 24-Core GPU *
Radeon RX 5700M *
M1 Pro 16-Core GPU *
Radeon PRO W6600M *
GeForce RTX 2070 Super Max-Q
M1 Pro 14-Core GPU *
Quadro P4200
Quadro P5000 Max-Q *
GeForce RTX 3050 4GB Laptop GPU
Quadro P4000 Max-Q
Radeon RX 580X (Laptop) *
Radeon RX 580 (Laptop)
Radeon Pro 5300M
Radeon RX 5300M
Quadro P3000 Max-Q *
Radeon Pro WX 7100 *
Radeon RX 570X (Laptop) *
Radeon RX 570 (Laptop) *
Radeon RX 470 (Laptop) *

Classe 3

GeForce GTX 1050 Ti Mobile
Radeon 680M
Quadro P2000 Max-Q
Radeon R9 M395X
GeForce GTX 1050 Ti Max-Q *
WX Vega M GL
Radeon R9 M485X
GeForce GTX 1050 Max-Q *
Radeon 660M
Radeon RX 560X (Laptop)
Radeon RX 560 (Laptop)
Radeon Pro 560X
Radeon Pro 560
Radeon Pro 460
Radeon Pro WX 4130 *
Quadro P620 *
Radeon RX 550X (Laptop)
Radeon Pro 555X
Radeon Pro 555
Radeon Pro 455
Quadro P600
Radeon RX 540X *
Radeon Pro WX 2100 *
Radeon Pro WX 3100 *
Radeon Pro 450
Radeon 630
Radeon 540X *
Quadro P520
Quadro P500 *
Iris Plus Graphics G7 (Ice Lake 64 EU) *
Vega 10 *
Iris Pro Graphics 580
Vega 9
FirePro W5130M
UHD Graphics Xe G4 48EUs *
UHD Graphics 32EUs
UHD Graphics Xe 32EUs (Tiger Lake-H) *
UHD Graphics 750
Vega 7
Radeon R7 M465
Vega 8
Iris Plus Graphics G4 (Ice Lake 48 EU)
Quadro M600M
FirePro W4190M
Radeon R7 M445
UHD Graphics 24EUs (Alder Lake-N) *
Radeon R7 M340
Radeon 610M *
UHD Graphics G1 (Ice Lake 32 EU)
UHD Graphics Xe 16EUs (Tiger Lake-H) *
Radeon R5 (Bristol Ridge)
Adreno 690 *
Adreno 685 *
Adreno 680 *

Classe 4

UHD Graphics 730
Radeon R5 M315 *
Radeon R5 M420 *
UHD Graphics 617
UHD Graphics 615
Radeon R4 (Stoney Ridge)
Radeon R2 (Stoney Ridge)
HD Graphics (Broadwell)

Classe 5

Posizione approssimativa dell'adattatore grafico

> Recensioni e prove di notebook, tablets e smartphones > Info Techniche / Tips > Confronto delle schede video > Intel > Intel HD Graphics 5600
Klaus Hinum, 2015-12- 9 (Update: 2015-12- 9)