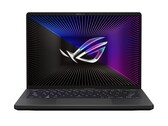
Recensione del portatile Asus ROG Zephyrus G14 GA402RJ: Display luminoso e tante prestazioni
AMD Ryzen 7 6800HS | AMD Radeon RX 6700S | 14.00" | 1.7 kg

La AMD Radeon RX 6700S è una scheda grafica mobile di fascia alta per portatili da gioco. Utilizza il chip Navi 22 basato sulla nuova architettura RDNA 2. Utilizza 2.304 dei 2.560 shader (= 36 CUs), 144? TMUs e 64 ROPs. Il sistema di memoria a 160 Bit collega 10 GB GDDR6 con clock di memoria a 2 GHz. Inoltre, la RX6800S include 80 MB di Infinity Cache. AMD ha specificato 2 GHz di clock di gioco per 7,9 TFLOPS di prestazioni teoriche FP32 a un TDP di 80 Watt. Questo significa che la GPU è in teoria più lenta di una Radeon RX 6650M (8,85 TFLOPS). La 6700S è la variante a risparmio energetico della RX 6700M e presenta velocità di clock più basse e un TDP inferiore.
Le prestazioni di gioco della RX 6700S dovrebbero essere simili alla Radeon RX 6650M. AMD specifica le prestazioni simili a quelle di una RTX 3060 a basso consumo. Quando gli effetti Raytracing sono attivati, cade dietro le GPU GeForce.
Il chip Navi 22 è prodotto da TSMC nel moderno processo a 7nm.
Radeon RX 6000M Serie
| ||||||||||||||||||||||||||||||||||||||||||||||
| Architettura | RDNA 2 | |||||||||||||||||||||||||||||||||||||||||||||
| Pipelines | 1792 - unified | |||||||||||||||||||||||||||||||||||||||||||||
| TMUs | 112 | |||||||||||||||||||||||||||||||||||||||||||||
| ROPs | 64 | |||||||||||||||||||||||||||||||||||||||||||||
| Raytracing Cores | 28 | |||||||||||||||||||||||||||||||||||||||||||||
| Velocità del core | 1700 - 1890 (Boost) MHz | |||||||||||||||||||||||||||||||||||||||||||||
| Theoretical Performance | 15.84 TFLOPS FP16, 7.92 TFLOPS FP32 | |||||||||||||||||||||||||||||||||||||||||||||
| Cache | L2: 2 MB, L3: 32 MB | |||||||||||||||||||||||||||||||||||||||||||||
| Velocità della memoria | 14000 effective = 1750 MHz | |||||||||||||||||||||||||||||||||||||||||||||
| Larghezza del bus di memoria | 128 Bit | |||||||||||||||||||||||||||||||||||||||||||||
| Tipo di memoria | GDDR6 | |||||||||||||||||||||||||||||||||||||||||||||
| Max. quantità di memoria | 10 GB | |||||||||||||||||||||||||||||||||||||||||||||
| Memoria condivisa | no | |||||||||||||||||||||||||||||||||||||||||||||
| Memory Bandwidth | 224 GB/s | |||||||||||||||||||||||||||||||||||||||||||||
| API | DirectX 12, Shader 6.4, OpenGL 4.6 | |||||||||||||||||||||||||||||||||||||||||||||
| Consumo di corrente | 80 Watt | |||||||||||||||||||||||||||||||||||||||||||||
| Transistor Count | 17.2 Billion | |||||||||||||||||||||||||||||||||||||||||||||
| tecnologia | 7 nm | |||||||||||||||||||||||||||||||||||||||||||||
| PCIe | 4.0 x8 | |||||||||||||||||||||||||||||||||||||||||||||
| Caratteristiche | DisplayPort 1.4 w/DFSC, HDMI 2.0b, Radeon Media Engine (H.264 4K150 decode, 4K90 encode / H.265 4K90 decode, 4K60 encode / VP9 4K90 decode) | |||||||||||||||||||||||||||||||||||||||||||||
| Dimensione del portatile | misura media | |||||||||||||||||||||||||||||||||||||||||||||
| Data dell'annuncio | 04.01.2022 | |||||||||||||||||||||||||||||||||||||||||||||
| Link alla pagina del produttore | www.amd.com | |||||||||||||||||||||||||||||||||||||||||||||
I seguenti benchmarks deirivano dai benchmarks dei portatili recensiti. Le prestazioni dipendono dalla scheda grafica utilizzata, dal clock rate, dal processore, dai settaggi di sistema, dai drivers, e dai sistemi operativi. Quindi i risultati non sono rappresentativi per i portatili con questa GPU. Per informazioni dettagliate sui risultati del benchmark, cliccate sul numero di fps.


| basso | medio | alto | ultra | QHD | 4K | |
|---|---|---|---|---|---|---|
| The Quarry | 95.3 | 76.1 | 54.8 | 35.3 | ||
| F1 22 | 211 | 161 | 37 | 21 | ||
| Vampire Bloodhunt | 202 | 179.5 | 165.4 | 97.9 | ||
| Ghostwire Tokyo | 116.4 | 115.3 | 115.2 | 59.8 | ||
| Tiny Tina's Wonderlands | 133 | 82.4 | 62.4 | 39.1 | ||
| Cyberpunk 2077 1.6 | 99.1 | 74 | 59.7 | 31.2 | ||
| Elex 2 | 70.7 | 64.8 | 59.2 | 38.3 | ||
| GRID Legends | 194 | 147 | 114 | 88.1 | ||
| Elden Ring | 59.9 | 59.9 | 59.9 | 56.6 | ||
| Dying Light 2 | 64.8 | 50.9 | 31.1 | |||
| Rainbow Six Extraction | 159 | 157 | 126 | 66 | ||
| God of War | 79 | 69.4 | 50.5 | 38.9 | ||
| Halo Infinite | 97.9 | 80.8 | 75.9 | 53.9 | ||
| Farming Simulator 22 | 155.9 | 134.2 | 119.8 | 104.5 | ||
| Forza Horizon 5 | 140 | 138 | 74 | 54 | ||
| Riders Republic | 100 | 91 | 88 | 59 | ||
| Guardians of the Galaxy | 112 | 111 | 104 | 68 | ||
| Back 4 Blood | 200 | 171.3 | 157.3 | 92.4 | ||
| Far Cry 6 | 107 | 93 | 86 | 59 | ||
| Alan Wake Remastered | 133.3 | 120.8 | 78.2 | |||
| Deathloop | 110.8 | 89 | 66.3 | 39.6 | ||
| Days Gone | 117.4 | 106.5 | 77.2 | 50.6 | ||
| Mass Effect Legendary Edition | 98.4 | 95.3 | ||||
| Resident Evil Village | 195.7 | 180.1 | 142.8 | 92.3 | ||
| Outriders | 115.5 | 111.3 | 96.9 | 56.3 | ||
| Hitman 3 | 178 | 159 | 146 | 83.4 | ||
| Yakuza Like a Dragon | 98.5 | 94.7 | 83.5 | 48.9 | ||
| Assassin´s Creed Valhalla | 113 | 93 | 79 | 49 | ||
| Dirt 5 | 116 | 98 | 80.3 | 67.7 | ||
| Watch Dogs Legion | 109 | 96 | 59 | 38 | ||
| Star Wars Squadrons | 286 | 245 | 224 | 146.7 | ||
| Mafia Definitive Edition | 92 | 84.3 | 51.2 | |||
| Serious Sam 4 | 102 | 94.9 | 82.9 | 73.1 | ||
| Crysis Remastered | 171.2 | 55 | 46.6 | 28.4 | ||
| Death Stranding | 139.8 | 129.8 | 128 | 85.4 | ||
| Gears Tactics | 189 | 123 | 88.1 | 56.7 | ||
| Doom Eternal | 218 | 194.7 | 189.7 | 120.8 | ||
| Hunt Showdown | 124.7 | 99.3 | 72 | |||
| Strange Brigade | 227 | 182.7 | 157.3 | |||
| Far Cry 5 | 110 | 103 | 97 | 79 | ||
| X-Plane 11.11 | 65.4 | 51.7 | 45.2 | |||
| Final Fantasy XV Benchmark | 106.7 | 78.6 | ||||
| Dota 2 Reborn | 145.1 | 114.7 | 103 | |||
| The Witcher 3 | 246 | 144 | 84.3 | |||
| GTA V | 170.9 | 154.7 | 81.3 | |||
| basso | medio | alto | ultra | QHD | 4K | < 30 fps < 60 fps < 120 fps ≥ 120 fps | 1 1 | 2 21 20 | 4 23 17 | 8 22 9 | 2 20 15 2 | |
Per conoscere altri giochi che potrebbero essere utilizzabili e per una lista completa di tutti i giochi e delle schede grafiche visitate la nostra Gaming List

Asus ROG Zephyrus G14 GA402RJ: AMD Ryzen 7 6800HS, 14.00", 1.7 kg
Recensioni esterne » Asus ROG Zephyrus G14 GA402RJ
Asus ROG Zephyrus G14 GA402RJ-L8116W: AMD Ryzen 7 6800HS, 14.00", 1.7 kg
Recensioni esterne » Asus ROG Zephyrus G14 GA402RJ-L8116W
Posizione approssimativa dell'adattatore grafico
I nostri Top 10
» Top 10 Portatili Multimedia
» Top 10 Portatili Gaming
» Top 10 Portatili Gaming Leggeri
» Top 10 Portatili da Ufficio e Business economici
» Top 10 Portatili Premium da Ufficio/Business
» Top 10 Portatili sotto i 300 Euro
» Top 10 Portatili sotto i 500 Euro
» Top 10 dei Portatili Workstation
» Top 10 Subnotebooks
» Top 10 Ultrabooks
» Top 10 Convertibili
» Top 10 Tablets
» Top 10 Tablets Windows
» Top 10 Smartphones