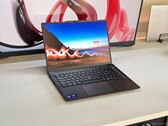
Recensione del Lenovo ThinkPad E14 Gen 7 - Lunar Lake offre una maggiore durata della batteria, ma comporta dei compromessi
Intel Core Ultra 5 228V | Intel Arc Graphics 130V | 14.00" | 1.4 kg
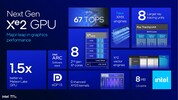
L'Intel Arc Graphics 130V è un adattatore grafico integrato che gli Intel di fascia più bassa Lunar Lake di fascia bassa. Si tratta di un successore diretto dell' Arc 7 iGPU; ha 7 core di architettura Xe² che funzionano fino a 1.850 MHz e 7 unità di ray tracing a disposizione.
DirectX 12 Ultimate è pienamente supportato e l'iGPU supporta anche la decodifica hardware di un lungo elenco di codec video popolari come h.266 VVC, h.265 HEVC, h.264 AVC, AV1 e VP9. Può pilotare tre monitor SUHD 4320p simultaneamente tramite HDMI 2.1, eDP 1.5 e DP 2.1.
Proprio come nel caso di Meteor Lake, Intel utilizza la sua tecnologia Foveros per costruire i chip Lunar Lake, il che significa che l'iGPU e i core della CPU si trovano su die diversi impilati l'uno sull'altro o uno accanto all'altro.
Prestazioni
Sulla base dei risultati dei nostri test interni a 140V, ci aspettiamo che il 130V sia veloce quanto la Radeon 780M per ottenere frame rate giocabili nella maggior parte dei giochi del 2023 e in alcuni giochi del 2024 a 1080p con impostazioni grafiche basse.
Consumo di energia
I consumi energetici dei processori Lunar Lake sono relativamente modesti e si aggirano tra i 20 e i 30 W, di cui circa la metà viene consumata dalla GPU integrata.
Gen13 / Xe² Serie
| |||||||
| Nome in codice | Lunar Lake iGPU | ||||||
| Architettura | Xe² Battlemage | ||||||
| Pipelines | 7 - unified | ||||||
| Raytracing Cores | 7 | ||||||
| Velocità del core | 1850 (Boost) MHz | ||||||
| Tipo di memoria | LPDDR5x | ||||||
| Max. quantità di memoria | 16 GB | ||||||
| Memoria condivisa | si | ||||||
| API | DirectX 12_2, OpenGL 4.6, OpenCL 3.0, Vulkan 1.4 | ||||||
| tecnologia | 3 nm | ||||||
| Displays | 3 Displays (max.), HDMI 2.1, DisplayPort 2.1 | ||||||
| Caratteristiche | SUHD 4320p60 resolution support, AVC/HEVC/VVC/VP9/AV1 decoding | ||||||
| Data dell'annuncio | 24.09.2024 | ||||||
| Predecessor | Arc 7-Core | ||||||
| ||||||||||||||||||||||||
I seguenti benchmarks deirivano dai benchmarks dei portatili recensiti. Le prestazioni dipendono dalla scheda grafica utilizzata, dal clock rate, dal processore, dai settaggi di sistema, dai drivers, e dai sistemi operativi. Quindi i risultati non sono rappresentativi per i portatili con questa GPU. Per informazioni dettagliate sui risultati del benchmark, cliccate sul numero di fps.


| basso | medio | alto | ultra | QHD | 4K | |
|---|---|---|---|---|---|---|
| F1 25 | 67.1 | 53.4 | 43.8 | |||
| Until Dawn | 27.6 | 18.6 | 12.3 | 9.68 | ||
| God of War Ragnarök | 18.7 | 18.5 | 16.2 | 15.7 | ||
| Final Fantasy XVI | 14.7 | 13.6 | 11.7 | 11.5 | ||
| Space Marine 2 | 16.4 | 15 | 14.7 | 13.2 | ||
| Star Wars Outlaws | 8.56 | 7.3 | ||||
| F1 24 | 73 | 65 | 49 | 16 | ||
| Senua's Saga Hellblade 2 | 13.2 | 11.7 | 9.12 | |||
| Ghost of Tsushima | 22.5 | 20.8 | 17.8 | 13.6 | ||
| Horizon Forbidden West | 25.5 | 22.1 | 16.3 | 15.1 | ||
| Dragon's Dogma 2 | 17.6 | 13.1 | ||||
| Helldivers 2 | 33.4 | 25.6 | 23.5 | 22 | ||
| Prince of Persia The Lost Crown | 162.6 | 103.8 | 101.5 | |||
| Ready or Not | 52.5 | 40.8 | 26.5 | 19.9 | ||
| The Finals | 79.6 | 62.9 | 55.3 | 44.8 | ||
| Avatar Frontiers of Pandora | 12 | 11 | 8.7 | 7.1 | ||
| Alan Wake 2 | 15.1 | 12.6 | 11.2 | |||
| Lords of the Fallen | 17.1 | 16.1 | 14.3 | 11.4 | ||
| Total War Pharaoh | 99.8 | 55.5 | 31 | 25.4 | ||
| Assassin's Creed Mirage | 33 | 32 | 29 | |||
| Counter-Strike 2 | 50.7 | 47.1 | 28.3 | 21.4 | ||
| Cyberpunk 2077 | 40 | 31 | 27 | 24 | ||
| Baldur's Gate 3 | 33 | 26 | 23 | 22 | ||
| F1 22 | 91.2 | 81.3 | 59.7 | 18 | ||
| Tiny Tina's Wonderlands | 61.1 | 43.6 | 27.2 | 21.2 | ||
| Strange Brigade | 193 | 73 | 60 | 50 | ||
| Far Cry 5 | 77 | 43 | 39 | 36 | ||
| X-Plane 11.11 | 44 | 34 | 31 | |||
| Final Fantasy XV Benchmark | 78 | 42 | 29 | 23.4 | ||
| Dota 2 Reborn | 96 | 87 | 74 | 74 | ||
| GTA V | 150 | 132 | 55 | 23 | ||
| basso | medio | alto | ultra | QHD | 4K | < 30 fps < 60 fps < 120 fps ≥ 120 fps | 12 7 9 2 | 13 10 5 2 | 19 8 3 | 18 3 2 | 1 | |
Per conoscere altri giochi che potrebbero essere utilizzabili e per una lista completa di tutti i giochi e delle schede grafiche visitate la nostra Gaming List


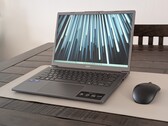
Asus Vivobook S 14 OLED S5406SA: Intel Core Ultra 5 226V, 14.00", 1.3 kg
recensione » Recensione dell'Asus Vivobook S 14 OLED: economico, più silenzioso e con una maggiore autonomia grazie al Lunar Lake
Samsung Galaxy Book5 Pro 360: Intel Core Ultra 5 226V, 16.00", 1.7 kg
recensione » Recensione del portatile Samsung Galaxy Book5 Pro 360 - Il convertibile OLED di grandi dimensioni beneficia della Intel Lunar Lake
Acer Swift 14 AI SF14-51-58TU: Intel Core Ultra 5 226V, 14.00", 1.3 kg
recensione » Recensione dell'Acer Swift 14 AI: Il primo computer portatile con Arc Graphics 130V
Lenovo Yoga 7 2-in-1 14ILL10: Intel Core Ultra 5 226V, 14.00", 1.4 kg
Recensioni esterne » Lenovo Yoga 7 2-in-1 14ILL10
Acer Swift Go 14 AI SFG14-75 : Intel Core Ultra 5 226V, 14.00", 1.2 kg
Recensioni esterne » Acer Swift Go 14 AI SFG14-75
HP OmniBook X Flip NGAI 14-fm0000: Intel Core Ultra 5 226V, 14.00", 1.4 kg
Recensioni esterne » HP OmniBook X Flip NGAI 14-fm0000
Acer Aspire 14 AI A14-53M: Intel Core Ultra 5 226V, 14.00", 1.2 kg
Recensioni esterne » Acer Aspire 14 AI A14-53M
Microsoft Surface Laptop 7 13.8, Ultra 5 238V: Intel Core Ultra 5 238V, 13.80", 1.4 kg
Recensioni esterne » Microsoft Surface Laptop 7 13.8, Ultra 5 238V
Asus VivoBook 14 Flip TP3407SA, Ultra 5 226V: Intel Core Ultra 5 226V, 14.00", 1.6 kg
Recensioni esterne » Asus VivoBook 14 Flip TP3407SA, Ultra 5 226V
Microsoft Surface Pro 11: Intel Core Ultra 5 236V, 13.00", 0.9 kg
Recensioni esterne » Microsoft Surface Pro 11
Acer Swift 16 AI SF16-51, Ultra 5 226V: Intel Core Ultra 5 226V, 16.00", 1.5 kg
Recensioni esterne » Acer Swift 16 AI SF16-51, Ultra 5 226V
Acer Aspire 14 AI N24Q14: Intel Core Ultra 5 226V, 14.00", 1.4 kg
Recensioni esterne » Acer Aspire 14 AI N24Q14
Asus Vivobook S 14 OLED S5406SA: Intel Core Ultra 5 226V, 14.00", 1.3 kg
Recensioni esterne » Asus Vivobook S 14 OLED S5406SA
Asus Vivobook S14 Q423: Intel Core Ultra 5 226V, 14.00", 1.3 kg
Recensioni esterne » Asus Vivobook S14 Q423
Acer Swift 14 AI SF14-51-58TU: Intel Core Ultra 5 226V, 14.00", 1.3 kg
Recensioni esterne » Acer Swift 14 AI SF14-51-58TU
Asus ZenBook S14 OLED UX5406SA: Intel Core Ultra 5 226V, 14.00", 1.2 kg
Recensioni esterne » Asus ZenBook S14 OLED UX5406SA
Lenovo ThinkPad E14 Gen 7 21U2002QGE: Intel Core Ultra 5 228V, 14.00", 1.4 kg
» Lenovo offre il ThinkPad E14 Gen 7 con le moderne CPU Intel, ma solo le vecchie CPU AMD
Samsung Galaxy Book5 Pro 14 940XHA: Intel Core Ultra 5 226V, 14.00", 1.2 kg
» Samsung applica prezzi elevati per il Galaxy Book5 Pro, ma 1699 euro per 16 GB di RAM e un SSD da 512 GB sono eccessivi
» Il pannello OLED di Samsung in Galaxy Book5 Pro 14 non è all'altezza della concorrenza
Acer TravelMate P6 TMP614-54-TCO-553Z: Intel Core Ultra 5 226V, 14.00", 1 kg
» Talenti nascosti: funzioni intelligenti dell'Acer TravelMate P6 che brillano nell'uso quotidiano
Lenovo ThinkPad T14s Gen 6 Intel: Intel Core Ultra 5 228V, 14.00", 1.3 kg
» Massima efficienza: Lenovo ThinkPad T14s Gen 6 mostra perché Lunar Lake è la scelta perfetta per i computer portatili aziendali
Asus Vivobook S 14 OLED S5406SA: Intel Core Ultra 5 226V, 14.00", 1.3 kg
» Asus Vivobook S 16 (S5606CA) è stato lanciato con le ultime CPU mobili Intel Core Ultra 200H Arrow Lake e il display OLED Lumina
Posizione approssimativa dell'adattatore grafico
I nostri Top 10
» Top 10 Portatili Multimedia
» Top 10 Portatili Gaming
» Top 10 Portatili Gaming Leggeri
» Top 10 Portatili da Ufficio e Business economici
» Top 10 Portatili Premium da Ufficio/Business
» Top 10 Portatili sotto i 300 Euro
» Top 10 Portatili sotto i 500 Euro
» Top 10 dei Portatili Workstation
» Top 10 Subnotebooks
» Top 10 Ultrabooks
» Top 10 Convertibili
» Top 10 Tablets
» Top 10 Tablets Windows
» Top 10 Smartphones