
Notebookcheck Logo

Apple M3 Pro 14-Core GPU
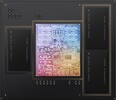
Apple M3 Pro 14-Core GPU

Apple M2 Max 38-Core-GPU è una scheda grafica integrata di Apple che offre tutti i 38 core del chip M2 Max.Chip M2 Max.

La scheda grafica non ha una memoria grafica dedicata, ma può utilizzare la veloce memoria unificata LPDDR5-6400 con un bus a 512 bit (fino a 400 GBit/s).

Grazie ai core aggiuntivi e ai miglioramenti architettonici, la GPU M2 Max dovrebbe essere nettamente migliore della vecchia GPU GPU M1 Maxcon 32 core e quindi essere la iGPU più veloce attualmente disponibile.

La GPU è destinata a utilizzare l'API Apple Metal 2 e potrebbe essere ancora basata sulle vecchie architetture PowerVR (utilizzate l'ultima volta nel modello Apple A10). Una nuova caratteristica dei MacBook Pro 14 e 16 del 2023 è il supporto dell'uscita HDMI 2.1 e 8k.

Apple M2 Max è prodotto nel processo di seconda generazione a 5nm presso TSMC. Secondo lo strumento interno di powermetrics, la GPU utilizza fino a 53,6 Watt (modalità prestazioni) e l'intero chip (compresa la CPU) fino a 89 Watt.

Apple M3 Serie

M3 Max 40-Core GPU 40
M3 Max 30-Core GPU 30
M3 Pro 18-Core GPU 18
M3 Pro 14-Core GPU 14
M3 10-Core GPU 10
M3 8-Core GPU 8
Pipelines14 - unified
Tipo di memoriaLPDDR5-6400
Memoria condivisano
tecnologia5 nm
Dimensione del portatilemisura media
Data dell'annuncio31.10.2023
CPU in M3 Pro 14-Core GPUGPU Base SpeedGPU Boost / Turbo
Apple M3 Pro 11-Core11 x 2748 MHz, 27 W? MHz? MHz

Benchmark

3DMark - 3DMark Wild Life Extreme Unlimited
12094 Points (14%)
Blender - Blender 3.3 Classroom METAL *
73 Seconds (8%)
Cinebench R15
Cinebench R15 OpenGL 64 Bit +
Cinebench R15 OpenGL Ref. Match 64 Bit +
GFXBench - GFXBench 5.0 4K Aztec Ruins High Tier Offscreen
79 fps (32%)
GFXBench - GFXBench 5.0 Aztec Ruins High Tier Offscreen
178.7 fps (32%)
3.3 -98%
...
102.9 -42%
108 -40%
109 -39%
110.2 -38%
Apple M3 10-Core GPU
118.5 -34%
Apple M1 Pro 14-Core GPU
147 -18%
153 -14%
161.4 -10%
Apple M1 Pro 16-Core GPU
166 -7%
Apple M3 Pro 14-Core GPU
178.7
181.1 1%
185.4 4%
187 5%
208 16%
210.6 18%
219.7 23%
Apple M1 Max 24-Core GPU
240 34%
242.3 36%
248.5 39%
...
536 200%
0%
100%
GFXBench - GFXBench 5.0 Aztec Ruins Normal Tier Offscreen
481.9 fps (36%)
GFXBench - GFXBench Car Chase Offscreen
376.3 fps (42%)
GFXBench 3.0 - GFXBench 3.0 Manhattan Offscreen
818 fps (48%)
GFXBench (DX / GLBenchmark) 2.7
GFXBench T-Rex HD Offscreen C24Z16 +
Geekbench 6.2 - Geekbench 6.2 GPU OpenCL
42798 punti (12%)
Geekbench 6.2 - Geekbench 6.2 GPU Metal
68043 punti (44%)
Power Consumption - The Witcher 3 Power Consumption - external Monitor *
32.8 Watt (5%)
051015202530Tooltip
Power Consumption - Witcher 3 Power Consumption *
42.8 Watt (9%)
0510152025303540Tooltip
Power Consumption - Witcher 3 ultra Power Efficiency - external Monitor
min: 1.189     media: 1.2     media: 1.2 (99%)     massimo: 1.207 fps per Watt
Emissions Witcher 3 Fan Noise +
Emissions - Witcher 3 Fan Noise
25.1 dB(A) (40%)
- Valori di benchmark per questa scheda grafica
- Valori medi di benchmark per questa scheda grafica
* Numeri più piccoli rappresentano prestazioni supeiori

Benchmarks per i giochi

I seguenti benchmarks deirivano dai benchmarks dei portatili recensiti. Le prestazioni dipendono dalla scheda grafica utilizzata, dal clock rate, dal processore, dai settaggi di sistema, dai drivers, e dai sistemi operativi. Quindi i risultati non sono rappresentativi per i portatili con questa GPU. Per informazioni dettagliate sui risultati del benchmark, cliccate sul numero di fps.

Total War Pharaoh

Total War Pharaoh

2023
basso 1920x1080
193  fps    + Confronta
medio 1920x1080
125  fps    + Confronta
alto 1920x1080
67  fps    + Confronta
ultra 1920x1080
53  fps    + Confronta
QHD 2560x1440
35  fps    + Confronta
» Giocabile con tutti i portatili testati con dettagli ultra.
alto 1920x1080
42  fps    + Confronta
ultra 1920x1080
39  fps    + Confronta
» Giocabile con tutti i portatili testati con dettagli ultra.
medio 1920x1080
75  fps    + Confronta
alto 1920x1080
49.5  fps    + Confronta
ultra 1920x1080
35.9  fps    + Confronta
QHD 2560x1440
22.5  fps    + Confronta
» Giocabile con tutti i portatili testati con dettagli ultra.
medio 1920x1080
66  fps    + Confronta
alto 1920x1080
60  fps    + Confronta
ultra 1920x1080
53  fps    + Confronta
QHD 2560x1440
34  fps    + Confronta
» Giocabile con tutti i portatili testati con dettagli ultra.
ultra 1920x1080
39  fps    + Confronta
» Giocabile con tutti i portatili testati con dettagli ultra.
GTA V

GTA V

2015
alto 1920x1080
79  fps    + Confronta
ultra 1920x1080
50  fps    + Confronta
» Giocabile con tutti i portatili testati con dettagli ultra.
bassomedioaltoultraQHD4K
Total War Pharaoh193125675335
Baldur's Gate 34239
Total War: Three Kingdoms7549.535.922.5
Shadow of the Tomb Raider66605334
The Witcher 339
GTA V7950
< 30 fps
< 60 fps
< 120 fps
≥ 120 fps


1


2
1

2
3

6

1
2


Per conoscere altri giochi che potrebbero essere utilizzabili e per una lista completa di tutti i giochi e delle schede grafiche visitate la nostra Gaming List

v1.26
log 25. 13:49:32

#0 no ids found in url (should be separated by "_") +0s ... 0s

#1 not redirecting to Ajax server +0s ... 0s

#2 did not recreate cache, as it is less than 5 days old! Created at Thu, 25 Apr 2024 05:40:10 +0200 +0.001s ... 0.001s

#3 no comparison url found in template nbc.compare_page_1 needed +0.055s ... 0.056s

#4 no comparison url found in template nbc.compare_page_1 needed +0s ... 0.056s

#5 no comparison url found in template nbc.compare_page_1 needed +0s ... 0.057s

#6 no comparison url found in template nbc.compare_page_1 needed +0s ... 0.057s

#7 no comparison url found in template nbc.compare_page_1 needed +0s ... 0.057s

#8 composed specs +0s ... 0.057s

#9 did output specs +0s ... 0.057s

#10 start showIntegratedCPUs +0s ... 0.057s

#11 getting avg benchmarks for device 12032 +0.014s ... 0.071s

#12 got single benchmarks 12032 +0.008s ... 0.078s

#13 got avg benchmarks for devices +0s ... 0.078s

#14 min, max, avg, median took s +0.204s ... 0.283s

#15 before gaming benchmark output +0s ... 0.283s

#16 Got 18 rows for game benchmarks. +0.004s ... 0.287s

#17 composed SQL query for gamebenchmarks +0s ... 0.287s

#18 got data and put it in $dataArray +0.003s ... 0.29s

#19 benchmarks composed for output. +0.18s ... 0.471s

#20 no comparison url found in template nbc.compare_page_1 needed +0.002s ... 0.473s

#21 return log +0s ... 0.473s

Please share our article, every link counts!

Classe 1

GeForce RTX 2080 Super Mobile

Classe 2

M1 Max 32-Core GPU *
GeForce RTX 2070 Super Mobile
M1 Max 24-Core GPU *
Radeon RX 5700M *
M1 Pro 16-Core GPU *
Radeon PRO W6600M *
GeForce RTX 2070 Super Max-Q
M1 Pro 14-Core GPU *
Quadro P4200
Quadro P5000 Max-Q *
GeForce RTX 3050 4GB Laptop GPU
Quadro P4000 Max-Q
Radeon RX 580X (Laptop) *
Radeon RX 580 (Laptop)
Radeon Pro 5300M
Radeon RX 5300M
Quadro P3000 Max-Q *
Radeon Pro WX 7100 *
Radeon RX 570X (Laptop) *
Radeon RX 570 (Laptop) *
Radeon RX 470 (Laptop) *

Classe 3

GeForce GTX 1050 Ti Mobile
Radeon 680M
Quadro P2000 Max-Q
Radeon R9 M395X
GeForce GTX 1050 Ti Max-Q *
WX Vega M GL
Radeon R9 M485X
GeForce GTX 1050 Max-Q *
Radeon 660M
Radeon RX 560X (Laptop)
Radeon RX 560 (Laptop)
Radeon Pro 560X
Radeon Pro 560
Radeon Pro 460
Radeon Pro WX 4130 *
Quadro P620 *
Radeon RX 550X (Laptop)
Radeon Pro 555X
Radeon Pro 555
Radeon Pro 455
Quadro P600
Radeon RX 540X *
Radeon Pro WX 2100 *
Radeon Pro WX 3100 *
Radeon Pro 450
Radeon 630
Radeon 540X *
Quadro P520
Quadro P500 *
Iris Plus Graphics G7 (Ice Lake 64 EU) *
Vega 10 *
Iris Pro Graphics 580
Vega 9
FirePro W5130M
UHD Graphics Xe G4 48EUs *
UHD Graphics 32EUs
UHD Graphics Xe 32EUs (Tiger Lake-H) *
UHD Graphics 750
Vega 7
Radeon R7 M465
Vega 8
Iris Plus Graphics G4 (Ice Lake 48 EU)
Quadro M600M
FirePro W4190M
Radeon R7 M445
UHD Graphics 24EUs (Alder Lake-N) *
Radeon R7 M340
Radeon 610M *
UHD Graphics G1 (Ice Lake 32 EU)
UHD Graphics Xe 16EUs (Tiger Lake-H) *
Radeon R5 (Bristol Ridge)
Adreno 690 *
Adreno 685 *
Adreno 680 *

Classe 4

UHD Graphics 730
Radeon R5 M315 *
Radeon R5 M420 *
Xclipse 530
UHD Graphics 617
UHD Graphics 615
Radeon R4 (Stoney Ridge)
Radeon R2 (Stoney Ridge)
HD Graphics (Broadwell)

Classe 5

Posizione approssimativa dell'adattatore grafico

> Recensioni e prove di notebook, tablets e smartphones > Info Techniche / Tips > Confronto delle schede video > Apple M3 Pro 14-Core GPU
Klaus Hinum (Update: 2023-11-29)