Notebookcheck Logo

AMD Radeon RX Vega 6 (Ryzen 2000/3000)

AMD Vega 6

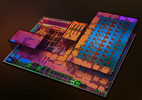
L'AMD Radeon RX Vega 6 è una GPU integrata per notebook. Viene utilizzata per le APUs Ryzen 3, lanciate all'inizio del 2018. La GPU è basata sull'architettura Vega (5a generazione GCN) e ha 6 CUs (= 384 dei 704 shader) con clock fino a 1100 MHz. Le prestazioni dipendono dal TDP configurato (12-25 W al lancio), dal clock, dal raffreddamento e dalla configurazione della memoria). La GPU dovrebbe beneficiare di una veloce RAM dual-channel DDR4-2400 (contrariamente alla al DDR4-2133 single-channel, che è anche possibile).

L'architettura Vega offre alcuni miglioramenti rispetto alla generazione Polaris e ora supporta DirectX 12 Feature Level 12_1. Maggiori informazioni sono disponibili nel nostro articolo dedicato all'architettura Raven Ridge.

Attualmente si stima una performance intorno a un'Intel UHD Graphics 630. Pertanto, solo i giochi più bassi e impegnativi del 2016 dovrebbero funzionare con impostazioni di dettaglio basso correntemente.

Grazie al processo da 14 nm e alle intelligenti funzioni di risparmio energetico, il consumo energetico è relativamente basso (secondo AMD), per cui la scheda grafica può essere utilizzata anche per notebook sottili e leggeri.

RX Vega 2000/3000 Serie

Vega 10 640 @ 1.3 GHz
Vega 9 576 @ 1.3 GHz
Vega 8 512 @ 1.2 GHz
Vega 6 384 @ 1.1 GHz
Vega 3 192 @ 0.6 - 1.2 GHz
Vega 2 128 @ 1.1 GHz
Nome in codiceVega Raven Ridge
ArchitetturaVega
Pipelines384 - unified
Velocità del core1100 (Boost) MHz
Memoria condivisano
APIDirectX 12_1
Consumo di corrente15 Watt
Transistor Count4.5 Billion
tecnologia14 nm
CaratteristicheTiled Rasterization, Shared Memory (up to Dual-Channel DDR4-2400)
Data dell'annuncio07.01.2018
CPU in Vega 6GPU Base SpeedGPU Boost / Turbo
AMD Ryzen 3 3350U4 x 2100 MHz, 15 W? MHz1200 MHz
AMD Ryzen 3 3300U4 x 2100 MHz, 15 W? MHz1200 MHz
AMD Ryzen 3 PRO 3300U4 x 2100 MHz, 15 W? MHz1200 MHz
min. - max.? MHz1100 - 1200 MHz

Benchmark

Performance Rating - 3DMark 11 + Fire Strike + Time Spy
1 pt (3%)
AMD Radeon HD 8180
0.06416 -94%
...
0.884 -11%
0.918 -8%
0.932 -6%
AMD FirePro W5130M
0.934 -6%
Intel Iris Plus Graphics G4 (Ice Lake 48 EU)
0.94 -5%
0.959 -3%
Intel UHD Graphics Xe 750 32EUs (Rocket Lake)
0.962 -3%
0.973 -2%
0.977 -2%
AMD Radeon RX Vega 6 (Ryzen 2000/3000)
0.993
1.005 1%
AMD Radeon RX Vega 10
1.005 1%
Intel UHD Graphics Xe G4 48EUs
1.027 3%
1.03 4%
1.031 4%
1.036 4%
1.038 5%
1.045 5%
AMD Radeon RX Vega 8 (Ryzen 2000/3000)
1.054 6%
...
20.4 1954%
max:
33.3 3253%
0%
100%
3DMark - 3DMark Time Spy Score
min: 585     media: 618     media: 617.5 (2%)     massimo: 650 Points
3DMark - 3DMark Time Spy Graphics
min: 522     media: 552     media: 551.5 (1%)     massimo: 581 Points
113 -80%
...
Intel UHD Graphics G1 (Ice Lake 32 EU)
419.6 -24%
442.5 -20%
450.5 -18%
452.3 -18%
AMD Radeon 610M
458.3 -17%
AMD Radeon R7 M445
471 -15%
493 -11%
Intel UHD Graphics Xe 750 32EUs (Rocket Lake)
539 -2%
550 0%
AMD Radeon RX Vega 6 (Ryzen 2000/3000)
552
555 1%
558 1%
570 3%
577 5%
614 11%
NVIDIA Quadro M600M
631 14%
Intel Iris Plus Graphics G4 (Ice Lake 48 EU)
639 16%
650 18%
Intel UHD Graphics Xe 32EUs (Tiger Lake-H)
670 21%
...
19434 3421%
max:
36520 6516%
0%
100%
3DMark - 3DMark Ice Storm Unlimited Graphics
94451 Points (10%)
3DMark - 3DMark Ice Storm Extreme Graphics
65778 Points (8%)
3DMark - 3DMark Cloud Gate Score
min: 9963     media: 10224     media: 10091 (11%)     massimo: 10619 Points
3DMark - 3DMark Cloud Gate Graphics
min: 15850     media: 16926     media: 16787 (4%)     massimo: 18140 Points
3DMark - 3DMark Fire Strike Standard Score
min: 1878     media: 2000     media: 2025 (4%)     massimo: 2096 Points
3DMark - 3DMark Fire Strike Standard Graphics
min: 2064     media: 2207     media: 2245 (3%)     massimo: 2312 Points
3DMark - 3DMark Ice Storm Graphics
min: 87019     media: 87377     media: 87377 (10%)     massimo: 87735 Points
3DMark - 3DMark Night Raid
6191 Points (6%)
3DMark - 3DMark Night Raid Graphics Score
7661 Points (3%)
3DMark 11 - 3DM11 Performance Score
min: 3049     media: 3195     media: 3111 (4%)     massimo: 3425 Points
3DMark 11 - 3DM11 Performance GPU
min: 2986     media: 3101     media: 2991 (3%)     massimo: 3325 Points
171.8 -94%
...
2872 -7%
NVIDIA Quadro M600M
2911 -6%
Qualcomm Adreno 690
2930 -6%
2941 -5%
Intel Iris Plus Graphics G4 (Ice Lake 48 EU)
2965 -4%
2967 -4%
2973 -4%
2985 -4%
NVIDIA Quadro P500
3022 -3%
AMD Radeon RX Vega 6 (Ryzen 2000/3000)
3101
AMD FirePro W5130M
3106 0%
3131 1%
Intel UHD Graphics Xe 32EUs (Tiger Lake-H)
3180 3%
Intel Iris Pro Graphics 580
3220 4%
3238 4%
3249 5%
3261 5%
Intel UHD Graphics Xe G4 48EUs
3288 6%
3310 7%
...
59943 1833%
max:
105674 3308%
0%
100%
3DMark Vantage
3DM Vant. Perf. total +
3DMark Vantage - 3DM Vant. Perf. total
8189 Points (2%)
3DM Vant. Perf. GPU no PhysX +
3DMark Vantage - 3DM Vant. Perf. GPU no PhysX
7387 Points (4%)
62 -99%
...
6943 -6%
7015 -5%
7078 -4%
7119 -4%
7155 -3%
7181 -3%
7243 -2%
7268 -2%
7362 0%
AMD Radeon RX Vega 6 (Ryzen 2000/3000)
7387
Intel UHD Graphics G1 (Ice Lake 32 EU)
7444 1%
7535 2%
7591 3%
Intel Iris Plus Graphics G4 (Ice Lake 48 EU)
7610 3%
7614 3%
7631 3%
7645 3%
7691 4%
7782 5%
...
132443 1693%
max:
170928 2214%
0%
100%
3DMark 06 3DMark 06 - Standard 1366x768 +
3DMark 06
11313 Points (15%)
3DMark 06 - Standard 1280x1024 +
3DMark 06
12132 Points (16%)
3DMark 06 - Standard 1280x720 +
3DMark 06
11264 Points (15%)
3DMark 06 - Standard 1024x768 +
3DMark 06
10132 Points (13%)
Cinebench R10 Cinebench R10 Shading (32bit) +
Cinebench R10 - Cinebench R10 Shading (32bit)
7146 punti (5%)
Cinebench R11.5 Cinebench R11.5 OpenGL 64 Bit +
Cinebench R11.5 - Cinebench R11.5 OpenGL 64 Bit
min: 39.43     media: 41.2     media: 41.1 (14%)     massimo: 42.86 fps
Cinebench R15
Cinebench R15 OpenGL 64 Bit +
Cinebench R15 - Cinebench R15 OpenGL 64 Bit
min: 36.26     media: 44.5     media: 46.4 (3%)     massimo: 50.7 fps
Cinebench R15 OpenGL Ref. Match 64 Bit +
Cinebench R15 - Cinebench R15 OpenGL Ref. Match 64 Bit
98 % (98%)
GFXBench (DX / GLBenchmark) 2.7
GFXBench T-Rex HD Offscreen C24Z16 +
GFXBench (DX / GLBenchmark) 2.7 - GFXBench T-Rex HD Offscreen C24Z16
164.6 fps (1%)
LuxMark v2.0 64Bit - LuxMark v2.0 Room GPU
241 Samples/s (1%)
LuxMark v2.0 64Bit - LuxMark v2.0 Sala GPU
558 Samples/s (1%)
ComputeMark v2.1 - ComputeMark v2.1 Result
1790 punti (2%)
- Valori di benchmark per questa scheda grafica
- Valori medi di benchmark per questa scheda grafica
* Numeri più piccoli rappresentano prestazioni supeiori

Benchmarks per i giochi

I seguenti benchmarks deirivano dai benchmarks dei portatili recensiti. Le prestazioni dipendono dalla scheda grafica utilizzata, dal clock rate, dal processore, dai settaggi di sistema, dai drivers, e dai sistemi operativi. Quindi i risultati non sono rappresentativi per i portatili con questa GPU. Per informazioni dettagliate sui risultati del benchmark, cliccate sul numero di fps.

basso 1920x1080
25.7  fps    + Confronta + 📈 Graph
medio 1920x1080
18.7  fps    + Confronta + 📈 Graph
alto 1920x1080
10.3  fps    + Confronta + 📈 Graph
» Il Benchmark indica che il gioco non è utilizzabile con i settaggi testati.
Additional Benchmarks
Low Preset 1280x720
34.8
basso 1920x1080
6.4  fps    + Confronta
» Il Benchmark indica che il gioco non è utilizzabile con i settaggi testati.
Additional Benchmarks
Low Preset (FSR off) 1280x720
10.5
Steam Deck 1280x720
15
basso 1920x1080
6  fps    + Confronta + 📈 Graph
» Il Benchmark indica che il gioco non è utilizzabile con i settaggi testati.
Additional Benchmarks
Low Preset 1280x720
9.7
basso 1920x1080
12.2  fps    + Confronta + 📈 Graph
» Il Benchmark indica che il gioco non è utilizzabile con i settaggi testati.
Additional Benchmarks
Low Preset Low TAA 1280x720
20.1
basso 1920x1080
10.3  fps    + Confronta
» Il Benchmark indica che il gioco non è utilizzabile con i settaggi testati.
Additional Benchmarks
Minimum Settings 1280x720
20.1
basso 1920x1080
8.4  fps    + Confronta + 📈 Graph
» Il Benchmark indica che il gioco non è utilizzabile con i settaggi testati.
Additional Benchmarks
Ultra Low Preset 1280x720
16.2
basso 1920x1080
9.6  fps    + Confronta + 📈 Graph
» Il Benchmark indica che il gioco non è utilizzabile con i settaggi testati.
Additional Benchmarks
Low Preset 1280x720
16.3
basso 1920x1080
11.1  fps    + Confronta + 📈 Graph
» Il Benchmark indica che il gioco non è utilizzabile con i settaggi testati.
Additional Benchmarks
Low Preset / Off 1280x720
17.4
basso 1920x1080
13.5  fps    + Confronta + 📈 Graph
» Il Benchmark indica che il gioco non è utilizzabile con i settaggi testati.
Additional Benchmarks
Low Preset 1280x720
20.7
basso 1920x1080
9.3  fps    + Confronta
» Il Benchmark indica che il gioco non è utilizzabile con i settaggi testati.
Additional Benchmarks
Low Preset (without FSR Upscaling) 1280x720
14.6
basso 1920x1080
6.8  fps    + Confronta + 📈 Graph
» Il Benchmark indica che il gioco non è utilizzabile con i settaggi testati.
F1 22

F1 22

2022
basso 1920x1080
15.8  fps    + Confronta
medio 1920x1080
15.4  fps    + Confronta
» Il Benchmark indica che il gioco non è utilizzabile con i settaggi testati.
Additional Benchmarks
Ultra Low Preset 16xAF TAA 1280x720
27.1
basso 1920x1080