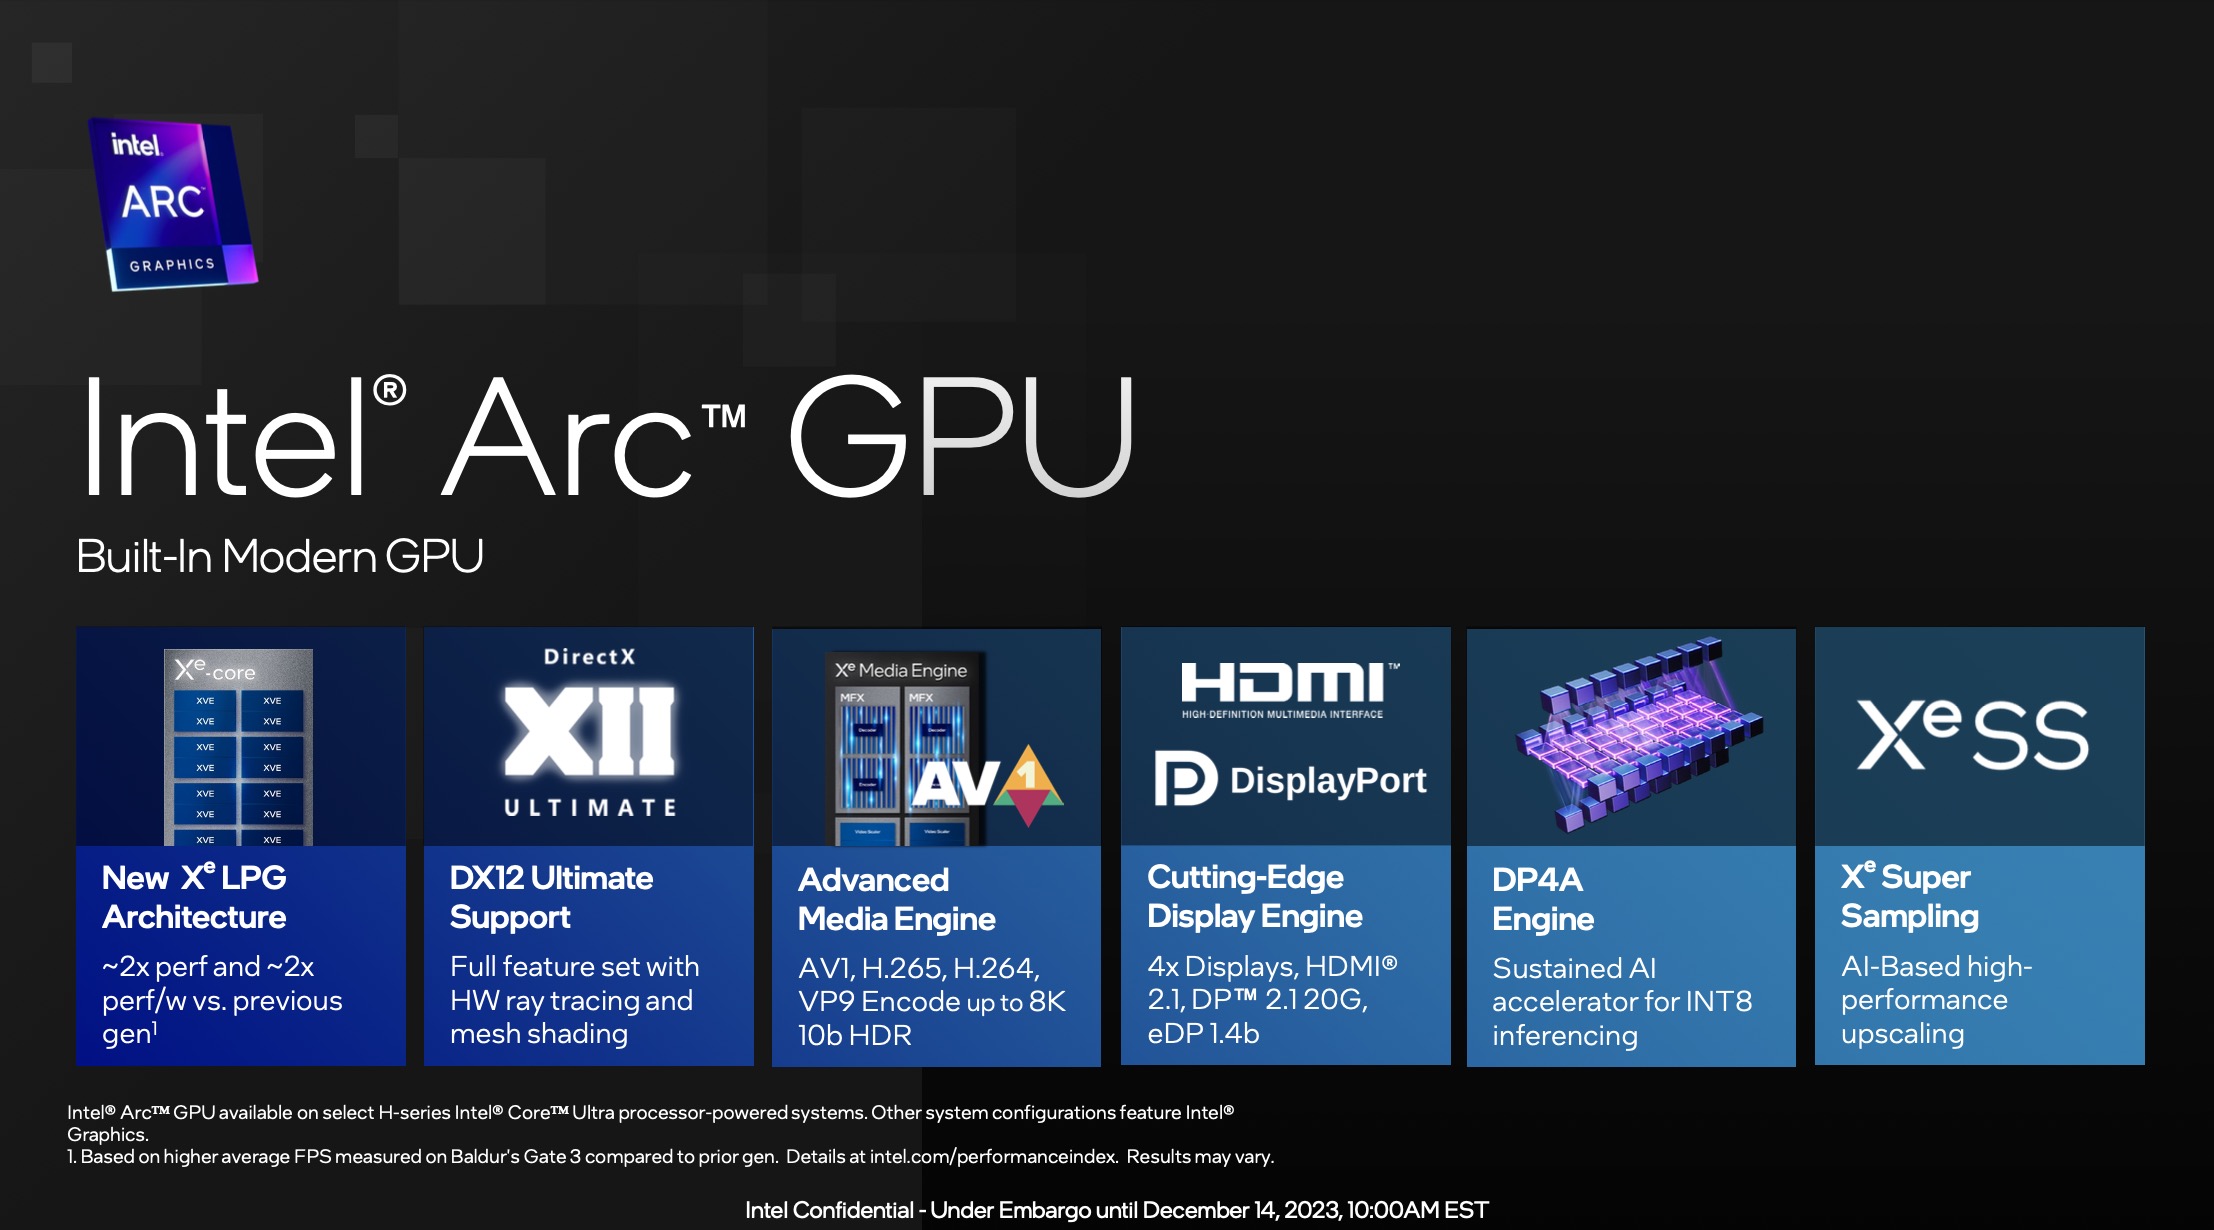
Recensioni Notebook con Intel Arc 7-Core iGPU la scheda grafica
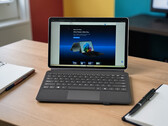
Recensione dell'Alldocube iWork GT Ultra convertibile: Alternativa ai tablet Android con prestazioni da vero PC
Con iWork GT Ultra, Alldocube offre un versatile convertibile Windows con Intel Core Ultra 5 125H. Lo stilo e la tastiera sono disponibili come pacchetto completo a circa 920 dollari. Ma come si comporta il dispositivo nell'uso quotidiano in termini di prestazioni, mobilità e durata della batteria? Il nostro test risponde alle domande più importanti.
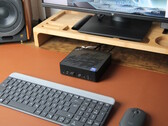
Intel Core Ultra 5 125H, Arc 7-Core, 13", 870 grRecensione del Minix Elite EU512-AI: Un Mini PC Core Ultra particolarmente efficiente dal punto di vista energetico
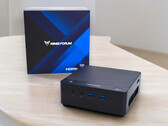
I mini PC provenienti dall'Estremo Oriente spesso pubblicizzano prezzi bassi, ma sono dotati di processori poco potenti come l'Intel N100. Non è questo il caso della serie Elite di Minix: questi modelli sono dotati di CPU Intel Core Ultra, ma i prezzi partono da soli 668 euro (780 dollari) o 829 euro (967 dollari). Sottoponiamo questo mini PC alimentato dall'AI alla prova per vedere cosa offre realmente.
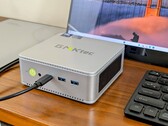
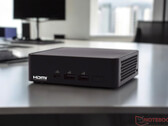
Intel Core Ultra 5 125H, Arc 7-Core, 772 grRecensione del mini PC GMK NucBox K9: Core Ultra 5 125H con grafica Arc 7
Il Core Ultra 5 125H può essere un PC più intelligente, ma non significa necessariamente più veloce. Le prestazioni grezze sono inferiori a quelle del Ryzen 7 7840HS, più vecchio e più economico, con un discreto margine.
Intel Core Ultra 5 125H, Arc 7-Core, 528 grRecensione dell'Asus NUC 14 Pro: Mini PC NUC con Intel Core Ultra 5 125H, iGPU Intel Arc veloce e 2x Thunderbolt 4
Asus ha rilevato la divisione NUC di Intel e ora offre i popolari mini PC con i processori Meteor Lake di Intel. Questo non solo offre ai piccoli computer desktop una maggiore potenza della CPU, ma può anche aumentare significativamente le prestazioni 3D grazie all'iGPU rivisitata. Abbiamo testato in dettaglio l'Asus NUC 14 Pro con Intel Core Ultra 5 125H e valutato le prestazioni sulla base di numerose misurazioni e benchmark.
Intel Core Ultra 5 125H, Arc 7-Core, 525 grRecensione del Minisforum UH125 Pro: mini-PC AI con Intel Core Ultra 5 125H, 32 GB di RAM DDR5 e SSD da 1 TB
Minisforum rinnova la sua gamma di modelli basati sui processori Intel Meteor Lake: L'UH125 Pro viene lanciato sulla base dell'Intel Core Ultra 5 125H. Può anche contare su una ricca connettività, che attualmente è tra le più moderne con USB4 e OCuLink. Abbiamo dato un'occhiata dettagliata al dispositivo e analizzato le sue prestazioni sulla base di numerose misurazioni e benchmark.
Intel Core Ultra 5 125H, Arc 7-Core, 797 grLenovo ThinkBook 13x G4 21KR0008GE: Intel Core Ultra 5 125H, 13.50", 1.2 kg
recensione » Recensione del portatile Lenovo ThinkBook 13x G4: Uno dei migliori subnotebook a parte la tastiera
Samsung Galaxy Book4 Pro 360: Intel Core Ultra 5 125H, 16.00", 1.7 kg
recensione » Samsung Galaxy Book4 Pro 360 - Un 2-in-1 estremamente sottile con Core Ultra 5 e AMOLED da 120 Hz
Lenovo IdeaPad Slim 5 14IMH9: Intel Core Ultra 5 125H, 14.00", 1.4 kg
recensione » Recensione del portatile Lenovo IdeaPad Slim 5 14: Un tuttofare di successo con un display OLED
Honor MagicBook X 16 (2026): Intel Core Ultra 5 125H, 16.00", 1.8 kg
Recensioni esterne » Honor MagicBook X 16 (2026)
Asus ExpertBook B3405: Intel Core Ultra 5 125H, 14.00", 1.4 kg
Recensioni esterne » Asus ExpertBook B3405
Acer Aspire Lite 16 AI AL16-71P: Intel Core Ultra 5 125H, 16.00", 1.6 kg
Recensioni esterne » Acer Aspire Lite 16 AI AL16-71P
Acer Aspire 16 A16-71M: Intel Core Ultra 5 125H, 16.00", 1.6 kg
Recensioni esterne » Acer Aspire 16 A16-71M
MSI Modern 15 H AI C1MG, Ultra 5 125H: Intel Core Ultra 5 125H, 15.60", 1.9 kg
Recensioni esterne » MSI Modern 15 H AI C1MG, Ultra 5 125H
Dynabook Portégé X30L-M: Intel Core Ultra 5 125H, 13.30", 0.9 kg
Recensioni esterne » Dynabook Portégé X30L-M
Asus Zenbook 14 OLED Q415MA: Intel Core Ultra 5 125H, 14.00", 1.3 kg
Recensioni esterne » Asus Zenbook 14 OLED Q415MA
Lenovo ThinkBook 13x G4 21KR0008GE: Intel Core Ultra 5 125H, 13.50", 1.2 kg
Recensioni esterne » Lenovo ThinkBook 13x G4 21KR0008GE
Lenovo ThinkBook 16 G7 IML, Ultra 5 125H: Intel Core Ultra 5 125H, 16.00", 1.7 kg
Recensioni esterne » Lenovo ThinkBook 16 G7 IML, Ultra 5 125H
HP Pavilion Plus 14-ew1000: Intel Core Ultra 5 125H, 14.00", 1.4 kg
Recensioni esterne » HP Pavilion Plus 14-ew1000
LG gram 14 2-in-1 14T90S: Intel Core Ultra 5 125H, 14.00", 1.3 kg
Recensioni esterne » LG gram 14 2-in-1 14T90S
Lenovo Yoga 7 14IML9, Ultra 5 125H: Intel Core Ultra 5 125H, 14.00", 1.5 kg
Recensioni esterne » Lenovo Yoga 7 14IML9, Ultra 5 125H
Acer Swift Go 14 SFG14-72, Ultra 5 125H: Intel Core Ultra 5 125H, 14.00", 1.3 kg
Recensioni esterne » Acer Swift Go 14 SFG14-72, Ultra 5 125H
MSI Prestige 14 AI Evo C1MG: Intel Core Ultra 5 125H, 14.00", 1.7 kg
Recensioni esterne » MSI Prestige 14 AI Evo C1MG
MSI Prestige 13 AI Evo, Ultra 5: Intel Core Ultra 5 125H, 13.30", 1 kg
Recensioni esterne » MSI Prestige 13 AI Evo, Ultra 5
Asus VivoBook S 14 OLED S5406MA: Intel Core Ultra 5 125H, 14.00", 1.3 kg
Recensioni esterne » Asus VivoBook S 14 OLED S5406MA
Lenovo IdeaPad Slim 5 14IMH9: Intel Core Ultra 5 125H, 14.00", 1.4 kg
Recensioni esterne » Lenovo IdeaPad Slim 5 14IMH9
Asus ZenBook 14 UX3405MA, Ultra 5: Intel Core Ultra 5 125H, 14.00", 1.3 kg
Recensioni esterne » Asus ZenBook 14 UX3405MA, Ultra 5
Lenovo ThinkBook 13x IMH G4: Intel Core Ultra 5 125H, 13.50", 1.2 kg
Recensioni esterne » Lenovo ThinkBook 13x IMH G4
Samsung Galaxy Book4 Pro 360: Intel Core Ultra 5 125H, 16.00", 1.7 kg
Recensioni esterne » Samsung Galaxy Book4 Pro 360
Alldocube iWork GT Ultra: Intel Core Ultra 5 125H, 13.00", 0.9 kg
» Convertibile/tablet Windows sotto gli 800 euro: iWork GT Ultra - un vantaggio in termini di prezzo e prestazioni o un dispositivo di compromesso?