Recensioni Notebook con NVIDIA GeForce GTX 1650 Ti Max-Q la scheda grafica
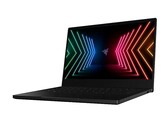
Recensione del Razer Blade Stealth 13 2021: dispositivo Mobile per il gaming con pannello OLED
Razer offre il suo compatto Blade Stealth 13 con uno schermo OLED in aggiunta al familiare display IPS. Questo offre vantaggi come i tempi di risposta estremamente veloci e un'immagine ottima, ma ci sono anche svantaggi come il PWM flickering così come la durata della batteria significativamente ridotta.
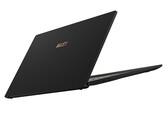
Intel Core i7-1165G7, NVIDIA GeForce GTX 1650 Ti Max-Q, 13.3", 1.5 kgRecensione del computer portatile MSI Summit E14: GeForce grafica GTX senza il peso della GeForce GTX
Il Summit E14 può sembrare un normale Ultrabook, ma riesce a ospitare una vera e propria GeForce GTX 1650 Ti Max-Q per offrire prestazioni grafiche significativamente più veloci del meglio che Intel Iris Xe e AMD Vega possono attualmente fare. Ci sono alcuni costi di cui essere consapevoli, tuttavia.
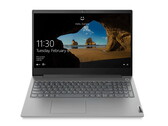
Intel Core i7-1185G7, NVIDIA GeForce GTX 1650 Ti Max-Q, 14", 1.3 kgRecensione del portatile Lenovo ThinkBook 15p 4K: Dispositivo multimediale tuttofare con un grande display 4K ma connessioni scarse
Lenovo ha equipaggiato la sua serie business entry-level di nuovo con un processore Comet Lake, combinando la CPU con una GTX 1650 Ti Max-Q, e trasformando così il dispositivo in un tuttofare multimediale. Con questo, ora offre le stesse specifiche del ThinkPad X1 Extreme Gen3, ma ad un prezzo inferiore. Il nostro test dettagliato rivela tutti i vantaggi che il ThinkPad potrebbe ancora avere o non avere, rispetto al ThinkBook.
Intel Core i7-10750H, NVIDIA GeForce GTX 1650 Ti Max-Q, 15.6", 2 kgRecensione del computer portatile Acer ConceptD 3 Ezel CC314: un potente convertibile rallentato dall'Intel Comet Lake
Acer distribuisce computer portatili per professionisti creativi e ingegneri con l'etichetta "ConceptD". Per raggiungere questo gruppo target, si sono specializzati in convertibili con componenti potenti - che è anche il caso dell'Acer ConceptD 3 Ezel CC314. Sfortunatamente, il nostro test ci ha lasciato un po' delusi a causa della CPU piuttosto inefficiente.
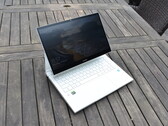
Intel Core i7-10750H, NVIDIA GeForce GTX 1650 Ti Max-Q, 14", 1.8 kgRecensione del Laptop HP Envy 14 2021: Tiger Lake, 16:10 e GeForce GTX 1650 Ti Max-Q All-In-One
Svelato al CES 2021, l'ultimo Envy 14 incorpora quasi tutto ciò che c'era di ottimo nell'Envy 15.6 pollici dell'anno scorso, ma in un formato più portatile da 14 pollici. È uno dei computer portatili più veloci di HP in questa dimensione dello schermo il che lo rende una solida opzione per coloro che vogliono massimizzare le prestazioni senza accontentarsi di alternative più grandi.
Intel Core i5-1135G7, NVIDIA GeForce GTX 1650 Ti Max-Q, 14", 1.6 kgMSI Summit E15 A11SCST: Intel Core i7-1185G7, 15.60", 1.8 kg
recensione » Recensione del laptop MSI Summit E15: Avanza nel segmento business premium
Lenovo ThinkPad X1 Extreme Gen3-20TLS0UV00: Intel Core i7-10750H, 15.60", 1.7 kg
recensione » Recensione del laptop ThinkPad X1 Extreme Gen3 2020: un Laptop Lenovo Multimedia Premium con GTX 1650 Ti Max-Q
Asus ZenBook UX535-M01440: Intel Core i7-10750H, 15.60", 2 kg
recensione » Recensione del portatile Asus ZenBook Pro 15 UX535: Potrebbe essere ancora un po' più Zen
Razer Blade Stealth i7-1165G7 GTX 1650 Ti Max-Q: Intel Core i7-1165G7, 13.30", 1.4 kg
recensione » Recensione del Laptop Razer Blade Stealth Tiger Lake GTX 1650 Ti Max-Q: in piccolo passo in avanti
Razer Blade Stealth Core i7 GTX 1650 Ti Max-Q 4K: Intel Core i7-1065G7, 13.30", 1.5 kg
recensione » Recensione del Laptop Razer Blade Stealth GTX 1650 Ti Max-Q 2020: Simile alla versione 2019, ma ben fatto
HP Envy 14-eb0021tx: Intel Core i7-1165G7, 14.00", 1.5 kg
Recensioni esterne » HP Envy 14-eb0021tx
Razer Blade Stealth 13 2021 OLED: Intel Core i7-1165G7, 13.30", 1.5 kg
Recensioni esterne » Razer Blade Stealth 13 2021 OLED
MSI Summit E14 A11SCS: Intel Core i7-1185G7, 14.00", 1.3 kg
Recensioni esterne » MSI Summit E14 A11SCS
MSI Prestige 14 A11SCS-036DC: Intel Core i7-1185G7, 14.00", 1.3 kg
Recensioni esterne » MSI Prestige 14 A11SCS-036DC
MSI GF63 Thin 10SCSR-1051XES: Intel Core i7-10750H, 15.60", 1.9 kg
Recensioni esterne » MSI GF63 Thin 10SCSR-1051XES
Asus ROG Flow X13 GV301QH-K6200T: AMD Ryzen 9 5900HS, 13.40", 1.3 kg
Recensioni esterne » Asus ROG Flow X13 GV301QH-K6200T
HP Envy 14-eb0003ns: Intel Core i7-1165G7, 14.00", 1.5 kg
Recensioni esterne » HP Envy 14-eb0003ns
MSI Summit E15 A11SCS-091AU: Intel Core i7-1185G7, 15.60", 1.7 kg
Recensioni esterne » MSI Summit E15 A11SCS-091AU
MSI GF63 Thin 10SCSR-876XES: Intel Core i7-10750H, 15.60", 1.9 kg
Recensioni esterne » MSI GF63 Thin 10SCSR-876XES
MSI Prestige 15 A11SCS-033XES: Intel Core i7-1185G7, 15.60", 1.7 kg
Recensioni esterne » MSI Prestige 15 A11SCS-033XES
HP Envy 14-eb0775ng: Intel Core i7-1165G7, 14.00", 1.5 kg
Recensioni esterne » HP Envy 14-eb0775ng
Razer Blade Stealth i7-1165G7 GTX 1650 Ti Max-Q: Intel Core i7-1165G7, 13.30", 1.4 kg
Recensioni esterne » Razer Blade Stealth i7-1165G7 GTX 1650 Ti Max-Q
MSI Summit E15 A11SCST-067RU: Intel Core i7-1185G7, 15.60", 1.8 kg
Recensioni esterne » MSI Summit E15 A11SCST-067RU
Acer ConceptD 3 Ezel CC314-72G-7513: Intel Core i7-10750H, 14.00", 1.8 kg
Recensioni esterne » Acer ConceptD 3 Ezel CC314-72G-7513
MSI Summit E15 A11SCST-227ID: Intel Core i7-1185G7, 15.60"
Recensioni esterne » MSI Summit E15 A11SCST-227ID
Lenovo ThinkBook 15p IMH-20V30009GE: Intel Core i7-10750H, 15.60", 1.9 kg
Recensioni esterne » Lenovo ThinkBook 15p IMH-20V30009GE
MSI Summit E15 A11SCST: Intel Core i7-1185G7, 15.60", 1.8 kg
Recensioni esterne » MSI Summit E15 A11SCST
HP Envy 14-eb0010nr: Intel Core i5-1135G7, 14.00", 1.6 kg
Recensioni esterne » HP Envy 14-eb0010nr
Lenovo ThinkPad X1 Extreme G3, i7-10850H, 1650 Ti Max-Q: Intel Core i7-10850H, 15.60", 1.7 kg
Recensioni esterne » Lenovo ThinkPad X1 Extreme G3, i7-1850H, 1650 Ti Max-Q
Lenovo ThinkPad X1 Extreme G3-20TK000NGE: Intel Core i9-10885H, 15.60", 1.7 kg
Recensioni esterne » Lenovo ThinkPad X1 Extreme G3-20TK000NGE
Asus ZenBook Pro 15 UX535LI-E3089T: Intel Core i7-10750H, 15.60", 1.8 kg
Recensioni esterne » Asus ZenBook Pro 15 UX535LI-E3089T
HP Spectre x360 15-eb0036ng: Intel Core i7-10750H, 15.60", 1.9 kg
Recensioni esterne » HP Spectre x360 15-eb0036ng
Acer ConceptD 3 Ezel: Intel Core i7-10750H, 15.60", 2 kg
Recensioni esterne » Acer ConceptD 3 Ezel
MSI GF63 10SCSR-243: Intel Core i7-10750H, 15.60", 1.9 kg
Recensioni esterne » MSI GF63 10SCSR-243
Dell XPS 15 9500 i7-10750H, 1650 Ti Max-Q: Intel Core i7-10750H, 15.60", 2.1 kg
Recensioni esterne » Dell XPS 15 9500 i7-10750H, 1650 Ti Max-Q
Razer Blade Stealth 2020, i7-1065G7, GTX 1650 Ti Max-Q: Intel Core i7-1065G7, 13.30", 1.4 kg
Recensioni esterne » Razer Blade Stealth 2020, i7-1065G7, GTX 1650 Ti Max-Q
Lenovo ThinkBook 15p Gen1 4K: Intel Core i7-10750H, 15.60", 2 kg
» Il Lenovo ThinkBook 15p ha un grande display ma pessime connessioni per un tuttofare aziendale
Acer ConceptD 3 Ezel CC314-72G-7513: Intel Core i7-10750H, 14.00", 1.8 kg
» L'Acer ConceptD 3 Ezel ha mostrato una perdita di potenziale nel nostro test
HP Envy 14-eb0010nr: Intel Core i5-1135G7, 14.00", 1.6 kg
» Il Core i5-1135G7 dell'HP Envy 14 funziona a frequenze di clock superiori rispetto alla maggior parte dei portatili Core i7-1165G7
MSI Summit E15 A11SCST: Intel Core i7-1185G7, 15.60", 1.8 kg
» MSI Summit E15 - Uno sfidante per il Dell XPS 15 e il Lenovo ThinkPad X1 Extreme
Lenovo ThinkPad X1 Extreme Gen3-20TLS0UV00: Intel Core i7-10750H, 15.60", 1.7 kg
» Lenovo migliora le prestazioni del ThinkPad X1 Extreme Gen3, ma vorremmo vedere un aggiornamento più corposo con AMD Ryzen
Asus ZenBook UX535-M01440: Intel Core i7-10750H, 15.60", 2 kg
» Asus ZenBook Pro 15 UX535: più Zen la prossima volta