Notebookcheck Logo

AMD Radeon RX 640

AMD Radeon RX 640

La AMD Radeon RX 640 è una scheda grafica mobile di fascia media per computer portatili basata sull'architettura Polaris. È dotata di 640 shader (10 CU) o 512 shader (8 CU) con diverse velocità di clock. Rispetto alla più vecchia RX 550(X), la RX 640 sembra offrire solo la metà della larghezza di banda di memoria (64 bit di bus di memoria invece di 128 bit).

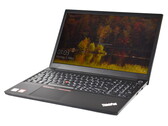
Le prestazioni dovrebbero essere leggermente inferiori rispetto al vecchio RX 550 e quindi una Nvidia GeForce MX150. Solo giochi poco impegnativi sono quindi giocabili con la GPU. Nei nostri benchmark del Thinkpad E15 la RX640 è leggermente più lenta di una GeForce MX330 media (+4%) / MX250 / MX150. Pertanto, le prestazioni potrebbero non essere sufficienti per giochi molto impegnativi. Ad esempio, Ghost Recon Breakpoint ha raggiunto in media solo 26 fps nelle impostazioni più basse.

Radeon 600 Serie

Radeon RX 640 640 @ 1.22 - 1.22 GHz64 Bit @ 6000 MHz
Radeon 630 512 @ 1.22 GHz64 Bit @ 6000 MHz
Radeon 625 384 @ 1.02 GHz64 Bit @ 2250 MHz
Radeon 620 384 @ 1.02 GHz64 Bit @ 2250 MHz
Radeon 610 320 @ 1.03 GHz64 Bit @ 2250 MHz
Nome in codicePolaris 12
ArchitetturaPolaris
Pipelines640 - unified
Velocità del core1218 - 1218 (Boost) MHz
Velocità della memoria6000 MHz
Larghezza del bus di memoria64 Bit
Tipo di memoriaGDDR5
Max. quantità di memoria4 GB
Memoria condivisano
APIDirectX 12, OpenGL Vulkan
Consumo di corrente50 Watt
tecnologia14 nm
CaratteristicheDisplayPort 1.3 HBR / 1.4 HDR Ready, HDMI 2.0, AMD FreeSync
Dimensione del portatilegrande
Data dell'annuncio12.08.2019
Link alla pagina del produttorewww.amd.com

Benchmark

Performance Rating - 3DMark 11 + Fire Strike + Time Spy
1.6 pt (5%)
AMD Radeon HD 8180
0.06605 -96%
...
NVIDIA Quadro P520
1.466 -8%
AMD Radeon RX Vega 7
1.525 -4%
1.525 -4%
1.551 -3%
1.57 -2%
1.589 0%
1.592 0%
1.593 0%
1.593 0%
AMD Radeon RX 640
1.594
1.66 4%
1.665 4%
1.667 5%
1.679 5%
AMD Radeon RX 550X (Laptop)
1.68 5%
1.687 6%
1.713 7%
1.714 8%
1.748 10%
...
21.1 1224%
max:
33.3 1989%
0%
100%
3DMark - 3DMark Time Spy Score
min: 1100     media: 1117     media: 1116.5 (3%)     massimo: 1133 Points
3DMark - 3DMark Time Spy Graphics
min: 990     media: 1008     media: 1007.5 (3%)     massimo: 1025 Points
113 -89%
...
862 -14%
AMD Radeon RX Vega 9
872 -13%
936 -7%
AMD Radeon Pro 450
952 -6%
956 -5%
971 -4%
AMD Radeon RX Vega 7
991 -2%
995 -1%
NVIDIA Quadro P520
999 -1%
AMD Radeon RX 640
1008
1012 0%
AMD Radeon RX 550X (Laptop)
1050 4%
1064 6%
1070 6%
AMD Radeon Pro 555
1078 7%
AMD Radeon Pro 455
1118 11%
1136 13%
1148 14%
1161 15%
...
19434 1828%
max:
36350 3506%
0%
100%
3DMark - 3DMark Cloud Gate Score
min: 12166     media: 12880     media: 12879.5 (14%)     massimo: 13593 Points
3DMark - 3DMark Cloud Gate Graphics
min: 19479     media: 19946     media: 19945.5 (5%)     massimo: 20412 Points
3DMark - 3DMark Fire Strike Standard Score
min: 3049     media: 3119     media: 3119 (6%)     massimo: 3189 Points
3DMark - 3DMark Fire Strike Standard Graphics
min: 3279     media: 3499     media: 3498.5 (4%)     massimo: 3718 Points
3DMark - 3DMark Ice Storm Graphics
68364 Points (8%)
3DMark 11 - 3DM11 Performance Score
min: 5243     media: 5411     media: 5411 (7%)     massimo: 5579 Points
3DMark 11 - 3DM11 Performance GPU
min: 4998     media: 5235     media: 5235 (4%)     massimo: 5472 Points
171.8 -97%
...
4894 -7%
4913 -6%
4957 -5%
4974 -5%
AMD Radeon RX Vega 7
5054 -3%
5134 -2%
5161 -1%
AMD Radeon Pro 555
5185 -1%
5213 0%
AMD Radeon RX 640
5235
5277 1%
AMD Radeon Pro 560
5305 1%
5310 1%
5334 2%
AMD Radeon RX 550X (Laptop)
5345 2%
AMD Radeon Pro 455
5388 3%
5445 4%
5515 5%
5542 6%
...
59943 1045%
max:
105645 1918%
0%
100%
3DMark Vantage
3DM Vant. Perf. total +
3DMark Vantage - 3DM Vant. Perf. total
14141 Points (4%)
3DMark 06 3DMark 06 - Standard 1280x1024 +
3DMark 06
20261 Points (28%)
Cinebench R10 Cinebench R10 Shading (32bit) +
Cinebench R10 - Cinebench R10 Shading (32bit)
369 punti (0%)
Cinebench R11.5 Cinebench R11.5 OpenGL 64 Bit +
Cinebench R15
Cinebench R15 OpenGL 64 Bit +
Cinebench R15 - Cinebench R15 OpenGL 64 Bit
min: 82.9     media: 84.2     media: 84.2 (5%)     massimo: 85.4 fps
Cinebench R15 OpenGL Ref. Match 64 Bit +
Cinebench R15 - Cinebench R15 OpenGL Ref. Match 64 Bit
98 % (98%)
GFXBench - GFXBench Car Chase Offscreen
62.2 fps (7%)
GFXBench 3.1 - GFXBench Manhattan ES 3.1 Offscreen
73.5 fps (2%)
GFXBench 3.0 - GFXBench 3.0 Manhattan Offscreen
80.2 fps (5%)
GFXBench (DX / GLBenchmark) 2.7
GFXBench T-Rex HD Offscreen C24Z16 +
GFXBench (DX / GLBenchmark) 2.7 - GFXBench T-Rex HD Offscreen C24Z16
258.1 fps (2%)
LuxMark v2.0 64Bit - LuxMark v2.0 Room GPU
464 Samples/s (2%)
LuxMark v2.0 64Bit - LuxMark v2.0 Sala GPU
719 Samples/s (1%)
ComputeMark v2.1 - ComputeMark v2.1 Result
2934 punti (3%)
Power Consumption - Witcher 3 Power Consumption *
54 Watt (12%)
Emissions Witcher 3 Fan Noise +
Emissions - Witcher 3 Fan Noise
35.5 dB(A) (57%)
- Valori di benchmark per questa scheda grafica
- Valori medi di benchmark per questa scheda grafica
* Numeri più piccoli rappresentano prestazioni supeiori

Benchmarks per i giochi

I seguenti benchmarks deirivano dai benchmarks dei portatili recensiti. Le prestazioni dipendono dalla scheda grafica utilizzata, dal clock rate, dal processore, dai settaggi di sistema, dai drivers, e dai sistemi operativi. Quindi i risultati non sono rappresentativi per i portatili con questa GPU. Per informazioni dettagliate sui risultati del benchmark, cliccate sul numero di fps.

medio 1920x1080
25.9  fps    + Confronta
» Il Benchmark indica che il gioco non è utilizzabile con i settaggi testati.
basso 1280x720
31.7  fps    + Confronta
medio 1920x1080
14.3  fps    + Confronta
» Il Benchmark indica che il gioco non è utilizzabile con i settaggi testati.
GRID 2019

GRID 2019

2019
basso 1280x720
60.6  fps    + Confronta
medio 1920x1080
20.4  fps    + Confronta
» Giocabile con tutti i portatili testati con dettagli basso.
basso 1280x720
29  fps    + Confronta
» Il Benchmark indica che il gioco non è utilizzabile con i settaggi testati.
FIFA 20

FIFA 20

2019
basso 1280x720
112.6  fps    + Confronta
» Giocabile con tutti i portatili testati con dettagli basso.
F1 2019

F1 2019

2019
basso 1280x720
55  fps    + Confronta
medio 1920x1080
23  fps    + Confronta
» Giocabile con tutti i portatili testati con dettagli basso.
basso 1280x720
51.4  fps    + Confronta
medio 1920x1080
16.9  fps    + Confronta
» Giocabile con tutti i portatili testati con dettagli basso.
Anno 1800

Anno 1800

2019
basso 1280x720
61.8  fps    + Confronta
medio 1920x1080
20.5  fps    + Confronta
» Giocabile con tutti i portatili testati con dettagli basso.
basso 1280x720
52  fps    + Confronta
medio 1920x1080
18  fps    + Confronta
» Giocabile con tutti i portatili testati con dettagli basso.
basso 1280x720
37  fps    + Confronta
medio 1920x1080
17  fps    + Confronta
» Giocabile con tutti i portatili testati con dettagli basso.
basso 1280x720
72  fps    + Confronta
medio 1920x1080
27  fps    + Confronta
alto 1920x1080
20  fps    + Confronta
» Giocabile con tutti i portatili testati con dettagli basso.
basso 1280x720
61.8  fps    + Confronta
medio 1920x1080
29.8  fps    + Confronta
alto 1920x1080
23.2  fps    + Confronta
» Giocabile con tutti i portatili testati con dettagli basso.
basso 1280x720
39  fps    + Confronta
medio 1920x1080
20  fps    + Confronta
» Giocabile con tutti i portatili testati con dettagli basso.
basso 1280x720
42 56 ~ 49 fps    + Confronta
medio 1920x1080
22  fps    + Confronta
» Giocabile con tutti i portatili testati con dettagli basso.
Additional Benchmarks
Lowest Preset 1920x1080
33
Far Cry 5

Far Cry 5

2018
basso 1280x720
48  fps    + Confronta
medio 1920x1080
21  fps    + Confronta
» Giocabile con tutti i portatili testati con dettagli basso.
basso 1280x720
45.5  fps    + Confronta
medio 1920x1080
32.8  fps    + Confronta
alto 1920x1080
30.1  fps    + Confronta
» Giocabile con tutti i portatili testati con dettagli basso.
basso 1024x768
61.6 64.7 ~ 63 fps    + Confronta
medio 1366x768
28.6 42.7 ~ 36 fps    + Confronta
alto 1920x1080
19.8 21.1 ~ 20 fps    + Confronta
» Giocabile con la maggior parte dei portatili testati con dettagli medio.
basso 1280x720
110 113 ~ 112 fps    + Confronta
medio 1366x768
93 95.5 ~ 94 fps    + Confronta
alto 1920x1080
51.7 53.4 ~ 53 fps    + Confronta
ultra 1920x1080
48.2 50.3 ~ 49 fps    + Confronta
» Giocabile con tutti i portatili testati con dettagli ultra.
basso 1024x768
63.2 65.5 ~ 64 fps    + Confronta
medio 1366x768
38.4 39.4 ~ 39 fps    + Confronta
alto 1920x1080
19.7 19.9 ~ 20 fps    + Confronta
ultra 1920x1080
» Giocabile con tutti i portatili testati con dettagli medio.
basso 1280x720
150.5  fps    + Confronta