AMD Radeon RX Vega 8 (Ryzen 4000/5000)
L'AMD Radeon RX Vega 8 è una GPU integrata per notebook. Viene utilizzata per le APU Ryzen 7 della generazione Renoir (Ryzen 4000 Mobile), annunciate all'inizio del 2020. La GPU è basata sull'architettura Vega (GCN di quinta generazione) e ha 8 CU (= 512 dei 704 shaders) con clock fino a 1,750 MHz (Ryzen 7 4800U). Le prestazioni dipendono dalla configurazione del TDP (12-25 W al lancio), dai clock, dal raffreddamento e dalla configurazione della memoria). La GPU dovrebbe beneficiare di una veloce RAM dual-channel DDR4-3200 (contrariamente alla DDR4-2133 single-channel ancora utilizzata). Rispetto all'analoga Radeon RX Vega 8 della generazione Raven Ridge (Ryzen 2000 Mobile), questa GPU ha un clock significativamente più alto (1.750 contro 1.100 MHz Boost, +59%).
L'architettura Vega offre alcuni miglioramenti rispetto alla generazione Polaris e ora supporta DirectX 12 Feature Level 12_1. Ulteriori informazioni sono disponibili nel nostro articolo dedicato all'architettura Raven Ridge.
Le prestazioni sono chiaramente superiori rispetto alla vecchia RX Vega 8 grazie alla maggiore velocità di clock e alla memoria principale più veloce (se utilizzata). E' comunque posizionata nella fascia entry level (rispetto alle schede grafiche dedicate) ed è adatta solo per giochi poco impegnativi.
Grazie al moderno processo a 7nm e alle intelligenti funzioni di risparmio energetico, il consumo energetico è relativamente basso (secondo AMD), quindi la scheda grafica può essere utilizzata anche per notebook sottili e leggeri.
RX Vega 4000/5000 Serie
| |||||||||||||
| Nome in codice | Vega | ||||||||||||
| Architettura | Vega | ||||||||||||
| iGPU | Integrated Graphics | ||||||||||||
| Pipelines | 512 - unified | ||||||||||||
| Velocità del core | 2100 (Boost) MHz | ||||||||||||
| Memoria condivisa | no | ||||||||||||
| API | DirectX 12_1 | ||||||||||||
| Consumo di corrente | 15 Watt | ||||||||||||
| tecnologia | 7 nm | ||||||||||||
| Caratteristiche | Tiled Rasterization, Shared Memory (up to Dual-Channel DDR4-2400) | ||||||||||||
| Data dell'annuncio | 07.01.2020 | ||||||||||||
| ||||||||||||||||||||||||
Benchmark
3DM Vant. Perf. total +
specvp12 sw-03 +
Cinebench R15 OpenGL 64 Bit +
* Numeri più piccoli rappresentano prestazioni supeiori
Benchmarks per i giochi
I seguenti benchmarks deirivano dai benchmarks dei portatili recensiti. Le prestazioni dipendono dalla scheda grafica utilizzata, dal clock rate, dal processore, dai settaggi di sistema, dai drivers, e dai sistemi operativi. Quindi i risultati non sono rappresentativi per i portatili con questa GPU. Per informazioni dettagliate sui risultati del benchmark, cliccate sul numero di fps.

F1 24
2024
EA Sports WRC
2023
Lords of the Fallen
2023
Total War Pharaoh
2023
EA Sports FC 24
2023
Counter-Strike 2
2023
Cyberpunk 2077
2023
Baldur's Gate 3
2023
Lies of P
2023
The Crew Motorfest
2023
Starfield
2023
Armored Core 6
2023
Immortals of Aveum
2023
Atlas Fallen
2023
F1 23
2023
Diablo 4
2023
Dead Island 2
2023
The Last of Us
2023
Company of Heroes 3
2023
Sons of the Forest
2023
Atomic Heart
2023
Returnal
2023
Hogwarts Legacy
2023
Dead Space Remake
2023
The Witcher 3 v4
2023
High On Life
2023
The Quarry
2022
F1 22
2022
Vampire Bloodhunt
2022
Ghostwire Tokyo
2022
Cyberpunk 2077 1.6
2022
Elex 2
2022
GRID Legends
2022
Elden Ring
2022
Dying Light 2
2022
God of War
2022
Halo Infinite
2021
Farming Simulator 22
2021
Battlefield 2042
2021
Forza Horizon 5
2021
Riders Republic
2021
Back 4 Blood
2021
Far Cry 6
2021
Alan Wake Remastered
2021
FIFA 22
2021
New World
2021
Deathloop
2021
F1 2021
2021
Days Gone
2021
Outriders
2021
Hitman 3
2021
Cyberpunk 2077 1.0
2020
Yakuza Like a Dragon
2020
Dirt 5
2020
Watch Dogs Legion
2020
FIFA 21
2020
Star Wars Squadrons
2020
Serious Sam 4
2020
Crysis Remastered
2020
Horizon Zero Dawn
2020
Death Stranding
2020
F1 2020
2020
Gears Tactics
2020
Doom Eternal
2020
Hunt Showdown
2020
Borderlands 3
2019
Control
2019
F1 2019
2019
Anno 1800
2019
The Division 2
2019
Far Cry New Dawn
2019
Metro Exodus
2019
Apex Legends
2019
Battlefield V
2018
F1 2018
2018
Monster Hunter World
2018
Far Cry 5
2018
X-Plane 11.11
2018
Fortnite
2018
Rocket League
2017
Overwatch
2016
Metal Gear Solid V
2015
Dota 2 Reborn
2015
The Witcher 3
2015
GTA V
2015
BioShock Infinite
2013
Counter-Strike: GO
2012Per conoscere altri giochi che potrebbero essere utilizzabili e per una lista completa di tutti i giochi e delle schede grafiche visitate la nostra Gaming List
Recensioni Notebook con AMD Radeon RX Vega 8 (Ryzen 4000/5000) la scheda grafica

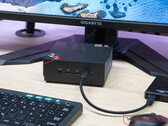
Recensione del NiPoGi AM06 Pro con AMD Ryzen 7: Un mini PC economico per la scuola, l'università e l'ufficio
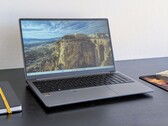
Recensione del Thinkeagle VigoBook G7: Non male per soli 500 dollari
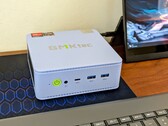
Recensione del mini PC GMK NucBox M5: AMD Zen 2 è un po' troppo lungo
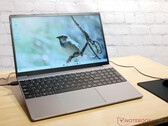
Recensione del portatile Ninkear A15 Plus: Sorprendentemente buono ed economico
Lenovo ThinkPad L15 Gen 4 21H70021GE: AMD Ryzen 7 PRO 7730U, 15.60", 1.9 kg
recensione » Recensione del Lenovo ThinkPad L15 Gen 4: Un portatile Ryzen silenzioso e a basso consumo di batteria
Geekom A5: AMD Ryzen 7 5800H, 0.6 kg
recensione » Recensione del Geekom A5: Un mini PC rosa, alternativa al NUC con APU AMD Ryzen 7 e 32 GB di RAM
HP Envy x360 15-fh0077ng: AMD Ryzen 7 7730U, 15.60", 1.8 kg
recensione » Recensione del convertibile HP Envy x360 15 Ryzen 7 7730U: Il primo portatile IMAX Enhanced
Lenovo ThinkPad E16 G1-21JUS08X00: AMD Ryzen 7 7730U, 16.00", 1.8 kg
recensione » Recensione del Lenovo ThinkPad E16 G1 AMD - Grande portatile da ufficio con potenza AMD e display WQHD
Lenovo ThinkPad E14 G5-21JSS05C00: AMD Ryzen 7 7730U, 14.00", 1.4 kg
recensione » Recensione del Lenovo ThinkPad E14 G5 AMD: Un portatile da ufficio economico con un display migliore
Geekom AS 5: AMD Ryzen 9 5900HX, 0.7 kg
recensione » Recensione del Geekom AS 5: Un compagno perfetto per i progetti più impegnativi e include un AMD Ryzen 9 5900HX e una AMD Radeon Vega 8
Asus ZenBook 14 UM3402Y: AMD Ryzen 7 7730U, 14.00", 1.4 kg
recensione » Recensione del portatile Asus Zenbook 14 UM3402Y: Nuovo nome Ryzen 7 7730U, vecchie prestazioni Zen 3
Lenovo ThinkPad E14 G4 21EB0041GE: AMD Ryzen 7 5825U, 14.00", 1.6 kg
recensione » Recensione del portatile Lenovo ThinkPad E14 G4 AMD: Conveniente e senza grossi punti deboli
HP EliteBook 645 G9, Ryzen 7 5825U: AMD Ryzen 7 5825U, 14.00", 1.4 kg
recensione » Recensione del portatile HP EliteBook 645 G9: Un portatile da ufficio compatto e robusto con potenziale (inutilizzato)
Lenovo IdeaPad Flex 5 16ABR G8: AMD Ryzen 7 7730U, 16.00", 2 kg
recensione » Recensione del Lenovo IdeaPad Flex 5 16 - Un conveniente 2-in-1 da 16 pollici con Ryzen 7000
Lenovo Yoga 6 13 83B2001SGE: AMD Ryzen 7 7730U, 13.30", 1.4 kg
recensione » Recensione del Lenovo Yoga 6 Gen8: Convertibile con nuovo Ryzen 7-7730U e rivestimento in tessuto
LG UltraPC 14 14U70Q-G.AA79G: AMD Ryzen 7 5825U, 14.00", 1.3 kg
recensione » Recensione dell'LG Ultra PC 14: La resistenza incontra le prestazioni
HP Envy x360 15-ey0023dx: AMD Ryzen 7 5825U, 15.60", 1.9 kg
recensione » Recensione del convertibile HP Envy x360 15 2022: Debutto dell'AMD Ryzen 7 5825U
Asus ZenBook 14 UM425U: AMD Ryzen 7 5700U, 14.00", 1.2 kg
recensione » Recensione del portatile Asus ZenBook 14 UM425U: Un duello tra AMD e Intel
Dell Inspiron 15 5515-H8P8F: AMD Ryzen 7 5700U, 15.60", 1.6 kg
recensione » Recensione del portatile Dell Inspiron 15 5515: Un notebook da ufficio duraturo con un potenziale inespresso
Asus ZenBook 14X UM5401QA-KN162: AMD Ryzen 7 5800H, 14.00", 1.4 kg
recensione » Recensione dell'Asus ZenBook 14X OLED AMD: Tanti colori, tanta durata della batteria, prezzo basso
Prime Computer Primestation Pulsar: AMD Ryzen 7 PRO 5750G, 4.2 kg
recensione » Recensione del PC desktop Primestation Pulsar: AMD Ryzen Pro con raffreddamento passivo e produzione sostenibile
Minisforum EliteMini B550: AMD Ryzen 7 5700G, 1.1 kg
recensione » Recensione del Minisforum EliteMini B550: Mini PC compatto con scheda grafica esterna
Asus ZenBook Flip 14 UN5401QA-KN085W: AMD Ryzen 7 5800H, 14.00", 1.4 kg
recensione » Recensione dell'Asus Zenbook Flip 14 OLED: Una sensazione ottima grazie ad AMD e all'OLED
Asus VivoBook 15 OLED M513UA-L1282W: AMD Ryzen 7 5700U, 15.60", 1.8 kg
recensione » Recensione Asus VivoBook 15 OLED: un silenzioso notebook da ufficio con schermo robusto
Beelink SER4: AMD Ryzen 7 4800U, 0.5 kg
recensione » Recensione del mini PC Beelink SER4: AMD Zen 2 dà ancora del filo da torcere all'Intel NUC
Lenovo ThinkPad T14s G2 20XGS01100: AMD Ryzen 7 PRO 5850U, 14.00", 1.3 kg
recensione » Recensione del laptop Lenovo ThinkPad T14s G2 AMD: L'efficienza degli ultrabook incontra la potenza della workstation
Acer Aspire 5 A515-45-R4R1: AMD Ryzen 7 5700U, 15.60", 1.7 kg
recensione » Recensione dell'Acer Aspire 5 A515-45: Un portatile con potenza AMD Ryzen 7 ma...
Beelink GTR5: AMD Ryzen 9 5900HX, 0.7 kg
recensione » Recensione del mini PC Beelink GTR5 2022: Un NUC Intel con AMD Ryzen 9
Minisforum EliteMini HX90: AMD Ryzen 9 5900HX
recensione » Recensione del Minisforum EliteMini HX90: Mini-PC compatto con prestazioni elevate ed AMD Ryzen 9 5900HX
Morefine S500+: AMD Ryzen 9 5900HX, 0.7 kg
recensione » Recensione del Morefine S500+: AMD Ryzen 9 5900HX con 32 GB di RAM e un SSD da 1 TB in un Mini PC
AMD Ryzen 7 5700G: AMD Ryzen 7 5700G, 32.00"
recensione » Recensione dell'AMD Ryzen 7 5700G: APU desktop a 8 core basata su Zen3 con unità grafica Vega
Minisforum HM90: AMD Ryzen 9 4900H
recensione » Recensione del PC desktop Minisforum EliteMini HM90 con la veloce APU AMD Ryzen
Huawei MateBook 16 R7 5800H: AMD Ryzen 7 5800H, 16.00", 2 kg
recensione » Recensione Huawei MateBook 16 AMD - Il portatile multimediale impressiona con la sua CPU Ryzen 7
Lenovo Yoga 6 13ALC6: AMD Ryzen 7 5700U, 13.30", 1.3 kg
recensione » AMD Ryzen 7 5700U contro Ryzen 5 5500U: Recensione del convertibile Lenovo Yoga 6 13
Dell Inspiron 14 7400 7415 2-in-1: AMD Ryzen 7 5700U, 14.00", 1.5 kg
recensione » Recensione del Dell Inspiron 14 7400 7415 2-in-1: prestazioni elevate con un budget limitato
Lenovo ThinkPad P14s G2 AMD: AMD Ryzen 7 PRO 5850U, 14.00", 1.5 kg
recensione » Recensione del portatile AMD Lenovo ThinkPad P14s G2: Con un LCD 4K opaco e Ryzen 5000
GPD Win Max 2021: AMD Ryzen 7 4800U, 8.00", 0.9 kg
recensione » Recensione del computer portatile gaming GPD Win Max 2021: Ryzen 7 più lento del Core i7
Lenovo Yoga Slim 7 Pro 14ACH5: AMD Ryzen 9 5900HX, 14.00", 1.3 kg
recensione » Recensione del Lenovo Yoga Slim 7 Pro 14ACH5: una centrale elettrica da 14 pollici con buona durata della batteria
Lenovo ThinkPad E15 G3-20YG003UGE: AMD Ryzen 7 5700U, 15.60", 1.8 kg
recensione » Recensione del Lenovo ThinkPad E15 G3 AMD: Laptop economico con Ryzen 7
HP Pavilion Aero 13 be0097nr: AMD Ryzen 7 5800U, 13.30", 1 kg
recensione » Recensione dell'HP Pavilion Aero 13: La serie Pavilion sta crescendo
Lenovo ThinkPad L14 G2 AMD: AMD Ryzen 7 PRO 5850U, 14.00", 1.7 kg
recensione » Recensione del Lenovo ThinkPad L14 Gen 2 AMD: L'aggiornabilità incontra AMD Ryzen 5000
HP ProBook x360 435 G8 R7-5800U: AMD Ryzen 7 5800U, 13.30", 1.5 kg
recensione » Recensione dell'HP ProBook x360 435 G8 AMD - convertibile business entry-level con CPU Zen 3 Ryzen
Asus VivoBook S15 D533UA: AMD Ryzen 7 5700U, 15.60", 1.8 kg
recensione » Recensione Asus VivoBook S15 D533UA: un tuttofare con una Ryzen 7 e una buona autonomia della batteria
HP Envy x360 15-eu0097nr: AMD Ryzen 7 5700U, 15.60", 1.9 kg
recensione » Recensione del convertibile HP Envy x360 15 Ryzen 7 5700U: Più veloce dello Spectre x360 15
Asus ZenBook 13 UM325S: AMD Ryzen 7 5800U, 13.30", 1.2 kg
recensione » Recensione Asus ZenBook 13 - Un portatile compatto da 13" con un veloce Ryzen 7 5800U e un display OLED
Lenovo IdeaPad Flex 5 14ALC05 82HU002YUS: AMD Ryzen 7 5700U, 14.00", 1.6 kg
recensione » Recensione del Lenovo IdeaPad Flex 5 14 Ryzen 7: Il convertibile da 14" più veloce del mercato
Microsoft Surface Laptop 4 15 AMD TFF_00028: AMD Ryzen 7 4980U, 15.00", 1.6 kg
recensione » Recensione del computer portatile Microsoft Surface Laptop 4 15: Nuovo processore AMD e maggiore autonomia
Lenovo Yoga Slim 7-14ARE: AMD Ryzen 7 4800U, 14.00", 1.4 kg
recensione » Recensione del laptop Lenovo Yoga Slim 7 14: la Ryzen 7 4800U è un mostro
Acer Aspire Go 15 AG15-42P: AMD Ryzen 7 5825U, 15.60", 1.8 kg
Recensioni esterne » Acer Aspire Go 15 AG15-42P
Lenovo V15 G4 AMN, R7 7730U: AMD Ryzen 7 7730U, 15.60", 1.7 kg
Recensioni esterne » Lenovo V15 G4 AMN, R7 7730U
HP 17-cp3000: AMD Ryzen 7 7730U, 17.30", 2.1 kg
Recensioni esterne » HP 17-cp3000
Acer Aspire 3 A314-42P: AMD Ryzen 7 5700U, 14.00", 1.4 kg
Recensioni esterne » Acer Aspire 3 A314-42P
Acer Aspire 3 A315-44P: AMD Ryzen 7 5700U, 15.60", 1.8 kg
Recensioni esterne » Acer Aspire 3 A315-44P
Lenovo IdeaPad Slim 3 15ABR8: AMD Ryzen 7 7730U, 15.60", 1.6 kg
Recensioni esterne » Lenovo IdeaPad Slim 3 15ABR8
Lenovo ThinkBook 14 G6 ABP: AMD Ryzen 7 7730U, 14.00", 1.4 kg
Recensioni esterne » Lenovo ThinkBook 14 G6 ABP
Lenovo ThinkPad E16 G1-21JUS08X00: AMD Ryzen 7 7730U, 16.00", 1.8 kg
Recensioni esterne » Lenovo ThinkPad E16 G1-21JUS08X00
Asus Vivobook 16 M1605YA: AMD Ryzen 7 7730U, 16.00", 1.9 kg
Recensioni esterne » Asus Vivobook 16 M1605YA
Asus ZenBook 14 UM3402Y: AMD Ryzen 7 7730U, 14.00", 1.4 kg
Recensioni esterne » Asus ZenBook 14 UM3402Y
HP 15s-eq2145ns: AMD Ryzen 7 5700U, 15.60", 1.7 kg
Recensioni esterne » HP 15s-eq2145ns
Dell Vostro 15 3535: AMD Ryzen 7 7730U, 15.60", 1.9 kg
Recensioni esterne » Dell Vostro 15 3535
Lenovo IdeaPad 1 15ALC7, R7 5700U: AMD Ryzen 7 5700U, 15.60", 1.6 kg
Recensioni esterne » Lenovo IdeaPad 1 15ALC7, R7 5700U
Lenovo IdeaPad Slim 5 14ABR8: AMD Ryzen 7 7730U, 14.00", 1.5 kg
Recensioni esterne » Lenovo IdeaPad Slim 5 14ABR8
HP Envy x360 15-fh0077ng: AMD Ryzen 7 7730U, 15.60", 1.8 kg
Recensioni esterne » HP Envy x360 15-fh0077ng
Asus Vivobook 15X M1503, R7 5800H: AMD Ryzen 7 5800H, 15.60", 1.7 kg
Recensioni esterne » Asus Vivobook 15X M1503, R7 5800H
MSI Modern 15 B7M: AMD Ryzen 7 7730U, 15.60", 1.8 kg
Recensioni esterne » MSI Modern 15 B7M
Lenovo IdeaPad Slim 3 14ABR8: AMD Ryzen 7 7730U, 14.00", 1.8 kg
Recensioni esterne » Lenovo IdeaPad Slim 3 14ABR8
Acer Aspire 5 A515-48M: AMD Ryzen 7 7730U, 15.60", 1.7 kg
Recensioni esterne » Acer Aspire 5 A515-48M
Acer Swift Go 14 SFG14-41: AMD Ryzen 7 7730U, 14.00", 1.3 kg
Recensioni esterne » Acer Swift Go 14 SFG14-41
MSI Modern 14 C7M, R7 7730U: AMD Ryzen 7 7730U, 14.00", 1.4 kg
Recensioni esterne » MSI Modern 14 C7M, R7 7730U
Lenovo IdeaPad Flex 5 16ABR G8: AMD Ryzen 7 7730U, 16.00", 2 kg
Recensioni esterne » Lenovo IdeaPad Flex 5 16ABR G8
HP 15-fc0072ns: AMD Ryzen 7 7730U, 15.60", 1.6 kg
Recensioni esterne » HP 15-fc0072ns
Lenovo IdeaPad 5 14ABA7, R7 5825U: AMD Ryzen 7 5825U, 14.00", 1.4 kg
Recensioni esterne » Lenovo IdeaPad 5 14ABA7, R7 5825U
Asus Vivobook 15 M1505YA: AMD Ryzen 7 7730U, 15.60", 1.7 kg
Recensioni esterne » Asus Vivobook 15 M1505YA
MSI Modern 15 B5M, R7 5825U: AMD Ryzen 7 5825U, 15.60", 1.8 kg
Recensioni esterne » MSI Modern 15 B5M, R7 5825U
HP Pavilion 15-eh3000: AMD Ryzen 7 7730U, 15.60", 1.8 kg
Recensioni esterne » HP Pavilion 15-eh3000
HP Pavilion Aero 13-be1002ns: AMD Ryzen 7 5800U, 13.30", 1 kg
Recensioni esterne » HP Pavilion Aero 13-be1002ns
Asus VivoBook 15 M515UA-EJ486W: AMD Ryzen 7 5700U, 15.60", 1.8 kg
Recensioni esterne » Asus VivoBook 15 M515UA-EJ486W
Asus Vivobook 16X M1603, R7 5800H: AMD Ryzen 7 5800H, 16.00", 1.9 kg
Recensioni esterne » Asus Vivobook 16X M1603, R7 5800H
Asus ZenBook 14 UM3402YA-KM452W: AMD Ryzen 7 7730U, 14.00", 1.4 kg
Recensioni esterne » Asus ZenBook 14 UM3402YA-KM452W
Acer Swift 3 SF314-43-R2LX: AMD Ryzen 7 5700U, 14.00", 1.2 kg
Recensioni esterne » Acer Swift 3 SF314-43-R2LX
Dynabook Satellite Pro C50D-B-11A: AMD Ryzen 7 5800U, 15.60", 1.9 kg
Recensioni esterne » Dynabook Satellite Pro C50D-B-11A
Dell Inspiron 15 5515-H8P8F: AMD Ryzen 7 5700U, 15.60", 1.6 kg
Recensioni esterne » Dell Inspiron 15 5515-H8P8F
Acer Aspire 5 A515-45-R3K8: AMD Ryzen 7 5700U, 15.60", 1.8 kg
Recensioni esterne » Acer Aspire 5 A515-45-R3K8
Acer Aspire 5 A515-45-R4R1: AMD Ryzen 7 5700U, 15.60", 1.7 kg
Recensioni esterne » Acer Aspire 5 A515-45-R4R1
Lenovo IdeaPad 3 15ABA7, R7 5825U: AMD Ryzen 7 5825U, 15.60", 1.9 kg
Recensioni esterne » Lenovo IdeaPad 3 15ABA7, R7 5825U
Lenovo IdeaPad 3 17ABA7, R7 5825U: AMD Ryzen 7 5825U, 17.30", 2.2 kg
Recensioni esterne » Lenovo IdeaPad 3 17ABA7, R7 5825U
HP Envy x360 15-ey0023dx: AMD Ryzen 7 5825U, 15.60", 1.9 kg
Recensioni esterne » HP Envy x360 15-ey0023dx
Asus ZenBook 14X UM5401, 5800H: AMD Ryzen 7 5800H, 14.00", 1.4 kg
Recensioni esterne » Asus ZenBook 14X UM5401, 5800H
Dell Inspiron 16 5625, Ryzen 7 5825U: AMD Ryzen 7 5825U, 16.00", 1.9 kg
Recensioni esterne » Dell Inspiron 16 5625, Ryzen 7 5825U
Lenovo ThinkBook 14 G3 ACL, Ryzen 7 5700U: AMD Ryzen 7 5700U, 14.00", 1.4 kg
Recensioni esterne » Lenovo ThinkBook 14 G3 ACL, Ryzen 7 5700U
Lenovo Yoga 7 14ACN6-82N7004HGE: AMD Ryzen 7 5800U, 14.00", 1.5 kg
Recensioni esterne » Lenovo Yoga 7 14ACN6-82N7004HGE
Lenovo ThinkPad X13 G2, Ryzen 7 PRO 5850U: AMD Ryzen 7 PRO 5850U, 13.30", 1.3 kg
Recensioni esterne » Lenovo ThinkPad X13 G2, Ryzen 7 PRO 5850U
Lenovo ThinkPad E15 G3-20YG003UGE: AMD Ryzen 7 5700U, 15.60", 1.8 kg
Recensioni esterne » Lenovo ThinkPad E15 G3-20YG003UGE
HP ProBook 455 G9, R7 5825U: AMD Ryzen 7 5825U, 15.60", 1.7 kg
Recensioni esterne » HP ProBook 455 G9, R7 5825U
HP EliteBook 645 G9, Ryzen 7 5825U: AMD Ryzen 7 5825U, 14.00", 1.4 kg
Recensioni esterne » HP EliteBook 645 G9, Ryzen 7 5825U
Asus ZenBook 14 UM3402YA-KM115W: AMD Ryzen 7 5825U, 14.00", 1.4 kg
Recensioni esterne » Asus ZenBook 14 UM3402YA-KM115W
HP Pavilion Aero 13-be0009ns: AMD Ryzen 7 5800U, 13.30", 1 kg
Recensioni esterne » HP Pavilion Aero 13-be0009ns
Lenovo ThinkBook 15 G3 ACL-21A4002DMH: AMD Ryzen 7 5700U, 15.60", 1.7 kg
Recensioni esterne » Lenovo ThinkBook 15 G3 ACL-21A4002DMH
Lenovo IdeaPad 3 15ALC6-82KU01EBMH: AMD Ryzen 7 5700U, 15.60", 1.7 kg
Recensioni esterne » Lenovo IdeaPad 3 15ALC6-82KU01EBMH
Asus Vivobook Pro 14 M3400, R7 5800H: AMD Ryzen 7 5800H, 14.00", 1.4 kg
Recensioni esterne » Asus Vivobook Pro 14 M3400, R7 5800H
HP Pavilion 15-eh1771nd: AMD Ryzen 7 5700U, 15.60", 1.8 kg
Recensioni esterne » HP Pavilion 15-eh1771nd
HP Dev One, Ryzen 7 PRO 5850U: AMD Ryzen 7 PRO 5850U, 14.00", 1.5 kg
Recensioni esterne » HP Dev One, Ryzen 7 PRO 5850U
HP 15s-eq2119ns: AMD Ryzen 7 5700U, 15.60", 1.7 kg
Recensioni esterne » HP 15s-eq2119ns
Lenovo IdeaPad 3 14ALC6-82KT0042SP: AMD Ryzen 7 5700U, 14.00", 1.4 kg
Recensioni esterne » Lenovo IdeaPad 3 14ALC6-82KT0042SP
HP 14s-fq1083AU: AMD Ryzen 7 5700U, 14.00", 1.5 kg
Recensioni esterne » HP 14s-fq1083AU
Asus ZenBook 14 UM3402YA-KM067W: AMD Ryzen 7 5825U, 14.00", 1.4 kg
Recensioni esterne » Asus ZenBook 14 UM3402YA-KM067W
Asus Zenbook 14 UM425UAZ-KI047: AMD Ryzen 7 5700U, 14.00", 1.3 kg
Recensioni esterne » Asus Zenbook 14 UM425UAZ-KI047
Asus ZenBook 14 UM425UAZ-KI035T: AMD Ryzen 7 5700U, 14.00", 1.1 kg
Recensioni esterne » Asus ZenBook 14 UM425UAZ-KI035T
HP Pavilion 14-ec0006ns: AMD Ryzen 7 5700U, 14.00", 2.1 kg
Recensioni esterne » HP Pavilion 14-ec0006ns
Asus VivoBook 15 M513UA-L1568W: AMD Ryzen 7 5700U, 15.60", 1.8 kg
Recensioni esterne » Asus VivoBook 15 M513UA-L1568W
Acer Swift 3 Pro SF314-43-R8MY: AMD Ryzen 7 5700U, 14.00", 1.2 kg
Recensioni esterne » Acer Swift 3 Pro SF314-43-R8MY
Asus VivoBook Flip 14 TM420UA-EC110T: AMD Ryzen 7 5700U, 14.00", 1.5 kg
Recensioni esterne » Asus VivoBook Flip 14 TM420UA-EC110T
Lenovo IdeaPad 5 Pro 14ACN6-82L7004XMH: AMD Ryzen 7 5800U, 14.00", 1.4 kg
Recensioni esterne » Lenovo IdeaPad 5 Pro 14ACN6-82L7004XMH
HP 15s-eq2120ns: AMD Ryzen 7 5700U, 15.60", 1.7 kg
Recensioni esterne » HP 15s-eq2120ns
HP Pavilion Aero 13-be0008ns: AMD Ryzen 7 5800U, 13.30", 1 kg
Recensioni esterne » HP Pavilion Aero 13-be0008ns
HP 15s-eq2113ns: AMD Ryzen 7 5700U, 15.60", 1.7 kg
Recensioni esterne » HP 15s-eq2113ns
MSI Modern 15 A5M-009XES: AMD Ryzen 7 5700U, 15.60", 1.6 kg
Recensioni esterne » MSI Modern 15 A5M-009XES
Asus ZenBook 14 Flip OLED UN5401QA-K181W: AMD Ryzen 9 5900HX, 14.00", 1.4 kg
Recensioni esterne » Asus ZenBook Flip 14 UN5401QA-K181W
Asus ZenBook Flip 14 UN5401QA-KN085W: AMD Ryzen 7 5800H, 14.00", 1.4 kg
Recensioni esterne » Asus ZenBook Flip 14 UN5401QA-KN085W
HP Envy x360 13-ay1054AU: AMD Ryzen 7 5800U, 13.30", 1.3 kg
Recensioni esterne » HP Envy x360 13-ay1054AU
HP Pavilion 14-ec0013ns: AMD Ryzen 7 5700U, 14.00", 1.4 kg
Recensioni esterne » HP Pavilion 14-ec0013ns
HP ProBook 455 G8-45R47ES: AMD Ryzen 7 5800U, 15.60", 1.7 kg
Recensioni esterne » HP ProBook 455 G8-45R47ES
Lenovo Thinkbook 14p G2 ACH, 5800H: AMD Ryzen 7 5800H, 14.00", 1.4 kg
Recensioni esterne » Lenovo Thinkbook 14p G2 ACH, 5800H
Lenovo Yoga Slim 7 Carbon 14ACN6-82L0005DGE: AMD Ryzen 7 5800U, 14.00", 1.1 kg
Recensioni esterne » Lenovo Yoga Slim 7 Carbon 14ACN6-82L0005DGE
Lenovo Yoga Slim 7 Pro 14ACH5 O-82N5003TGE: AMD Ryzen 7 5800H, 14.00", 1.4 kg
Recensioni esterne » Lenovo Yoga Slim 7 Pro 14ACH5 O-82N5003TGE
HP Pavilion Aero 13-be0002AU: AMD Ryzen 7 5800U, 13.30", 1 kg
Recensioni esterne » HP Pavilion Aero 13-be0002AU
HP 15s-eq2059ns: AMD Ryzen 7 5700U, 15.60", 1.7 kg
Recensioni esterne » HP 15s-eq2059ns
Acer TravelMate P2 P215-41-G2-R7PB: AMD Ryzen 7 PRO 5850U, 15.60", 1.8 kg
Recensioni esterne » Acer TravelMate P2 P215-41-G2-R7PB
Asus Vivobook 15 M513UA-L1282T: AMD Ryzen 7 5700U, 15.60", 1.8 kg
Recensioni esterne » Asus Vivobook 15 M513UA-L1282T
Lenovo ThinkPad P14s G2 AMD FHD: AMD Ryzen 7 PRO 5850U, 14.00"
Recensioni esterne » Lenovo ThinkPad P14s G2 AMD FHD
Asus Zenbook 14 UM425UAZ-KI016T: AMD Ryzen 7 5700U, 14.00", 1.2 kg
Recensioni esterne » Asus Zenbook 14 UM425UAZ-KI016T
HP Envy x360 13-ay1001ns: AMD Ryzen 7 5800U, 13.30", 1.3 kg
Recensioni esterne » HP Envy x360 13-ay1001ns
Lenovo IdeaPad 5 Pro 16ACH6-82L5003UMH: AMD Ryzen 7 5800H, 16.00", 2.5 kg
Recensioni esterne » Lenovo IdeaPad 5 Pro 16ACH6-82L5003UMH
HP Envy x360 13-ay1074ng: AMD Ryzen 7 5800U, 13.30", 1.3 kg
Recensioni esterne » HP Envy x360 13-ay1074ng
Lenovo Thinkbook 14p, 5900HX OLED: AMD Ryzen 9 5900HX, 14.00", 1.4 kg
Recensioni esterne » Lenovo Thinkbook 14p, 5900HX OLED
Asus VivoBook Pro 15 M3500QA-L1082W: AMD Ryzen 7 5800H, 15.60", 1.7 kg
Recensioni esterne » Asus VivoBook Pro 15 M3500QA-L1082W
Lenovo Yoga 6 13ALC6: AMD Ryzen 7 5700U, 13.30", 1.3 kg
Recensioni esterne » Lenovo Yoga 6 13ALC6
Lenovo IdeaPad 5 14ALC05-82LM005XGE: AMD Ryzen 7 5700U, 14.00", 1.4 kg
Recensioni esterne » Lenovo IdeaPad 5 14ALC05-82LM005XGE
Dell Inspiron 14 7415-6JDWR, 2-in-1: AMD Ryzen 7 5700U, 14.00", 1.7 kg
Recensioni esterne » Dell Inspiron 14 7415-6JDWR, 2-in-1
Asus ZenBook 14 UM425QA, 5800H: AMD Ryzen 7 5800H, 14.00", 1.2 kg
Recensioni esterne » Asus ZenBook 14 UM425QA, 5800H
HP 15s-eq2032ns: AMD Ryzen 7 5700U, 15.60", 1.7 kg
Recensioni esterne » HP 15s-eq2032ns
HP Pavilion Aero 13-be0007ns: AMD Ryzen 7 5800U, 13.30", 1 kg
Recensioni esterne » HP Pavilion Aero 13-be0007ns
HP Pavilion Aero 13-be0240nd: AMD Ryzen 7 5800U, 13.30", 1 kg
Recensioni esterne » HP Pavilion Aero 13-be0240nd
Lenovo V14 G2 ALC-82KC0001GE: AMD Ryzen 7 5700U, 14.00", 1.6 kg
Recensioni esterne » Lenovo V14 G2 ALC-82KC0001GE
HP Pavilion 14-ec0004ns: AMD Ryzen 7 5700U, 14.00", 1.4 kg
Recensioni esterne » HP Pavilion 14-ec0004ns
HP ProBook 635 Aero G8-51C00US: AMD Ryzen 7 PRO 5850U, 13.30", 1.8 kg
Recensioni esterne » HP ProBook 635 Aero G8-51C00US
Lenovo Yoga Slim 7 Pro 14ACH5: AMD Ryzen 9 5900HX, 14.00", 1.3 kg
Recensioni esterne » Lenovo Yoga Slim 7 Pro 14ACH5
Asus ZenBook 14X UM5401, 5900HX: AMD Ryzen 9 5900HX, 14.00", 1.4 kg
Recensioni esterne » Asus ZenBook 14X UM5401, 5900HX
Lenovo ThinkPad E14 G3-20Y7003XGE: AMD Ryzen 7 5700U, 14.00", 1.4 kg
Recensioni esterne » Lenovo ThinkPad E14 G3-20Y7003XGE
Lenovo IdeaPad 5 Pro 14ACN6-82L7003NGE: AMD Ryzen 7 5800U, 14.00", 1.4 kg
Recensioni esterne » Lenovo IdeaPad 5 Pro 14ACN6-82L7003NGE
HP Pavilion Aero 13-be0006ns: AMD Ryzen 7 5800U, 13.30", 1 kg
Recensioni esterne » HP Pavilion Aero 13-be0006ns
Dell Vostro 15 5515, R7 5700U: AMD Ryzen 7 5700U, 15.60", 1.6 kg
Recensioni esterne » Dell Vostro 15 5515, R7 5700U
HP Pavilion Aero 13 be0097nr: AMD Ryzen 7 5800U, 13.30", 1 kg
Recensioni esterne » HP Pavilion Aero 13 be0097nr
Asus Vivobook 14 M433UA-EB751TS: AMD Ryzen 7 5700U, 14.00", 1.4 kg
Recensioni esterne » Asus Vivobook 14 M433UA-EB751TS
Dell Inspiron 15 5515, R7 5700U: AMD Ryzen 7 5700U, 15.60", 1.8 kg
Recensioni esterne » Dell Inspiron 15 5515, R7 5700U
Lenovo Yoga Slim 7 Pro 14ACH5, R7 5800H: AMD Ryzen 7 5800H, 14.00", 1.3 kg
Recensioni esterne » Lenovo Yoga Slim 7 Pro 14ACH5, R7 5800H
Lenovo IdeaPad 5 15ALC05-82LN0037SP: AMD Ryzen 7 5700U, 15.60", 1.7 kg
Recensioni esterne » Lenovo IdeaPad 5 15ALC05-82LN0037SP
Acer Swift 3 SF314-43-R2YY: AMD Ryzen 7 5700U, 14.00", 1.2 kg
Recensioni esterne » Acer Swift 3 SF314-43-R2YY
Lenovo Yoga Slim 7 13ACN5, R7 5800U: AMD Ryzen 7 5800U, 13.30", 1.2 kg
Recensioni esterne » Lenovo Yoga Slim 7 13ACN5, R7 5800U
Asus ZenBook 13 OLED UM325UA: AMD Ryzen 7 5700U, 13.30", 1.1 kg
Recensioni esterne » Asus ZenBook 13 OLED UM325UA
Asus VivoBook 14 M413U, R7 5700U: AMD Ryzen 7 5700U, 14.00", 1.4 kg
Recensioni esterne » Asus VivoBook 14 M413U, R7 5700U
Lenovo IdeaPad 3 15ALC6-82KU008GSP: AMD Ryzen 7 5700U, 15.60", 1.7 kg
Recensioni esterne » Lenovo IdeaPad 3 15ALC6-82KU008GSP
HP Envy x360 15-eu0097nr: AMD Ryzen 7 5700U, 15.60", 1.9 kg
Recensioni esterne » HP Envy x360 15-eu0097nr
Huawei MateBook 16 R7 5800H: AMD Ryzen 7 5800H, 16.00", 2 kg
Recensioni esterne » Huawei MateBook 16, R7 5800H
Xiaomi RedmiBook Pro 15, R7 5800H: AMD Ryzen 7 5800H, 15.60", 1.8 kg
Recensioni esterne » Xiaomi RedmiBook Pro 15, R7 5800H
Lenovo IdeaPad Flex 5 14ALC05 82HU002YUS: AMD Ryzen 7 5700U, 14.00", 1.6 kg
Recensioni esterne » Lenovo IdeaPad Flex 5 14ALC05 82HU002YUS
Asus ZenBook 13 UM325S: AMD Ryzen 7 5800U, 13.30", 1.2 kg
Recensioni esterne » Asus ZenBook 13 UM325S
Asus ZenBook 13 OLED UM325UA-DS71: AMD Ryzen 7 5700U, 13.30", 1.1 kg
Recensioni esterne » Asus ZenBook 13 OLED UM325UA-DS71
Dell Inspiron 15 3505, Ryzen 5 3450U: AMD Ryzen 5 3450U, 15.60", 2 kg
Recensioni esterne » Dell Inspiron 15 3505, Ryzen 5 3450U
Microsoft Surface Laptop 4 15 AMD TFF_00028: AMD Ryzen 7 4980U, 15.00", 1.6 kg
Recensioni esterne » Microsoft Surface Laptop 4 15 AMD TFF_00028
Lenovo Yoga Slim 7 14ARE05-82A20087MH: AMD Ryzen 7 4800U, 14.00", 1.3 kg
Recensioni esterne » Lenovo Yoga Slim 7 14ARE05-82A20087MH
Lenovo Yoga Slim 7 14ARE05-82A200A5GE: AMD Ryzen 7 4800U, 14.00", 1.3 kg
Recensioni esterne » Lenovo Yoga Slim 7 14ARE05-82A200A5GE
Lenovo Yoga Slim 7 14ARH05: AMD Ryzen 7 4800U, 14.00", 1.5 kg
Recensioni esterne » Lenovo Yoga Slim 7 14ARH05
Lenovo IdeaPad S540-13ARE-82DL002TMH: AMD Ryzen 7 4800U, 13.30", 1.3 kg
Recensioni esterne » Lenovo IdeaPad S540-13ARE-82DL002TMH
Lenovo IdeaPad Slim 7-14ARE05, Ryzen 7 4800U: AMD Ryzen 7 4800U, 14.00", 1.4 kg
Recensioni esterne » Lenovo IdeaPad Slim 7-14ARE05, Ryzen 7 4800U
Lenovo Yoga Slim 7-14ARE05-82A2005KMH: AMD Ryzen 7 4800U, 14.00", 1.3 kg
Recensioni esterne » Lenovo Yoga Slim 7-14ARE05-82A2005KMH
Lenovo Yoga Slim 7-14ARE: AMD Ryzen 7 4800U, 14.00", 1.4 kg
Recensioni esterne » Lenovo Yoga Slim 7-14ARE
Beelink GTR5: AMD Ryzen 9 5900HX, 0.7 kg
» Il mini PC Beelink GTR5 Ryzen 9 supera quasi tutti i NUC Intel finora nelle prestazioni grezze del processore
Dell Inspiron 14 7400 7415 2-in-1: AMD Ryzen 7 5700U, 14.00", 1.5 kg
» Confusamente, il Dell Inspiron 14 7415 e l'Inspiron 14 5410 sono lo stesso portatile
GPD Win Max 2021: AMD Ryzen 7 4800U, 8.00", 0.9 kg
» Tre svantaggi e vantaggi del Win Max di cui GPD non vi parla
Lenovo ThinkPad E15 G3-20YG003UGE: AMD Ryzen 7 5700U, 15.60", 1.8 kg
» Il ThinkPad E15 AMD di Lenovo ha una potente CPU Ryzen 7 e una grande tastiera
HP Pavilion Aero 13 be0097nr: AMD Ryzen 7 5800U, 13.30", 1 kg
» L'economico HP Pavilion Aero 13 è più veloce di qualsiasi Spectre 13 attualmente disponibile grazie all'AMD Zen 3 Ryzen 7 5800U
Lenovo ThinkPad L14 G2 AMD: AMD Ryzen 7 PRO 5850U, 14.00", 1.7 kg
» Il Lenovo ThinkPad L14 Gen 2 è uno dei ThinkPad 2021 più aggiornabili
HP Envy x360 15-eu0097nr: AMD Ryzen 7 5700U, 15.60", 1.9 kg
» Zen 3 più lento di Zen 2: i primi benchmark mostrano che l'AMD Ryzen 7 5700U supera il Ryzen 7 5800U nella maggior parte degli scenari
Lenovo IdeaPad Flex 5 14ALC05 82HU002YUS: AMD Ryzen 7 5700U, 14.00", 1.6 kg
» L'AMD Ryzen 7 5700U a 7 nm è assolutamente folle, con prestazioni grezze che rivaleggiano con il Core i7-10875H
Microsoft Surface Laptop 4 15 AMD TFF_00028: AMD Ryzen 7 4980U, 15.00", 1.6 kg
» Anche se il Surface Laptop 4 15 offre maggiori prestazioni, delude ancora


