Recensione del mini PC Beelink GTR5 2022: Un NUC Intel con AMD Ryzen 9

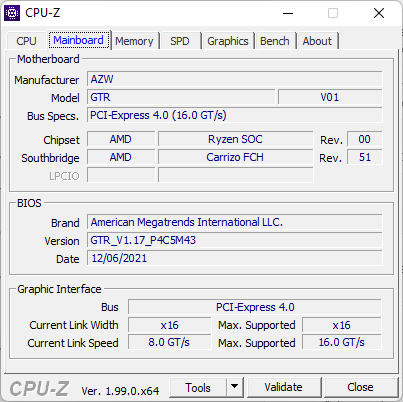
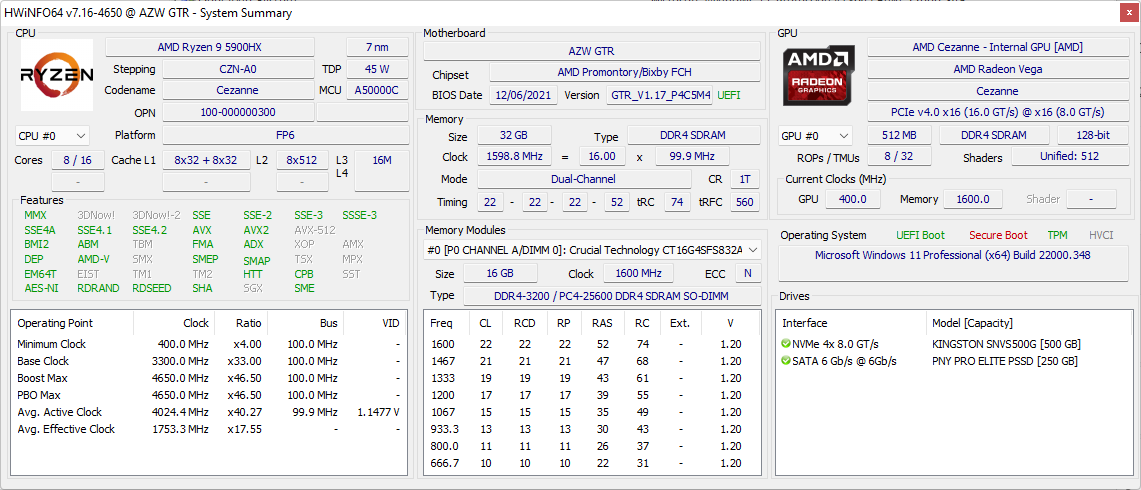
Nei primi giorni dei mini PC di dimensioni NUC, tali prodotti erano tipicamente visti come alternative a bassissima potenza al tipico desktop o laptop. Oggi, i mini PC si sono evoluti per includere specifiche a livello di gioco e altre potenti caratteristiche. Il Beelink GTR5 è l'ultimo mini PC ad alte prestazioni del produttore dotato di un processore AMD Zen 3 Ryzen 9 5900HX che è tipicamente riservato a potenti portatili da gioco come il Asus ROG Zephyrus Duo 15 SE, Lenovo Legion 7 16o il Gigabyte A7 X1. Vedere una tale opzione per un PC con fattore di forma 0,8 L dovrebbe automaticamente rendere il GTR5 uno dei più veloci della sua categoria se tutto funziona come pubblicizzato.
Il GTR5 è attualmente su Indiegogo che vanno da $620 USD per un kit nudo fino a $950 se completamente configurato. Tutte le SKU sono dotate dello stesso processore Ryzen 9 5900HX. Il GTR5 non dovrebbe essere confuso con il GTR7 che è in realtà un vecchio modello di Beelink che gira sul molto più lento Ryzen 7 3750H.
Altre recensioni di Beelink:
Potenziali concorrenti a confronto
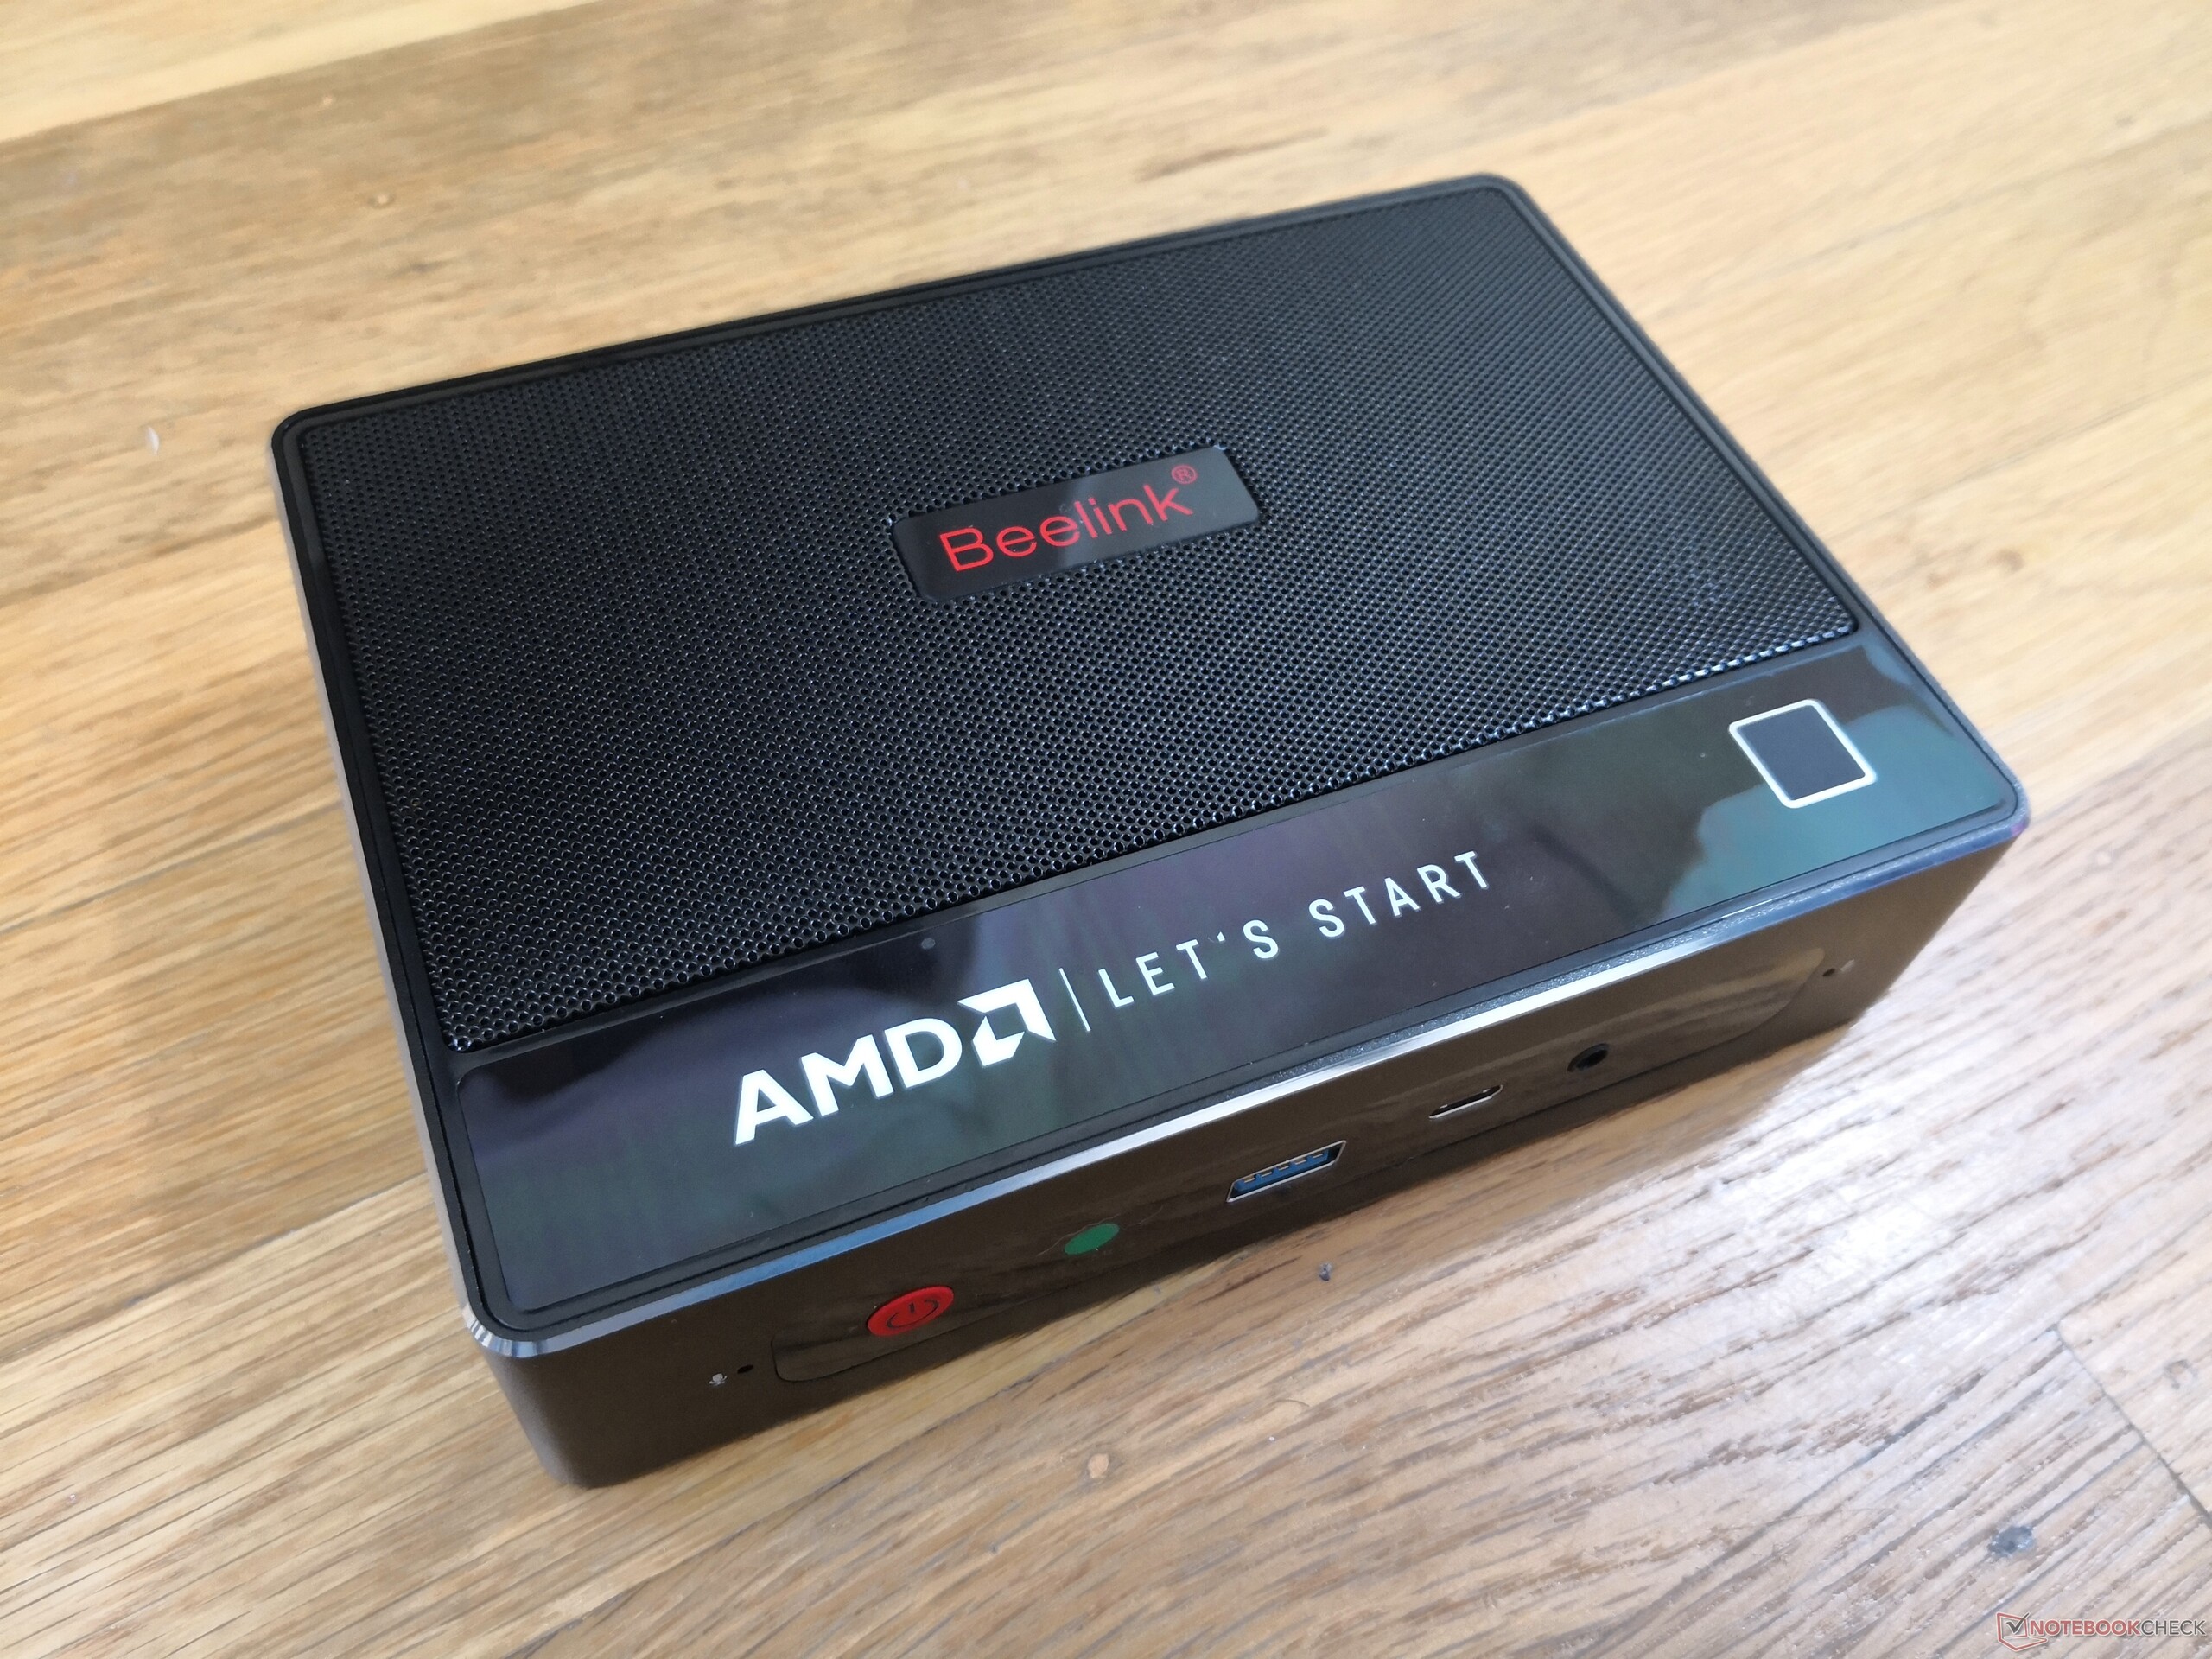
Caso
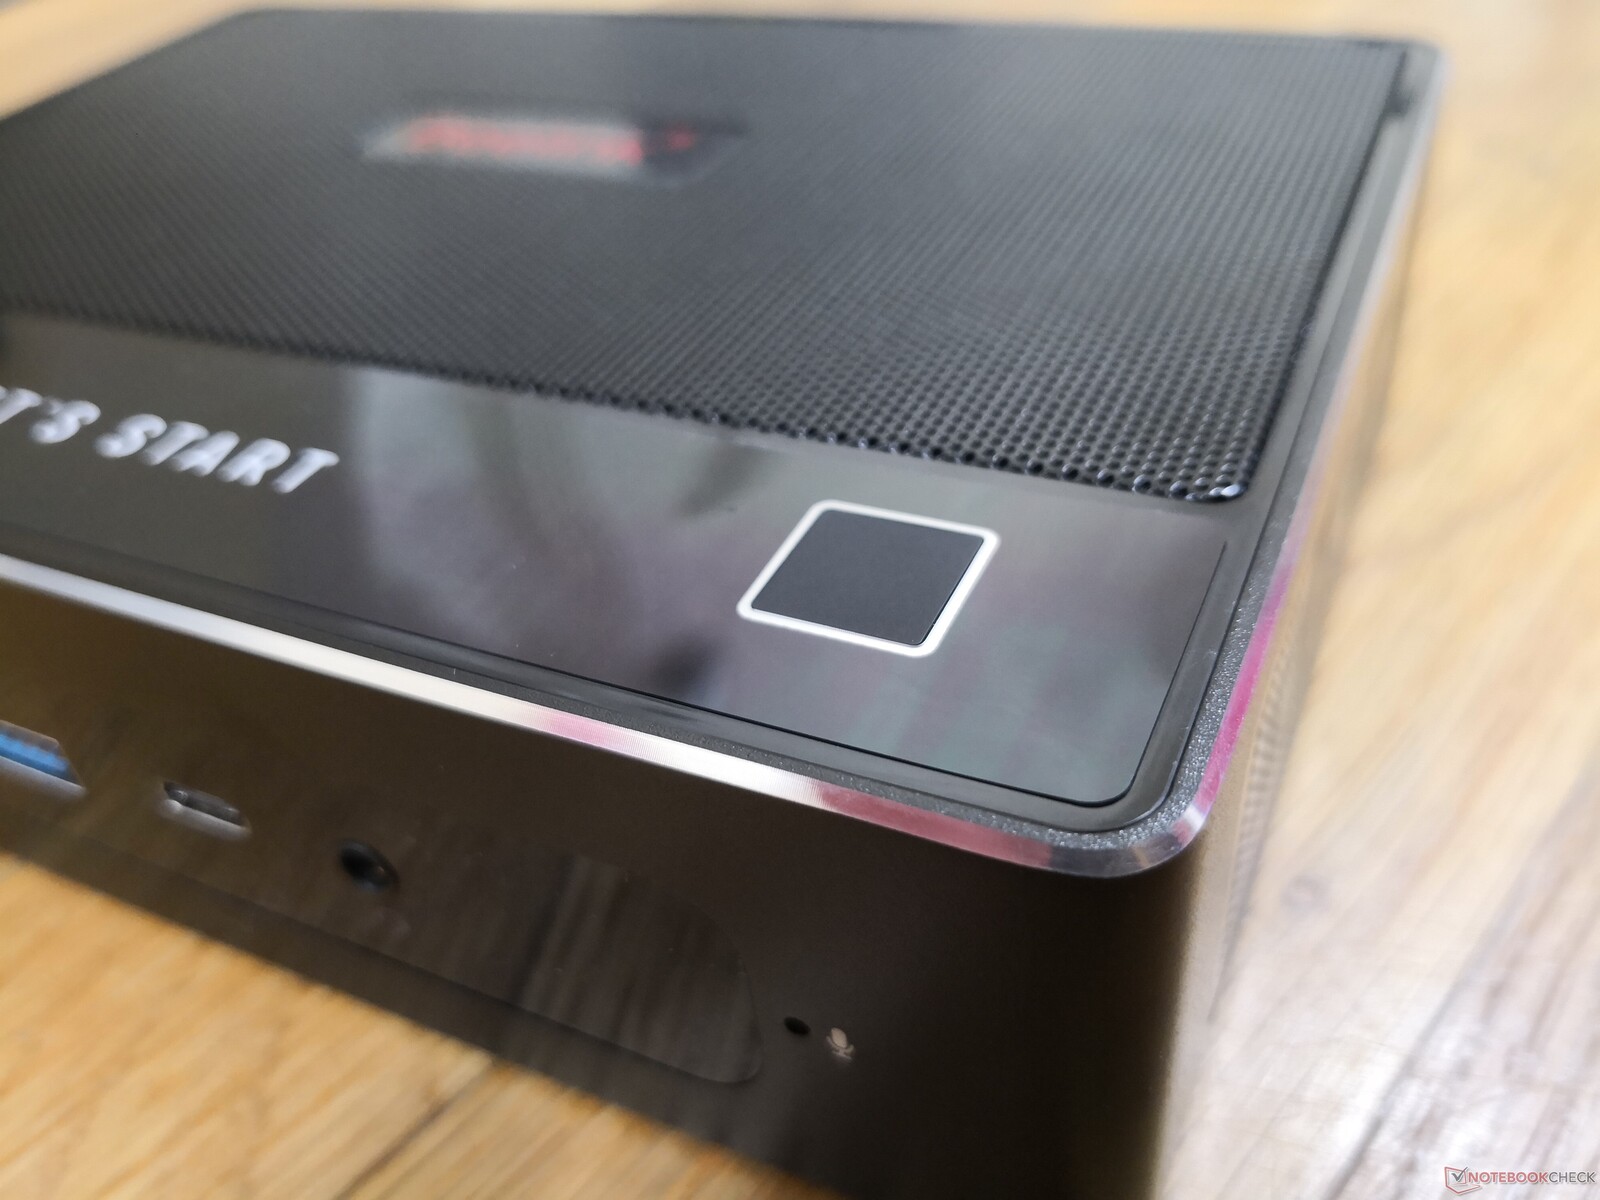
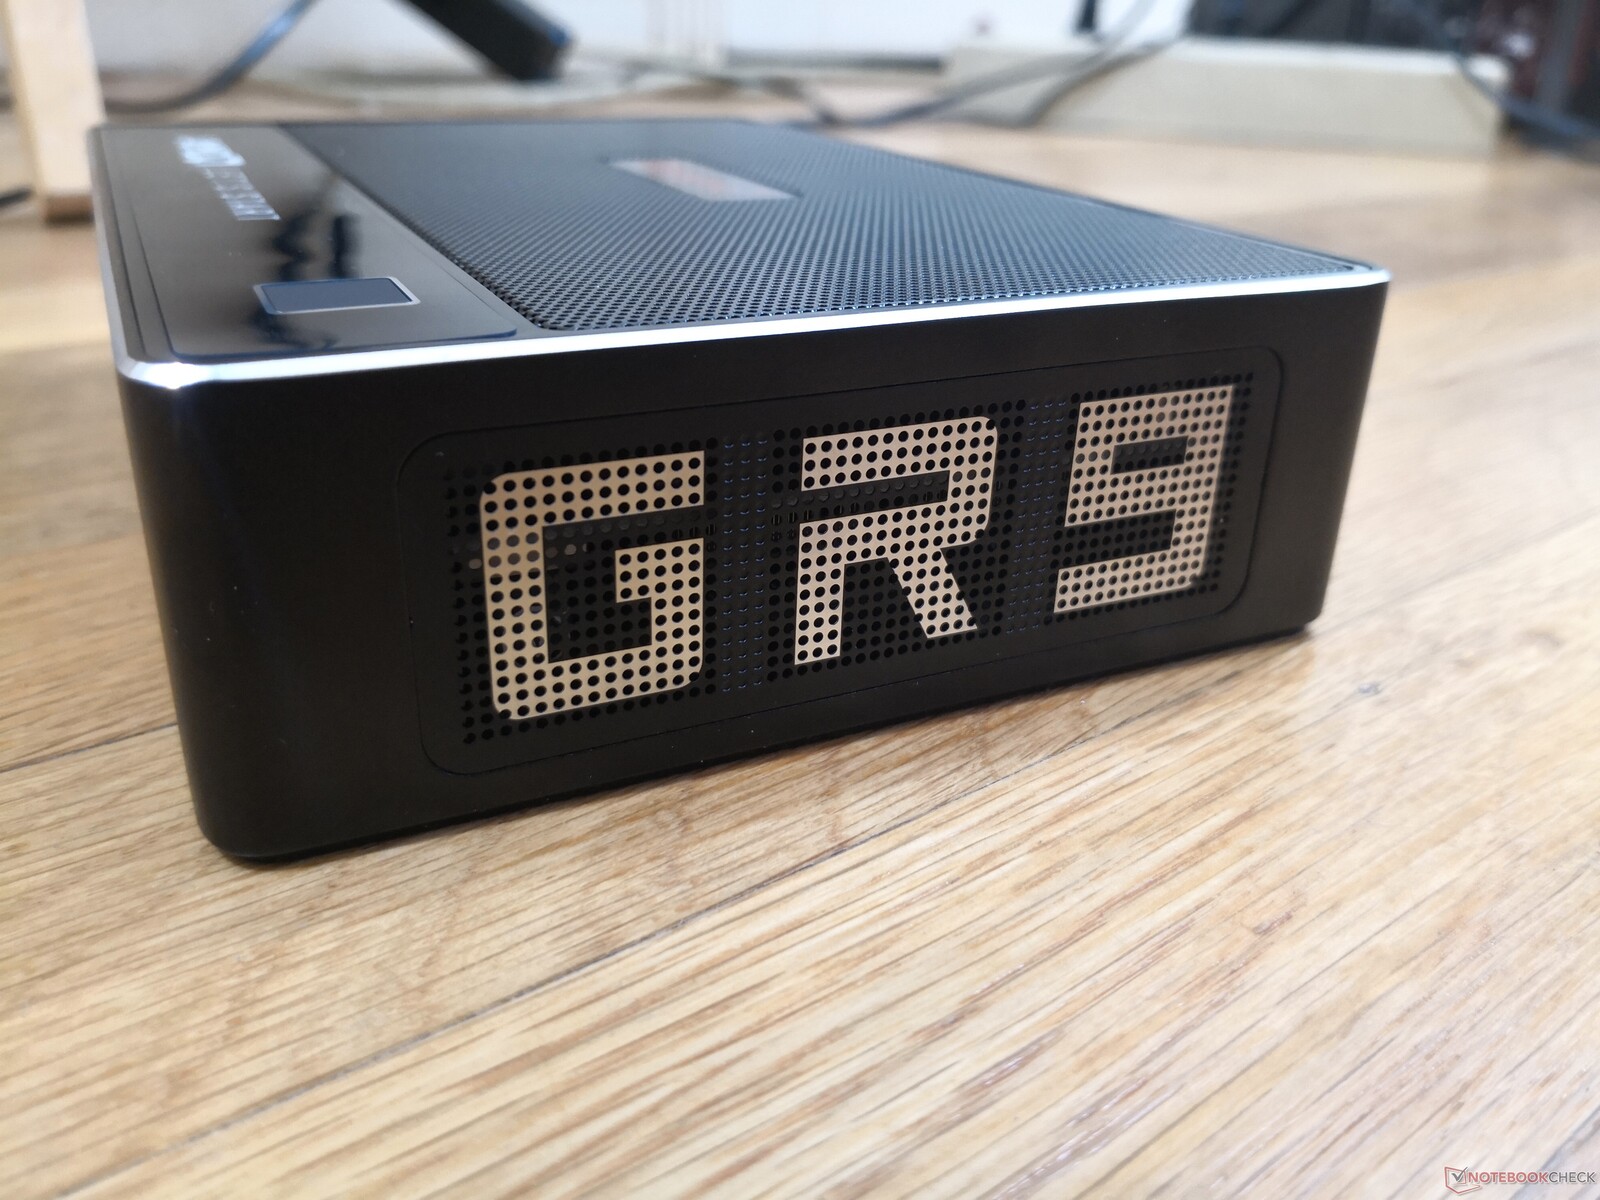
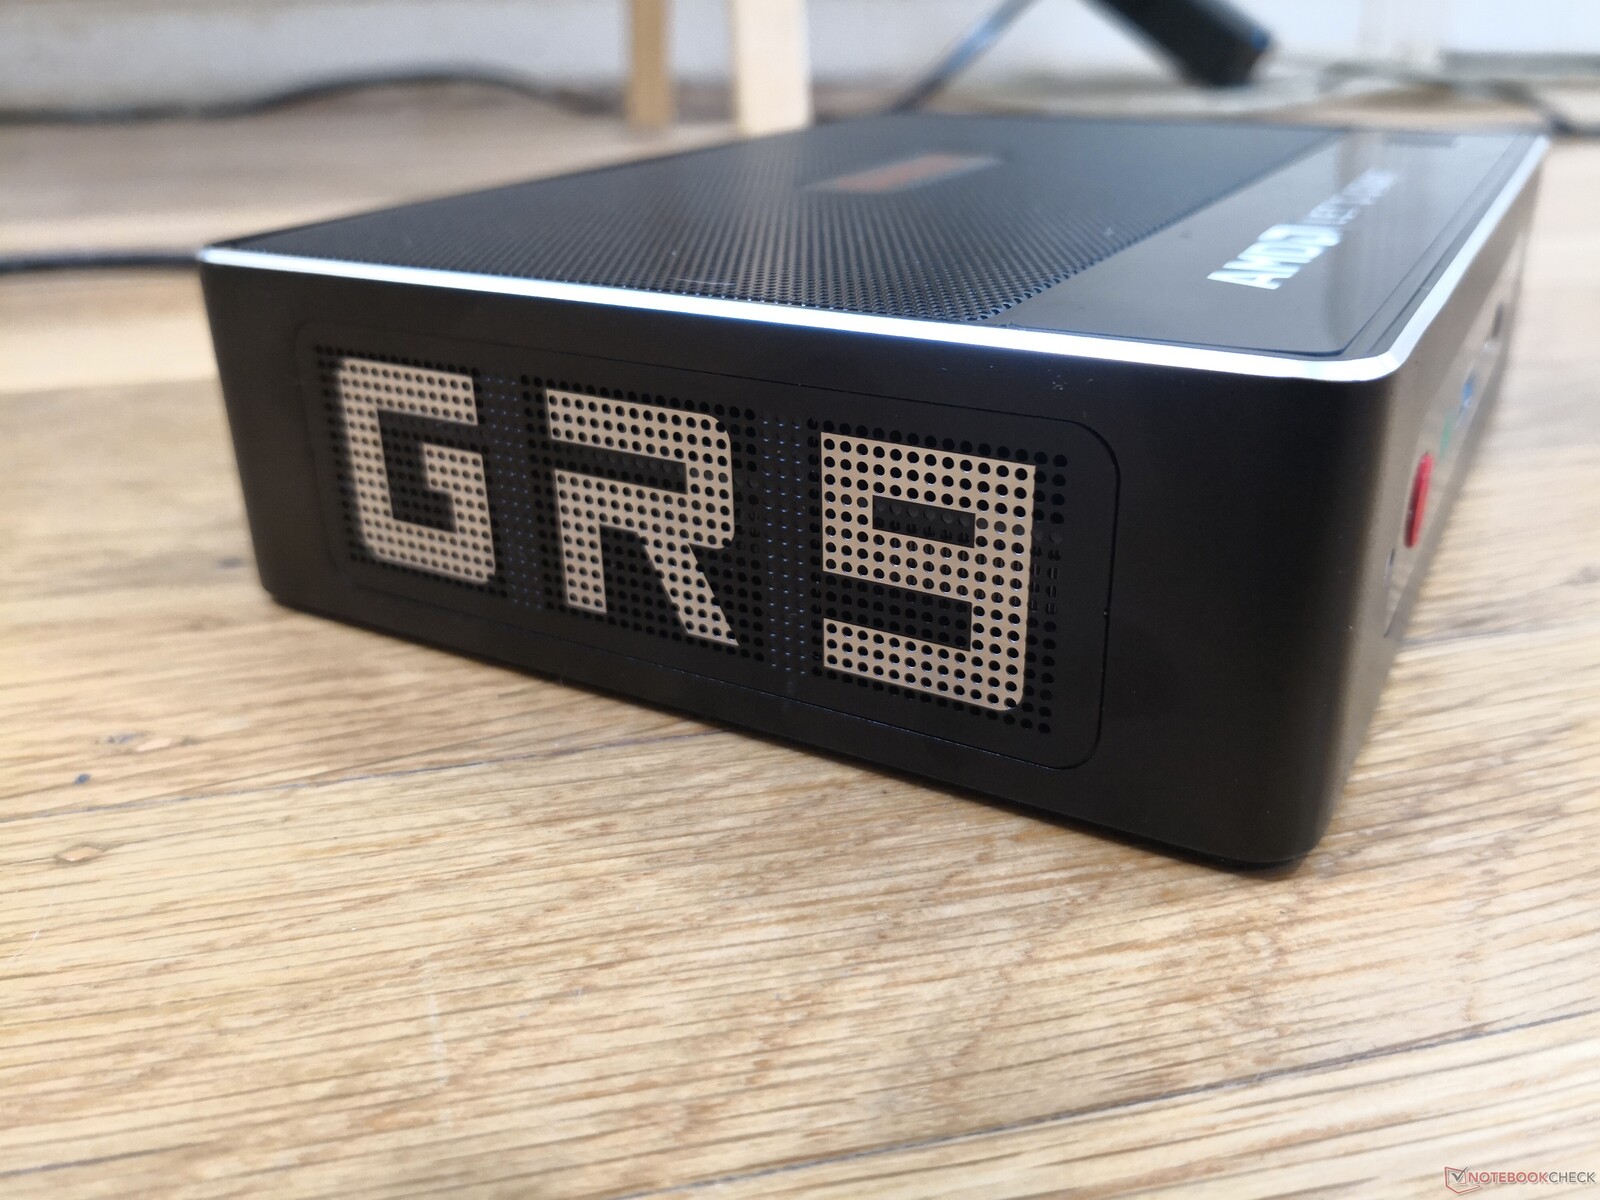
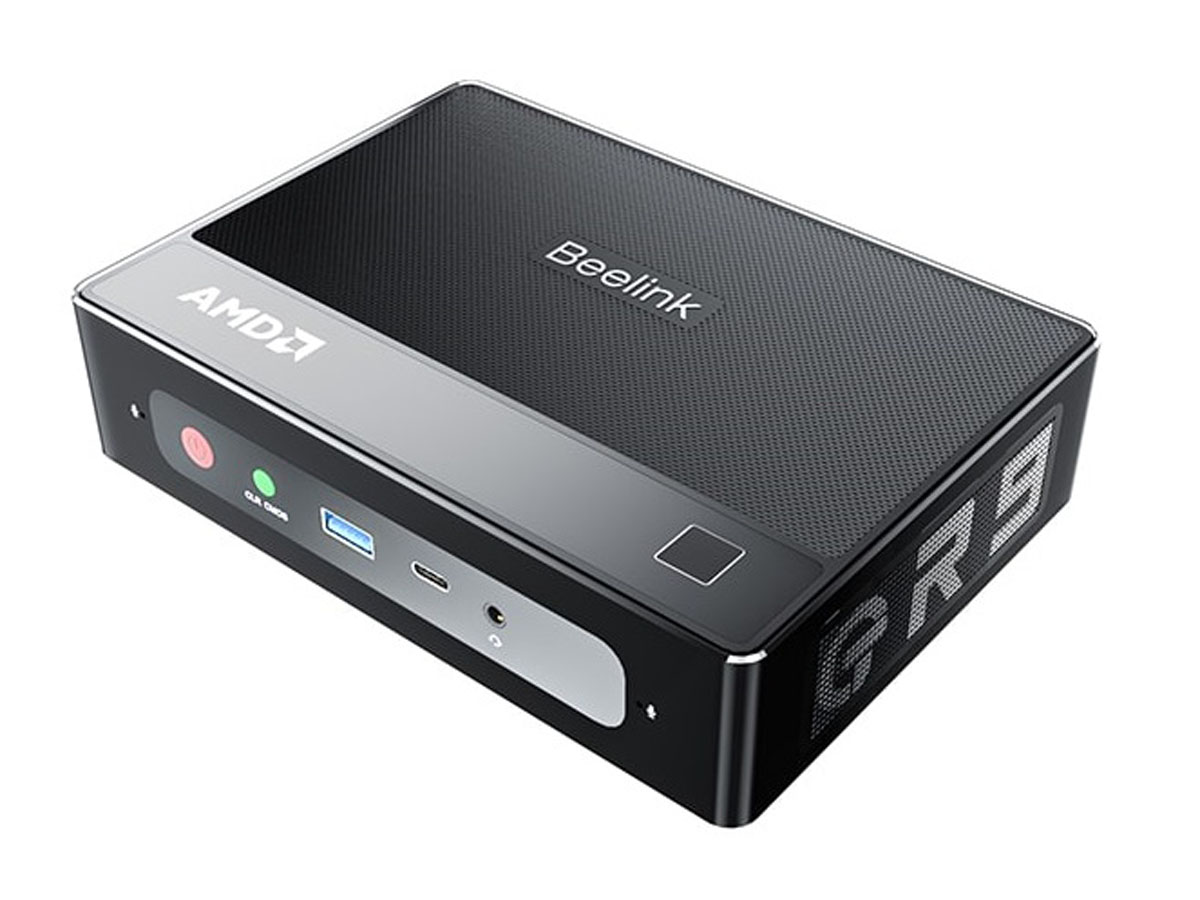
Beelink ha riproposto il suo chassis Intel GTI11 per l'AMD GTR5 poiché le dimensioni e la costruzione complessiva del GTR5 sono essenzialmente identiche alla sua controparte Intel. Il cambiamento più notevole è nella parte superiore dell'unità per accogliere meglio il più esigente processore AMD serie H. Questa superficie è ora perforata invece della plastica lucida liscia per un migliore flusso d'aria.
Confronto delle dimensioni
| Call of Duty Modern Warfare 2 2022 | |
| 1920x1080 Ultra Quality Preset AA:T2X Filmic SM | |
| Morefine S500+ | |
| 1920x1080 Balanced Quality Preset AA:T2X SM | |
| Morefine S500+ | |
| 1920x1080 Basic Quality Preset AA:T2X SM | |
| Morefine S500+ | |
| 1280x720 Basic Quality Preset AA:T2X SM | |
| Morefine S500+ | |
| F1 22 | |
| 1920x1080 Ultra High Preset AA:T AF:16x | |
| Morefine S500+ | |
| 1920x1080 High Preset AA:T AF:16x | |
| Morefine S500+ | |
| 1920x1080 Medium Preset AA:T AF:16x | |
| Morefine S500+ | |
| 1920x1080 Low Preset AA:T AF:16x | |
| Morefine S500+ | |
| 1280x720 Ultra Low Preset AA:T AF:16x | |
| Morefine S500+ | |
| The Quarry | |
| 1920x1080 High Preset | |
| Morefine S500+ | |
| 1920x1080 Medium Preset | |
| Morefine S500+ | |
| 1920x1080 Low Preset | |
| Morefine S500+ | |
| 1280x720 Low Preset | |
| Morefine S500+ | |
| Vampire Bloodhunt | |
| 3840x2160 Ultra Preset | |
| Morefine S500+ | |
| 2560x1440 Ultra Preset | |
| Morefine S500+ | |
| 1920x1080 Ultra Preset | |
| Morefine S500+ | |
| 1920x1080 High Preset | |
| Morefine S500+ | |
| 1920x1080 Medium Preset | |
| Morefine S500+ | |
| 1920x1080 Low Preset | |
| Morefine S500+ | |
| 1280x720 Low Preset | |
| Morefine S500+ | |
| Tiny Tina's Wonderlands | |
| 3840x2160 Badass Preset (DX12) | |
| Morefine S500+ | |
| 2560x1440 Badass Preset (DX12) | |
| Morefine S500+ | |
| 1920x1080 Badass Preset (DX12) | |
| Morefine S500+ | |
| 1920x1080 High Preset (DX12) | |
| Morefine S500+ | |
| 1920x1080 Medium Preset (DX12) | |
| Morefine S500+ | |
| 1920x1080 Low Preset (DX12) | |
| Morefine S500+ | |
| 1280x720 Lowest Preset (DX12) | |
| Morefine S500+ | |
| Ghostwire Tokyo | |
| 3840x2160 Highest Settings | |
| Morefine S500+ | |
| 2560x1440 Highest Settings | |
| Morefine S500+ | |
| 1920x1080 Highest Settings | |
| Morefine S500+ | |
| 1920x1080 High Settings | |
| Morefine S500+ | |
| 1920x1080 Medium Settings | |
| Morefine S500+ | |
| 1920x1080 Low Settings | |
| Morefine S500+ | |
| 1280x720 Lowest Settings | |
| Morefine S500+ | |
| Elden Ring | |
| 3840x2160 Maximum Preset | |
| Morefine S500+ | |
| 2560x1440 Maximum Preset | |
| Morefine S500+ | |
| 1920x1080 Maximum Preset | |
| Morefine S500+ | |
| 1920x1080 High Preset | |
| Morefine S500+ | |
| 1920x1080 Medium Preset | |
| Morefine S500+ | |
| 1920x1080 Low Preset | |
| Morefine S500+ | |
| 1280x720 Low Preset | |
| Morefine S500+ | |
| Elex 2 | |
| 1920x1080 High / On AA:FX AF:16x | |
| Morefine S500+ | |
| 1920x1080 Medium / On AA:FX AF:16x | |
| Morefine S500+ | |
| 1920x1080 Low / Off | |
| Morefine S500+ | |
| 1280x720 Low / Off | |
| Morefine S500+ | |
| Cyberpunk 2077 1.6 | |
| 1920x1080 Ultra Preset | |
| Morefine S500+ | |
| 1920x1080 High Preset | |
| Morefine S500+ | |
| 1920x1080 Medium Preset | |
| Morefine S500+ | |
| 1920x1080 Low Preset | |
| Morefine S500+ | |
| 1280x720 Low Preset | |
| Morefine S500+ | |
| GRID Legends | |
| 3840x2160 Ultra Preset | |
| Morefine S500+ | |
| 2560x1440 Ultra Preset | |
| Morefine S500+ | |
| 1920x1080 Ultra Preset | |
| Morefine S500+ | |
| 1920x1080 High Preset | |
| Morefine S500+ | |
| 1920x1080 Medium Preset | |
| Morefine S500+ | |
| 1920x1080 Low Preset | |
| Morefine S500+ | |
| Dying Light 2 | |
| 3840x2160 High Quality | |
| Morefine S500+ | |
| 2560x1440 High Quality | |
| Morefine S500+ | |
| 1920x1080 High Quality | |
| Morefine S500+ | |
| 1920x1080 Medium Quality | |
| Morefine S500+ | |
| 1920x1080 Low Quality | |
| Morefine S500+ | |
| Rainbow Six Extraction | |
| 3840x2160 Ultra Preset (with Fixed Resolution Quality) | |
| Morefine S500+ | |
| 2560x1440 Ultra Preset (with Fixed Resolution Quality) | |
| Morefine S500+ | |
| 1920x1080 Ultra Preset (with Fixed Resolution Quality) | |
| Morefine S500+ | |
| 1920x1080 High Preset (with Fixed Resolution Quality) | |
| Morefine S500+ | |
| 1920x1080 Medium Preset (with Fixed Resolution Quality) | |
| Morefine S500+ | |
| 1920x1080 Very Low Preset (with Fixed Resolution Quality) | |
| Morefine S500+ | |
| God of War | |
| 1920x1080 Ultra Preset | |
| Morefine S500+ | |
| 1920x1080 High Preset | |
| Morefine S500+ | |
| 1920x1080 Original Preset | |
| Morefine S500+ | |
| 1920x1080 Low Preset | |
| Morefine S500+ | |
| Farming Simulator 22 | |
| 3840x2160 Very High Preset | |
| Morefine S500+ | |
| 2560x1440 Very High Preset | |
| Morefine S500+ | |
| 1920x1080 Very High Preset | |
| Morefine S500+ | |
| 1920x1080 High Preset | |
| Morefine S500+ | |
| 1920x1080 Medium Preset | |
| Morefine S500+ | |
| 1920x1080 Low Preset | |
| Morefine S500+ | |
| 1280x720 Low Preset | |
| Morefine S500+ | |
| Riders Republic | |
| 3840x2160 Ultra Preset | |
| Morefine S500+ | |
| 2560x1440 Ultra Preset | |
| Morefine S500+ | |
| 1920x1080 Ultra Preset | |
| Morefine S500+ | |
| 1920x1080 High Preset | |
| Morefine S500+ | |
| 1920x1080 Medium Preset | |
| Morefine S500+ | |
| 1920x1080 Low Preset | |
| Morefine S500+ | |
| 1280x720 Low Preset | |
| Morefine S500+ | |
| Alan Wake Remastered | |
| 3840x2160 High Preset | |
| Morefine S500+ | |
| 2560x1440 High Preset | |
| Morefine S500+ | |
| 1920x1080 High Preset | |
| Morefine S500+ | |
| 1920x1080 Medium Preset | |
| Morefine S500+ | |
| 1920x1080 Low Preset | |
| Morefine S500+ | |
| CrossMark | |
| Responsiveness | |
| Beelink GTR5 | |
| Creativity | |
| Beelink GTR5 | |
| Productivity | |
| Beelink GTR5 | |
| Overall | |
| Beelink GTR5 | |
| Far Cry 6 | |
| 3840x2160 Ultra Graphics Quality + HD Textures AA:T | |
| Morefine S500+ | |
| 2560x1440 Ultra Graphics Quality + HD Textures AA:T | |
| Morefine S500+ | |
| 1920x1080 Ultra Graphics Quality + HD Textures AA:T | |
| Morefine S500+ | |
| 1920x1080 High Graphics Quality AA:T | |
| Morefine S500+ | |
| 1920x1080 Medium Graphics Quality AA:SM | |
| Morefine S500+ | |
| 1920x1080 Low Graphics Quality | |
| Morefine S500+ | |
| 1280x720 Low Graphics Quality | |
| Morefine S500+ | |
| F1 2021 | |
| 3840x2160 Ultra High Preset + Raytracing AA:T AF:16x | |
| Morefine S500+ | |
| 2560x1440 Ultra High Preset + Raytracing AA:T AF:16x | |
| Morefine S500+ | |
| 1920x1080 Ultra High Preset + Raytracing AA:T AF:16x | |
| Morefine S500+ | |
| 1920x1080 High Preset AA:T AF:16x | |
| Morefine S500+ | |
| 1920x1080 Medium Preset AA:T AF:16x | |
| Morefine S500+ | |
| 1280x720 Ultra Low Preset | |
| Morefine S500+ | |
| V-Ray 5 Benchmark | |
| GPU CUDA | |
| Morefine S500+ | |
| CPU | |
| Morefine S500+ | |
| Intel NUC11PAQi7 | |
| Intel NUC11PHKi7C | |
| SPECviewperf 2020 | |
| 3840x2160 Solidworks (solidworks-05) | |
| Morefine S500+ | |
| 3840x2160 Siemens NX (snx-04) | |
| Morefine S500+ | |
| 3840x2160 Medical (medical-03) | |
| Morefine S500+ | |
| 3840x2160 Maya (maya-06) | |
| Morefine S500+ | |
| 3840x2160 Energy (energy-03) | |
| Morefine S500+ | |
| 3840x2160 Creo (creo-03) | |
| Morefine S500+ | |
| 3840x2160 CATIA (catia-06) | |
| Morefine S500+ | |
| 3840x2160 3ds Max (3dsmax-07) | |
| Morefine S500+ | |
| Cinebench R23 | |
| Single Core | |
| Intel NUC11PHKi7C | |
| Beelink GTR5 | |
| Morefine S500+ | |
| Beelink GTI 11 | |
| GMK NucBox 2 | |
| Multi Core | |
| Beelink GTR5 | |
| Morefine S500+ | |
| Intel NUC11PAQi7 | |
| Intel NUC11PHKi7C | |
| Beelink GTI 11 | |
| GMK NucBox 2 | |
| Unigine Superposition | |
| 7680x4320 8k Optimized | |
| Morefine S500+ | |
| 3840x2160 4k Optimized | |
| Morefine S500+ | |
| 1920x1080 1080p Extreme | |
| Morefine S500+ | |
| 1920x1080 1080p High | |
| Morefine S500+ | |
| 1280x720 720p Low | |
| Morefine S500+ | |
| Strange Brigade | |
| 3840x2160 ultra AA:ultra AF:16 | |
| Morefine S500+ | |
| 2560x1440 ultra AA:ultra AF:16 | |
| Morefine S500+ | |
| 1920x1080 ultra AA:ultra AF:16 | |
| Intel NUC11PHKi7C | |
| Morefine S500+ | |
| Beelink GTR5 | |
| Beelink GTI 11 | |
| Intel NUC11PAQi7 | |
| 1920x1080 high AA:high AF:8 | |
| Intel NUC11PHKi7C | |
| Morefine S500+ | |
| Beelink GTR5 | |
| Beelink GTI 11 | |
| Intel NUC11PAQi7 | |
| 1920x1080 medium AA:medium AF:4 | |
| Intel NUC11PHKi7C | |
| Morefine S500+ | |
| Beelink GTR5 | |
| Beelink GTI 11 | |
| Intel NUC11PAQi7 | |
| 1280x720 lowest AF:1 | |
| Intel NUC11PHKi7C | |
| Morefine S500+ | |
| Beelink GTR5 | |
| Beelink GTI 11 | |
| Intel NUC11PAQi7 | |
| F1 2020 | |
| 3840x2160 Ultra High Preset AA:T AF:16x | |
| Morefine S500+ | |
| 2560x1440 Ultra High Preset AA:T AF:16x | |
| Morefine S500+ | |
| 1920x1080 Ultra High Preset AA:T AF:16x | |
| Morefine S500+ | |
| 1920x1080 High Preset AA:T AF:16x | |
| Morefine S500+ | |
| 1920x1080 Medium Preset AF:16x | |
| Morefine S500+ | |
| 1280x720 Ultra Low Preset | |
| Morefine S500+ | |
| V-Ray Benchmark Next 4.10 | |
| GPU | |
| Intel NUC11PHKi7C | |
| Morefine S500+ | |
| Intel NUC11PAQi7 | |
| CPU | |
| Morefine S500+ | |
| Intel NUC11PAQi7 | |
| Intel NUC11PHKi7C | |
| LibreOffice - 20 Documents To PDF | |
| GMK NucBox 2 | |
| Beelink GTI 11 | |
| Morefine S500+ | |
| Beelink GTR5 | |
| Intel NUC11PHKi7C | |
| Intel NUC11PAQi7 | |
| DPC Latencies / LatencyMon - interrupt to process latency (max), Web, Youtube, Prime95 | |
| Morefine S500+ | |
| Intel NUC11PHKi7C | |
| GMK NucBox 2 | |
| Intel NUC11PAQi7 | |
| Beelink GTI 11 | |
| Beelink GTR5 | |
| Youtube - 2160p60 CPU Load | |
| GMK NucBox 2 (31, 2) | |
| Intel NUC11PAQi7 (32) | |
| Beelink GTI 11 (33) | |
| Intel NUC11PHKi7C (30) | |
| Beelink GTR5 (7, 3) | |
| R Benchmark 2.5 - Overall mean | |
| GMK NucBox 2 | |
| Beelink GTI 11 | |
| Intel NUC11PHKi7C | |
| Intel NUC11PAQi7 | |
| Morefine S500+ | |
| Beelink GTR5 | |
| Borderlands 3 | |
| 3840x2160 Badass Overall Quality (DX11) | |
| Morefine S500+ | |
| 2560x1440 Badass Overall Quality (DX11) | |
| Morefine S500+ | |
| 1920x1080 Badass Overall Quality (DX11) | |
| Morefine S500+ | |
| 1920x1080 High Overall Quality (DX11) | |
| Morefine S500+ | |
| 1920x1080 Medium Overall Quality (DX11) | |
| Morefine S500+ | |
| 1920x1080 Very Low Overall Quality (DX11) | |
| Morefine S500+ | |
| 1280x720 Very Low Overall Quality (DX11) | |
| Morefine S500+ | |
| Geekbench 5.0 | |
| OpenCL Score 5.0 | |
| Intel NUC11PHKi7C | |
| Morefine S500+ | |
| Intel NUC11PAQi7 | |
| GMK NucBox 2 | |
| 5.0 Multi-Core | |
| Morefine S500+ | |
| Intel NUC11PHKi7C | |
| Intel NUC11PAQi7 | |
| GMK NucBox 2 | |
| 5.0 Single-Core | |
| Intel NUC11PAQi7 | |
| Intel NUC11PHKi7C | |
| Morefine S500+ | |
| GMK NucBox 2 | |
| Jetstream 2 - 2.0 Total | |
| Beelink GTI 11 | |
| Intel NUC11PHKi7C | |
| GMK NucBox 2 | |
| Cinebench R20 | |
| CPU (Single Core) | |
| Intel NUC11PHKi7C | |
| Intel NUC11PAQi7 | |
| Beelink GTR5 | |
| Morefine S500+ | |
| Beelink GTI 11 | |
| GMK NucBox 2 | |
| CPU (Multi Core) | |
| Beelink GTR5 | |
| Morefine S500+ | |
| Intel NUC11PAQi7 | |
| Beelink GTI 11 | |
| Intel NUC11PHKi7C | |
| GMK NucBox 2 | |
| Metro Exodus | |
| 3840x2160 Ultra Quality AF:16x | |
| Morefine S500+ | |
| 2560x1440 Ultra Quality AF:16x | |
| Morefine S500+ | |
| 1920x1080 Ultra Quality AF:16x | |
| Morefine S500+ | |
| 1920x1080 High Quality AF:16x | |
| Morefine S500+ | |
| 1920x1080 Medium Quality AF:4x | |
| Morefine S500+ | |
| 1280x720 Low Quality AF:4x | |
| Morefine S500+ | |
| Far Cry New Dawn | |
| 3840x2160 Ultra Preset | |
| Morefine S500+ | |
| 2560x1440 Ultra Preset | |
| Morefine S500+ | |
| 1920x1080 Ultra Preset | |
| Morefine S500+ | |
| 1920x1080 High Preset | |
| Morefine S500+ | |
| 1920x1080 Medium Preset | |
| Morefine S500+ | |
| 1280x720 Low Preset | |
| Morefine S500+ | |
| SPECviewperf 13 | |
| Solidworks (sw-04) | |
| Morefine S500+ | |
| Siemens NX (snx-03) | |
| Morefine S500+ | |
| Showcase (showcase-02) | |
| Morefine S500+ | |
| Medical (medical-02) | |
| Morefine S500+ | |
| Maya (maya-05) | |
| Morefine S500+ | |
| Energy (energy-02) | |
| Morefine S500+ | |
| Creo (creo-02) | |
| Morefine S500+ | |
| Catia (catia-05) | |
| Morefine S500+ | |
| 3ds Max (3dsmax-06) | |
| Morefine S500+ | |
| HWBOT x265 Benchmark v2.2 - 4k Preset | |
| Beelink GTR5 | |
| Morefine S500+ | |
| Intel NUC11PAQi7 | |
| Intel NUC11PHKi7C | |
| Beelink GTI 11 | |
| GMK NucBox 2 | |
| Far Cry 5 | |
| 3840x2160 Ultra Preset AA:T | |
| Morefine S500+ | |
| 2560x1440 Ultra Preset AA:T | |
| Morefine S500+ | |
| 1920x1080 Ultra Preset AA:T | |
| Morefine S500+ | |
| Beelink GTR5 | |
| Beelink GTI 11 | |
| 1920x1080 High Preset AA:T | |
| Morefine S500+ | |
| Beelink GTR5 | |
| Beelink GTI 11 | |
| 1920x1080 Medium Preset AA:T | |
| Morefine S500+ | |
| Beelink GTR5 | |
| Beelink GTI 11 | |
| 1920x1080 Low Preset AA:T | |
| Morefine S500+ | |
| Beelink GTR5 | |
| Beelink GTI 11 | |
| 1280x720 Low Preset AA:T | |
| Morefine S500+ | |
| Beelink GTR5 | |
| Beelink GTI 11 | |
| WebXPRT 3 - Overall | |
| Beelink GTR5 | |
| Morefine S500+ | |
| Intel NUC11PHKi7C | |
| Intel NUC11PAQi7 | |
| Beelink GTI 11 | |
| GMK NucBox 2 | |
| X-Plane 11.11 | |
| 3840x2160 high (fps_test=3) | |
| Morefine S500+ | |
| 1920x1080 high (fps_test=3) | |
| Intel NUC11PHKi7C | |
| Beelink GTR5 | |
| Morefine S500+ | |
| Intel NUC11PAQi7 | |
| Beelink GTI 11 | |
| GMK NucBox 2 | |
| 1920x1080 med (fps_test=2) | |
| Intel NUC11PHKi7C | |
| Morefine S500+ | |
| Beelink GTR5 | |
| Intel NUC11PAQi7 | |
| Beelink GTI 11 | |
| GMK NucBox 2 | |
| 1280x720 low (fps_test=1) | |
| Intel NUC11PHKi7C | |
| Beelink GTR5 | |
| Morefine S500+ | |
| Intel NUC11PAQi7 | |
| GMK NucBox 2 | |
| Beelink GTI 11 | |
| Final Fantasy XV Benchmark | |
| 3840x2160 High Quality | |
| Morefine S500+ | |
| 2560x1440 High Quality | |
| Morefine S500+ | |
| 1920x1080 High Quality | |
| Intel NUC11PHKi7C | |
| Morefine S500+ | |
| Beelink GTR5 | |
| Beelink GTI 11 | |
| Intel NUC11PAQi7 | |
| GMK NucBox 2 | |
| 1920x1080 Standard Quality | |
| Intel NUC11PHKi7C | |
| Morefine S500+ | |
| Beelink GTR5 | |
| Beelink GTI 11 | |
| Intel NUC11PAQi7 | |
| GMK NucBox 2 | |
| 1280x720 Lite Quality | |
| Intel NUC11PHKi7C | |
| Morefine S500+ | |
| Beelink GTR5 | |
| Beelink GTI 11 | |
| Intel NUC11PAQi7 | |
| GMK NucBox 2 | |
| Blender - v2.79 BMW27 CPU | |
| GMK NucBox 2 | |
| Beelink GTI 11 | |
| Intel NUC11PHKi7C | |
| Intel NUC11PAQi7 | |
| Morefine S500+ | |
| Beelink GTR5 | |
| VRMark | |
| Cyan Room | |
| Morefine S500+ | |
| Blue Room | |
| Morefine S500+ | |
| Orange Room | |
| Morefine S500+ | |
| Geekbench 4.4 | |
| Compute OpenCL Score | |
| Intel NUC11PHKi7C | |
| Intel NUC11PAQi7 | |
| GMK NucBox 2 | |
| Morefine S500+ | |
| 64 Bit Multi-Core Score | |
| Morefine S500+ | |
| Intel NUC11PHKi7C | |
| Intel NUC11PAQi7 | |
| GMK NucBox 2 | |
| 64 Bit Single-Core Score | |
| Intel NUC11PHKi7C | |
| Intel NUC11PAQi7 | |
| Morefine S500+ | |
| GMK NucBox 2 | |
| Power Consumption | |
| Witcher 3 ultra Efficiency (external Monitor) | |
| Morefine S500+ | |
| Beelink GTR5 | |
| Idle 1min (external Monitor) | |
| Morefine S500+ | |
| Witcher 3 ultra Efficiency | |
| Intel NUC11PHKi7C | |
| Beelink GTR5 | |
| Intel NUC11PAQi7 | |
| Beelink GTI 11 | |
| Cinebench R15 Multi Efficiency (external Monitor) | |
| Morefine S500+ | |
| Beelink GTR5 | |
| Beelink GTI 11 | |
| 1280x720 Prime95 28.10 and Furmark 1.25 | |
| Beelink GTR5 | |
| Morefine S500+ | |
| Beelink GTI 11 | |
| Witcher 3 ultra | |
| Intel NUC11PHKi7C | |
| Beelink GTR5 | |
| Beelink GTI 11 | |
| Intel NUC11PAQi7 | |
| Prime95 V2810 Stress (external Monitor) | |
| Beelink GTR5 | |
| Morefine S500+ | |
| Beelink GTI 11 | |
| Cinebench R15 Multi (external Monitor) | |
| Beelink GTR5 | |
| Morefine S500+ | |
| Beelink GTI 11 | |
| 1280x720 FurMark 1.19 GPU Stress Test (external Monitor) | |
| Beelink GTR5 | |
| Morefine S500+ | |
| Beelink GTI 11 | |
| 1920x1080 The Witcher 3 ultra (external Monitor) | |
| Beelink GTR5 | |
| Morefine S500+ | |
| Dota 2 Reborn | |
| 3840x2160 ultra (3/3) best looking | |
| Morefine S500+ | |
| 1920x1080 ultra (3/3) best looking | |
| Intel NUC11PHKi7C | |
| Morefine S500+ | |
| Beelink GTR5 | |
| Beelink GTI 11 | |
| Intel NUC11PAQi7 | |
| GMK NucBox 2 | |
| 1920x1080 high (2/3) | |
| Intel NUC11PHKi7C | |
| Morefine S500+ | |
| Beelink GTR5 | |
| Beelink GTI 11 | |
| Intel NUC11PAQi7 | |
| GMK NucBox 2 | |
| 1366x768 med (1/3) | |
| Intel NUC11PHKi7C | |
| Beelink GTR5 | |
| Morefine S500+ | |
| Beelink GTI 11 | |
| GMK NucBox 2 | |
| Intel NUC11PAQi7 | |
| 1280x720 min (0/3) fastest | |
| Intel NUC11PHKi7C | |
| Morefine S500+ | |
| Beelink GTR5 | |
| Beelink GTI 11 | |
| GMK NucBox 2 | |
| Intel NUC11PAQi7 | |
| Emissions | |
| Fan Noise The Witcher 3 ultra | |
| Beelink GTI 11 | |
| Beelink GTR5 | |
| Intel NUC11PHKi7C | |
| Intel NUC11PAQi7 | |
| Fan Noise | |
| Beelink GTI 11 | |
| Intel NUC11PAQi7 | |
| Beelink GTR5 | |
| Intel NUC11PHKi7C | |
| Morefine S500+ | |
| GMK NucBox 2 | |
| Networking | |
| iperf3 receive AX12 | |
| Beelink GTI 11 | |
| Intel NUC11PHKi7C | |
| Intel NUC11PAQi7 | |
| Beelink GTR5 | |
| GMK NucBox 2 | |
| iperf3 transmit AX12 | |
| Beelink GTI 11 | |
| Intel NUC11PHKi7C | |
| Beelink GTR5 | |
| Intel NUC11PAQi7 | |
| GMK NucBox 2 | |
| Unigine Valley 1.0 | |
| 1920x1080 Extreme HD DirectX AA:x8 | |
| Morefine S500+ | |
| 1920x1080 Extreme HD Preset OpenGL AA:x8 | |
| Morefine S500+ | |
| SD Card Reader | |
| average JPG Copy Test (av. of 3 runs) | |
| Intel NUC11PAQi7 | |
| Intel NUC11PHKi7C | |
| GMK NucBox 2 | |
| maximum AS SSD Seq Read Test (1GB) | |
| Intel NUC11PHKi7C | |
| Intel NUC11PAQi7 | |
| GMK NucBox 2 | |
| JetStream 1.1 - 1.1 Total | |
| Beelink GTR5 | |
| The Witcher 3 | |
| 1920x1080 Ultra Graphics & Postprocessing (HBAO+) | |
| Intel NUC11PHKi7C | |
| Morefine S500+ | |
| Beelink GTR5 | |
| Beelink GTI 11 | |
| Intel NUC11PAQi7 | |
| 1920x1080 High Graphics & Postprocessing (Nvidia HairWorks Off) | |
| Intel NUC11PHKi7C | |
| Beelink GTR5 | |
| Morefine S500+ | |
| Beelink GTI 11 | |
| Intel NUC11PAQi7 | |
| 1366x768 Medium Graphics & Postprocessing | |
| Intel NUC11PHKi7C | |
| Beelink GTR5 | |
| Morefine S500+ | |
| Beelink GTI 11 | |
| Intel NUC11PAQi7 | |
| 1024x768 Low Graphics & Postprocessing | |
| Intel NUC11PHKi7C | |
| Beelink GTR5 | |
| Morefine S500+ | |
| Beelink GTI 11 | |
| Intel NUC11PAQi7 | |
| GTA V | |
| 3840x2160 High/On (Advanced Graphics Off) AA:FX AF:8x | |
| Morefine S500+ | |
| 3840x2160 Highest AA:4xMSAA + FX AF:16x | |
| Morefine S500+ | |
| 2560x1440 Highest AA:4xMSAA + FX AF:16x | |
| Morefine S500+ | |
| 1920x1080 Highest AA:4xMSAA + FX AF:16x | |
| Intel NUC11PHKi7C | |
| Morefine S500+ | |
| Beelink GTR5 | |
| Beelink GTI 11 | |
| Intel NUC11PAQi7 | |
| 1920x1080 High/On (Advanced Graphics Off) AA:2xMSAA + FX AF:8x | |
| Intel NUC11PHKi7C | |
| Morefine S500+ | |
| Beelink GTR5 | |
| Beelink GTI 11 | |
| Intel NUC11PAQi7 | |
| 1920x1080 Normal/Off AF:4x | |
| Intel NUC11PHKi7C | |
| Morefine S500+ | |
| Beelink GTR5 | |
| Beelink GTI 11 | |
| Intel NUC11PAQi7 | |
| 1366x768 Normal/Off AF:4x | |
| Intel NUC11PHKi7C | |
| Beelink GTR5 | |
| Morefine S500+ | |
| Beelink GTI 11 | |
| Intel NUC11PAQi7 | |
| 1920x1080 Lowest Settings possible | |
| Intel NUC11PHKi7C | |
| Morefine S500+ | |
| Beelink GTR5 | |
| Beelink GTI 11 | |
| Intel NUC11PAQi7 | |
| 1024x768 Lowest Settings possible | |
| Intel NUC11PHKi7C | |
| Beelink GTR5 | |
| Morefine S500+ | |
| Beelink GTI 11 | |
| Intel NUC11PAQi7 | |
| Unigine Heaven 4.0 | |
| Extreme Preset OpenGL | |
| Morefine S500+ | |
| Extreme Preset DX11 | |
| Morefine S500+ | |
| Mozilla Kraken 1.1 - Total | |
| GMK NucBox 2 | |
| Beelink GTI 11 | |
| Intel NUC11PHKi7C | |
| Intel NUC11PAQi7 | |
| Morefine S500+ | |
| Beelink GTR5 | |
| PCMark 8 | |
| Work Score Accelerated v2 | |
| Intel NUC11PAQi7 | |
| Home Score Accelerated v2 | |
| Intel NUC11PAQi7 | |
| ComputeMark v2.1 | |
| 1024x600 Normal, QJuliaRayTrace | |
| Morefine S500+ | |
| 1024x600 Normal, Mandel Scalar | |
| Morefine S500+ | |
| 1024x600 Normal, Mandel Vector | |
| Morefine S500+ | |
| 1024x600 Normal, Fluid 2DTexArr | |
| Morefine S500+ | |
| 1024x600 Normal, Fluid 3DTex | |
| Morefine S500+ | |
| 1024x600 Normal, Score | |
| Morefine S500+ | |
| LuxMark v2.0 64Bit | |
| Room GPUs-only | |
| Morefine S500+ | |
| Sala GPUs-only | |
| Morefine S500+ | |
| TrueCrypt | |
| Serpent Mean 100MB | |
| Morefine S500+ | |
| Twofish Mean 100MB | |
| Morefine S500+ | |
| AES Mean 100MB | |
| Morefine S500+ | |
| X264 HD Benchmark 4.0 | |
| Pass 2 | |
| Morefine S500+ | |
| Pass 1 | |
| Morefine S500+ | |
| WinRAR - Result | |
| Morefine S500+ | |
| wPrime 2.10 | |
| 1024m | |
| Morefine S500+ | |
| 32m | |
| Morefine S500+ | |
| 3DMark 11 | |
| 1280x720 Performance Combined | |
| Intel NUC11PHKi7C | |
| Beelink GTI 11 | |
| Morefine S500+ | |
| Beelink GTR5 | |
| Intel NUC11PAQi7 | |
| GMK NucBox 2 | |
| 1280x720 Performance Physics | |
| Morefine S500+ | |
| Beelink GTR5 | |
| Intel NUC11PHKi7C | |
| Beelink GTI 11 | |
| Intel NUC11PAQi7 | |
| GMK NucBox 2 | |
| 1280x720 Performance GPU | |
| Intel NUC11PHKi7C | |
| Morefine S500+ | |
| Beelink GTR5 | |
| Intel NUC11PAQi7 | |
| Beelink GTI 11 | |
| GMK NucBox 2 | |
| 1280x720 Performance | |
| Intel NUC11PHKi7C | |
| Morefine S500+ | |
| Beelink GTR5 | |
| Intel NUC11PAQi7 | |
| Beelink GTI 11 | |
| GMK NucBox 2 | |
| 3DMark Vantage | |
| 1280x1024 P CPU no PhysX | |
| Morefine S500+ | |
| 1280x1024 P GPU no PhysX | |
| Morefine S500+ | |
| 1280x1024 P Result | |
| Morefine S500+ | |
| 3DMark 06 - 1280x1024 Standard Score AA:0x AF:0x | |
| Morefine S500+ | |
| 3DMark 06 - CPU - CPU Score | |
| Morefine S500+ | |
| 3DMark 05 - 1024x768 Standard AA:0x AF:0x | |
| Morefine S500+ | |
| SPECviewperf 12 | |
| 1900x1060 Solidworks (sw-03) | |
| Morefine S500+ | |
| 1900x1060 Siemens NX (snx-02) | |
| Morefine S500+ | |
| 1900x1060 Showcase (showcase-01) | |
| Morefine S500+ | |
| 1900x1060 Medical (medical-01) | |
| Morefine S500+ | |
| 1900x1060 Maya (maya-04) | |
| Morefine S500+ | |
| 1900x1060 Energy (energy-01) | |
| Morefine S500+ | |
| 1900x1060 Creo (creo-01) | |
| Morefine S500+ | |
| 1900x1060 Catia (catia-04) | |
| Morefine S500+ | |
| 1900x1060 3ds Max (3dsmax-05) | |
| Morefine S500+ | |
| Cinebench R11.5 | |
| CPU Single 32Bit | |
| Morefine S500+ | |
| CPU Multi 32Bit | |
| Morefine S500+ | |
| OpenGL 32Bit | |
| Morefine S500+ | |
| CPU Single 64Bit | |
| Morefine S500+ | |
| CPU Multi 64Bit | |
| Morefine S500+ | |
| OpenGL 64Bit | |
| Morefine S500+ | |
| Cinebench R10 | |
| Shading 64Bit | |
| Morefine S500+ | |
| Rendering Multiple CPUs 64Bit | |
| Morefine S500+ | |
| Rendering Single CPUs 64Bit | |
| Morefine S500+ | |
| Shading 32Bit | |
| Morefine S500+ | |
| Rendering Multiple CPUs 32Bit | |
| Morefine S500+ | |
| Rendering Single 32Bit | |
| Morefine S500+ | |
| Super Pi mod 1.5 XS 1M - 1M | |
| Morefine S500+ | |
| Super Pi mod 1.5 XS 2M - 2M | |
| Morefine S500+ | |
| Super Pi Mod 1.5 XS 32M - 32M | |
| Morefine S500+ | |
* ... Meglio usare valori piccoli
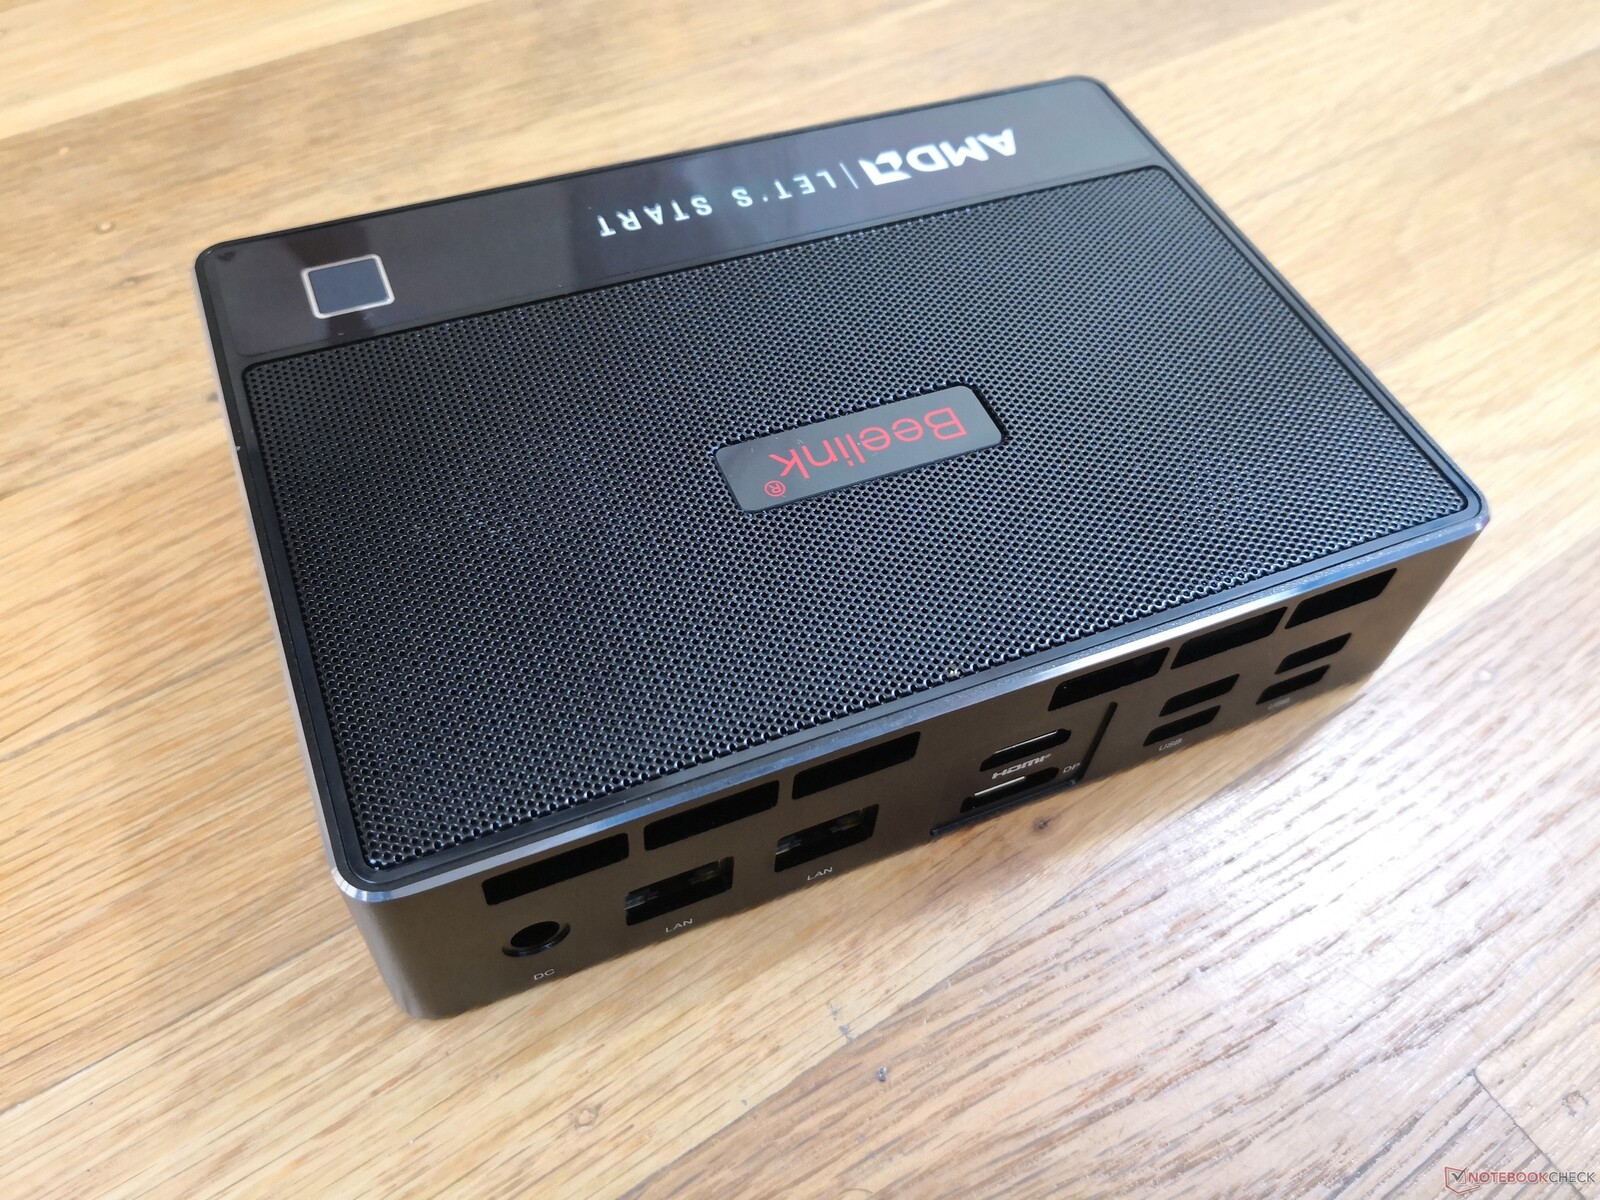
Connettività
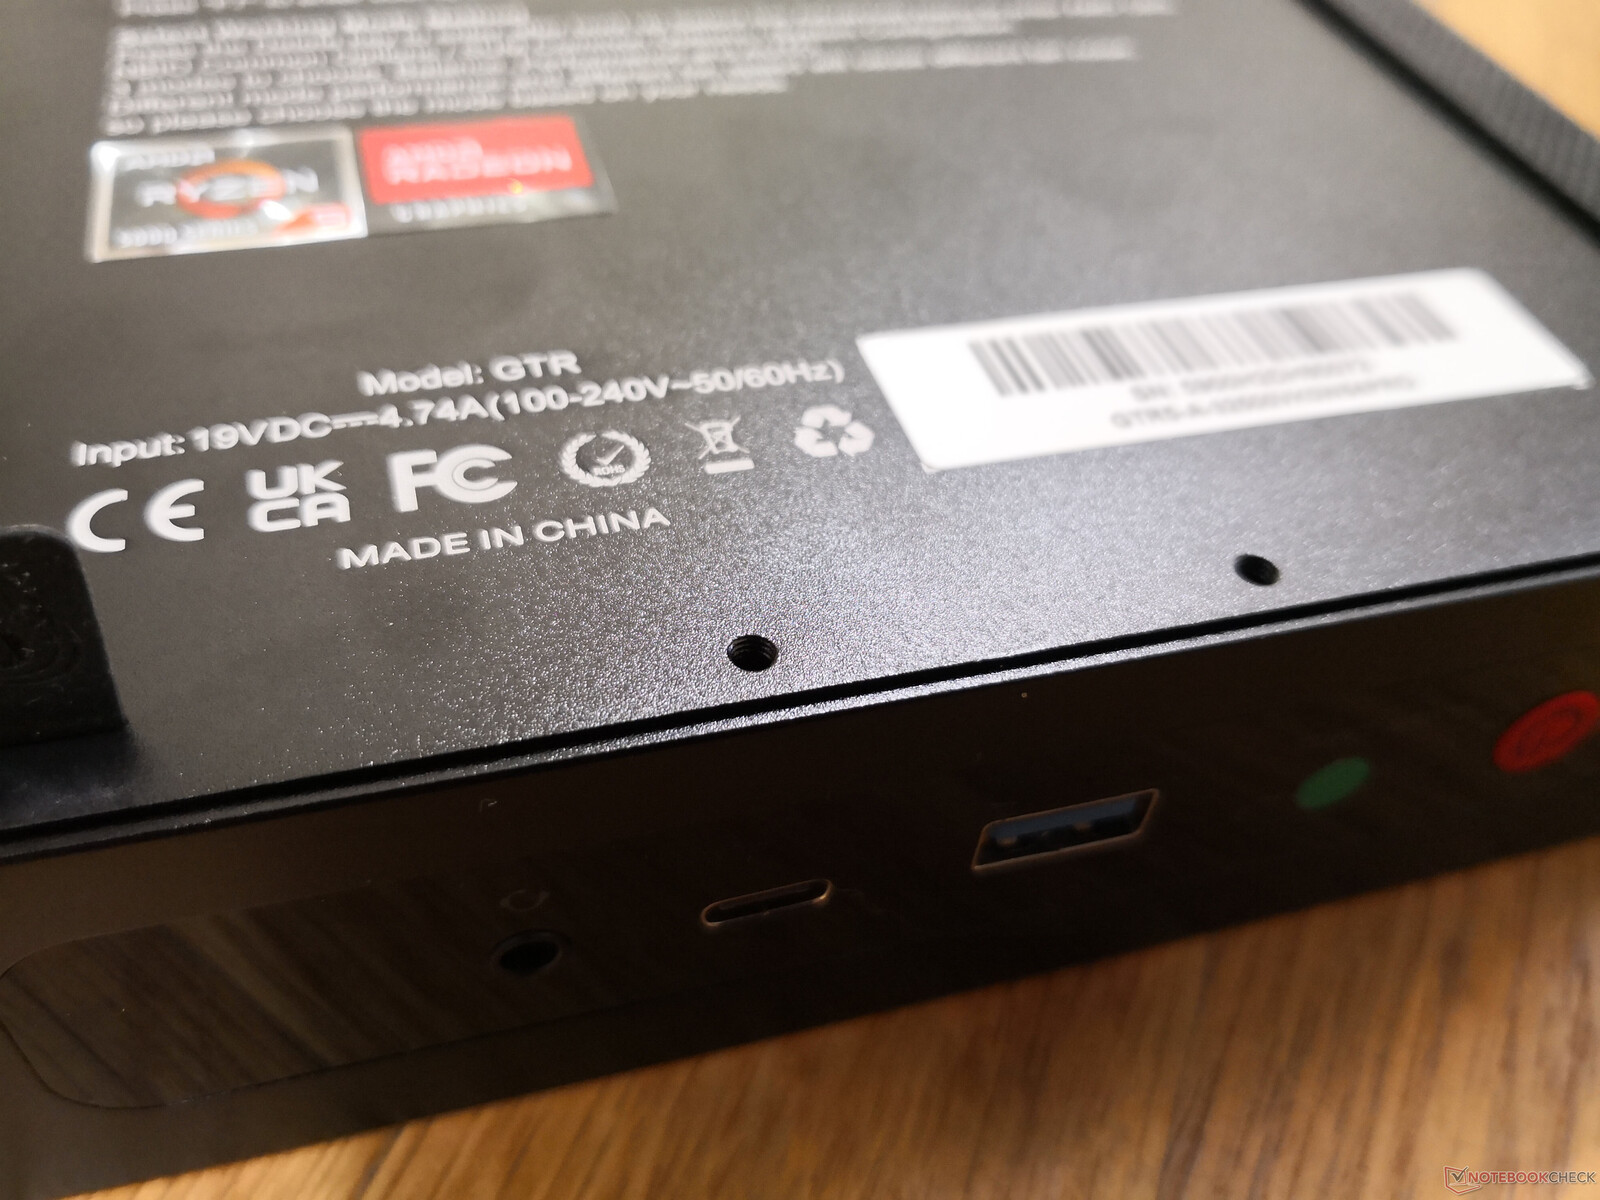
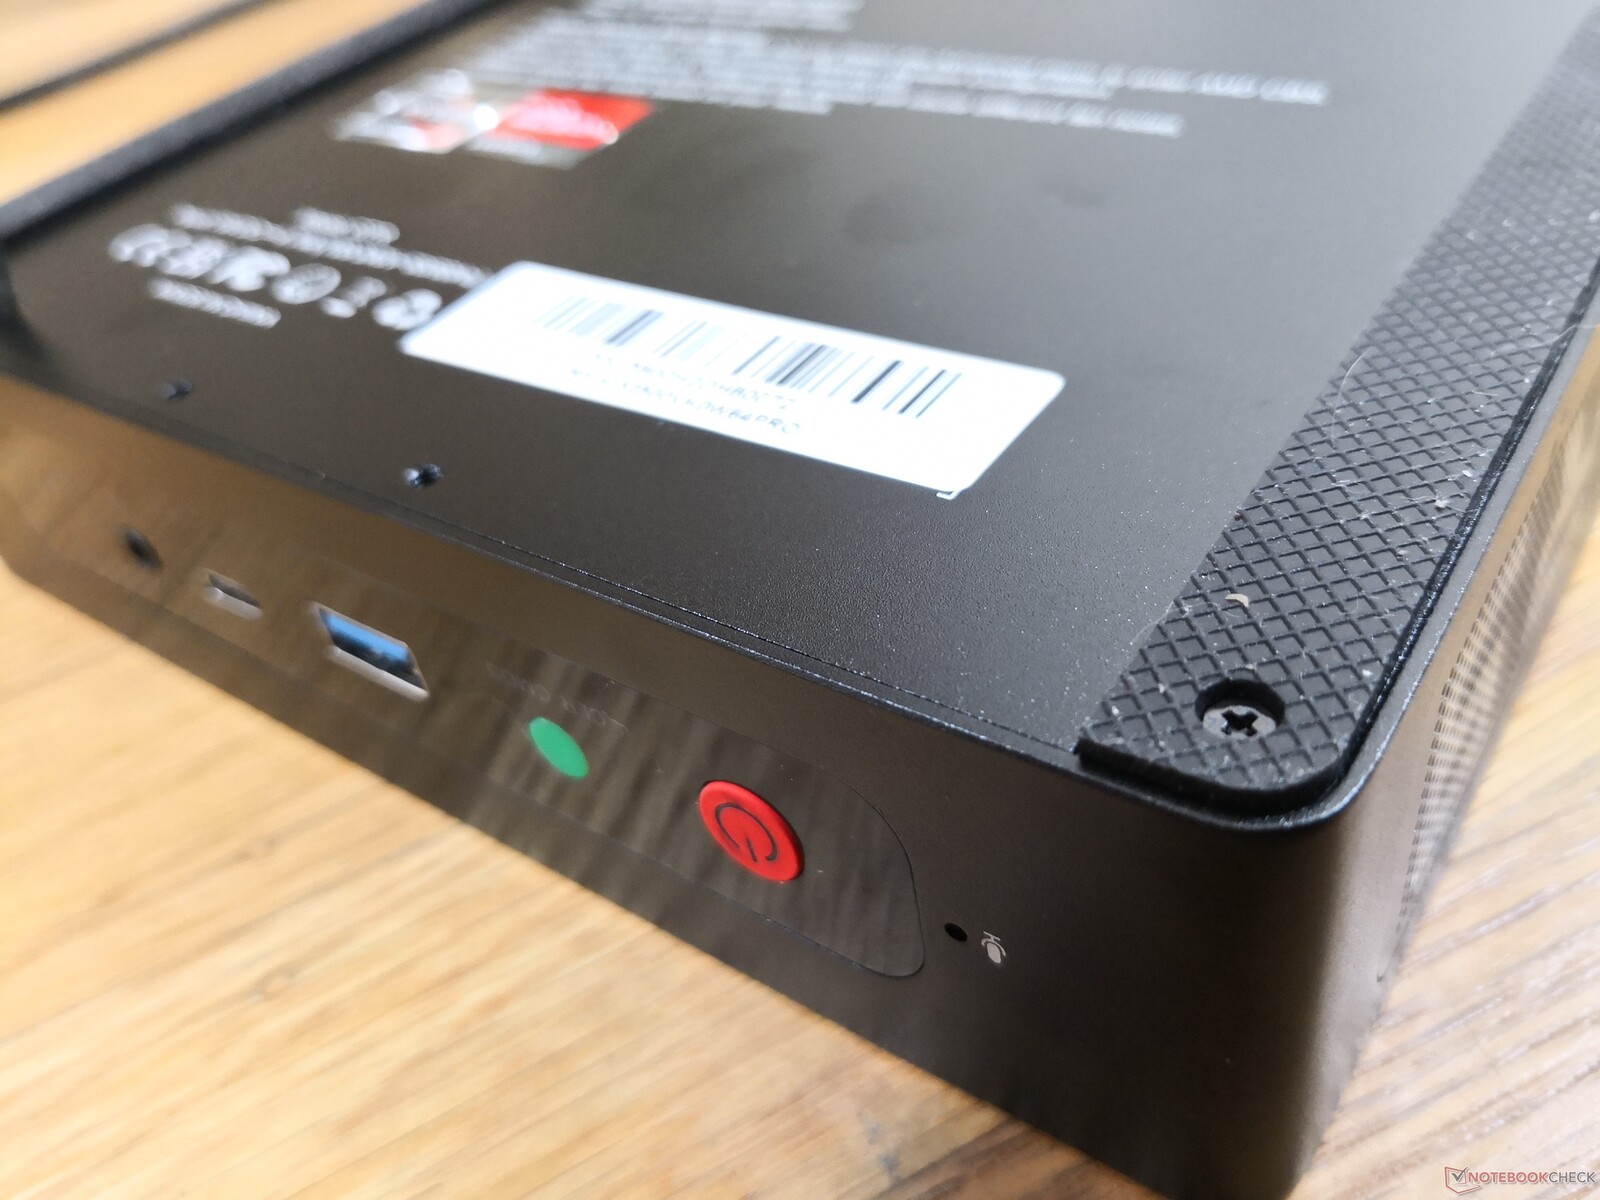
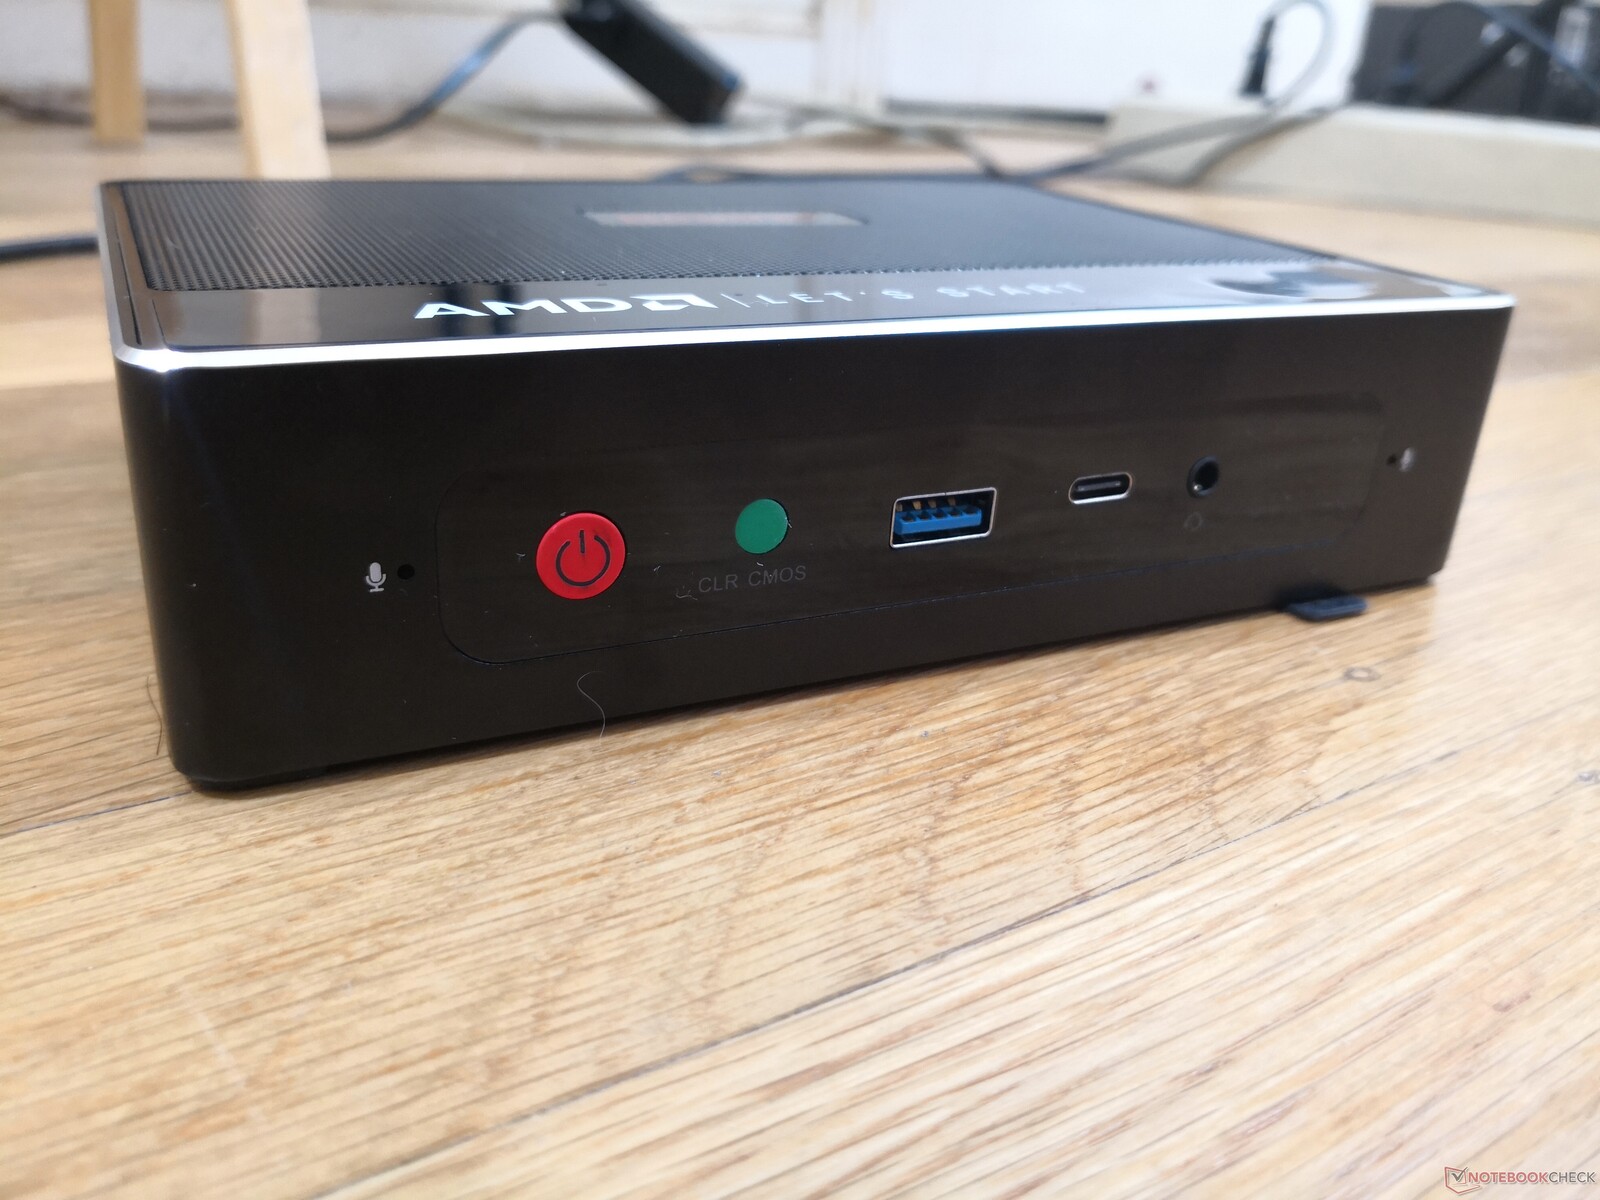
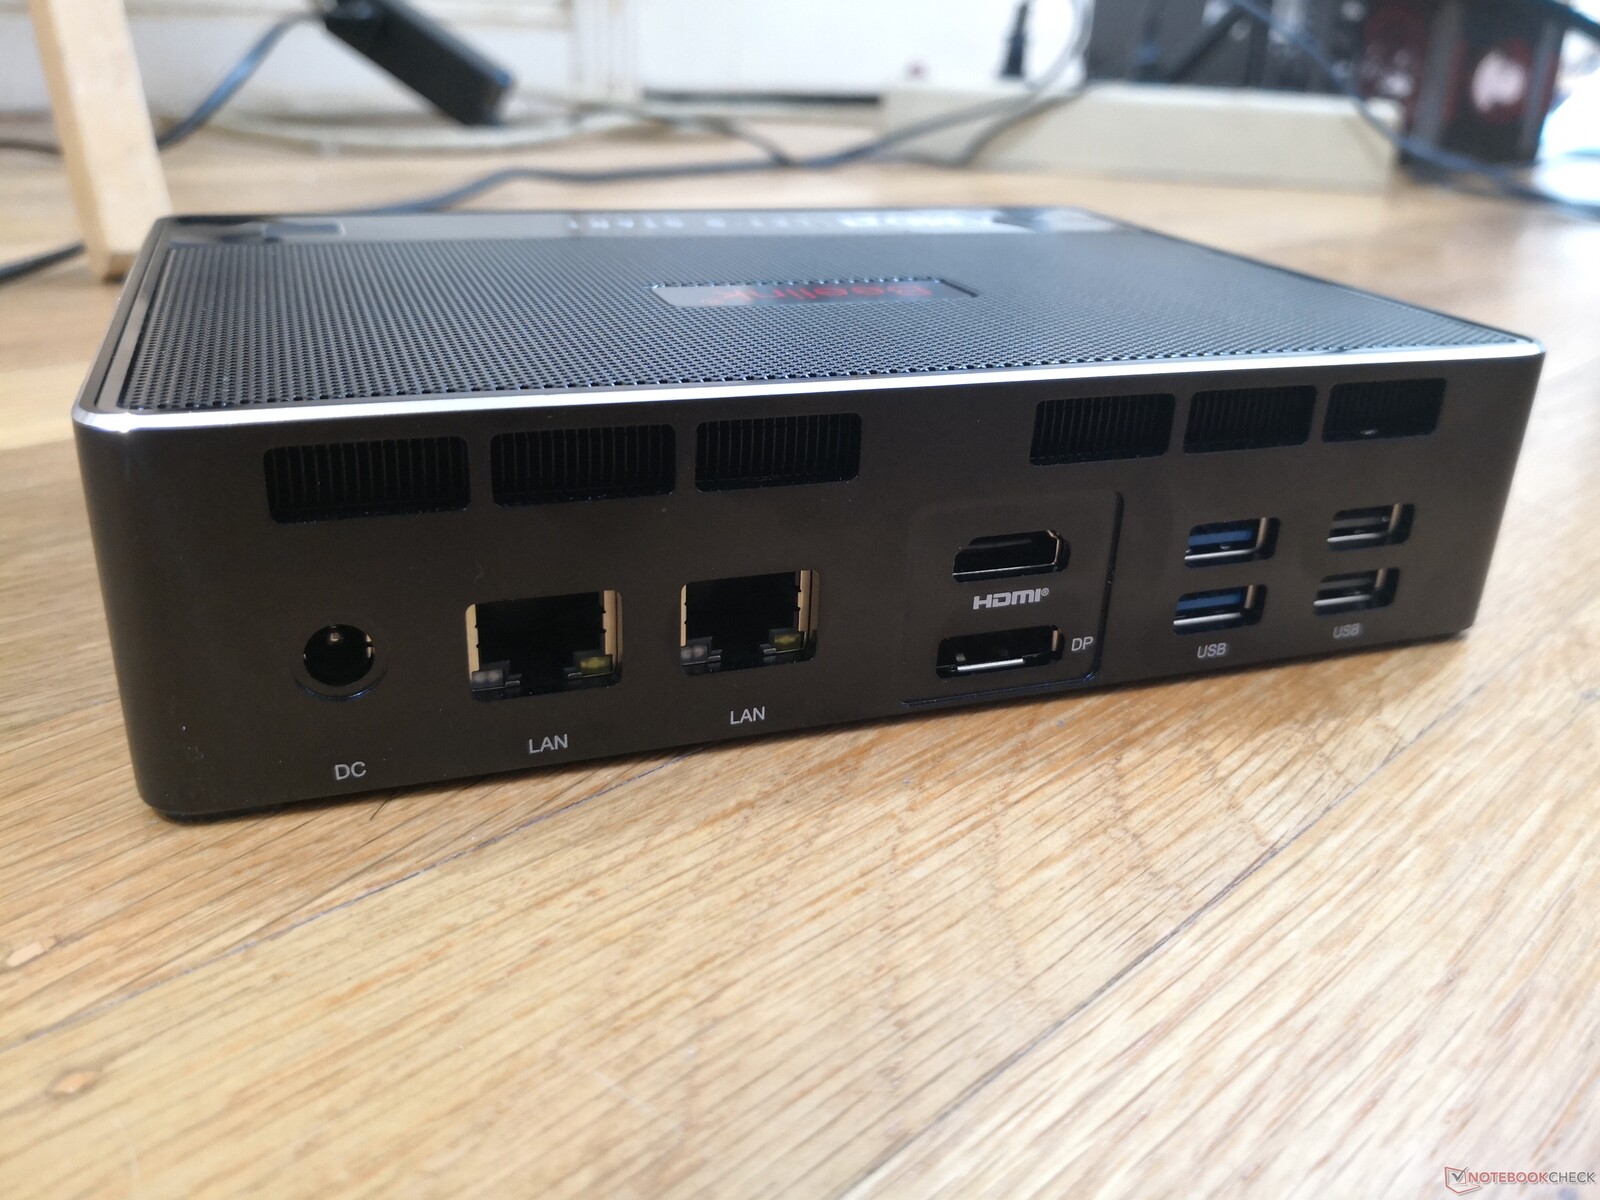
Le opzioni delle porte sono identiche al Beelink GTI 11 salvo due importanti distinzioni: il nostro GTR5 alimentato da AMD non ha il supporto Thunderbolt e una porta USB-A extra. Avremmo preferito più porte USB-C come sul NUC11PHKi7C Intel Phantom Canyon o almeno un lettore di schede SD integrato
È interessante notare che il sistema può essere alimentato da USB-C se si dovesse mai perdere l'adattatore AC proprietario da 90 W. Abbiamo collegato il nostro Dell XPS 15 9575 130 W USB-C al GTR5 e si è acceso senza problemi. Tuttavia, si consiglia di utilizzare l'adattatore AC proprietario da 90 W quando possibile, dal momento che la maggior parte degli adattatori USB-C di terze parti hanno uscite di potenza molto inferiori.
Comunicazione
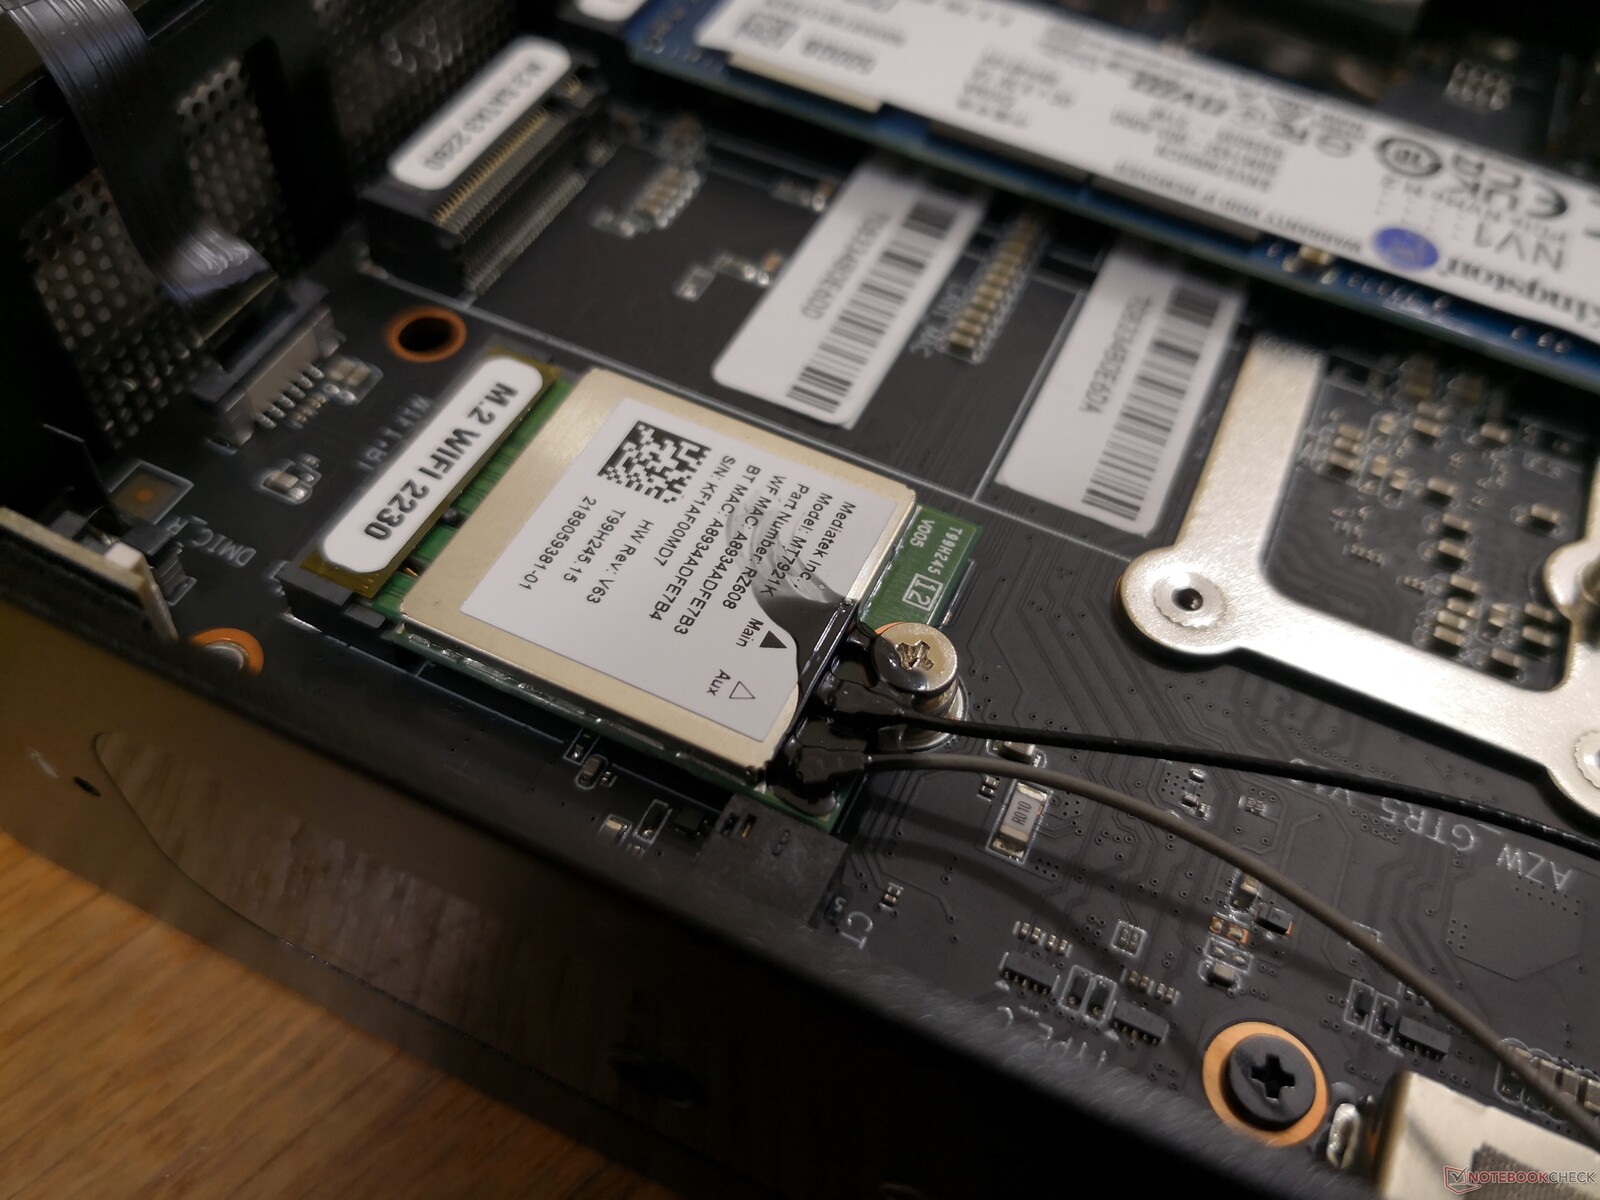
Il GTR5 è uno dei primi mini PC a utilizzare il MediaTek RZ608 invece della più tipica serie Intel AX200 o Qualcomm Atheros. Il modulo è capace di velocità Wi-Fi 6E, ma siamo limitati al nostro Netgear RAX200 Wi-Fi 6 per ora. Le velocità di trasferimento sono comunque affidabili.
| Networking | |
| iperf3 transmit AX12 | |
| Beelink GTI 11 | |
| Intel NUC11PHKi7C | |
| Beelink GTR5 | |
| Intel NUC11PAQi7 | |
| GMK NucBox 2 | |
| Beelink GK Mini | |
| iperf3 receive AX12 | |
| Beelink GTI 11 | |
| Intel NUC11PHKi7C | |
| Intel NUC11PAQi7 | |
| Beelink GTR5 | |
| GMK NucBox 2 | |
| Beelink GK Mini | |
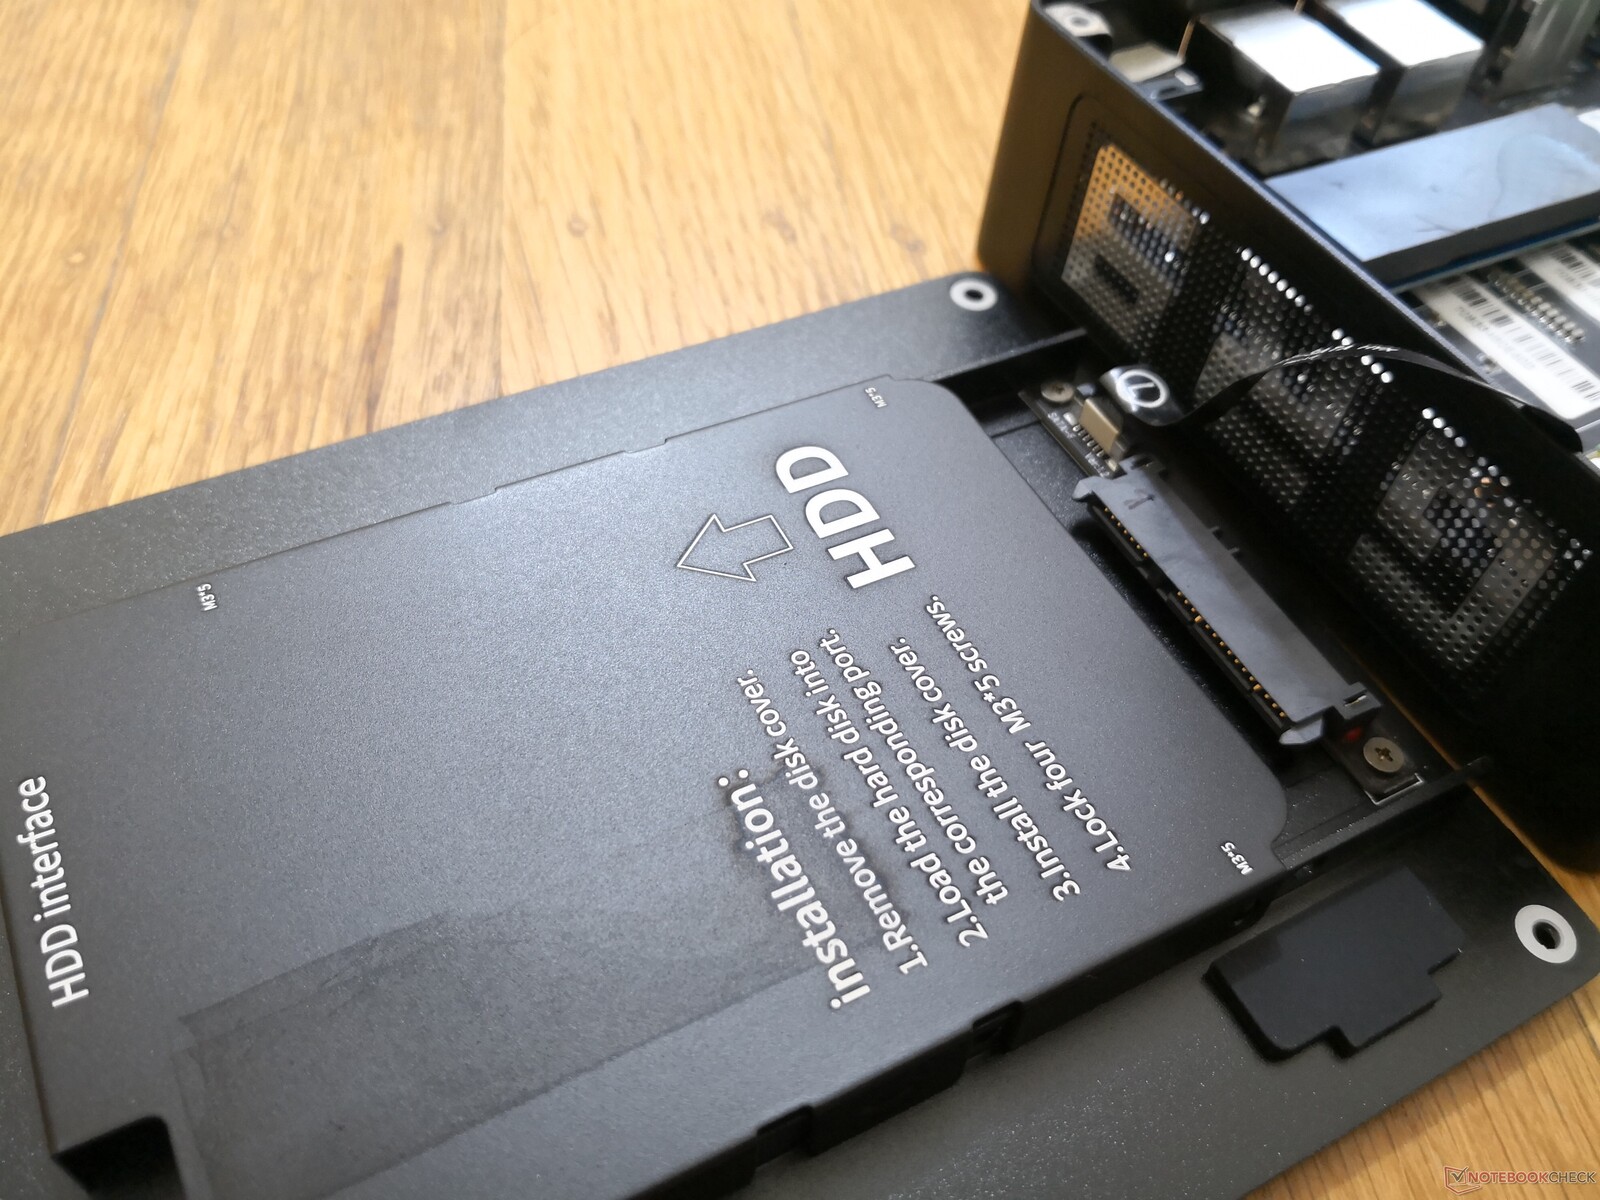
Manutenzione
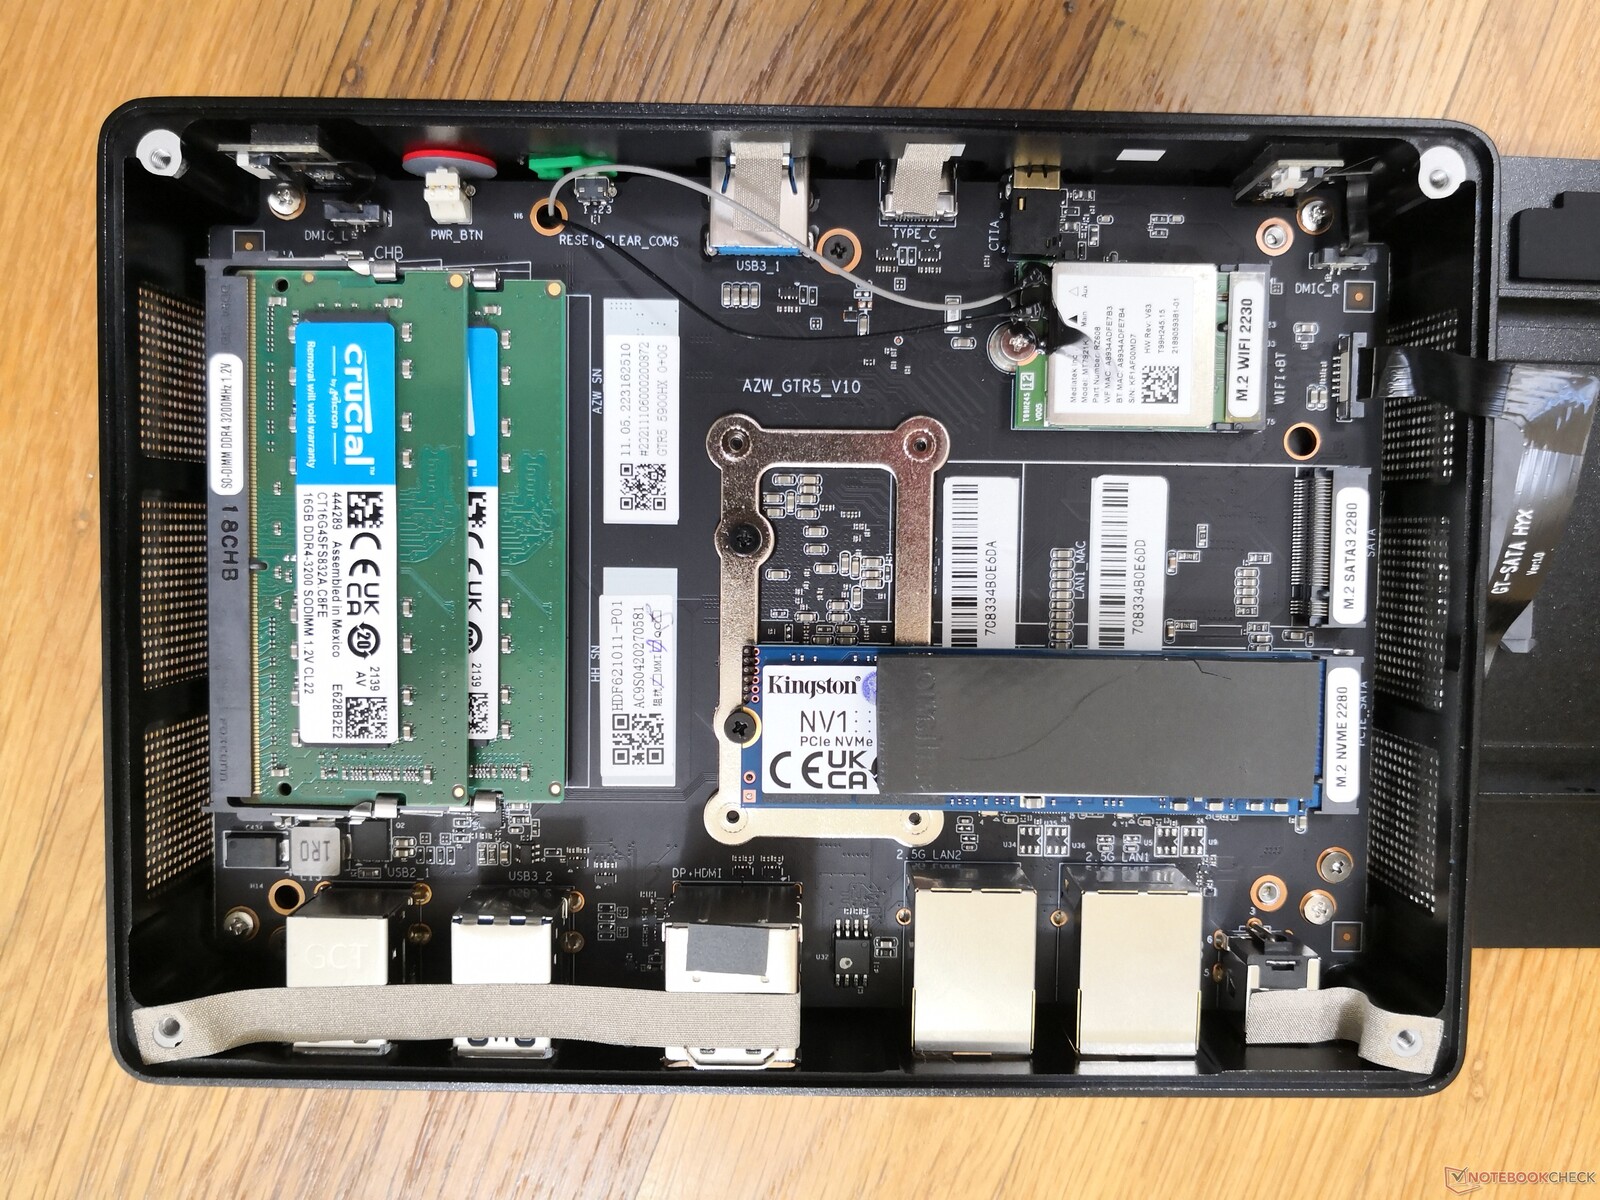
Il pannello inferiore è fissato da solo quattro viti Philips per una facile manutenzione. A differenza delle viti a pollice su un Intel NUC, tuttavia, le viti qui sono molto più piccole e richiedono un cacciavite per essere rimosse. Una volta all'interno, gli utenti avranno accesso diretto a 2x SODIMM, 3x alloggiamenti di archiviazione, e poi al modulo WLAN. Un ulteriore smontaggio è purtroppo richiesto se si vuole pulire le ventole doppie che si trovano sull'altro lato della scheda madre.
Accessori e garanzia
La scatola di vendita include l'adattatore AC, la documentazione, un cavo HDMI e una staffa di montaggio VESA con viti. Si applica la garanzia limitata standard di un anno del produttore
Performance
Condizioni di test
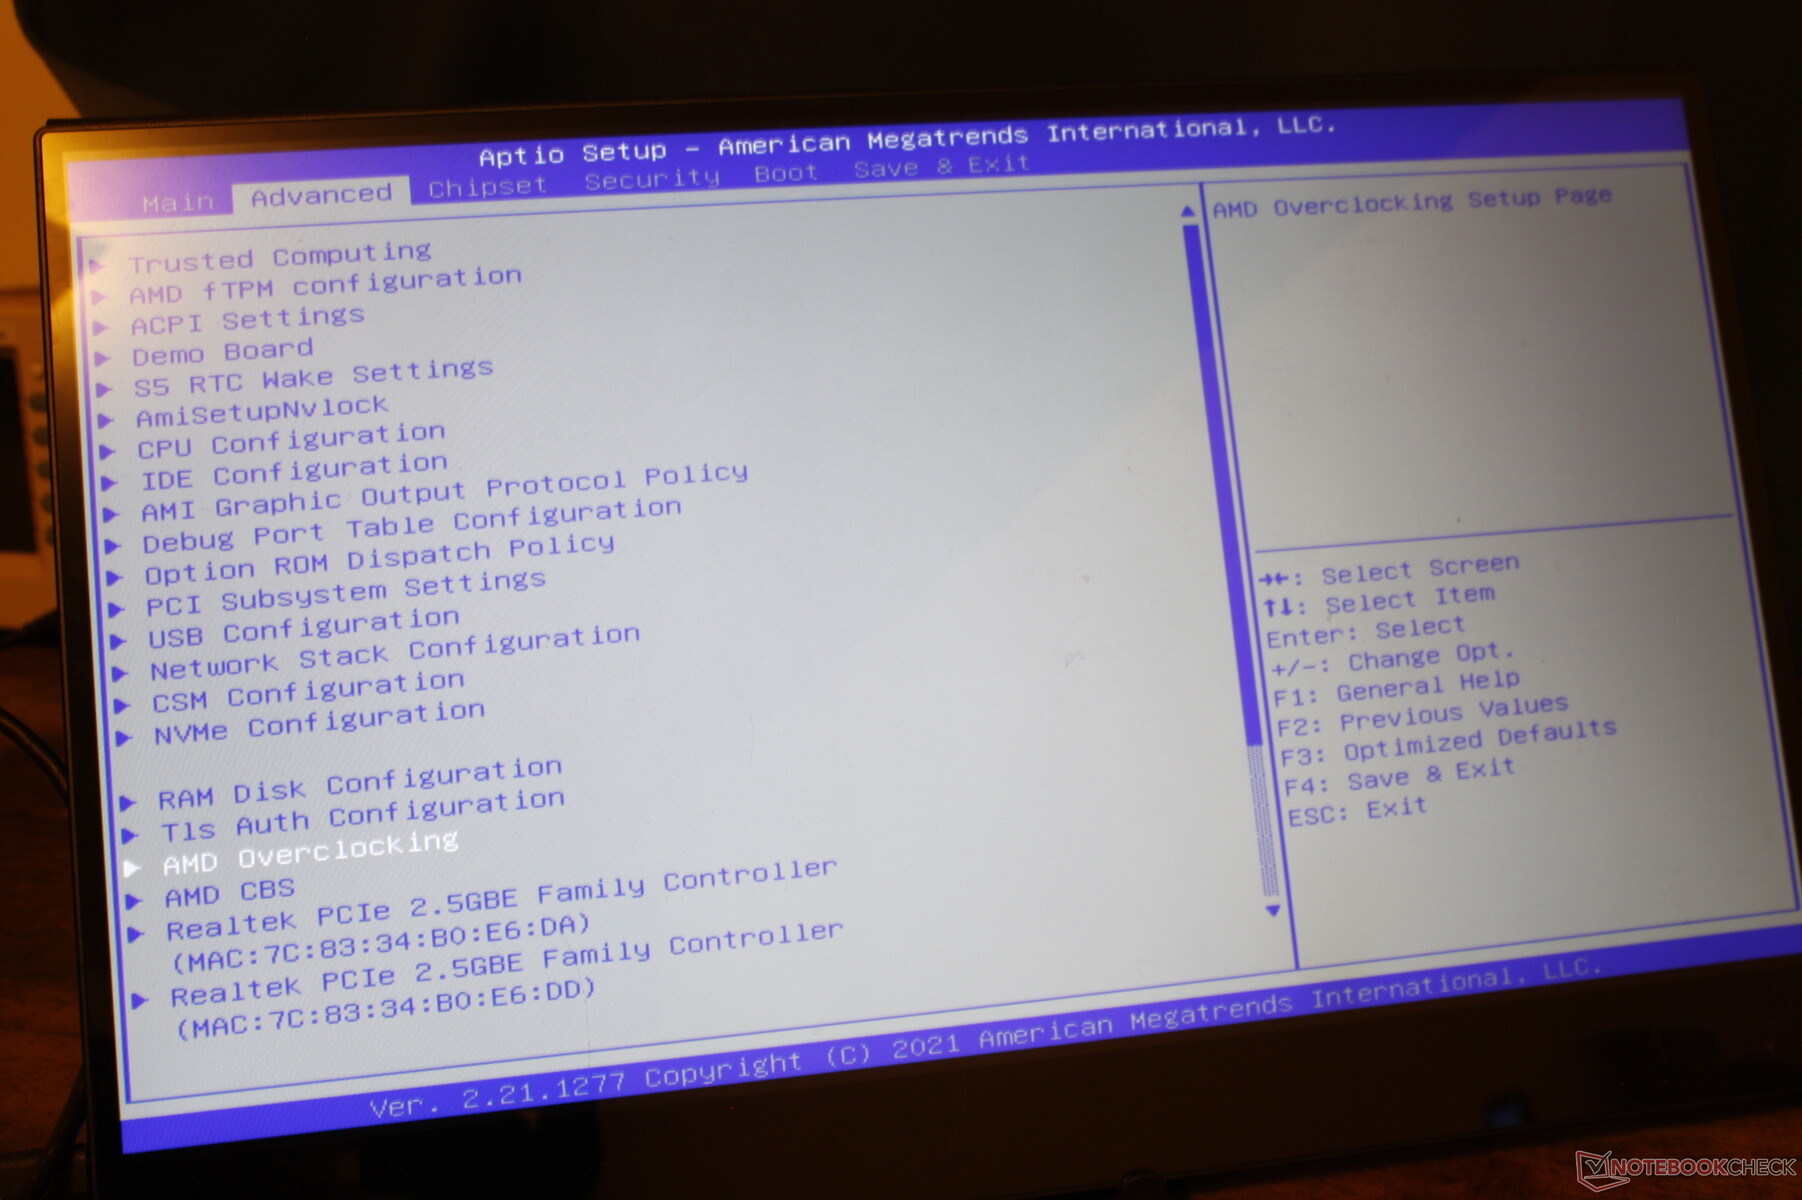
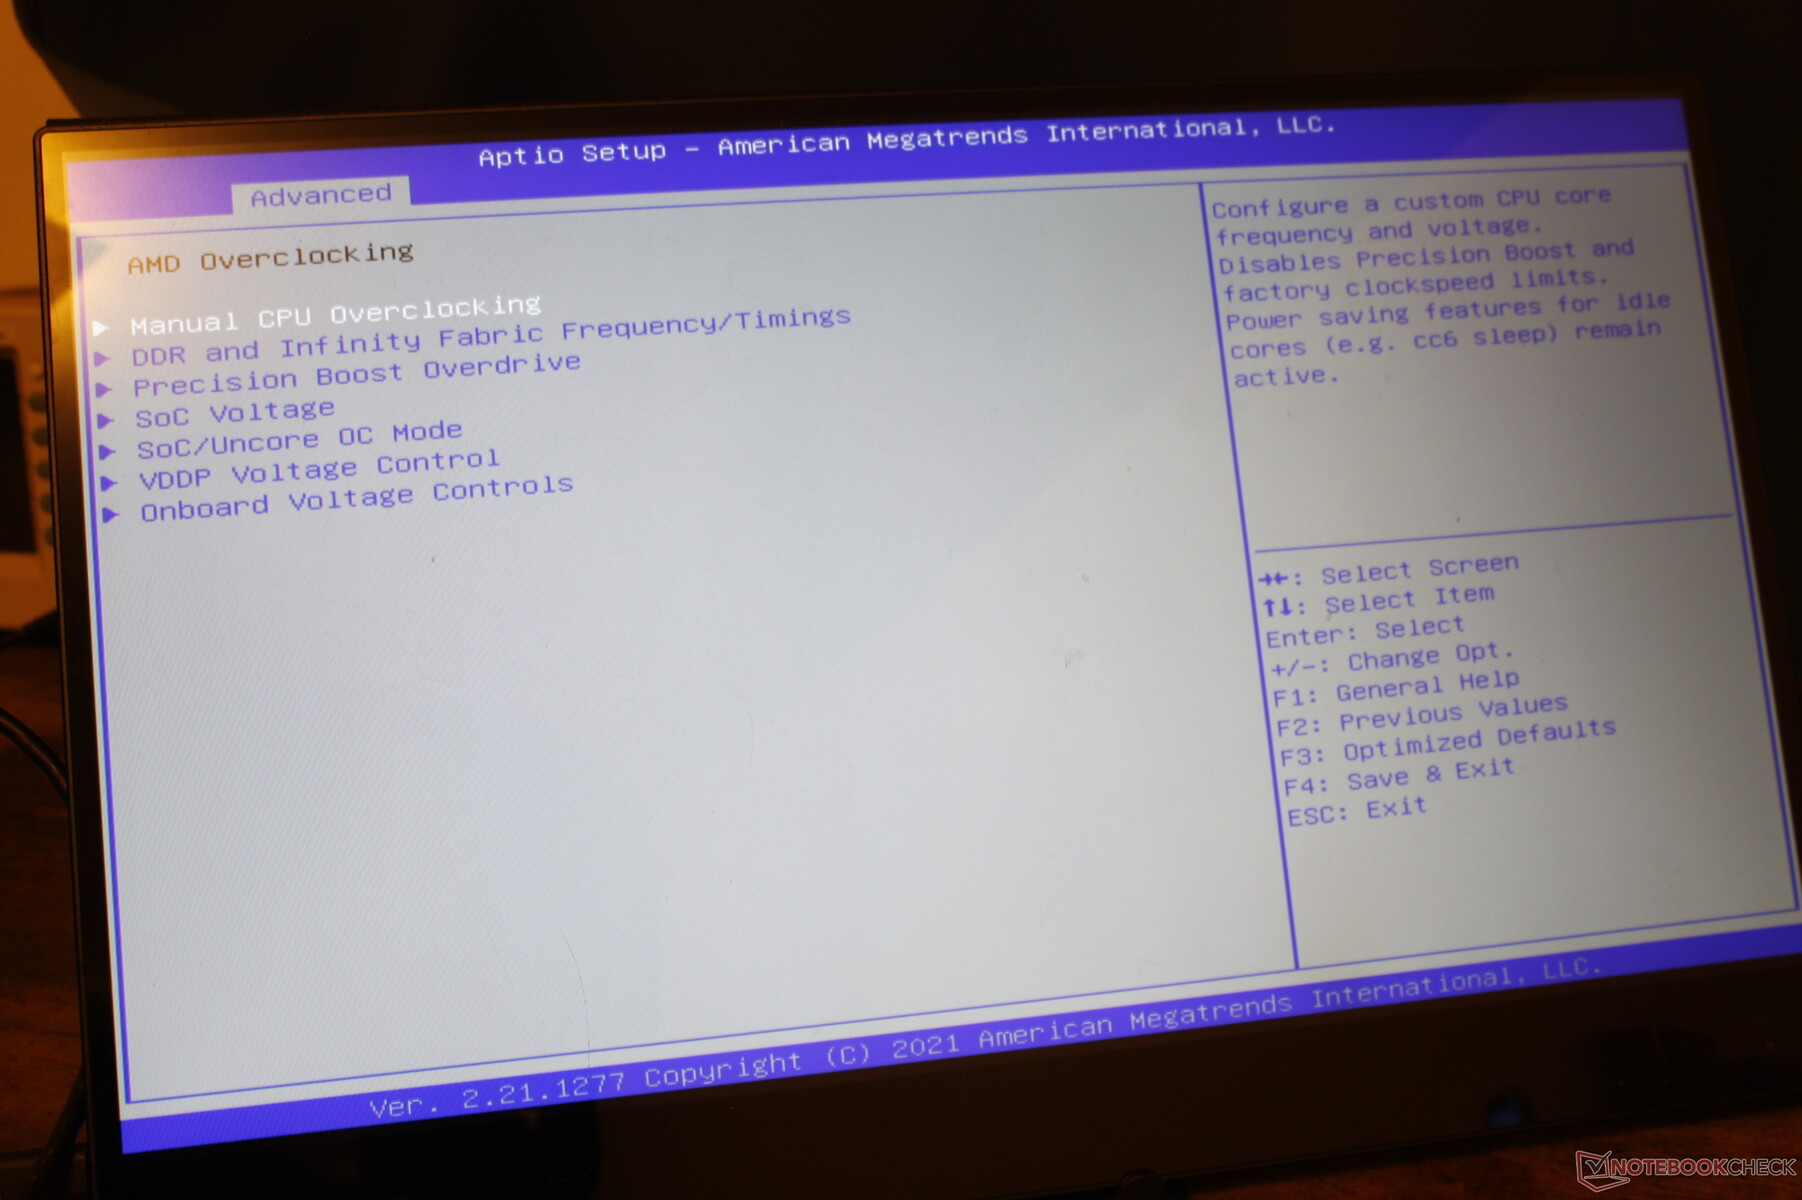
Abbiamo usato le impostazioni stock del BIOS e il profilo di alimentazione di Windows Performance prima di eseguire qualsiasi dei nostri benchmark qui sotto. Gli utenti possono opzionalmente overcloccare la CPU attraverso il BIOS per spremere più prestazioni, se lo desiderano.
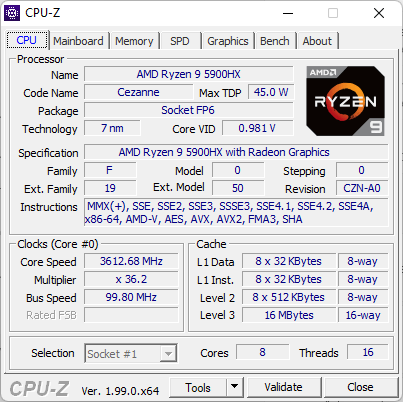
Processore
Le prestazioni della CPU multi-thread sono più veloci di quelle della maggior parte dei portatili da gioco con CPU Core i7 di 11a generazione, mentre sono paragonabili a quelle con Core i9 di 11a generazione. Se paragonato ad altri portatili con lo stesso Ryzen 9 5900HXtuttavia, il nostro Beelink è inferiore di circa il 5%. Le prestazioni sono comunque molto vicine al Ryzen 9 5900X come si trova sul Eurocom Nightsky ARX15 anche prima di qualsiasi overclock.
Cinebench R15 Multi Loop
Cinebench R20: CPU (Multi Core) | CPU (Single Core)
Cinebench R15: CPU Multi 64Bit | CPU Single 64Bit
Blender: v2.79 BMW27 CPU
7-Zip 18.03: 7z b 4 | 7z b 4 -mmt1
Geekbench 5.5: Multi-Core | Single-Core
HWBOT x265 Benchmark v2.2: 4k Preset
LibreOffice : 20 Documents To PDF
R Benchmark 2.5: Overall mean
* ... Meglio usare valori piccoli
AIDA64: FP32 Ray-Trace | FPU Julia | CPU SHA3 | CPU Queen | FPU SinJulia | FPU Mandel | CPU AES | CPU ZLib | FP64 Ray-Trace | CPU PhotoWorxx
| Performance rating | |
| Media AMD Ryzen 9 5900HX | |
| Beelink GTR5 | |
| Beelink GTI 11 | |
| Intel NUC11PHKi7C | |
| GMK NucBox 2 | |
| Beelink GK Mini | |
| AIDA64 / FP32 Ray-Trace | |
| Media AMD Ryzen 9 5900HX (12470 - 16014, n=26) | |
| Beelink GTR5 | |
| Beelink GTI 11 | |
| Intel NUC11PHKi7C | |
| GMK NucBox 2 | |
| Beelink GK Mini | |
| AIDA64 / FPU Julia | |
| Media AMD Ryzen 9 5900HX (79554 - 101008, n=26) | |
| Beelink GTR5 | |
| Beelink GTI 11 | |
| Intel NUC11PHKi7C | |
| GMK NucBox 2 | |
| Beelink GK Mini | |
| AIDA64 / CPU SHA3 | |
| Media AMD Ryzen 9 5900HX (2754 - 3444, n=26) | |
| Beelink GTR5 | |
| Beelink GTI 11 | |
| Intel NUC11PHKi7C | |
| GMK NucBox 2 | |
| Beelink GK Mini | |
| AIDA64 / CPU Queen | |
| Media AMD Ryzen 9 5900HX (87865 - 105123, n=26) | |
| Beelink GTR5 | |
| Intel NUC11PHKi7C | |
| Beelink GTI 11 | |
| GMK NucBox 2 | |
| Beelink GK Mini | |
| AIDA64 / FPU SinJulia | |
| Beelink GTR5 | |
| Media AMD Ryzen 9 5900HX (10899 - 12806, n=26) | |
| Intel NUC11PHKi7C | |
| Beelink GTI 11 | |
| GMK NucBox 2 | |
| Beelink GK Mini | |
| AIDA64 / FPU Mandel | |
| Media AMD Ryzen 9 5900HX (43685 - 55702, n=26) | |
| Beelink GTR5 | |
| Intel NUC11PHKi7C | |
| Beelink GTI 11 | |
| GMK NucBox 2 | |
| Beelink GK Mini | |
| AIDA64 / CPU AES | |
| Media AMD Ryzen 9 5900HX (109927 - 137901, n=26) | |
| Beelink GTR5 | |
| Intel NUC11PHKi7C | |
| Beelink GTI 11 | |
| GMK NucBox 2 | |
| Beelink GK Mini | |
| AIDA64 / CPU ZLib | |
| Media AMD Ryzen 9 5900HX (706 - 878, n=26) | |
| Beelink GTR5 | |
| Intel NUC11PHKi7C | |
| Beelink GTI 11 | |
| GMK NucBox 2 | |
| Beelink GK Mini | |
| AIDA64 / FP64 Ray-Trace | |
| Media AMD Ryzen 9 5900HX (6664 - 8644, n=26) | |
| Beelink GTR5 | |
| Beelink GTI 11 | |
| Intel NUC11PHKi7C | |
| GMK NucBox 2 | |
| Beelink GK Mini | |
| AIDA64 / CPU PhotoWorxx | |
| Beelink GTI 11 | |
| Intel NUC11PHKi7C | |
| Beelink GTR5 | |
| Media AMD Ryzen 9 5900HX (14344 - 25533, n=26) | |
| GMK NucBox 2 | |
| Beelink GK Mini | |
Prestazioni del sistema
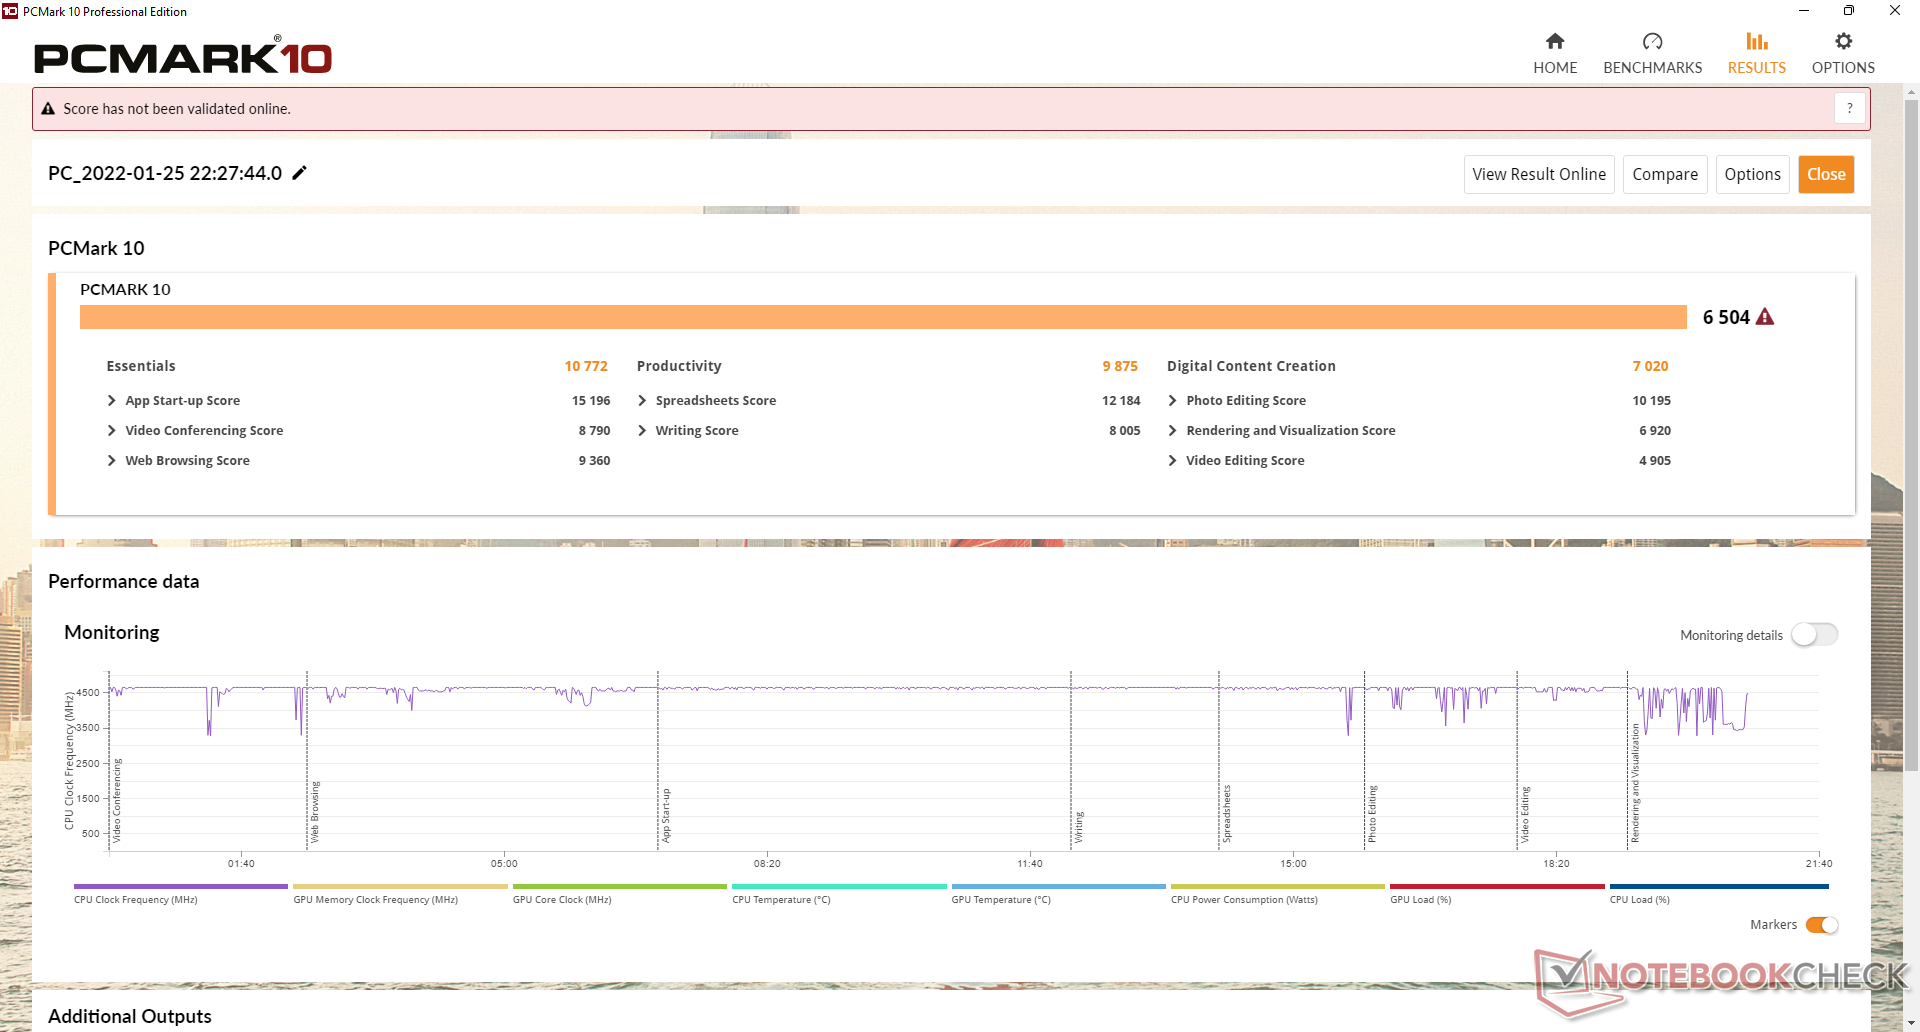
I risultati di PCMark sono eccellenti e ben al di sopra della maggior parte degli altri mini PC e NUC. Tuttavia, abbiamo incontrato due crash durante i nostri test in cui l'unità si spegneva automaticamente senza apparente motivo. Non siamo stati in grado di ripetere in modo affidabile i crash nel bene e nel male.
CrossMark: Overall | Productivity | Creativity | Responsiveness
| PCMark 10 / Score | |
| Beelink GTR5 | |
| Media AMD Ryzen 9 5900HX, AMD Radeon RX Vega 8 (Ryzen 4000/5000) (6290 - 6507, n=5) | |
| Intel NUC11PHKi7C | |
| Intel NUC11PAQi7 | |
| Beelink GTI 11 | |
| GMK NucBox 2 | |
| Beelink GK Mini | |
| PCMark 10 / Essentials | |
| Beelink GTR5 | |
| Media AMD Ryzen 9 5900HX, AMD Radeon RX Vega 8 (Ryzen 4000/5000) (10087 - 10836, n=5) | |
| Intel NUC11PAQi7 | |
| Beelink GTI 11 | |
| Intel NUC11PHKi7C | |
| GMK NucBox 2 | |
| Beelink GK Mini | |
| PCMark 10 / Productivity | |
| Media AMD Ryzen 9 5900HX, AMD Radeon RX Vega 8 (Ryzen 4000/5000) (9852 - 10196, n=5) | |
| Beelink GTR5 | |
| Intel NUC11PHKi7C | |
| Intel NUC11PAQi7 | |
| Beelink GTI 11 | |
| GMK NucBox 2 | |
| Beelink GK Mini | |
| PCMark 10 / Digital Content Creation | |
| Beelink GTR5 | |
| Intel NUC11PHKi7C | |
| Media AMD Ryzen 9 5900HX, AMD Radeon RX Vega 8 (Ryzen 4000/5000) (6660 - 7105, n=5) | |
| Beelink GTI 11 | |
| Intel NUC11PAQi7 | |
| GMK NucBox 2 | |
| Beelink GK Mini | |
| CrossMark / Overall | |
| Beelink GTR5 | |
| Media AMD Ryzen 9 5900HX, AMD Radeon RX Vega 8 (Ryzen 4000/5000) (1402 - 1501, n=2) | |
| CrossMark / Productivity | |
| Beelink GTR5 | |
| Media AMD Ryzen 9 5900HX, AMD Radeon RX Vega 8 (Ryzen 4000/5000) (1387 - 1495, n=2) | |
| CrossMark / Creativity | |
| Beelink GTR5 | |
| Media AMD Ryzen 9 5900HX, AMD Radeon RX Vega 8 (Ryzen 4000/5000) (1553 - 1589, n=2) | |
| CrossMark / Responsiveness | |
| Beelink GTR5 | |
| Media AMD Ryzen 9 5900HX, AMD Radeon RX Vega 8 (Ryzen 4000/5000) (1068 - 1281, n=2) | |
| PCMark 10 Score | 6504 punti | |
Aiuto | ||
| AIDA64 / Memory Copy | |
| GMK NucBox 2 | |
| Beelink GTR5 | |
| Beelink GTI 11 | |
| Media AMD Ryzen 9 5900HX (36725 - 43318, n=26) | |
| Intel NUC11PHKi7C | |
| Beelink GK Mini | |
| AIDA64 / Memory Read | |
| Beelink GTR5 | |
| Beelink GTI 11 | |
| Media AMD Ryzen 9 5900HX (41378 - 47593, n=26) | |
| Intel NUC11PHKi7C | |
| GMK NucBox 2 | |
| Beelink GK Mini | |
| AIDA64 / Memory Write | |
| GMK NucBox 2 | |
| Beelink GTI 11 | |
| Beelink GTR5 | |
| Media AMD Ryzen 9 5900HX (32536 - 46718, n=26) | |
| Intel NUC11PHKi7C | |
| Beelink GK Mini | |
| AIDA64 / Memory Latency | |
| Intel NUC11PHKi7C | |
| Beelink GTR5 | |
| Media AMD Ryzen 9 5900HX (73.5 - 97.1, n=26) | |
| Beelink GK Mini | |
| Beelink GTI 11 | |
| GMK NucBox 2 | |
* ... Meglio usare valori piccoli
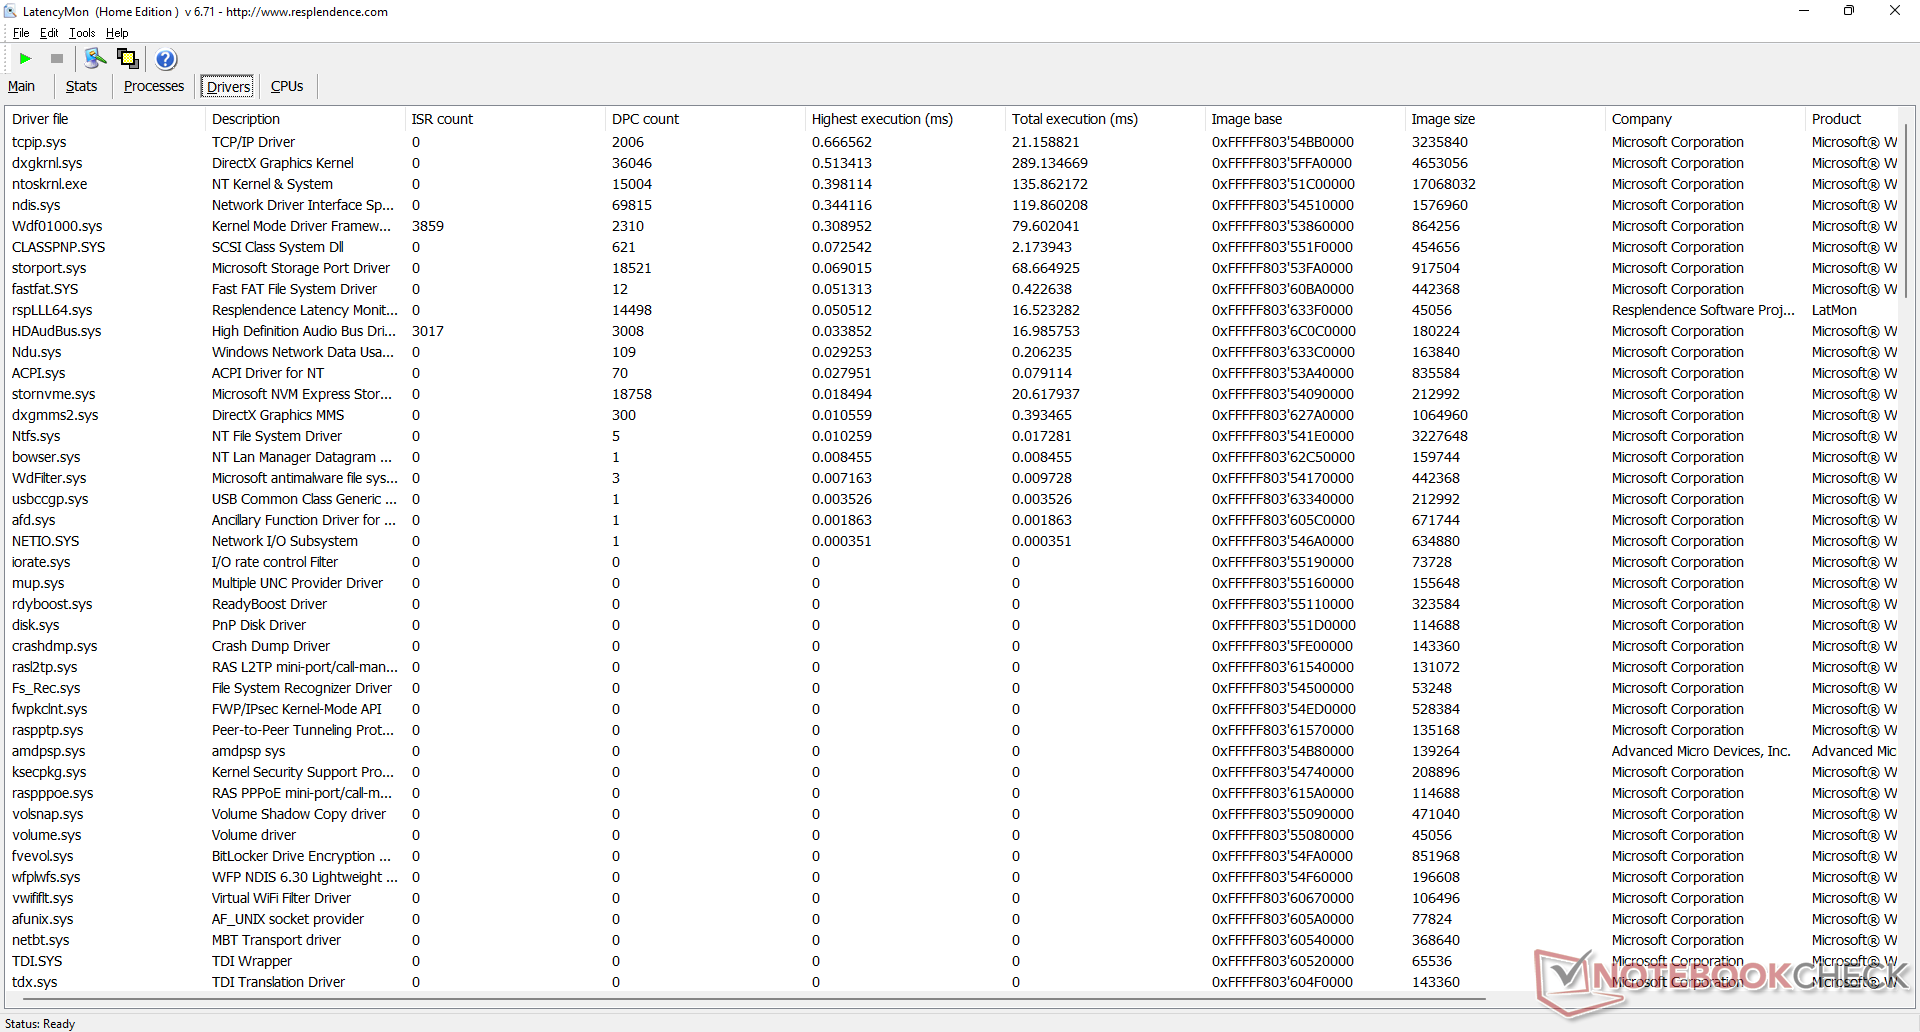
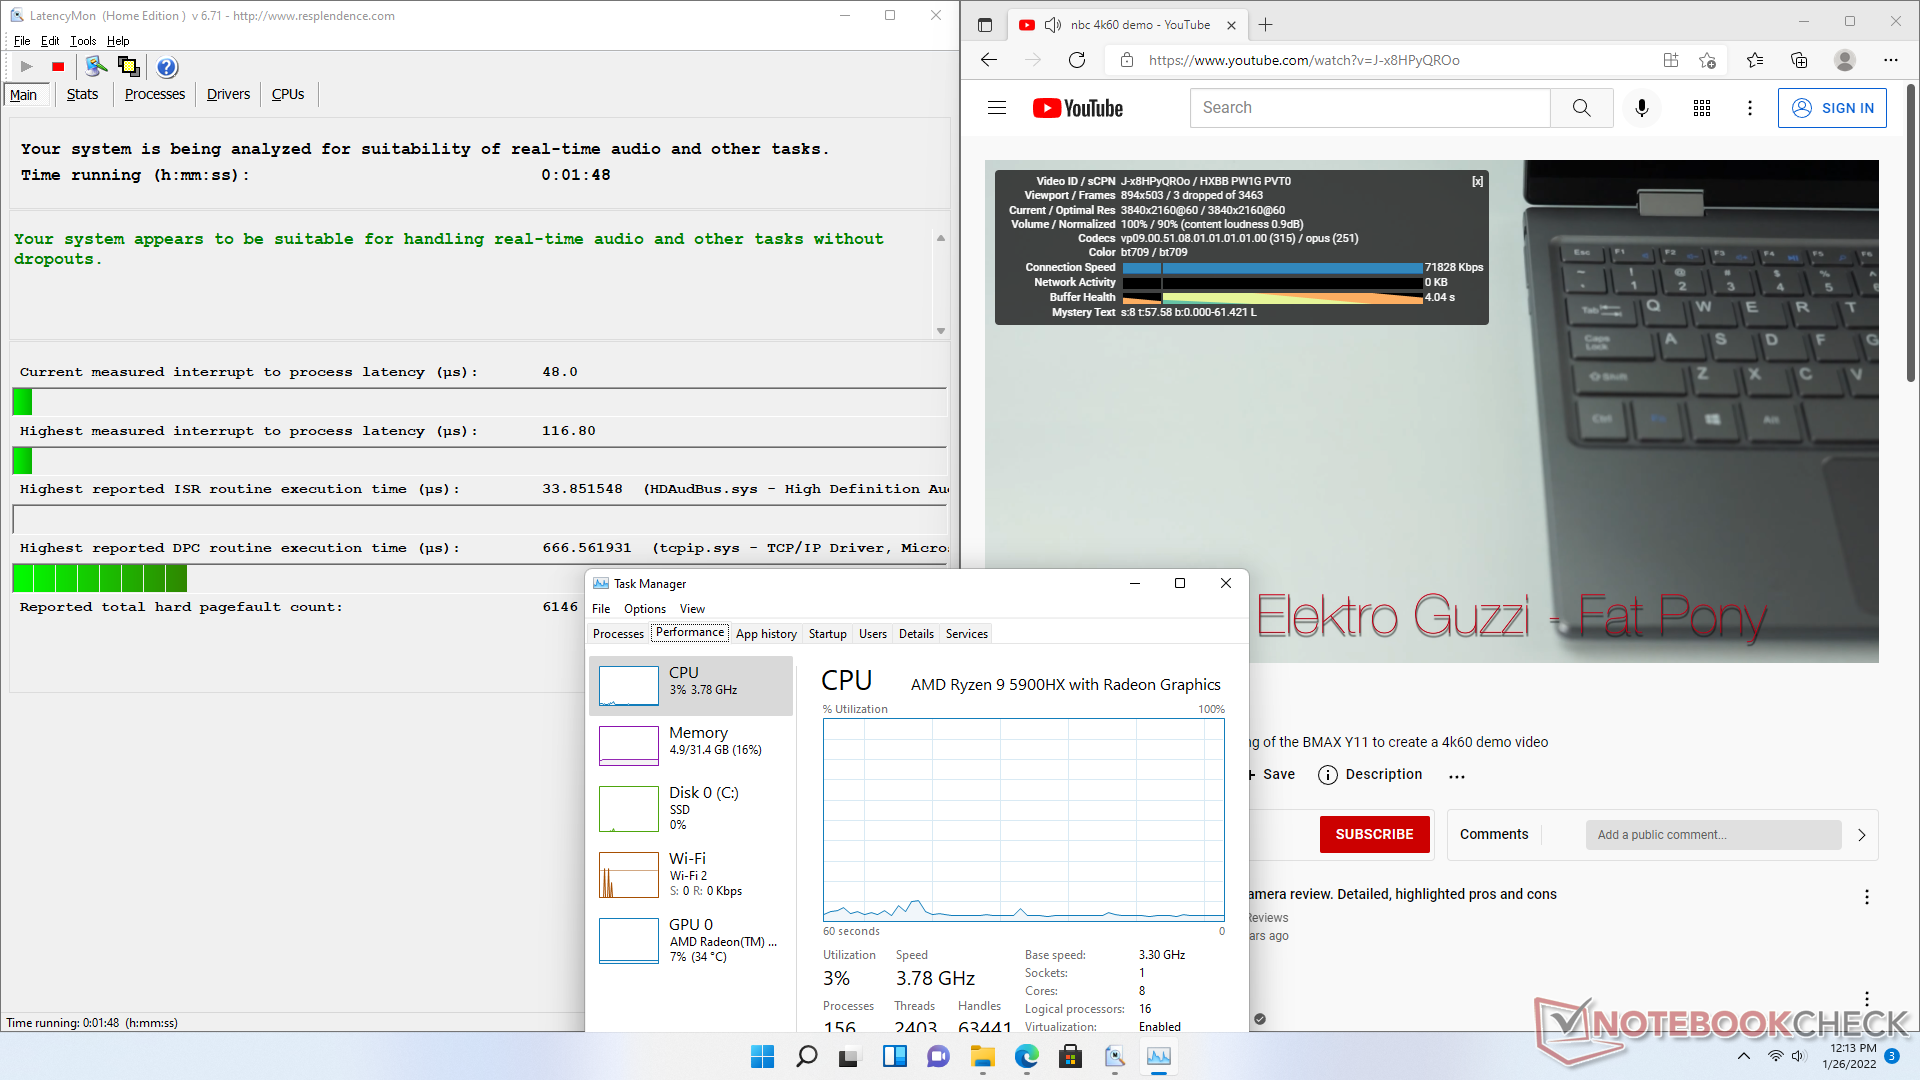
Latenza DPC
LatencyMon non mostra problemi di DPC quando si aprono più schede del browser sulla nostra homepage. la riproduzione di video 4K a 60 FPS è fluida con solo 3 fotogrammi caduti durante il nostro test di YouTube di un minuto.
| DPC Latencies / LatencyMon - interrupt to process latency (max), Web, Youtube, Prime95 | |
| Beelink GK Mini | |
| Intel NUC11PHKi7C | |
| GMK NucBox 2 | |
| Intel NUC11PAQi7 | |
| Beelink GTI 11 | |
| Beelink GTR5 | |
* ... Meglio usare valori piccoli
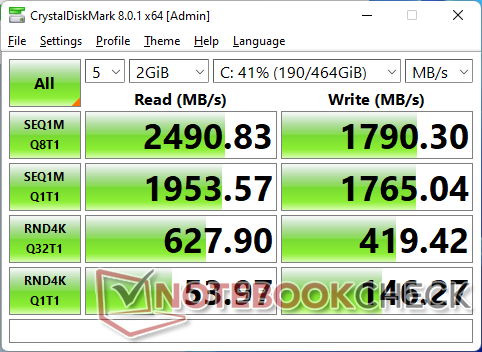
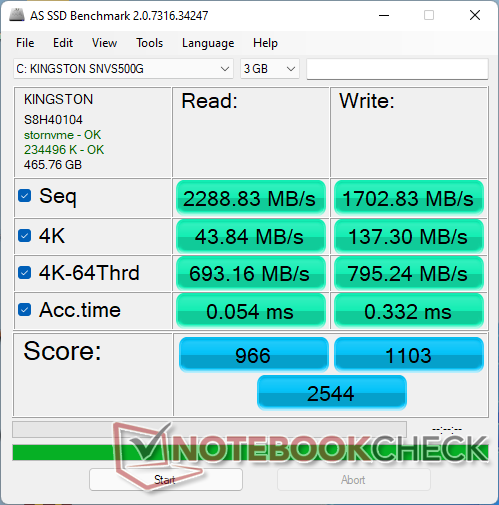
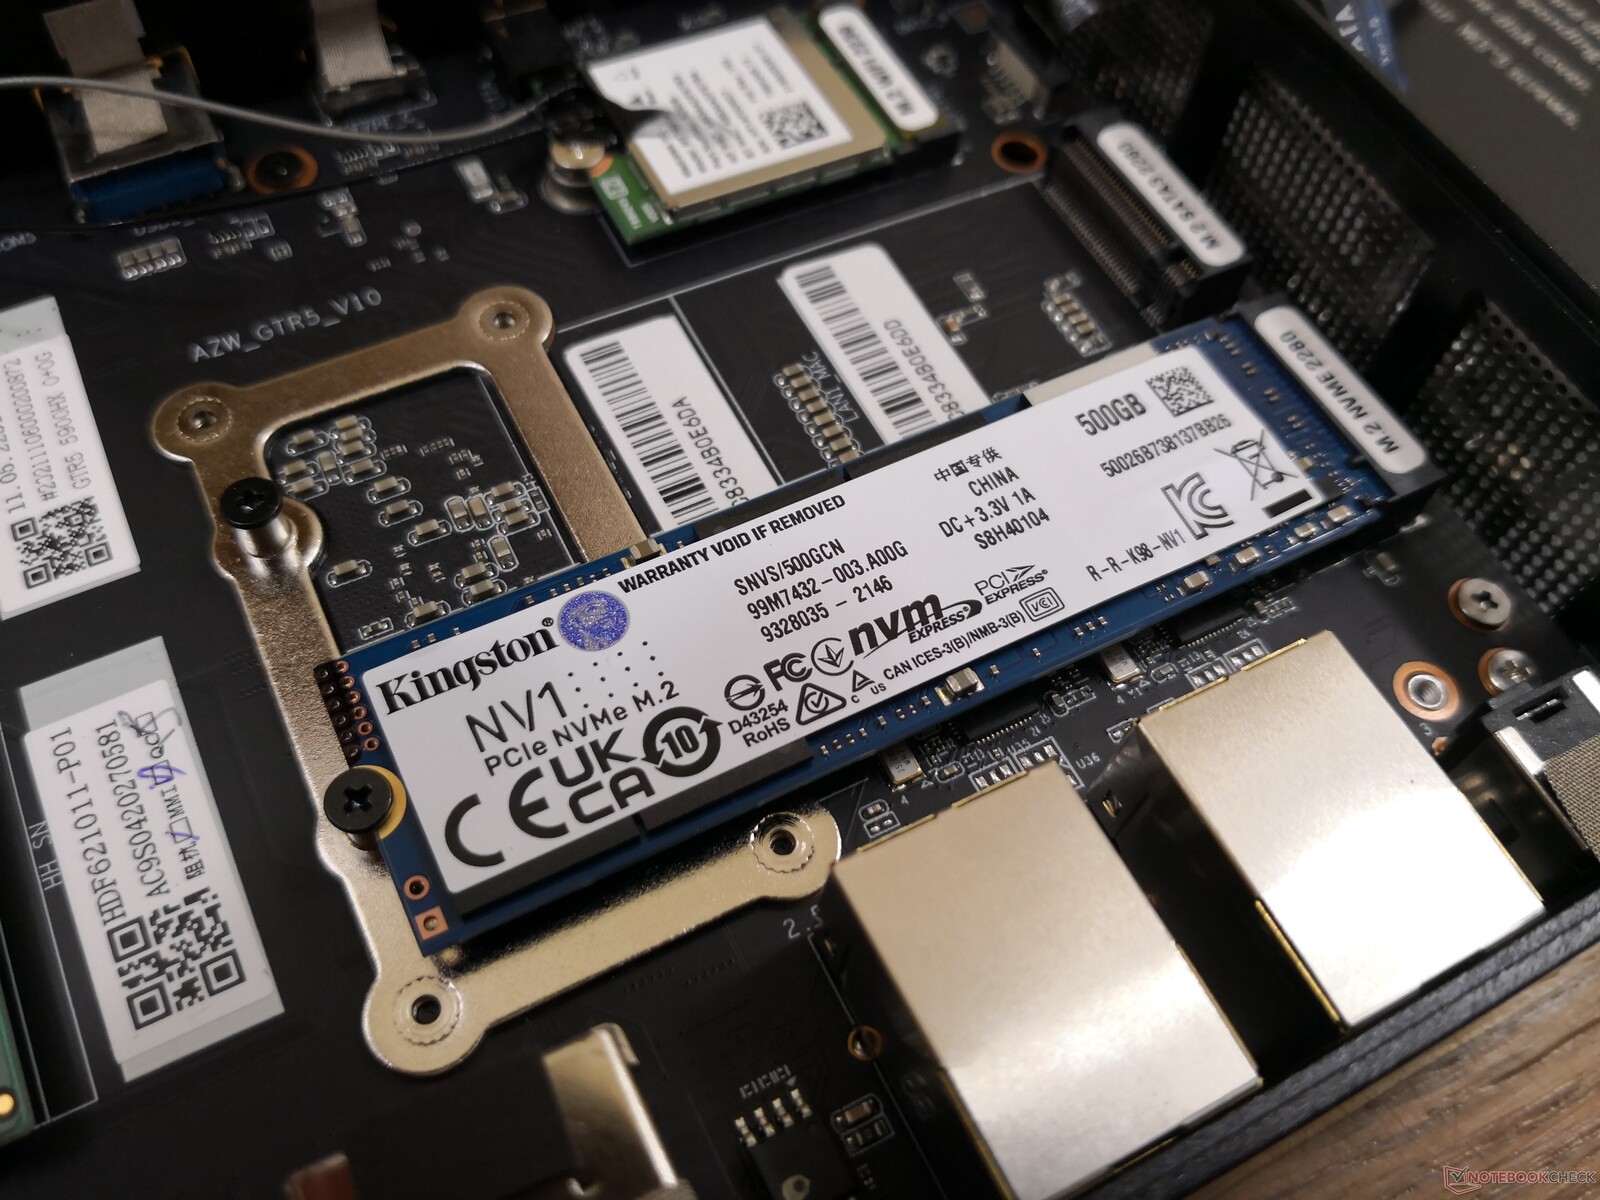
Dispositivi di archiviazione
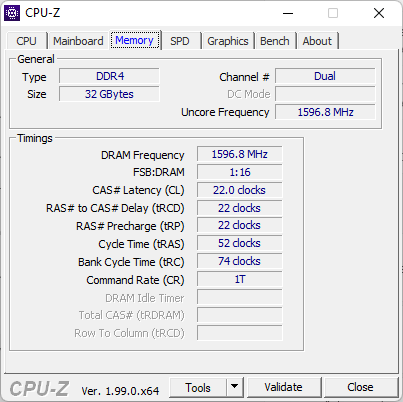
La nostra unità di prova è dotata di un midrange 500 GB Kingston NV1 SSD PCIe3 x4. Le velocità PCIe4 non sono supportate a differenza degli ultimi NUC Intel che girano su CPU Core di 11a generazione. L'unità Kingston altrimenti non mostra problemi nel mantenere la sua velocità massima di trasferimento di ~2300 MB/s per periodi prolungati.

| Drive Performance rating - Percent | |
| Intel NUC11PAQi7 | |
| Beelink GTI 11 | |
| Intel NUC11PHKi7C | |
| Beelink GTR5 | |
| GMK NucBox 2 | |
| Beelink GK Mini | |
* ... Meglio usare valori piccoli
Disk Throttling: DiskSpd Read Loop, Queue Depth 8
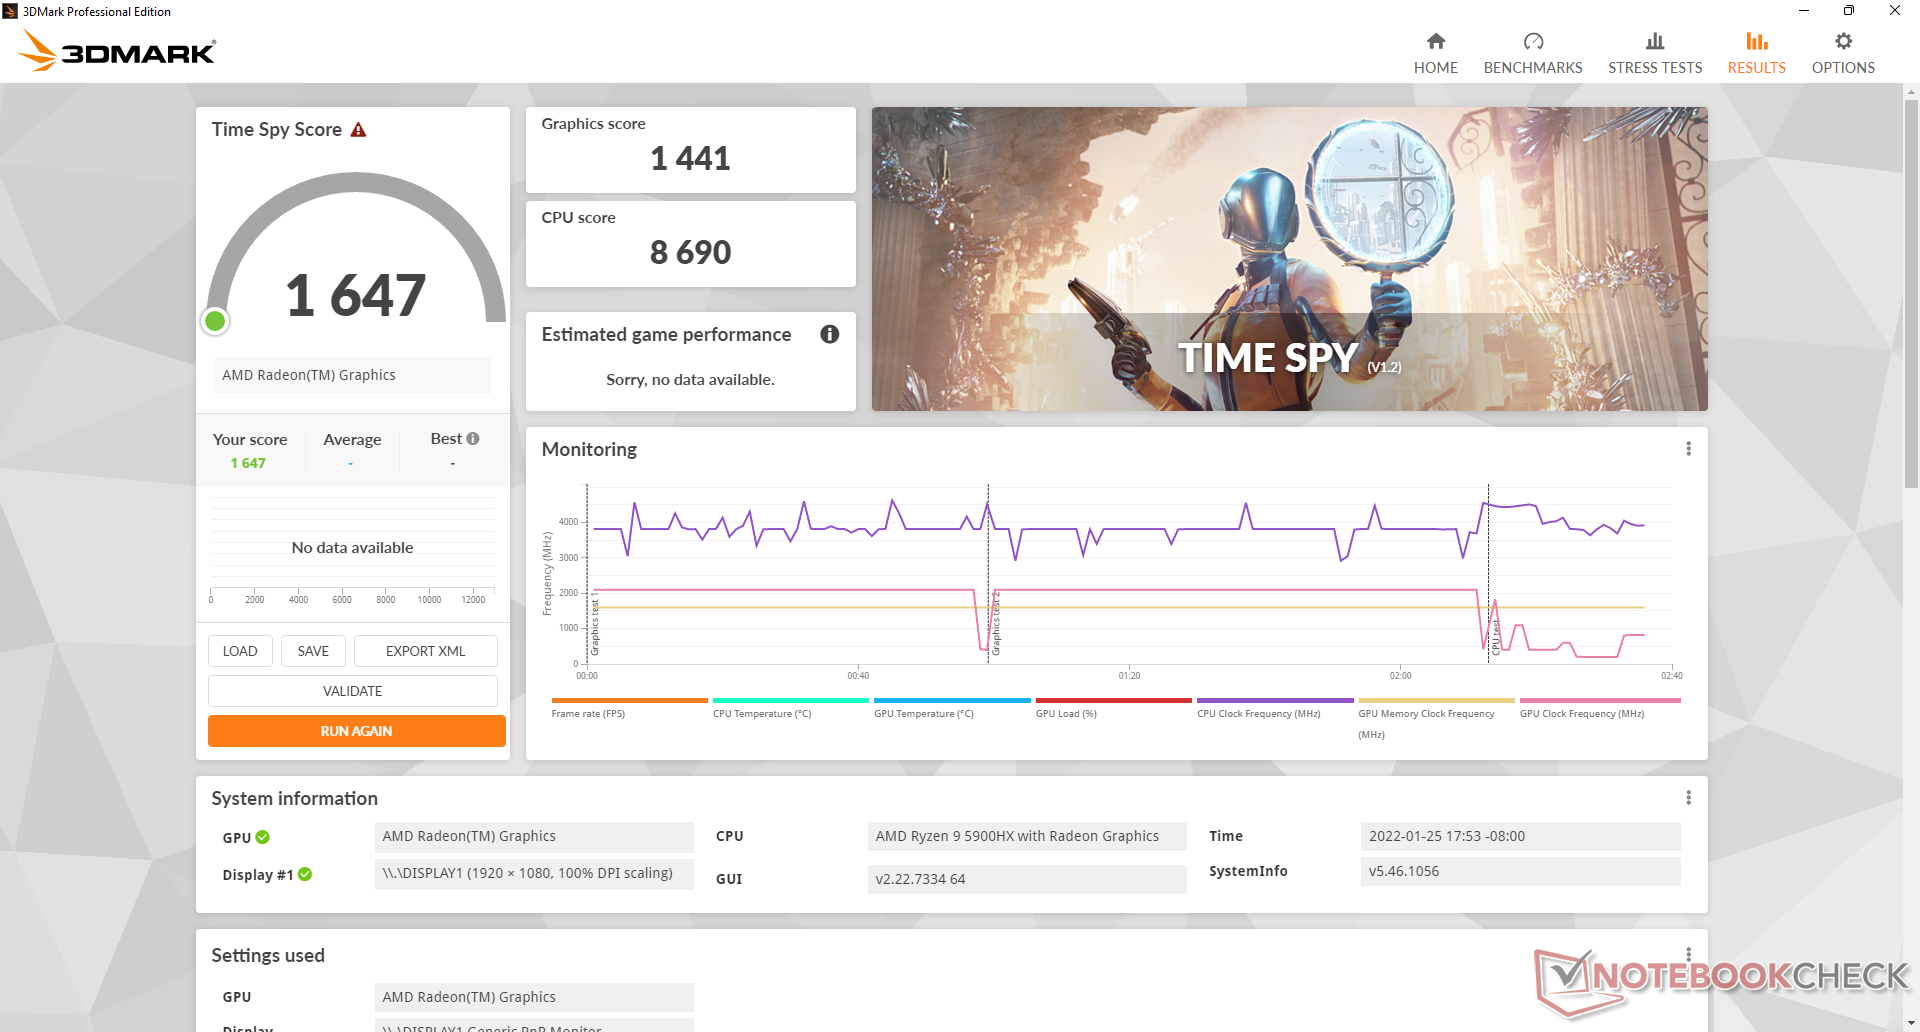
Prestazioni della GPU
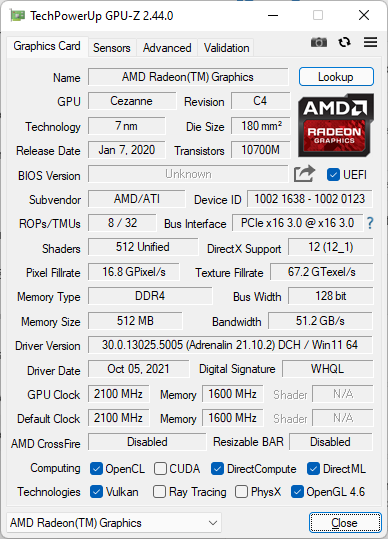
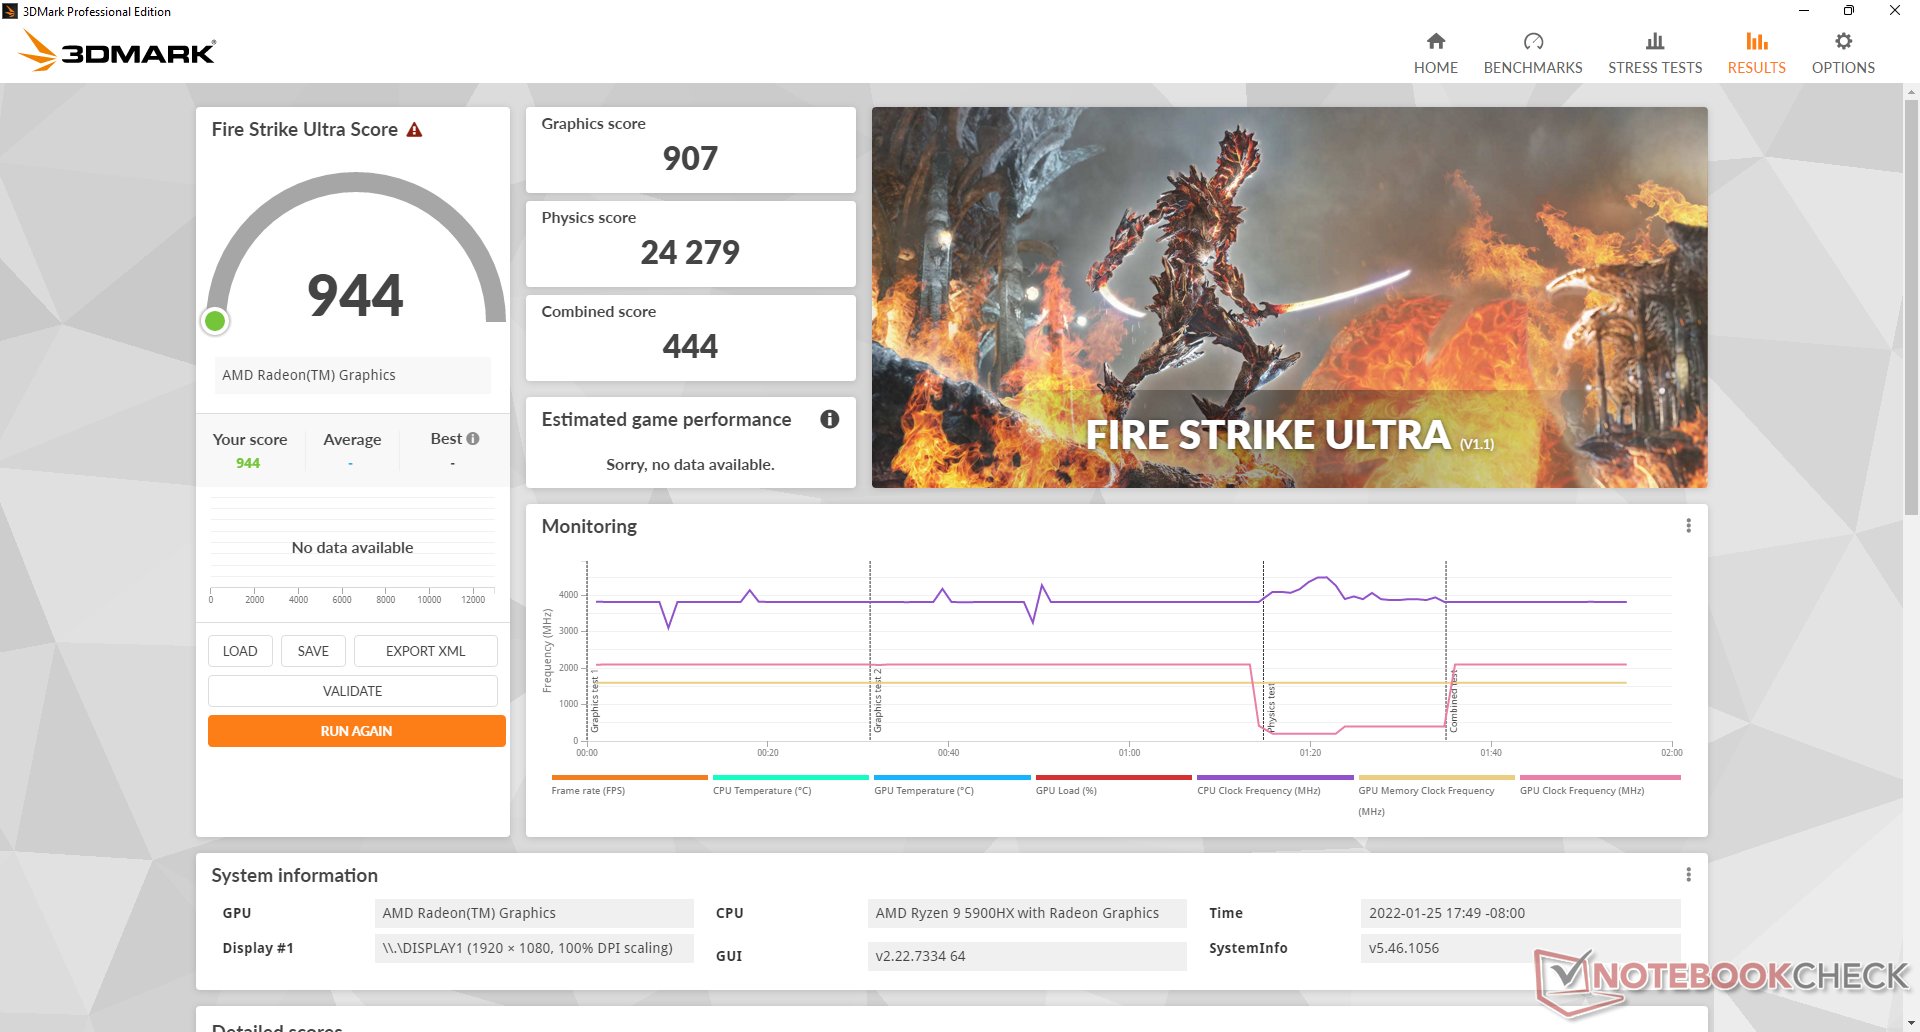
L'integratoRadeon RX Vega 8 qui è circa il 20 per cento più veloce del portatile medio nel nostro database dotato della stessa GPU integrata. La Intel Iris Xe 96 EUs che si trova sulla maggior parte dei portatili Core i7 di 11a generazione è ancora superiore alla nostra soluzione AMD nella maggior parte dei titoli, ma il delta tra loro è molto più stretto questa volta. La maggior parte dei titoli moderni ed esigenti girano ragionevolmente bene a 1080p con impostazioni basse.
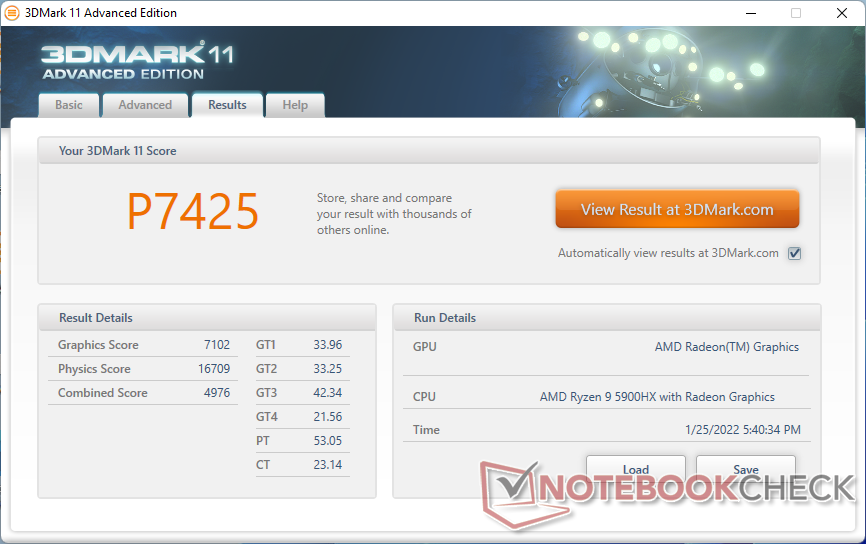

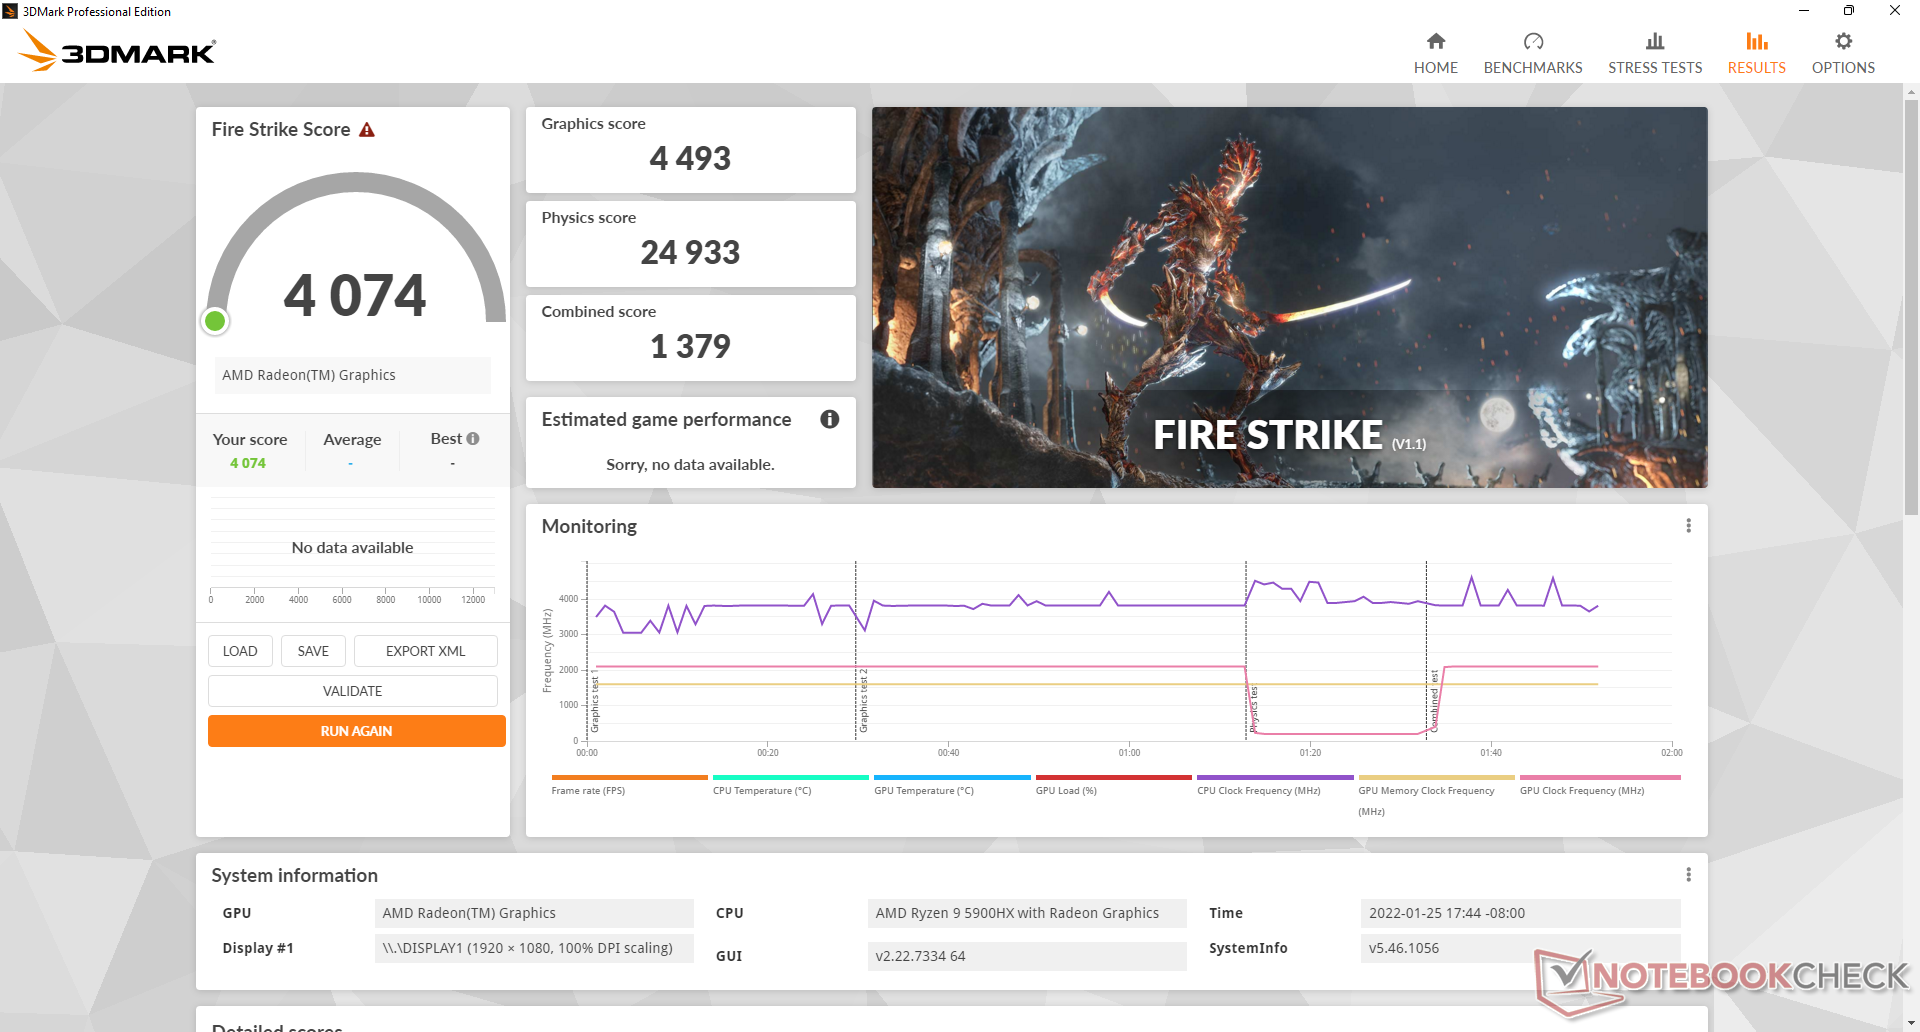
| 3DMark 11 Performance | 7425 punti | |
| 3DMark Cloud Gate Standard Score | 28723 punti | |
| 3DMark Fire Strike Score | 4074 punti | |
| 3DMark Time Spy Score | 1647 punti | |
Aiuto | ||
Witcher 3 FPS Chart
| basso | medio | alto | ultra | |
|---|---|---|---|---|
| GTA V (2015) | 140 | 124 | 33.4 | 15.1 |
| The Witcher 3 (2015) | 86.9 | 55.2 | 26.8 | 17.1 |
| Dota 2 Reborn (2015) | 135 | 107 | 63.8 | 59.9 |
| Final Fantasy XV Benchmark (2018) | 44.8 | 22.3 | 15.7 | |
| X-Plane 11.11 (2018) | 58.2 | 45.7 | 40.5 | |
| Far Cry 5 (2018) | 62 | 29 | 27 | 25 |
| Strange Brigade (2018) | 99.1 | 37.8 | 31.9 | 27.5 |
Emissioni
Rumore di sistema
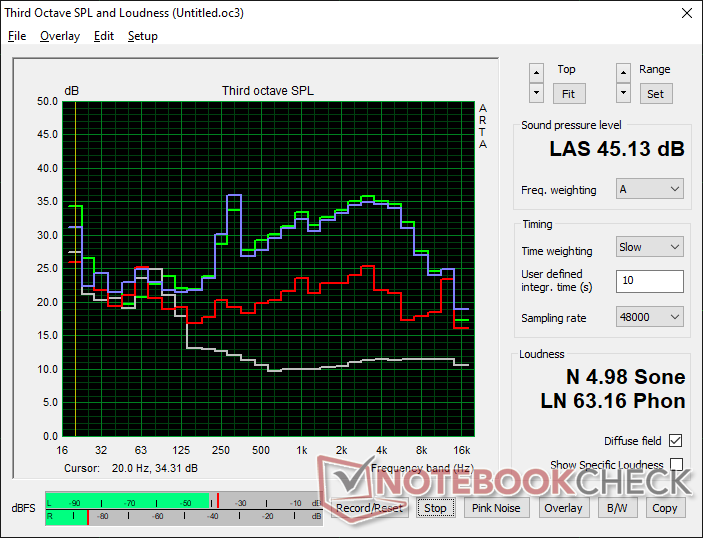
Il GTR5 è uno dei mini PC più rumorosi che abbiamo testato poiché le sue due ventole interne sono essenzialmente sempre attive. Quando si è semplicemente seduti sullo schermo del desktop di Windows, per esempio, siamo già in grado di registrare un rumore di ventola di 34,2 dB(A) rispetto a ~25 dB(A) sul GMK NucBox 2 o Intel NUC11PAQi7 ciascuno con CPU meno potenti.
L'esecuzione di carichi più elevati come i giochi può indurre un rumore della ventola da 41 a 45 dB(A) per essere ancora più forte dell'Intel NUC11PHKi7C equipaggiato con il significativamente più veloce GeForce RTX 2060. Non importa come lo tagliate, il GTR5 sarà rumoroso nella maggior parte delle condizioni. La buona notizia è che le ventole non pulsano o vanno in ciclo molto frequentemente, il che avrebbe reso il rumore ancora più fastidioso.
Rumorosità
| Idle |
| 34.2 / 34.2 / 34.2 dB(A) |
| Sotto carico |
| 44.6 / 45.1 dB(A) |
 | ||
30 dB silenzioso 40 dB(A) udibile 50 dB(A) rumoroso |
||
min: | ||
| Beelink GTR5 Vega 8, R9 5900HX, Kingston NV1 SNVS/500GCN | Beelink GTI 11 Iris Xe G7 80EUs, i5-1135G7, Kingston SA2000M8500G | GMK NucBox 2 Iris Plus Graphics 655, i5-8259U, Netac S930E8/256GPN | Intel NUC11PHKi7C GeForce RTX 2060 Mobile, i7-1165G7, Samsung SSD 980 Pro 500GB MZ-V8P500BW | Intel NUC11PAQi7 Iris Xe G7 96EUs, i7-1165G7, Samsung SSD 980 Pro 500GB MZ-V8P500BW | Beelink GK Mini UHD Graphics 600, Celeron J4125, Silicon Motion SM2258XT 256GB | |
|---|---|---|---|---|---|---|
| Noise | -4% | 18% | 13% | 12% | 1% | |
| off /ambiente * (dB) | 23.1 | 25.7 -11% | 25.6 -11% | 24.5 -6% | 25.6 -11% | 24.6 -6% |
| Idle Minimum * (dB) | 34.2 | 28.4 17% | 25.7 25% | 25.3 26% | 25.6 25% | 36.9 -8% |
| Idle Average * (dB) | 34.2 | 32 6% | 25.7 25% | 25.3 26% | 25.6 25% | 36.9 -8% |
| Idle Maximum * (dB) | 34.2 | 37.7 -10% | 25.7 25% | 25.3 26% | 25.6 25% | 36.9 -8% |
| Load Average * (dB) | 44.6 | 44.2 1% | 35.3 21% | 36.4 18% | 33.6 25% | 37 17% |
| Witcher 3 ultra * (dB) | 41.4 | 44.5 -7% | 39.7 4% | 33.6 19% | ||
| Load Maximum * (dB) | 45.1 | 56 -24% | 35.1 22% | 47.9 -6% | 54.5 -21% | 37 18% |
* ... Meglio usare valori piccoli
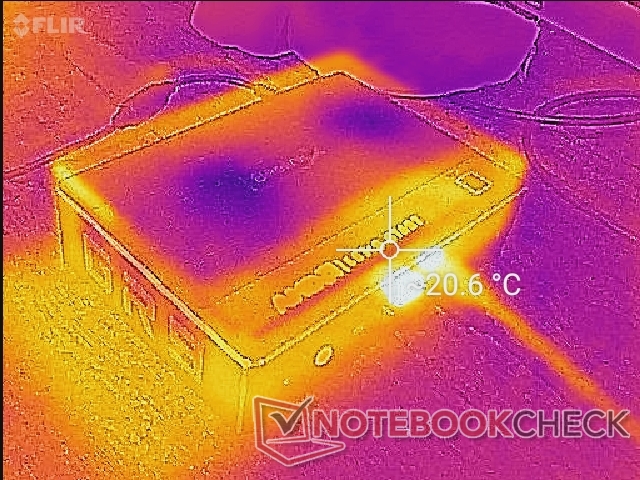
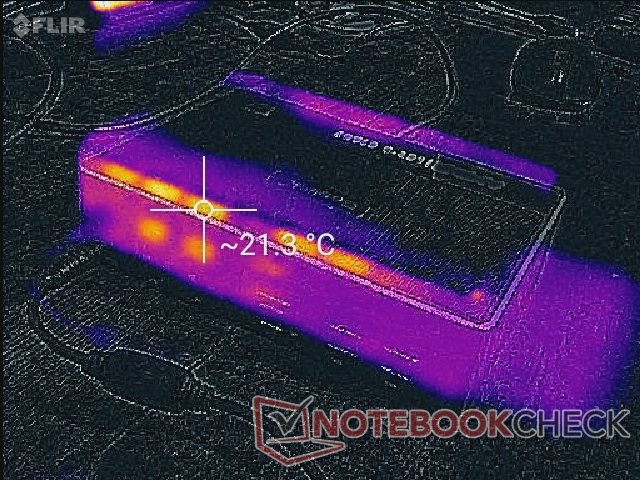
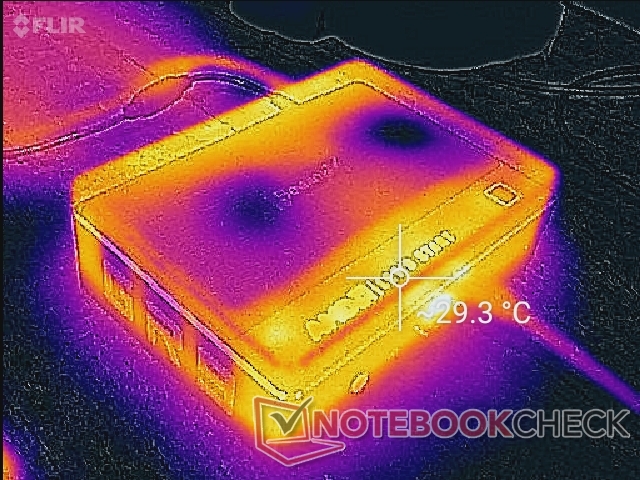
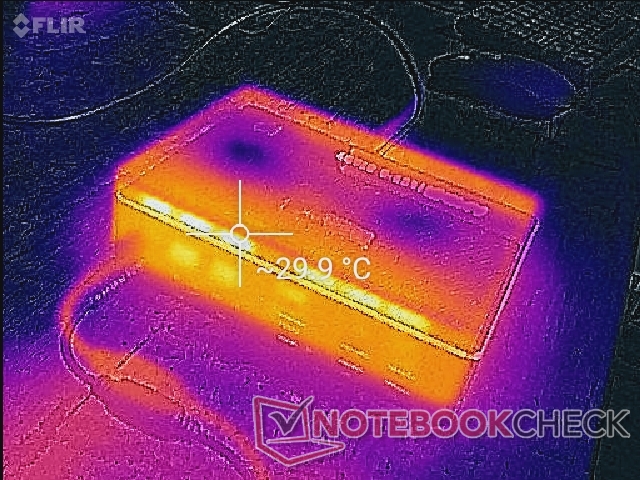
Temperatura
Le temperature di superficie non sono un problema soprattutto perché l'intera parte superiore dell'unità è una presa d'aria. Di conseguenza, non si raccomanda di mettere carte o libri sulla parte superiore del mini PC. Se si posiziona l'unità in verticale, assicurarsi di non premere la parte superiore del mini PC contro qualsiasi parete o scaffale per preservare il flusso d'aria.
Test di stress
Quando si esegue Prime95 per stressare la CPU con le impostazioni stock del BIOS, le frequenze di clock aumentavano a 3,9 GHz per i primi secondi prima di scendere leggermente a un più stabile 3,8 GHz. La temperatura del core (Tctl/Tdie) si stabilizza a 74 C per lasciare abbastanza spazio all'overclock. Il TDP della CPU sembra arrivare a 55 W durante l'inizio del test prima di stabilizzarsi a 45 W secondo HWiNFO.
Quando si esegue Witcher 3 per rappresentare lo stress da gioco, la GPU integrata si stabilizza a 2100 MHz e a una temperatura del core della CPU (Tctl/Tdie) di 65 C. Eseguendo questo stesso test sul Beelink GTI11 equipaggiato con il meno esigente Core i5-1135G7 avrebbe risultati di temperatura simili.
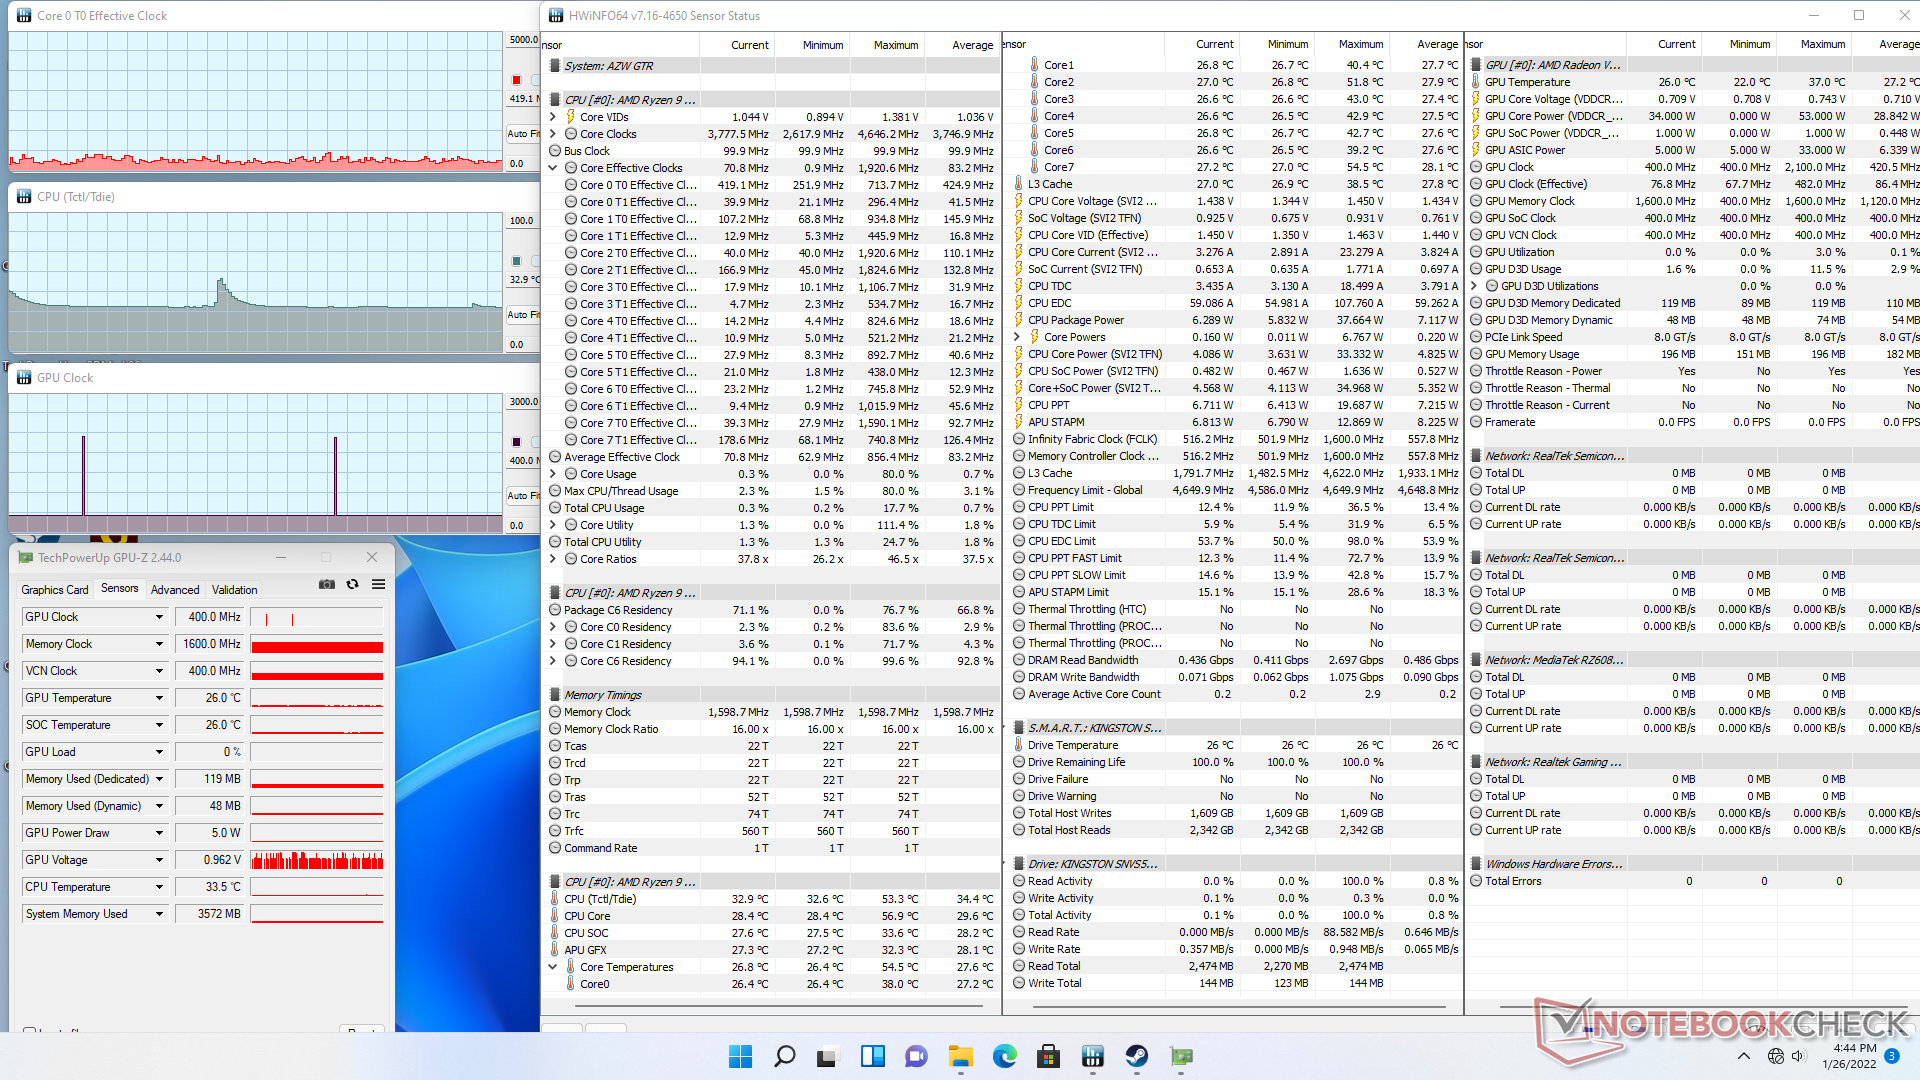
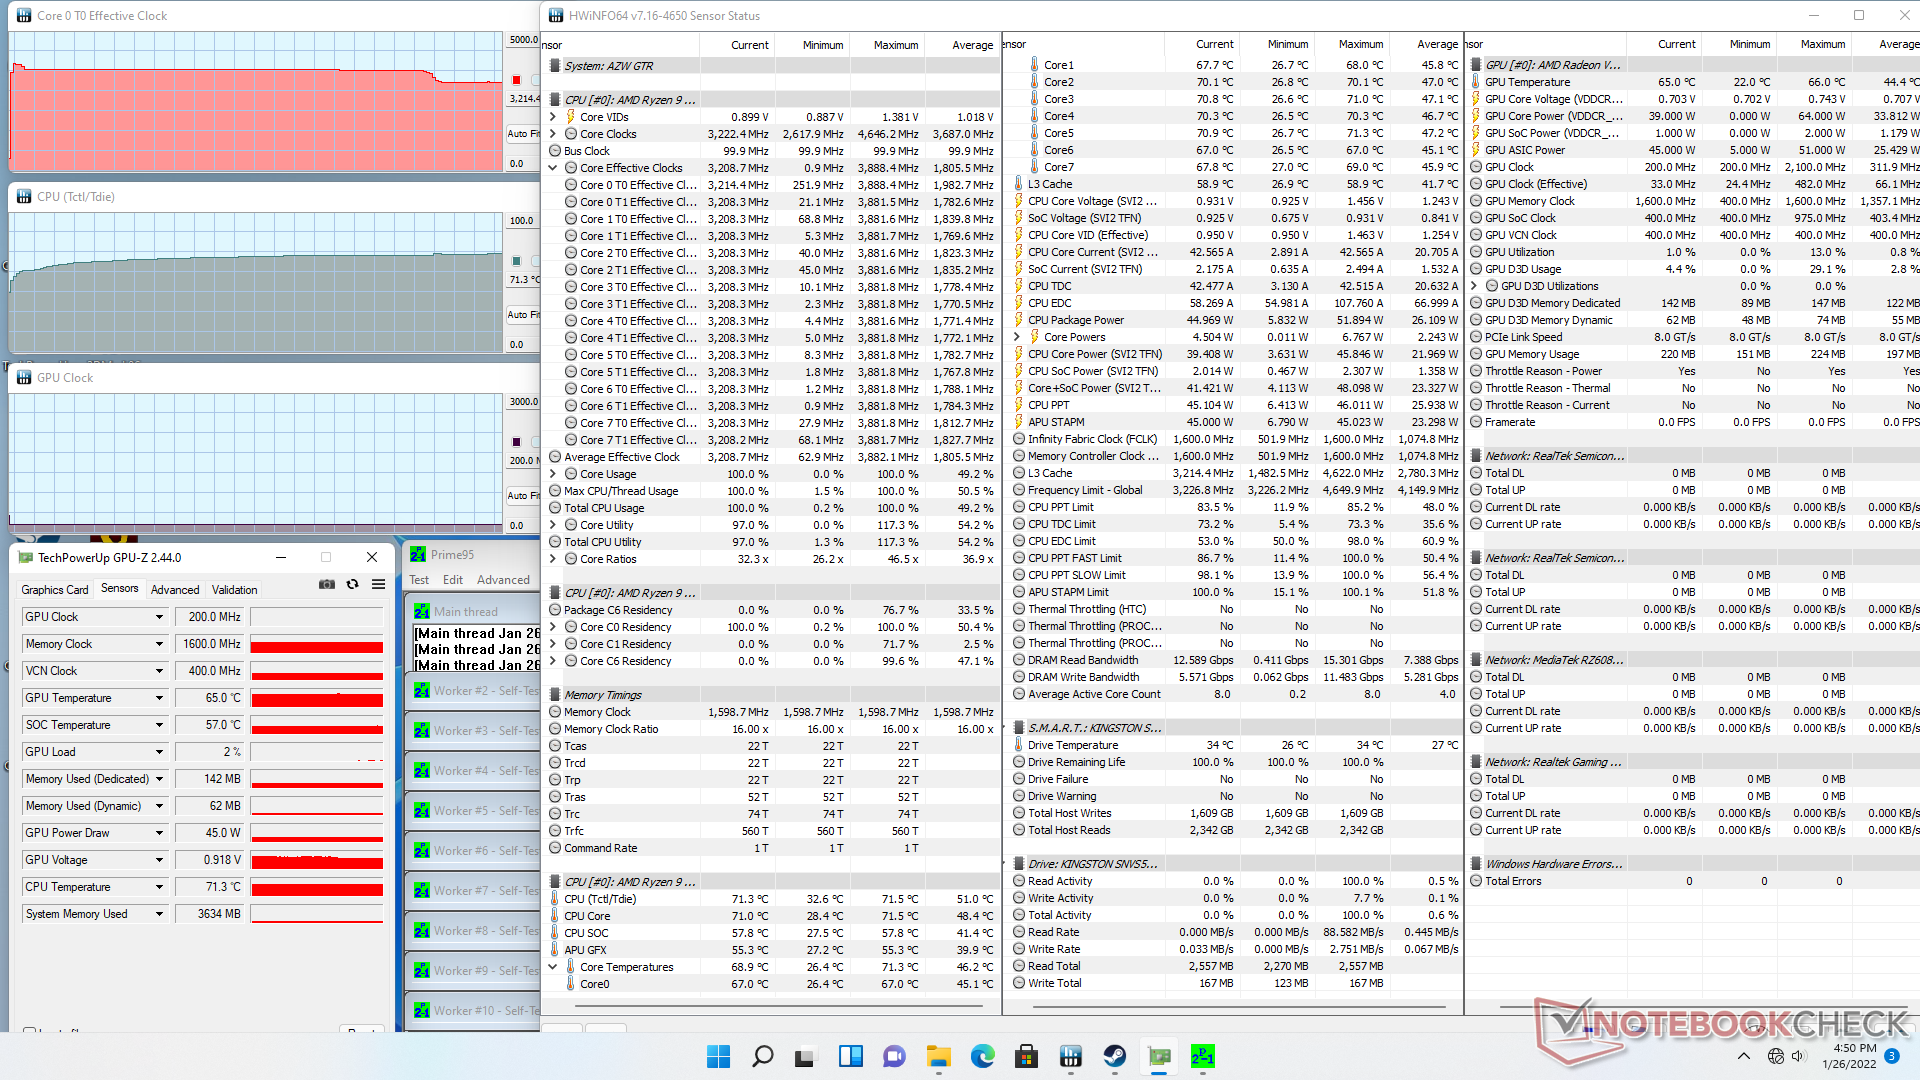
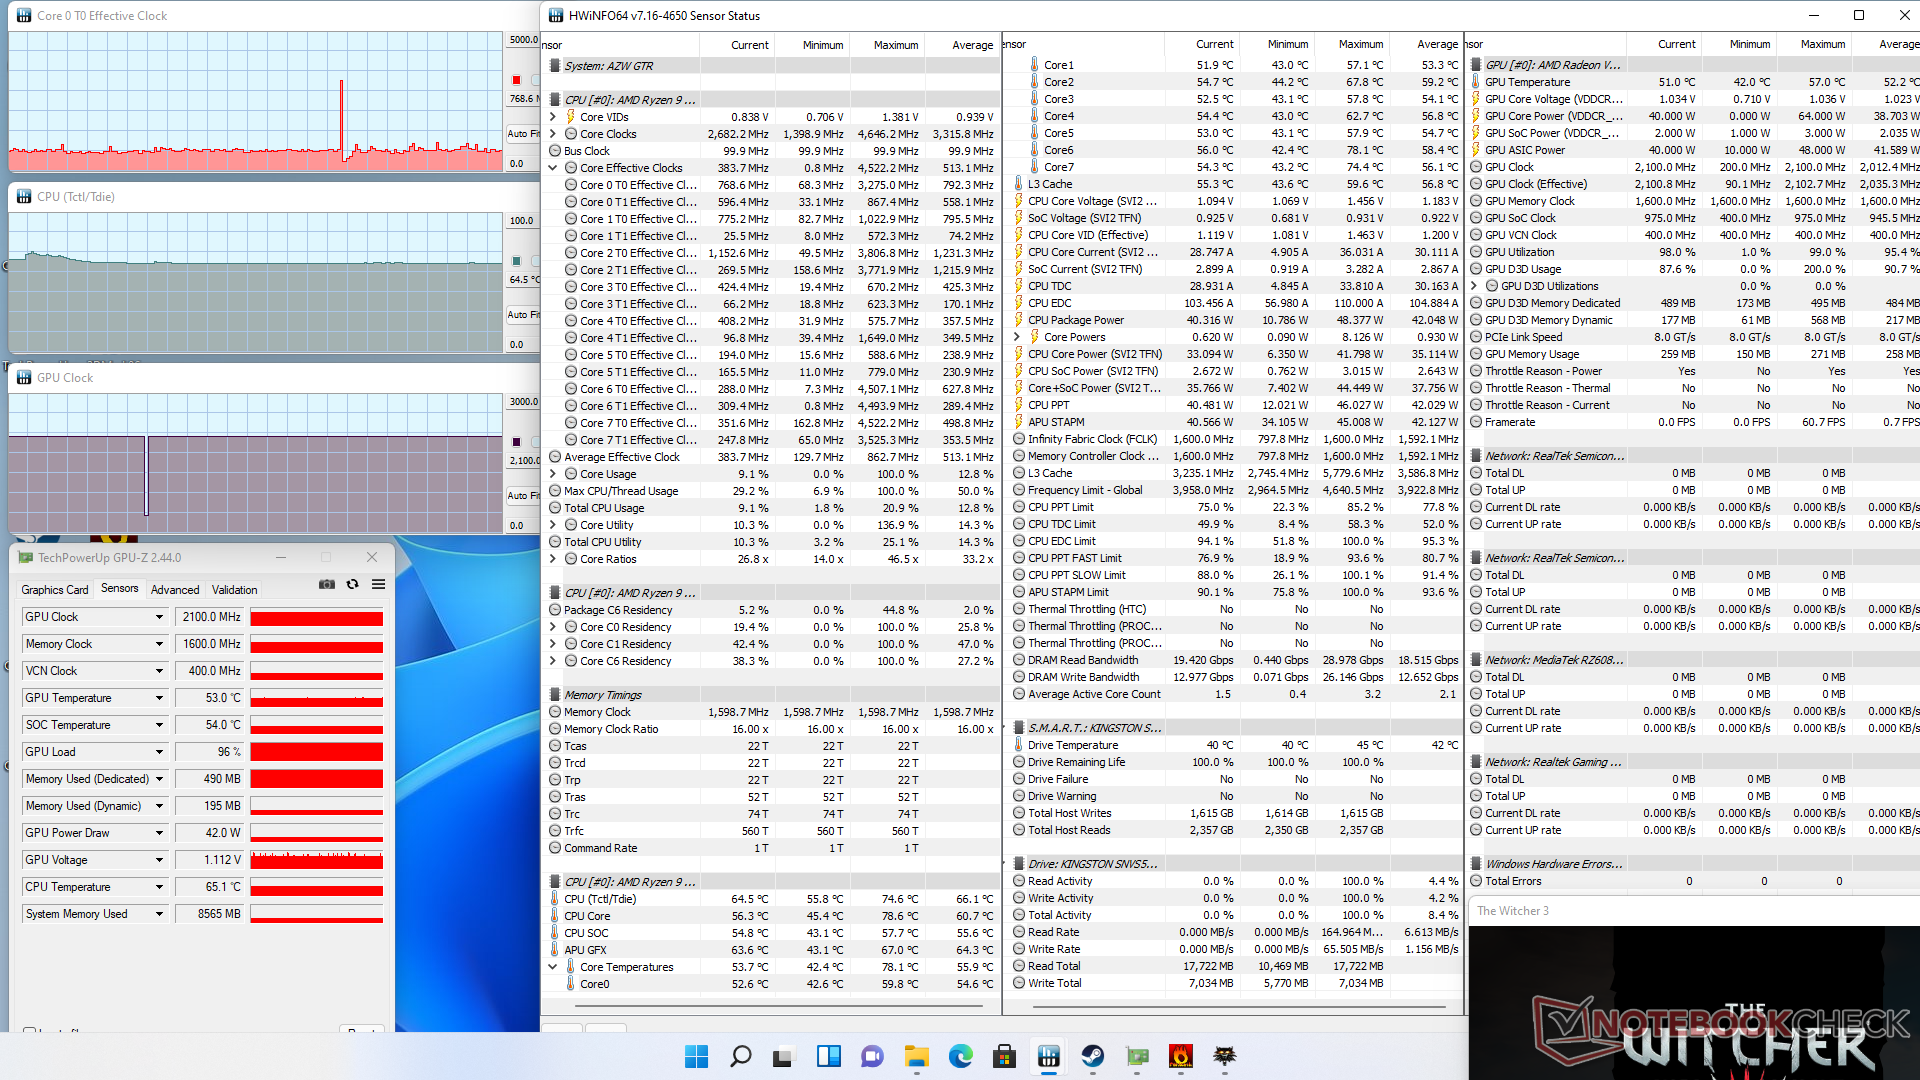
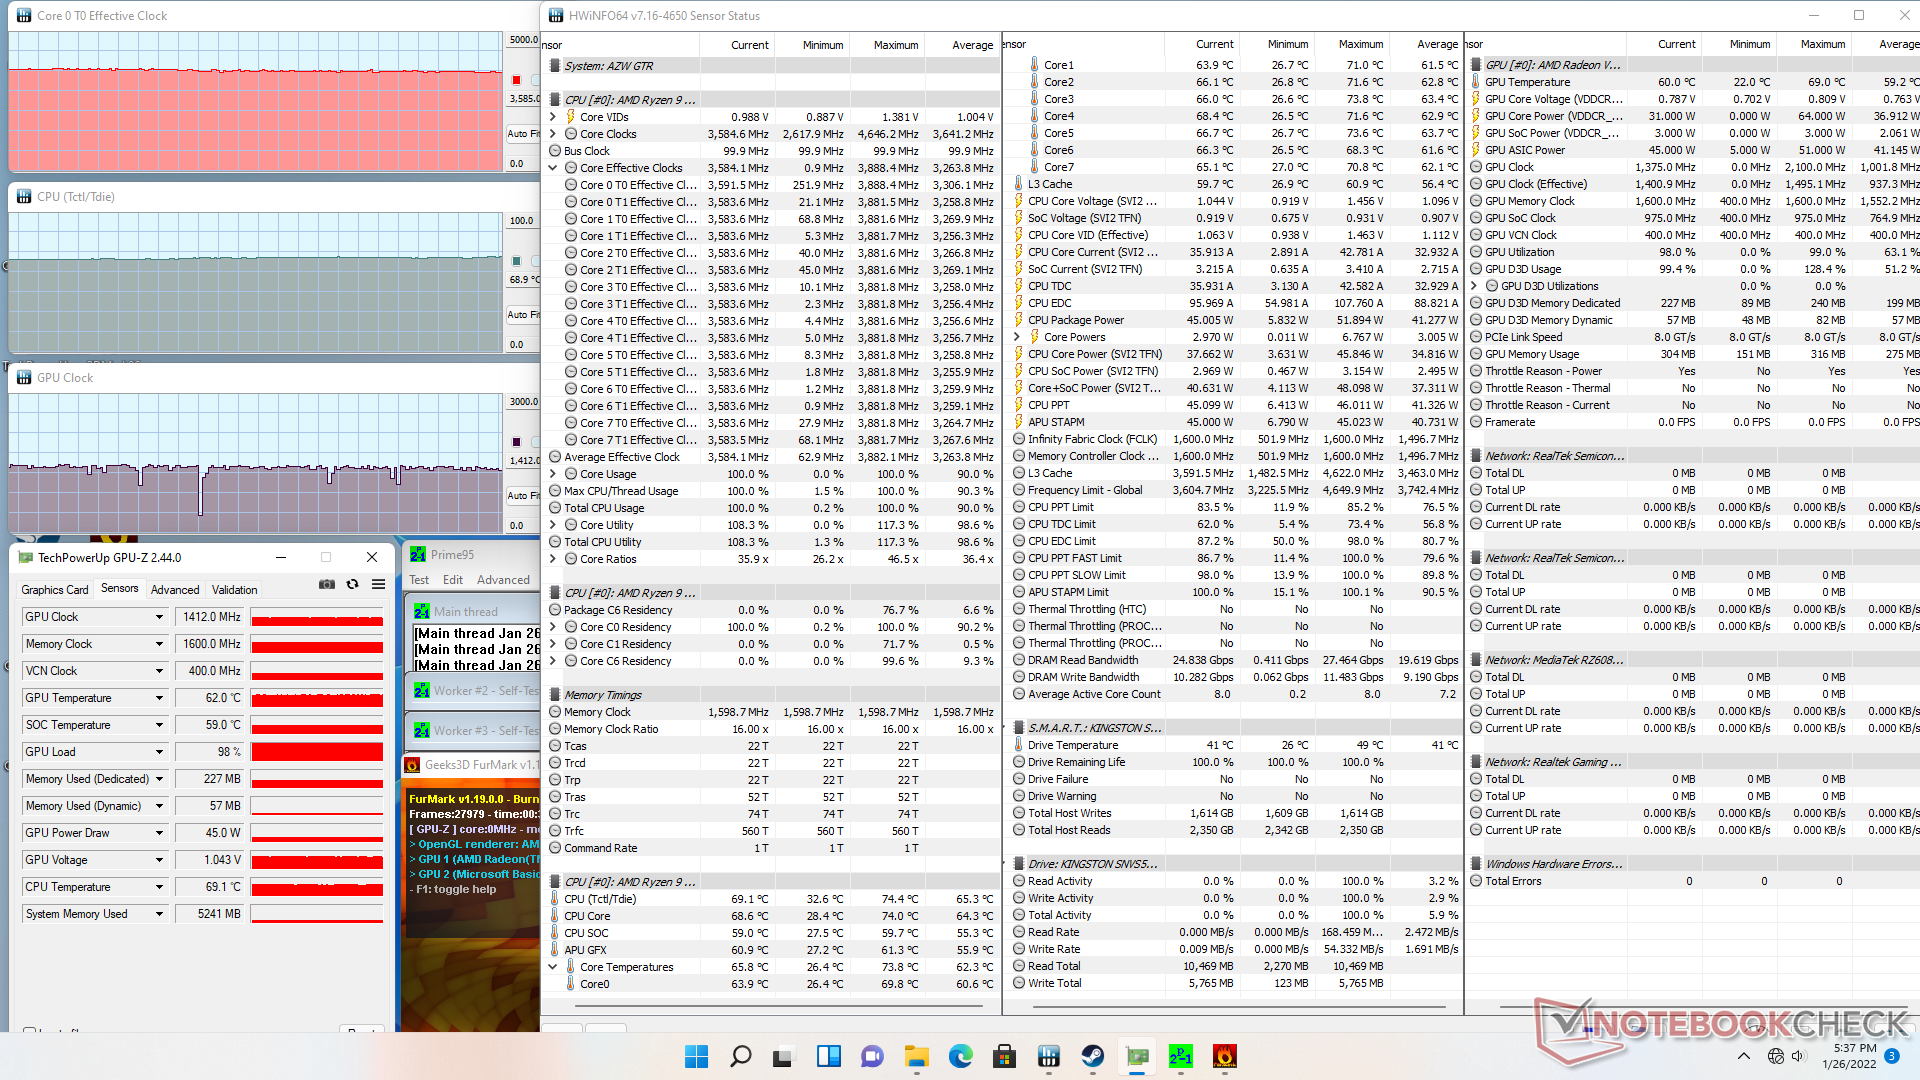
| Clock della CPU (GHz) | Clock della GPU (MHz) | Temperatura media della CPU Tctl/Tdie (°C) | |
| Sistema inattivo | -- | -- | 33 |
| Prime95 Stress | 3.8 | -- | 74 |
| Prime95 + FurMark Stress | 3.6 | 1412 | 69 |
| Witcher 3 Stress | ~0.8 | 2100 | 65 |
Gestione dell'energia
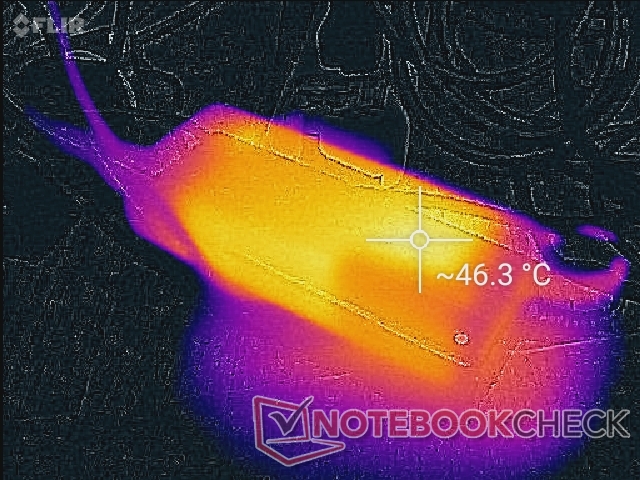
Consumo di energia
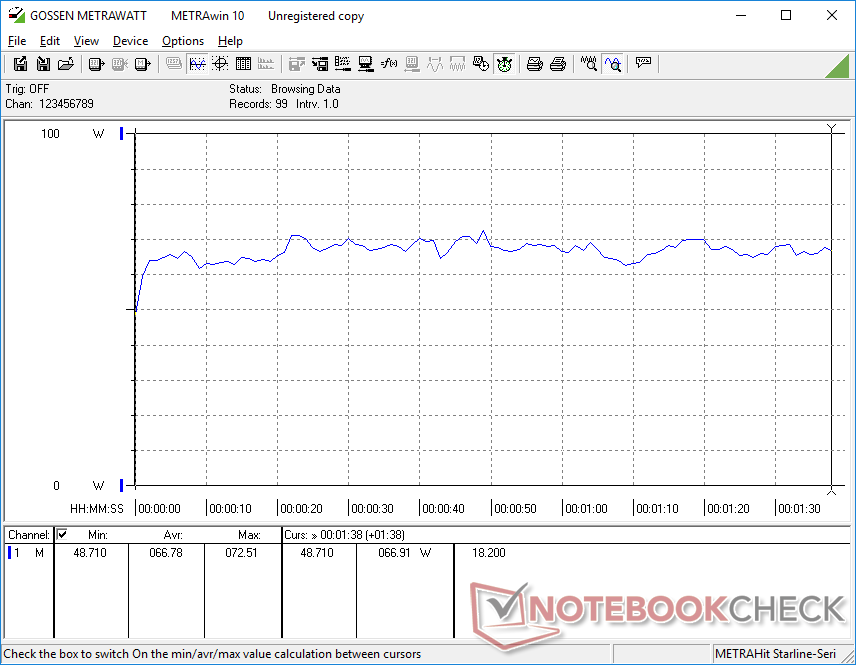
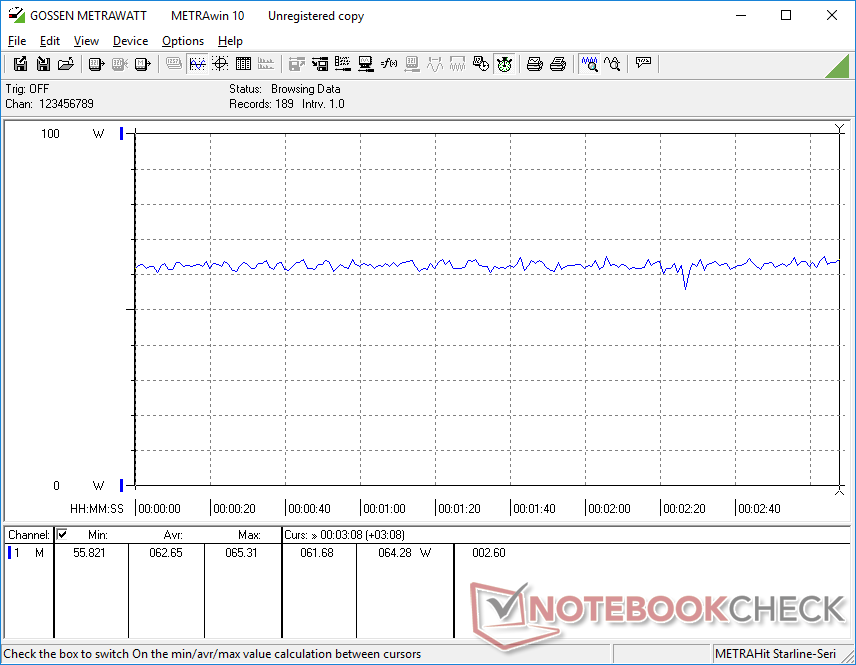
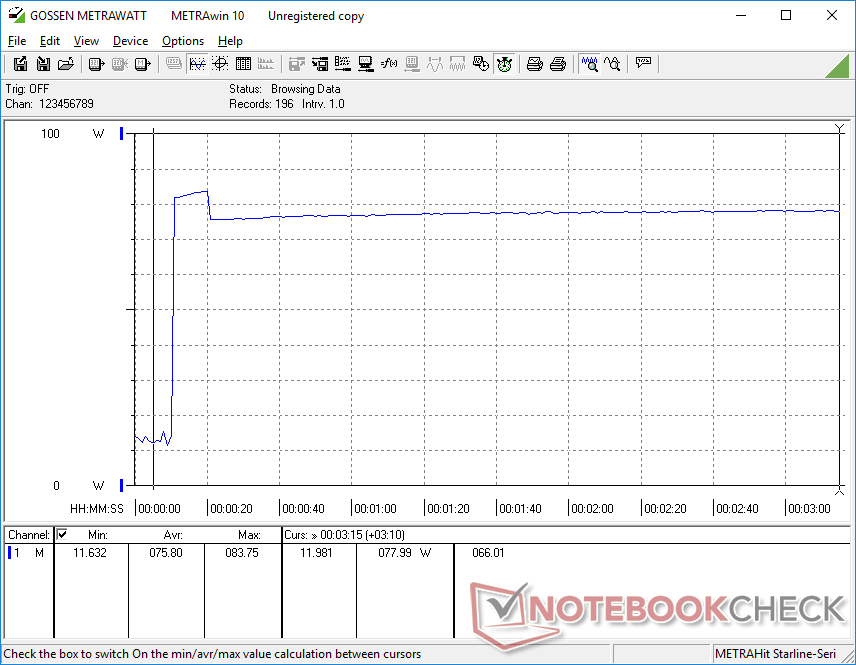
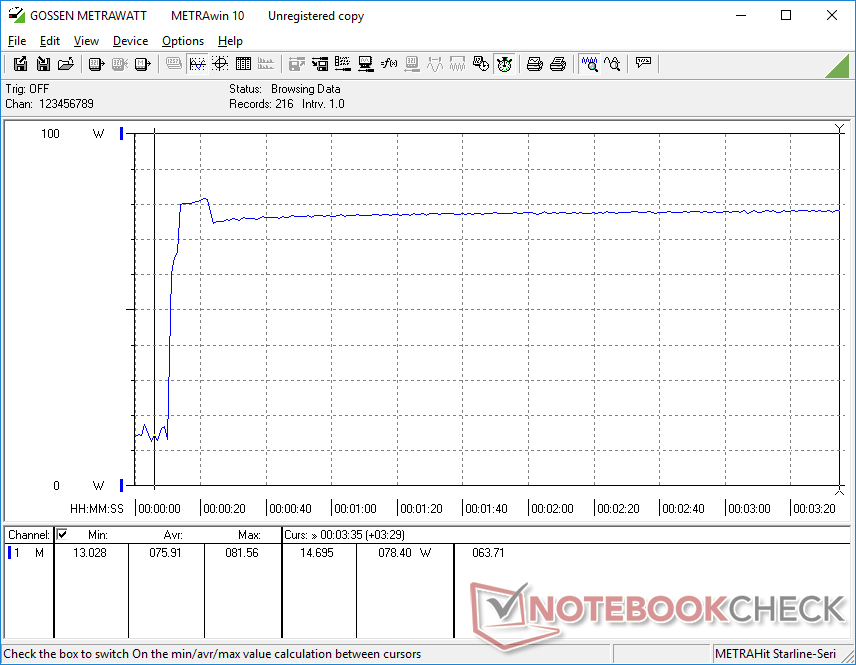
L'esecuzione di carichi più elevati, come i giochi, consumerà circa 2 volte di più rispetto all'Intel Core i7-powered NUC11PAQi7 nonostante le prestazioni grafiche leggermente inferiori della nostra Radeon RX Vega 8. I proprietari del GTR5 otterrebbero ancora circa il 70% di prestazioni della CPU multi-thread più veloci, tuttavia, che possono compensare il suo consumo energetico relativamente più elevato
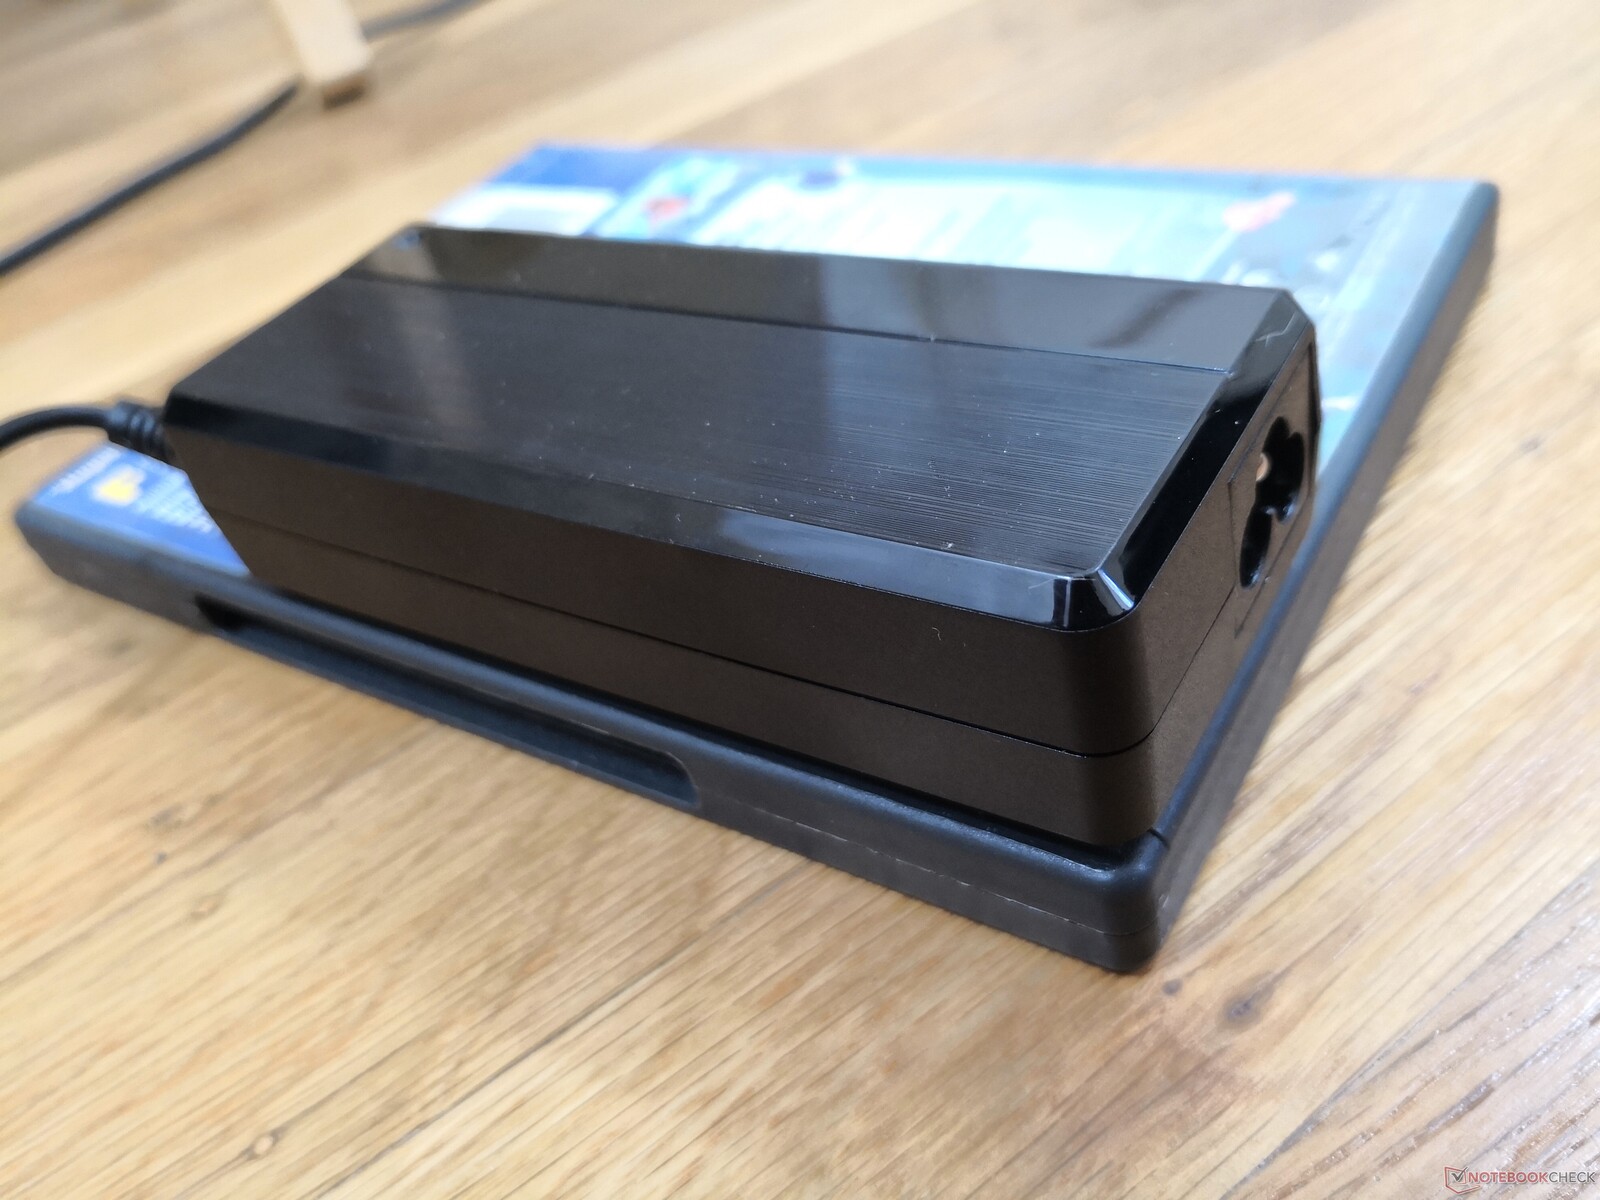
Siamo in grado di registrare un massimo di 82 W dal piccolo (12,5 x 5 x 3 cm) adattatore AC da 90 W durante l'esecuzione di carichi estremi Prime95 e FurMark.
| Off / Standby | |
| Idle | |
| Sotto carico |
|
Leggenda:
min: | |
| Beelink GTR5 R9 5900HX, Vega 8, Kingston NV1 SNVS/500GCN, , x, | Beelink GTI 11 i5-1135G7, Iris Xe G7 80EUs, Kingston SA2000M8500G, , x, | GMK NucBox 2 i5-8259U, Iris Plus Graphics 655, Netac S930E8/256GPN, , x, | Intel NUC11PHKi7C i7-1165G7, GeForce RTX 2060 Mobile, Samsung SSD 980 Pro 500GB MZ-V8P500BW, , x, | Intel NUC11PAQi7 i7-1165G7, Iris Xe G7 96EUs, Samsung SSD 980 Pro 500GB MZ-V8P500BW, , x, | Beelink GK Mini Celeron J4125, UHD Graphics 600, Silicon Motion SM2258XT 256GB, , x, | |
|---|---|---|---|---|---|---|
| Power Consumption | -48% | 23% | -85% | 29% | 66% | |
| Idle Minimum * (Watt) | 6.2 | 15.2 -145% | 6.1 2% | 5.8 6% | 5.6 10% | 3.2 48% |
| Idle Average * (Watt) | 8.9 | 16 -80% | 6.8 24% | 5.9 34% | 5.6 37% | 3.3 63% |
| Idle Maximum * (Watt) | 9 | 16 -78% | 7.3 19% | 20.7 -130% | 6 33% | 3.7 59% |
| Load Average * (Watt) | 66.8 | 48.6 27% | 46.3 31% | 130.8 -96% | 31.4 53% | 13.6 80% |
| Witcher 3 ultra * (Watt) | 62.6 | 53.8 14% | 154.4 -147% | 39 38% | ||
| Load Maximum * (Watt) | 81.6 | 104.3 -28% | 50.7 38% | 225.2 -176% | 80.5 1% | 17.8 78% |
* ... Meglio usare valori piccoli
Power Consumption Witcher 3 / Stresstest
Power Consumption external Monitor
Pro
Contro
Verdetto - Tutto su quel processore
Qualsiasi PC con il Ryzen 9 5900HX sarà incredibilmente veloce per il prezzo e il Beelink GTR5 non fa eccezione. Il processore AMD rivaleggia con qualsiasi soluzione mobile Intel di 11a generazione in termini di prestazioni CPU grezze, compreso il più costoso Core i9-11900H. Se vuoi massimizzare le prestazioni del processore mantenendo il sistema il più piccolo possibile, allora il GTR5 sarà la tua scommessa migliore
Per le massime prestazioni della CPU a costi e dimensioni minime, non cercate oltre il Beelink GTR5.
Ci sono due svantaggi principali da tenere a mente. In primo luogo, la grafica è limitata dalla GPU integrata Radeon Vega 8, mentre la maggior parte dei portatili con la stessa CPU sarebbero in genere dotati di una grafica discreta più veloce. Gli utenti saranno quasi sicuramente legati alla GPU quando si eseguono applicazioni più intense come l'editing grafico o il gioco. È un peccato che Thunderbolt non sia supportato, il che avrebbe risolto questa limitazione tramite le eGPU. In secondo luogo, il rumore della ventola è più forte della maggior parte degli altri mini PC come risultato diretto dell'inserimento di un processore così veloce in uno chassis di dimensioni così ridotte. Quindi, il GTR5 potrebbe non essere la scelta migliore per le configurazioni HTPC o sala conferenze dove il rumore ambientale dovrebbe essere mantenuto al minimo. Forse un passaggio al raffreddamento a camera di vapore in futuro potrebbe ridurre il rumore complessivo della ventola. I cacciatori di prestazioni della CPU con un budget più limitato saranno comunque impressionati da ciò che il GTR5 ha da offrire.
Prezzo e disponibilità
Il Beelink GTR5 non è ancora ampiamente disponibile. La sua pagina Indiegogo può essere trovata qui.
Price comparison

