La nostra migliore alternativa Intel NUC 11: Recensione del mini PC Beelink GTI 11
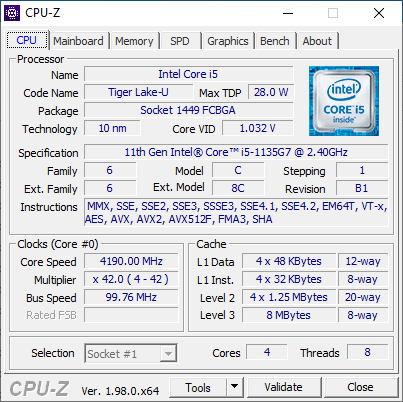
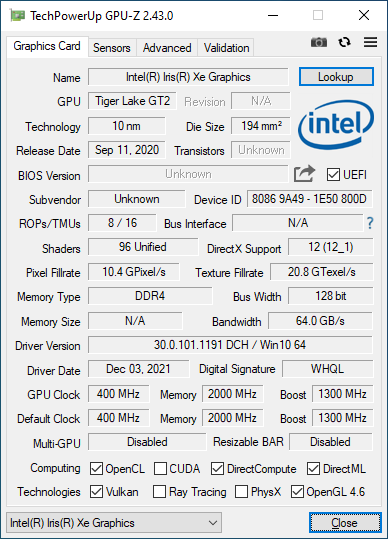
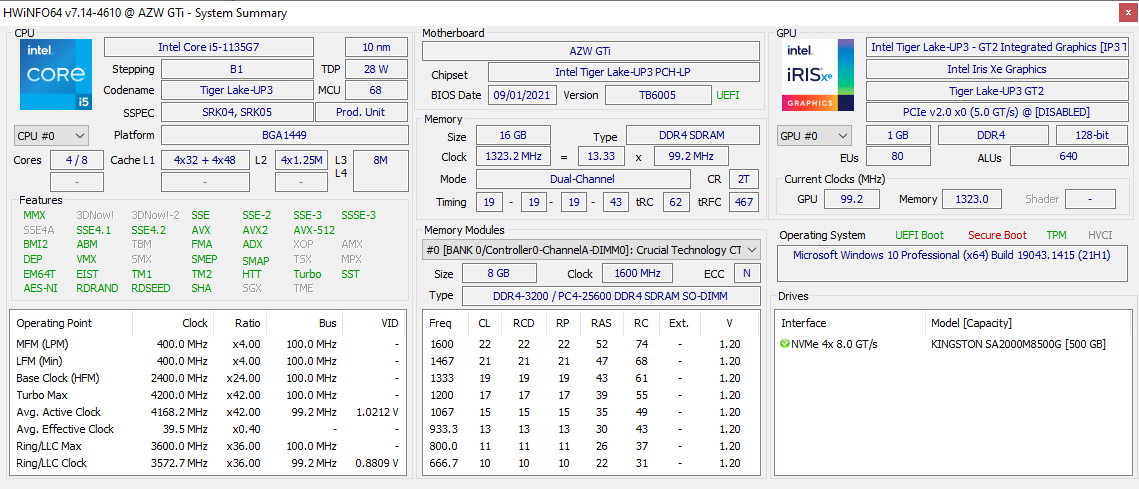
Beelink ha un'intera gamma di mini PC disponibili per gli acquirenti interessati all'esperienza Intel NUC senza dover pagare gli alti prezzi Intel NUC. Il modello più recente è il GTI 11 che utilizza l'ultimo processore 11° gen Tiger Lake-U Core i5-1135G7 con grafica integrata Iris Xe 80 EUs. Questo dettaglio è degno di nota in quanto la maggior parte degli altri mini PC Beelink si basano tipicamente su CPU più vecchie o più lente al fine di mantenere i costi a livelli più accessibili. Il GTI 11 è quindi uno dei mini PC più veloci e più costosi nella linea attuale di Beelink.
Le alternative al GTI 11 includono altri mini PC alimentati da CPU Intel Core serie U di 11a generazione come l Intel NUC11 Phantom Canyon, Beelink GMK NucBoc 2o Zotac ZBox CI665 Nano
Altre recensioni su Beelink:
Potential Competitors in Comparison
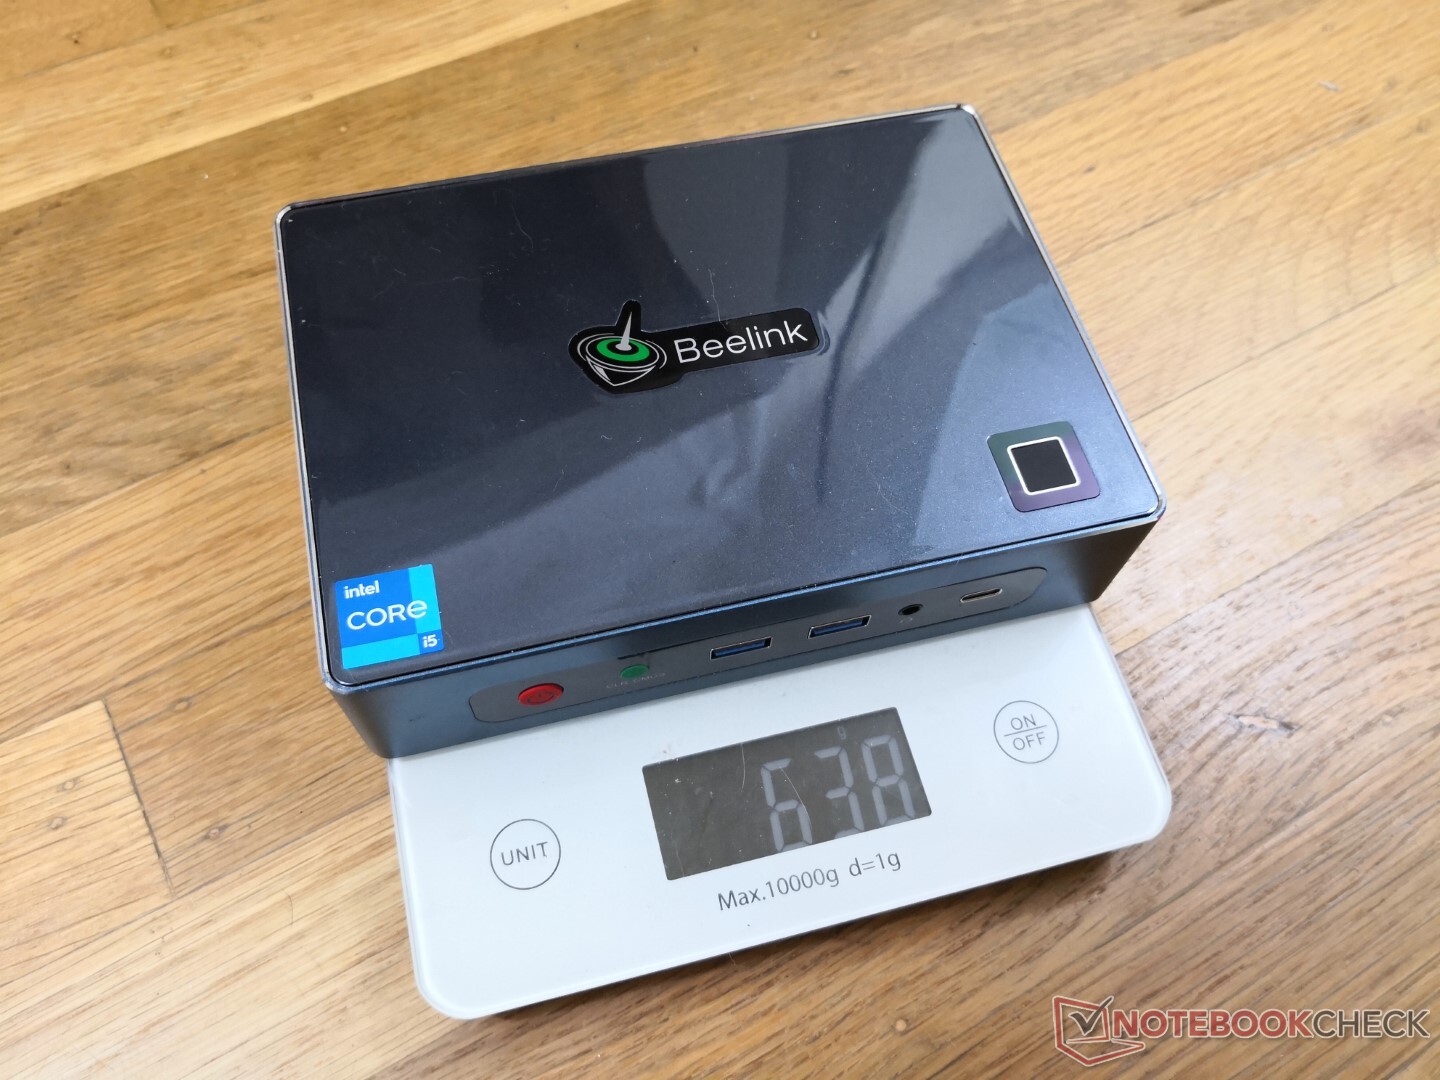
Punteggio | Data | Modello | Peso | Altezza | Dimensione | Risoluzione | Prezzo |
|---|---|---|---|---|---|---|---|
v (old) | 12/2021 | Beelink GTI 11 i5-1135G7, Iris Xe G7 80EUs | 638 gr | 39 mm | x | ||
v (old) | 11/2021 | Beelink SER3 R7 3750H, Vega 10 | 492 gr | 40 mm | x | ||
v (old) | 04/2021 | Intel NUC11TNKi5 i5-1135G7, Iris Xe G7 80EUs | 504 gr | 37 mm | x | ||
v (old) | 02/2020 | Intel NUC10i7FNH i7-10710U, UHD Graphics 620 | 697 gr | 51 mm | 0.00" | 0x0 | |
v (old) | 03/2021 | GMK NucBox 2 i5-8259U, Iris Plus Graphics 655 | 430 gr | 50 mm | x | ||
v (old) | 04/2018 | Intel Hades Canyon NUC8i7HVK i7-8809G, Vega M GH | 1.3 kg | 39 mm | x |
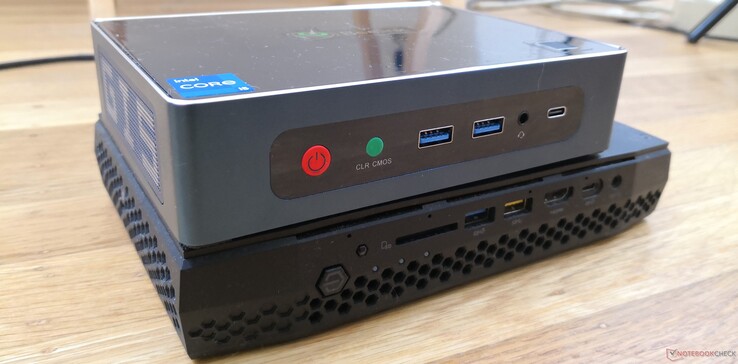
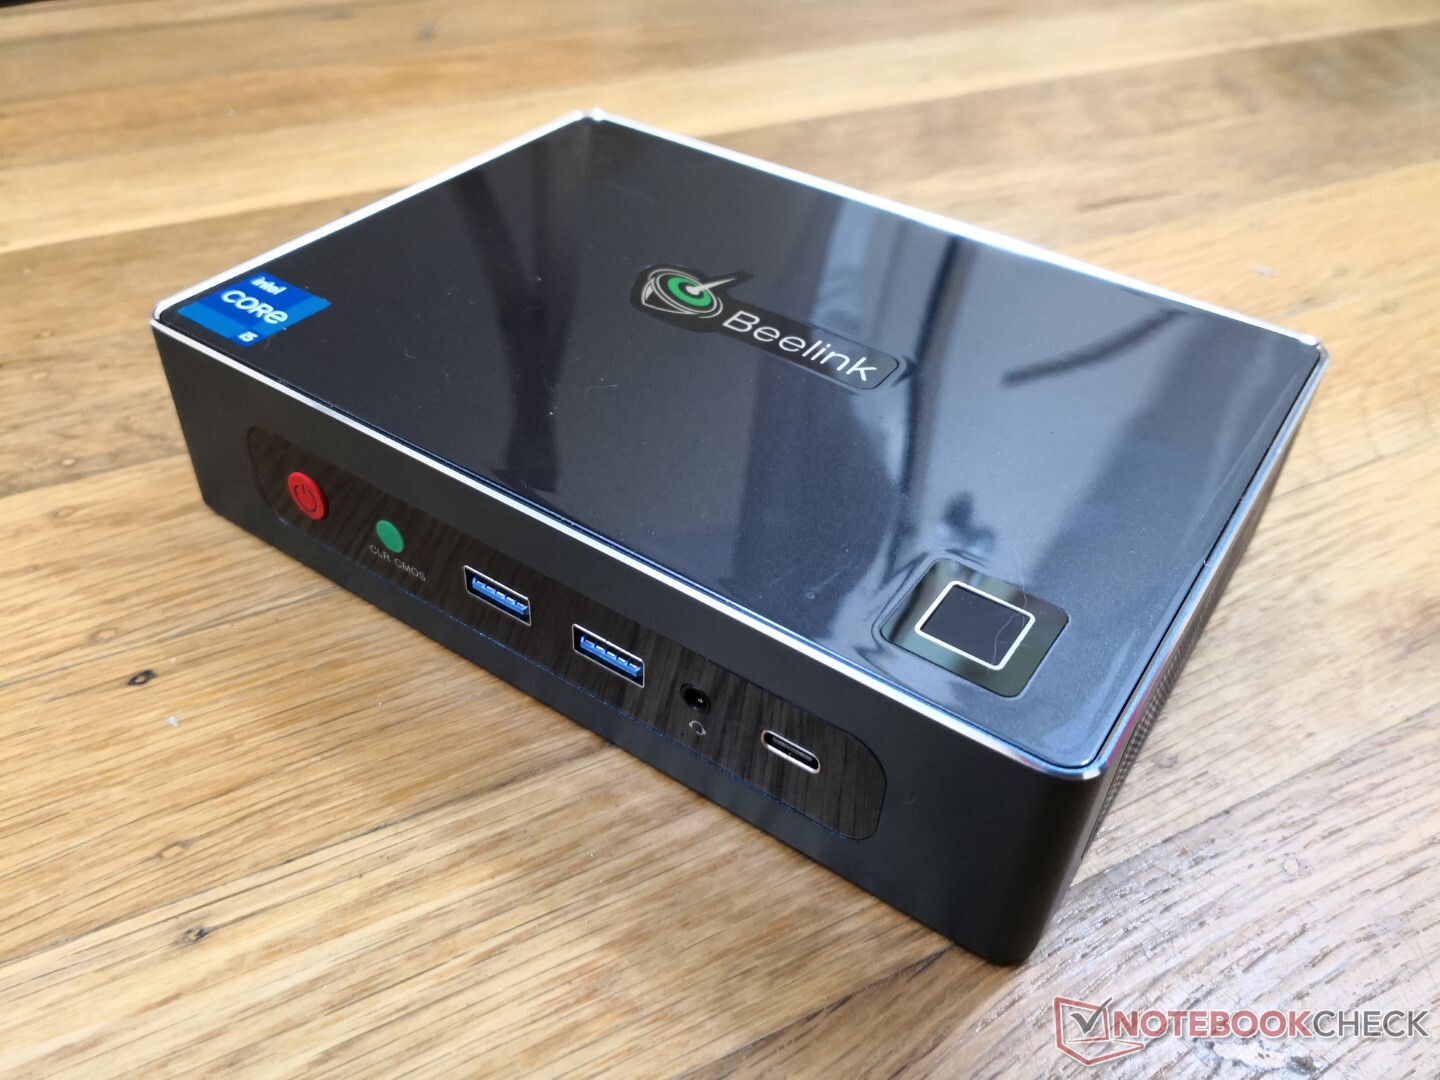
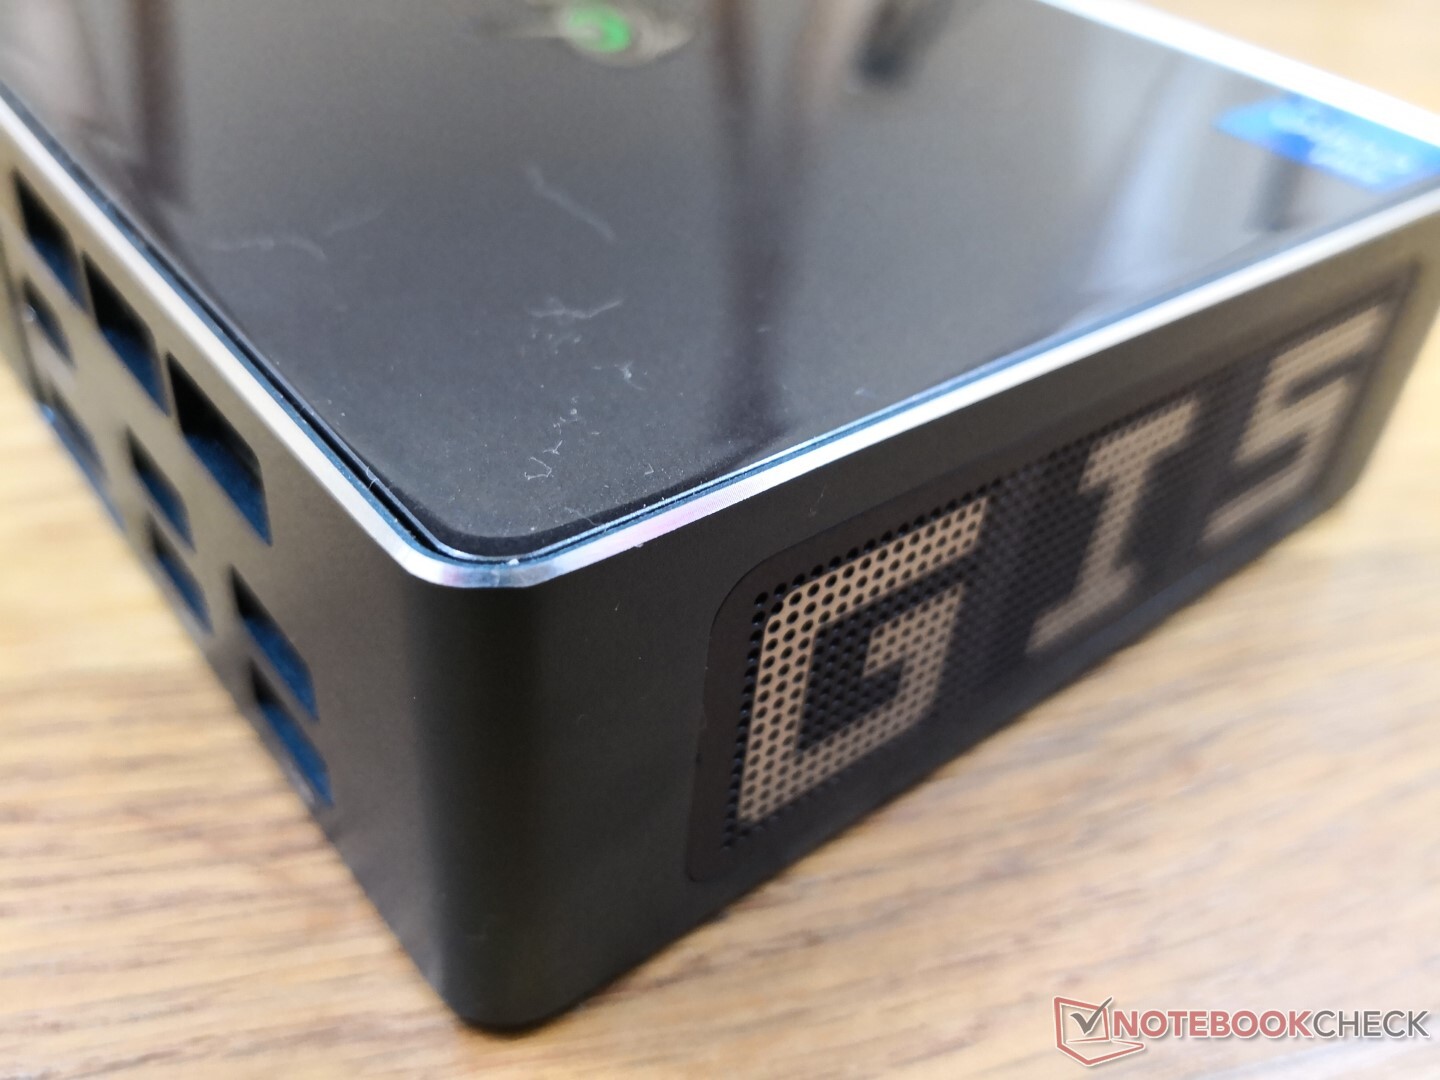
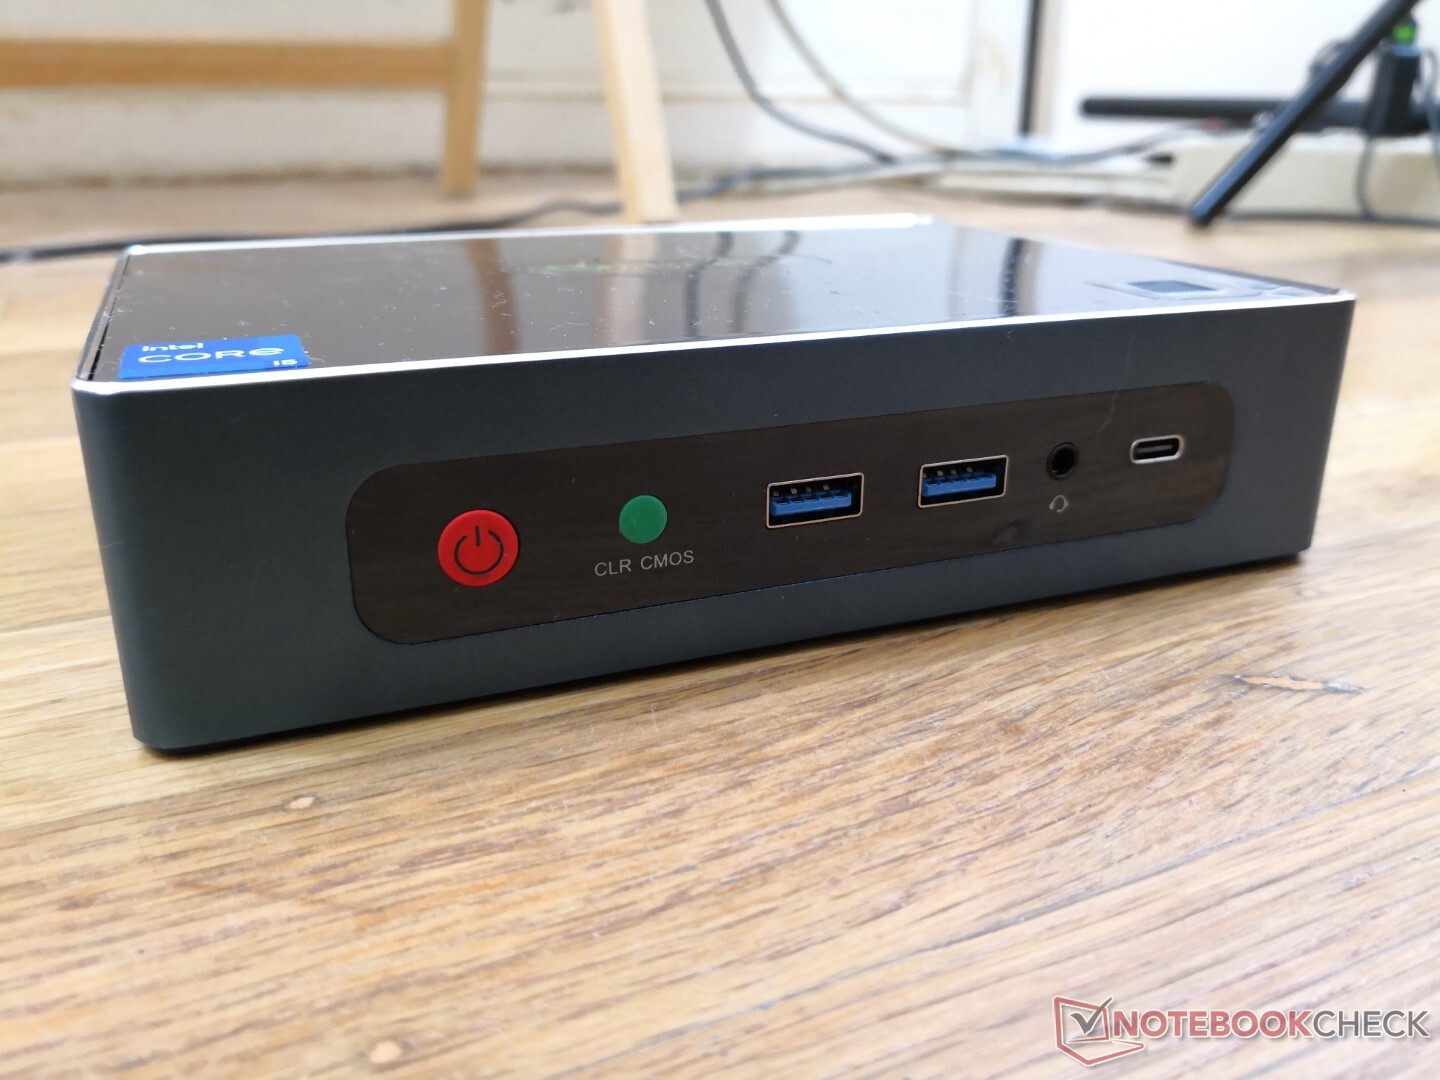
Caso
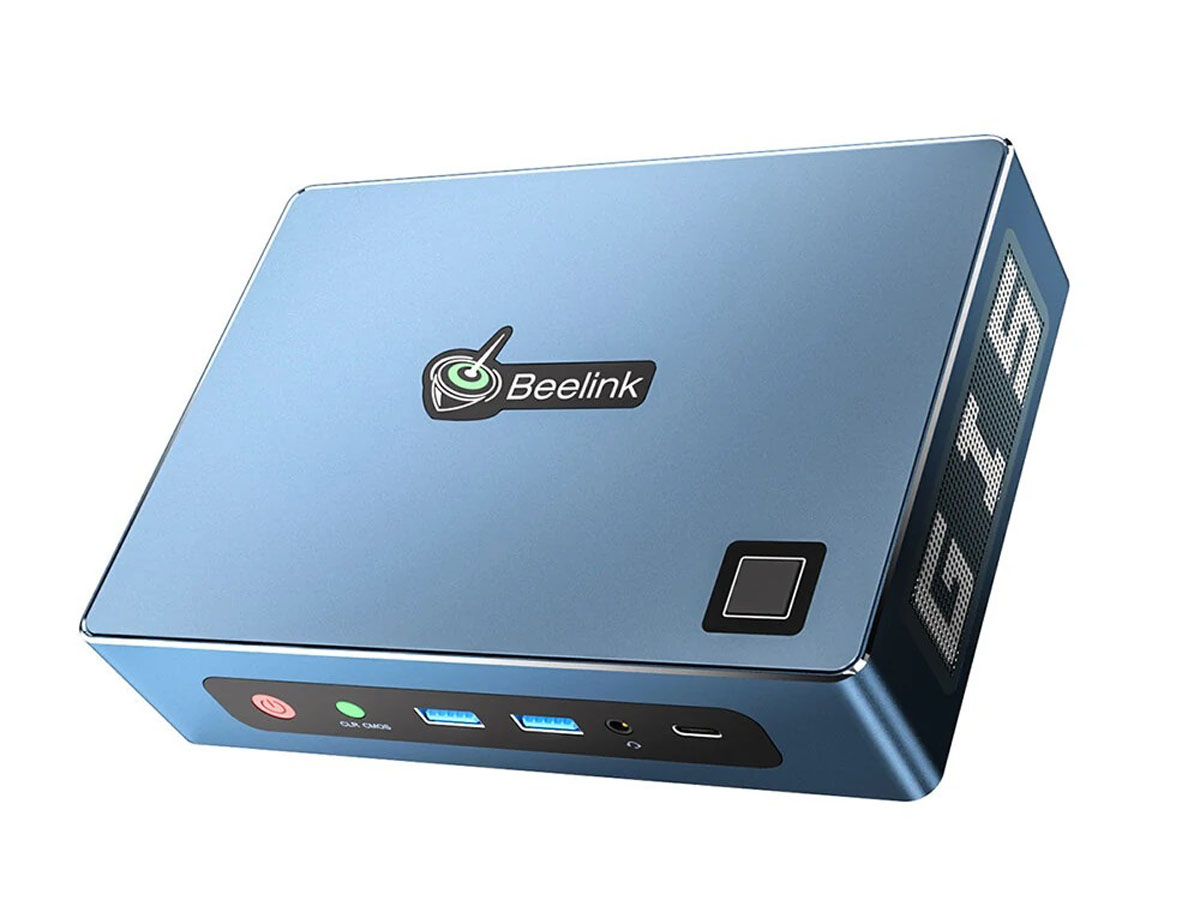
Lo scheletro è fatto di materiali più sottili e meno metallo che su un Intel NUC probabilmente per mantenere bassi sia i costi che il peso. La qualità costruttiva è ancora eccellente e senza flessioni o punti visibilmente deboli. Non ci piace particolarmente la parte superiore in plastica lucida, tuttavia, in quanto attira sia le impronte digitali che i graffi molto rapidamente
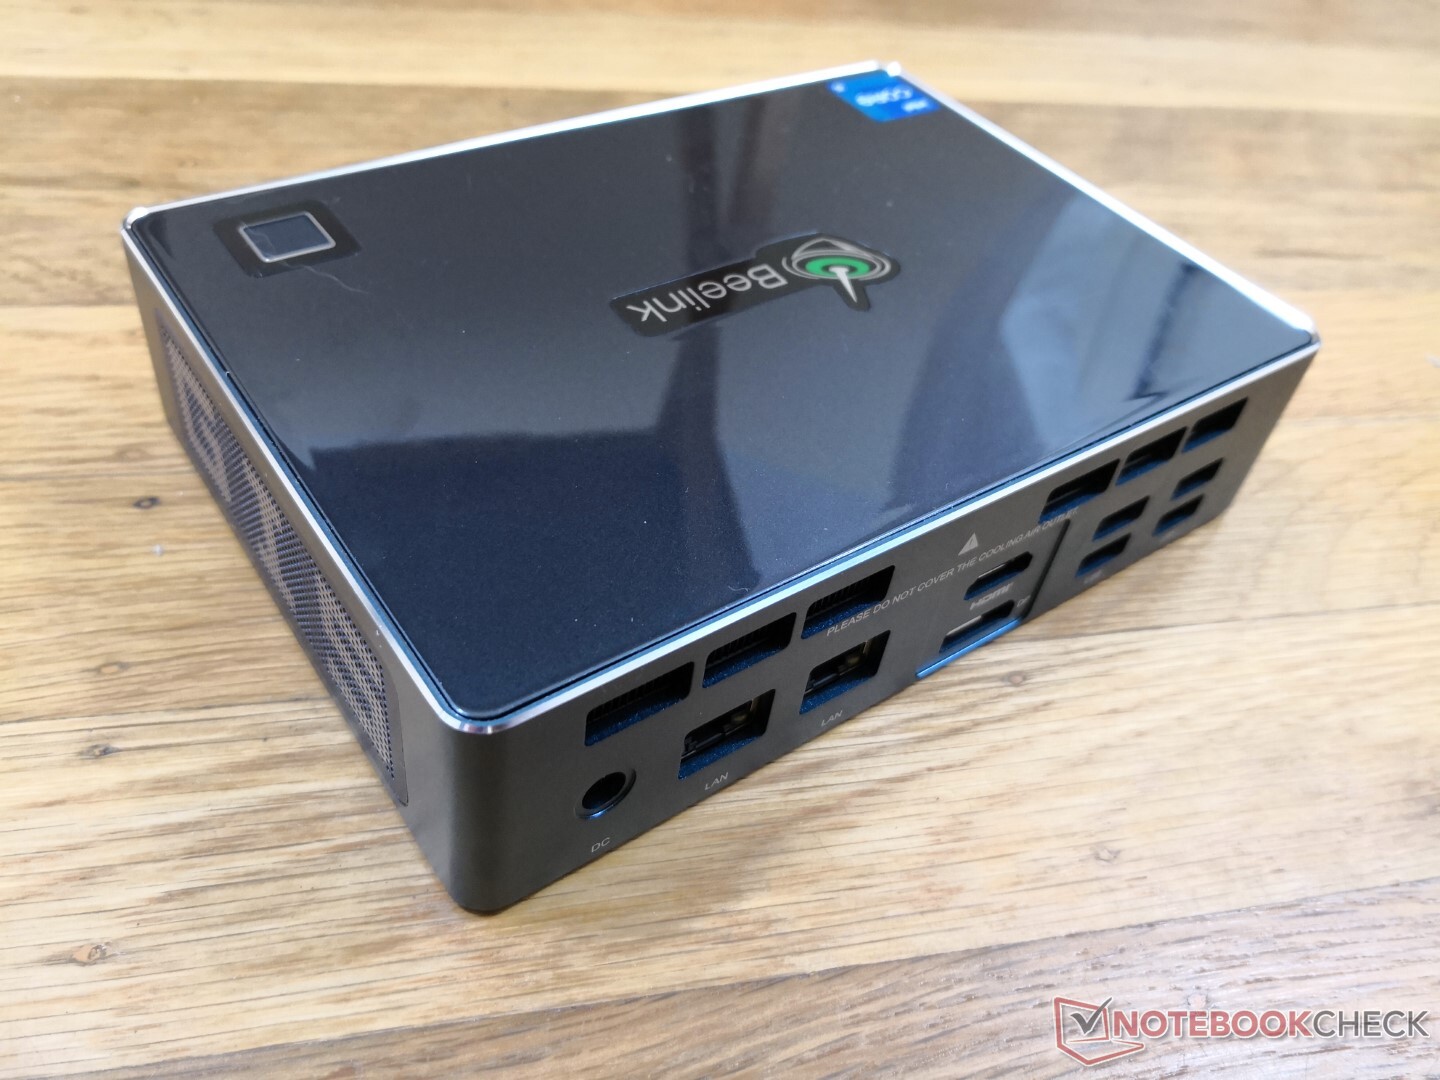
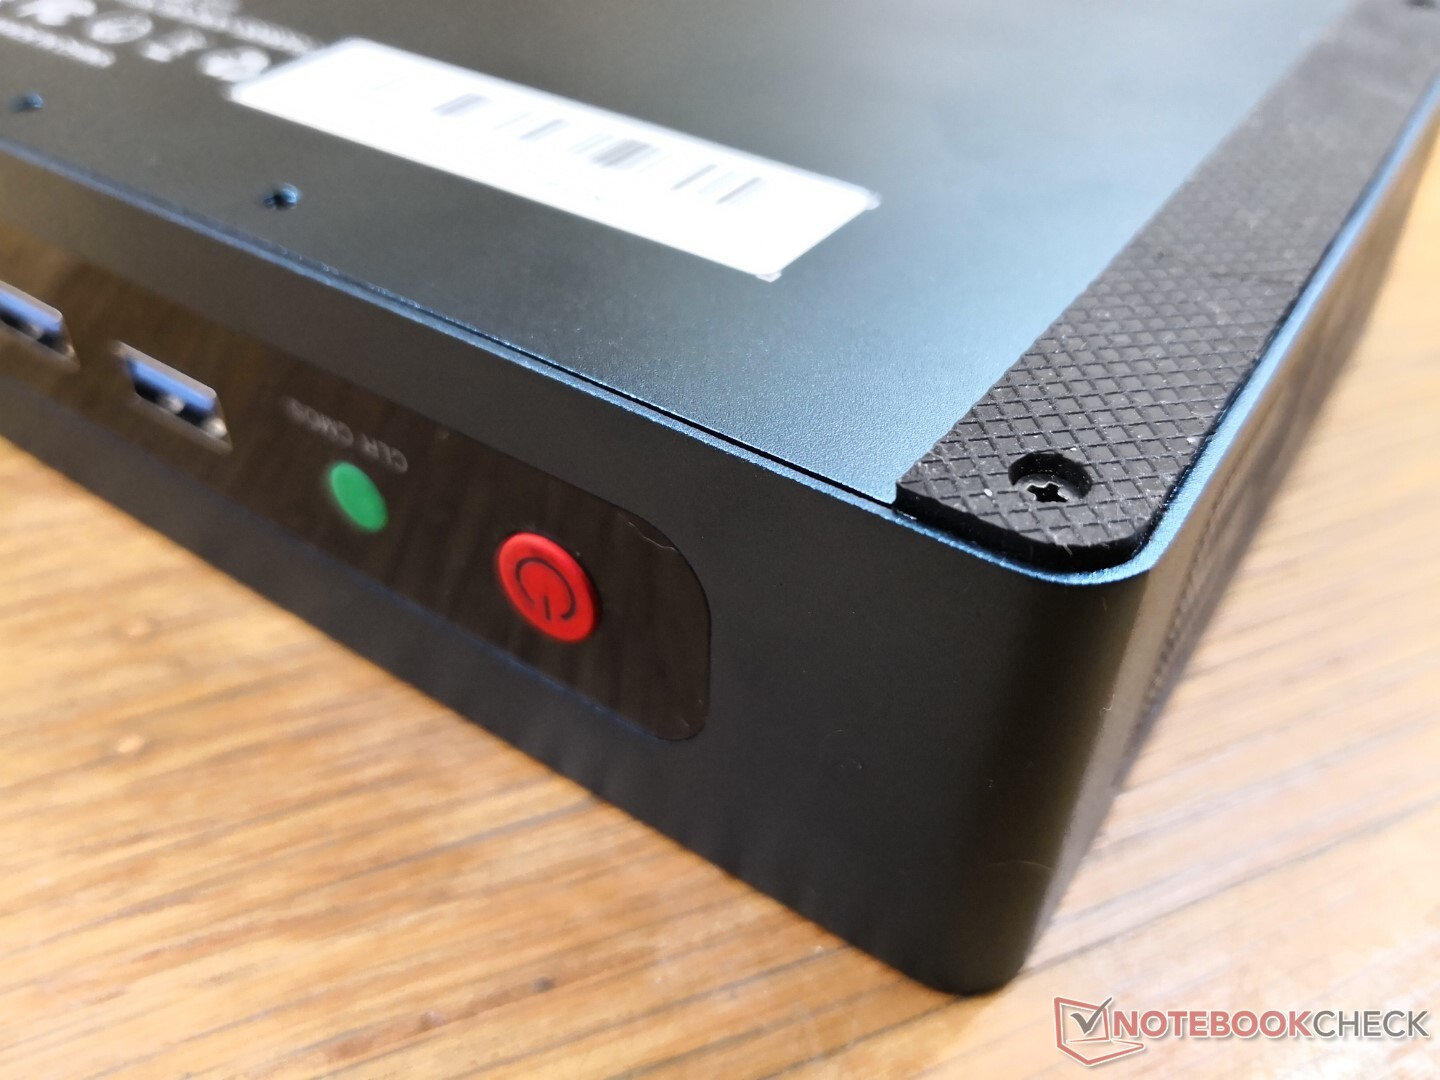
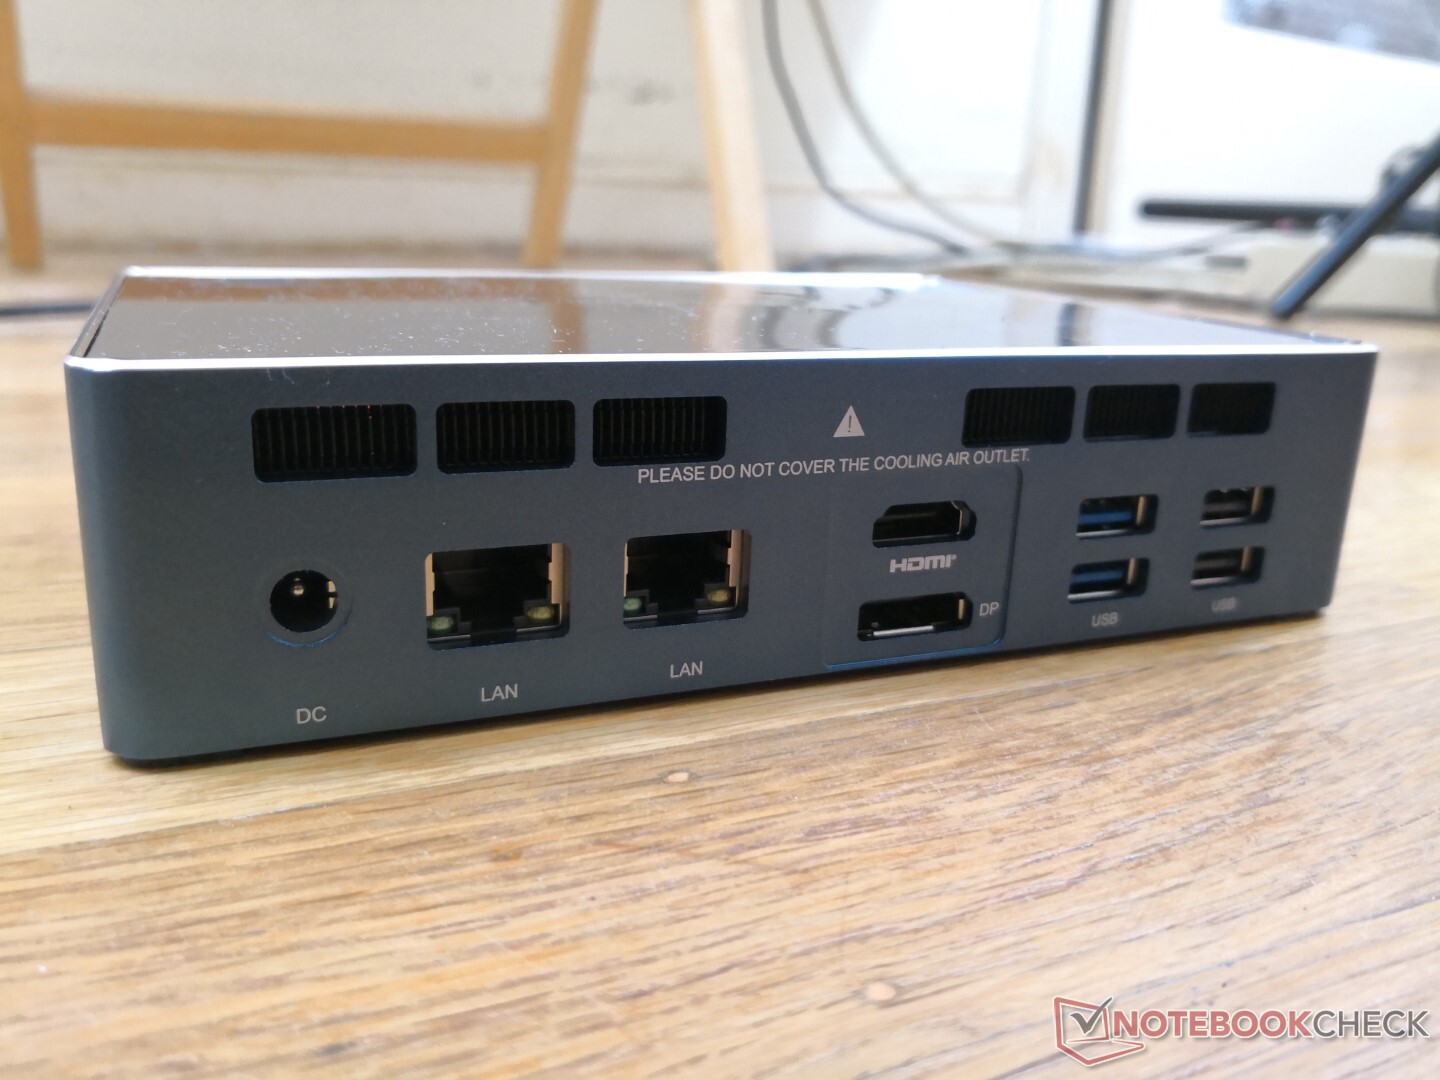
Connettività
Ci sono molte porte tra cui scegliere, tra cui più porte RJ-45, più porte HDMI e sei porte USB-A. La porta USB-C supporta anche i dispositivi Thunderbolt 4 anche se il produttore non lo pubblicizza. Il Thunderbolt Control Center è preinstallato e il suo file DxDiag conferma anche il supporto Thunderbolt.
La singola porta USB-C può sembrare limitante e non c'è una mini-DisplayPort o un blocco Kensington, in contrasto con l'Intel NUC11TNKi5 Pro.
Una nota particolare è che il Beelink può essere alimentato da USB-C al posto dell'adattatore AC proprietario. Abbiamo testato questo con un adattatore USB-C da 130 W da un Dell XPS 15 9500 che ha funzionato senza problemi sulla nostra unità Beelink.
Comunicazione
Moduli di comunicazione wired e wireless incorporati, confrontare i dati dei test di rete con quelli della concorrenza, soluzioni alternative disponibili (5G/LTE), irregolarità (ricezione radio)?
| Networking | |
| iperf3 transmit AX12 | |
| Intel NUC11TNKi5 | |
| Beelink GTI 11 | |
| GMK NucBox 2 | |
| Intel Hades Canyon NUC8i7HVK | |
| Beelink SER3 | |
| iperf3 receive AX12 | |
| Intel NUC11TNKi5 | |
| Beelink GTI 11 | |
| Beelink SER3 | |
| GMK NucBox 2 | |
| Intel Hades Canyon NUC8i7HVK | |
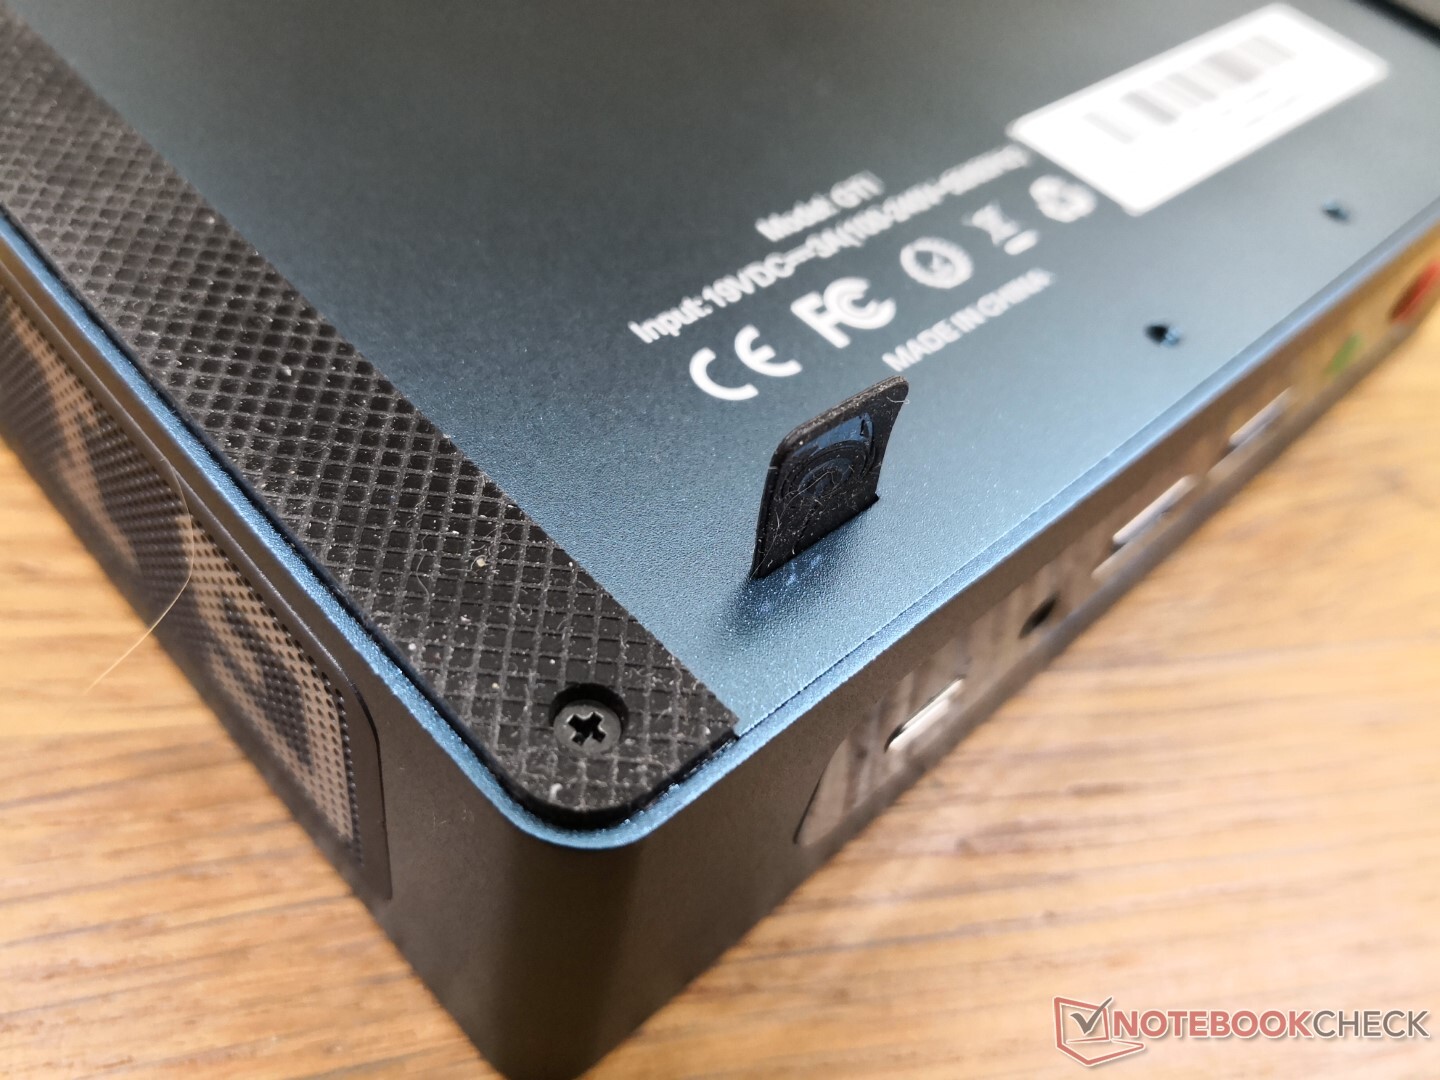
Manutenzione
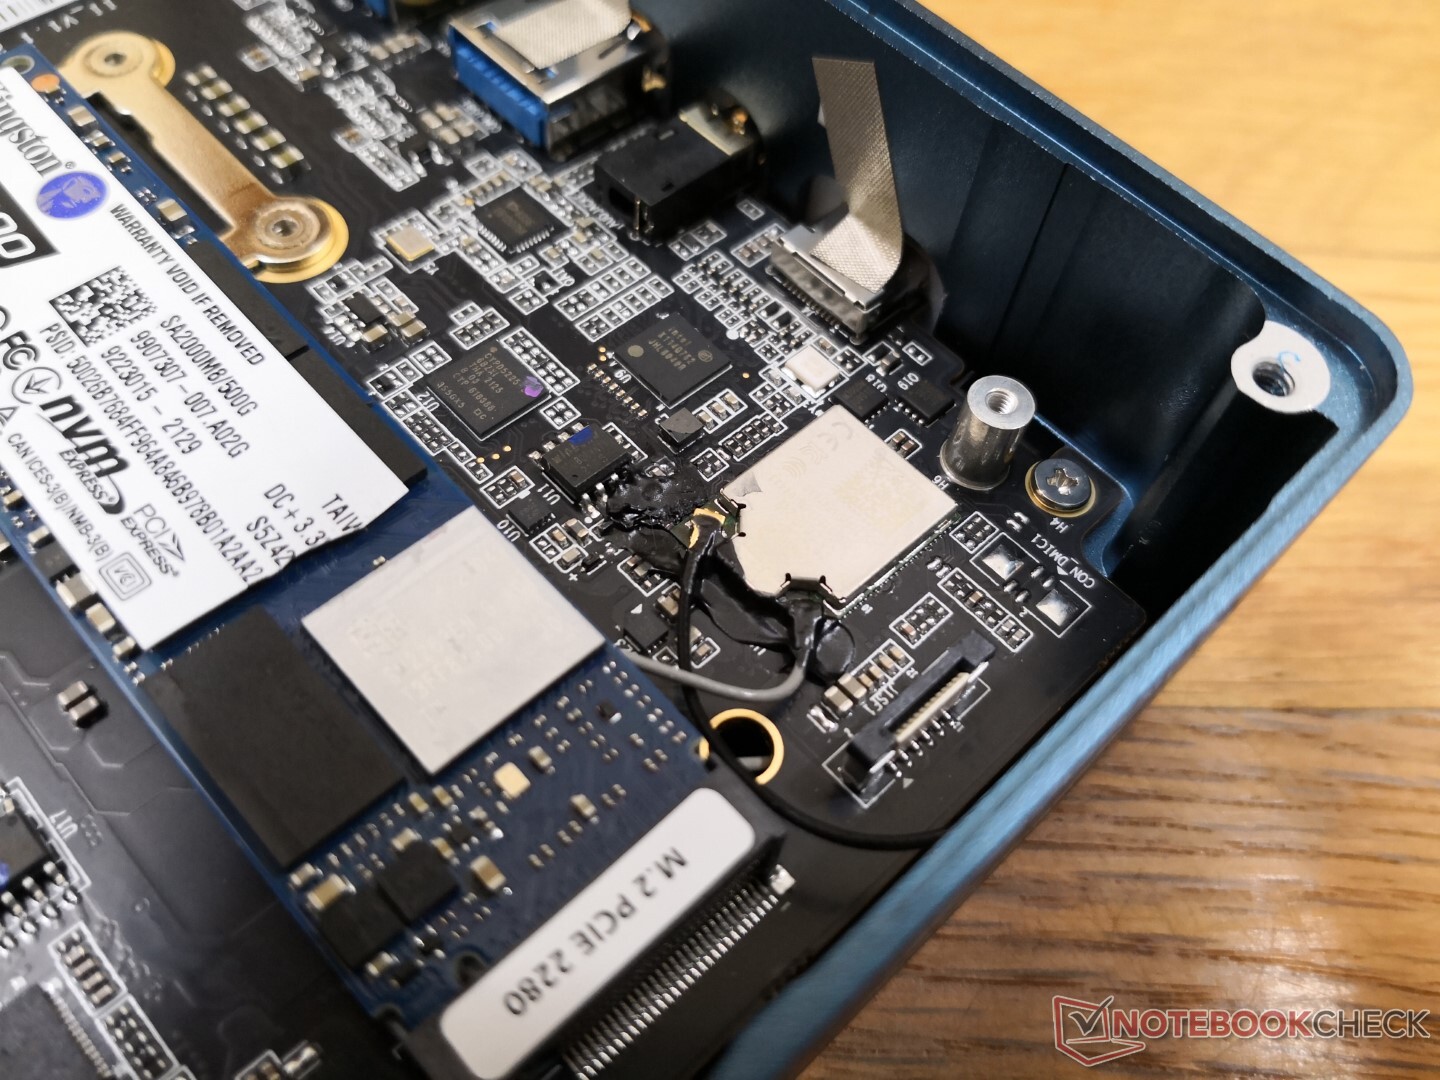
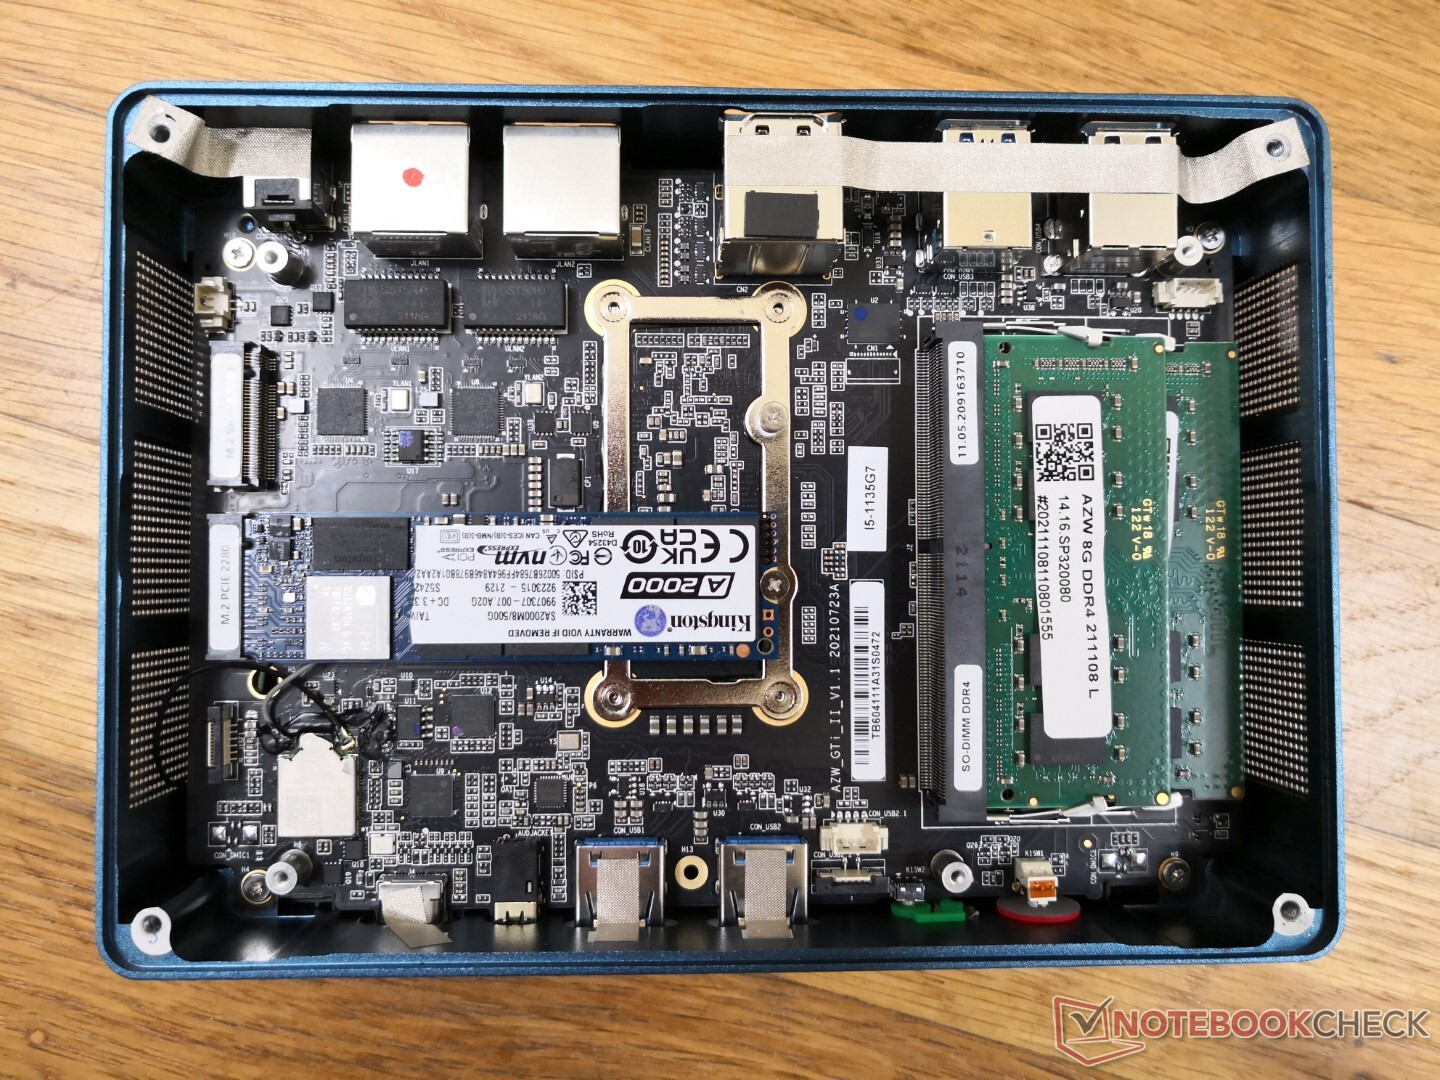
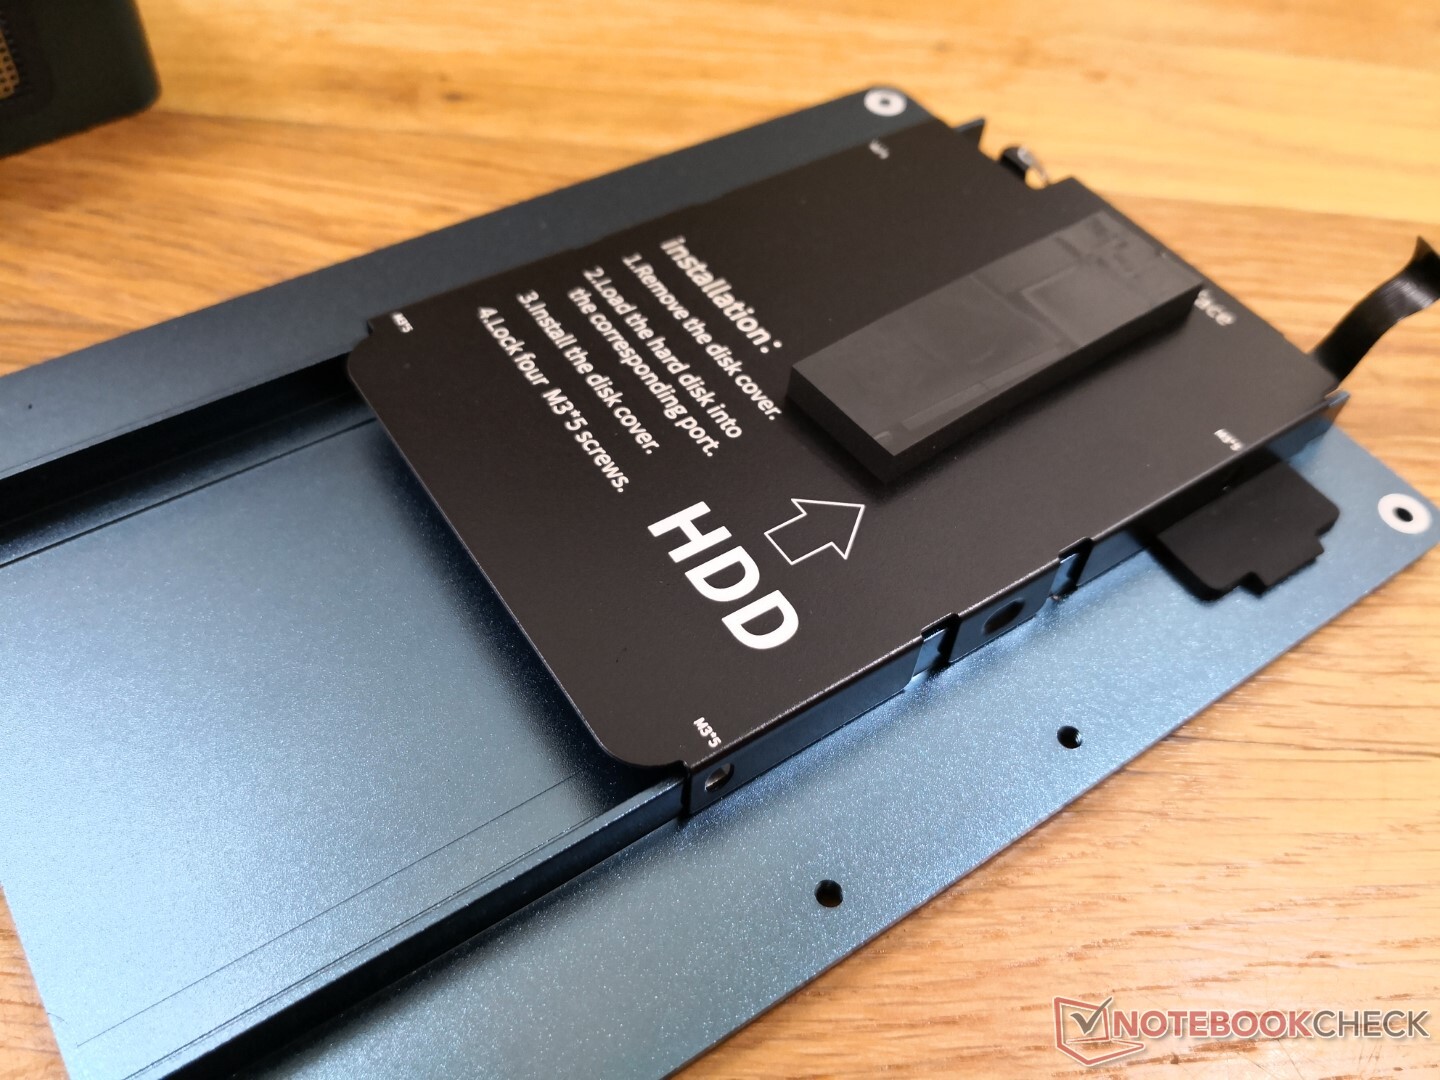
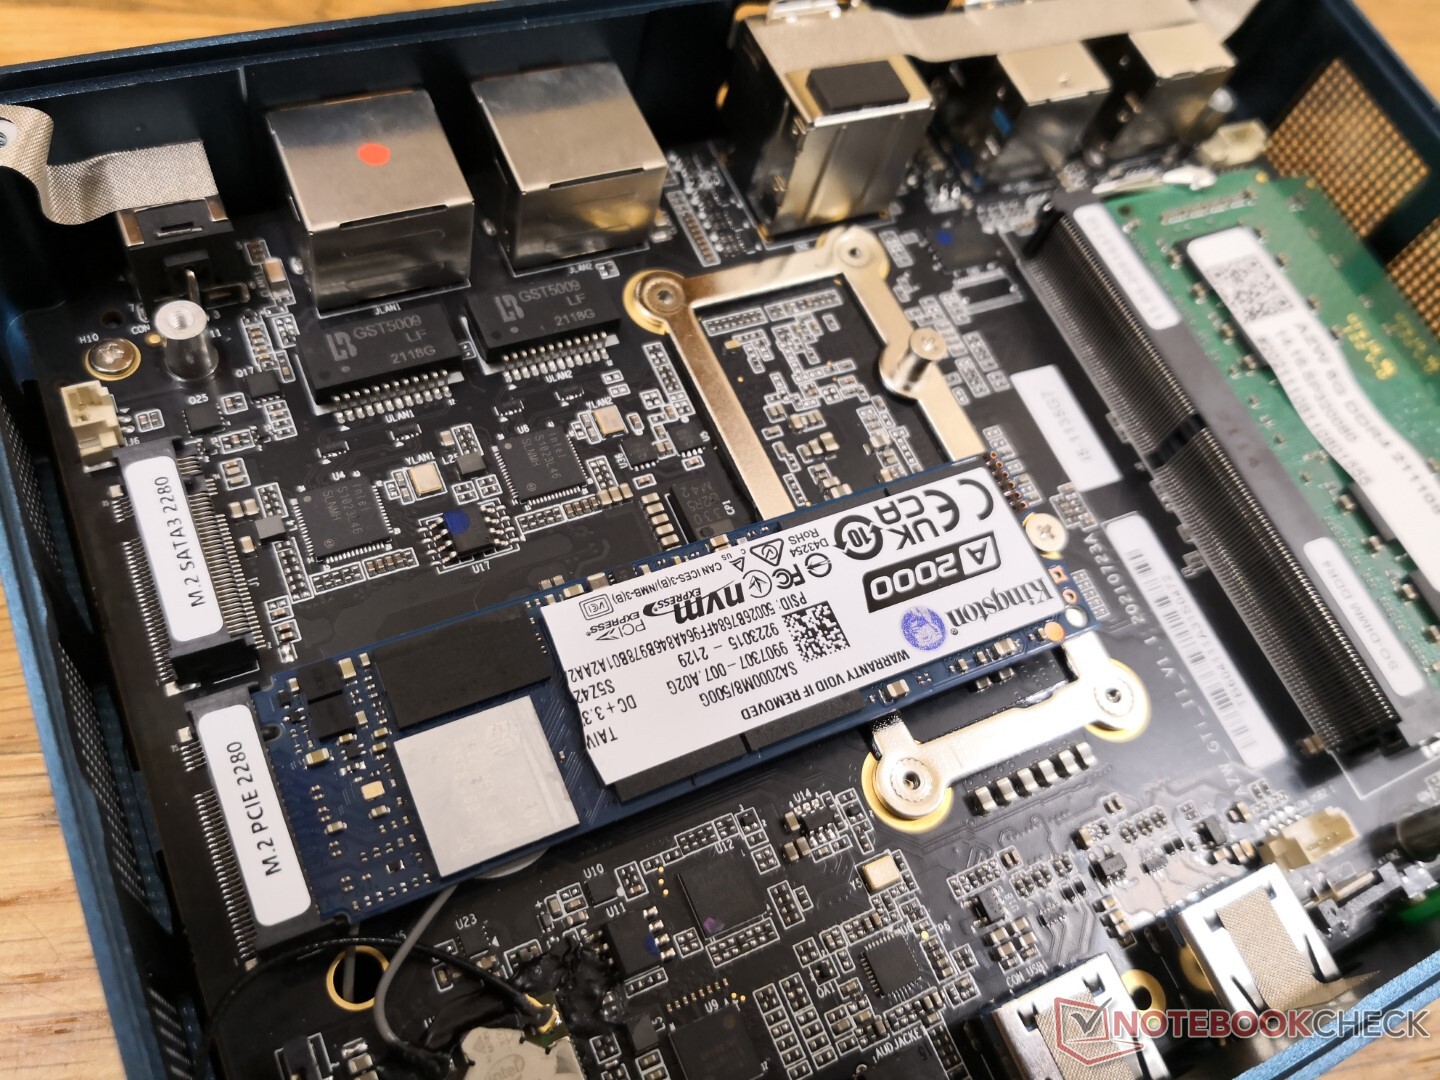
Il pannello inferiore può essere rimosso con un semplice cacciavite Philips. Gli utenti devono fare attenzione a staccare anche il nastro che collega il pannello inferiore alla scheda madre. C'è un accesso diretto a entrambi gli slot SODIMM, a entrambi gli slot M.2 2280 e all'alloggiamento SATA III da 2,5 pollici sul pannello inferiore una volta rimosso.
Accessori e garanzia
Gli extra includono due cavi HDMI, viti extra e una staffa per il conteggio VESA 50/100 mm.
Si applica la garanzia limitata standard di un anno. Reclamare la garanzia può essere arduo per alcuni utenti, dato che la spedizione è oltreoceano.
Performance
Processore
Le prestazioni crude della CPU multi-thread sono dal 15 al 20 per cento più veloci di un PC o di un portatile medio con lo stesso Core i5-1135G7 CPU. Anche il vecchio Kaby Lake-G da 100 WCore i7-8809G Hades Canyon mini PC è in ritardo rispetto alla nostra CPU Core i7 di 11a generazione. La fascia più altaCore i7-1165G7che non è disponibile sul GTI 11, può offrire agli utenti fino al 25 per cento di prestazioni multi-thread in più rispetto al nostro Core i5-1135G7
Quando si esegue CineBench R15 xT in un ciclo, il punteggio iniziale di 915 punti scende rapidamente a ~840 punti per rappresentare un calo delle prestazioni dell'8% a causa della limitata sostenibilità del Turbo Boost, come dettagliato nella nostra sezione Stress Test qui sotto.
Cinebench R15 Multi Loop
Cinebench R23: Multi Core | Single Core
Cinebench R20: CPU (Multi Core) | CPU (Single Core)
Cinebench R15: CPU Multi 64Bit | CPU Single 64Bit
Blender: v2.79 BMW27 CPU
7-Zip 18.03: 7z b 4 | 7z b 4 -mmt1
Geekbench 5.5: Multi-Core | Single-Core
HWBOT x265 Benchmark v2.2: 4k Preset
LibreOffice : 20 Documents To PDF
R Benchmark 2.5: Overall mean
| CPU Performance rating | |
| Intel NUC11PAQi7 -1! | |
| Lenovo Yoga 6 13ALC6 -2! | |
| Intel NUC10i7FNH -3! | |
| Asus Vivobook 15 K513EQ -2! | |
| Beelink GTI 11 | |
| Lenovo Yoga 6 13 82ND0009US -2! | |
| Intel NUC11TNKi5 | |
| Intel Hades Canyon NUC8i7HVK -6! | |
| Media Intel Core i5-1135G7 | |
| Infinix INBook X1 Pro -2! | |
| Asus VivoBook S13 S333JA-DS51 | |
| GMK NucBox 2 | |
| Beelink SER3 -2! | |
| Beelink GTR35 II-G-16512D00W64PRO-1T -2! | |
| Cinebench R23 / Multi Core | |
| Lenovo Yoga 6 13ALC6 | |
| Intel NUC11PAQi7 | |
| Lenovo Yoga 6 13 82ND0009US | |
| Asus Vivobook 15 K513EQ | |
| Beelink GTI 11 | |
| Intel NUC11TNKi5 | |
| Media Intel Core i5-1135G7 (2786 - 6136, n=55) | |
| Infinix INBook X1 Pro | |
| Asus VivoBook S13 S333JA-DS51 | |
| Beelink SER3 | |
| GMK NucBox 2 | |
| Cinebench R23 / Single Core | |
| Asus Vivobook 15 K513EQ | |
| Intel NUC11TNKi5 | |
| Beelink GTI 11 | |
| Media Intel Core i5-1135G7 (1062 - 1373, n=53) | |
| Lenovo Yoga 6 13ALC6 | |
| Infinix INBook X1 Pro | |
| Lenovo Yoga 6 13 82ND0009US | |
| Asus VivoBook S13 S333JA-DS51 | |
| GMK NucBox 2 | |
| Beelink SER3 | |
| Geekbench 5.5 / Multi-Core | |
| Intel NUC10i7FNH | |
| Beelink GTI 11 | |
| Intel NUC11PAQi7 | |
| Media Intel Core i5-1135G7 (3475 - 5472, n=58) | |
| Intel NUC11TNKi5 | |
| Asus VivoBook S13 S333JA-DS51 | |
| GMK NucBox 2 | |
| Beelink GTR35 II-G-16512D00W64PRO-1T | |
| Geekbench 5.5 / Single-Core | |
| Intel NUC11PAQi7 | |
| Beelink GTI 11 | |
| Intel NUC11TNKi5 | |
| Media Intel Core i5-1135G7 (1147 - 1428, n=58) | |
| Intel NUC10i7FNH | |
| Asus VivoBook S13 S333JA-DS51 | |
| GMK NucBox 2 | |
| Beelink GTR35 II-G-16512D00W64PRO-1T | |
| LibreOffice / 20 Documents To PDF | |
| Beelink SER3 | |
| Beelink GTR35 II-G-16512D00W64PRO-1T | |
| Lenovo Yoga 6 13 82ND0009US | |
| GMK NucBox 2 | |
| Lenovo Yoga 6 13ALC6 | |
| Asus VivoBook S13 S333JA-DS51 | |
| Infinix INBook X1 Pro | |
| Beelink GTI 11 | |
| Media Intel Core i5-1135G7 (44.2 - 62.9, n=60) | |
| Intel NUC11TNKi5 | |
| Asus Vivobook 15 K513EQ | |
| Intel NUC11PAQi7 | |
Cinebench R23: Multi Core | Single Core
Cinebench R20: CPU (Multi Core) | CPU (Single Core)
Cinebench R15: CPU Multi 64Bit | CPU Single 64Bit
Blender: v2.79 BMW27 CPU
7-Zip 18.03: 7z b 4 | 7z b 4 -mmt1
Geekbench 5.5: Multi-Core | Single-Core
HWBOT x265 Benchmark v2.2: 4k Preset
LibreOffice : 20 Documents To PDF
R Benchmark 2.5: Overall mean
* ... Meglio usare valori piccoli
AIDA64: FP32 Ray-Trace | FPU Julia | CPU SHA3 | CPU Queen | FPU SinJulia | FPU Mandel | CPU AES | CPU ZLib | FP64 Ray-Trace | CPU PhotoWorxx
| Performance rating | |
| Beelink GTI 11 | |
| Intel NUC11TNKi5 | |
| Media Intel Core i5-1135G7 | |
| GMK NucBox 2 | |
| Beelink SER3 | |
| AIDA64 / FP32 Ray-Trace | |
| Beelink GTI 11 | |
| Intel NUC11TNKi5 | |
| Media Intel Core i5-1135G7 (4313 - 7952, n=45) | |
| GMK NucBox 2 | |
| Beelink SER3 | |
| AIDA64 / FPU Julia | |
| Beelink GTI 11 | |
| Intel NUC11TNKi5 | |
| Media Intel Core i5-1135G7 (19402 - 32283, n=45) | |
| GMK NucBox 2 | |
| Beelink SER3 | |
| AIDA64 / CPU SHA3 | |
| Beelink GTI 11 | |
| Intel NUC11TNKi5 | |
| Media Intel Core i5-1135G7 (1316 - 2172, n=45) | |
| GMK NucBox 2 | |
| Beelink SER3 | |
| AIDA64 / CPU Queen | |
| Beelink GTI 11 | |
| Intel NUC11TNKi5 | |
| Media Intel Core i5-1135G7 (39000 - 46951, n=45) | |
| Beelink SER3 | |
| GMK NucBox 2 | |
| AIDA64 / FPU SinJulia | |
| Beelink SER3 | |
| Intel NUC11TNKi5 | |
| Beelink GTI 11 | |
| GMK NucBox 2 | |
| Media Intel Core i5-1135G7 (3497 - 4445, n=45) | |
| AIDA64 / FPU Mandel | |
| Beelink GTI 11 | |
| Intel NUC11TNKi5 | |
| Media Intel Core i5-1135G7 (12569 - 19635, n=45) | |
| GMK NucBox 2 | |
| Beelink SER3 | |
| AIDA64 / CPU AES | |
| Beelink GTI 11 | |
| Intel NUC11TNKi5 | |
| Media Intel Core i5-1135G7 (28988 - 67977, n=45) | |
| Beelink SER3 | |
| GMK NucBox 2 | |
| AIDA64 / CPU ZLib | |
| Intel NUC11TNKi5 | |
| Beelink GTI 11 | |
| Beelink SER3 | |
| Media Intel Core i5-1135G7 (265 - 373, n=51) | |
| GMK NucBox 2 | |
| AIDA64 / FP64 Ray-Trace | |
| Beelink GTI 11 | |
| Intel NUC11TNKi5 | |
| Media Intel Core i5-1135G7 (2226 - 4291, n=45) | |
| GMK NucBox 2 | |
| Beelink SER3 | |
| AIDA64 / CPU PhotoWorxx | |
| Beelink GTI 11 | |
| Media Intel Core i5-1135G7 (9004 - 45366, n=45) | |
| Intel NUC11TNKi5 | |
| Beelink SER3 | |
| GMK NucBox 2 | |
Prestazioni del sistema
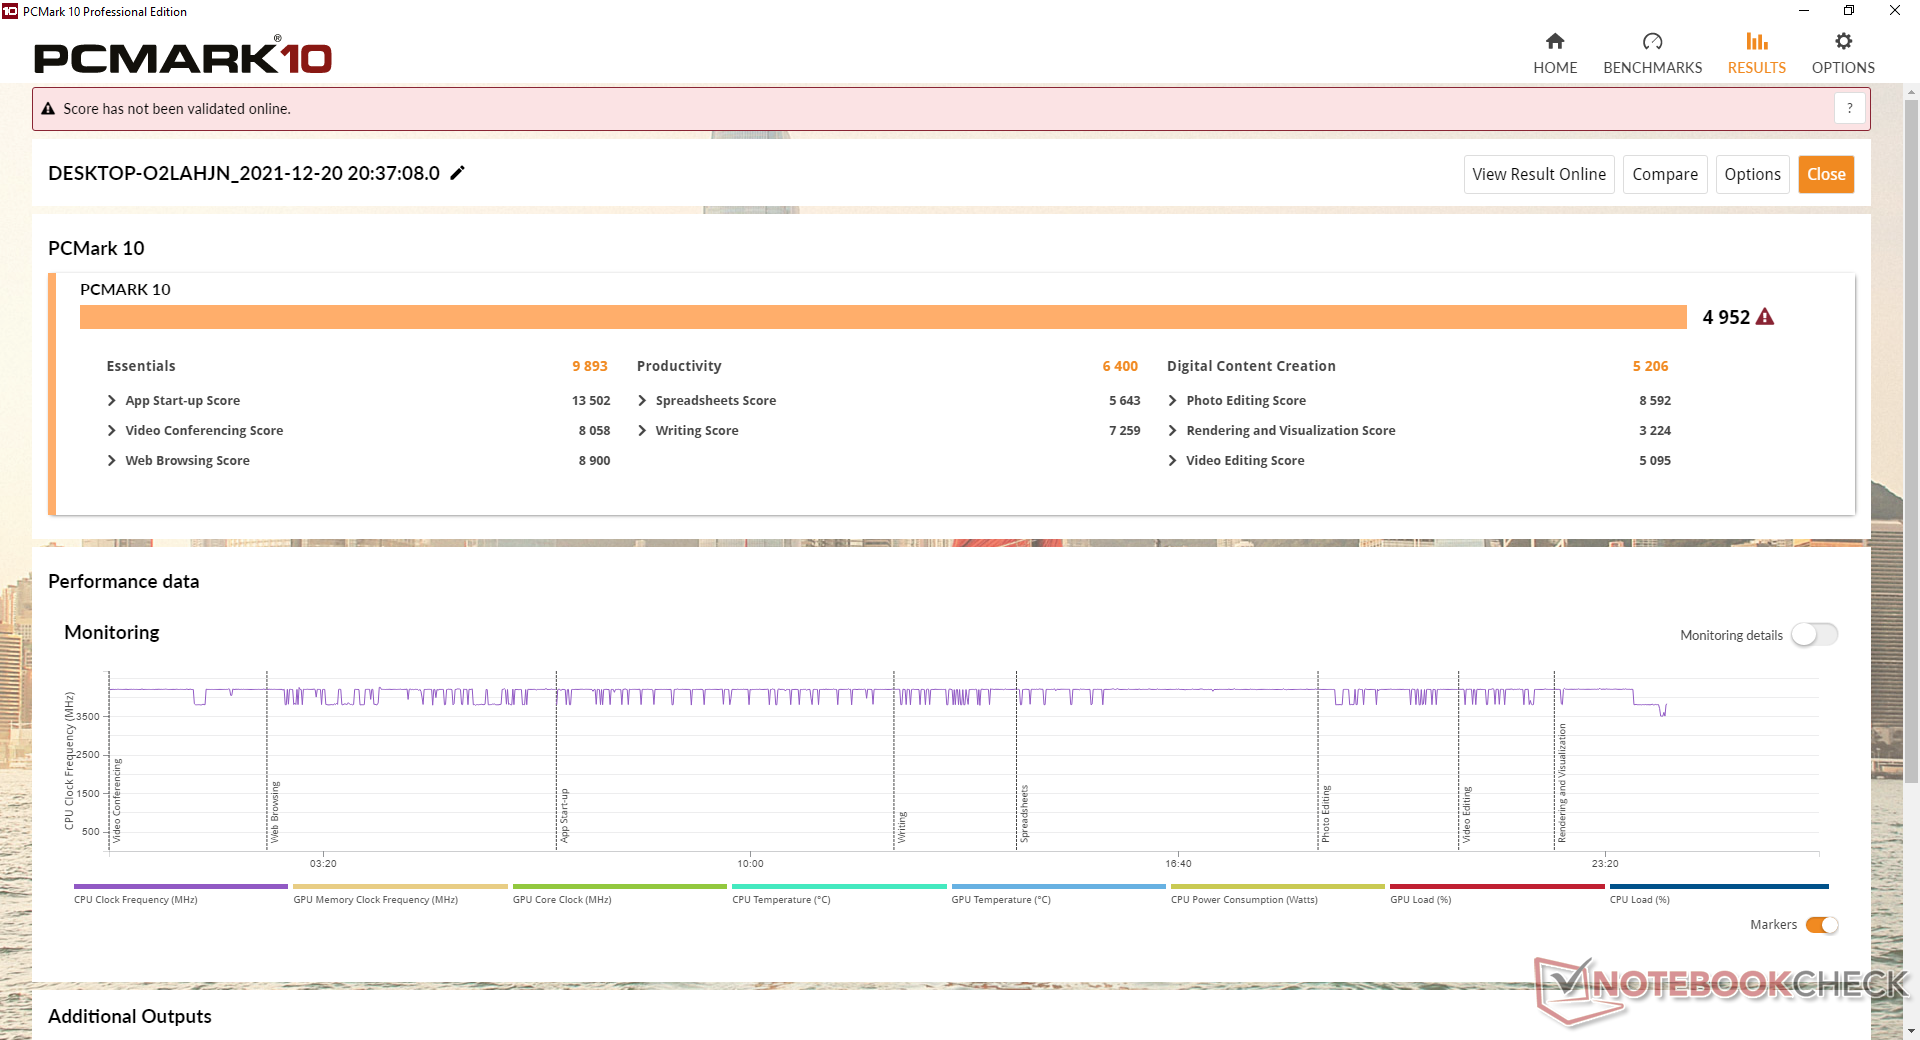
I punteggi PCMark 10 sono eccellenti e costantemente al di sopra di qualsiasi sistema Beelink venuto prima del nostro GTI 11. I benefici dell'uso di una CPU Intel di 11a generazione, più snella e più efficiente dal punto di vista energetico, si aggiungono a un'esperienza utente più fluida.
| PCMark 10 / Score | |
| Intel Hades Canyon NUC8i7HVK | |
| Beelink GTI 11 | |
| Media Intel Core i5-1135G7, Intel Iris Xe Graphics G7 80EUs (4026 - 4952, n=53) | |
| Intel NUC11TNKi5 | |
| Intel NUC10i7FNH | |
| GMK NucBox 2 | |
| Beelink SER3 | |
| PCMark 10 / Essentials | |
| Beelink GTI 11 | |
| Media Intel Core i5-1135G7, Intel Iris Xe Graphics G7 80EUs (8149 - 9917, n=53) | |
| Intel Hades Canyon NUC8i7HVK | |
| Intel NUC10i7FNH | |
| Intel NUC11TNKi5 | |
| GMK NucBox 2 | |
| Beelink SER3 | |
| PCMark 10 / Productivity | |
| Intel Hades Canyon NUC8i7HVK | |
| Intel NUC10i7FNH | |
| Beelink GTI 11 | |
| GMK NucBox 2 | |
| Media Intel Core i5-1135G7, Intel Iris Xe Graphics G7 80EUs (5040 - 6619, n=53) | |
| Intel NUC11TNKi5 | |
| Beelink SER3 | |
| PCMark 10 / Digital Content Creation | |
| Intel Hades Canyon NUC8i7HVK | |
| Beelink GTI 11 | |
| Media Intel Core i5-1135G7, Intel Iris Xe Graphics G7 80EUs (3548 - 5255, n=53) | |
| Intel NUC11TNKi5 | |
| Intel NUC10i7FNH | |
| GMK NucBox 2 | |
| Beelink SER3 | |
| PCMark 10 Score | 4952 punti | |
Aiuto | ||
| AIDA64 / Memory Copy | |
| GMK NucBox 2 | |
| Beelink GTI 11 | |
| Media Intel Core i5-1135G7 (17443 - 63889, n=45) | |
| Intel NUC11TNKi5 | |
| Beelink SER3 | |
| AIDA64 / Memory Read | |
| Beelink GTI 11 | |
| Media Intel Core i5-1135G7 (19716 - 63705, n=45) | |
| GMK NucBox 2 | |
| Intel NUC11TNKi5 | |
| Beelink SER3 | |
| AIDA64 / Memory Write | |
| GMK NucBox 2 | |
| Beelink GTI 11 | |
| Media Intel Core i5-1135G7 (18722 - 66778, n=45) | |
| Intel NUC11TNKi5 | |
| Beelink SER3 | |
| AIDA64 / Memory Latency | |
| Beelink SER3 | |
| Intel NUC11TNKi5 | |
| Media Intel Core i5-1135G7 (68.3 - 107, n=51) | |
| Beelink GTI 11 | |
| GMK NucBox 2 | |
* ... Meglio usare valori piccoli
Latenza DPC
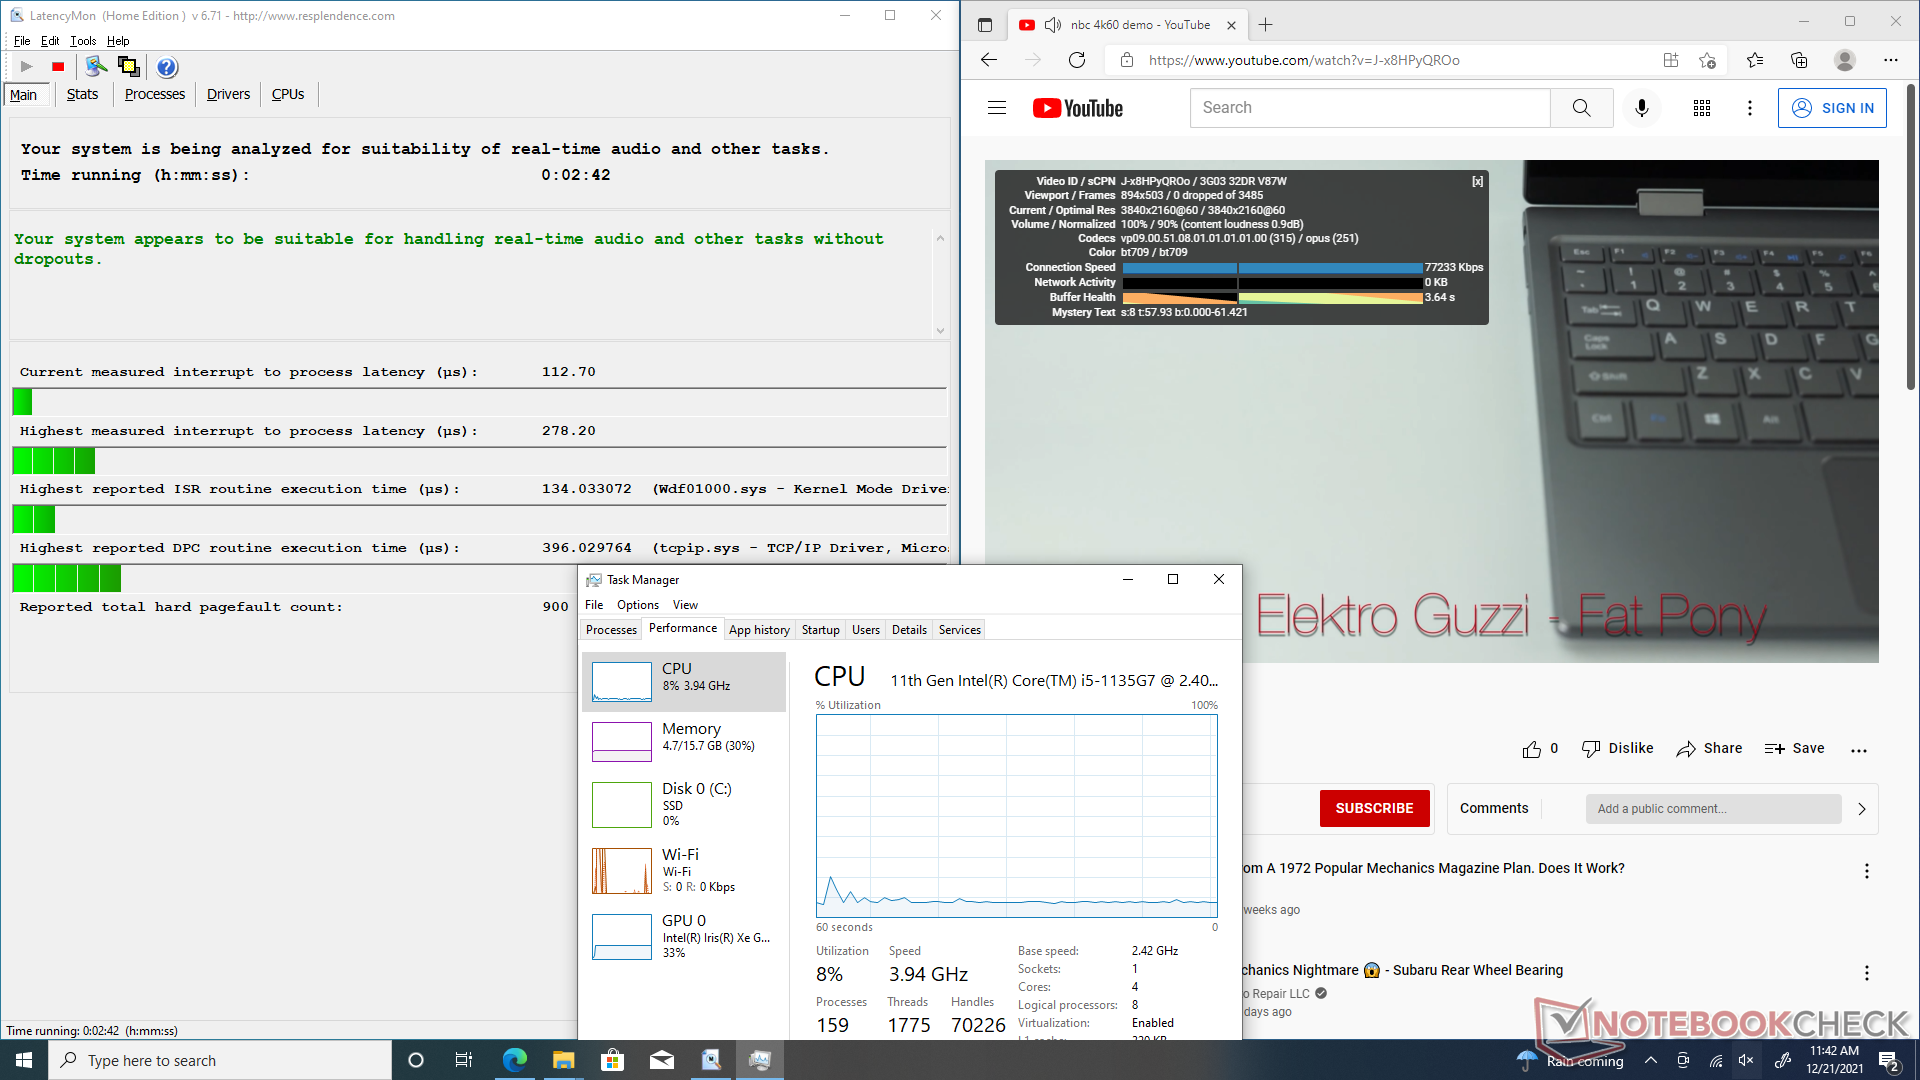
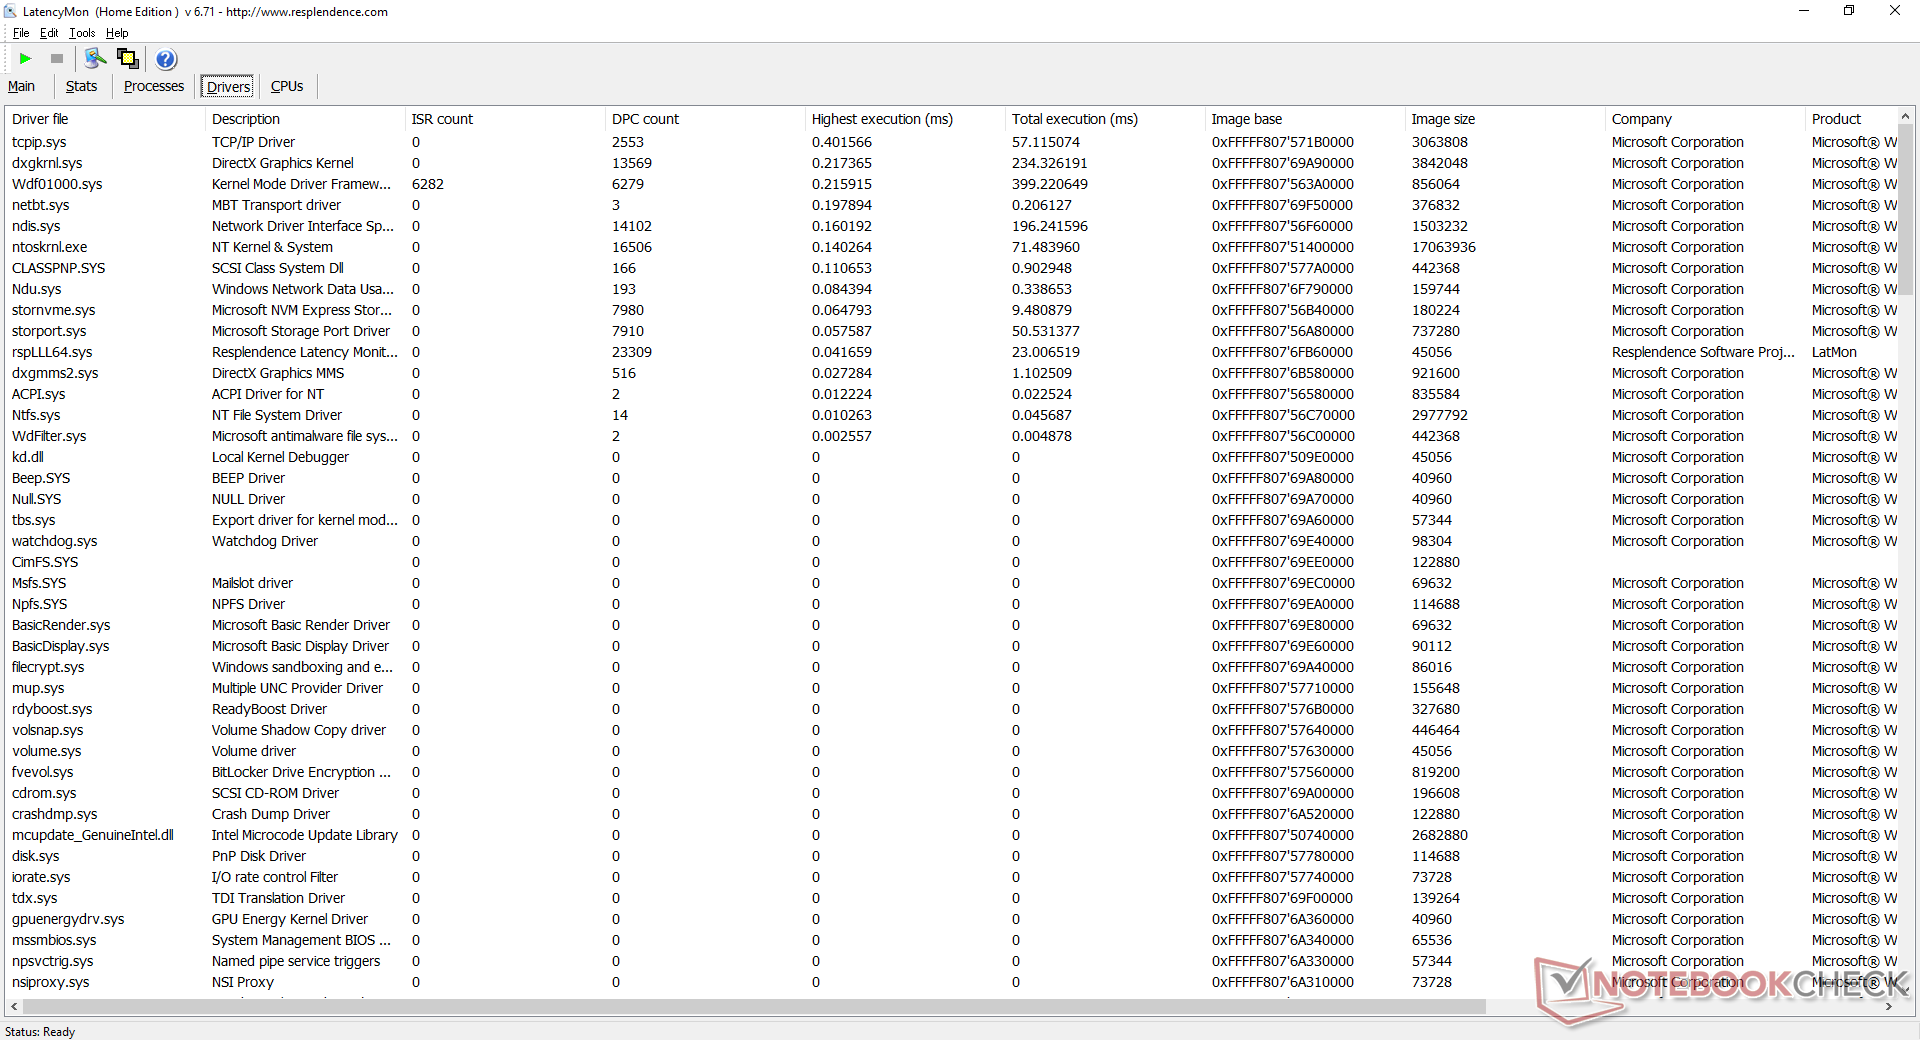
LatencyMon non rivela problemi di DPC quando si aprono più schede del browser sulla nostra homepage. Anche la riproduzione di video 4K a 60 FPS è fluida e senza alcun calo di frame.
| DPC Latencies / LatencyMon - interrupt to process latency (max), Web, Youtube, Prime95 | |
| GMK NucBox 2 | |
| Beelink SER3 | |
| Intel NUC11TNKi5 | |
| Beelink GTI 11 | |
* ... Meglio usare valori piccoli
Dispositivi di archiviazione
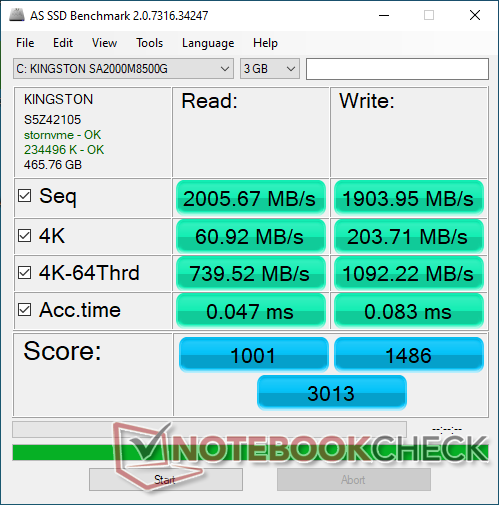
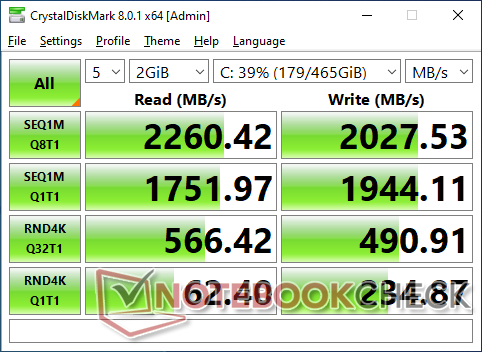
Il sistema può supportare fino a tre unità interne (2x M.2 2280 + 1x 2,5 pollici SATA III). Tieni presente che il secondo drive M.2 deve essere un drive SATA III e non un drive NVMe. Il Kingston A2000 da 500 GB nella nostra unità è un'unità PCIe3 M.2 di fascia media con velocità di lettura e scrittura sequenziale di circa 2000-2200 MB/s ciascuna. Anche la sostenibilità delle prestazioni è eccellente, senza problemi termici quando si esegue DiskSpd in un ciclo.
L'unità viene spedita con un drive PCIe3 invece di PCIe4 probabilmente per risparmiare sui costi. Gli utenti possono installare le proprie unità PCIe4 se lo desiderano.

| Drive Performance rating - Percent | |
| Beelink GTI 11 | |
| Intel Hades Canyon NUC8i7HVK -8! | |
| Beelink SER3 | |
| GMK NucBox 2 | |
| Intel NUC10i7FNH | |
| Intel NUC11TNKi5 | |
* ... Meglio usare valori piccoli
Disk Throttling: DiskSpd Read Loop, Queue Depth 8
Prestazioni della GPU
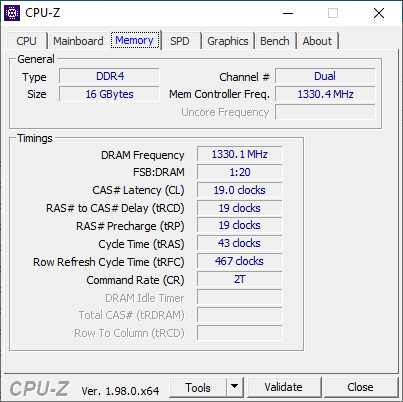
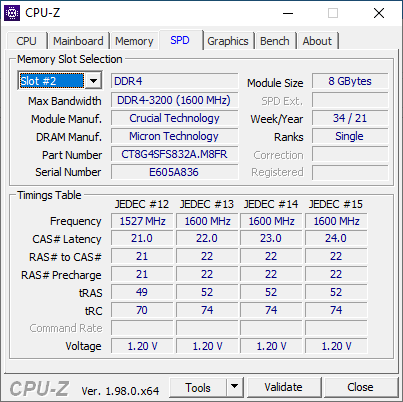
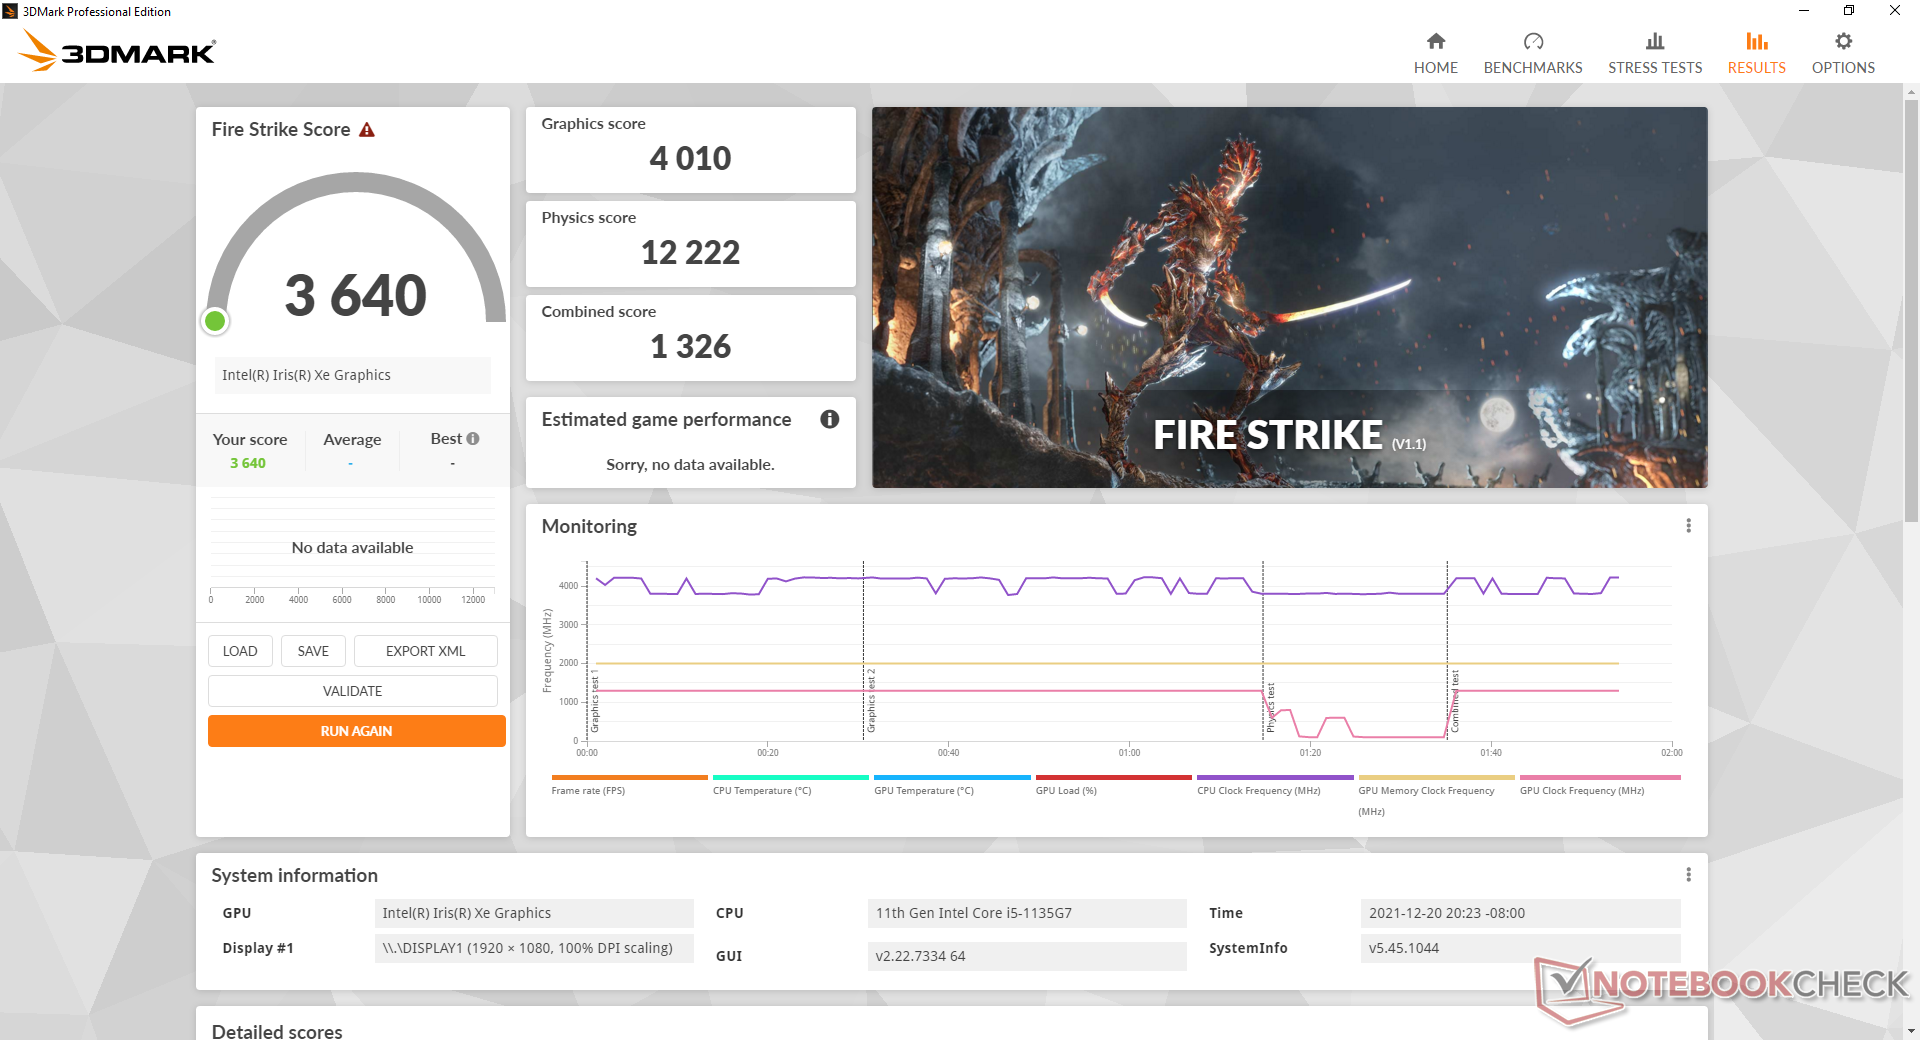
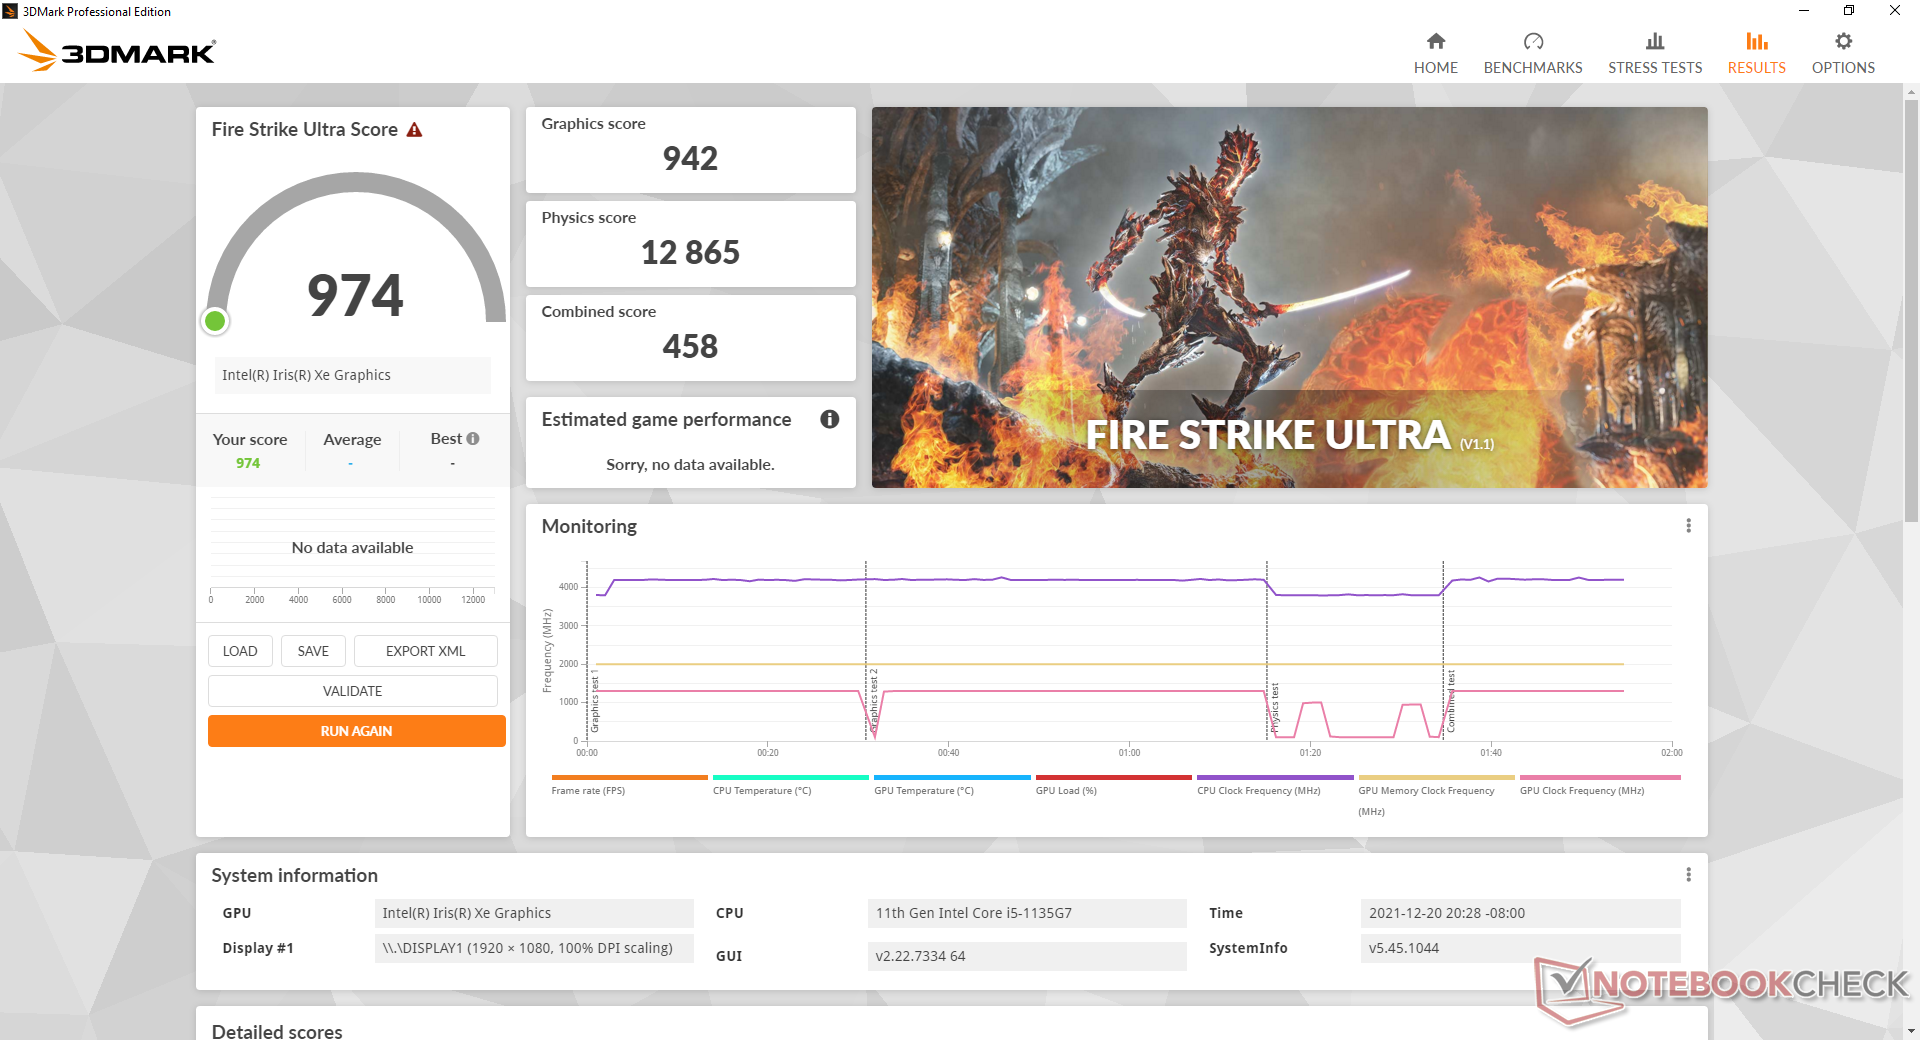
Le prestazioni grafiche sono molto buone, più veloci di circa il 13% rispetto alla media dei laptop o dei PC equipaggiati con lo stesso sistema integrato Iris Xe 80 UE. Il GTI 11 è dotato di RAM dual-channel a differenza del nostro Intel NUC11TNKi5 che viene fornito con la stessa CPU Core i5-1135G7 ma con solo RAM a singolo canale. Le prestazioni grafiche sono circa il 25% più veloci sul nostro Beelink a causa soprattutto delle loro diverse configurazioni di RAM
L'aggiornamento a un PC o laptop con il Core i7-1165G7 di fascia alta e la sua Iris Xe 96 EUs si tradurrà in un aumento delle prestazioni fino al 25-35 per cento a seconda del modello.
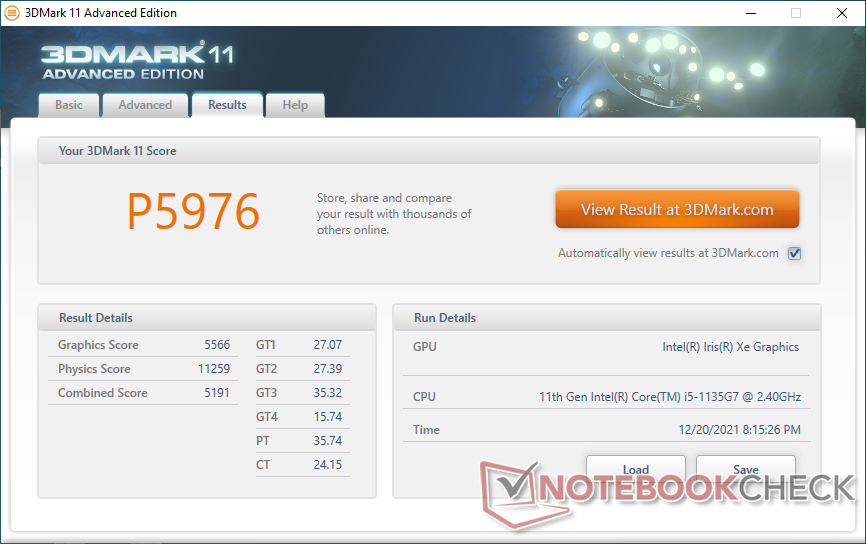

| 3DMark 11 Performance | 5976 punti | |
| 3DMark Cloud Gate Standard Score | 18036 punti | |
| 3DMark Fire Strike Score | 3640 punti | |
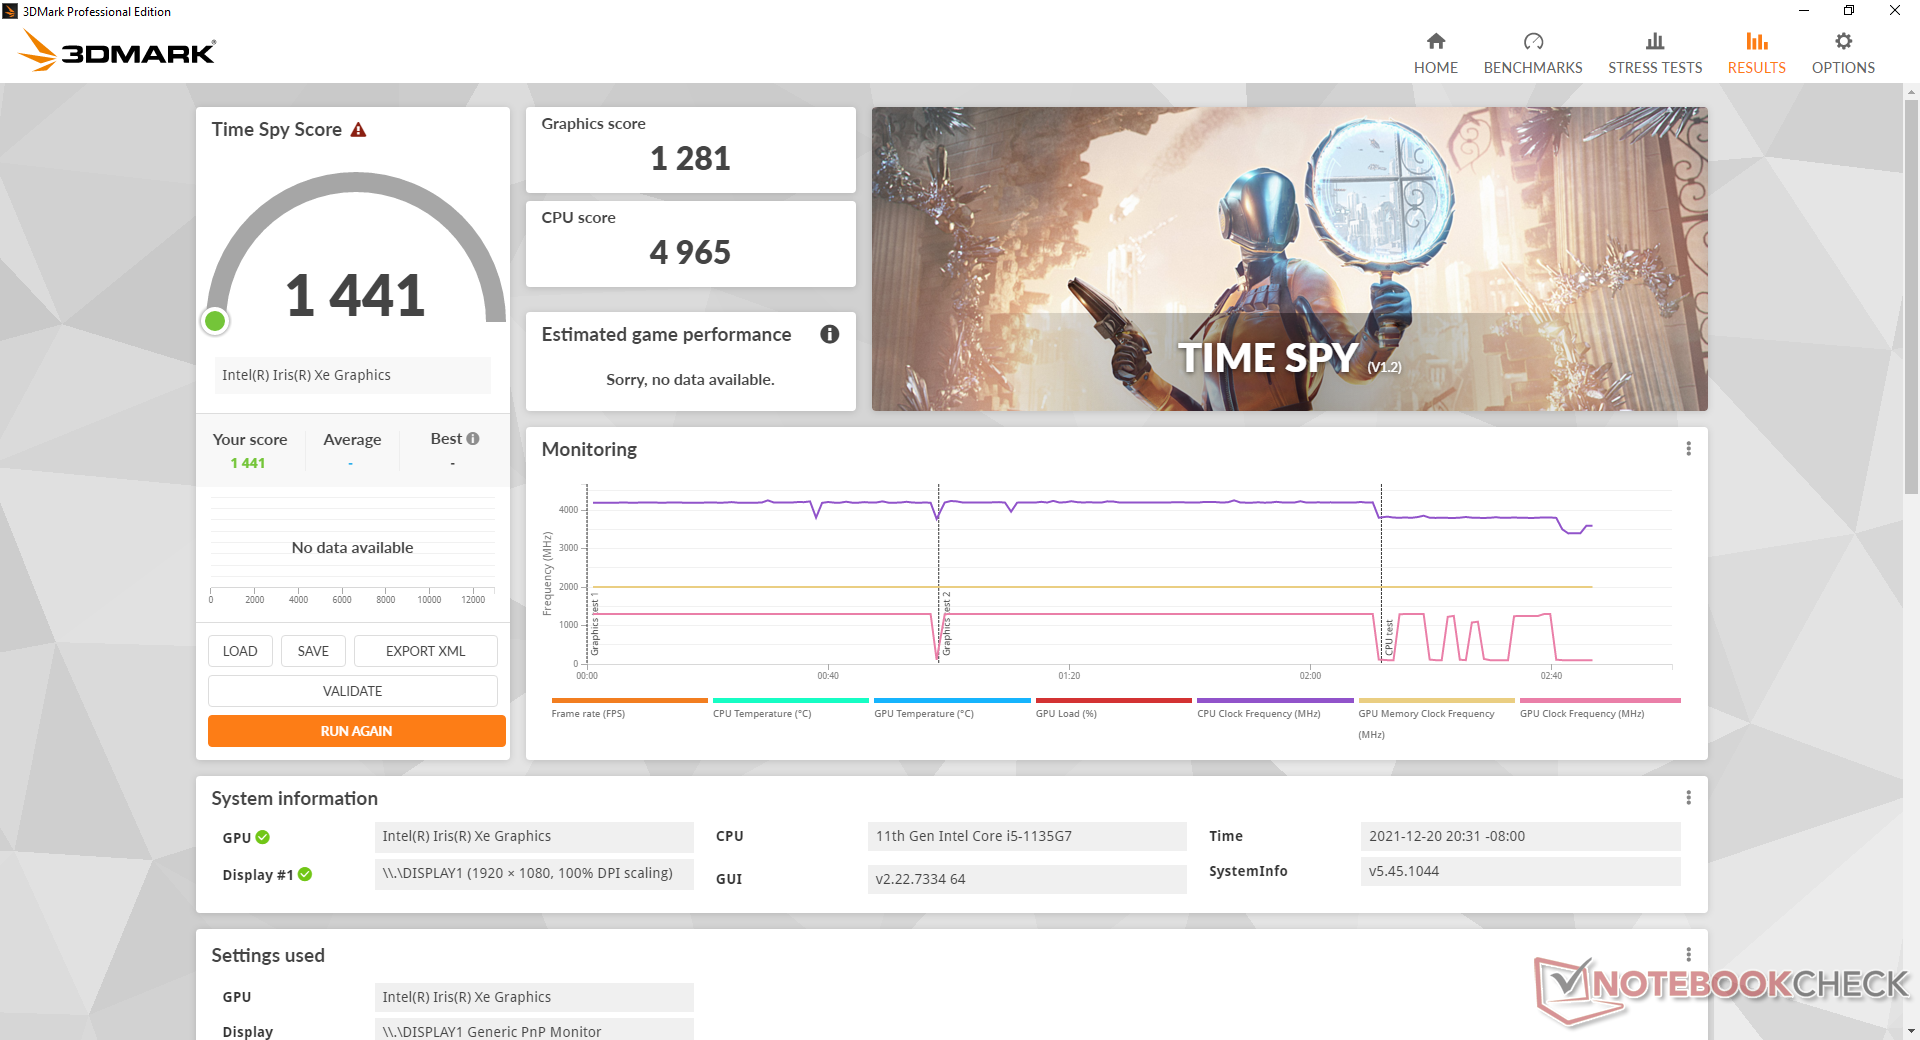
| 3DMark Time Spy Score | 1441 punti | |
Aiuto | ||
Witcher 3 FPS Chart
| basso | medio | alto | ultra | |
|---|---|---|---|---|
| GTA V (2015) | 95.1 | 79.5 | 21.1 | 8.17 |
| The Witcher 3 (2015) | 77.1 | 46.6 | 23.1 | 11.5 |
| Dota 2 Reborn (2015) | 123 | 81 | 49.7 | 47.2 |
| Final Fantasy XV Benchmark (2018) | 36.7 | 18.7 | 13.5 | |
| X-Plane 11.11 (2018) | 24 | 21.4 | 21.9 | |
| Far Cry 5 (2018) | 47 | 23 | 22 | 21 |
| Strange Brigade (2018) | 76.5 | 30.8 | 25.2 | 20.2 |
Emissioni
Rumore di sistema
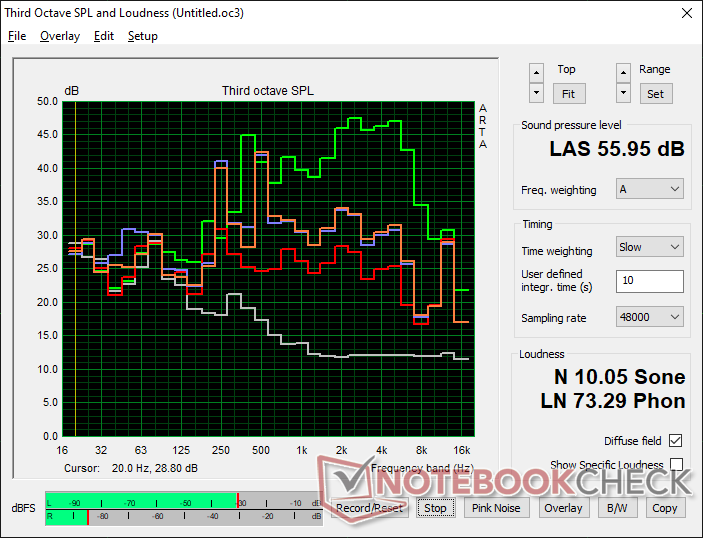
Il rumore della ventola è forse l'aspetto peggiore del GTI 11. Le due ventole interne pulsano frequentemente e sensibilmente tra i 28,4 dB(A) e i 37,7 dB(A) anche quando si sta semplicemente al minimo sul desktop o si naviga sul web. Il comportamento delle ventole non cambia nemmeno quando si imposta il sistema in modalità Power Saver.
L'esecuzione di carichi più elevati come i giochi indurrà un rumore della ventola che va da 44 dB(A) fino a 56 dB(A) che è molto più forte di quello che abbiamo registrato sulla maggior parte degli altri mini PC, compresa la serie Intel NUC. La nostra unità soffrirebbe anche di un leggero rumore elettronico o del fruscio della bobina e quindi non è mai veramente silenziosa.
Rumorosità
| Idle |
| 28.4 / 32 / 37.7 dB(A) |
| Sotto carico |
| 44.2 / 56 dB(A) |
 | ||
30 dB silenzioso 40 dB(A) udibile 50 dB(A) rumoroso |
||
min: | ||
| Beelink GTI 11 Iris Xe G7 80EUs, i5-1135G7, Kingston SA2000M8500G | Beelink SER3 Vega 10, R7 3750H, GSemi AZW GSDFN512TS3F1OGCX | Intel NUC11TNKi5 Iris Xe G7 80EUs, i5-1135G7, Transcend M.2 SSD 430S TS512GMTS430S | GMK NucBox 2 Iris Plus Graphics 655, i5-8259U, Netac S930E8/256GPN | Intel Hades Canyon NUC8i7HVK Vega M GH, i7-8809G, Intel Optane 120 GB SSDPEK1W120GA | |
|---|---|---|---|---|---|
| Noise | 19% | 3% | 20% | 8% | |
| off /ambiente * (dB) | 25.7 | 23.4 9% | 24.8 4% | 25.6 -0% | 28.7 -12% |
| Idle Minimum * (dB) | 28.4 | 23.4 18% | 35.6 -25% | 25.7 10% | 29 -2% |
| Idle Average * (dB) | 32 | 23.4 27% | 35.6 -11% | 25.7 20% | 29 9% |
| Idle Maximum * (dB) | 37.7 | 29.4 22% | 35.6 6% | 25.7 32% | 29 23% |
| Load Average * (dB) | 44.2 | 35.2 20% | 36.2 18% | 35.3 20% | 36 19% |
| Witcher 3 ultra * (dB) | 44.5 | 37.2 16% | 38 15% | 42 6% | |
| Load Maximum * (dB) | 56 | 43.3 23% | 47.6 15% | 35.1 37% | 49.4 12% |
* ... Meglio usare valori piccoli
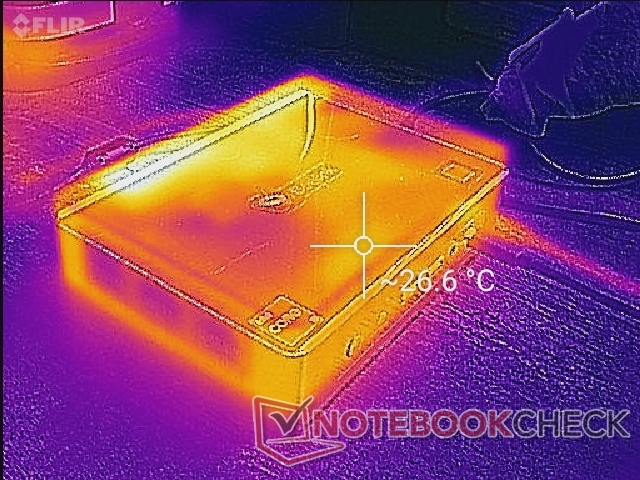
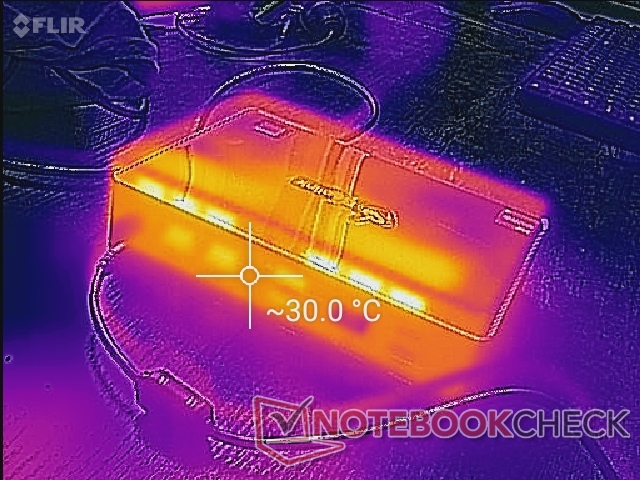
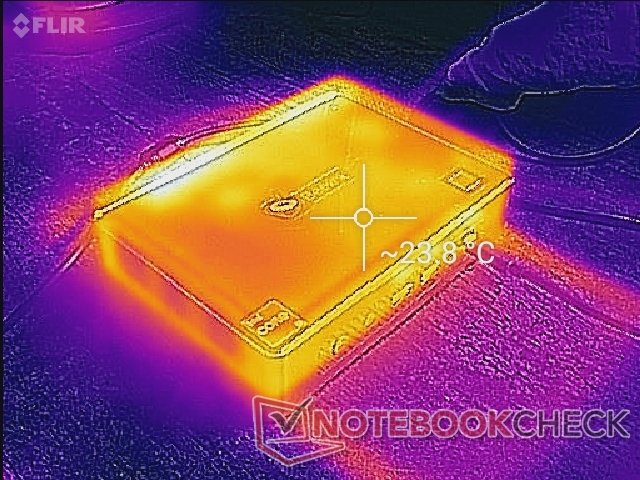
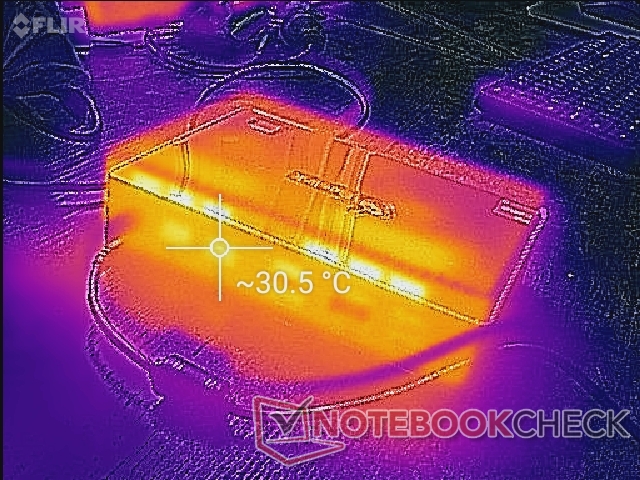
Temperatura
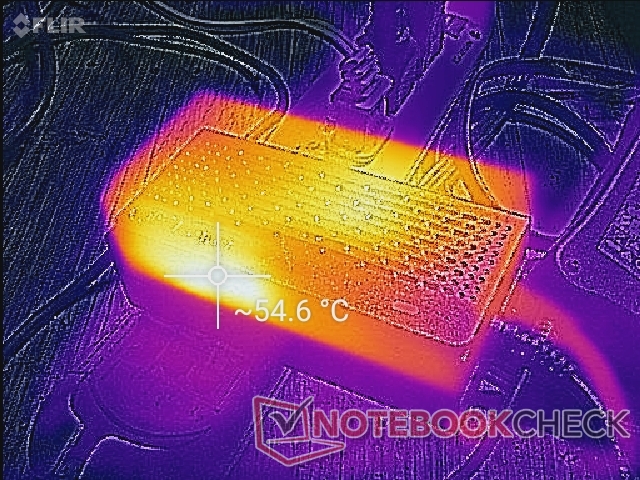
Le temperature di superficie non sono un problema sul GTI 11. Infatti, qualsiasi differenza tra i carichi al minimo e quelli di gioco è abbastanza minore, come mostrato dalle nostre mappe di temperatura qui sotto. L'aria fredda entra dai due lati del telaio che sono più distanti tra loro e l'aria calda entra dalla parte posteriore. Gli oggetti possono essere posizionati sopra l'unità senza ostruire il flusso d'aria, ma un orientamento verticale può avere un impatto sul rumore della ventola o sulla temperatura.
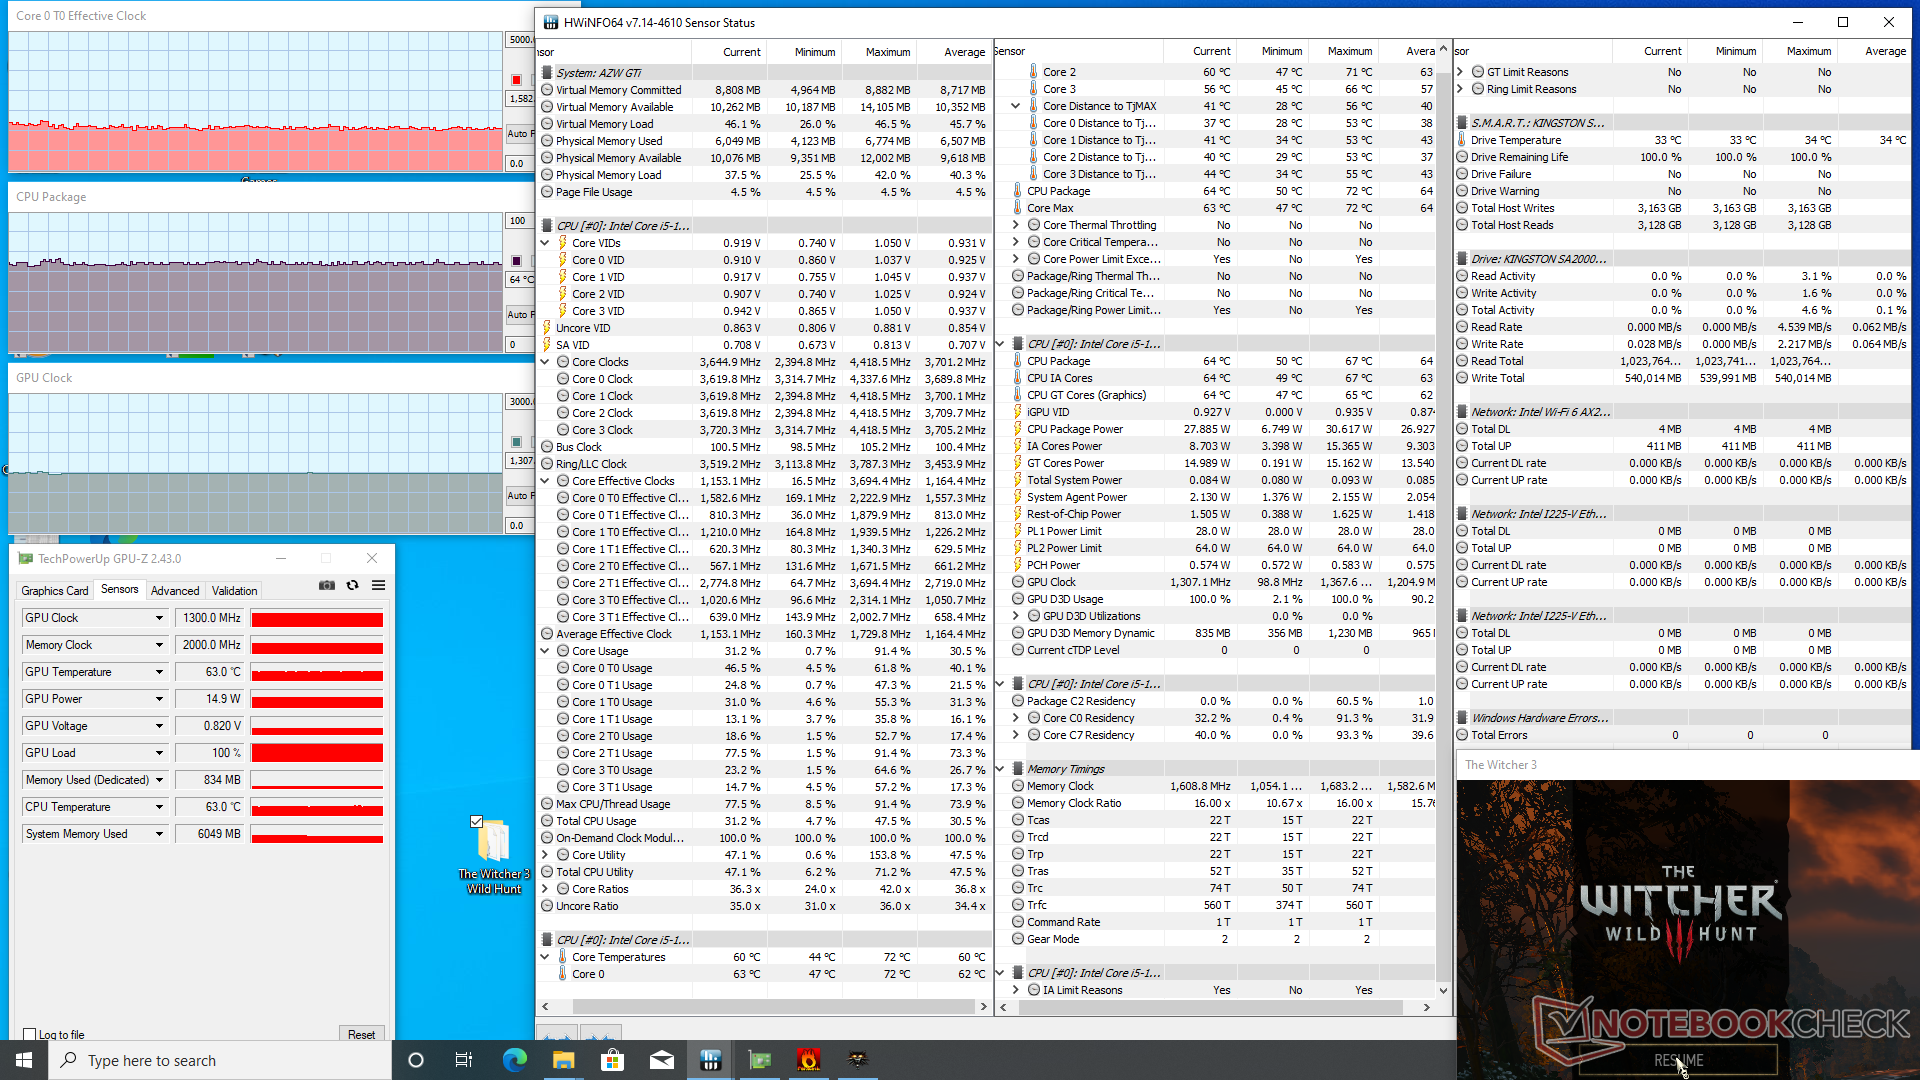
Test di stress
Quando si esegue Prime95 per stressare la CPU, le frequenze di clock aumentano a 3,8 GHz per i primi 20 secondi circa fino a raggiungere una temperatura del core di 89 C. Le frequenze di clock scendono poi a 2,8 GHz per mantenere una temperatura del core più fredda di 70 C. Anche la potenza del pacchetto CPU scende da 48 W massimo a un più stabile 28 W.
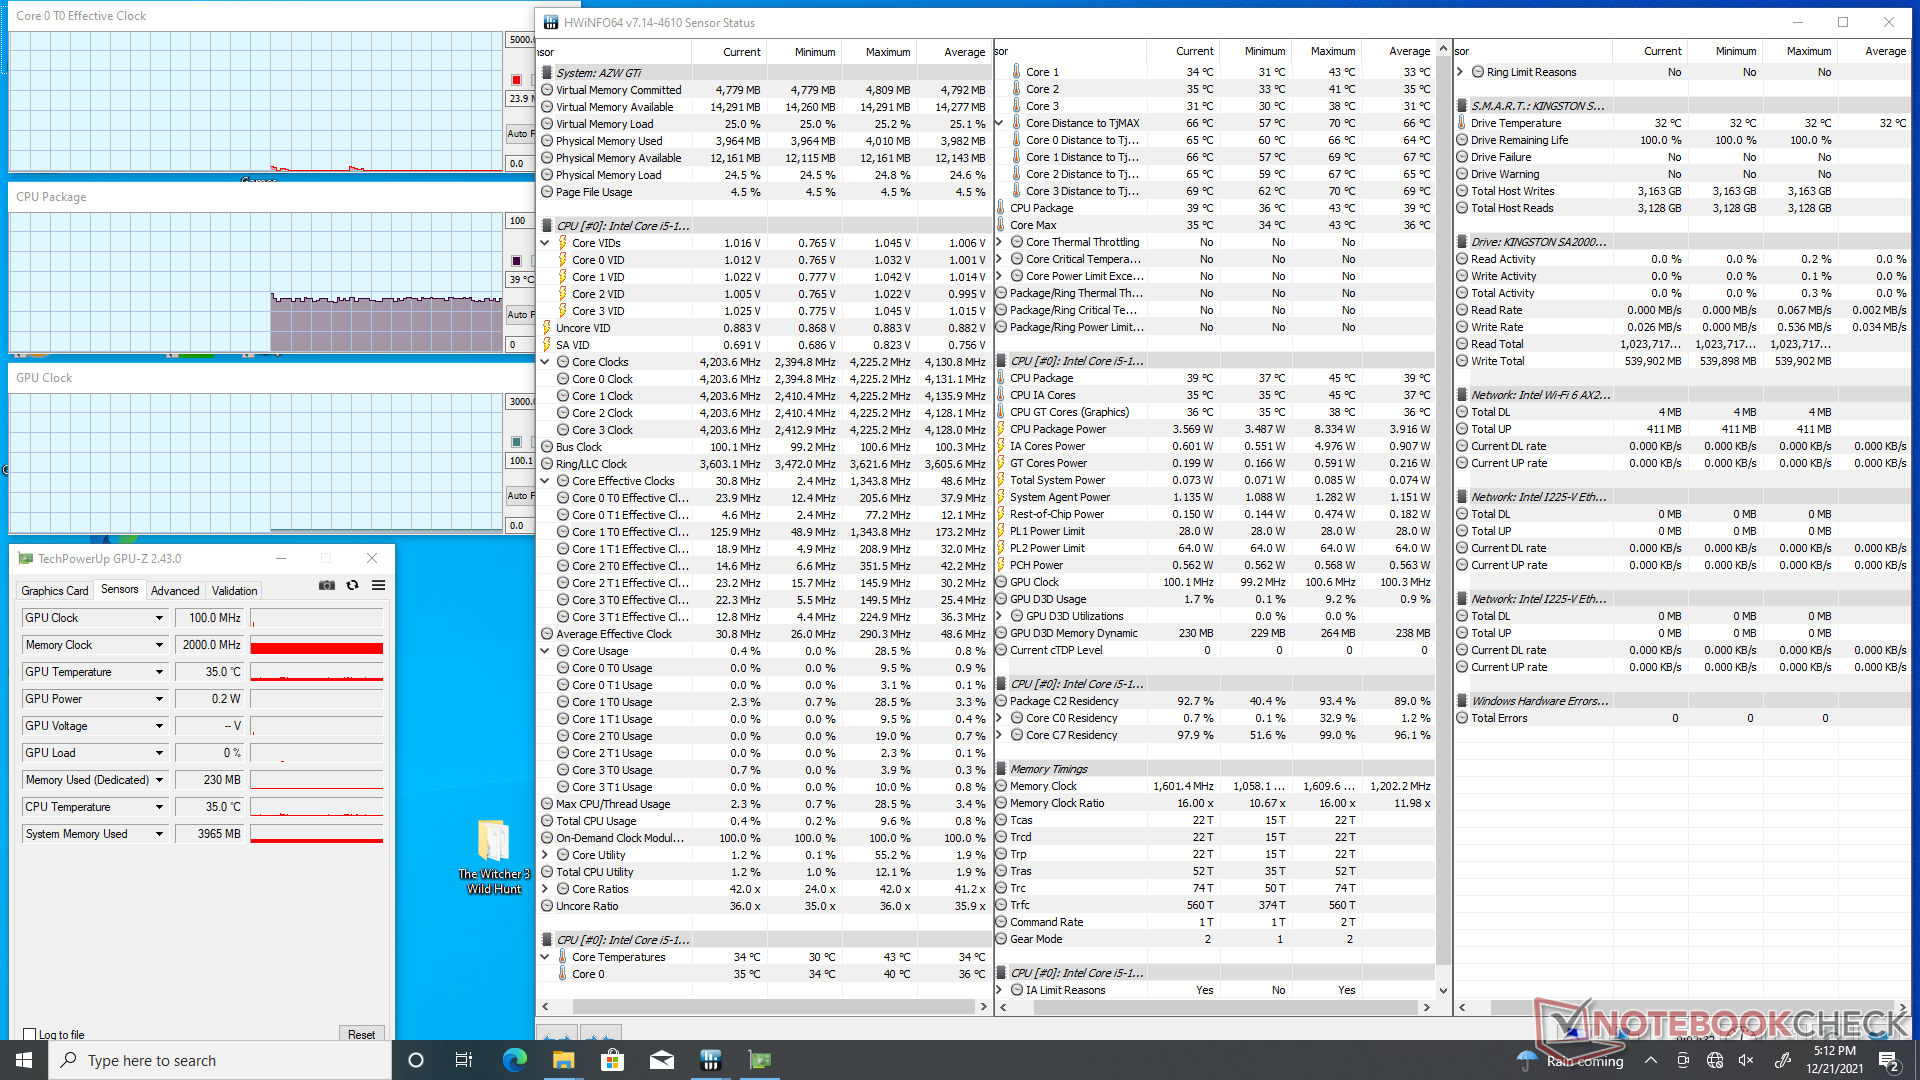
La temperatura del core e la frequenza di clock della GPU si stabilizzavano a 64 C e 1300 MHz, rispettivamente, durante l'esecuzione Witcher 3 a rappresentare carichi elevati. I risultati sono molto simili a quelli che abbiamo registrato sul NUC11TNKi5 concorrente quando entrambi i sistemi sono sottoposti a condizioni simili.
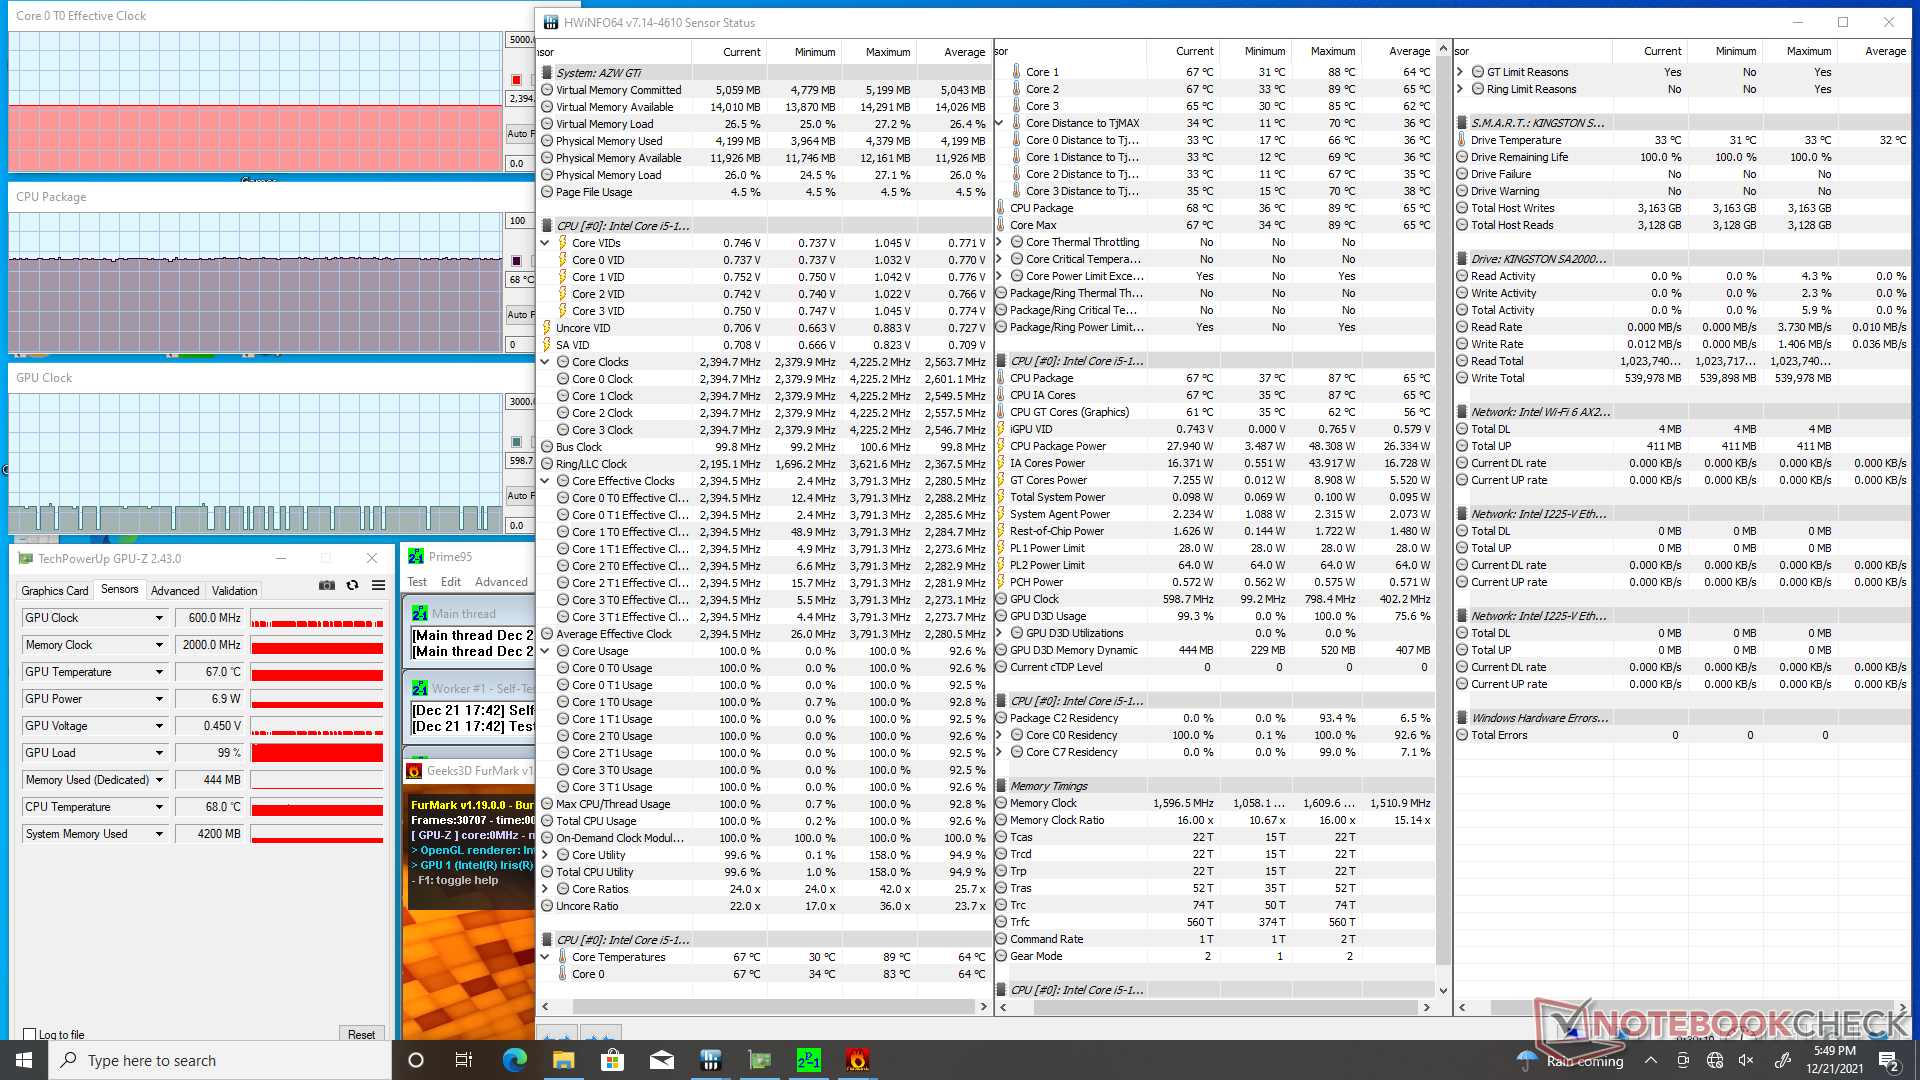
| Clock della CPU (GHz)Clock della GPU(MHz)Temperaturamedia dellaCPU (°C) | |
| Sistema inattivo | -- |
| Stress Prime95 | 2.8 |
| Prime95 + FurMark Stress | 2.4 |
| Witcher 3 Stress | 1.6 |
Gestione dell'energia
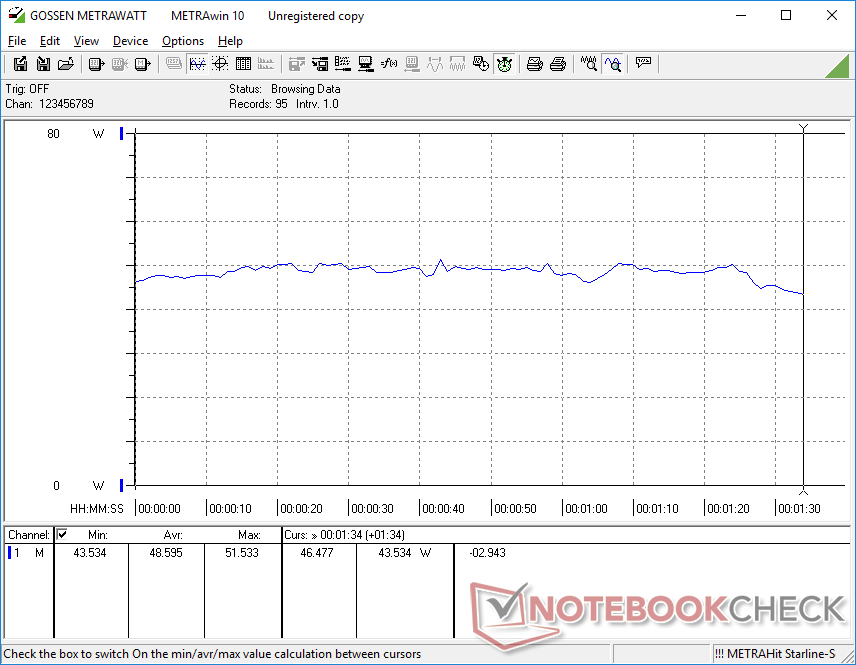
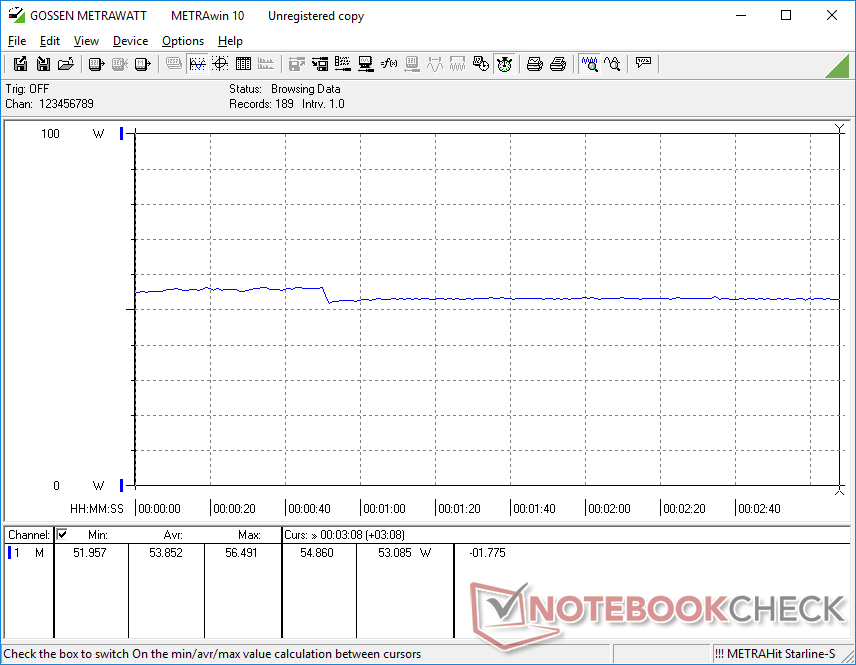
Consumo di energia
Il consumo energetico complessivo è più alto del previsto. L'Intel NUC11TNKi5 con la stessa identica CPU, per esempio, richiederebbe diversi watt in meno in tutte le condizioni testate rispetto alla nostra unità Beelink. Le prestazioni della CPU e della GPU più veloci di Beelink rispetto al PC medio con la stessa CPU Core i5-1135G7 sono probabilmente responsabili del suo maggiore consumo energetico
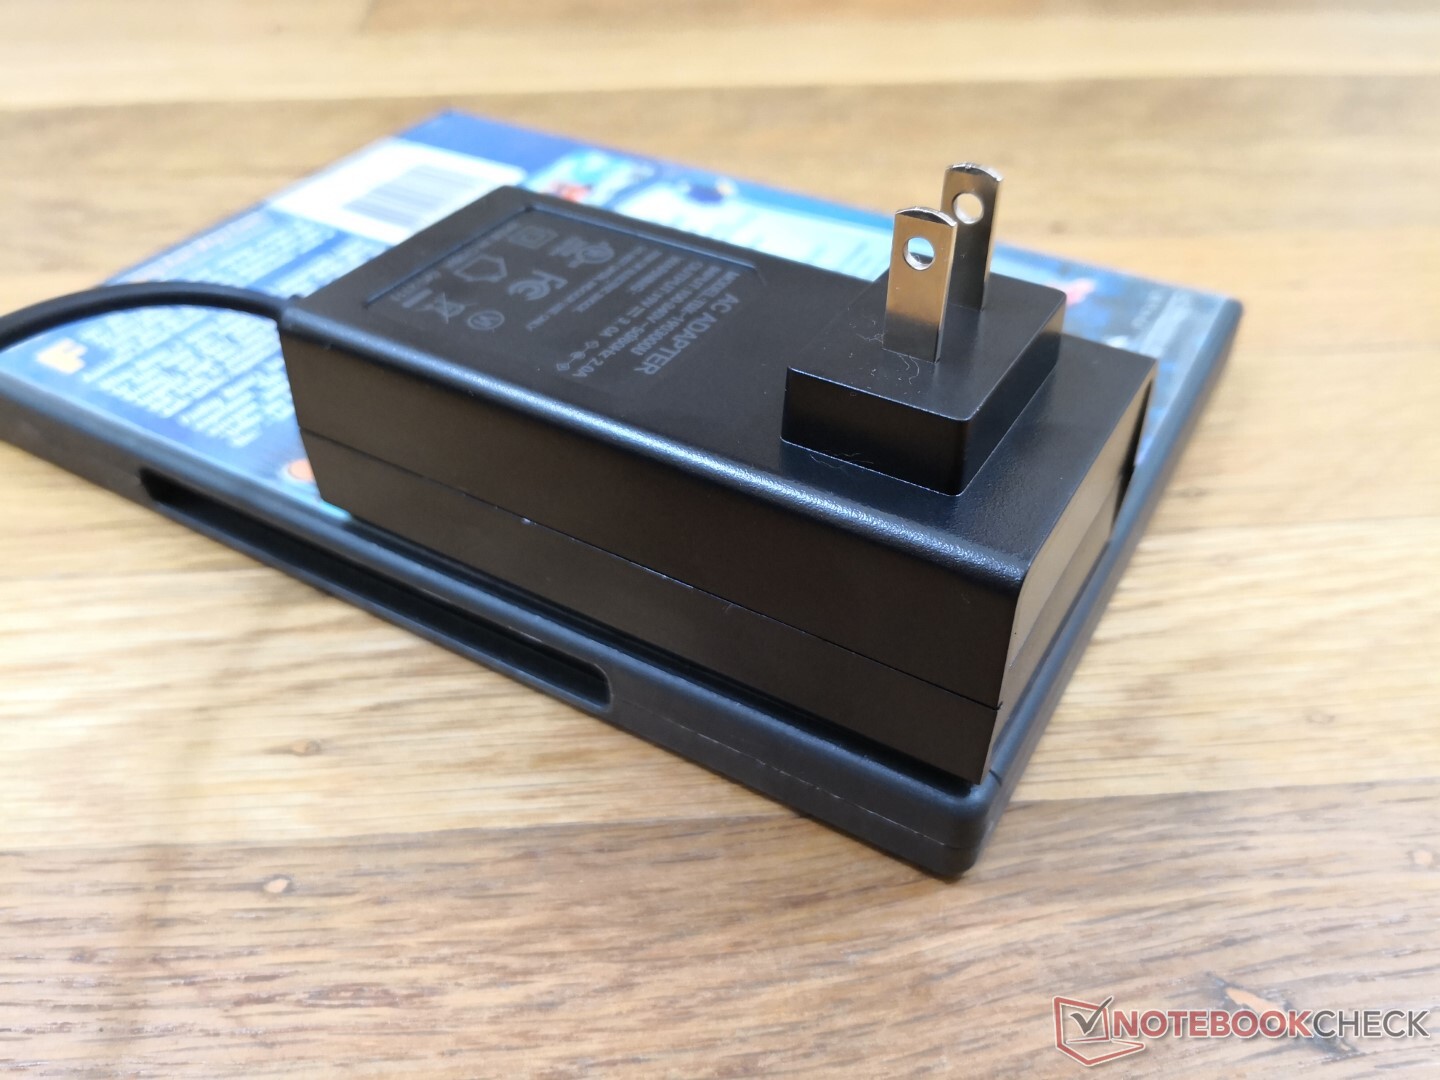
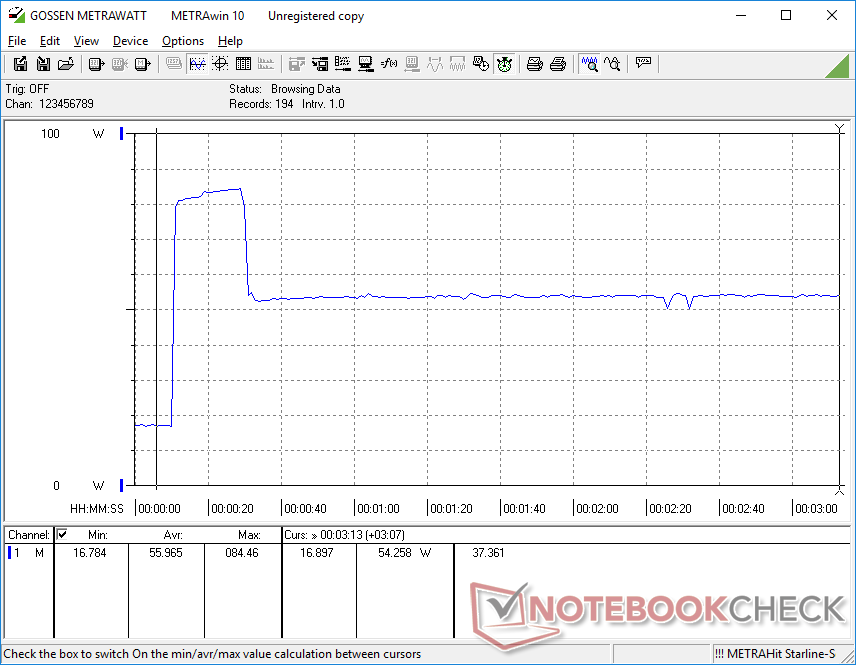
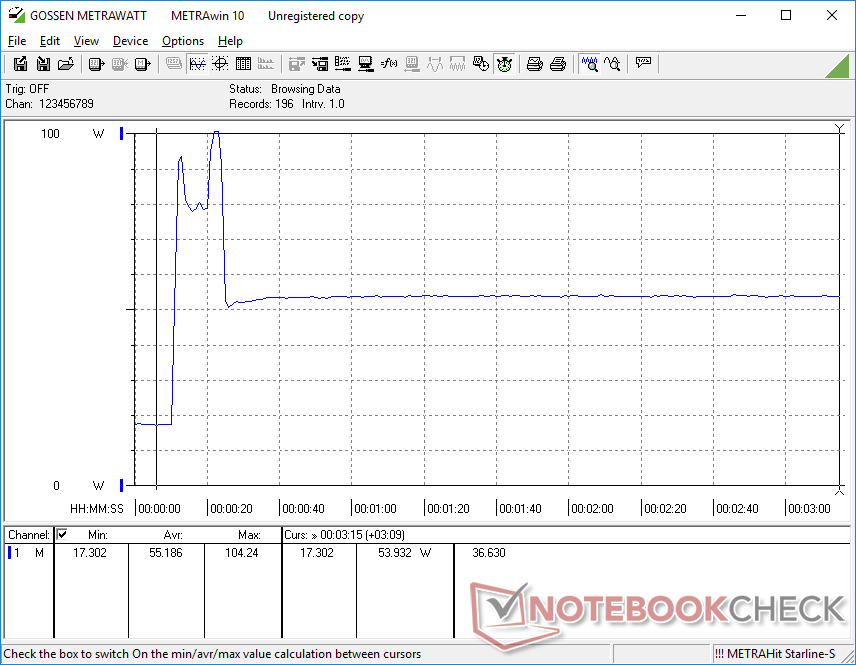
Siamo in grado di misurare un consumo massimo temporaneo di 104 W dall'adattatore AC medio-piccolo (~9.8 x 5 x 3.4 cm) da 57 W (19 V, 3A) quando si esegue Prime95. Questo picco dura circa 20 secondi prima di scendere e stabilizzarsi a 56 W come mostrato dai nostri grafici qui sotto.
| Off / Standby | |
| Idle | |
| Sotto carico |
|
Leggenda:
min: | |
| Beelink GTI 11 i5-1135G7, Iris Xe G7 80EUs, Kingston SA2000M8500G, , x, | Beelink SER3 R7 3750H, Vega 10, GSemi AZW GSDFN512TS3F1OGCX, , x, | Intel NUC11TNKi5 i5-1135G7, Iris Xe G7 80EUs, Transcend M.2 SSD 430S TS512GMTS430S, , x, | Intel NUC10i7FNH i7-10710U, UHD Graphics 620, Kingston RBUSNS8154P3256GJ1, , 0x0, 0" | GMK NucBox 2 i5-8259U, Iris Plus Graphics 655, Netac S930E8/256GPN, , x, | Intel Hades Canyon NUC8i7HVK i7-8809G, Vega M GH, Intel Optane 120 GB SSDPEK1W120GA, , x, | |
|---|---|---|---|---|---|---|
| Power Consumption | 45% | 22% | 33% | 45% | -45% | |
| Idle Minimum * (Watt) | 15.2 | 7 54% | 11.5 24% | 6.1 60% | 15.5 -2% | |
| Idle Average * (Watt) | 16 | 9.1 43% | 12.4 22% | 8.4 47% | 6.8 57% | 16.2 -1% |
| Idle Maximum * (Watt) | 16 | 9.7 39% | 12.9 19% | 7.3 54% | 16.5 -3% | |
| Load Average * (Watt) | 48.6 | 29.5 39% | 40.7 16% | 46.3 5% | 83.4 -72% | |
| Witcher 3 ultra * (Watt) | 53.8 | 32.5 40% | 43.9 18% | 121.7 -126% | ||
| Load Maximum * (Watt) | 104.3 | 48.7 53% | 73.5 30% | 86 18% | 50.7 51% | 173.5 -66% |
* ... Meglio usare valori piccoli
Power Consumption Witcher 3 / Stresstest
Power Consumption external Monitor
Pro
Contro
Verdetto - Come un Intel NUC, ma con un prezzo più ragionevole
Il Beelink GTI 11 è molto convincente. Per $600 a $700 USD, gli utenti stanno ottenendo il pacchetto completo con RAM, storage e Windows 10 Pro mentre un Intel NUC 11 con la stessa CPU verrebbe eseguito per quasi 600 dollari come kit base. Quindi, si spenderebbe quasi 800 dollari per un Intel NUC solo per eguagliare le specifiche del Beelink. Il fatto che possa supportare accessori Thunderbolt 4, Wi-Fi 6 e fino a tre SSD interni significa che gli utenti non devono rinunciare a molte caratteristiche importanti quando passano al Beelink.
Lo svantaggio principale da tenere a mente è il cattivo comportamento del rumore della ventola del GTI 11. Il numero di giri della ventola cambia frequentemente e sensibilmente per apparentemente senza motivo. Aspettatevi che il sistema sia complessivamente più rumoroso rispetto alla maggior parte dei modelli Intel NUC.
Prezzo e disponibilità
Price comparison

