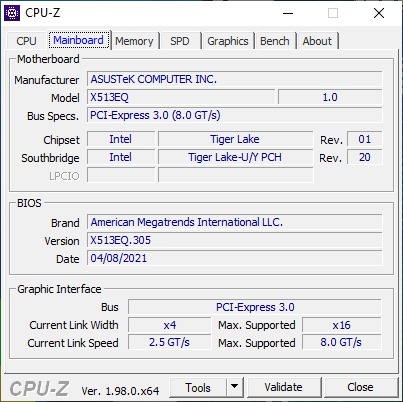
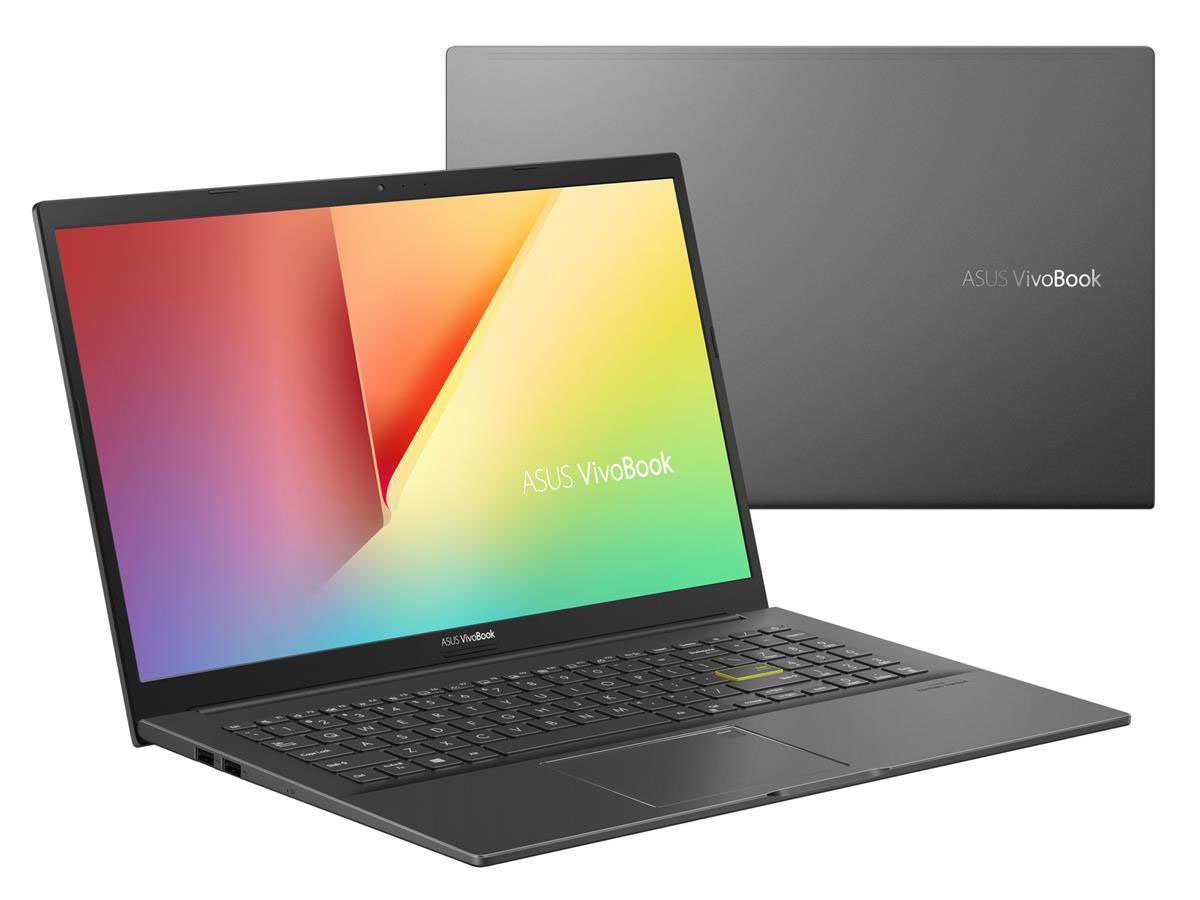
Recensioen del laptop Asus Vivobook 15 K513EQ OLED: L'alternativa Lenovo IdeaPad
Fate un passo indietro rispetto alla serie di fascia alta Asus ZenBook e vi troverete immersi nella serie economica Asus VivoBook. La famiglia si è rapidamente espansa in una linea confusamente grande di modelli che consistono di CPU Intel e AMD con grafica integrata o discreta e persino opzioni OLED. È stato sicuramente difficile tenere il passo e l'ultimo VivoBook 15 K513 non rende le cose esattamente più facili.
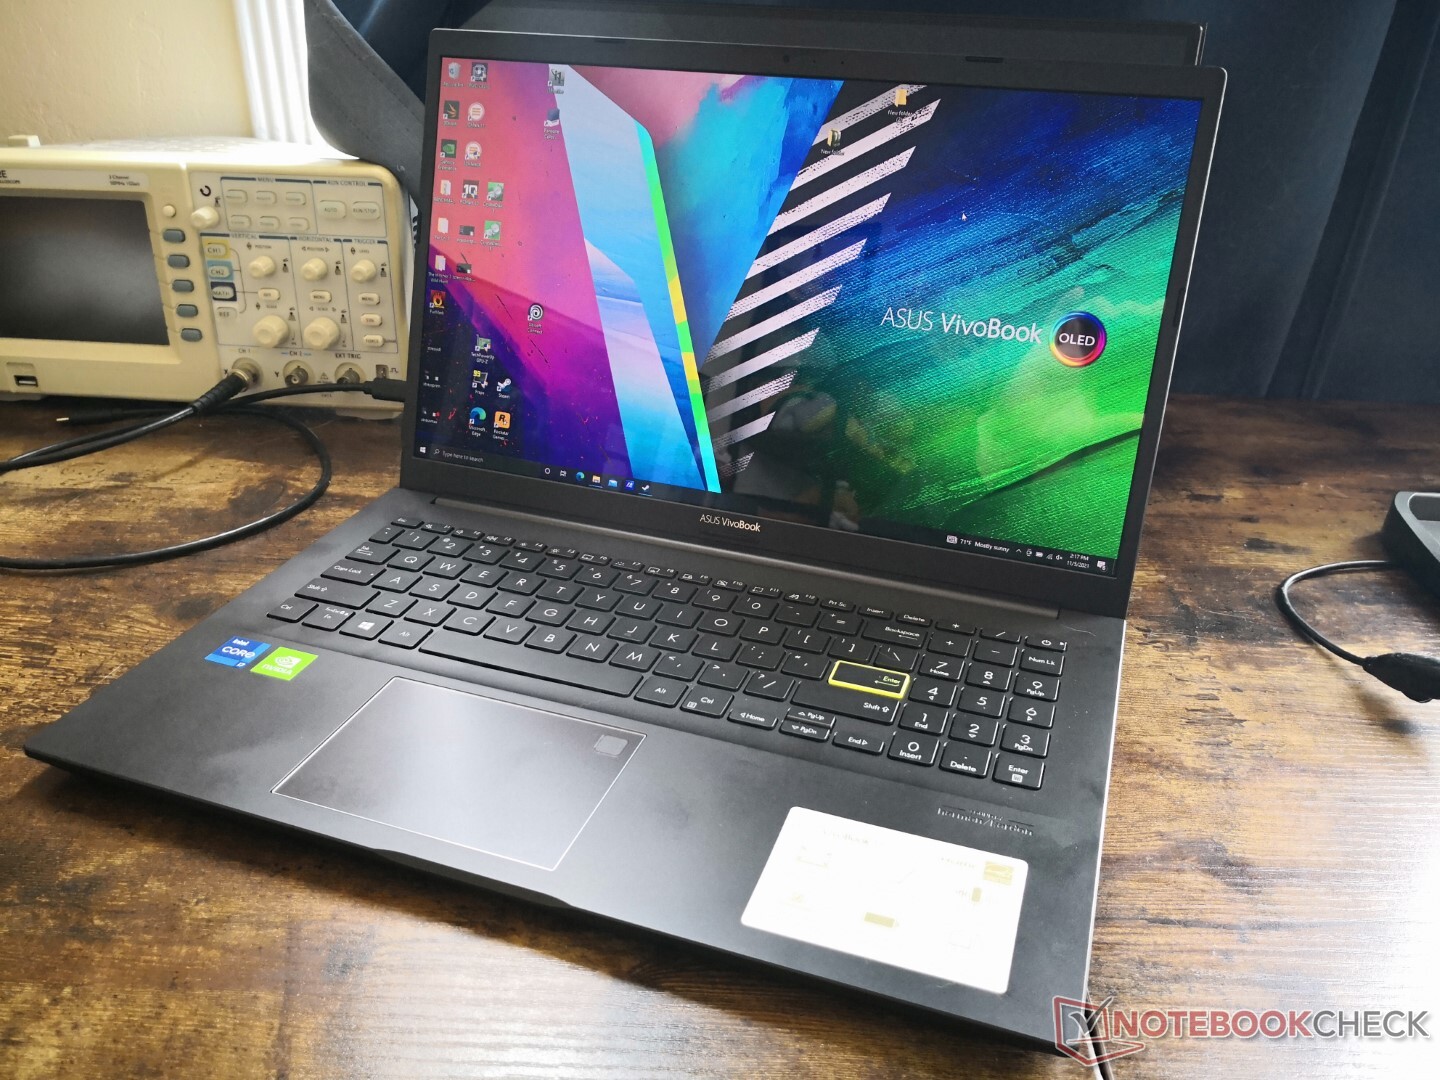
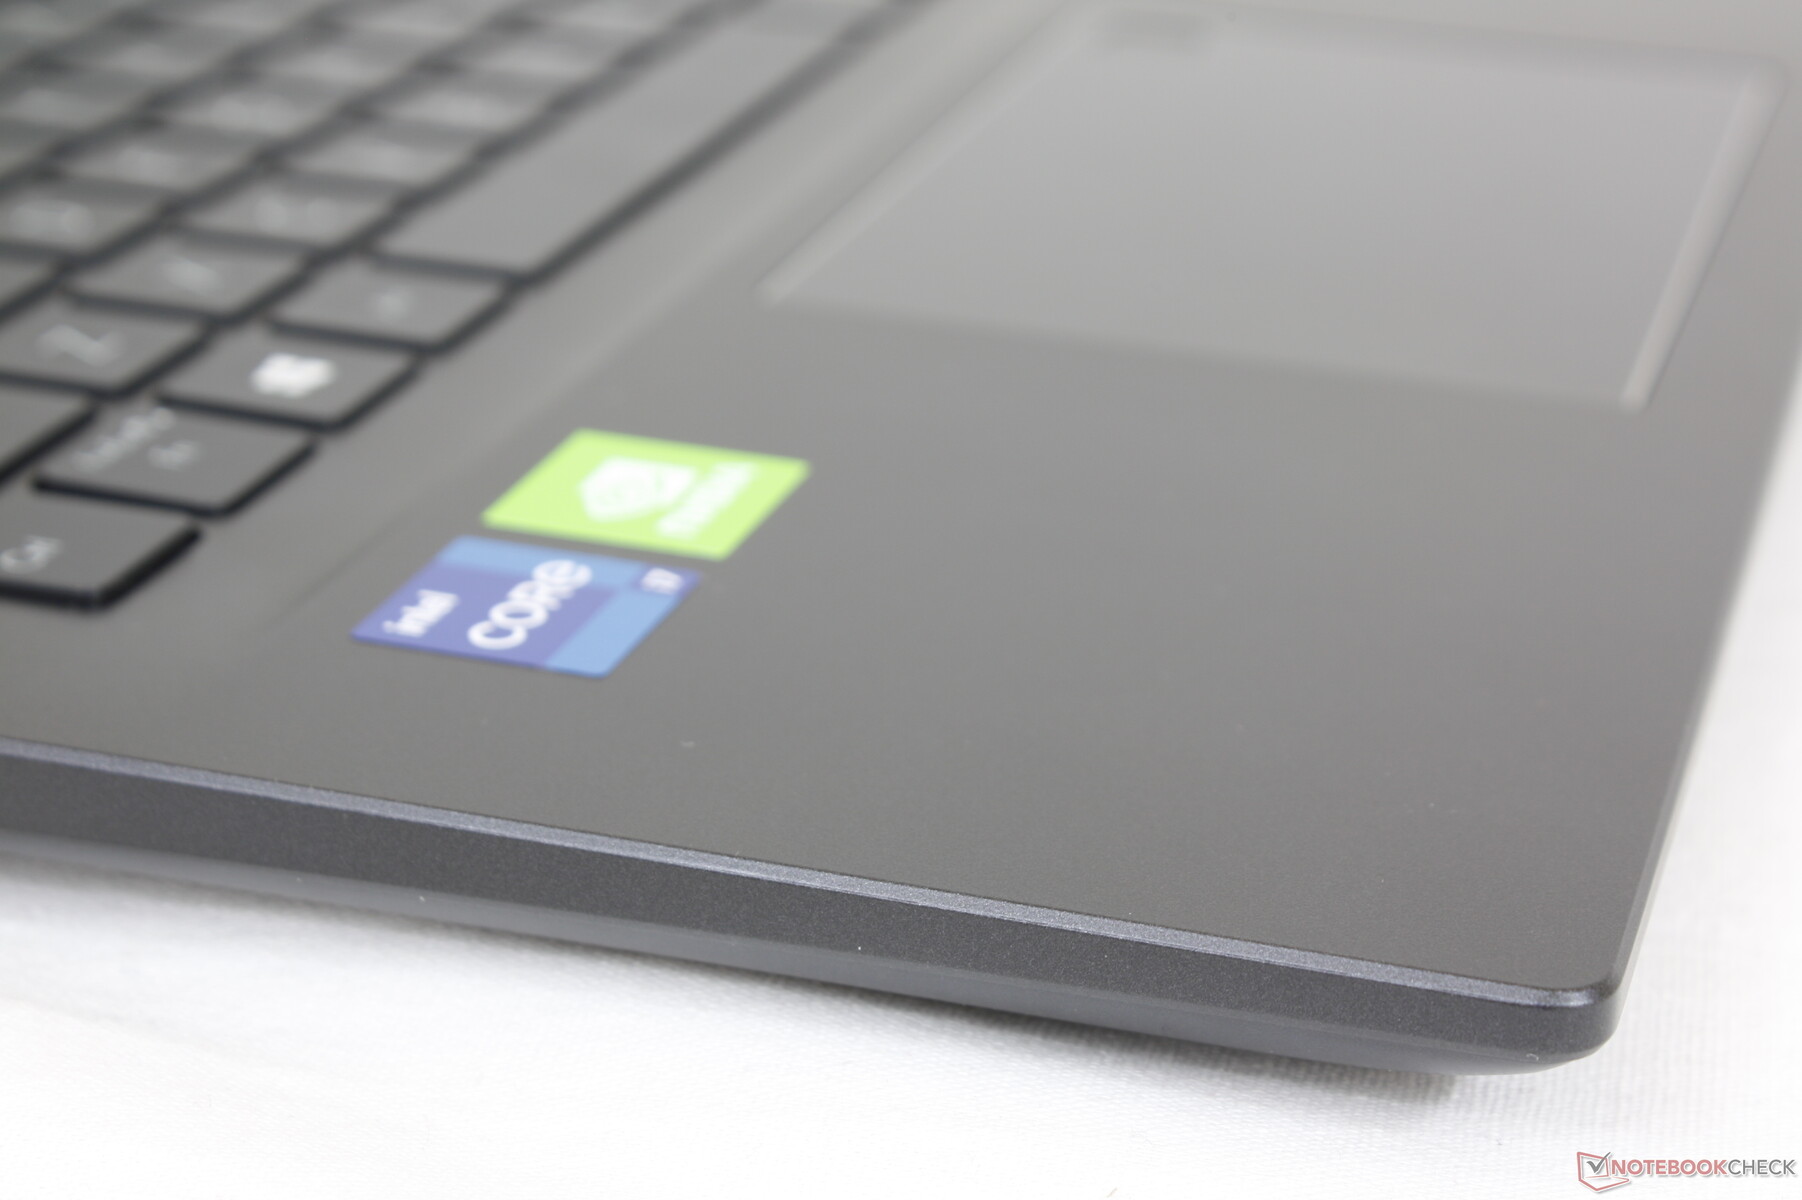
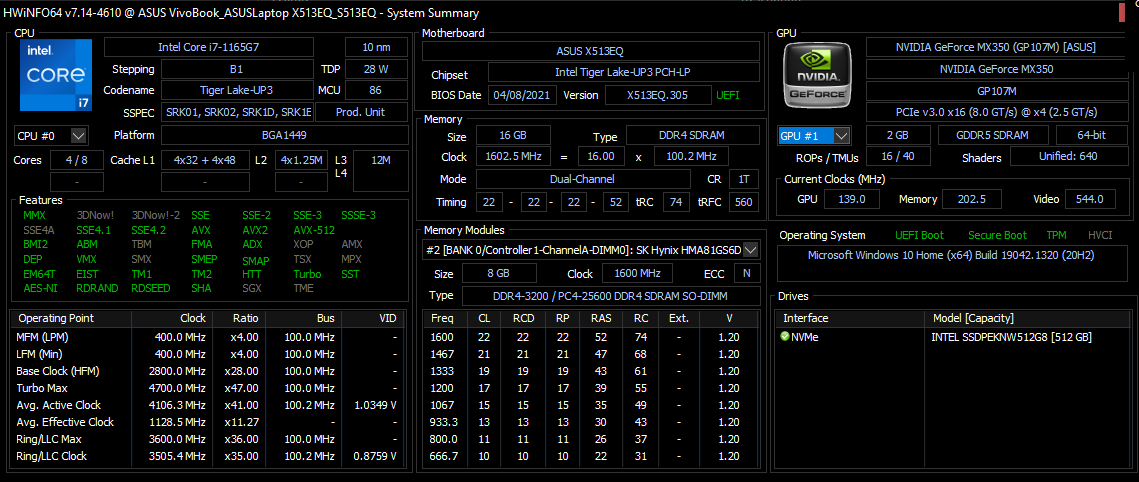
A parte la convenzione dei nomi, la nostra unità di test VivoBook 15 K513 è certamente diversa dalla maggior parte degli altri computer portatili multimediali economici o di fascia media là fuori con la sua non comune accoppiata Intel 11th gen Core i7-1165G7 e GeForce MX350. Inoltre, è uno dei primi portatili da 15,6 pollici a venire con un display OLED 1080p non touch rispetto a tutti i pannelli OLED 4K là fuori. Daremo uno sguardo più da vicino alle prestazioni, al display e alle caratteristiche fisiche del VivoBook 15 K513 per scoprire cosa esattamente lo rende così diverso da tutti gli altri modelli VivoBook 15 sul mercato
I concorrenti in questo spazio includono altri portatili multimediali di fascia media come il Lenovo IdeaPad 5 15, Dell Inspiron 15, HP Pavilion 15, o il MSI Summit B15/E15serie. La nostra specifica unità di prova può essere trovata online per circa $900 - $1000 USD.
Altre recensioni di Asus VivoBook:
Potential Competitors in Comparison
Punteggio | Data | Modello | Peso | Altezza | Dimensione | Risoluzione | Prezzo |
|---|---|---|---|---|---|---|---|
| 80.6 % v7 (old) | 11/2021 | Asus Vivobook 15 K513EQ i7-1165G7, GeForce MX350 | 1.6 kg | 17.9 mm | 15.60" | 1920x1080 | |
| 85.9 % v7 (old) | 11/2021 | Asus VivoBook 15 Pro M3500QC-L1062 R5 5600H, GeForce RTX 3050 4GB Laptop GPU | 1.7 kg | 19.9 mm | 15.60" | 1920x1080 | |
| 83.4 % v7 (old) | 12/2020 | Asus VivoBook S15 S533EQ-BQ002T i7-1165G7, GeForce MX350 | 1.8 kg | 16.1 mm | 15.60" | 1920x1080 | |
| 83.5 % v7 (old) | 08/2021 | Lenovo IdeaPad 5 15ALC05 R5 5500U, Vega 7 | 1.7 kg | 19.1 mm | 15.60" | 1920x1080 | |
| 80.5 % v7 (old) | 10/2021 | Dell Inspiron 15 3501 i7-1165G7, Iris Xe G7 96EUs | 2 kg | 19.9 mm | 15.60" | 1920x1080 | |
| 81.2 % v7 (old) | 06/2021 | HP Pavilion 15-eg i7-1165G7, GeForce MX450 | 1.7 kg | 17.9 mm | 15.60" | 1920x1080 |
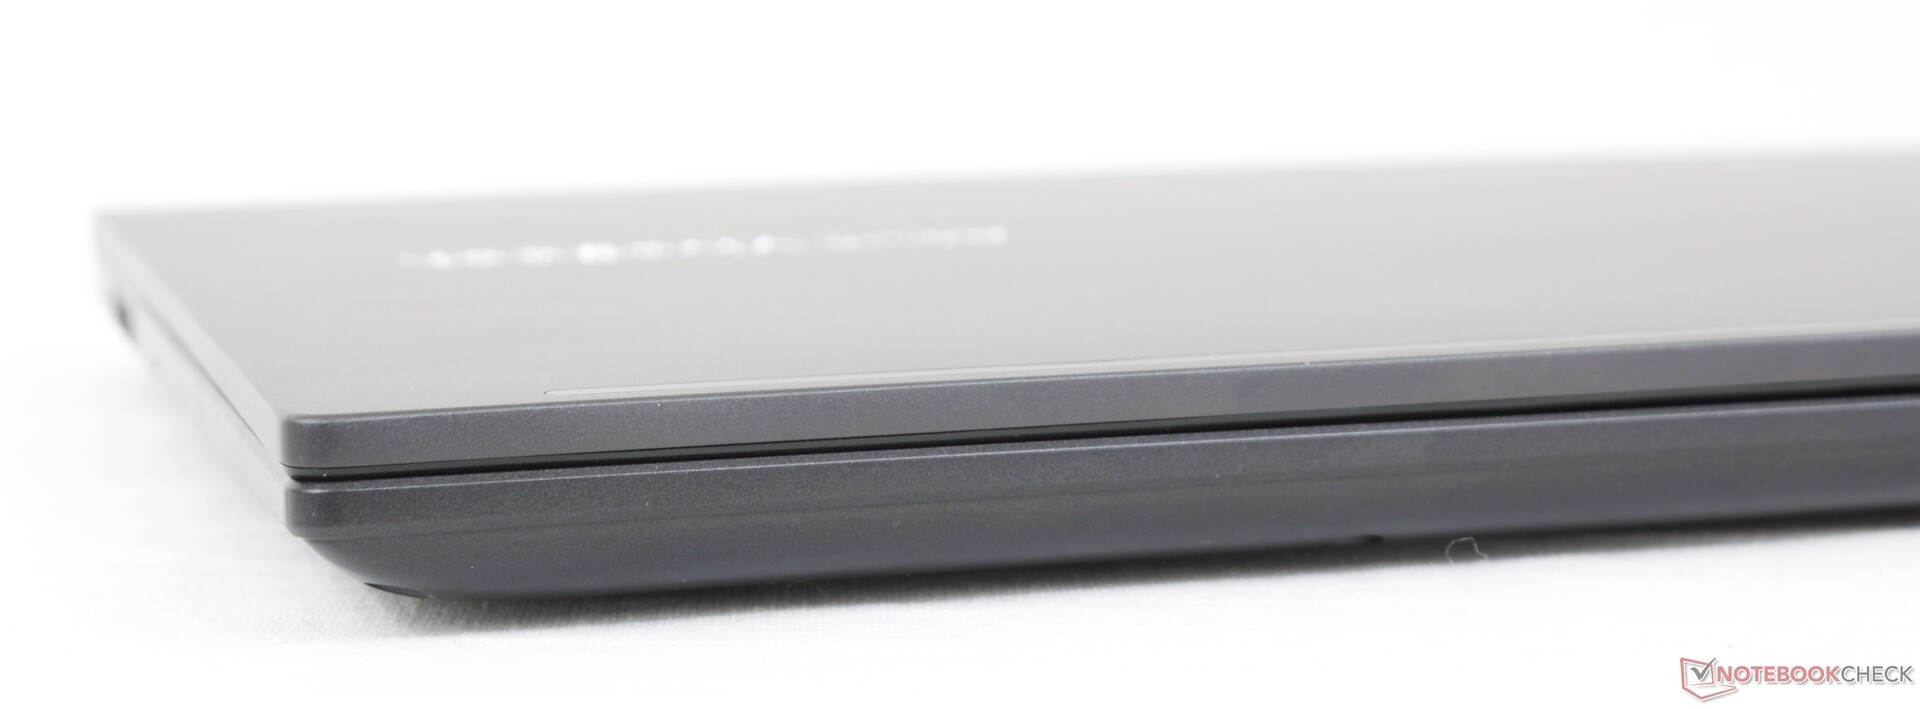
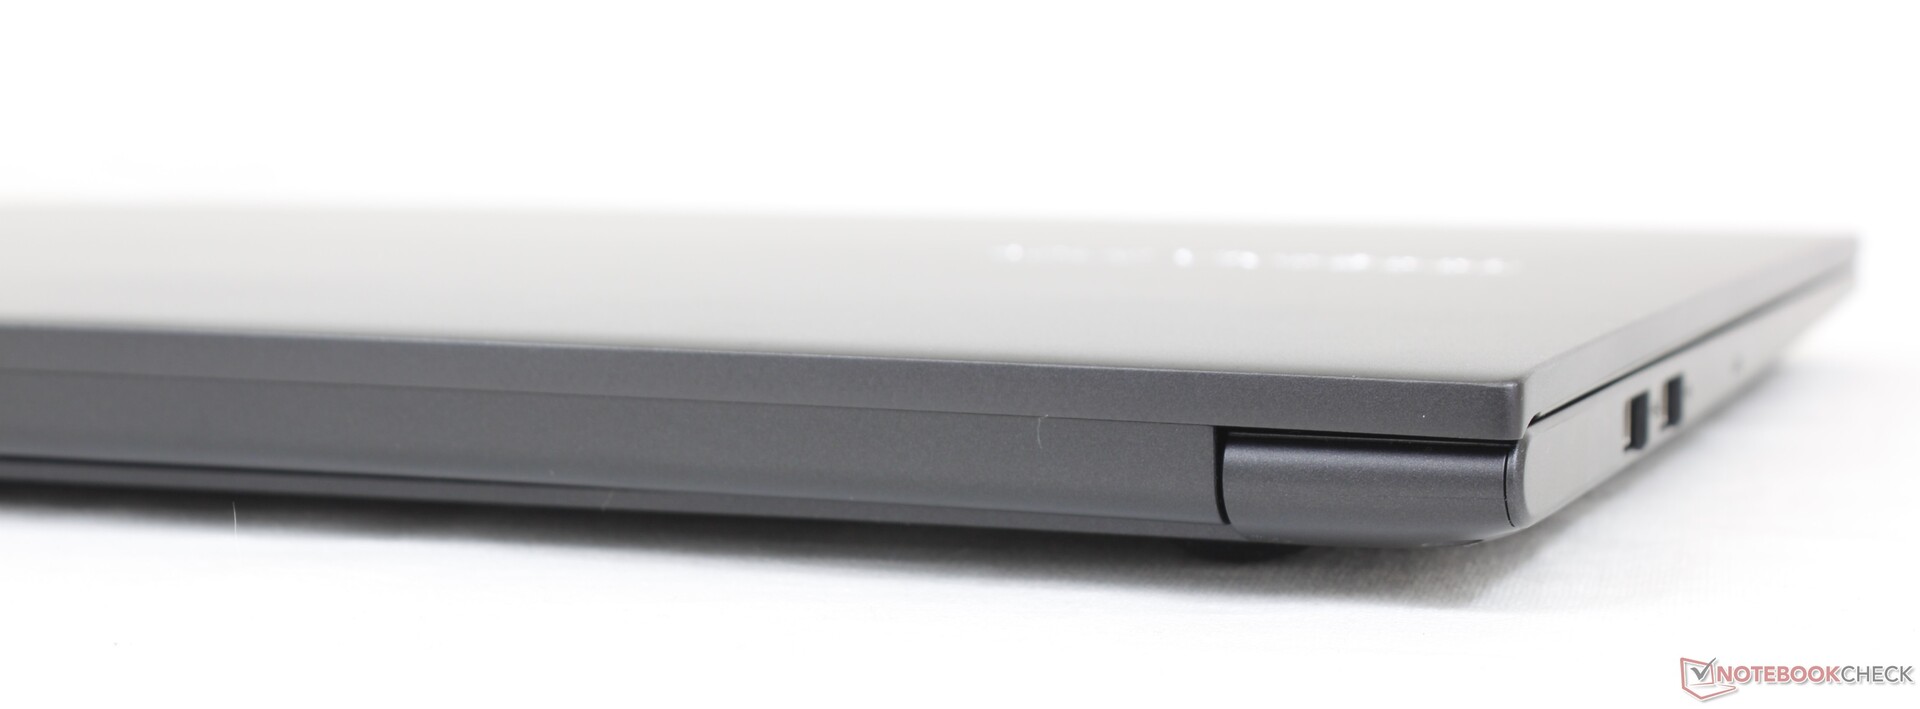
Caso - Spero ti piaccia la plastica
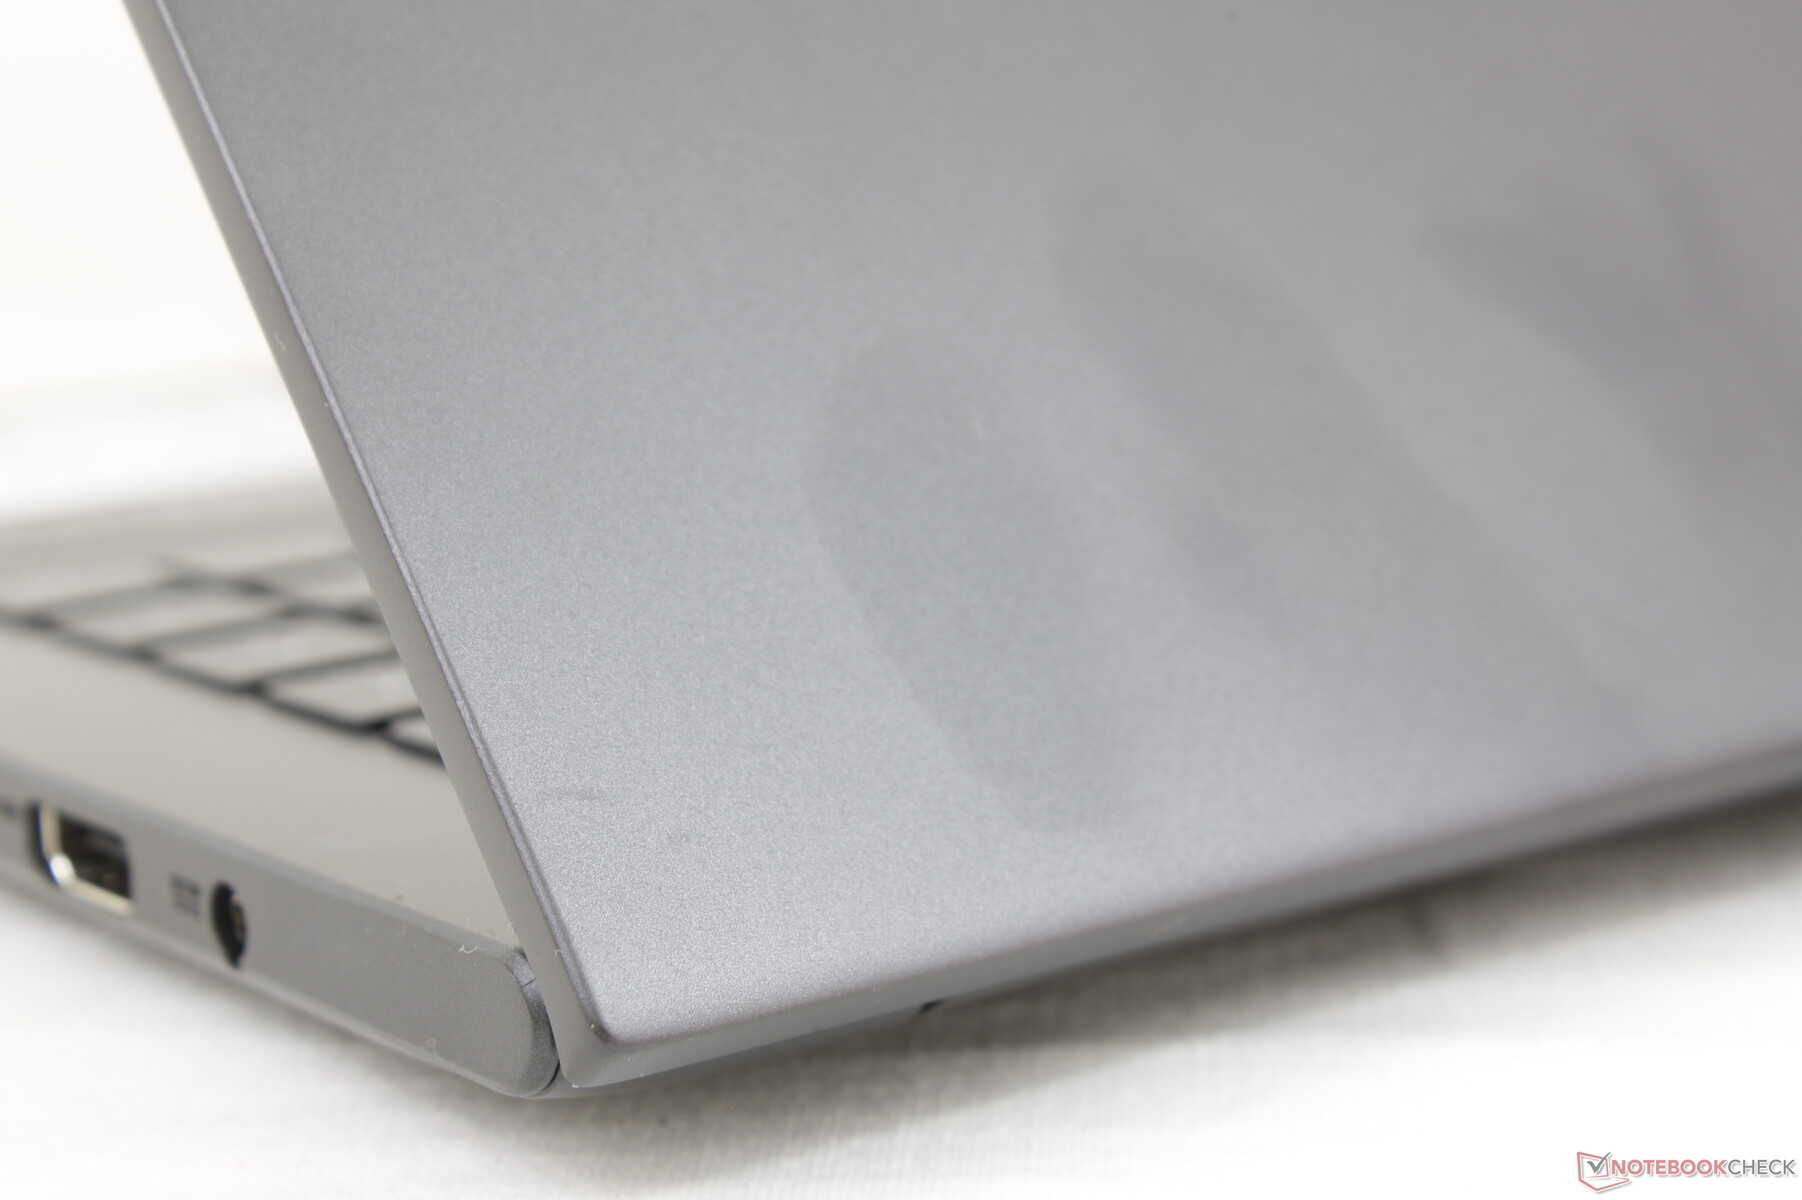
Ci sono moderate differenze sia all'interno che all'esterno tra tutti i vari modelli di VivoBook 15 da 15,6 pollici. Nel nostro caso, il VivoBook 15 K513 è più simile al VivoBook 15 F512 in termini di posizionamento delle porte e disposizione della scheda madre. La base in plastica, in particolare, non è neanche lontanamente così solida o lussuosa come un tipico ZenBook 15, HP Spectre, o Dell XPS 15 il che è da aspettarselo. La rigidità dello chassis è invece più in linea con il Lenovo IdeaPad 5 15 o Dell Inspiron 3501 mentre è un po' più debole dell'ultimo HP Pavilion 15. Il centro della tastiera, per esempio, si flette più facilmente di quanto vorremmo.
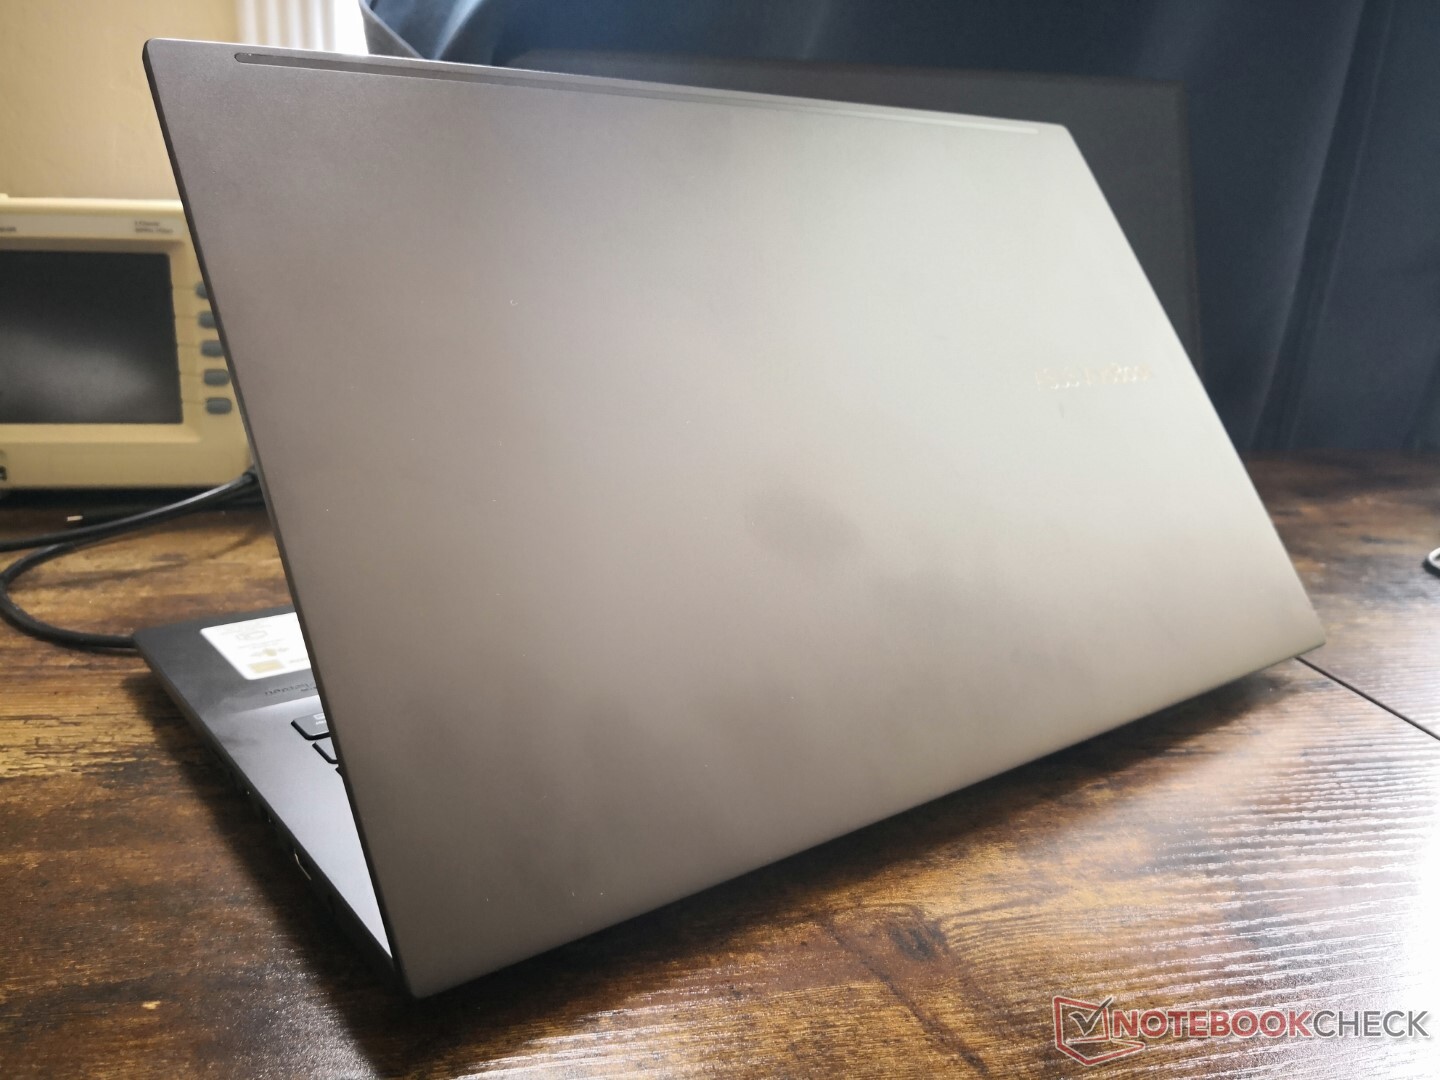
Il sistema è più leggero di molti dei suoi concorrenti di circa 100 g - 200 g nonostante la GPU discreta e il pannello OLED. Le dimensioni complessive sono più simili all'ultimo HP Pavilion 15 mentre sono più sottili e più spesse del VivoBook 15 Pro e del VivoBook S15, rispettivamente.
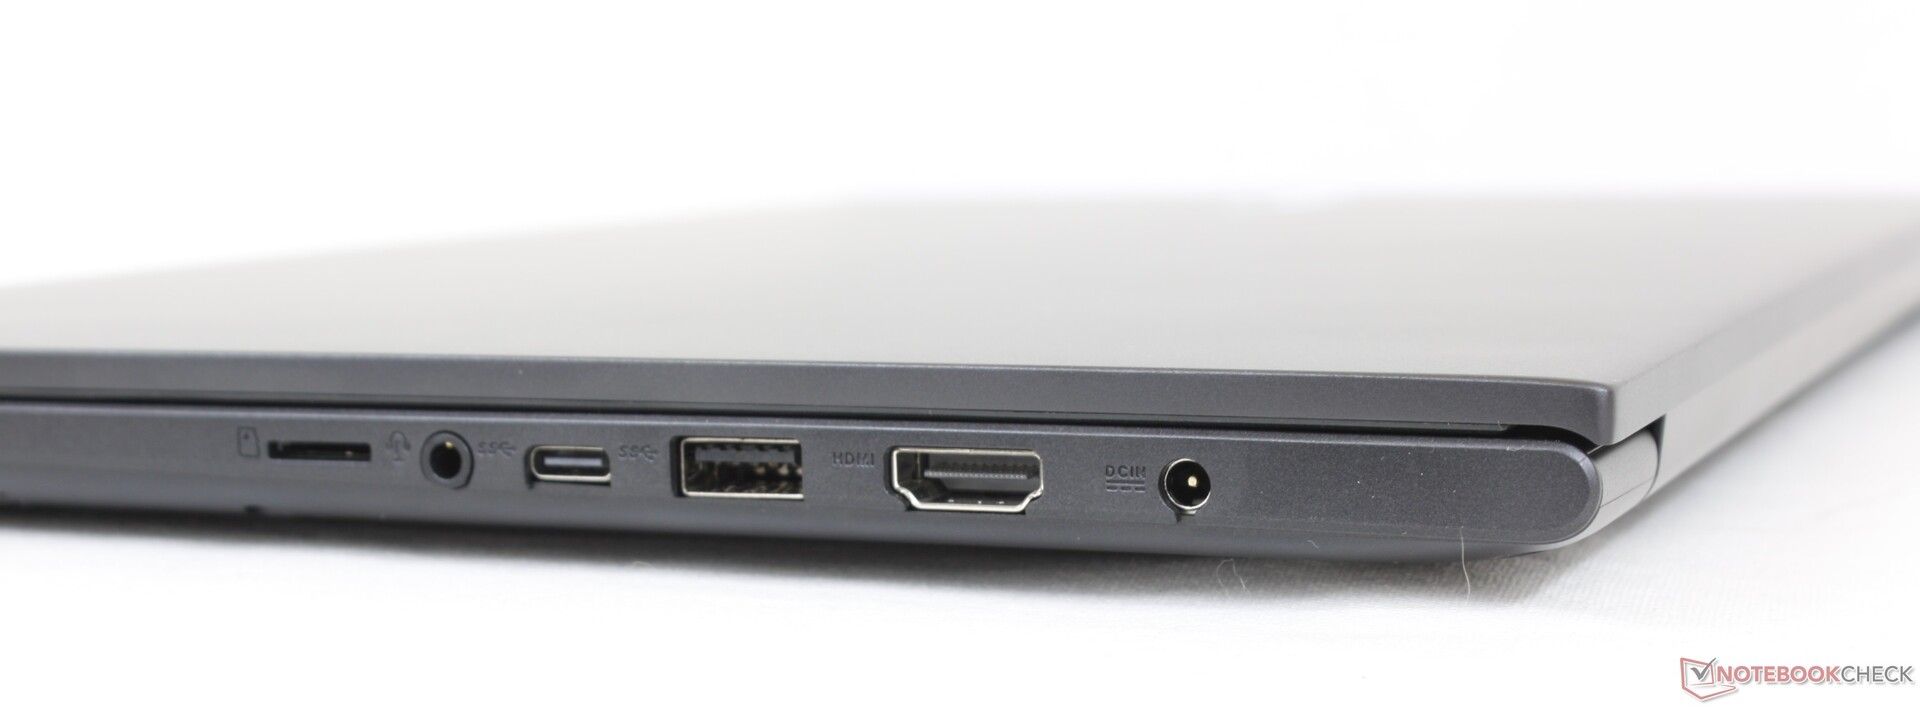
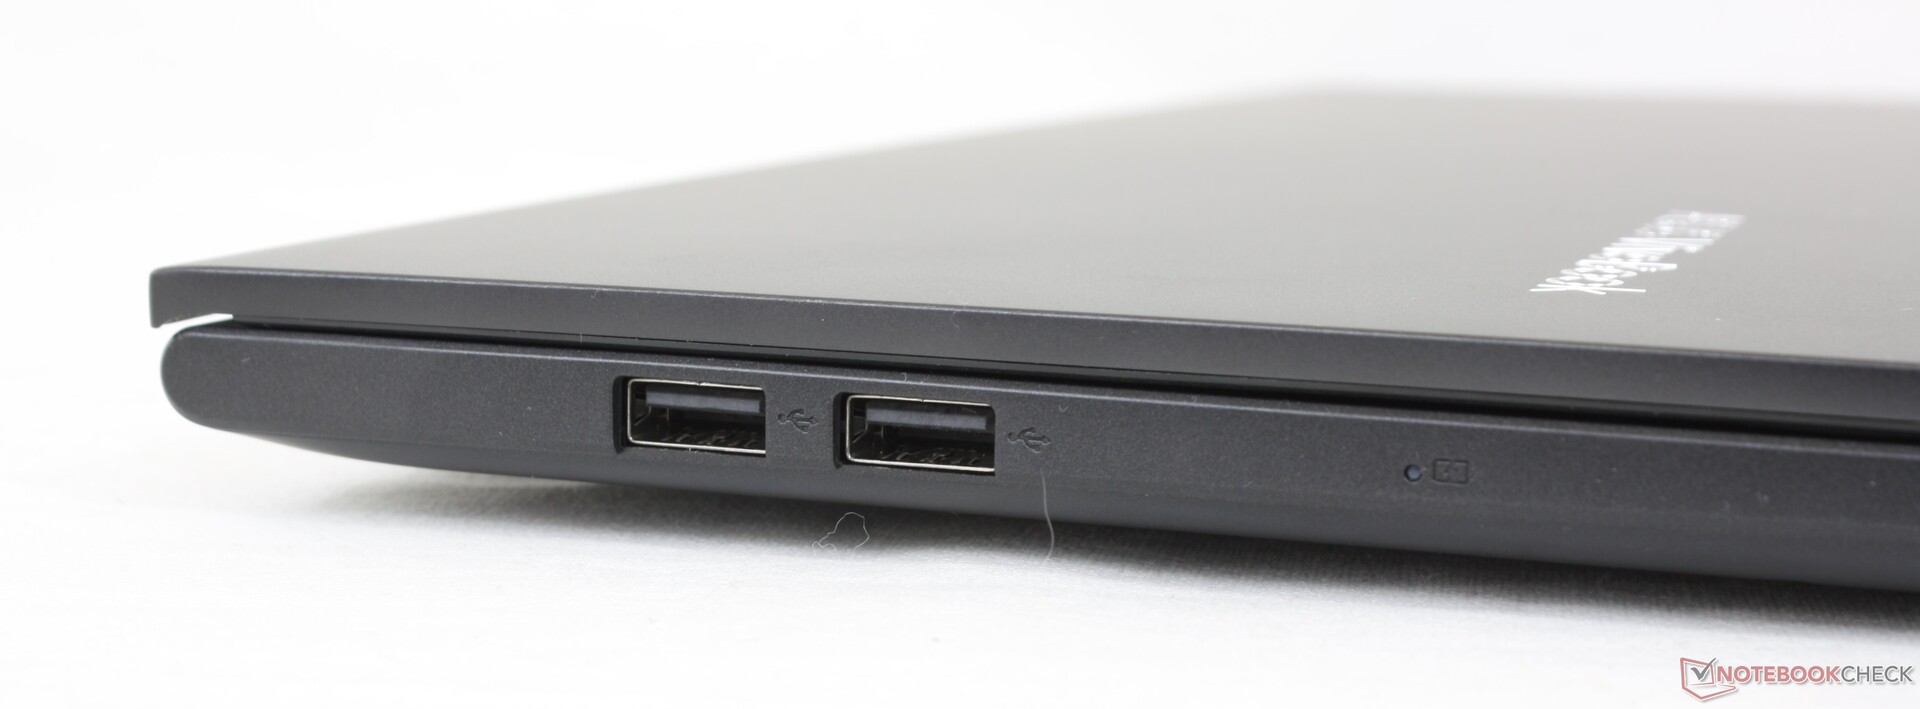
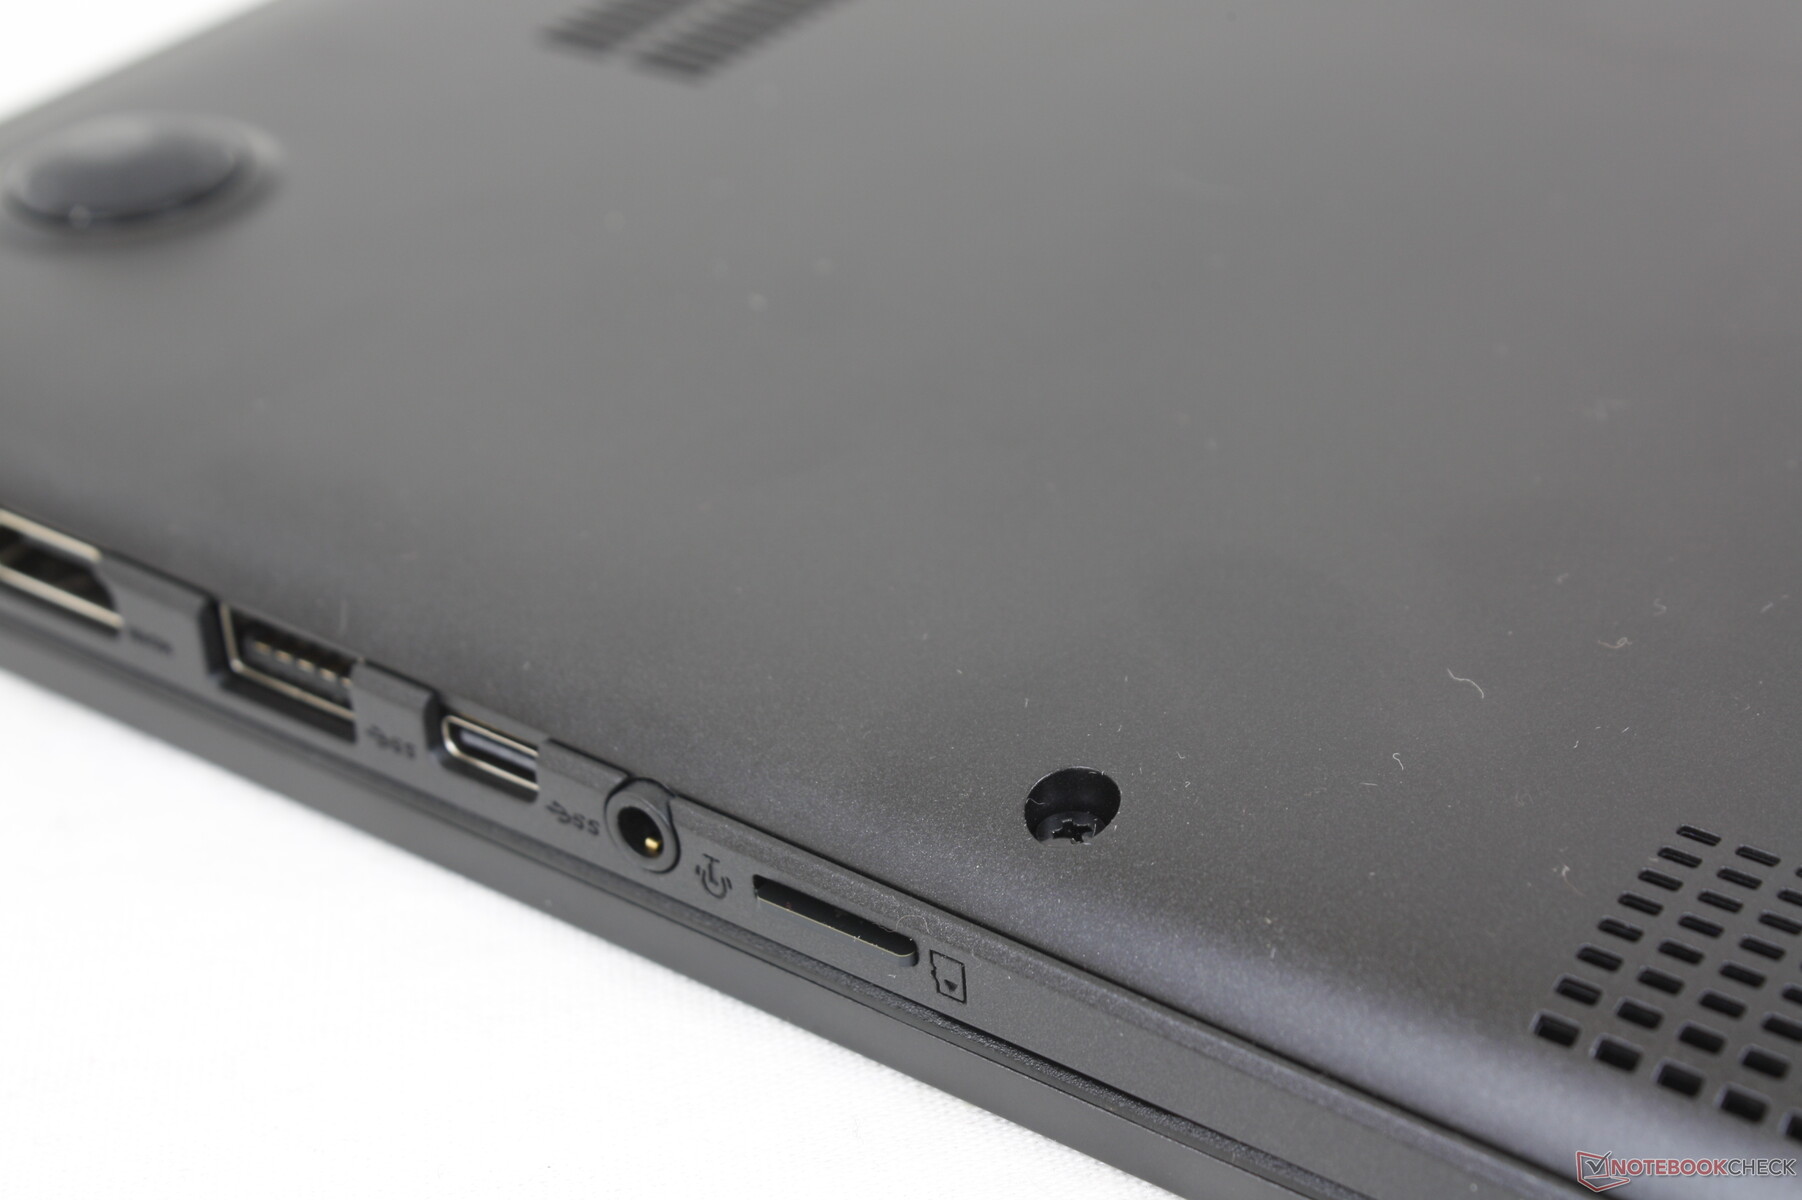
Connettività - Nessuna ricarica Thunderbolt o USB-C
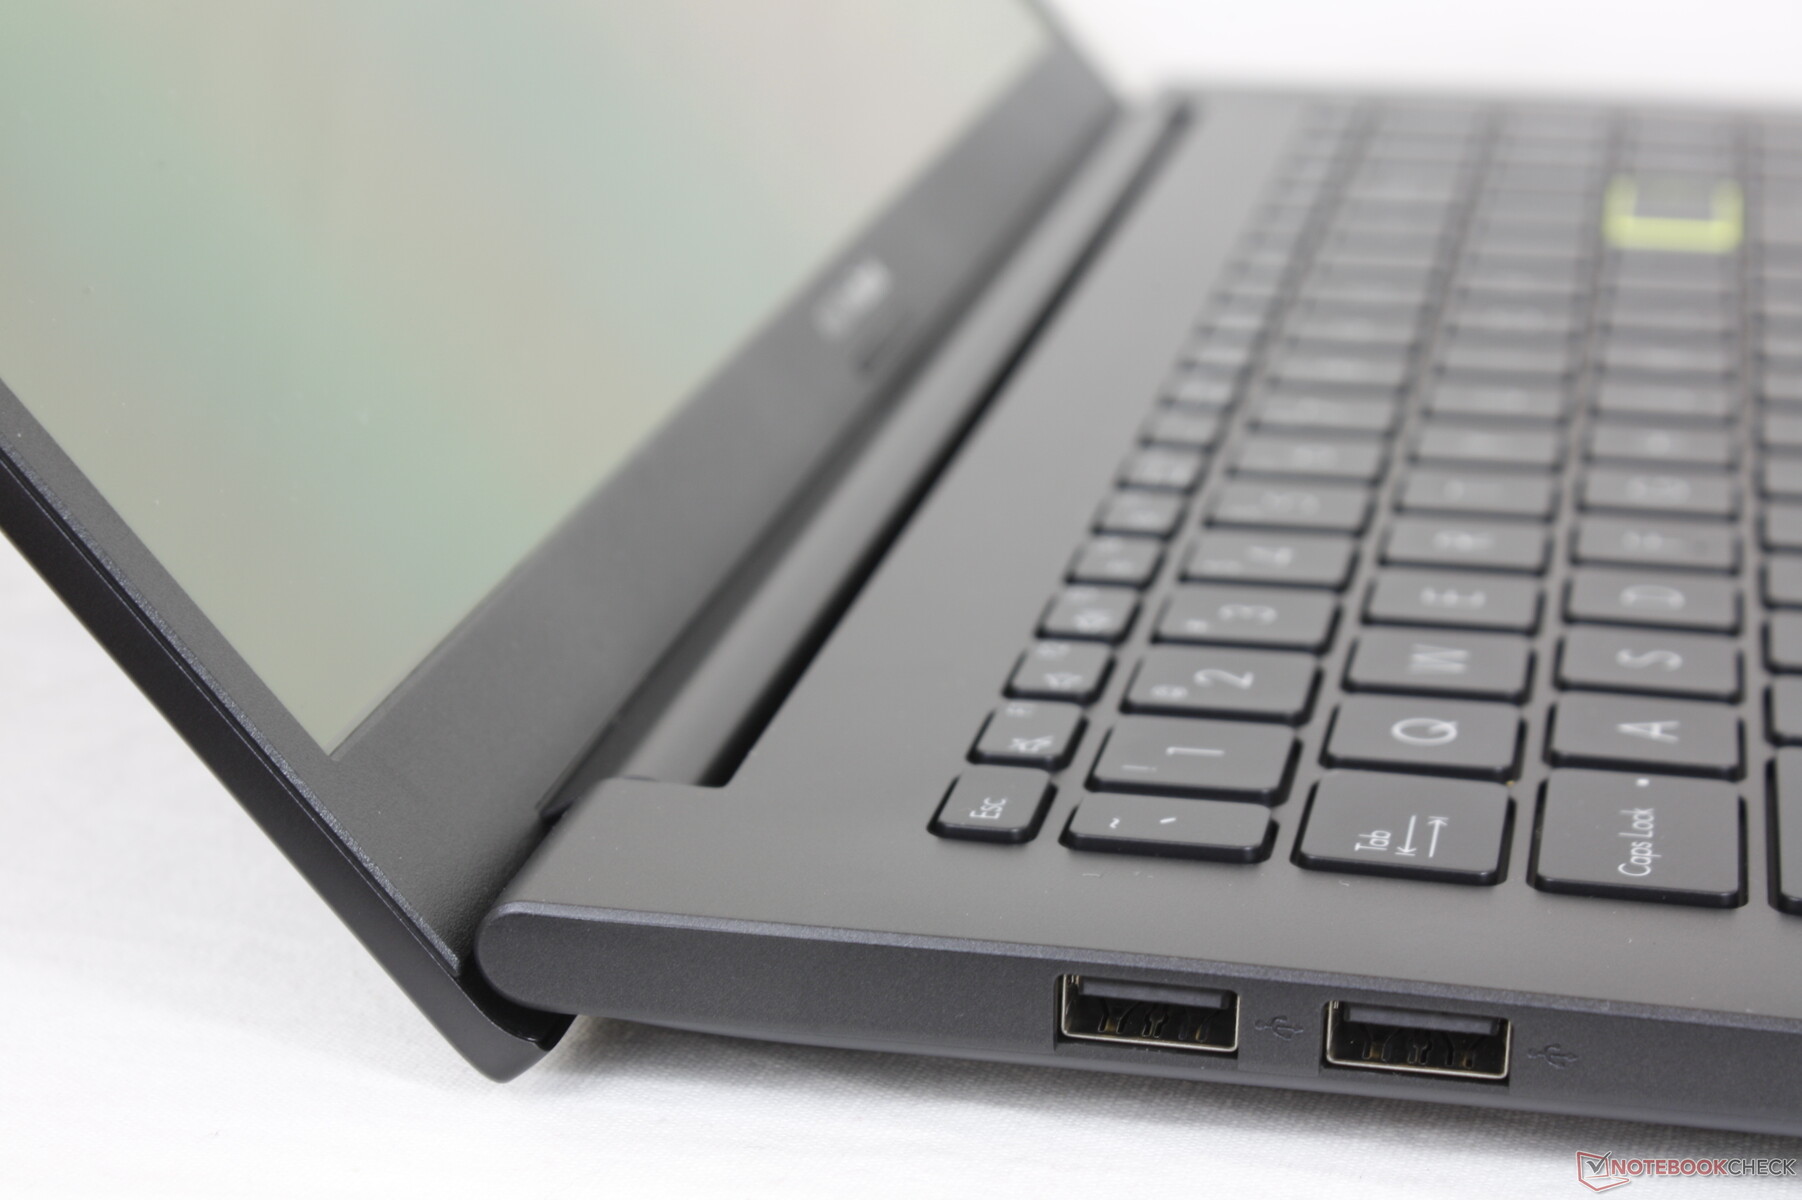
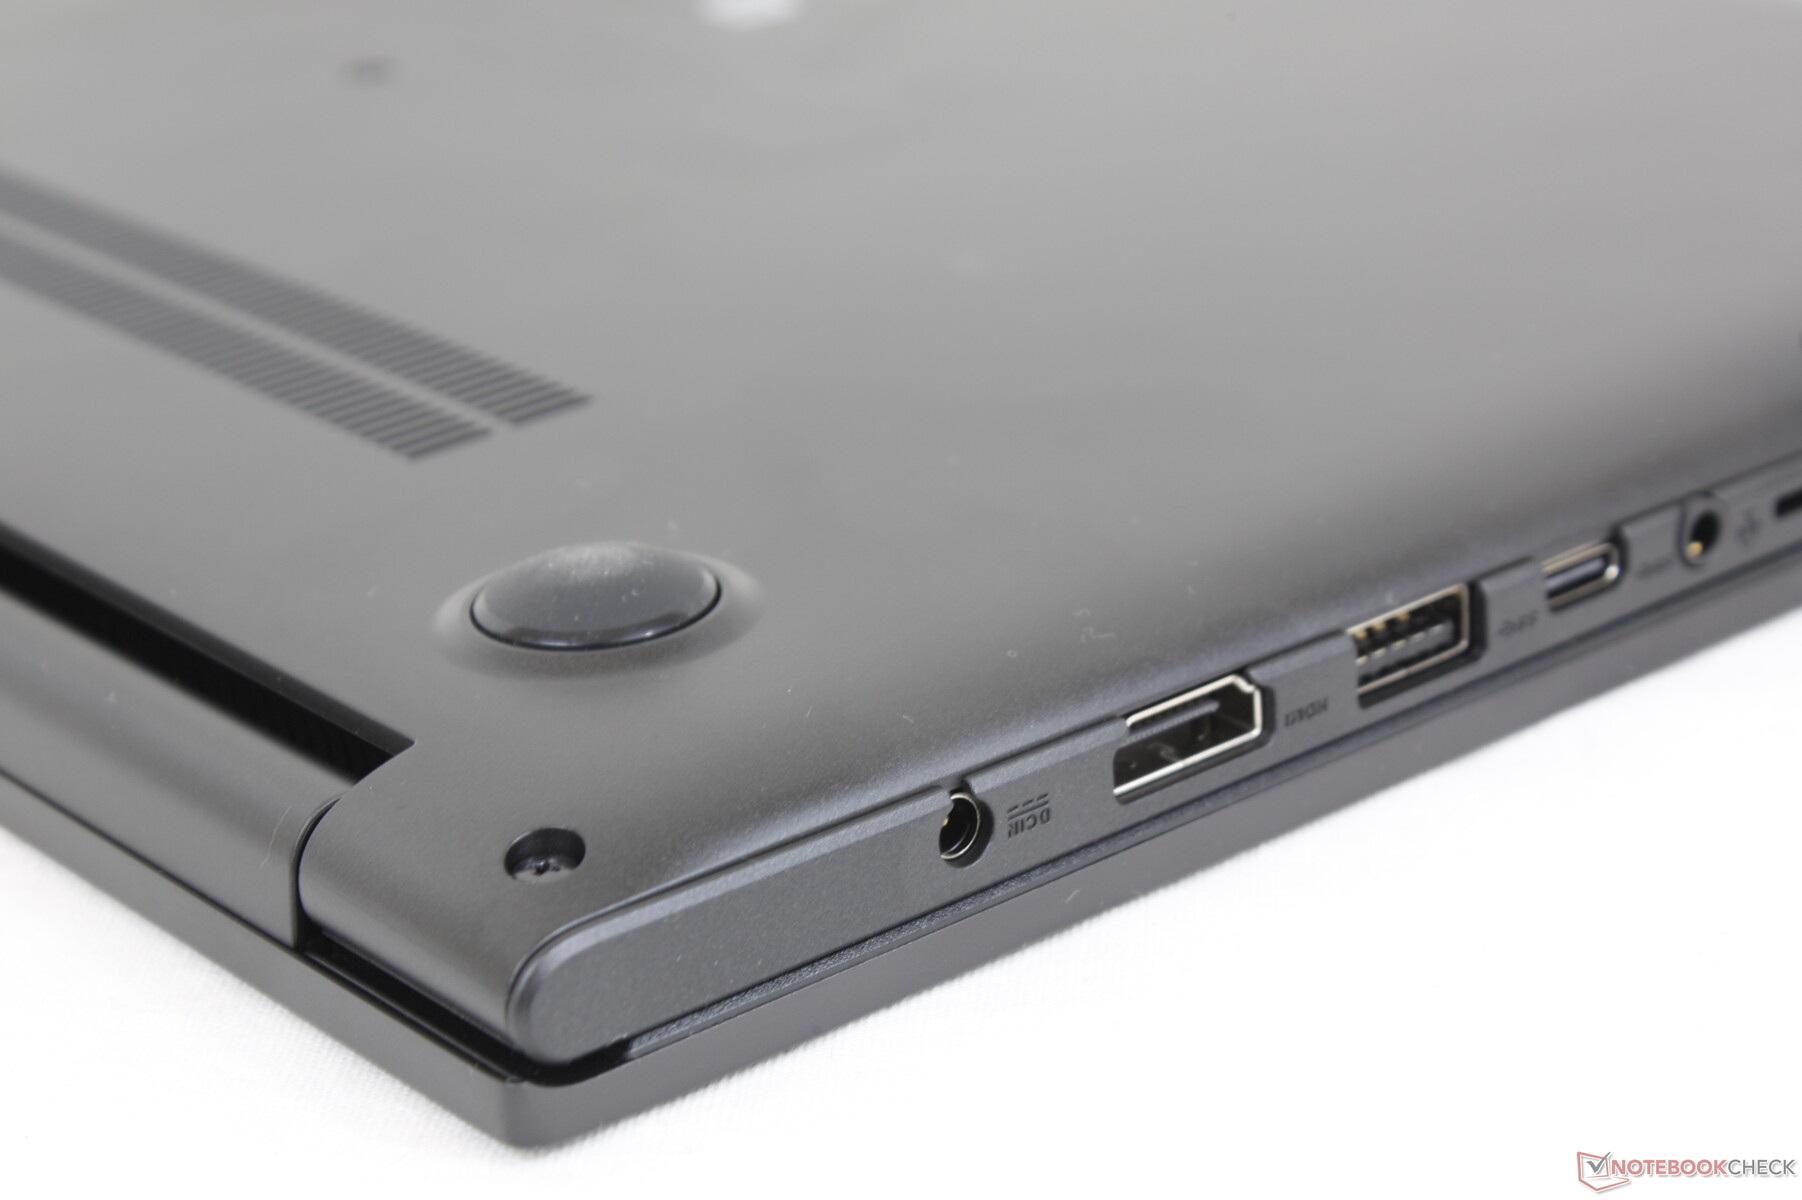
Le opzioni delle porte sono decenti, ma con avvertimenti deludenti. In primo luogo, la porta USB-C non supporta DisplayPort o Power Delivery, il che significa che non è possibile collegare monitor esterni o ricaricare il sistema attraverso questa porta a differenza della maggior parte degli altri portatili. In secondo luogo, la porta HDMI è solo la versione 1.4 che significa che manca il supporto per monitor esterni 4K a 60 FPS. Il modello utilizza anche porte USB-A 2.0 più lente che USB-A 3.0.
Lettore di schede SD
Il lettore di schede MicroSD a molla rimane lento per riflettere la gamma economica Vivobook. Spostare 1 GB di immagini dalla nostra scheda di test UHS-II al desktop richiede circa 30 secondi rispetto ai soli 14 secondi dello ZenBook 15.
| SD Card Reader | |
| average JPG Copy Test (av. of 3 runs) | |
| HP Pavilion 15-eg (AV PRO microSD 128 GB V60) | |
| Asus VivoBook 15 Pro M3500QC-L1062 (AV Pro V60) | |
| Asus Vivobook 15 K513EQ (AV Pro V60) | |
| Lenovo IdeaPad 5 15ALC05 (Toshiba Exceria Pro SDXC 64 GB UHS-II) | |
| Asus VivoBook S15 S533EQ-BQ002T (Toshiba Exceria Pro M501 microSDXC 64GB) | |
| Dell Inspiron 15 3501 (AV Pro SD 128 GB V60) | |
| maximum AS SSD Seq Read Test (1GB) | |
| HP Pavilion 15-eg (AV PRO microSD 128 GB V60) | |
| Asus VivoBook 15 Pro M3500QC-L1062 (AV Pro V60) | |
| Asus Vivobook 15 K513EQ (AV Pro V60) | |
| Lenovo IdeaPad 5 15ALC05 (Toshiba Exceria Pro SDXC 64 GB UHS-II) | |
| Dell Inspiron 15 3501 (AV Pro SD microSD 128 GB V60) | |
| Asus VivoBook S15 S533EQ-BQ002T (Toshiba Exceria Pro M501 microSDXC 64GB) | |
Comunicazione
La nostra unità di test è dotata di Wi-Fi 6 mentre le SKU minori sono dotate di Wi-Fi 5. Siamo in grado di raggiungere eccellenti tassi medi di ricezione nel mondo reale di oltre 1,2 Gbps sul nostro router di prova Netgear RAX200 mentre i tassi di trasmissione sono più deludenti a soli ~600 Mbps.
Webcam
La qualità della fotocamera rimane scarsa e in gran parte invariata da anni. Anche Windows Hello non è supportato, dato che non c'è un sensore IR integrato e nemmeno un otturatore fisico per la privacy.


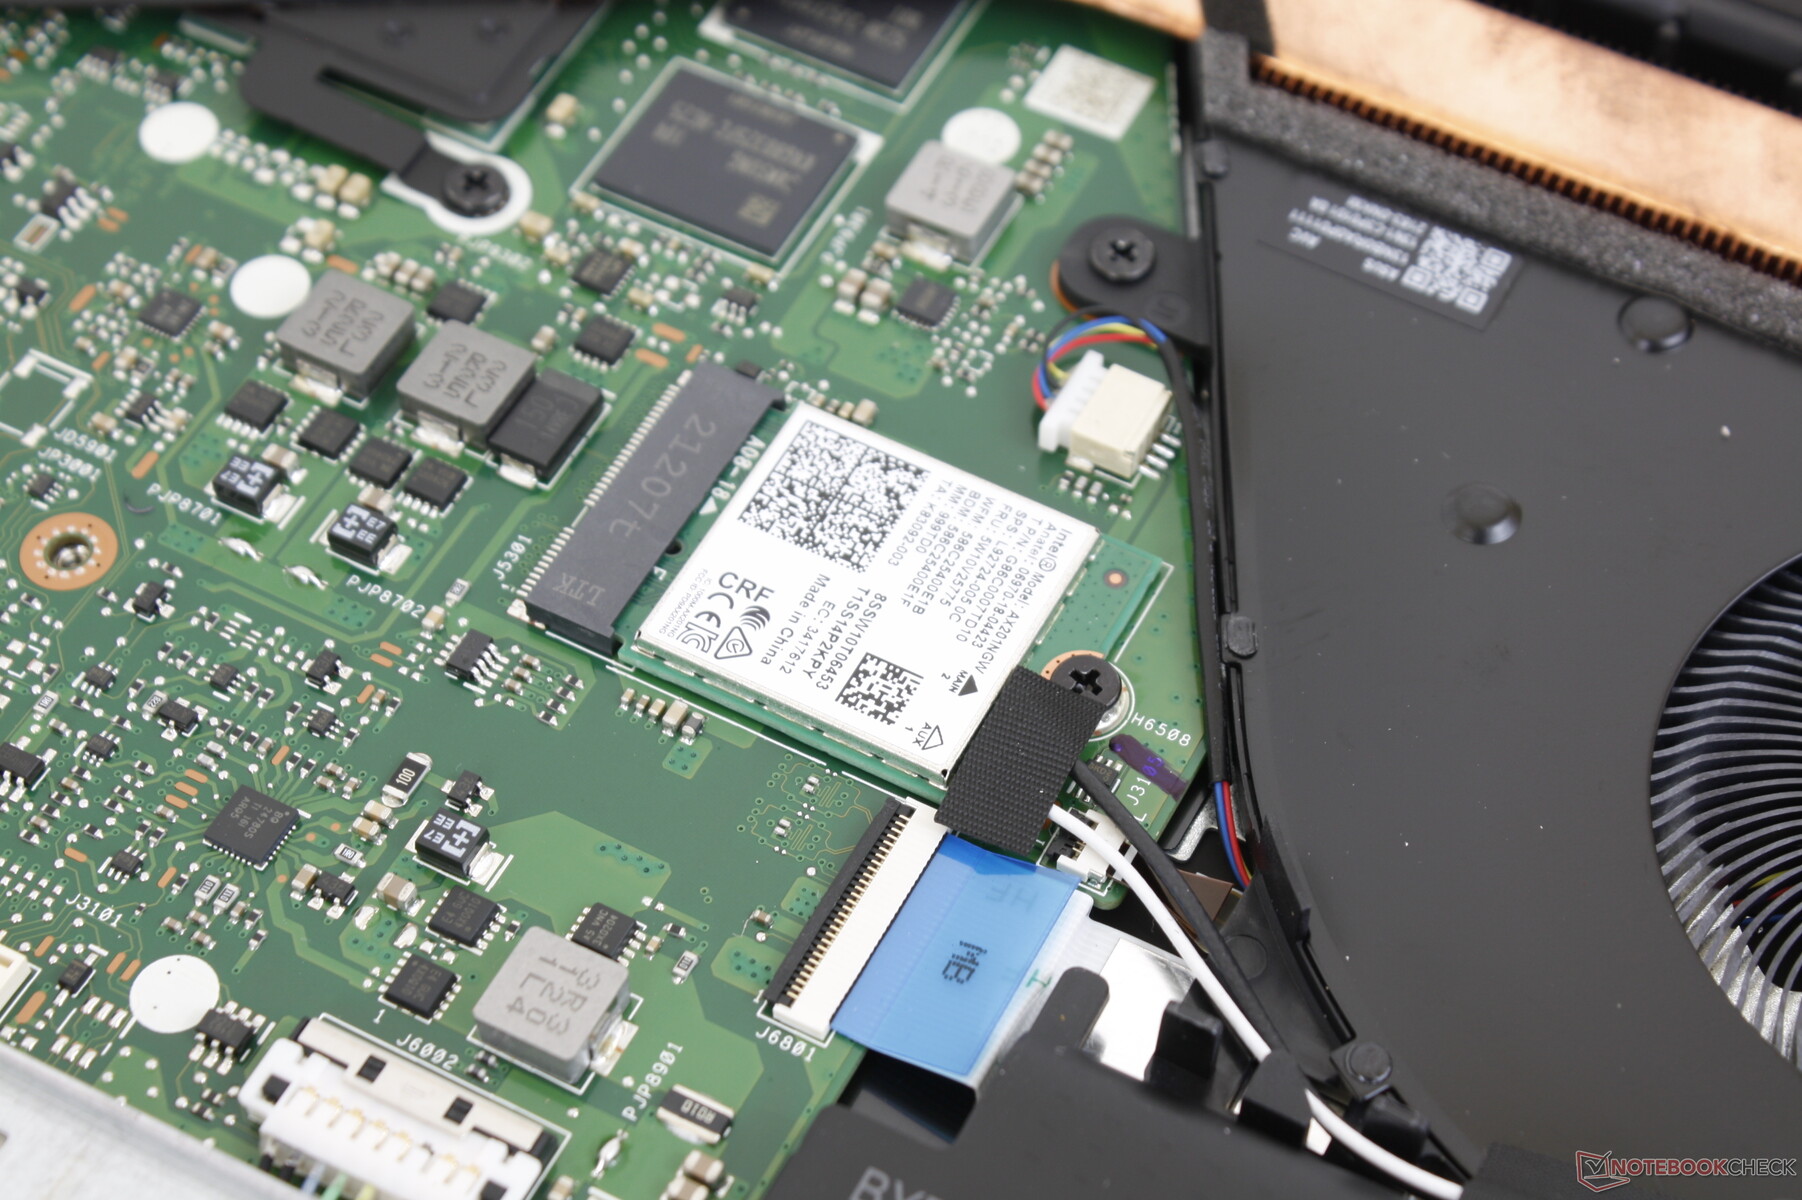
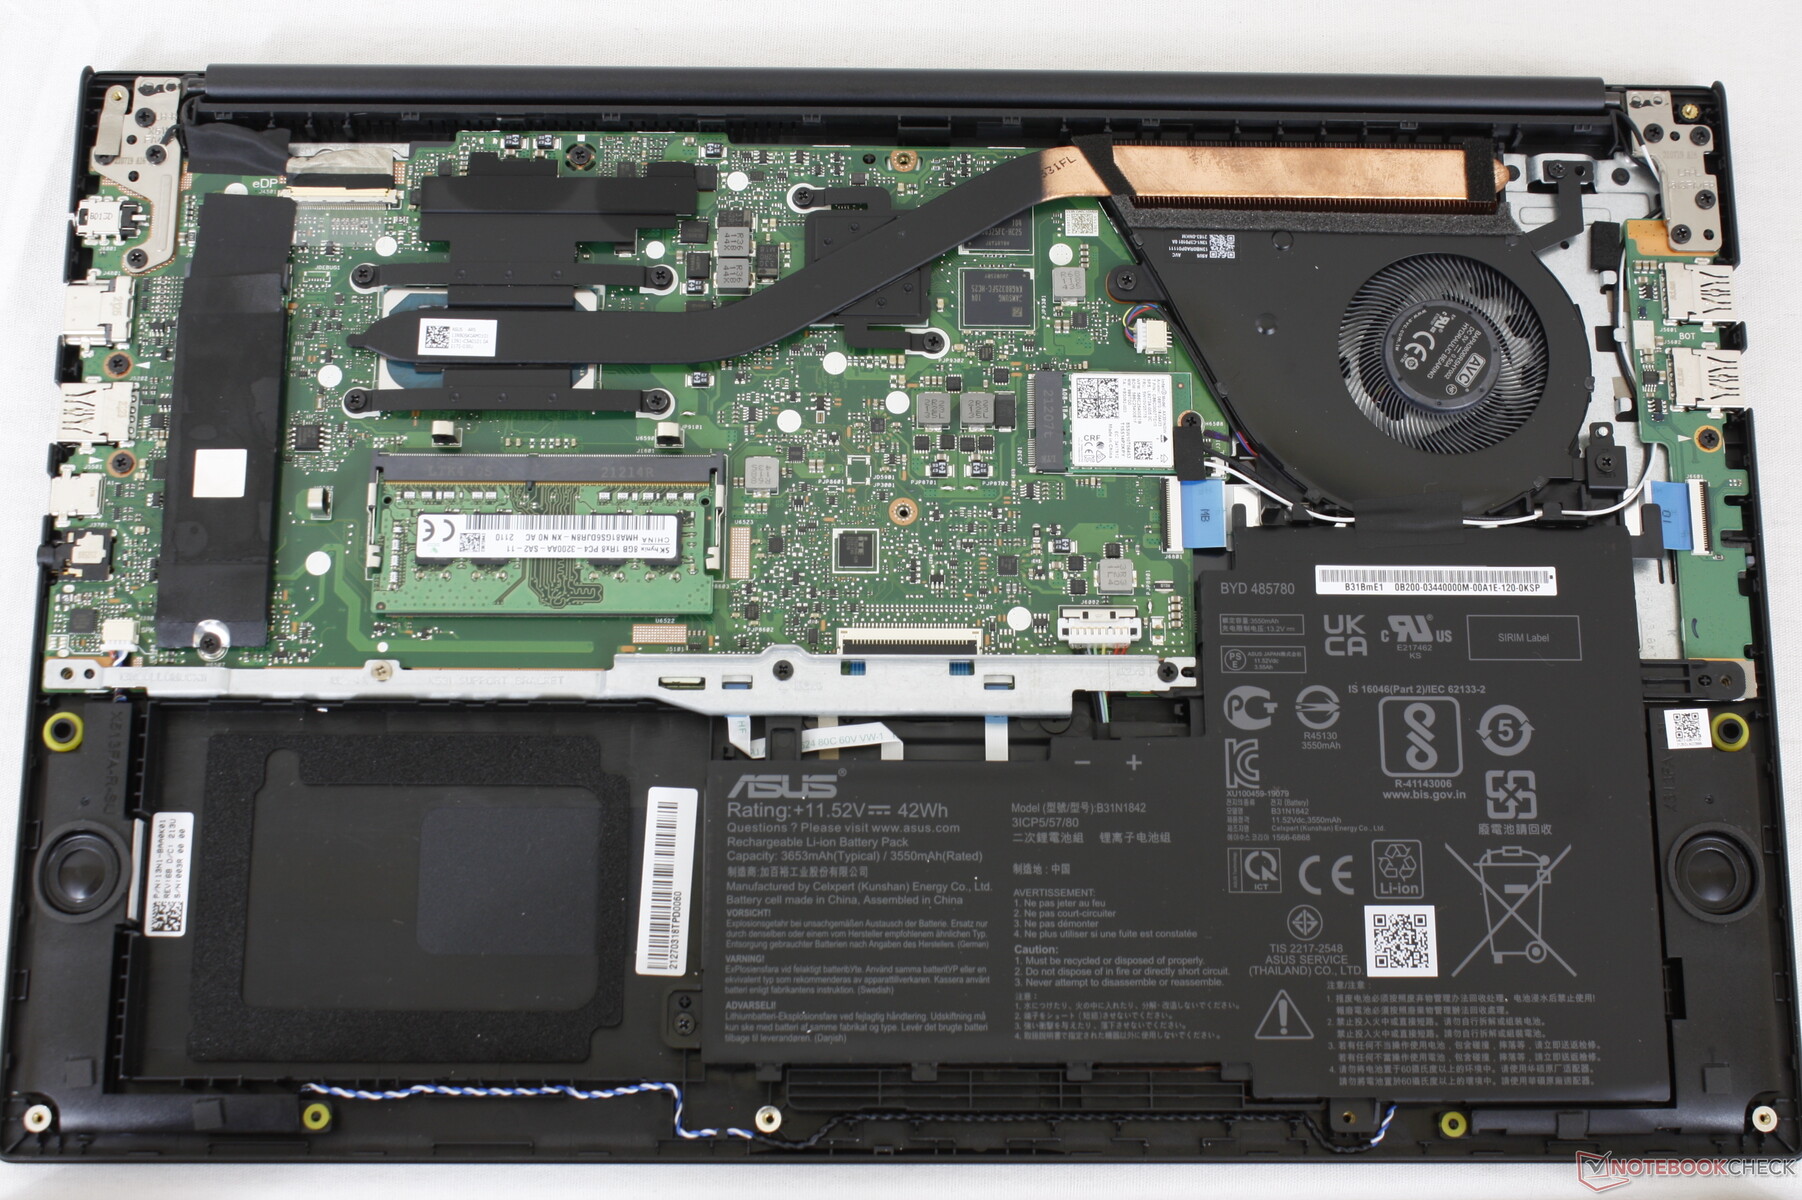
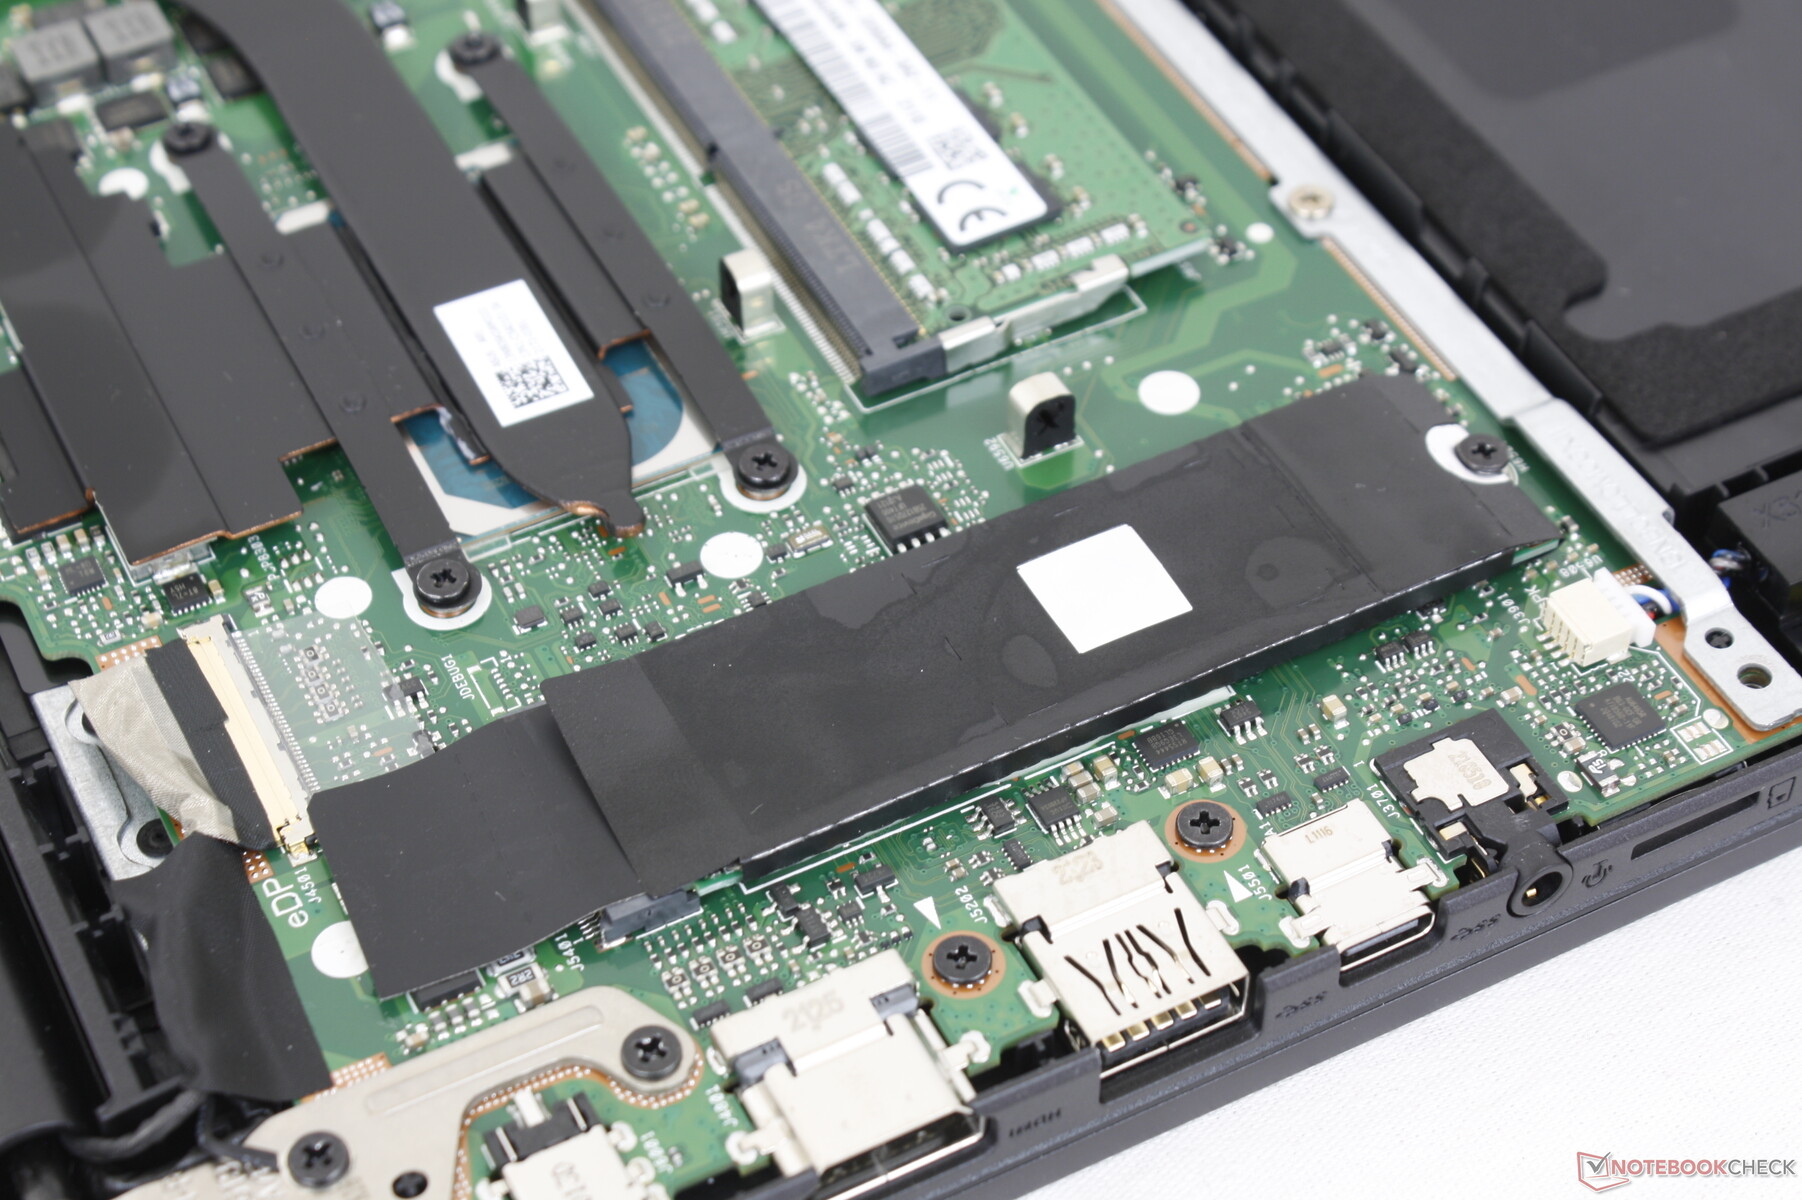
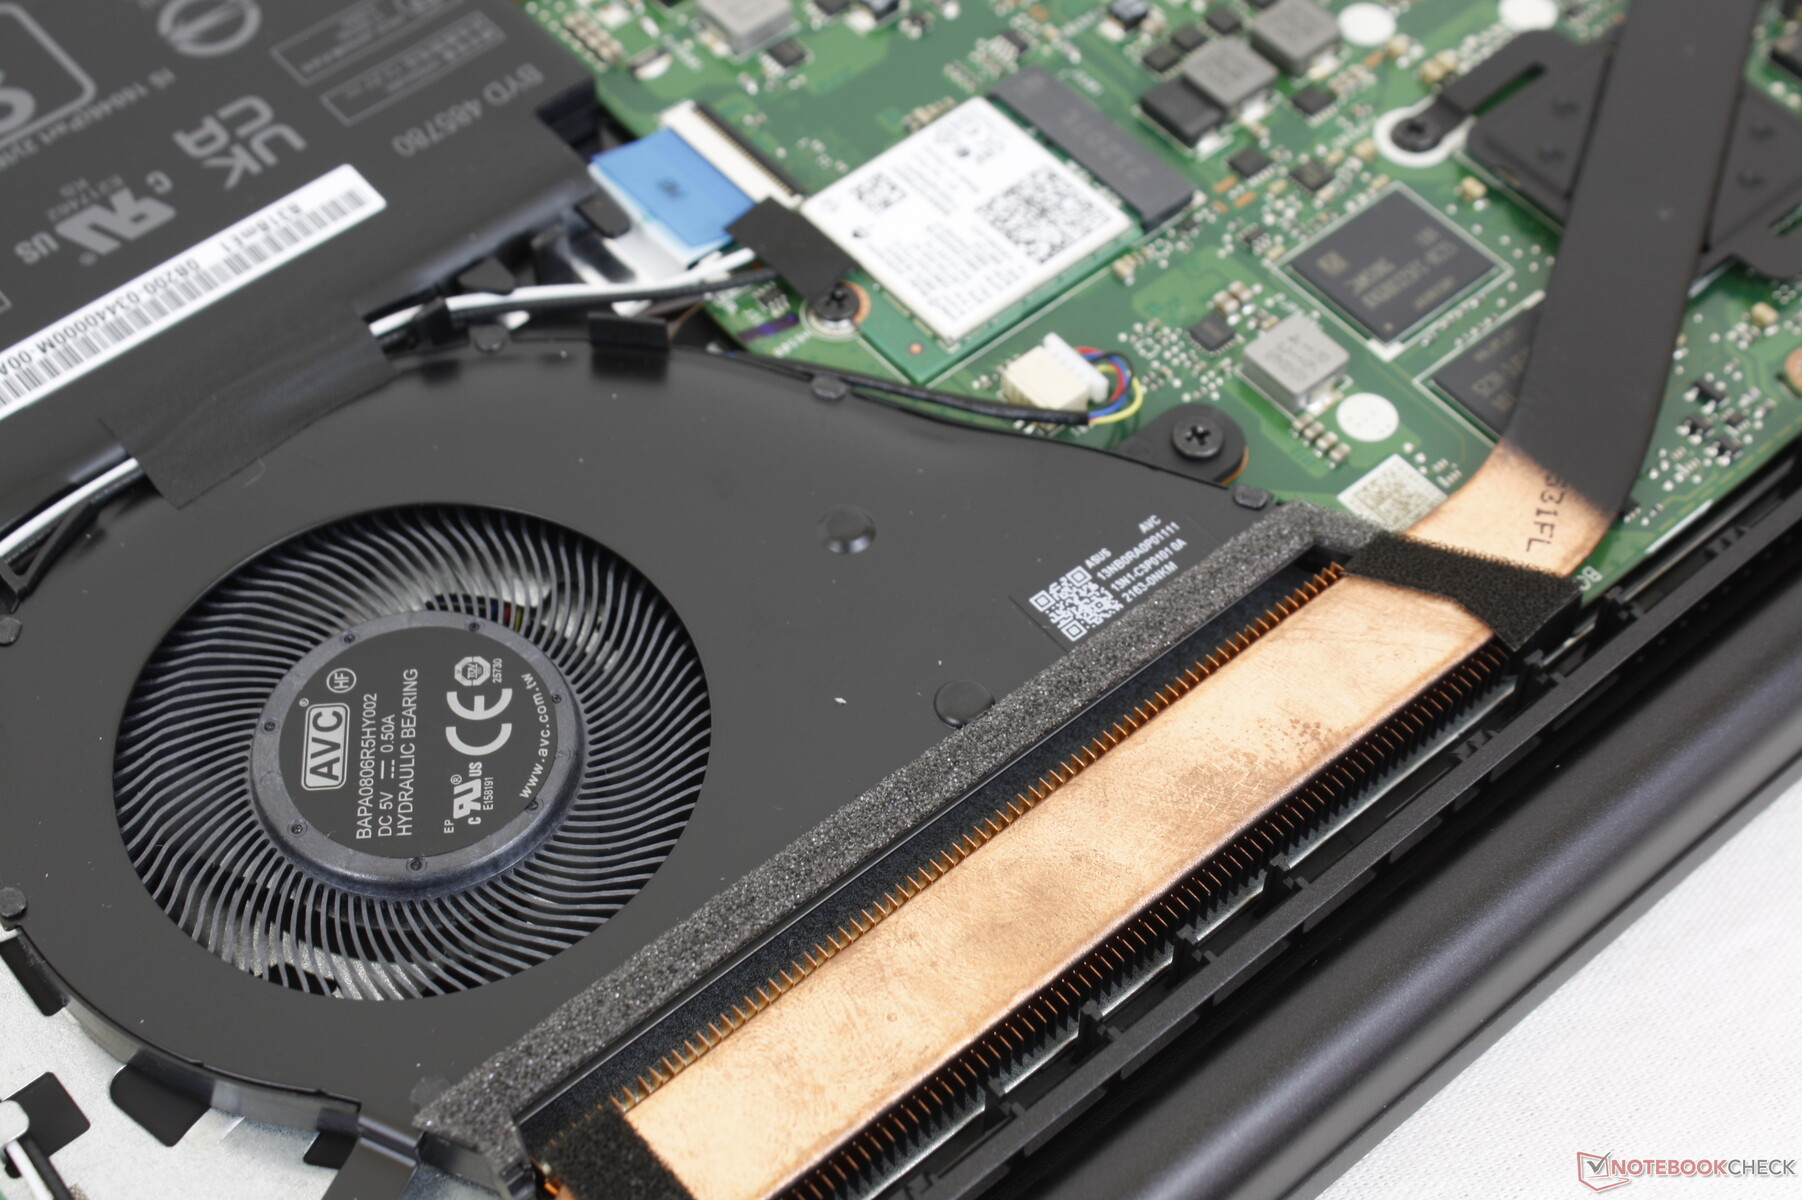
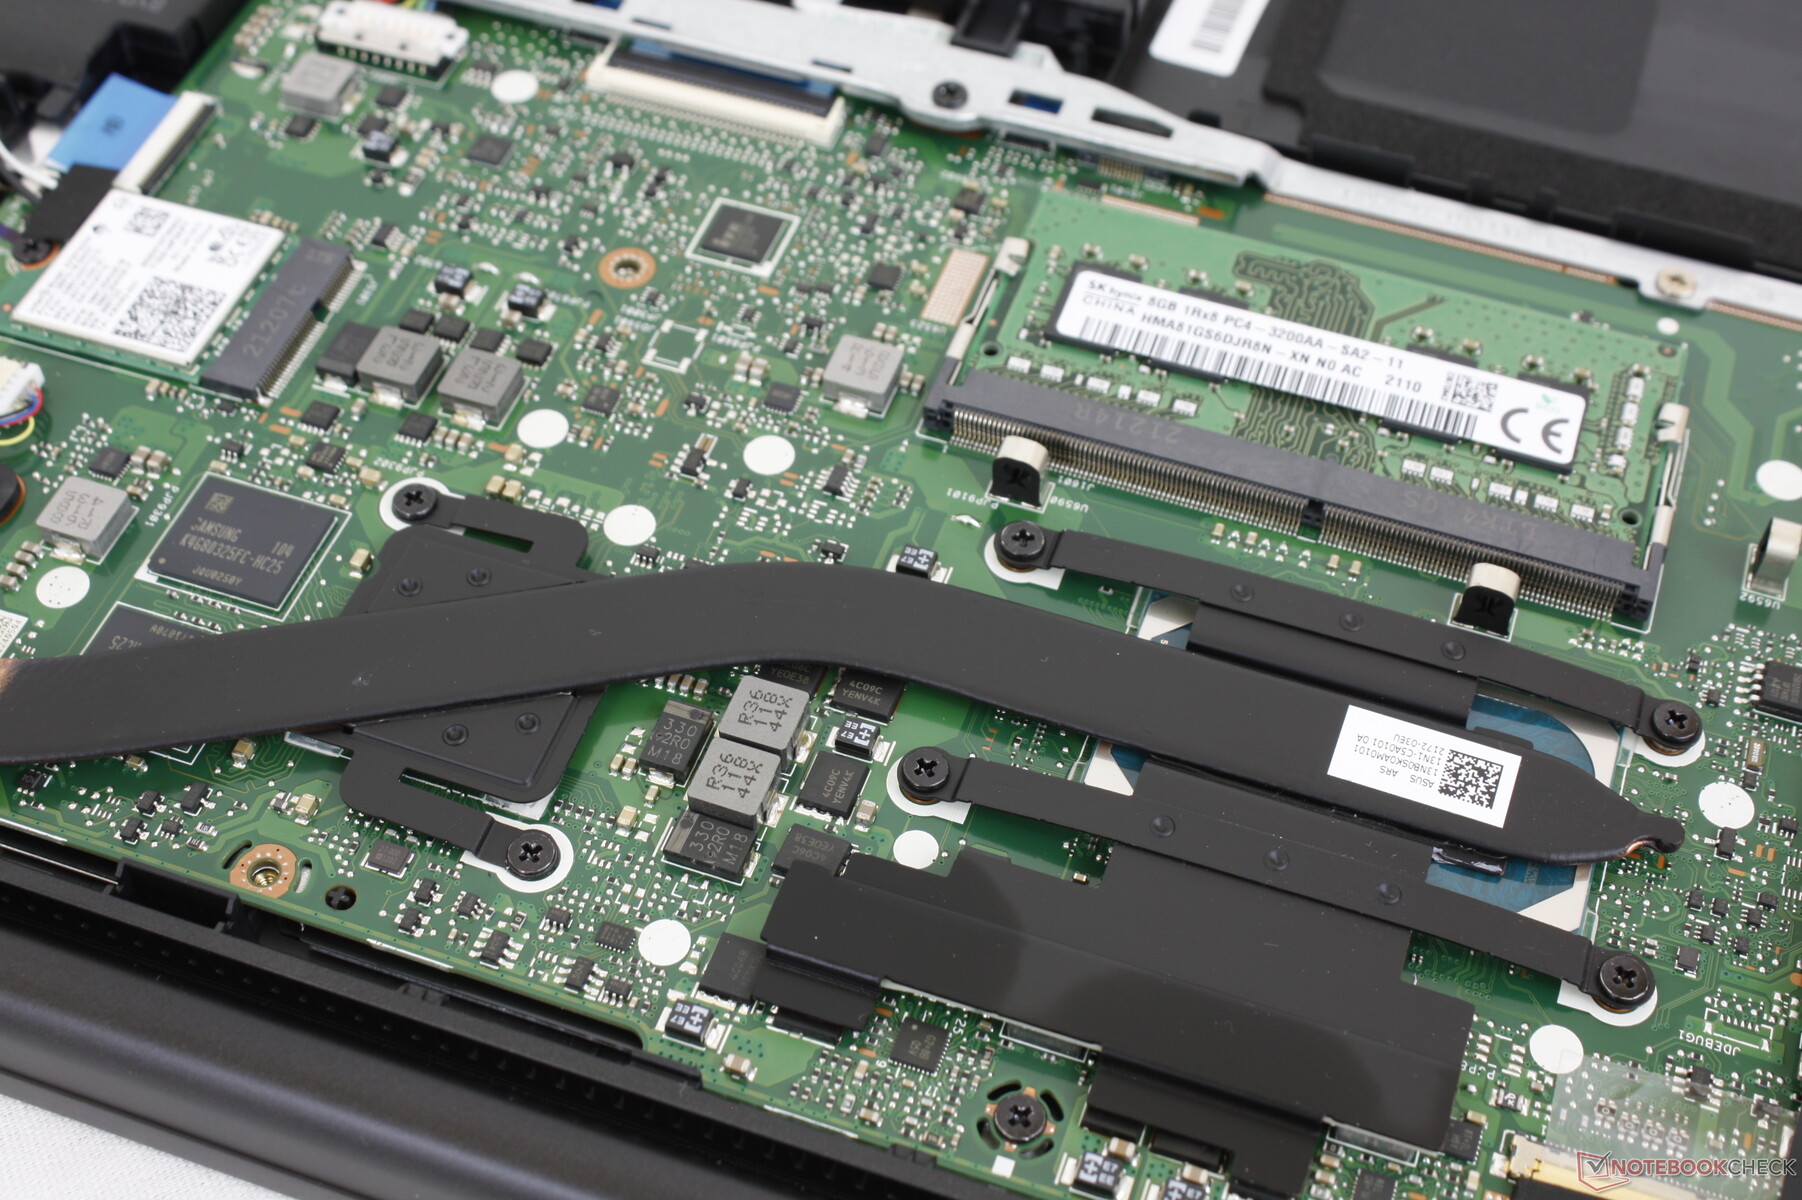
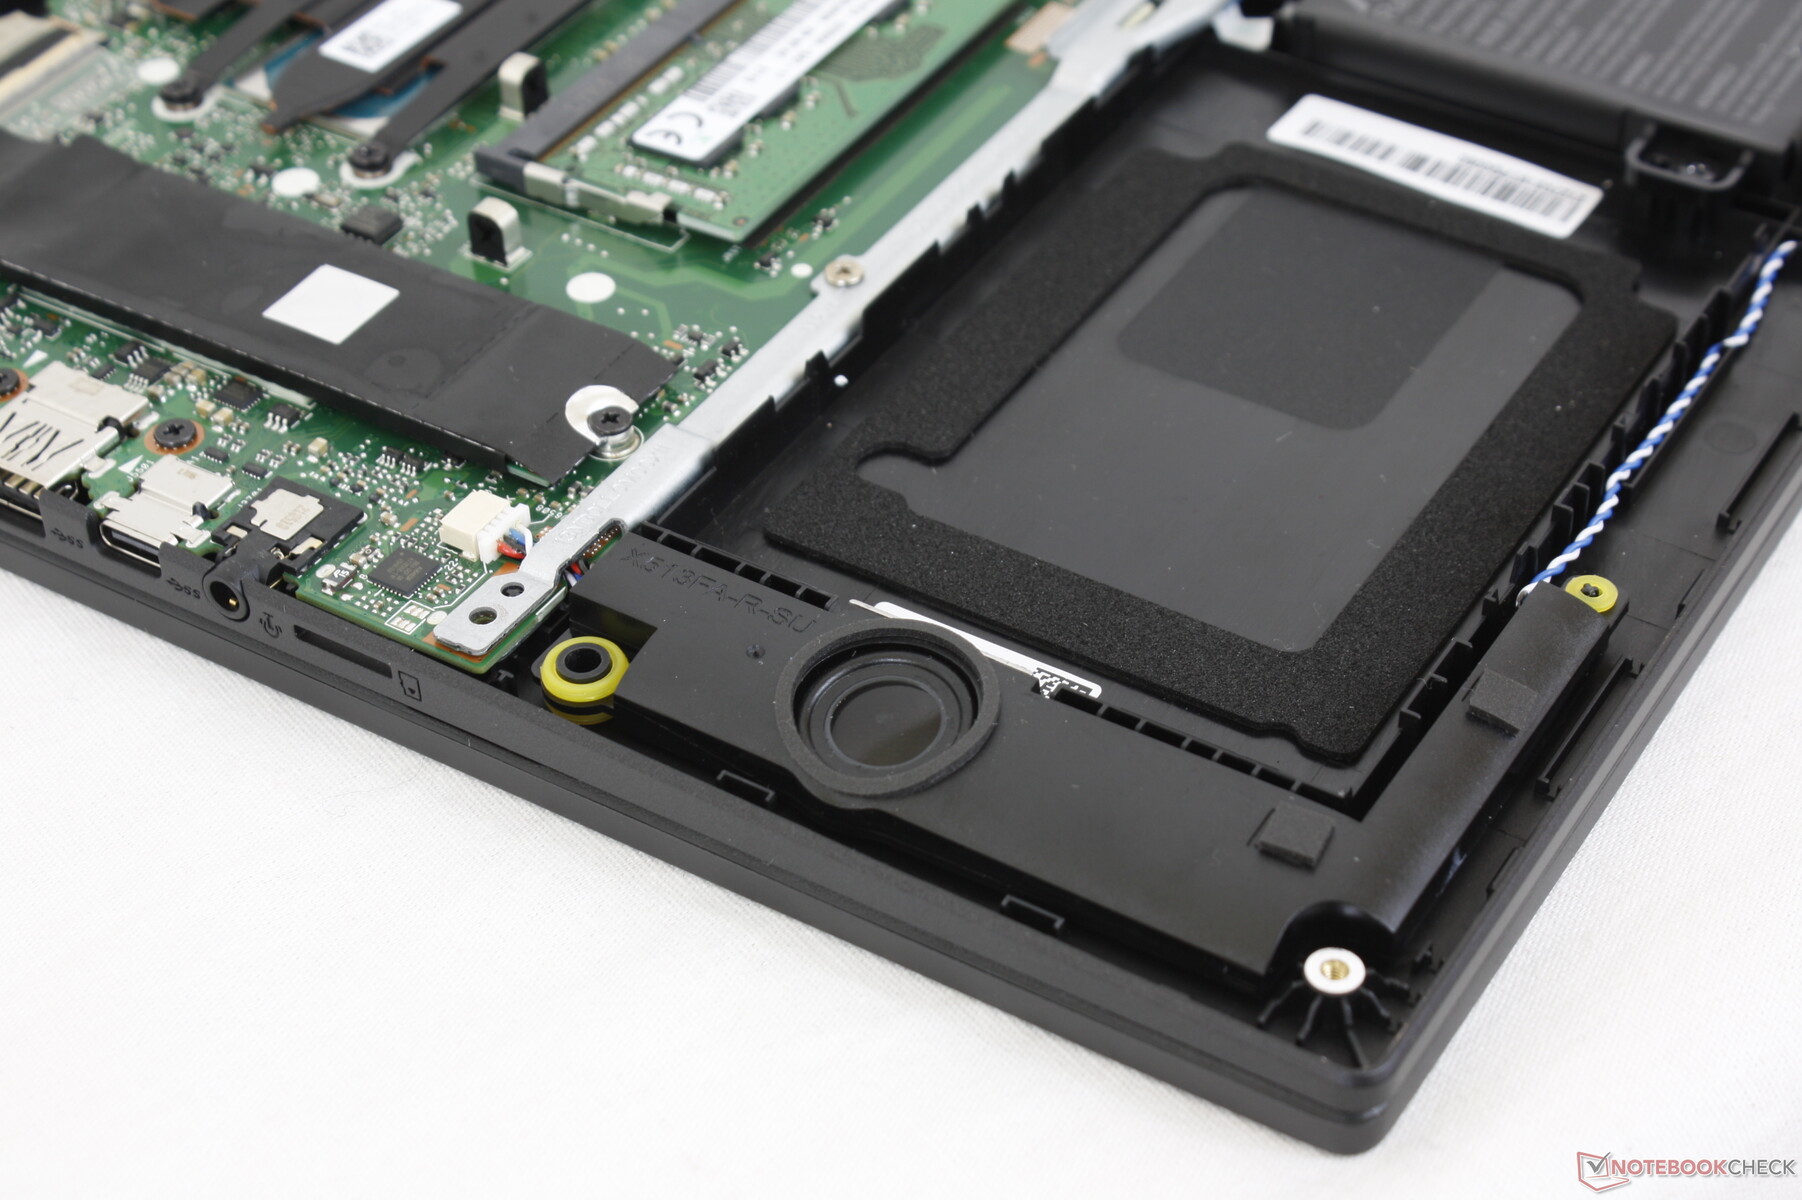
Manutenzione - Facile da aprire
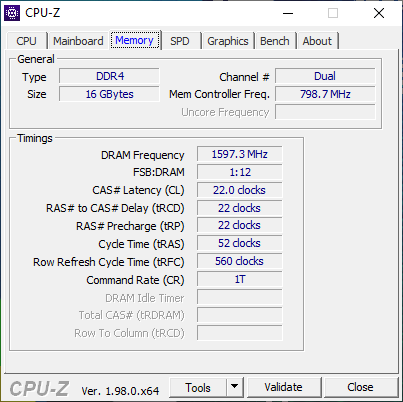
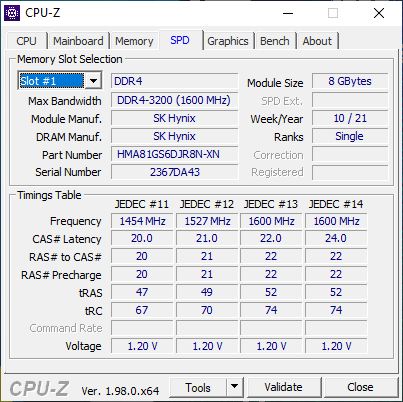
Il pannello inferiore può essere facilmente rimosso con un cacciavite Philips e un bordo tagliente per svelare il singolo slot SODIMM, il modulo WLAN e lo slot M.2 2280 PCIe3 x4. Una base di 8 GB di RAM a canale singolo è saldata e può essere accoppiata con un modulo rimovibile da 8 GB per un totale di 16 GB.
Accessori e garanzia
La scatola di vendita al dettaglio non include altri extra oltre alla documentazione e all'adattatore AC. Si applica la garanzia limitata standard di un anno del produttore
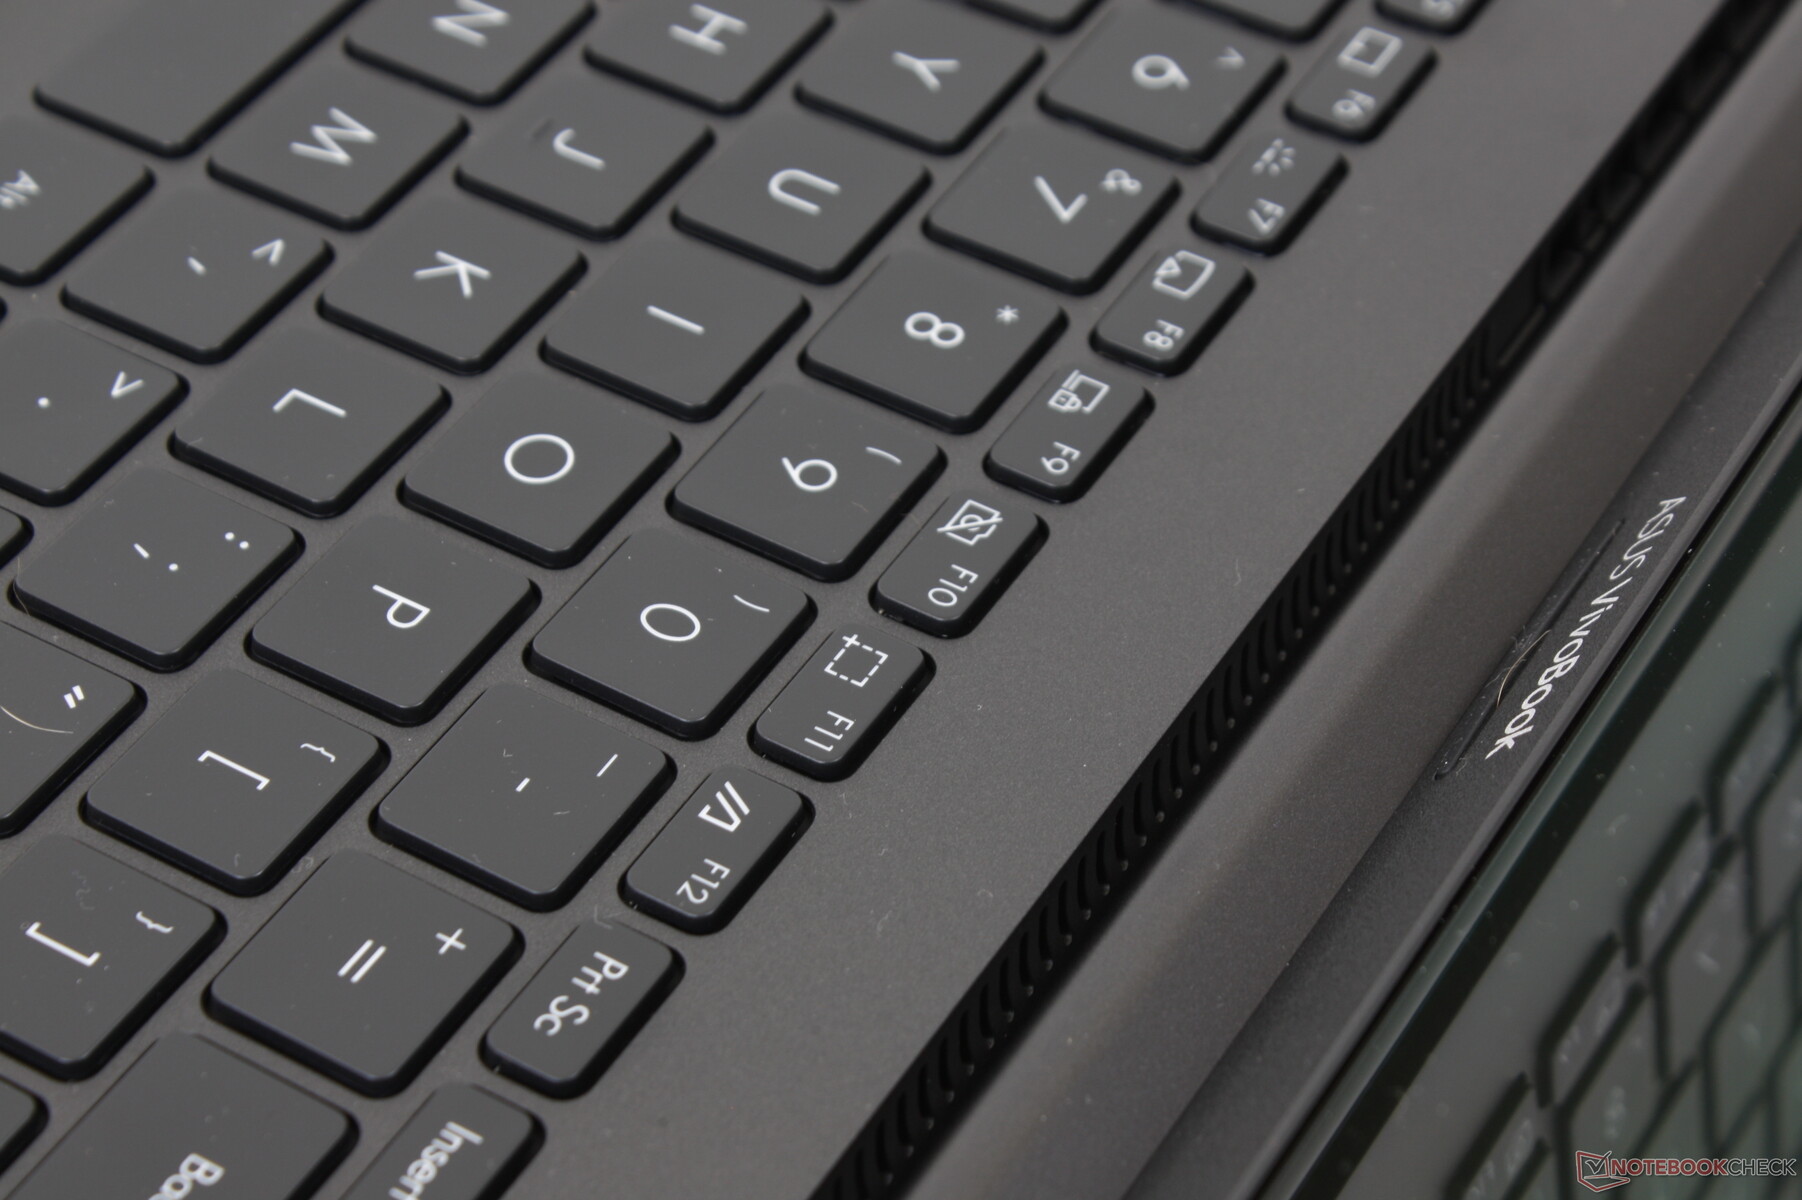
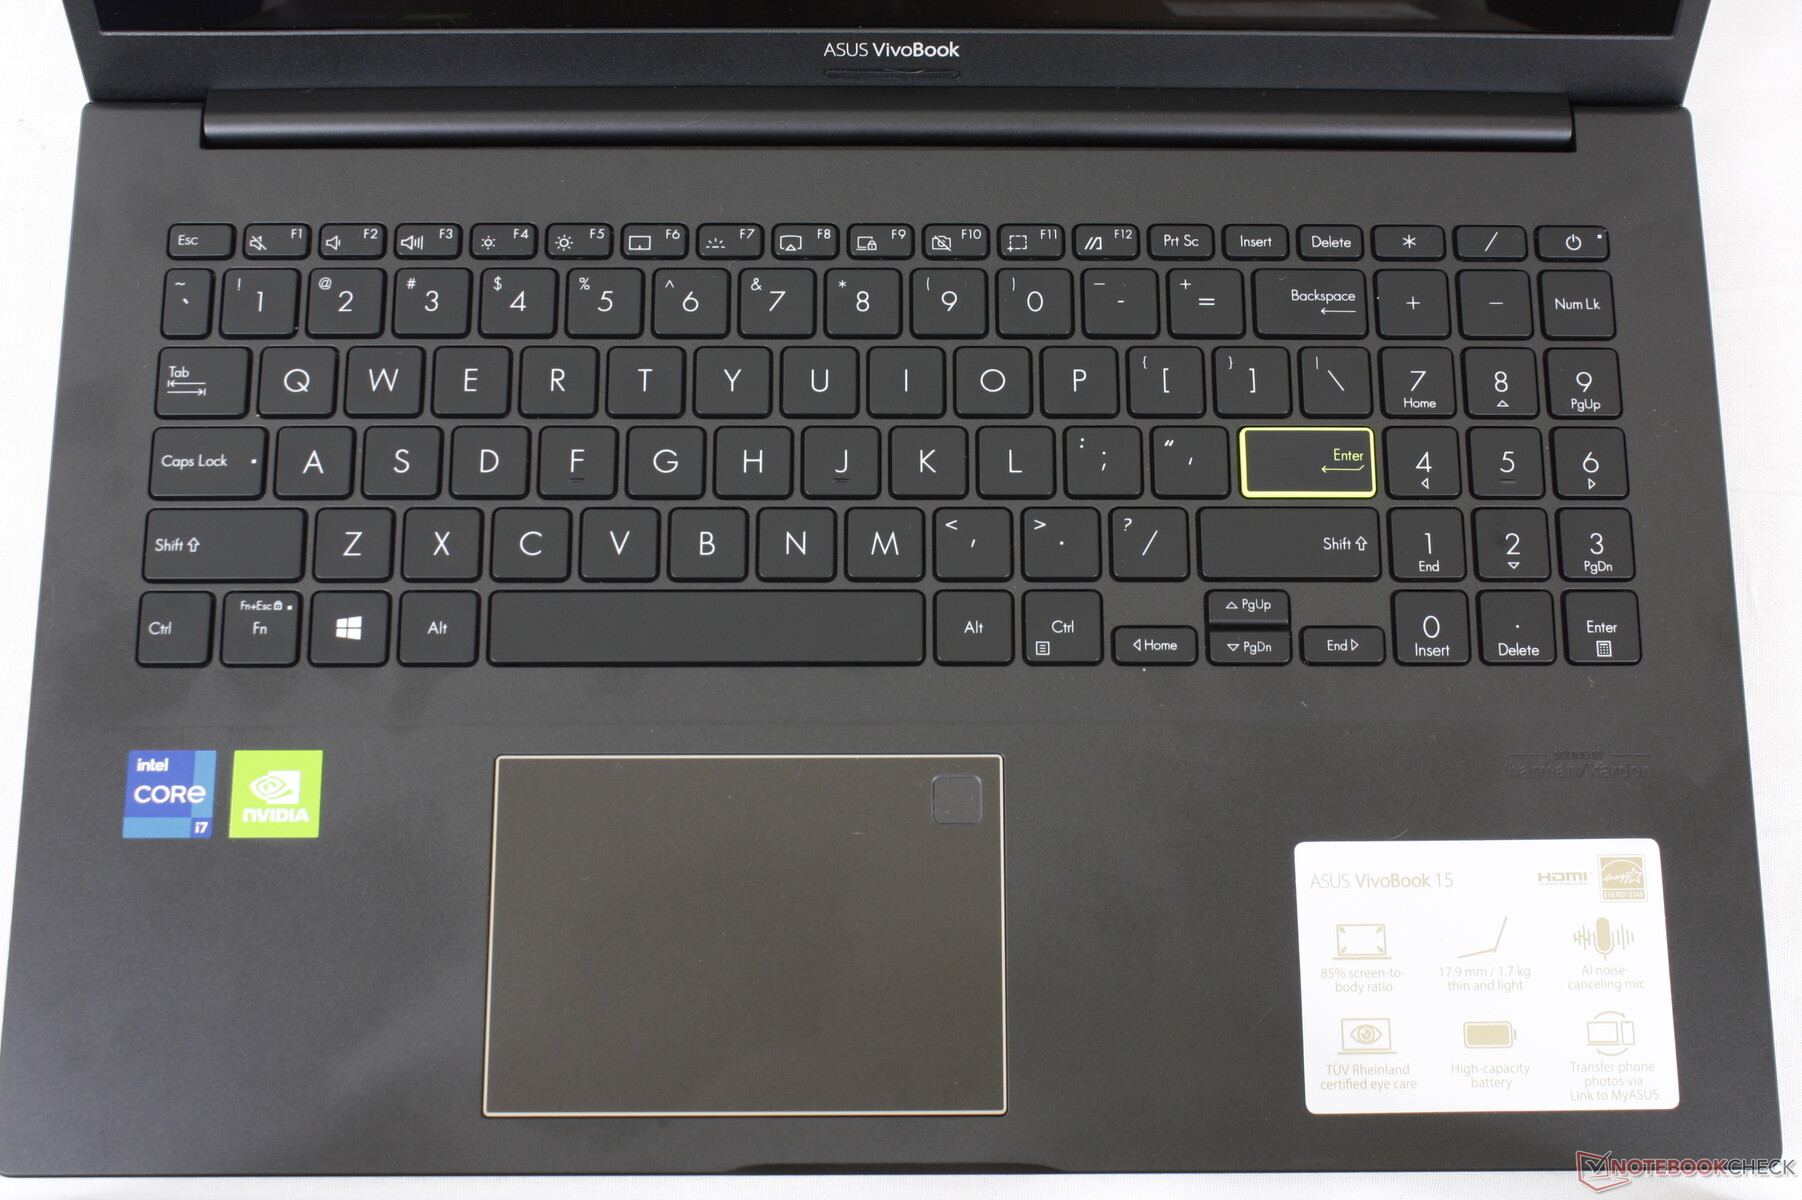
Dispositivi di input - Clickpad spugnoso
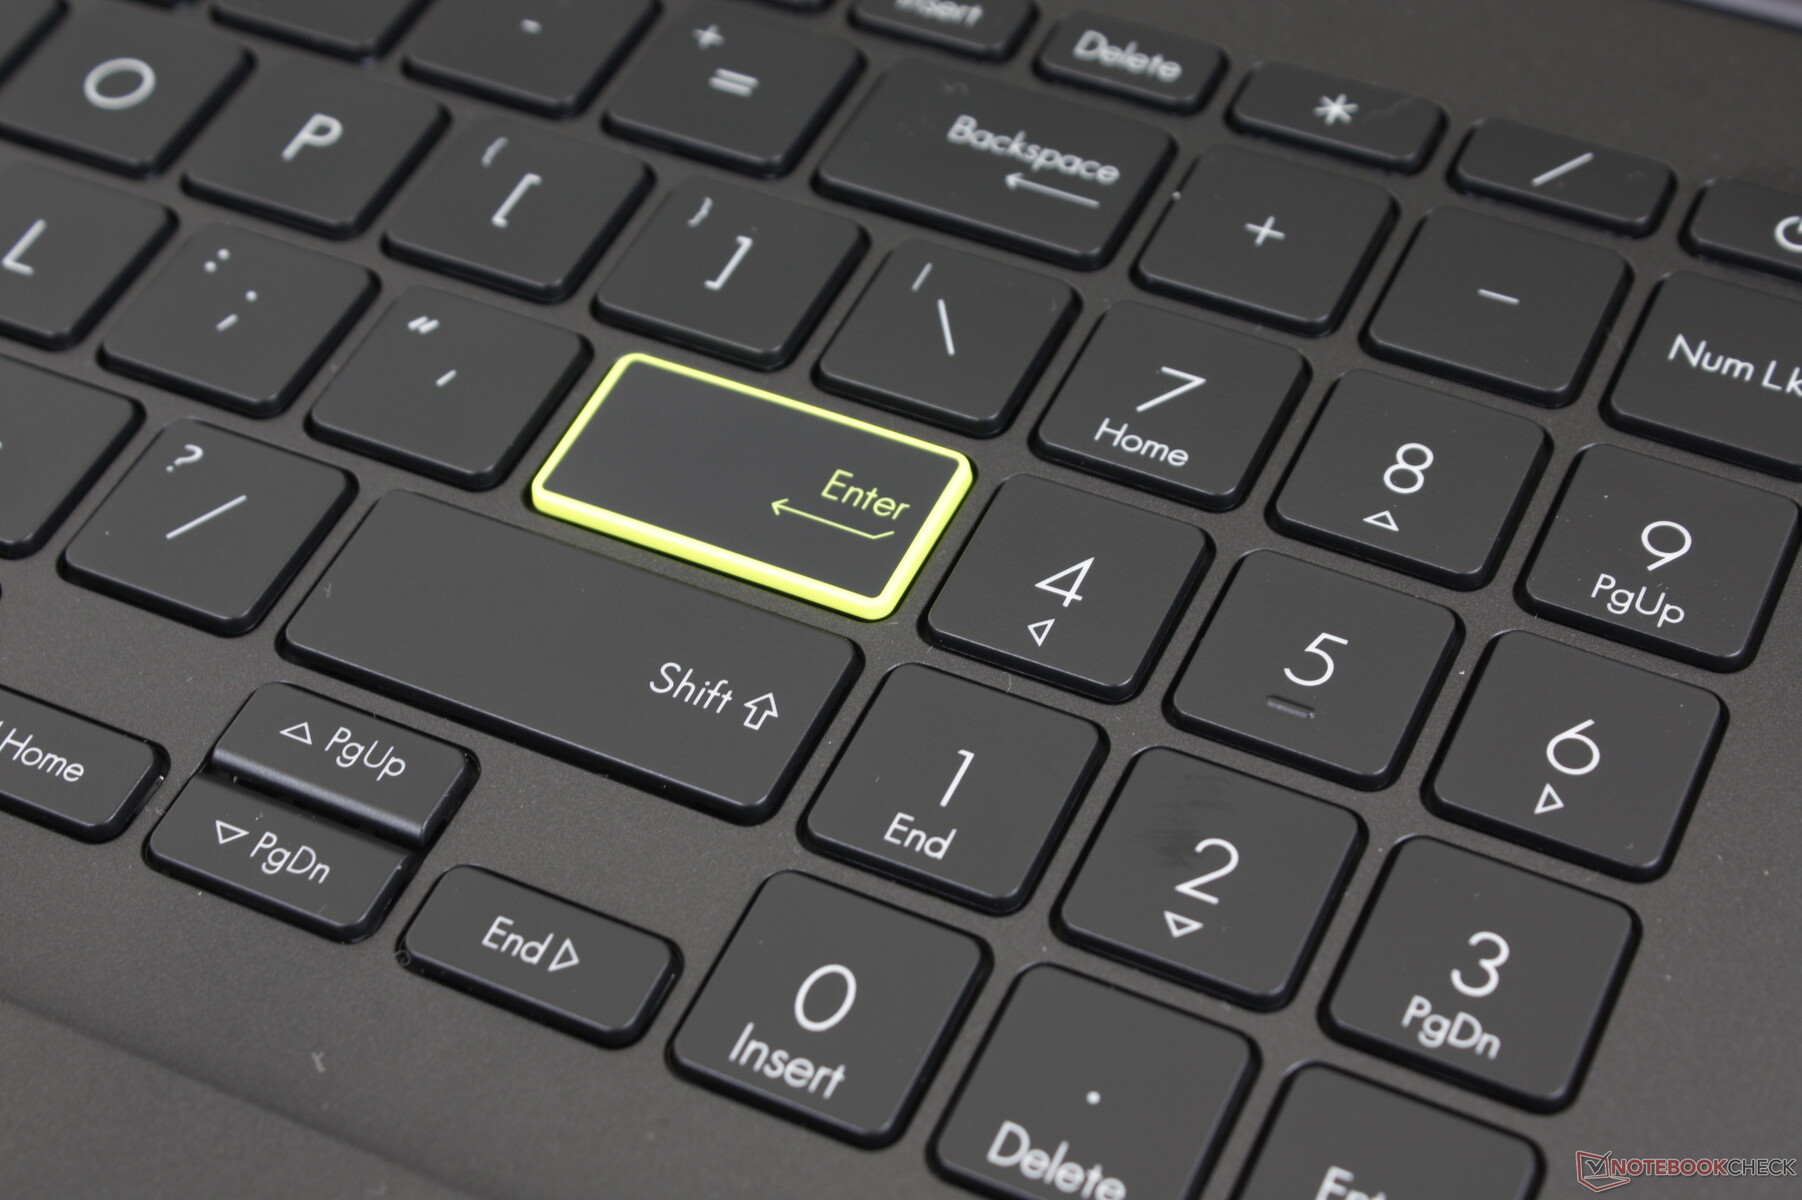
Tastiera
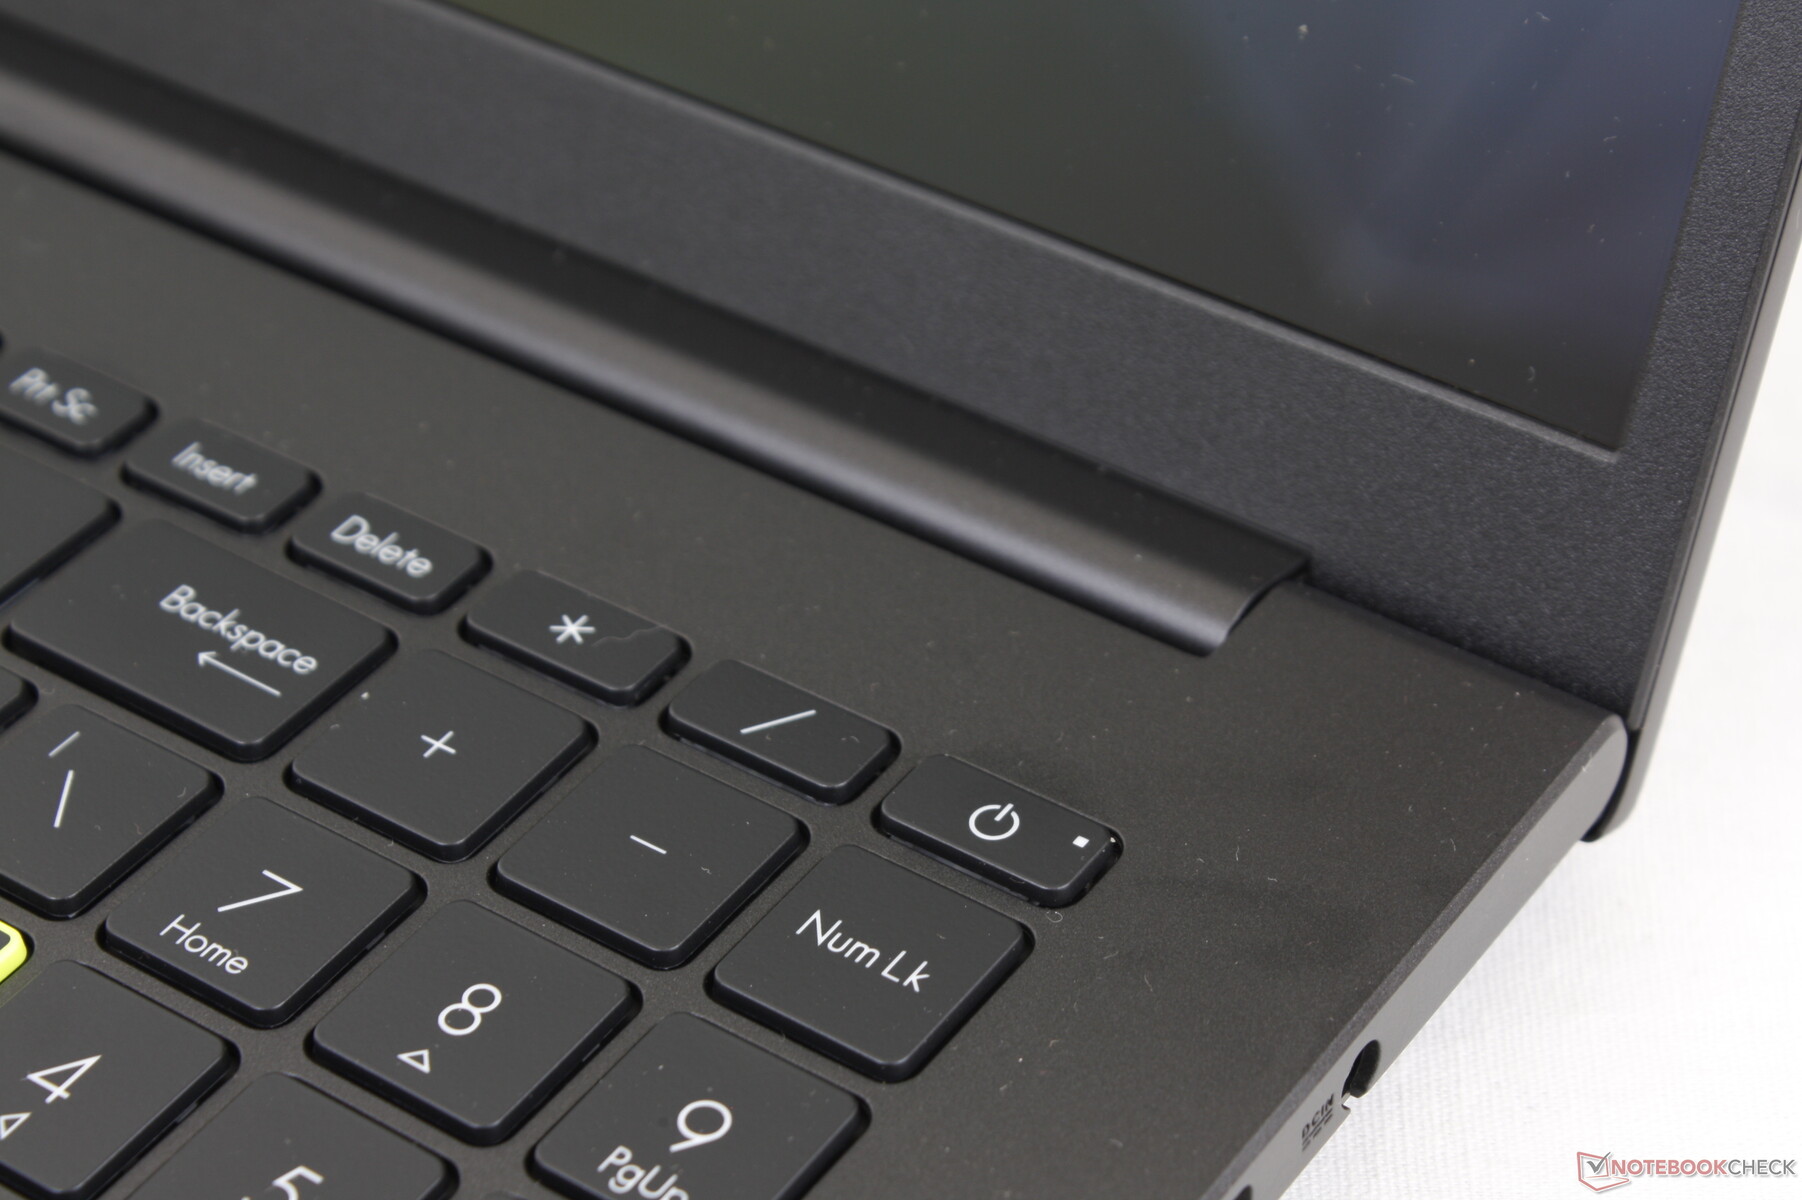
Se avete già digitato su un portatile VivoBook, allora saprete esattamente cosa aspettarvi dal VivoBook 15 K513, dato che c'è pochissima variazione tra i modelli in termini di feedback della tastiera. Sia la corsa che la tattilità rimangono poco profonde e morbide, rispettivamente, rispetto ai tasti più solidi del business-centrico Lenovo ThinkPad o HP EliteBook. I tasti del Lenovo IdeaPad 5 15si sentono simili a quelli che abbiamo qui sull'Asus, ma il rumore dei tasti è moderatamente più forte sull'Asus.
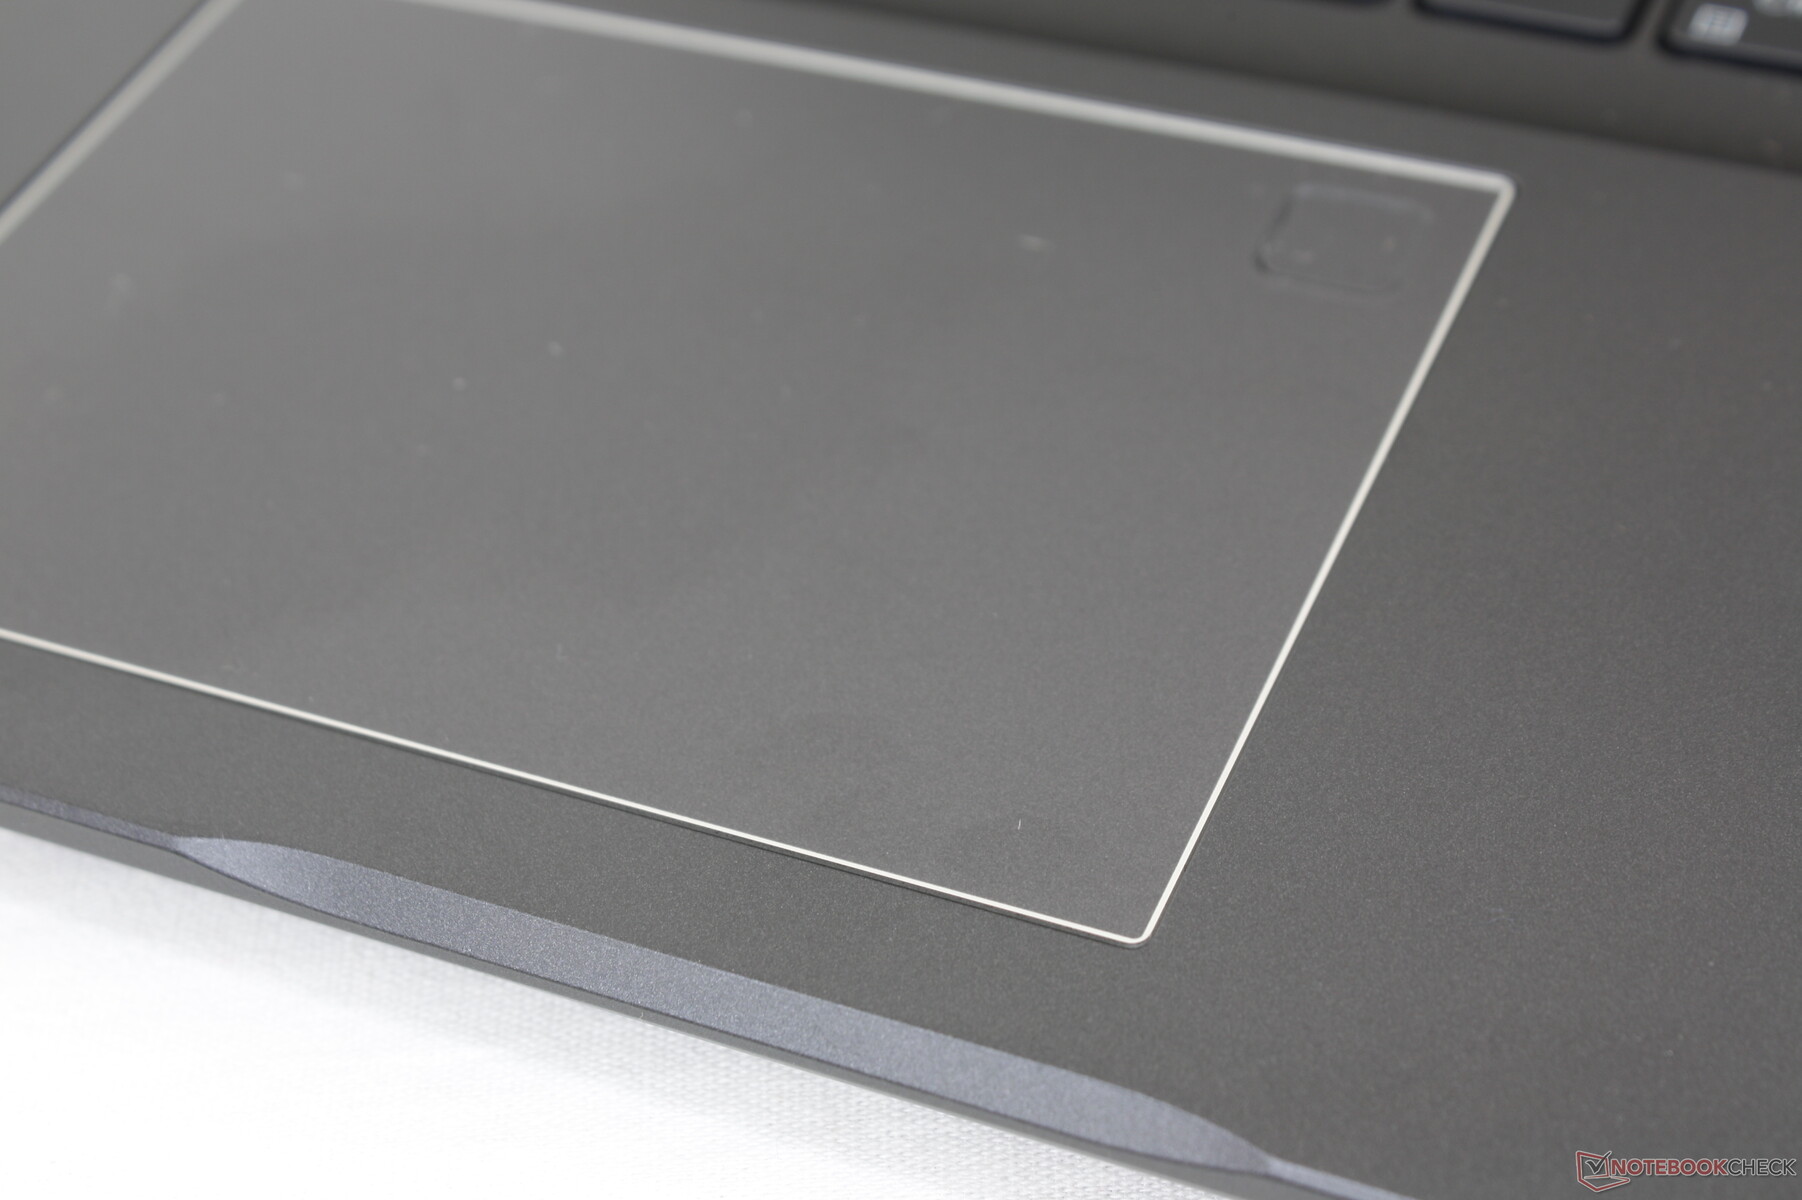
Touchpad
Il clickpad (~10.5 x 7.3 cm) è povero e sotto la media anche per gli standard economici. Mentre il movimento regolare del cursore è fluido e senza salti improvvisi, i suoi tasti del mouse integrati sono troppo spugnosi e poco profondi. Il risultato è un click insoddisfacente, specialmente se si clicca e si trascina o si eseguono altre azioni multi-touch.

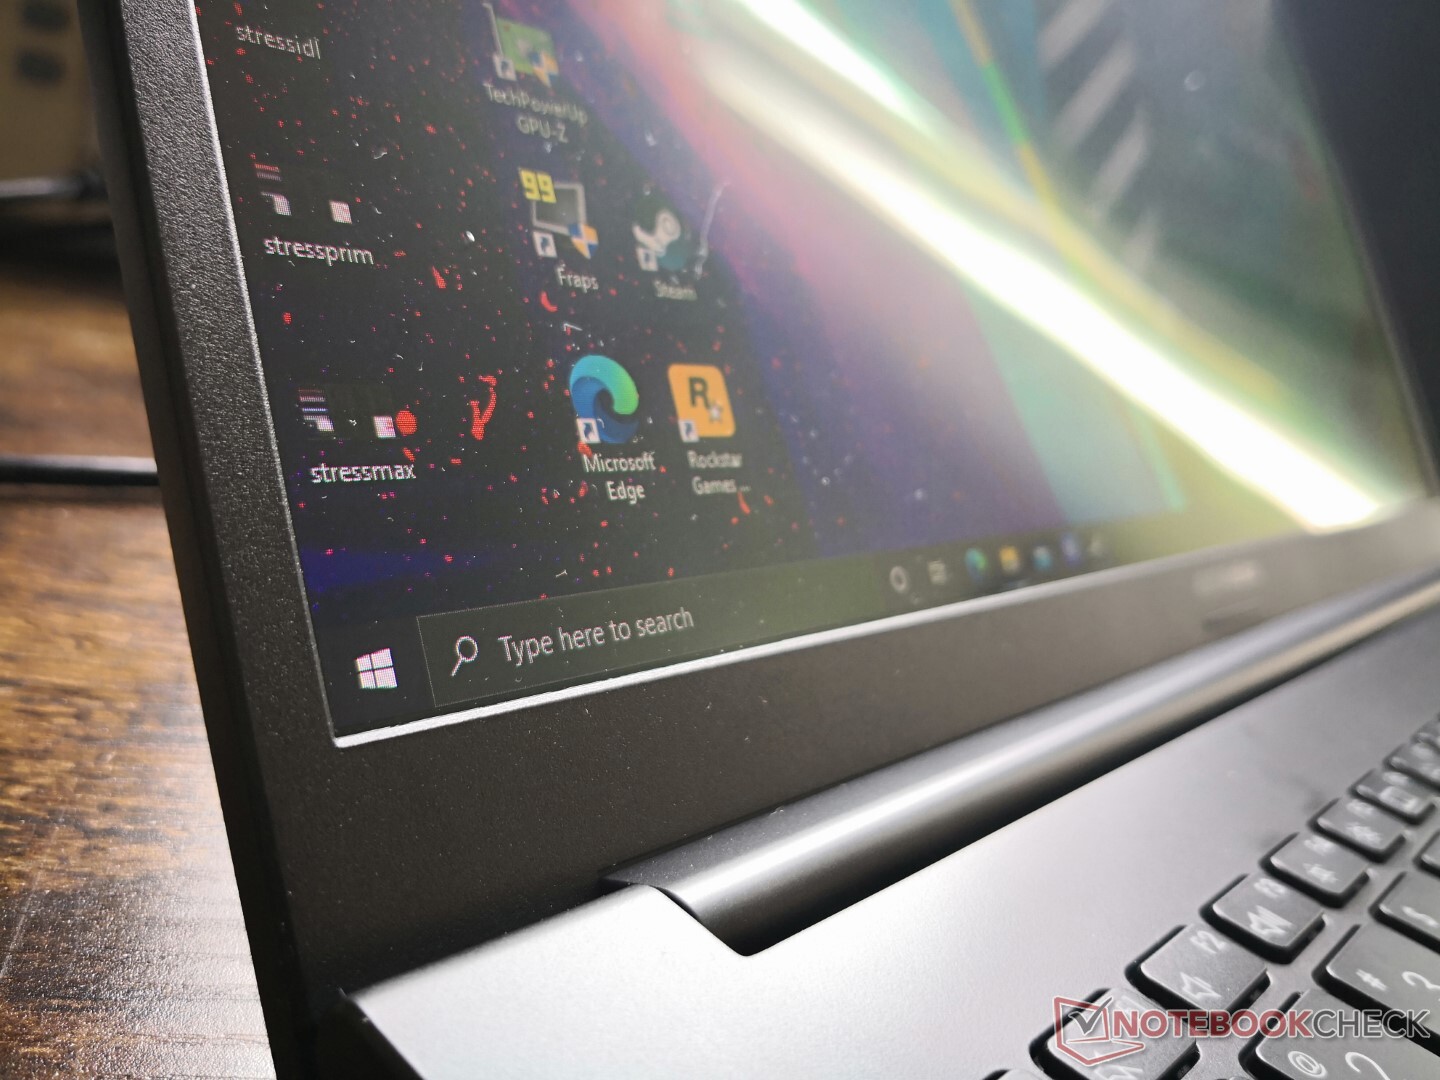
Display - Per lo più migliore dell'IPS
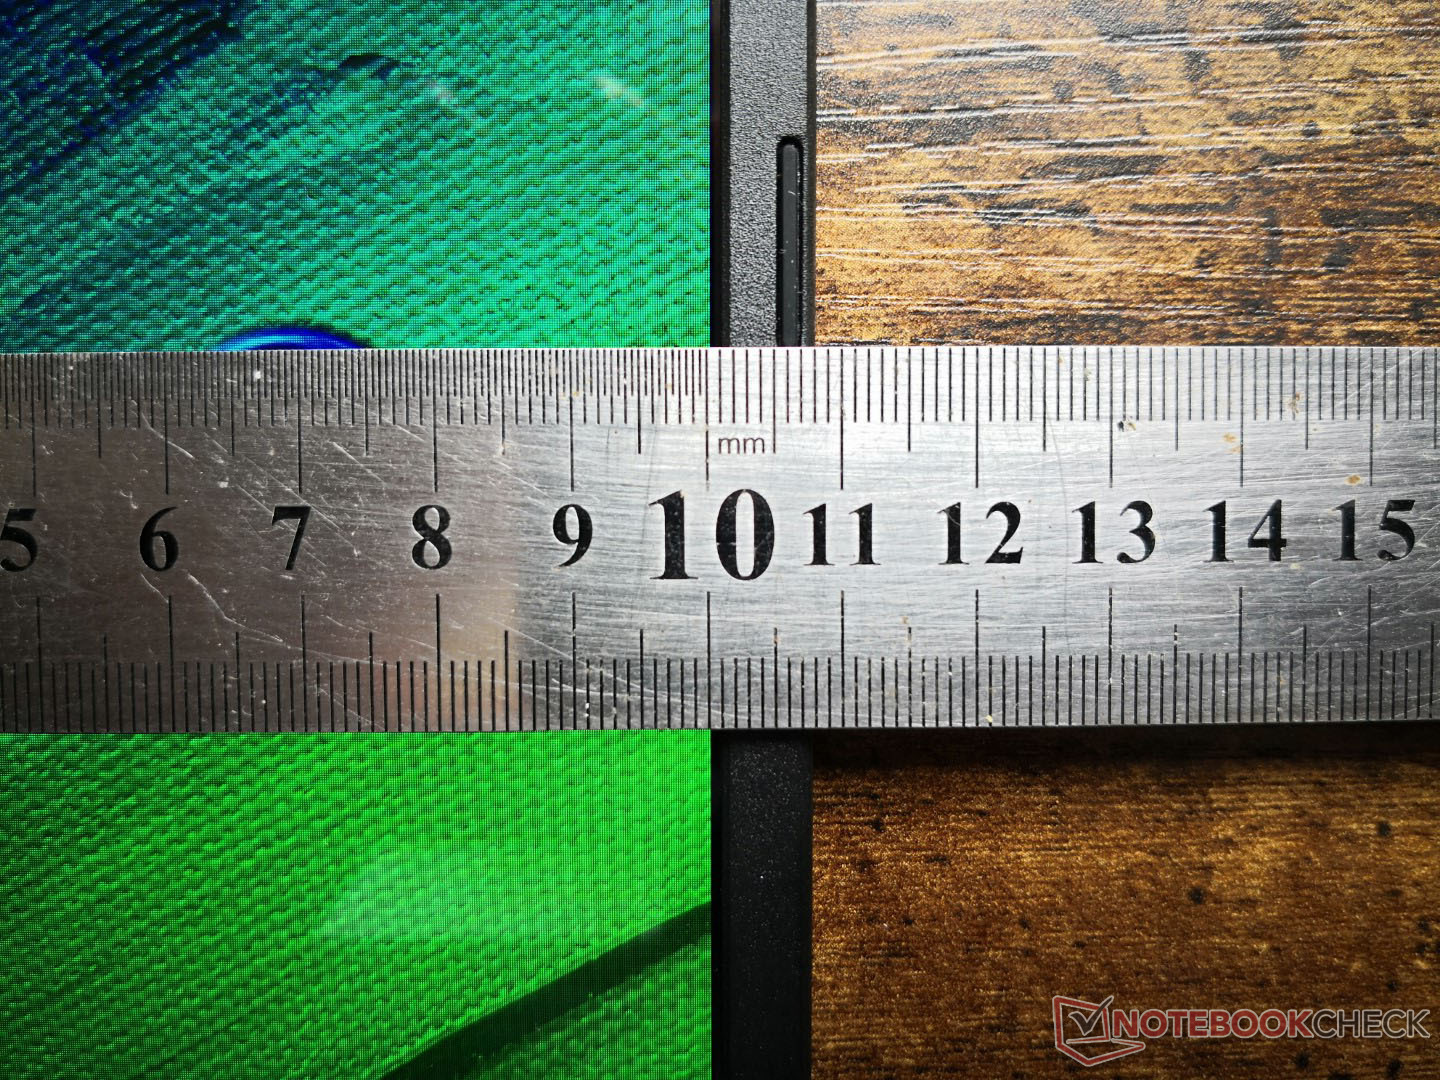
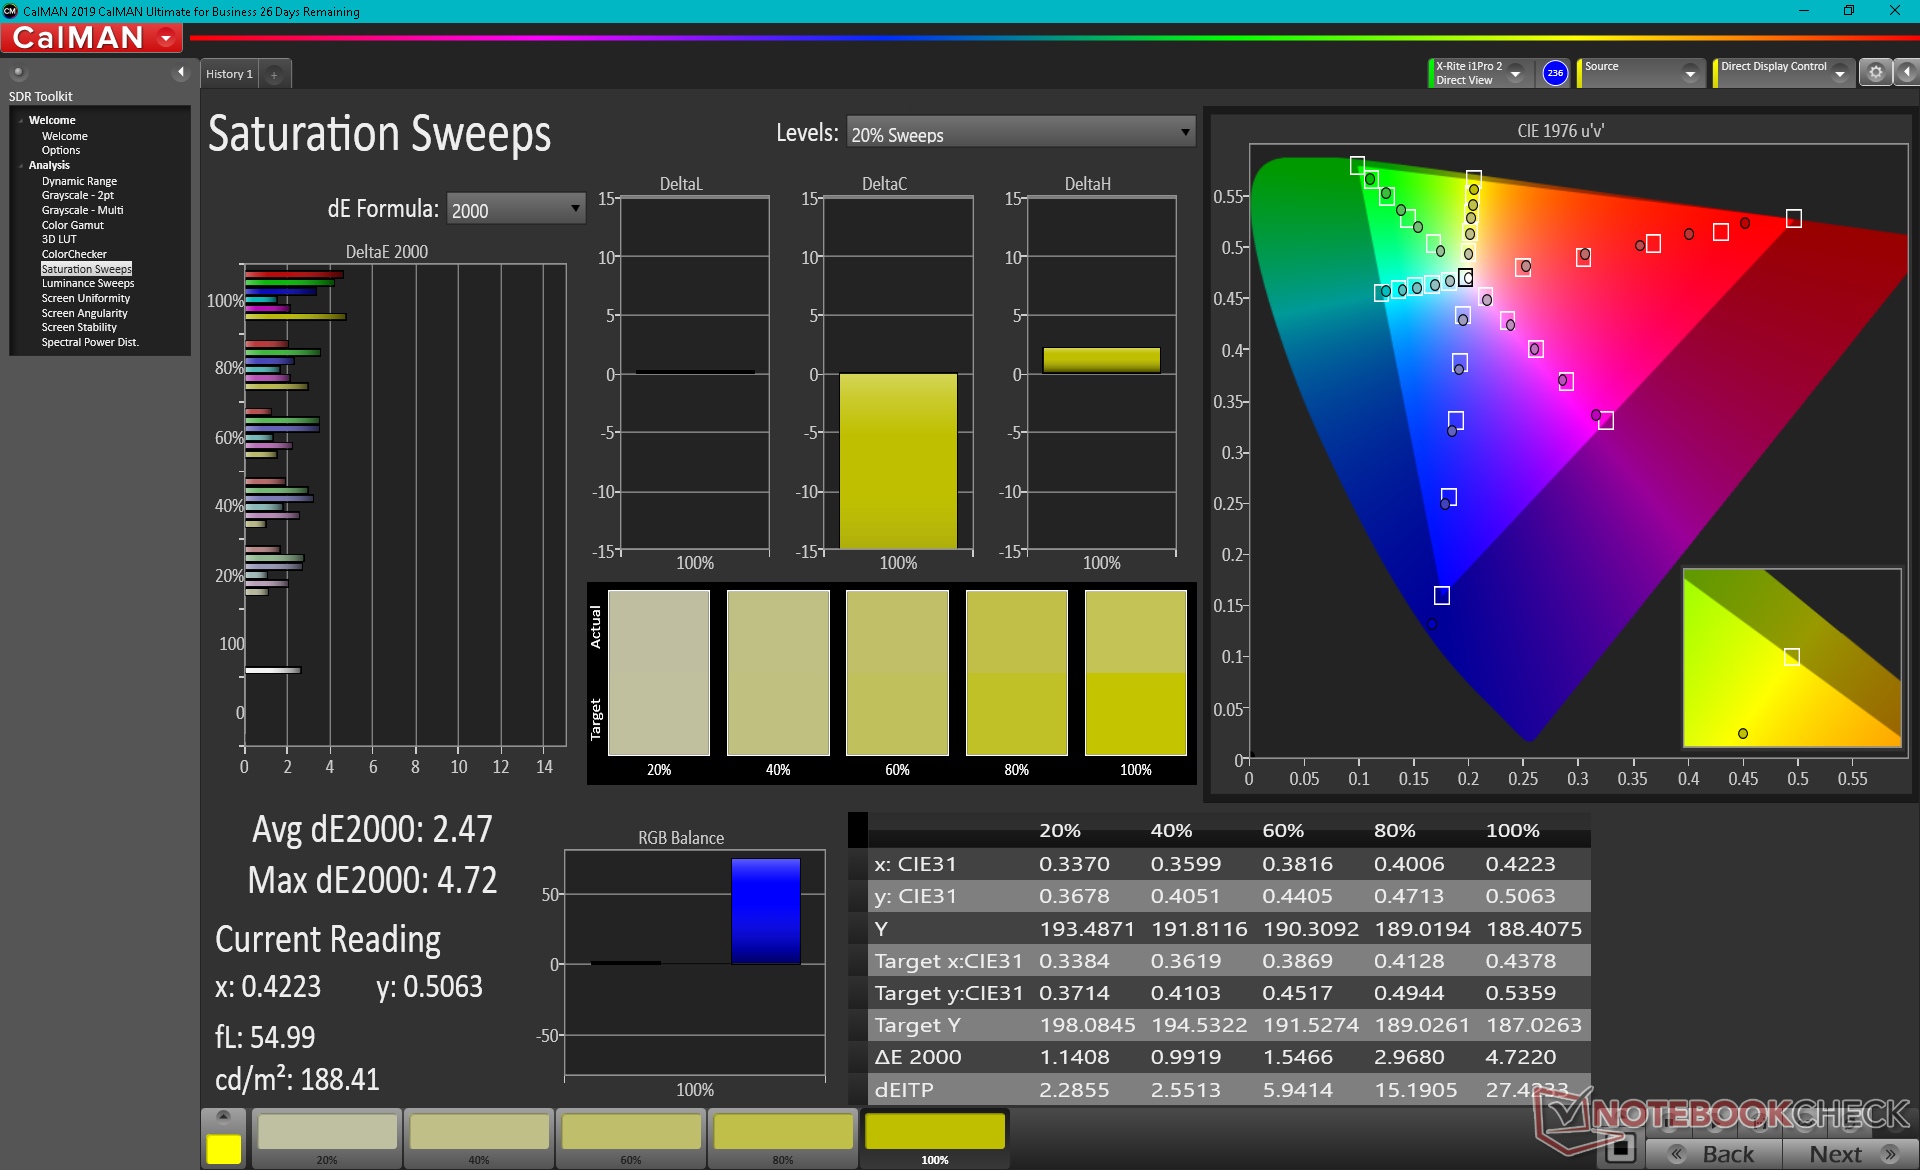
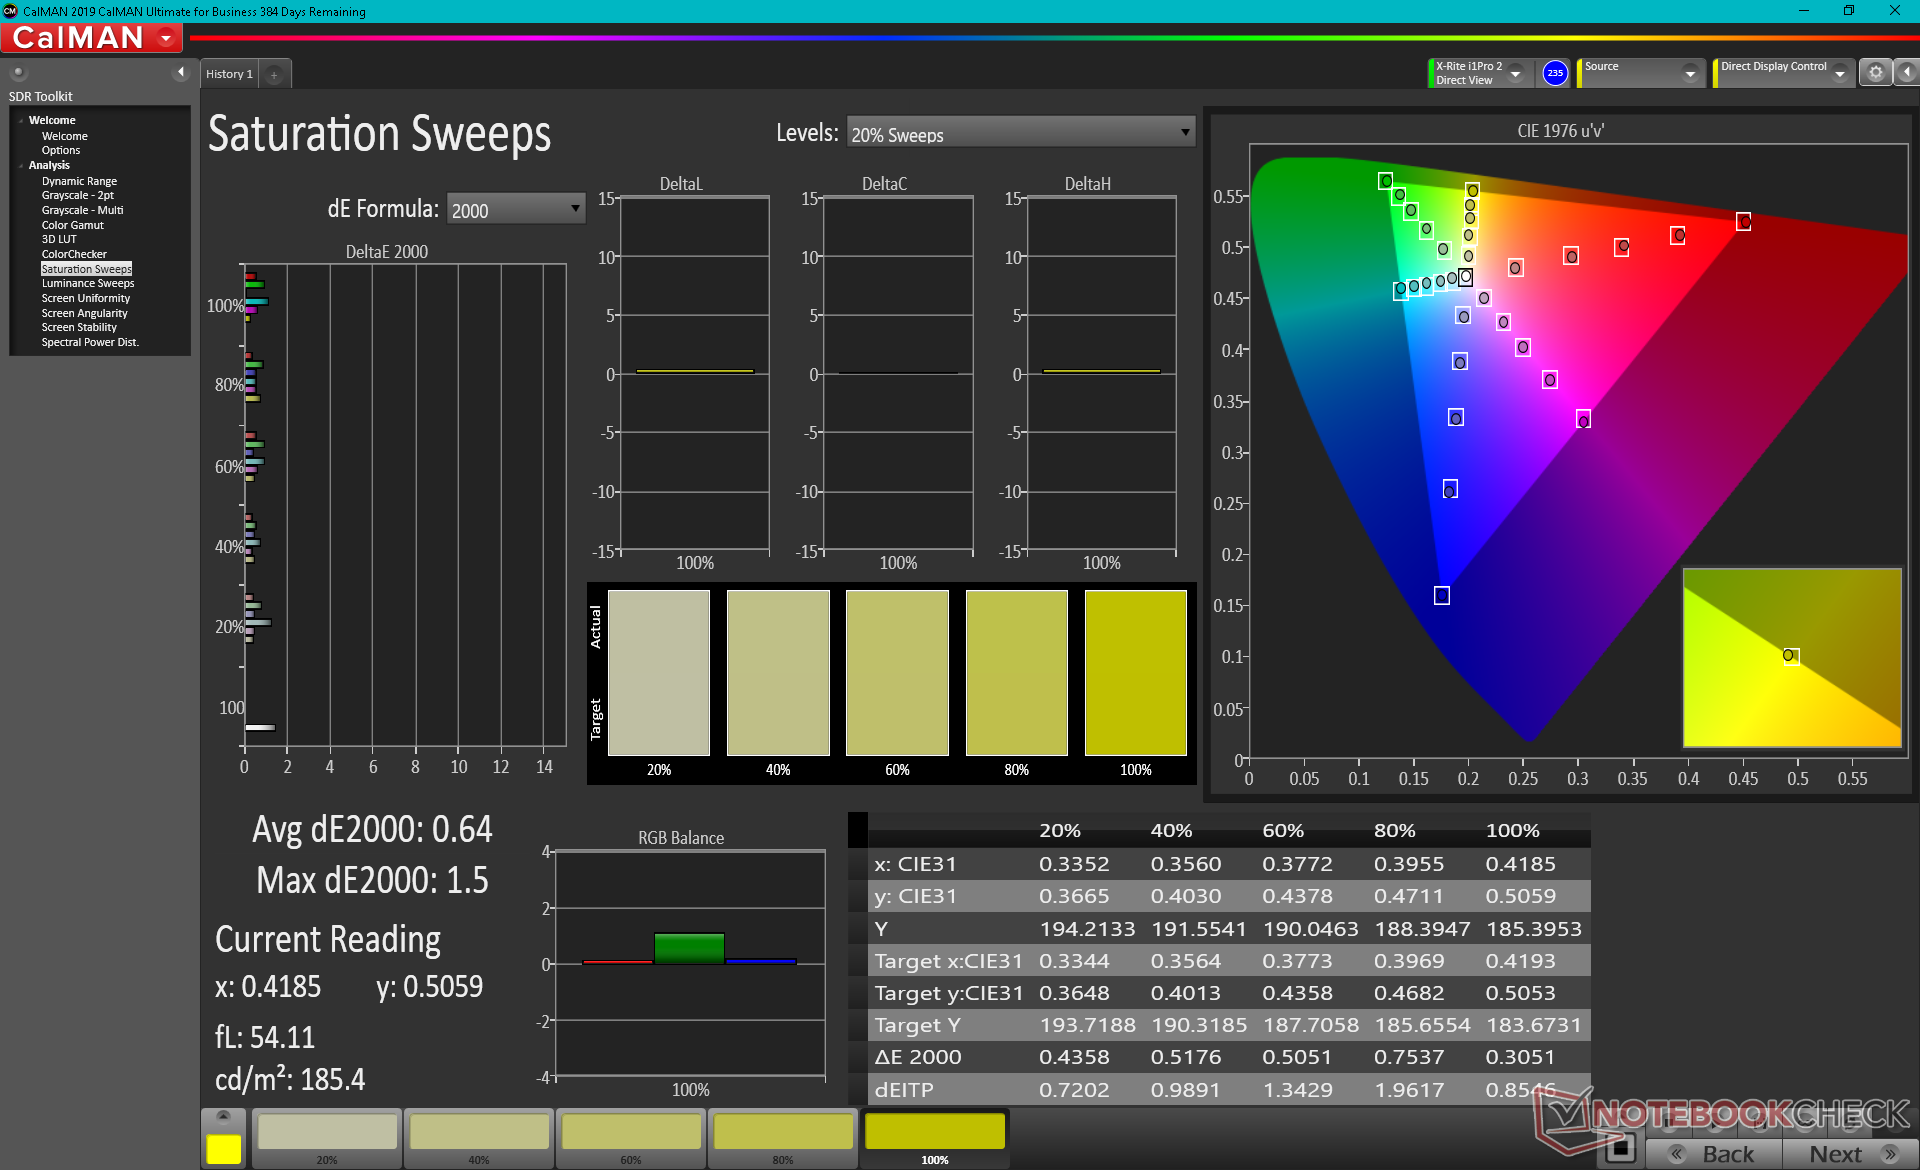
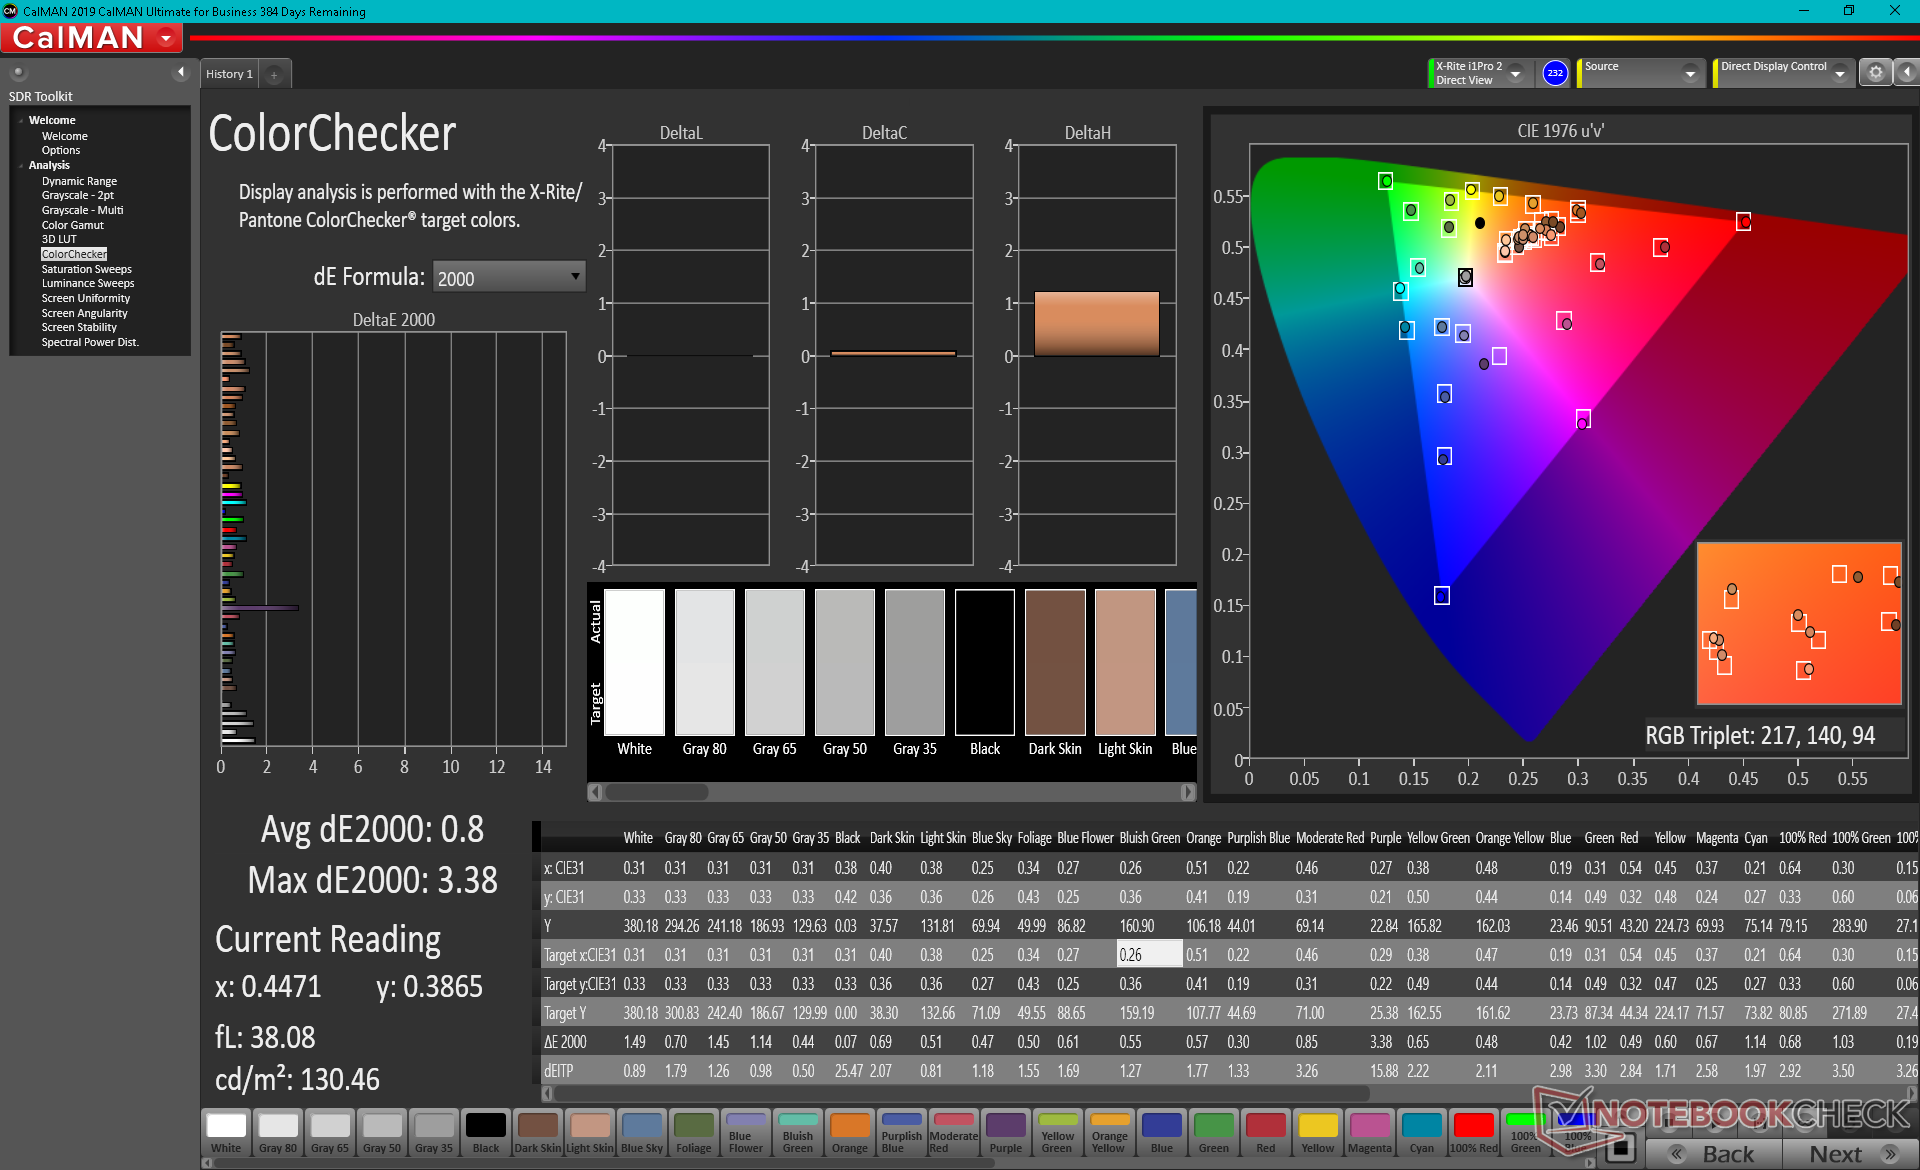
Asus utilizza lo stesso pannello OLED 1080p Samsung ATNA56YX03-0 per entrambe le serie VivoBook 15 K513 e VivoBook 15 Pro. Il pannello è notevole per offrire una copertura completa DCI-P3 che la maggior parte dei pannelli IPS non può raggiungere, specialmente in questa fascia di prezzo <$1000 USD. I tempi di risposta extra-veloci, la retroilluminazione relativamente luminosa e l'estremo rapporto di contrasto rendono il nostro VivoBook migliore del previsto per l'editing grafico
Tenete a mente che la modulazione di larghezza d'impulso è presente a tutti i livelli di luminosità a differenza della maggior parte degli altri portatili. Siamo in grado di registrare una frequenza di 59 Hz quando la luminosità è impostata al 50% o superiore e 434 Hz quando la luminosità è impostata al 49% o inferiore.


| |||||||||||||||||||||||||
Distribuzione della luminosità: 98 %
Al centro con la batteria: 384.5 cd/m²
Contrasto: ∞:1 (Nero: 0 cd/m²)
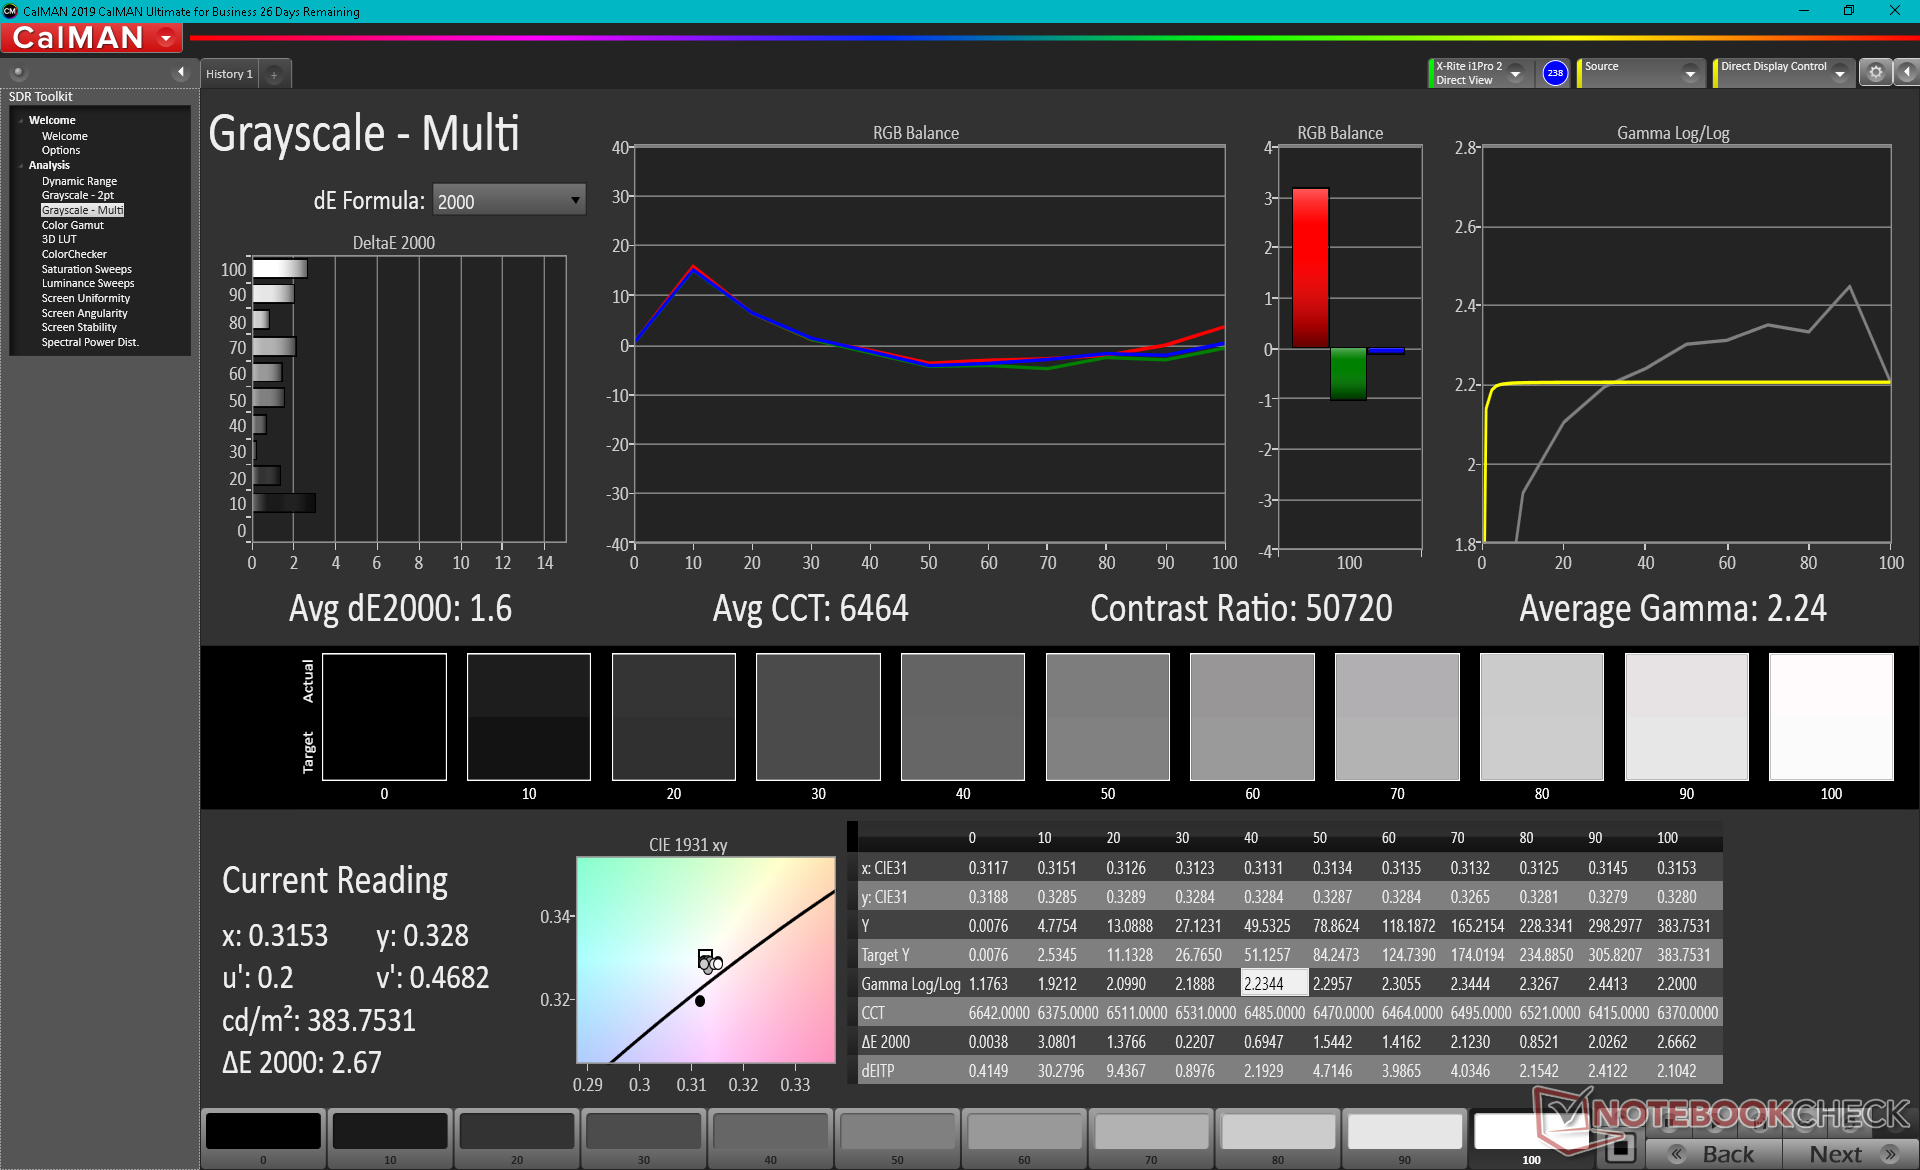
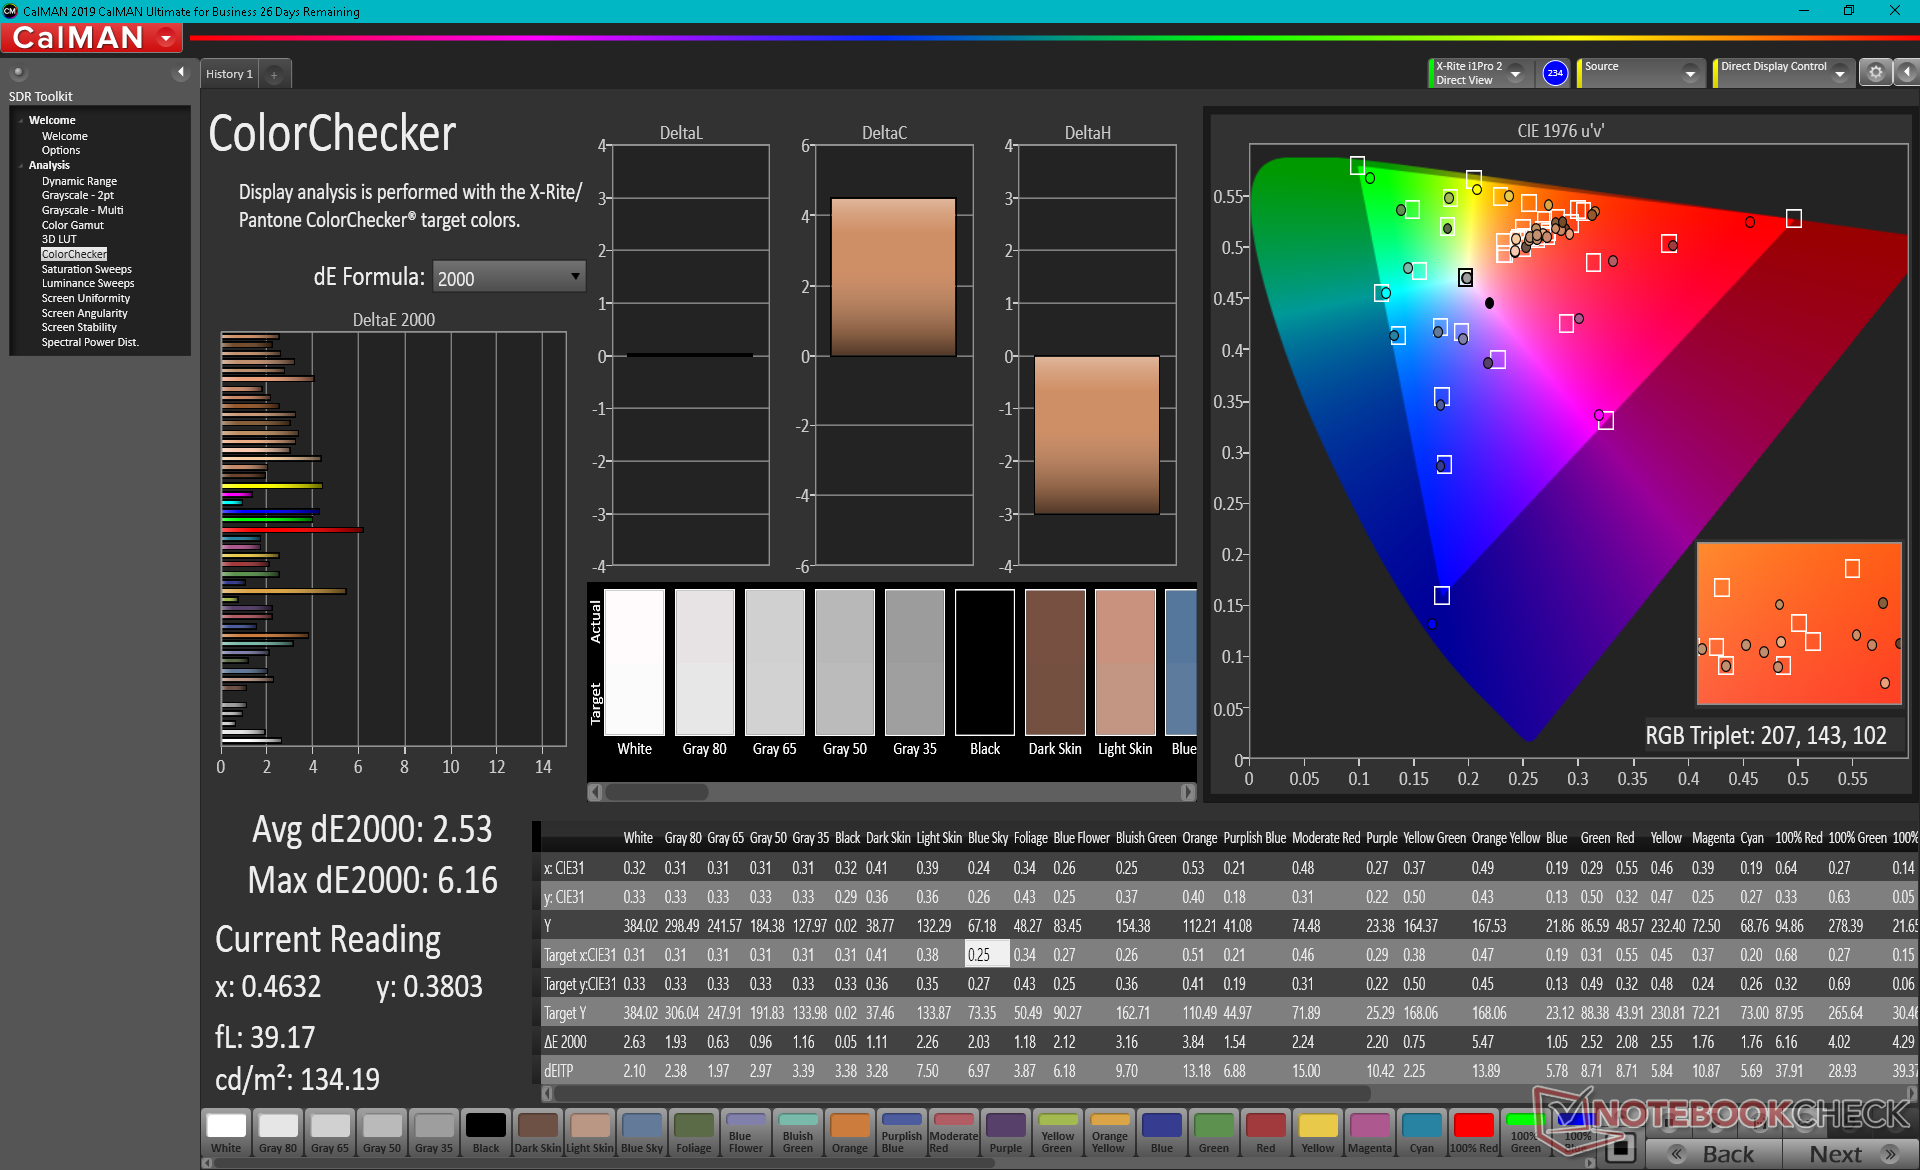
ΔE ColorChecker Calman: 2.53 | ∀{0.5-29.43 Ø4.73}
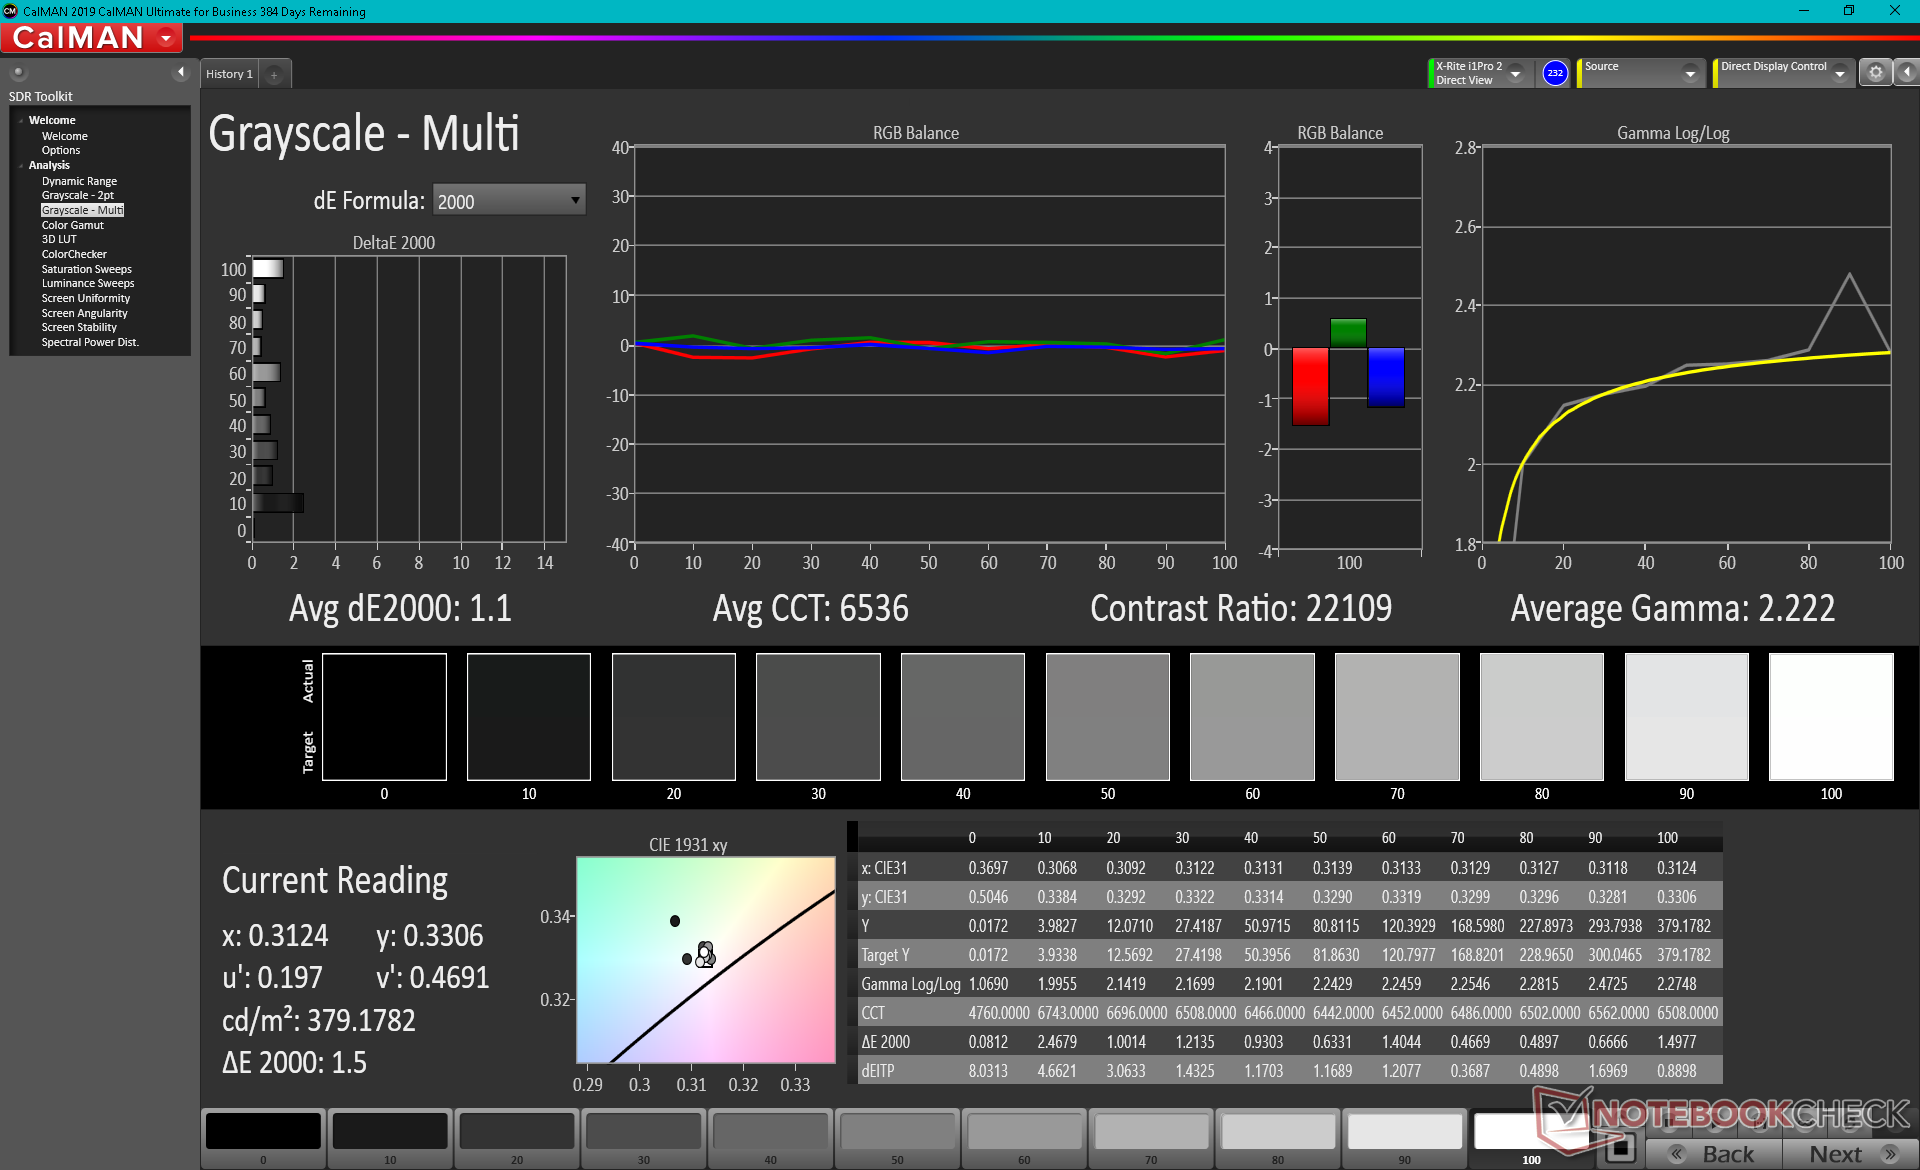
ΔE Greyscale Calman: 1.6 | ∀{0.09-98 Ø4.97}
99.9% AdobeRGB 1998 (Argyll 3D)
100% sRGB (Argyll 3D)
99.9% Display P3 (Argyll 3D)
Gamma: 2.24
CCT: 6464 K
| Asus Vivobook 15 K513EQ Samsung ATNA56YX03-0, OLED, 1920x1080, 15.6" | Asus VivoBook 15 Pro M3500QC-L1062 ATNA56YX03-0, AMOLED, 1920x1080, 15.6" | Asus VivoBook S15 S533EQ-BQ002T Panda LM156LF-5L04, IPS, 1920x1080, 15.6" | Lenovo IdeaPad 5 15ALC05 Lenovo LEN156FHD, IPS, 1920x1080, 15.6" | Dell Inspiron 15 3501 BOE NV15N3D (Dell P/N: N39X1), IPS, 1920x1080, 15.6" | HP Pavilion 15-eg Chi Mei CMN1523, IPS, 1920x1080, 15.6" | |
|---|---|---|---|---|---|---|
| Display | -1% | -54% | -52% | -54% | -50% | |
| Display P3 Coverage (%) | 99.9 | 99.9 0% | 39.01 -61% | 39.4 -61% | 42.9 -57% | |
| sRGB Coverage (%) | 100 | 99.9 0% | 58.5 -41% | 59 -41% | 58.7 -41% | 64 -36% |
| AdobeRGB 1998 Coverage (%) | 99.9 | 95.8 -4% | 40.33 -60% | 38 -62% | 40.7 -59% | 44.4 -56% |
| Response Times | -28% | -1229% | -870% | -1429% | -825% | |
| Response Time Grey 50% / Grey 80% * (ms) | 2.2 ? | 3.2 ? -45% | 38 ? -1627% | 29 ? -1218% | 43 ? -1855% | 22.8 ? -936% |
| Response Time Black / White * (ms) | 2.9 ? | 3.2 ? -10% | 27 ? -831% | 18 ? -521% | 32 ? -1003% | 23.6 ? -714% |
| PWM Frequency (Hz) | 59.5 ? | 60.2 ? | 1000 ? | 26320 ? | ||
| Screen | 14% | -65% | -101% | -47% | -74% | |
| Brightness middle (cd/m²) | 384.5 | 396 3% | 287 -25% | 376 -2% | 271 -30% | 294.3 -23% |
| Brightness (cd/m²) | 388 | 397 2% | 261 -33% | 341 -12% | 263 -32% | 251 -35% |
| Brightness Distribution (%) | 98 | 99 1% | 84 -14% | 78 -20% | 92 -6% | 76 -22% |
| Black Level * (cd/m²) | 0.51 | 0.66 | 0.15 | 0.26 | ||
| Colorchecker dE 2000 * | 2.53 | 2 21% | 4.72 -87% | 6.4 -153% | 4.83 -91% | 4.08 -61% |
| Colorchecker dE 2000 max. * | 6.16 | 4.8 22% | 17.94 -191% | 20.45 -232% | 7 -14% | 19.49 -216% |
| Greyscale dE 2000 * | 1.6 | 1 37% | 2.2 -38% | 4.59 -187% | 3.36 -110% | 3 -88% |
| Gamma | 2.24 98% | 2.17 101% | 2.51 88% | 2.26 97% | 2.56 86% | 2.21 100% |
| CCT | 6464 101% | 6608 98% | 6758 96% | 6819 95% | 6764 96% | 6616 98% |
| Colorchecker dE 2000 calibrated * | 1.8 | 3.74 | 3.7 | |||
| Contrast (:1) | 563 | 570 | 1807 | 1132 | ||
| Color Space (Percent of AdobeRGB 1998) (%) | 37 | 38 | ||||
| Color Space (Percent of sRGB) (%) | 58 | 59 | ||||
| Media totale (Programma / Settaggio) | -5% /
2% | -449% /
-273% | -341% /
-245% | -510% /
-300% | -316% /
-204% |
* ... Meglio usare valori piccoli
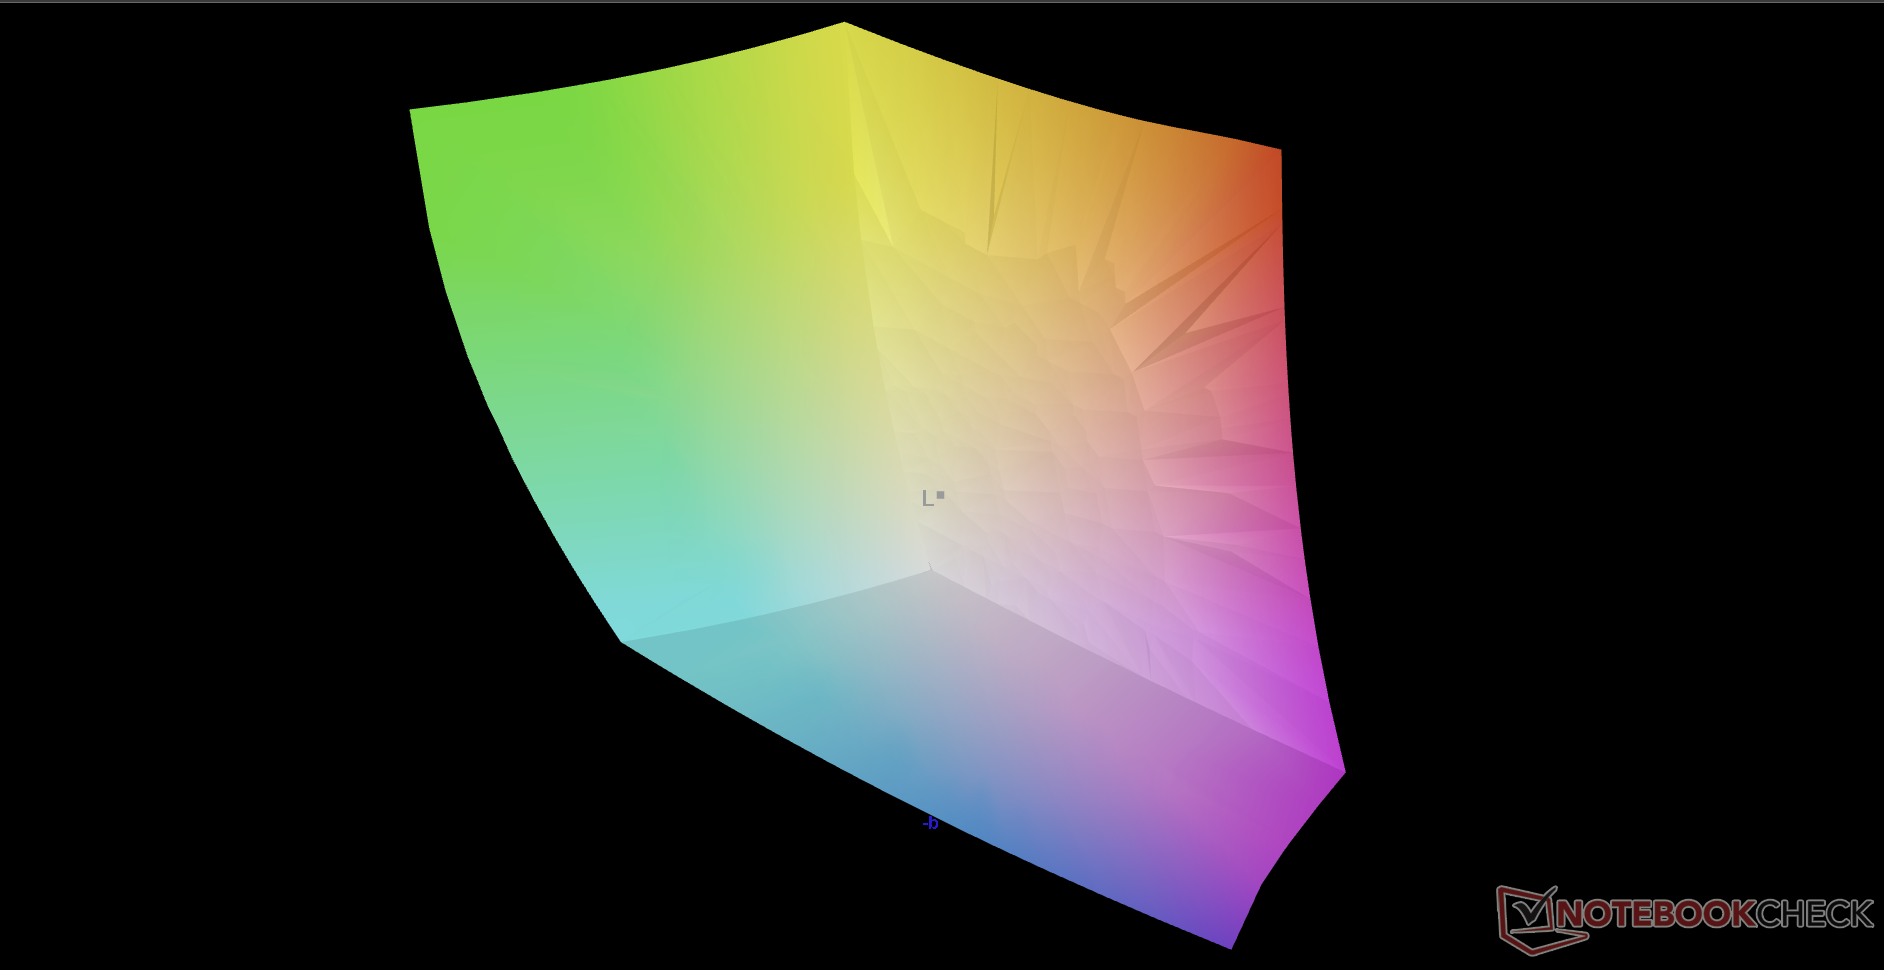
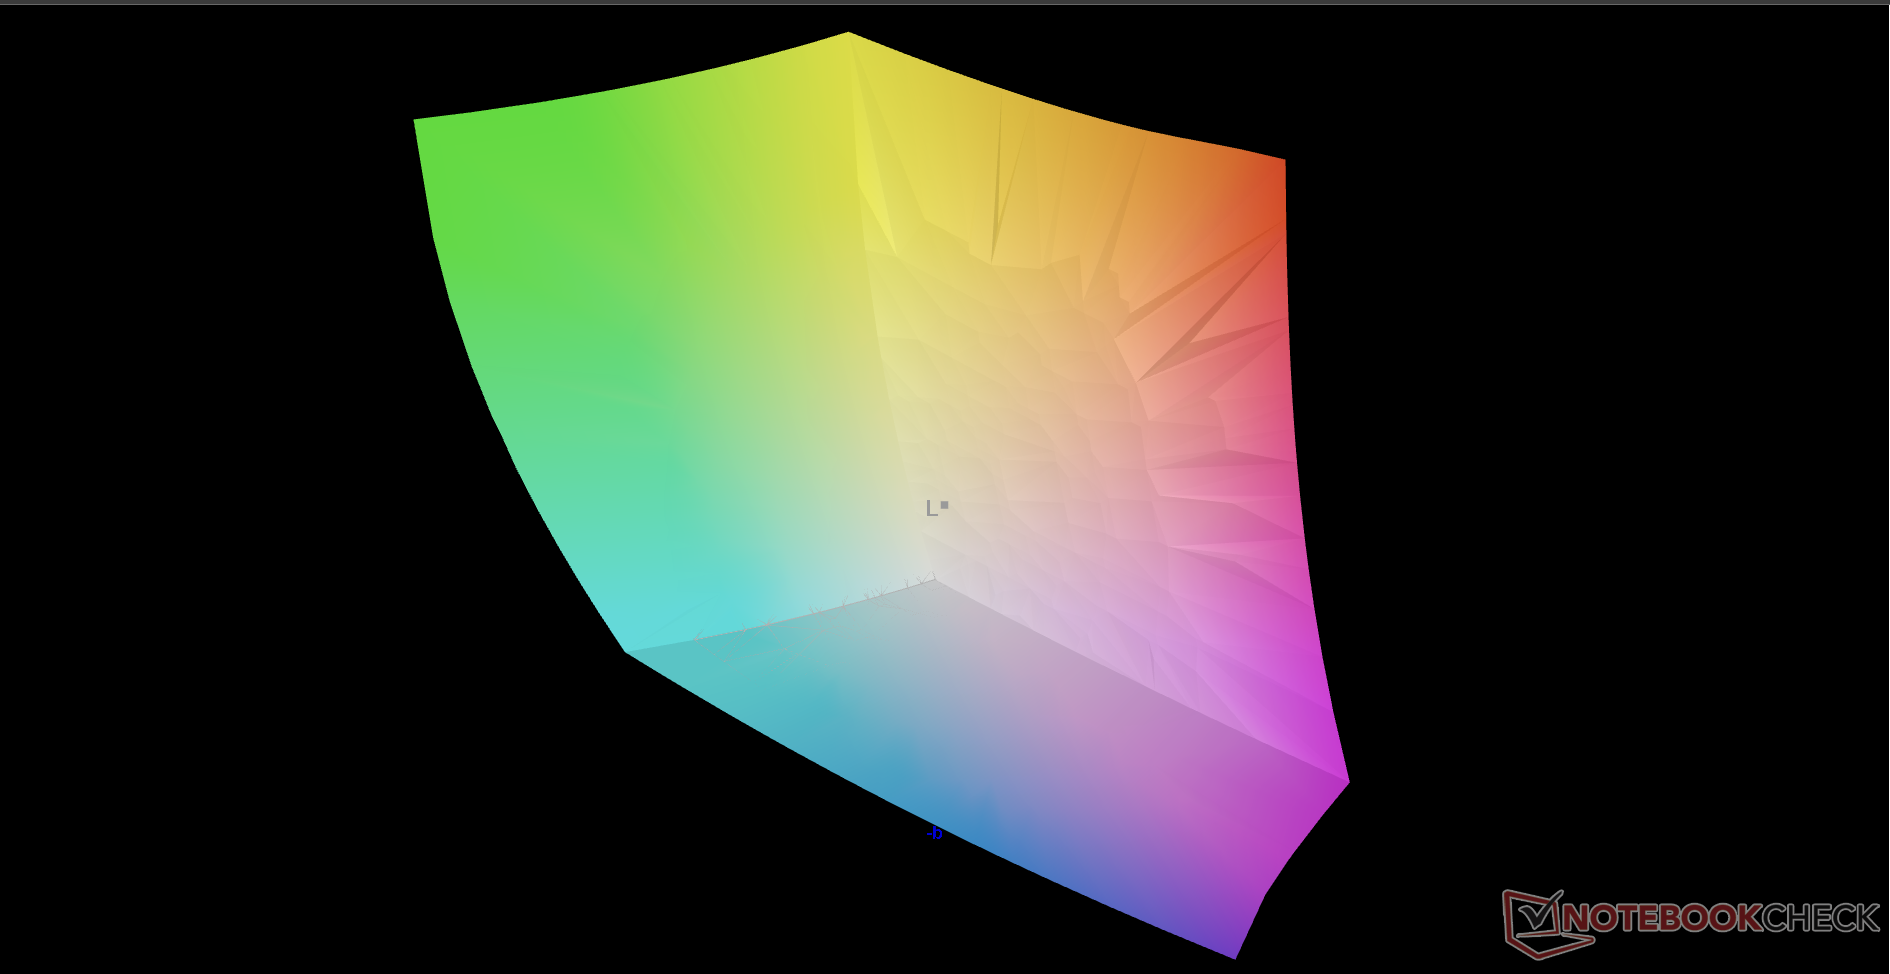
Il display è calibrato decentemente fuori dalla scatola con valori medi di deltaE della scala di grigi e del colore di solo 1,6 e 2,53, rispettivamente, se confrontati con lo standard P3. I colori rosso e giallo sembrano essere i più imprecisi rispetto agli altri colori primari e secondari
Tempi di risposta del Display
| ↔ Tempi di risposta dal Nero al Bianco | ||
|---|---|---|
| 2.9 ms ... aumenta ↗ e diminuisce ↘ combinato | ↗ 1.1 ms Incremento | 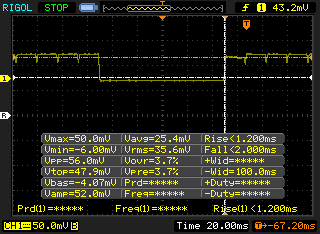 |
| ↘ 1.8 ms Calo | ||
| Lo schermo ha mostrato valori di risposta molto veloci nei nostri tests ed è molto adatto per i gaming veloce. In confronto, tutti i dispositivi di test variano da 0.1 (minimo) a 240 (massimo) ms. » 14 % di tutti i dispositivi è migliore. Questo significa che i tempi di risposta rilevati sono migliori rispettto alla media di tutti i dispositivi testati (19.9 ms). | ||
| ↔ Tempo di risposta dal 50% Grigio all'80% Grigio | ||
| 2.2 ms ... aumenta ↗ e diminuisce ↘ combinato | ↗ 1.1 ms Incremento | 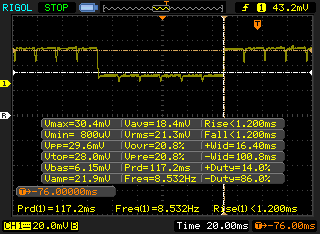 |
| ↘ 1.1 ms Calo | ||
| Lo schermo ha mostrato valori di risposta molto veloci nei nostri tests ed è molto adatto per i gaming veloce. In confronto, tutti i dispositivi di test variano da 0.165 (minimo) a 636 (massimo) ms. » 11 % di tutti i dispositivi è migliore. Questo significa che i tempi di risposta rilevati sono migliori rispettto alla media di tutti i dispositivi testati (31.1 ms). | ||
Sfarfallio dello schermo / PWM (Pulse-Width Modulation)
| flickering dello schermo / PWM rilevato | 59.5 Hz | ≤ 100 % settaggio luminosita' | 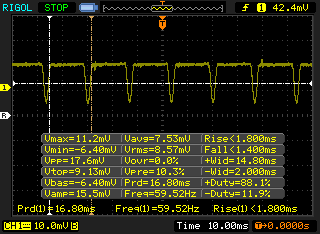 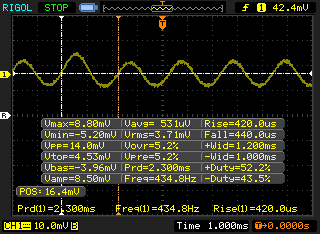 |
Il display sfarfalla a 59.5 Hz (Probabilmente a causa dell'uso di PWM) Flickering rilevato ad una luminosita' di 100 % o inferiore. Non dovrebbe verificarsi flickering o PWM sopra questo valore di luminosita'. La frequenza di 59.5 Hz è molto bassa, quindi il flickering potrebbe causare stanchezza agli occhi e mal di testa con un utilizzo prolungato. In confronto: 52 % di tutti i dispositivi testati non utilizza PWM per ridurre la luminosita' del display. Se è rilevato PWM, una media di 7798 (minimo: 5 - massimo: 343500) Hz è stata rilevata. | |||
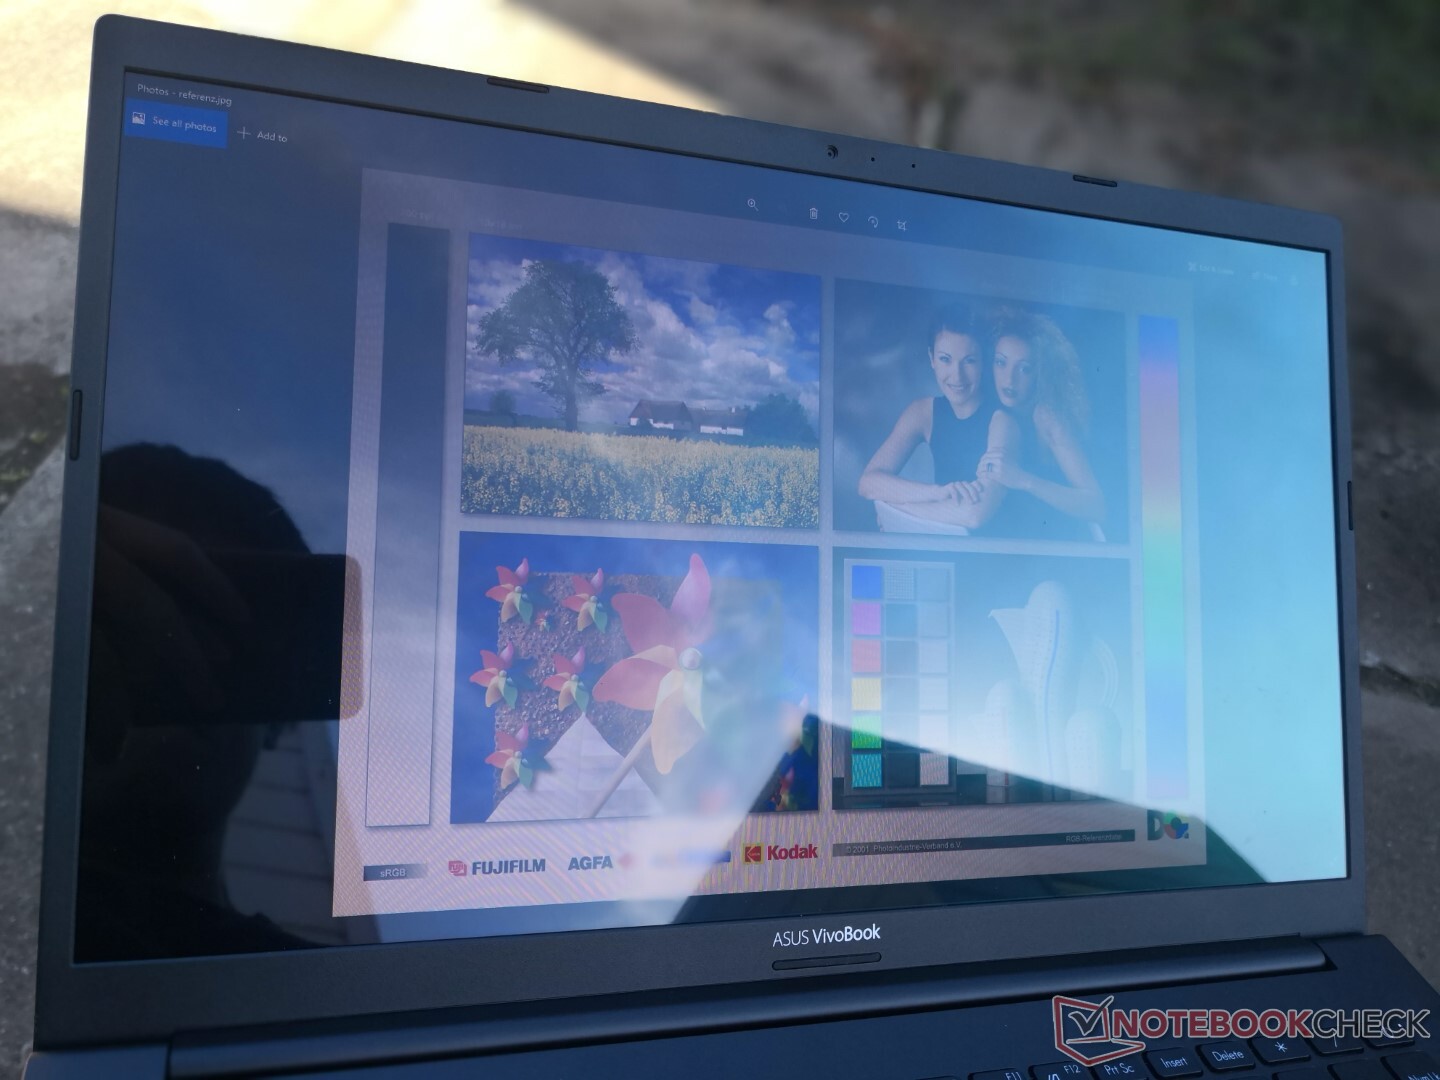
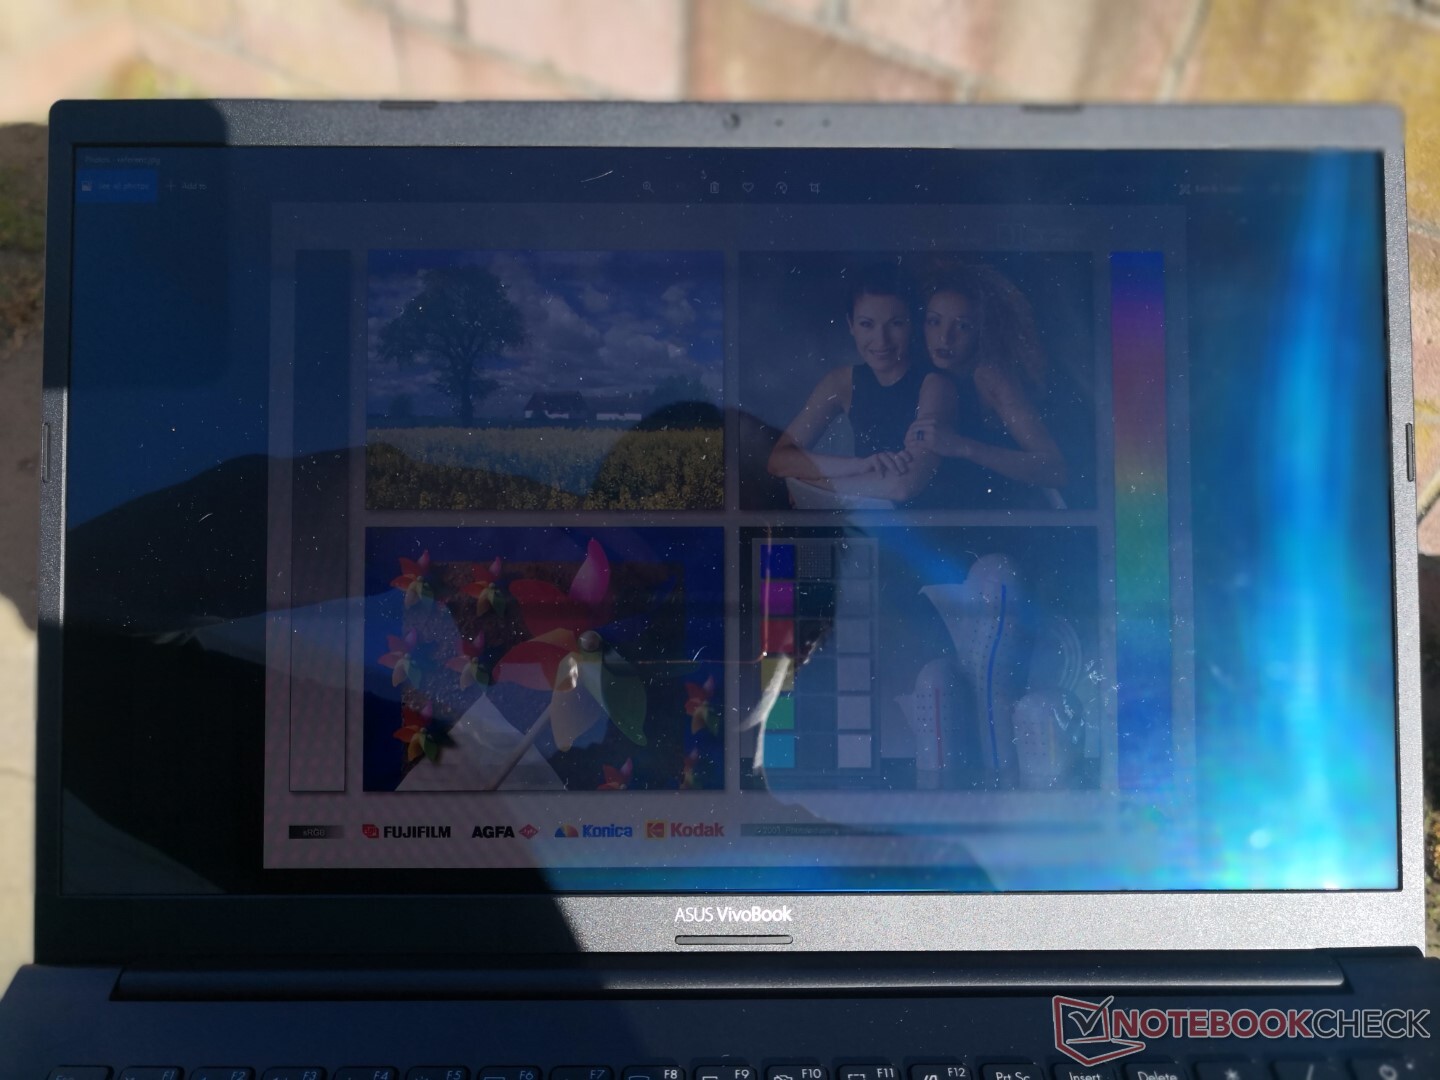
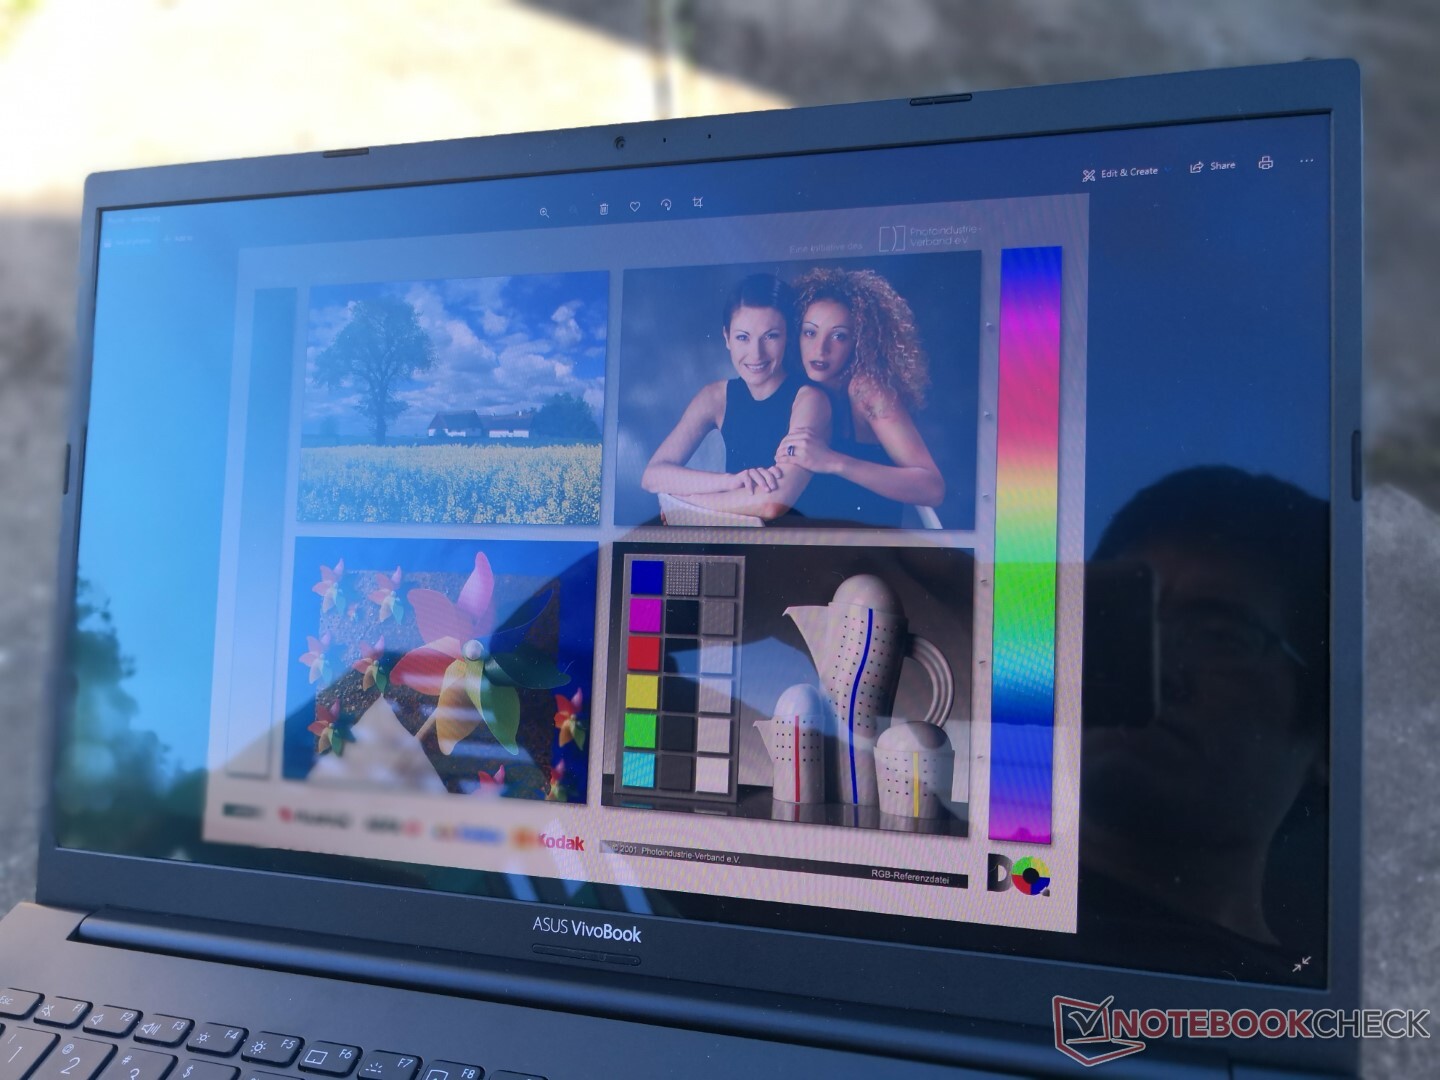
La visibilità all'aperto è media se sotto l'ombra e leggermente migliore dell'IPS quando si trova allo stesso livello di luminosità, grazie ai livelli di nero molto più profondi dell'OLED. Lo schermo non si lava così facilmente come risultato, ma i riflessi sono comunque difficili da evitare.

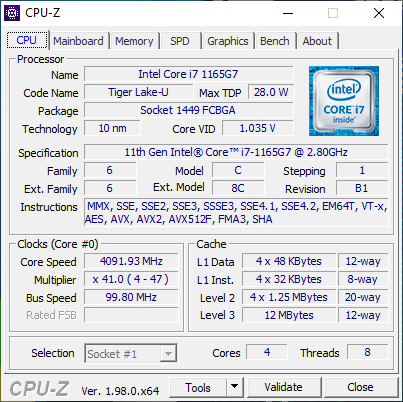
Prestazioni - 11a generazione Tiger Lake-U
Le attuali SKU sono equipaggiate con la serie U Core i3-1115G4 CPU fino al Core i7-1165G7 più grafica opzionale GeForce MX330 o MX350 su Optimus 1.0. La suddetta SKU Core i3 viene fornita solo con integrato UHD Graphics per essere significativamente più lenta di Iris Xe o della GPU discreta Nvidia. Gli utenti dovranno guardare la fascia più alta VivoBook 15 Pro se vogliono CPU Core serie H più veloci e GeForce grafica RTX
Condizioni di test
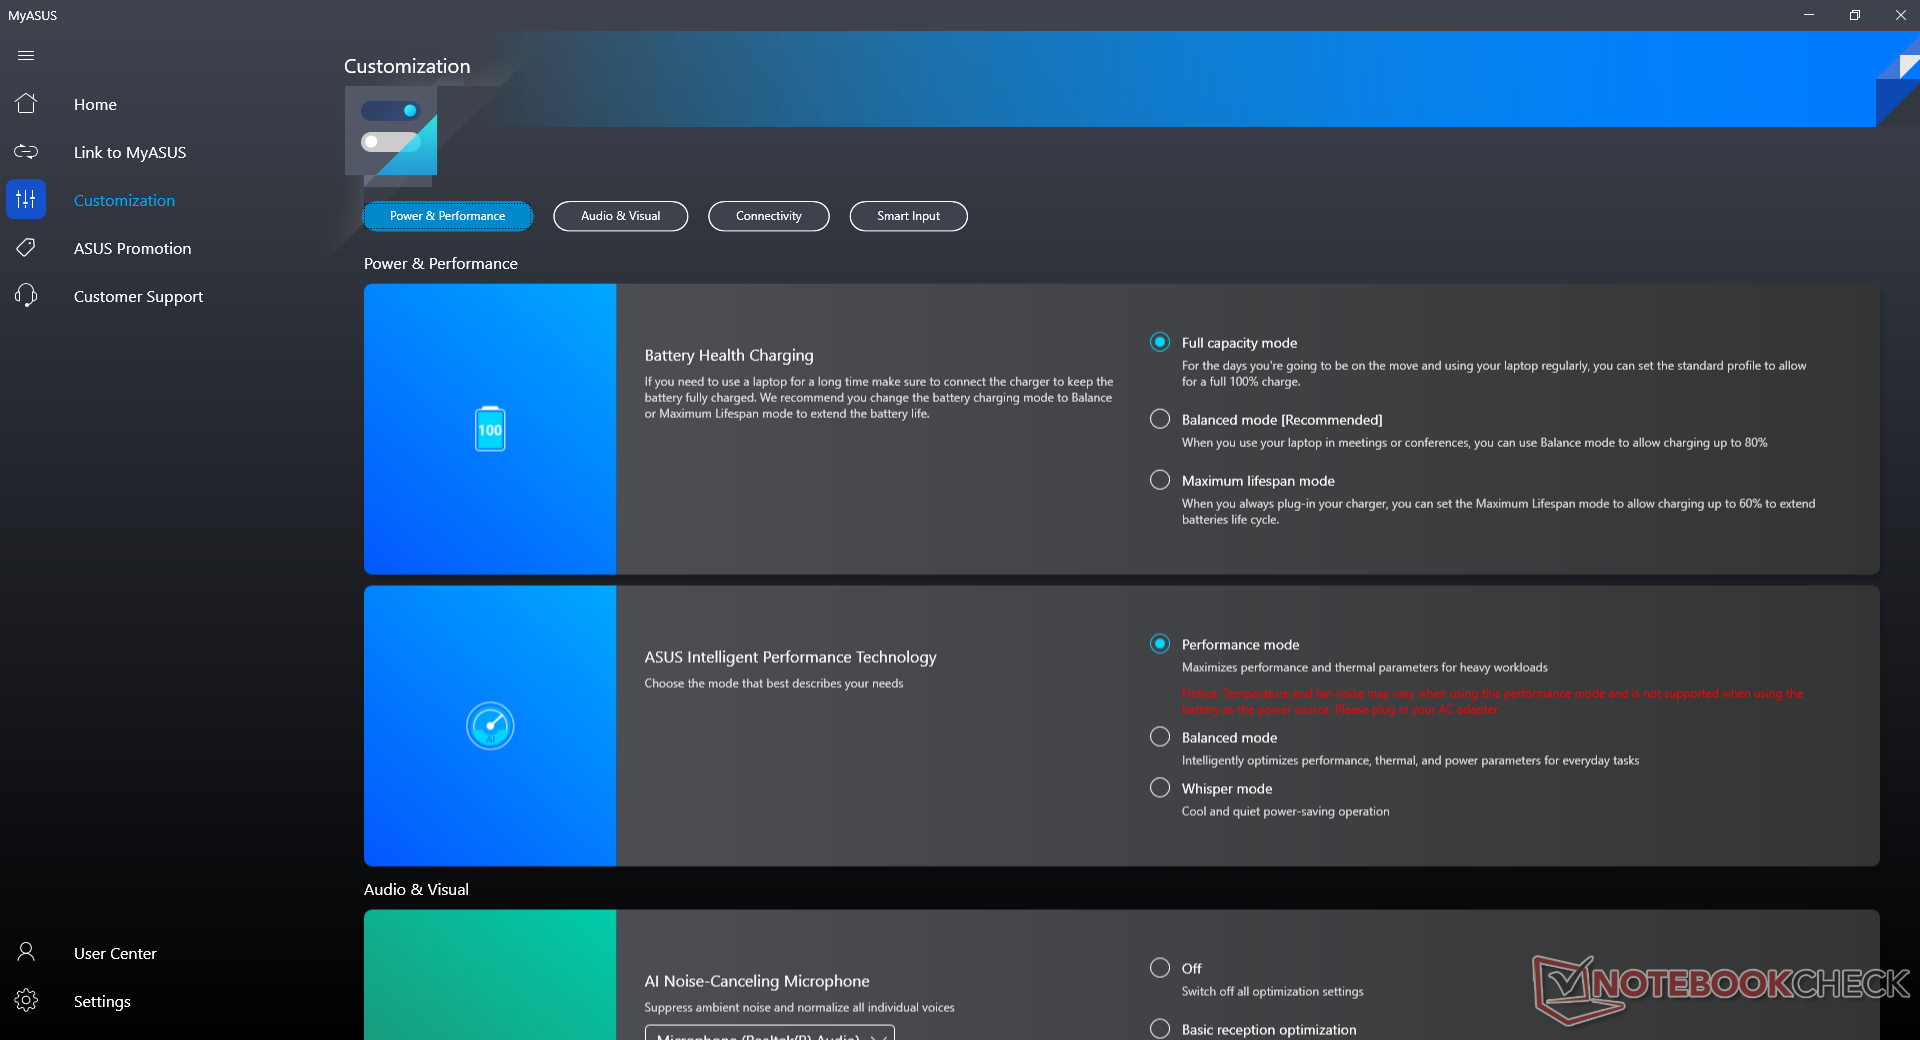
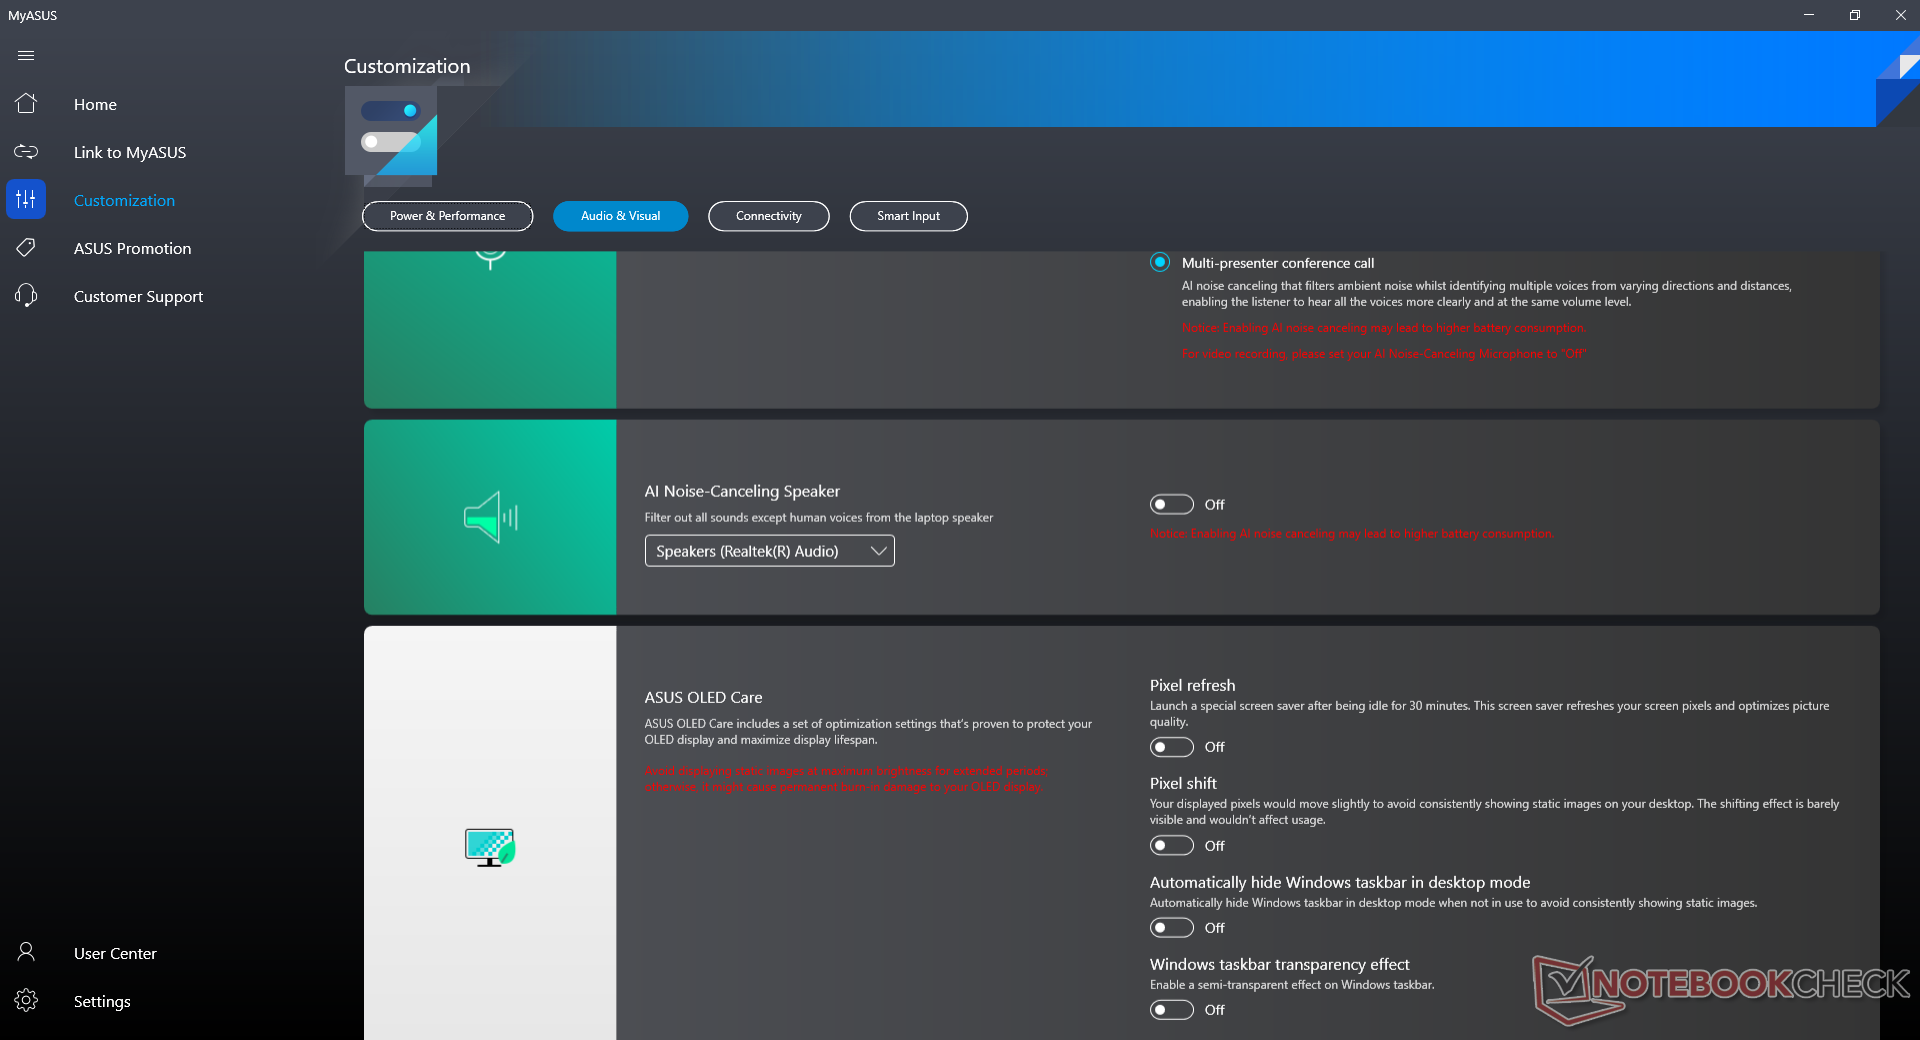
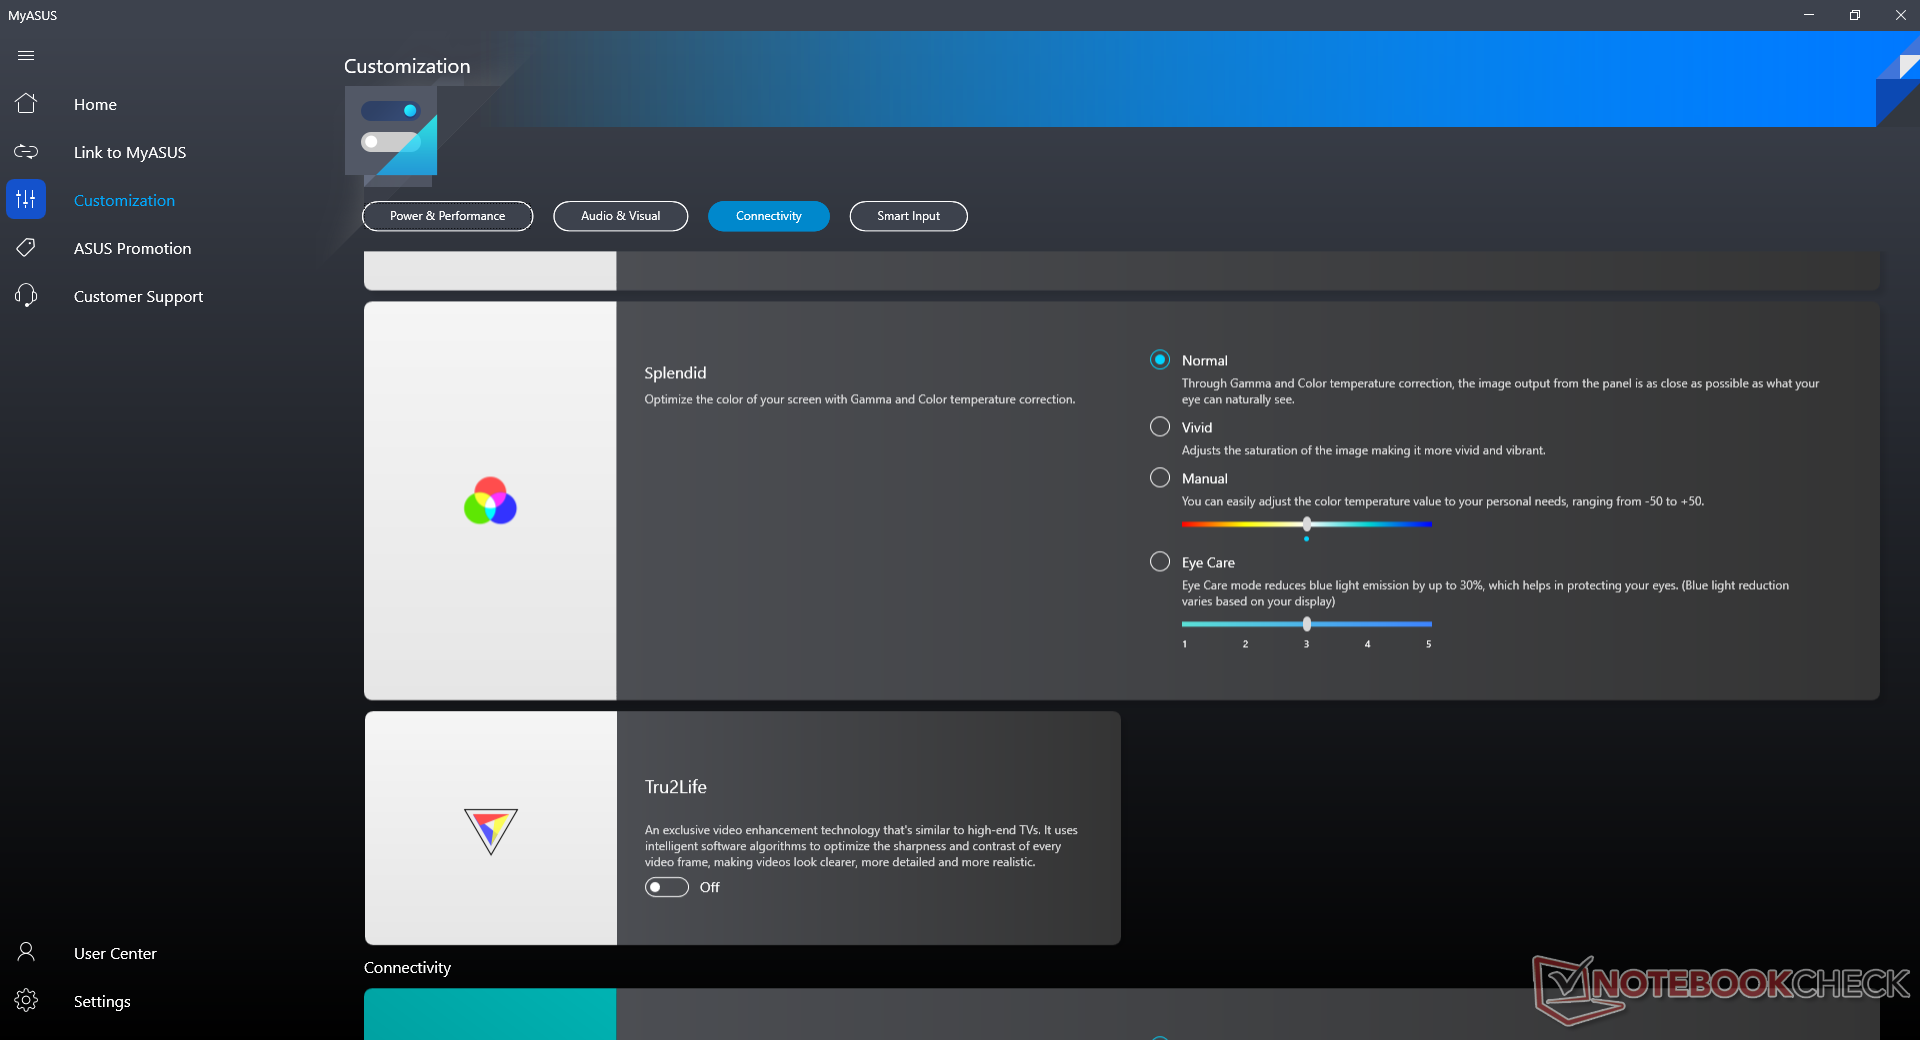
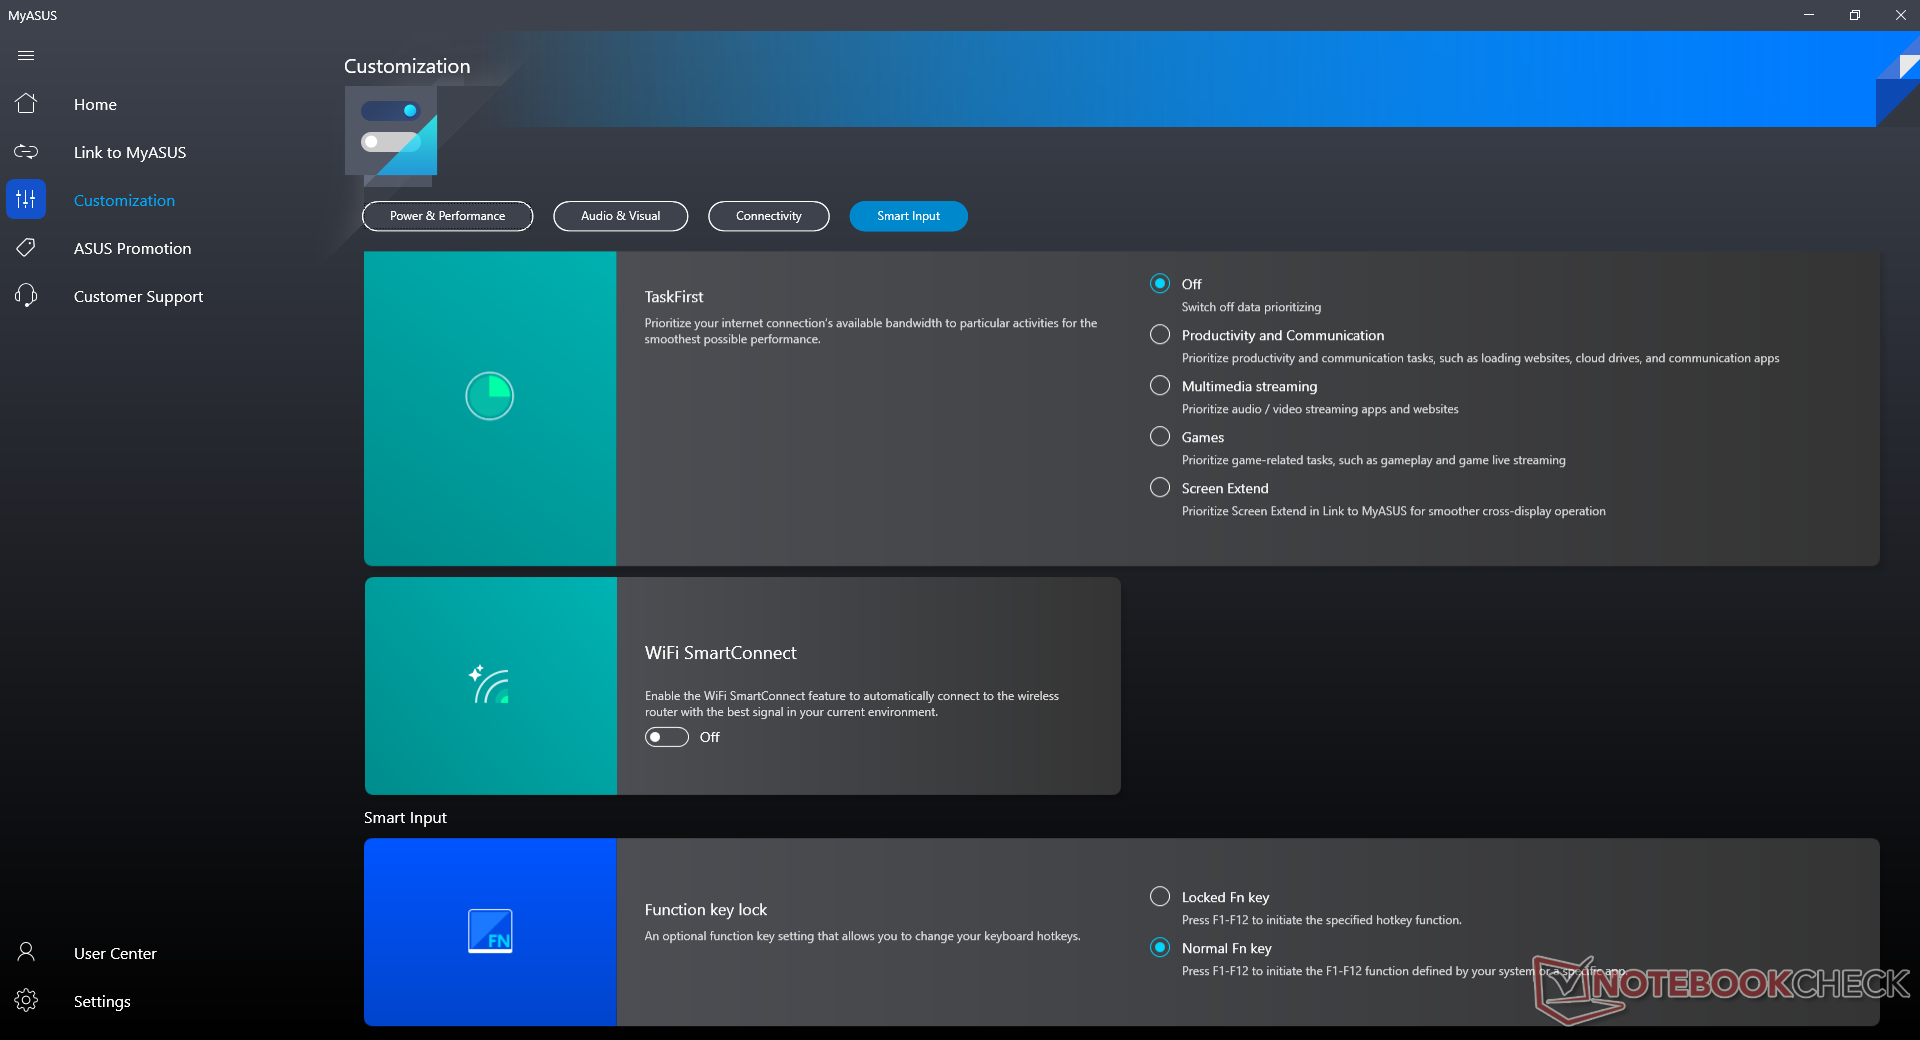
La nostra unità è stata impostata in modalità Performance tramite il software MyAsus per ottenere i migliori punteggi di benchmark possibili. Raccomandiamo ai proprietari di familiarizzare con questo software poiché le caratteristiche chiave relative a OLED, microfono, salute della batteria, aggiornamenti Asus e altro sono tutte accessibili qui.
Processore
Le prestazioni della CPU sono eccellenti con risultati multi-thread che sono circa il 10 per cento più veloci della media dei laptop nel nostro database con lo stesso Core i7-1165G7 processore. Optando per il meno Core i5-1135G7 comporterà un calo di prestazioni di solo circa il 10-15%.
Cinebench R15 Multi Loop
Cinebench R23: Multi Core | Single Core
Cinebench R20: CPU (Multi Core) | CPU (Single Core)
Cinebench R15: CPU Multi 64Bit | CPU Single 64Bit
Blender: v2.79 BMW27 CPU
7-Zip 18.03: 7z b 4 | 7z b 4 -mmt1
Geekbench 5.5: Multi-Core | Single-Core
HWBOT x265 Benchmark v2.2: 4k Preset
LibreOffice : 20 Documents To PDF
R Benchmark 2.5: Overall mean
| CPU Performance rating | |
| HP Pavilion Aero 13 be0097nr -2! | |
| Lenovo ThinkPad E15 G3-20YG003UGE | |
| Microsoft Surface Laptop 4 15 AMD TFF_00028 | |
| MSI Prestige 15 A10SC -10! | |
| VAIO SX14 VJS144X0111K -2! | |
| Asus Vivobook 15 K513EQ -2! | |
| Media Intel Core i7-1165G7 | |
| Microsoft Surface Laptop 3 15 i7-1065G7 -10! | |
| HP Pavilion x360 15-er0155ng | |
| Asus ZenBook 15 UX534FT-DB77 -10! | |
| Lenovo ThinkPad P15s Gen1-20T4000JGE -2! | |
| HP 250 G7-15S40ES -2! | |
| Dell Inspiron 15 5000 5502 -2! | |
| Cinebench R23 / Multi Core | |
| Microsoft Surface Laptop 4 15 AMD TFF_00028 | |
| Lenovo ThinkPad E15 G3-20YG003UGE | |
| HP Pavilion Aero 13 be0097nr | |
| VAIO SX14 VJS144X0111K | |
| Asus Vivobook 15 K513EQ | |
| Media Intel Core i7-1165G7 (2525 - 6862, n=64) | |
| HP Pavilion x360 15-er0155ng | |
| Cinebench R23 / Single Core | |
| VAIO SX14 VJS144X0111K | |
| Asus Vivobook 15 K513EQ | |
| Media Intel Core i7-1165G7 (1110 - 1539, n=59) | |
| HP Pavilion Aero 13 be0097nr | |
| HP Pavilion x360 15-er0155ng | |
| Microsoft Surface Laptop 4 15 AMD TFF_00028 | |
| Lenovo ThinkPad E15 G3-20YG003UGE | |
| Geekbench 5.5 / Multi-Core | |
| Microsoft Surface Laptop 4 15 AMD TFF_00028 | |
| Lenovo ThinkPad E15 G3-20YG003UGE | |
| Media Intel Core i7-1165G7 (3078 - 5926, n=77) | |
| HP Pavilion x360 15-er0155ng | |
| Lenovo ThinkPad P15s Gen1-20T4000JGE | |
| HP 250 G7-15S40ES | |
| Dell Inspiron 15 5000 5502 | |
| Geekbench 5.5 / Single-Core | |
| Media Intel Core i7-1165G7 (1302 - 1595, n=77) | |
| HP Pavilion x360 15-er0155ng | |
| Dell Inspiron 15 5000 5502 | |
| Lenovo ThinkPad P15s Gen1-20T4000JGE | |
| Lenovo ThinkPad E15 G3-20YG003UGE | |
| HP 250 G7-15S40ES | |
| Microsoft Surface Laptop 4 15 AMD TFF_00028 | |
Cinebench R23: Multi Core | Single Core
Cinebench R20: CPU (Multi Core) | CPU (Single Core)
Cinebench R15: CPU Multi 64Bit | CPU Single 64Bit
Blender: v2.79 BMW27 CPU
7-Zip 18.03: 7z b 4 | 7z b 4 -mmt1
Geekbench 5.5: Multi-Core | Single-Core
HWBOT x265 Benchmark v2.2: 4k Preset
LibreOffice : 20 Documents To PDF
R Benchmark 2.5: Overall mean
* ... Meglio usare valori piccoli
AIDA64: FP32 Ray-Trace | FPU Julia | CPU SHA3 | CPU Queen | FPU SinJulia | FPU Mandel | CPU AES | CPU ZLib | FP64 Ray-Trace | CPU PhotoWorxx
| Performance rating | |
| Asus VivoBook 15 Pro M3500QC-L1062 | |
| Lenovo IdeaPad 5 15ALC05 | |
| Asus Vivobook 15 K513EQ | |
| HP Pavilion 15-eg | |
| Asus VivoBook S15 S533EQ-BQ002T | |
| Media Intel Core i7-1165G7 | |
| Dell Inspiron 15 3501 | |
| AIDA64 / FP32 Ray-Trace | |
| Asus VivoBook 15 Pro M3500QC-L1062 | |
| Lenovo IdeaPad 5 15ALC05 | |
| Asus Vivobook 15 K513EQ | |
| Asus VivoBook S15 S533EQ-BQ002T | |
| Media Intel Core i7-1165G7 (3933 - 8184, n=58) | |
| HP Pavilion 15-eg | |
| Dell Inspiron 15 3501 | |
| AIDA64 / FPU Julia | |
| Asus VivoBook 15 Pro M3500QC-L1062 | |
| Lenovo IdeaPad 5 15ALC05 | |
| Asus Vivobook 15 K513EQ | |
| Asus VivoBook S15 S533EQ-BQ002T | |
| Media Intel Core i7-1165G7 (17720 - 34369, n=58) | |
| HP Pavilion 15-eg | |
| Dell Inspiron 15 3501 | |
| AIDA64 / CPU SHA3 | |
| Asus VivoBook 15 Pro M3500QC-L1062 | |
| Asus Vivobook 15 K513EQ | |
| Asus VivoBook S15 S533EQ-BQ002T | |
| Media Intel Core i7-1165G7 (958 - 2338, n=58) | |
| HP Pavilion 15-eg | |
| Dell Inspiron 15 3501 | |
| Lenovo IdeaPad 5 15ALC05 | |
| AIDA64 / CPU Queen | |
| Asus VivoBook 15 Pro M3500QC-L1062 | |
| Lenovo IdeaPad 5 15ALC05 | |
| HP Pavilion 15-eg | |
| Asus VivoBook S15 S533EQ-BQ002T | |
| Asus Vivobook 15 K513EQ | |
| Dell Inspiron 15 3501 | |
| Media Intel Core i7-1165G7 (44161 - 50624, n=58) | |
| AIDA64 / FPU SinJulia | |
| Lenovo IdeaPad 5 15ALC05 | |
| Asus VivoBook 15 Pro M3500QC-L1062 | |
| Asus Vivobook 15 K513EQ | |
| Asus VivoBook S15 S533EQ-BQ002T | |
| Media Intel Core i7-1165G7 (3183 - 4796, n=58) | |
| HP Pavilion 15-eg | |
| Dell Inspiron 15 3501 | |
| AIDA64 / FPU Mandel | |
| Asus VivoBook 15 Pro M3500QC-L1062 | |
| Lenovo IdeaPad 5 15ALC05 | |
| Asus Vivobook 15 K513EQ | |
| Asus VivoBook S15 S533EQ-BQ002T | |
| Media Intel Core i7-1165G7 (11876 - 20468, n=58) | |
| HP Pavilion 15-eg | |
| Dell Inspiron 15 3501 | |
| AIDA64 / CPU AES | |
| Asus VivoBook 15 Pro M3500QC-L1062 | |
| Asus Vivobook 15 K513EQ | |
| Asus VivoBook S15 S533EQ-BQ002T | |
| HP Pavilion 15-eg | |
| Dell Inspiron 15 3501 | |
| Media Intel Core i7-1165G7 (29506 - 73387, n=58) | |
| Lenovo IdeaPad 5 15ALC05 | |
| AIDA64 / CPU ZLib | |
| Asus VivoBook 15 Pro M3500QC-L1062 | |
| Lenovo IdeaPad 5 15ALC05 | |
| Asus Vivobook 15 K513EQ | |
| Asus VivoBook S15 S533EQ-BQ002T | |
| Dell Inspiron 15 3501 | |
| HP Pavilion 15-eg | |
| Media Intel Core i7-1165G7 (169 - 402, n=65) | |
| AIDA64 / FP64 Ray-Trace | |
| Asus VivoBook 15 Pro M3500QC-L1062 | |
| Lenovo IdeaPad 5 15ALC05 | |
| Asus Vivobook 15 K513EQ | |
| Asus VivoBook S15 S533EQ-BQ002T | |
| Dell Inspiron 15 3501 | |
| Media Intel Core i7-1165G7 (2033 - 4461, n=58) | |
| HP Pavilion 15-eg | |
| AIDA64 / CPU PhotoWorxx | |
| HP Pavilion 15-eg | |
| Media Intel Core i7-1165G7 (12392 - 45694, n=58) | |
| Asus VivoBook S15 S533EQ-BQ002T | |
| Asus Vivobook 15 K513EQ | |
| Dell Inspiron 15 3501 | |
| Lenovo IdeaPad 5 15ALC05 | |
| Asus VivoBook 15 Pro M3500QC-L1062 | |
Prestazioni del sistema
| PCMark 10 / Score | |
| Asus VivoBook 15 Pro M3500QC-L1062 | |
| HP Pavilion 15-eg | |
| Asus VivoBook S15 S533EQ-BQ002T | |
| Lenovo IdeaPad 5 15ALC05 | |
| Asus Vivobook 15 K513EQ | |
| Media Intel Core i7-1165G7, NVIDIA GeForce MX350 (4855 - 5306, n=5) | |
| Dell Inspiron 15 3501 | |
| PCMark 10 / Essentials | |
| Asus VivoBook 15 Pro M3500QC-L1062 | |
| HP Pavilion 15-eg | |
| Dell Inspiron 15 3501 | |
| Asus Vivobook 15 K513EQ | |
| Lenovo IdeaPad 5 15ALC05 | |
| Asus VivoBook S15 S533EQ-BQ002T | |
| Media Intel Core i7-1165G7, NVIDIA GeForce MX350 (8026 - 9551, n=5) | |
| PCMark 10 / Productivity | |
| HP Pavilion 15-eg | |
| Asus Vivobook 15 K513EQ | |
| Media Intel Core i7-1165G7, NVIDIA GeForce MX350 (8343 - 9071, n=5) | |
| Asus VivoBook 15 Pro M3500QC-L1062 | |
| Asus VivoBook S15 S533EQ-BQ002T | |
| Lenovo IdeaPad 5 15ALC05 | |
| Dell Inspiron 15 3501 | |
| PCMark 10 / Digital Content Creation | |
| Asus VivoBook 15 Pro M3500QC-L1062 | |
| HP Pavilion 15-eg | |
| Asus VivoBook S15 S533EQ-BQ002T | |
| Lenovo IdeaPad 5 15ALC05 | |
| Dell Inspiron 15 3501 | |
| Media Intel Core i7-1165G7, NVIDIA GeForce MX350 (4373 - 5330, n=5) | |
| Asus Vivobook 15 K513EQ | |
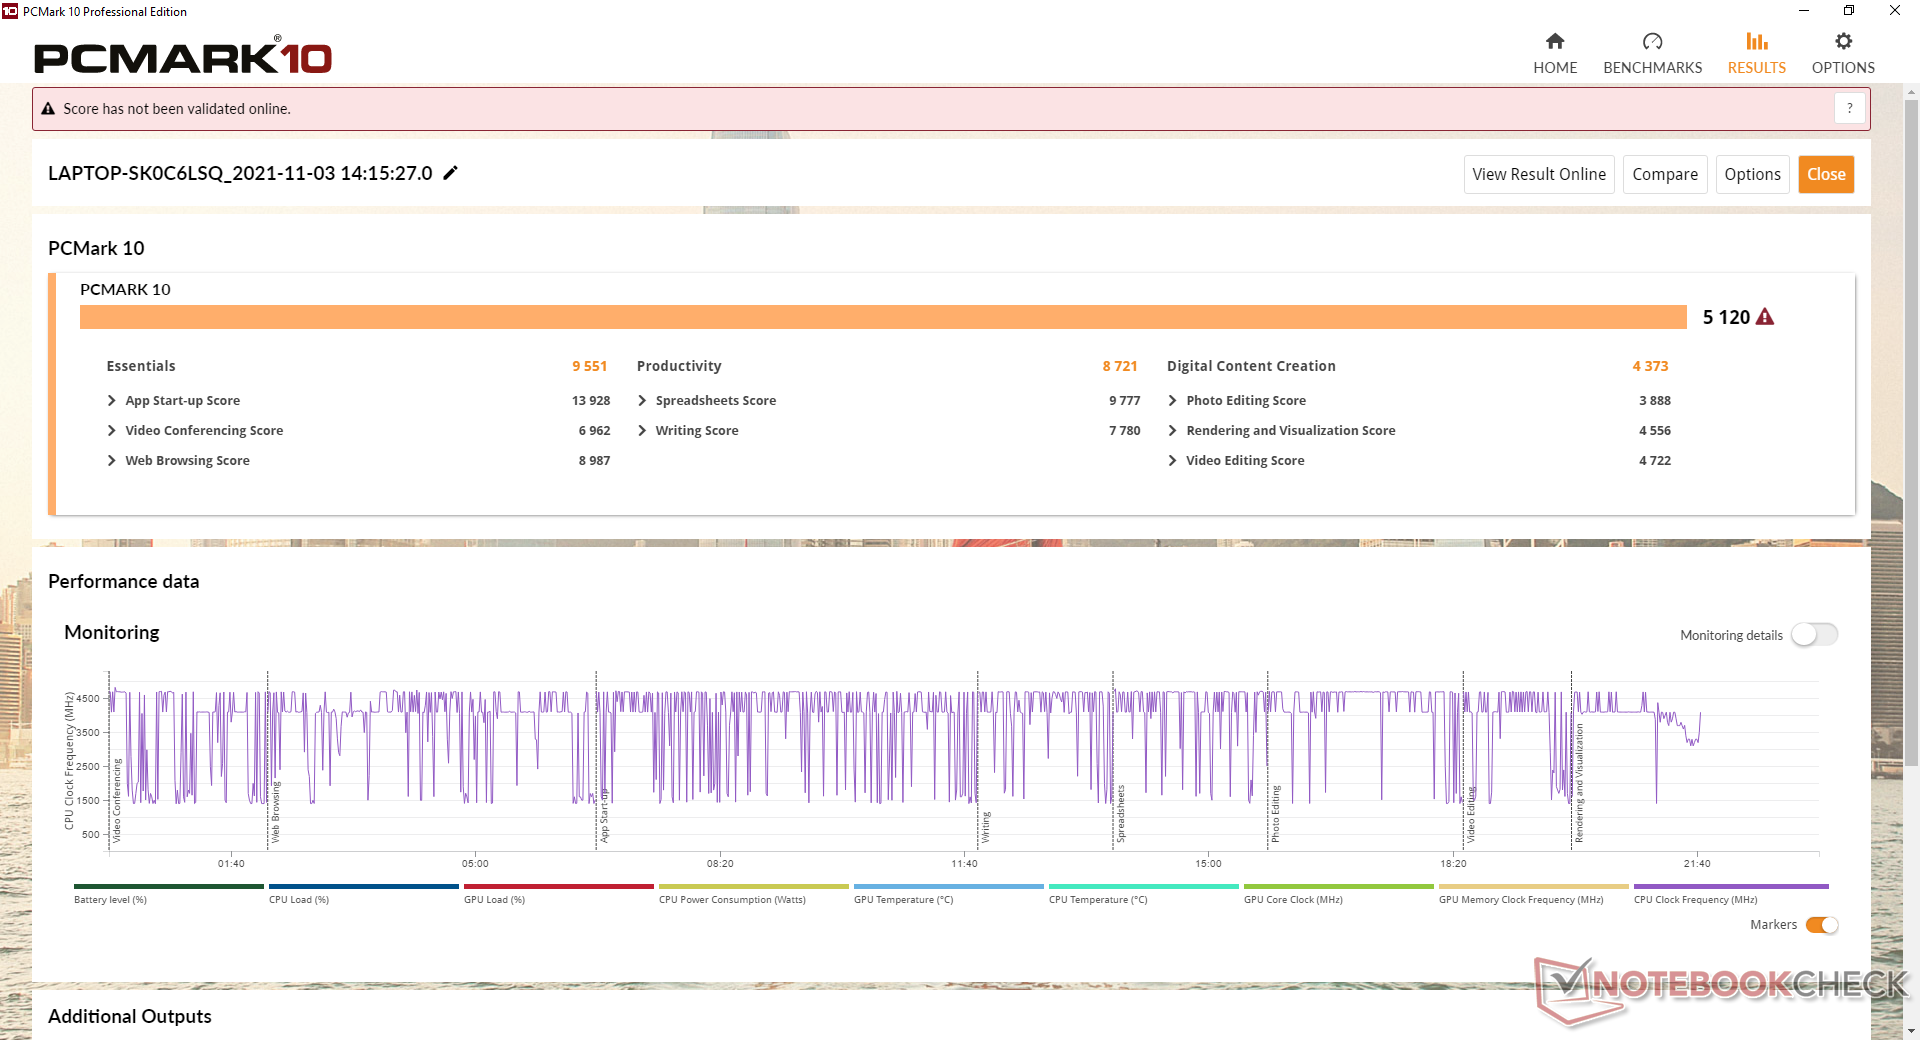
| PCMark 10 Score | 5120 punti | |
Aiuto | ||
| AIDA64 / Memory Copy | |
| Media Intel Core i7-1165G7 (20032 - 65446, n=58) | |
| HP Pavilion 15-eg | |
| Asus VivoBook 15 Pro M3500QC-L1062 | |
| Asus VivoBook S15 S533EQ-BQ002T | |
| Asus Vivobook 15 K513EQ | |
| Lenovo IdeaPad 5 15ALC05 | |
| Dell Inspiron 15 3501 | |
| AIDA64 / Memory Read | |
| Media Intel Core i7-1165G7 (23033 - 64524, n=58) | |
| HP Pavilion 15-eg | |
| Asus VivoBook 15 Pro M3500QC-L1062 | |
| Asus Vivobook 15 K513EQ | |
| Asus VivoBook S15 S533EQ-BQ002T | |
| Lenovo IdeaPad 5 15ALC05 | |
| Dell Inspiron 15 3501 | |
| AIDA64 / Memory Write | |
| Media Intel Core i7-1165G7 (21736 - 66791, n=58) | |
| HP Pavilion 15-eg | |
| Asus Vivobook 15 K513EQ | |
| Asus VivoBook S15 S533EQ-BQ002T | |
| Asus VivoBook 15 Pro M3500QC-L1062 | |
| Dell Inspiron 15 3501 | |
| Lenovo IdeaPad 5 15ALC05 | |
| AIDA64 / Memory Latency | |
| Lenovo IdeaPad 5 15ALC05 | |
| Dell Inspiron 15 3501 | |
| Asus Vivobook 15 K513EQ | |
| Asus VivoBook S15 S533EQ-BQ002T | |
| Media Intel Core i7-1165G7 (69 - 110, n=65) | |
| Asus VivoBook 15 Pro M3500QC-L1062 | |
| HP Pavilion 15-eg | |
* ... Meglio usare valori piccoli
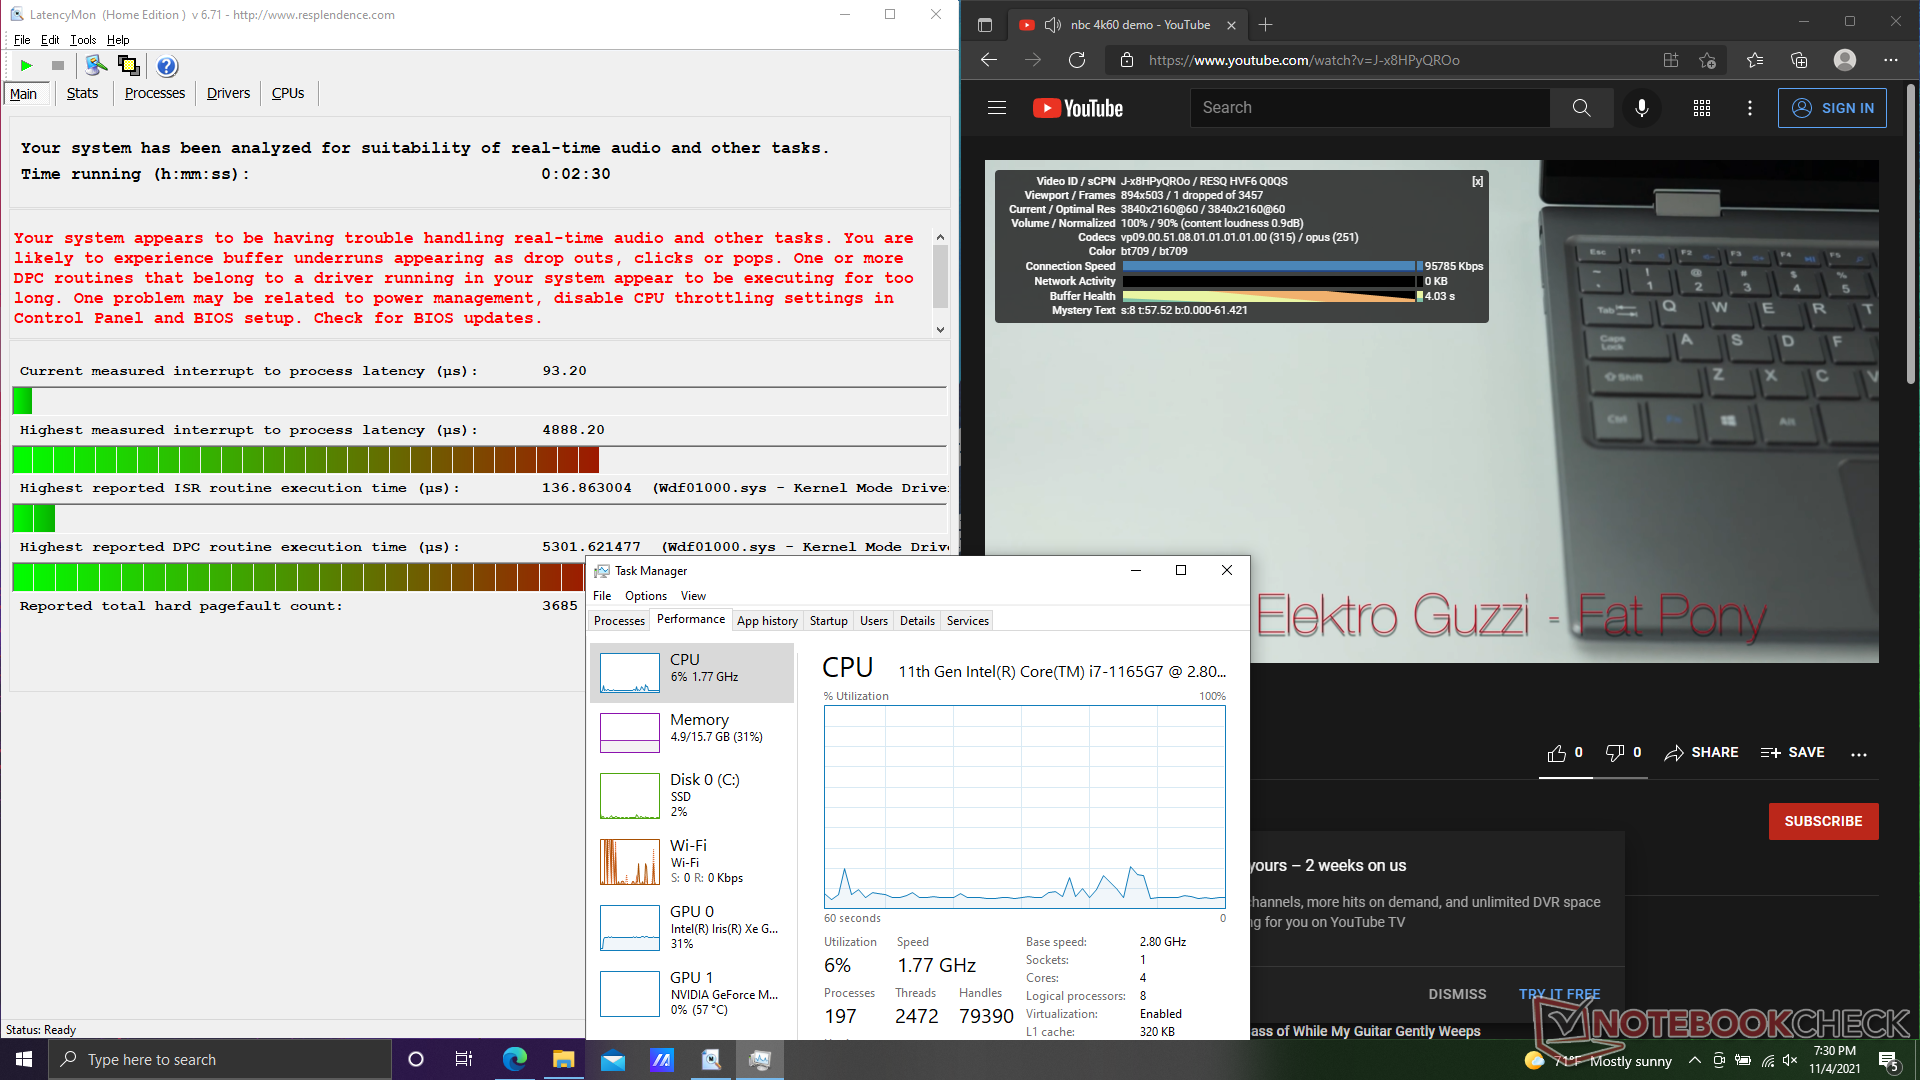
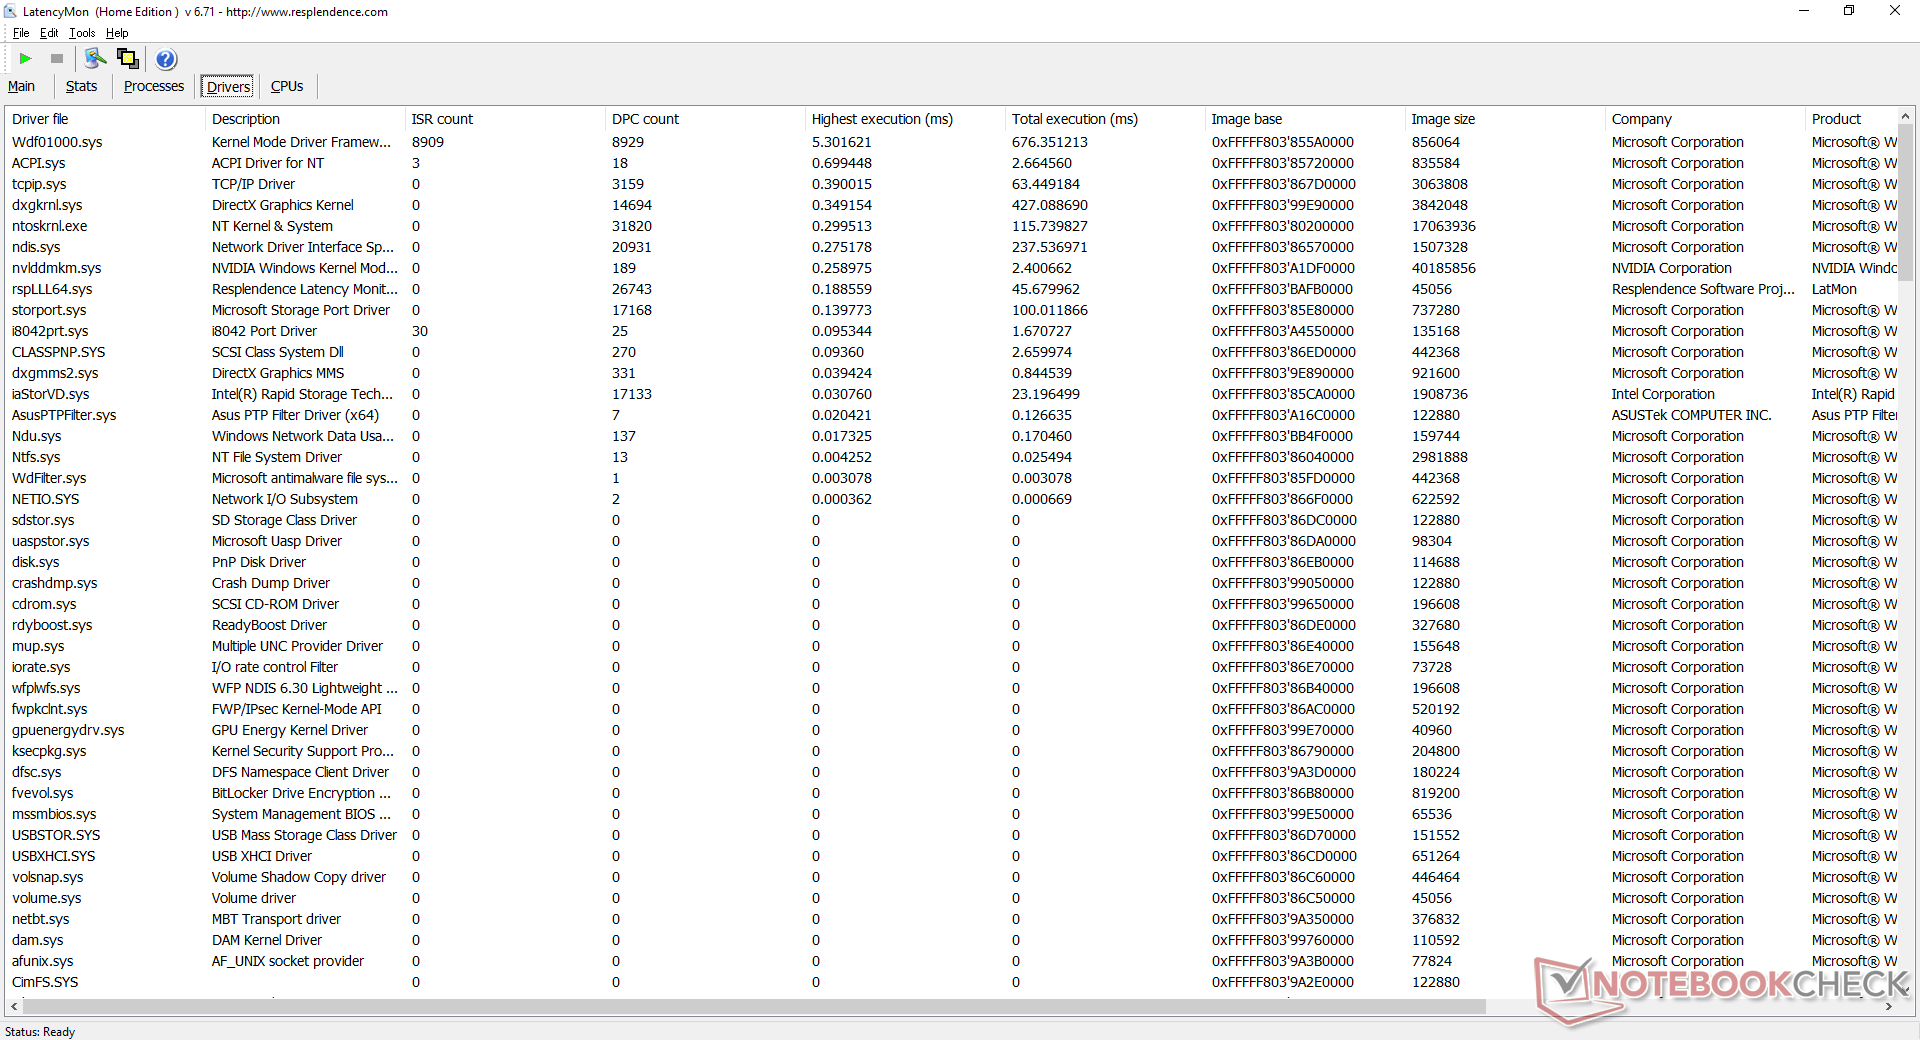
Latenza DPC
LatencyMon mostra problemi di DPC quando si aprono più schede del browser sulla nostra homepage. La riproduzione di video 4K nativi a 60 FPS è altrimenti fluida e senza problemi.
| DPC Latencies / LatencyMon - interrupt to process latency (max), Web, Youtube, Prime95 | |
| Asus Vivobook 15 K513EQ | |
| HP Pavilion 15-eg | |
| Dell Inspiron 15 3501 | |
| Lenovo IdeaPad 5 15ALC05 | |
| Asus VivoBook S15 S533EQ-BQ002T | |
| Asus VivoBook 15 Pro M3500QC-L1062 | |
* ... Meglio usare valori piccoli
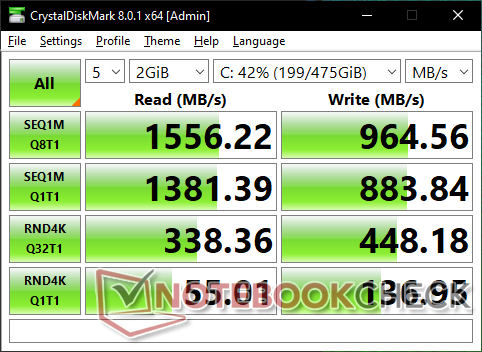
Dispositivi di archiviazione: solo spazio per un'unità
La nostra unità è configurata con un 512 GB Intel 660p SSDPEKNW512G8 PCIe3 NVMe SSD per una velocità massima teorica di lettura e scrittura di soli 1500 MB/s e 1000 MB/s, rispettivamente, che è circa 2 volte più lenta della più costosa serie Samsung PM981a. Le prestazioni saranno probabilmente sufficienti per il pubblico di destinazione, soprattutto data la CPU ULV serie U e la grafica GeForce MX con cui l'unità è accoppiata. Un diffusore di calore non è così necessario per preservare le prestazioni quando è sotto stress, dato che l'Intel 660p è solo una soluzione NVMe di fascia media.


| Drive Performance rating - Percent | |
| Asus VivoBook 15 Pro M3500QC-L1062 | |
| Dell Inspiron 15 3501 | |
| Lenovo IdeaPad 5 15ALC05 | |
| Asus VivoBook S15 S533EQ-BQ002T | |
| HP Pavilion 15-eg | |
| Asus Vivobook 15 K513EQ | |
* ... Meglio usare valori piccoli
Disk Throttling: DiskSpd Read Loop, Queue Depth 8
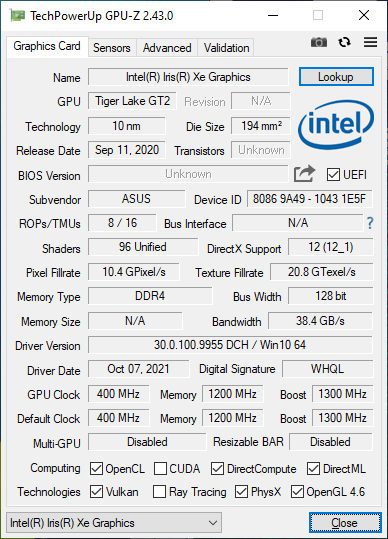
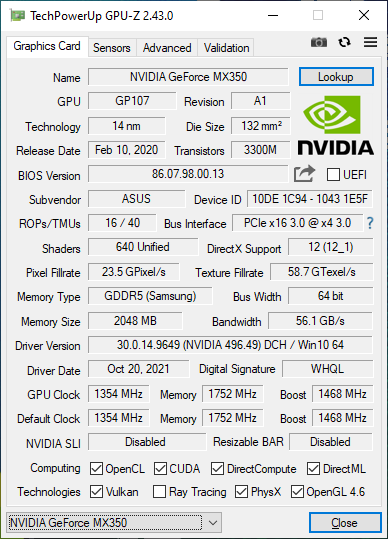
Prestazioni della GPU - Iris Xe vs. GeForce MX350
Le prestazioni grafiche sono dove ci aspettiamo che siano rispetto ad altri portatili equipaggiati con lo stesso GeForce MX350 GPU. L'integrato concorrente di Intel Iris Xe è stata costantemente migliorata nel tempo in termini di driver e supporto al gioco al punto che ora è alla pari con la GPU Nvidia nella maggior parte dei casi. GTA V e DOTA 2 Reborn sono due notevoli eccezioni in cui il nostro Vivobook alimentato da GeForce avrebbe ancora notevoli vantaggi in termini di prestazioni rispetto a Iris Xe.
L'aggiornamento dal MX330 all'MX350 aumenterà le prestazioni di circa il 15-20 per cento.
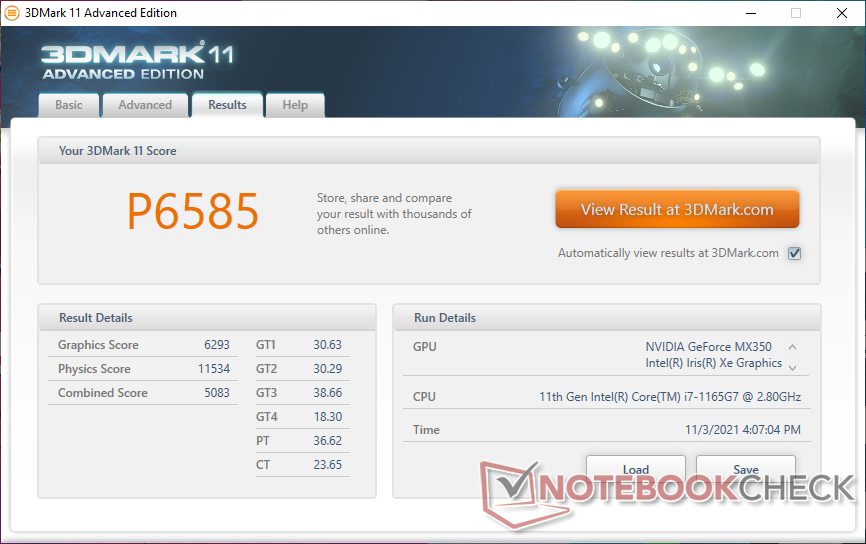
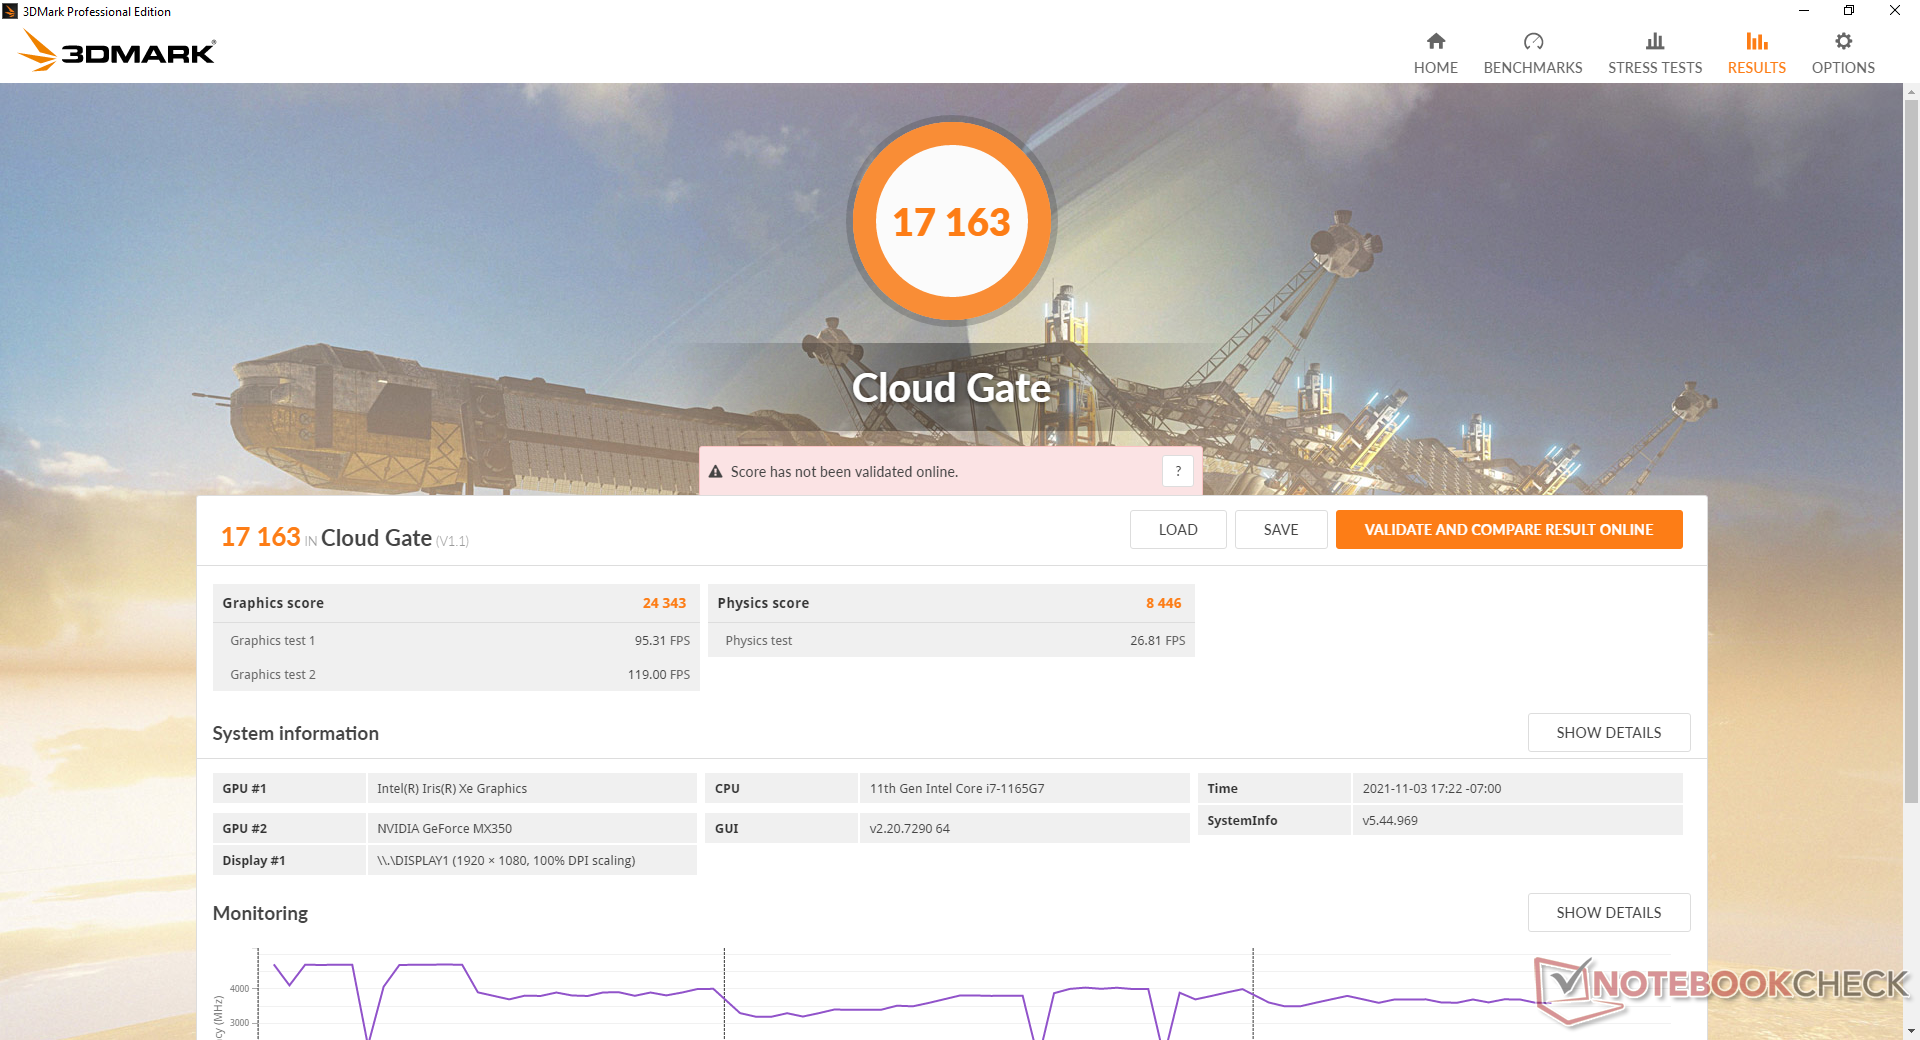
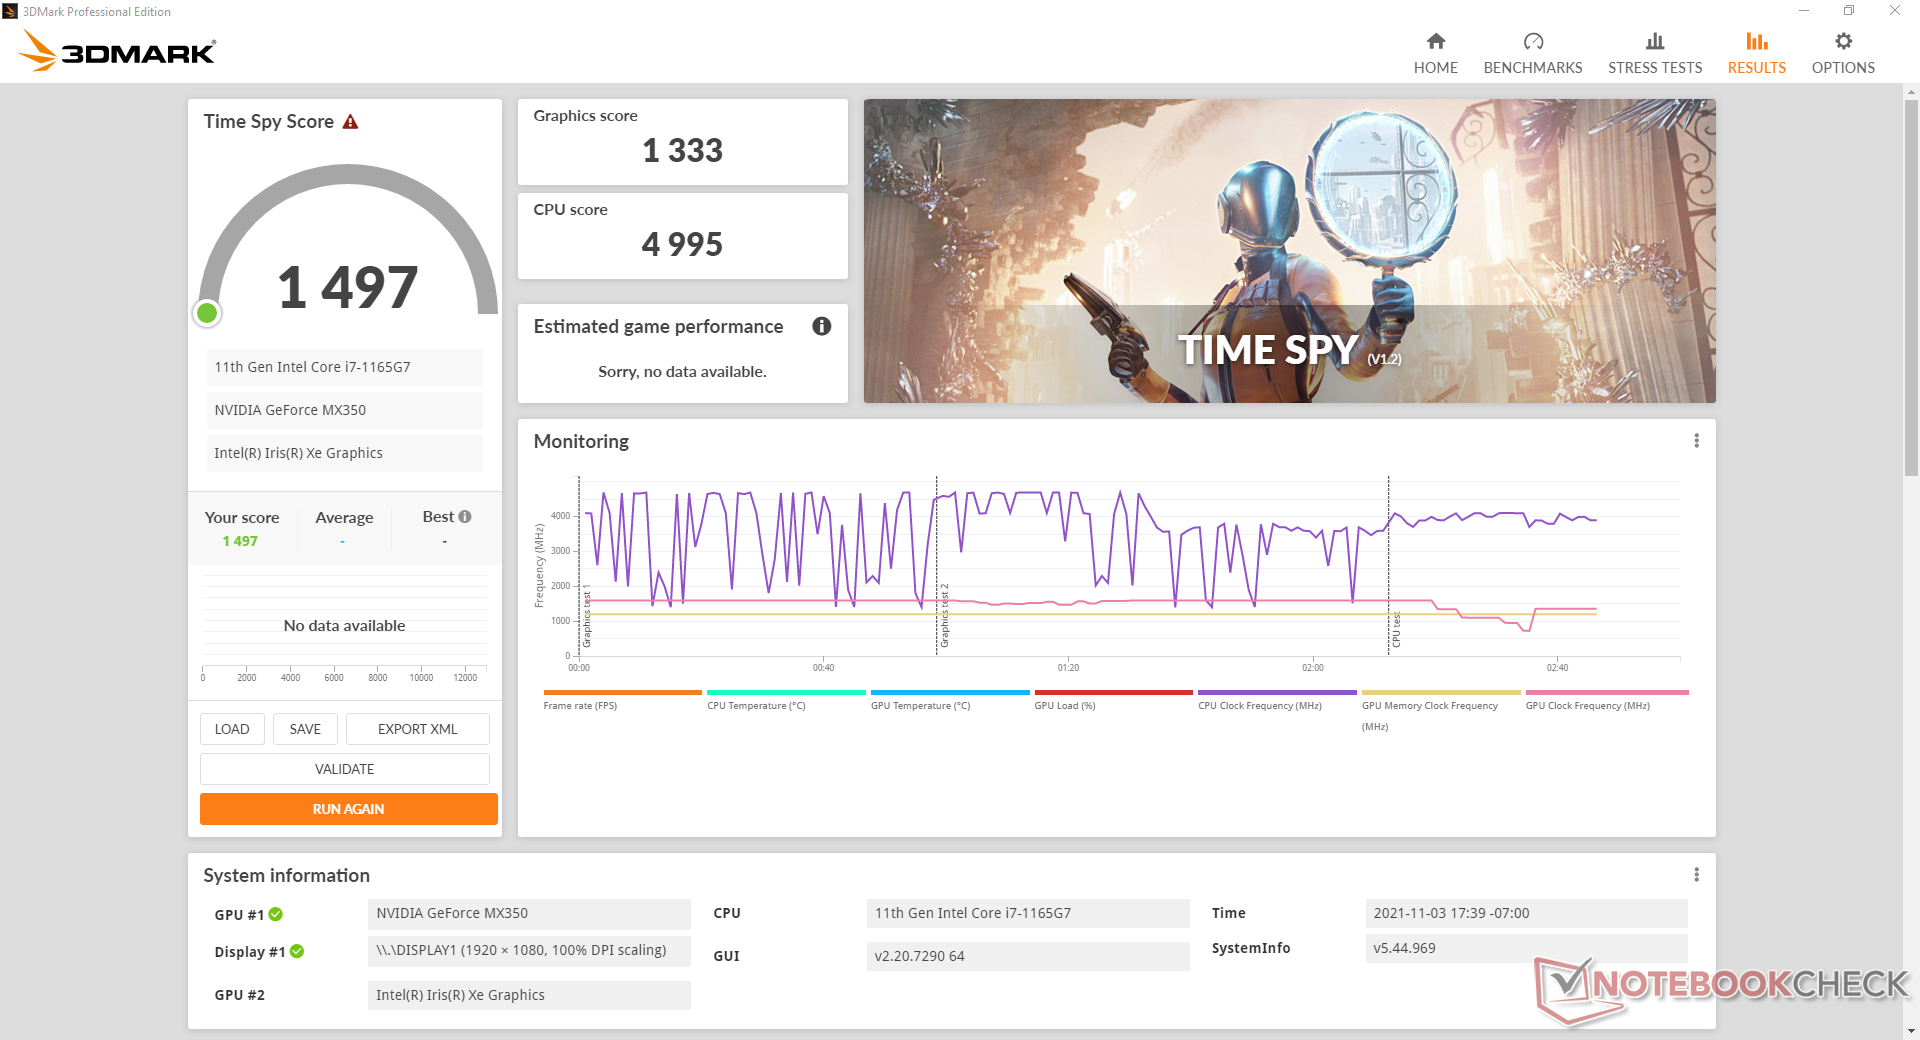
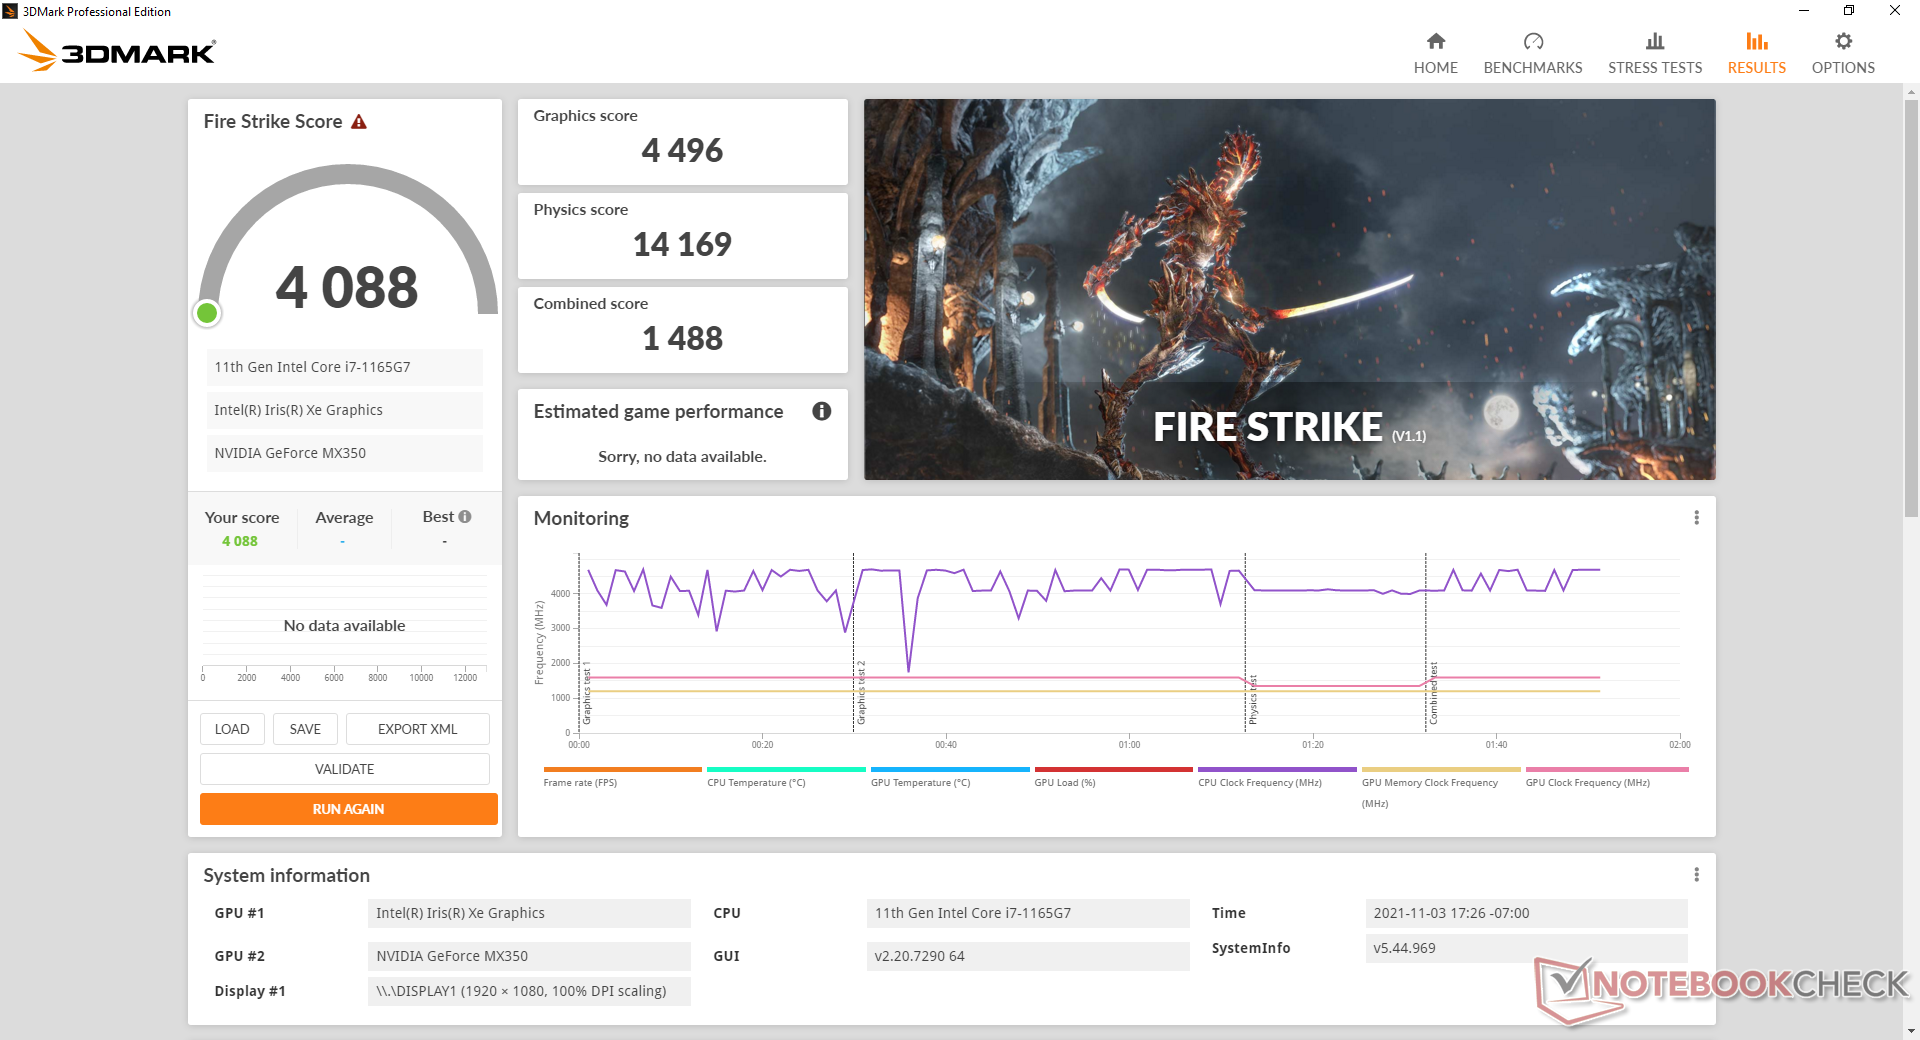
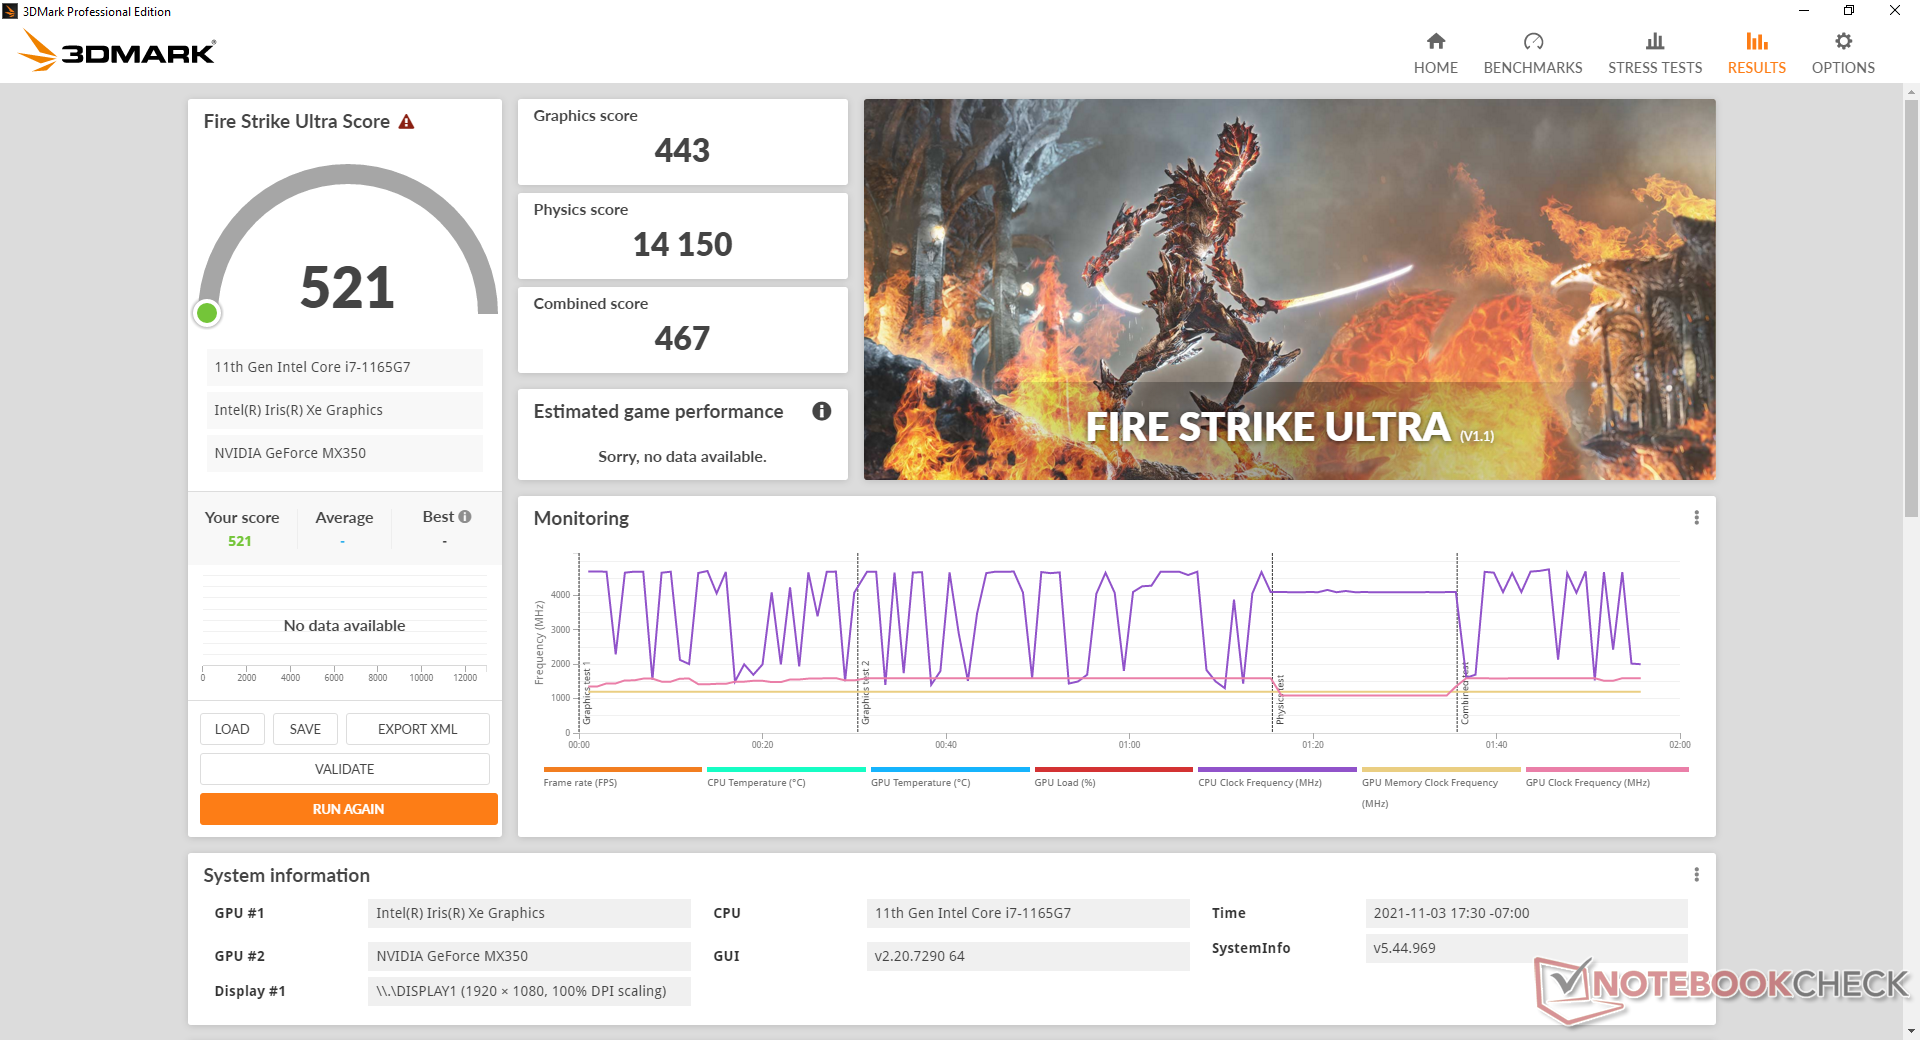
| 3DMark 11 Performance | 6585 punti | |
| 3DMark Cloud Gate Standard Score | 17163 punti | |
| 3DMark Fire Strike Score | 4088 punti | |
| 3DMark Time Spy Score | 1497 punti | |
Aiuto | ||
Witcher 3 FPS Chart
| basso | medio | alto | ultra | |
|---|---|---|---|---|
| GTA V (2015) | 141 | 115 | 45.8 | 23.7 |
| The Witcher 3 (2015) | 86 | 48.6 | 29.9 | 16.7 |
| Dota 2 Reborn (2015) | 126 | 119 | 80.4 | 73.4 |
| Final Fantasy XV Benchmark (2018) | 48.6 | 23 | 14.5 | |
| X-Plane 11.11 (2018) | 66.7 | 62.7 | 53.9 | |
| Far Cry 5 (2018) | 59 | 26 | 23 | 22 |
| Strange Brigade (2018) | 92.7 | 32.3 | 25 | 18.8 |
Emissioni - Tranquillo per la maggior parte
Rumore di sistema
La ventola interna fa un ottimo lavoro nel rimanere il più silenziosa possibile e con un comportamento pulsante minimo quando è sotto carichi di elaborazione bassi. Il rumore della ventola è generalmente a 27 dB(A) o inferiore durante la navigazione web o lo streaming video contro uno sfondo silenzioso di 23,4 dB(A). Qualche leggero rumore elettronico o fruscio della bobina sulla nostra unità di test gli impedisce di essere assolutamente silenzioso
Il rumore della ventola è legato alle tre impostazioni delle prestazioni (Whisper, Balanced, e Performance) sul software MyAsus. L'esecuzione di Witcher 3 in modalità Balanced o Performance risulterà in un rumore costante della ventola di 40.7 dB(A) o 42.9 dB(A), rispettivamente, per essere leggermente più rumoroso di molti Ultrabooks alimentati solo dalla grafica integrata. Carichi di elaborazione estremi come Prime95 e FurMark indurranno un rumore massimo della ventola ancora più forte di 47 dB(A).
Rumorosità
| Idle |
| 23.6 / 23.6 / 23.6 dB(A) |
| Sotto carico |
| 41 / 47 dB(A) |
 | ||
30 dB silenzioso 40 dB(A) udibile 50 dB(A) rumoroso |
||
min: | ||
| Asus Vivobook 15 K513EQ GeForce MX350, i7-1165G7, Intel SSD 660p SSDPEKNW512G8 | Asus VivoBook 15 Pro M3500QC-L1062 GeForce RTX 3050 4GB Laptop GPU, R5 5600H, SK Hynix HFM512GD3JX013N | Asus VivoBook S15 S533EQ-BQ002T GeForce MX350, i7-1165G7, Intel SSD 660p 1TB SSDPEKNW010T8 | Lenovo IdeaPad 5 15ALC05 Vega 7, R5 5500U | Dell Inspiron 15 3501 Iris Xe G7 96EUs, i7-1165G7, Samsung PM991a MZ9LQ512HBLU-00BD1 | HP Pavilion 15-eg GeForce MX450, i7-1165G7, Samsung PM991 MZVLQ1T0HALB | |
|---|---|---|---|---|---|---|
| Noise | -3% | -0% | -4% | -1% | -1% | |
| off /ambiente * (dB) | 23.4 | 24.8 -6% | 25 -7% | 26 -11% | 26 -11% | 25.4 -9% |
| Idle Minimum * (dB) | 23.6 | 24.8 -5% | 25 -6% | 26 -10% | 26 -10% | 25.6 -8% |
| Idle Average * (dB) | 23.6 | 24.8 -5% | 25 -6% | 26 -10% | 26 -10% | 25.6 -8% |
| Idle Maximum * (dB) | 23.6 | 26.4 -12% | 25 -6% | 26 -10% | 26 -10% | 25.6 -8% |
| Load Average * (dB) | 41 | 42.8 -4% | 39.5 4% | 42.6 -4% | 35.9 12% | 39.2 4% |
| Witcher 3 ultra * (dB) | 42.9 | 42.8 -0% | 39.3 8% | 39.1 9% | ||
| Load Maximum * (dB) | 47 | 42.8 9% | 41.6 11% | 37.4 20% | 35.8 24% | 41.5 12% |
* ... Meglio usare valori piccoli
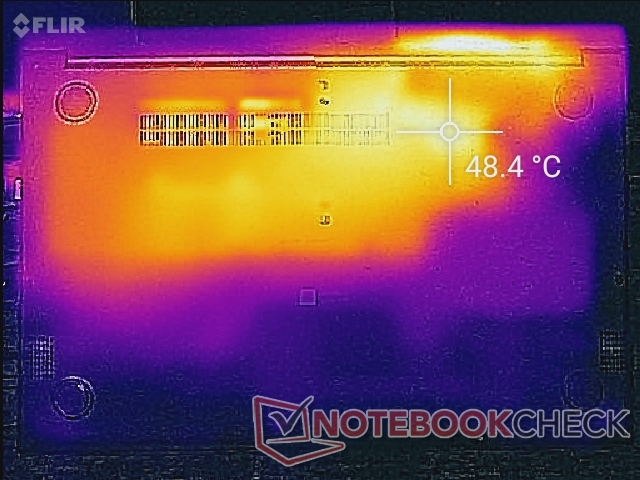
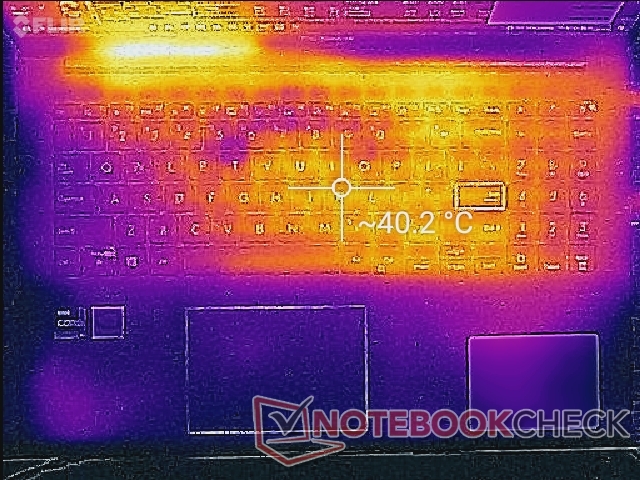
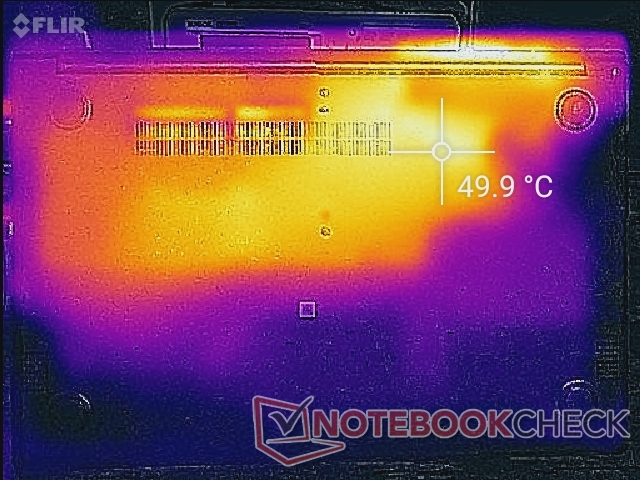
Temperatura
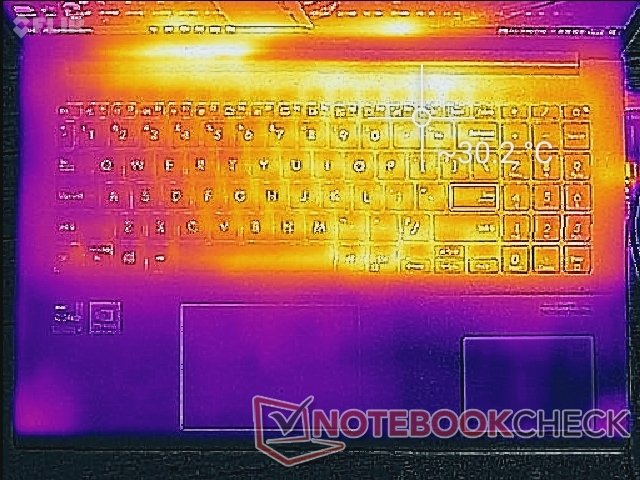
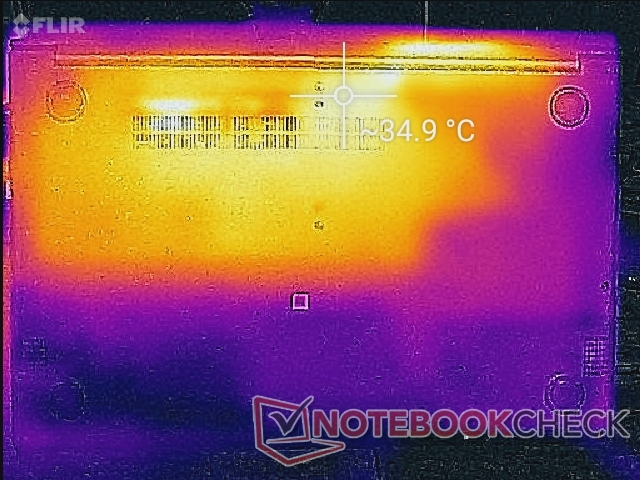
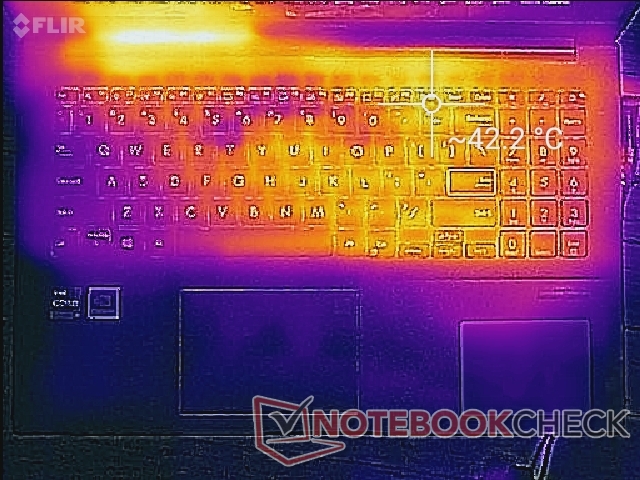
La metà destra del portatile sarà sempre più calda della metà sinistra a causa del design della soluzione di raffreddamento interna. I punti caldi sulla tastiera possono essere caldi fino a 42 C quando si gioca, il che è paragonabile al HP Pavilion 15 dotato di grafica integrata Iris Xe. La parte inferiore, tuttavia, può essere ancora più calda a quasi 50 C vicino alla parte posteriore.
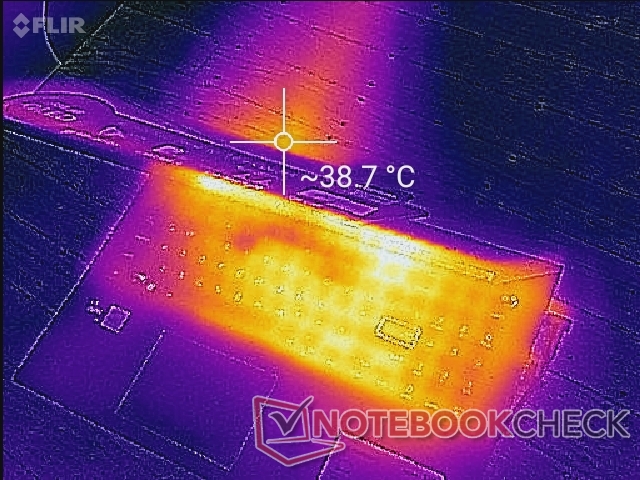
(-) La temperatura massima sul lato superiore è di 48.8 °C / 120 F, rispetto alla media di 36.8 °C / 98 F, che varia da 21 a 71 °C per questa classe Multimedia.
(±) Il lato inferiore si riscalda fino ad un massimo di 42 °C / 108 F, rispetto alla media di 39.1 °C / 102 F
(+) In idle, la temperatura media del lato superiore è di 25.6 °C / 78 F, rispetto alla media deld ispositivo di 31.3 °C / 88 F.
(±) Riproducendo The Witcher 3, la temperatura media per il lato superiore e' di 33.9 °C / 93 F, rispetto alla media del dispositivo di 31.3 °C / 88 F.
(+) I poggiapolsi e il touchpad sono piu' freddi della temperatura della pelle con un massimo di 28.2 °C / 82.8 F e sono quindi freddi al tatto.
(±) La temperatura media della zona del palmo della mano di dispositivi simili e'stata di 28.7 °C / 83.7 F (+0.5 °C / 0.9 F).
| Asus Vivobook 15 K513EQ Intel Core i7-1165G7, NVIDIA GeForce MX350 | Asus VivoBook 15 Pro M3500QC-L1062 AMD Ryzen 5 5600H, NVIDIA GeForce RTX 3050 4GB Laptop GPU | Asus VivoBook S15 S533EQ-BQ002T Intel Core i7-1165G7, NVIDIA GeForce MX350 | Lenovo IdeaPad 5 15ALC05 AMD Ryzen 5 5500U, AMD Radeon RX Vega 7 | Dell Inspiron 15 3501 Intel Core i7-1165G7, Intel Iris Xe Graphics G7 96EUs | HP Pavilion 15-eg Intel Core i7-1165G7, NVIDIA GeForce MX450 | |
|---|---|---|---|---|---|---|
| Heat | 14% | 16% | 12% | 8% | 3% | |
| Maximum Upper Side * (°C) | 48.8 | 37.8 23% | 38.1 22% | 40.5 17% | 45.6 7% | 44 10% |
| Maximum Bottom * (°C) | 42 | 48.4 -15% | 41.3 2% | 42 -0% | 41 2% | 53.4 -27% |
| Idle Upper Side * (°C) | 30 | 24 20% | 24.5 18% | 26.5 12% | 28.2 6% | 27.4 9% |
| Idle Bottom * (°C) | 35 | 25.1 28% | 26.8 23% | 29 17% | 29.1 17% | 28.8 18% |
* ... Meglio usare valori piccoli
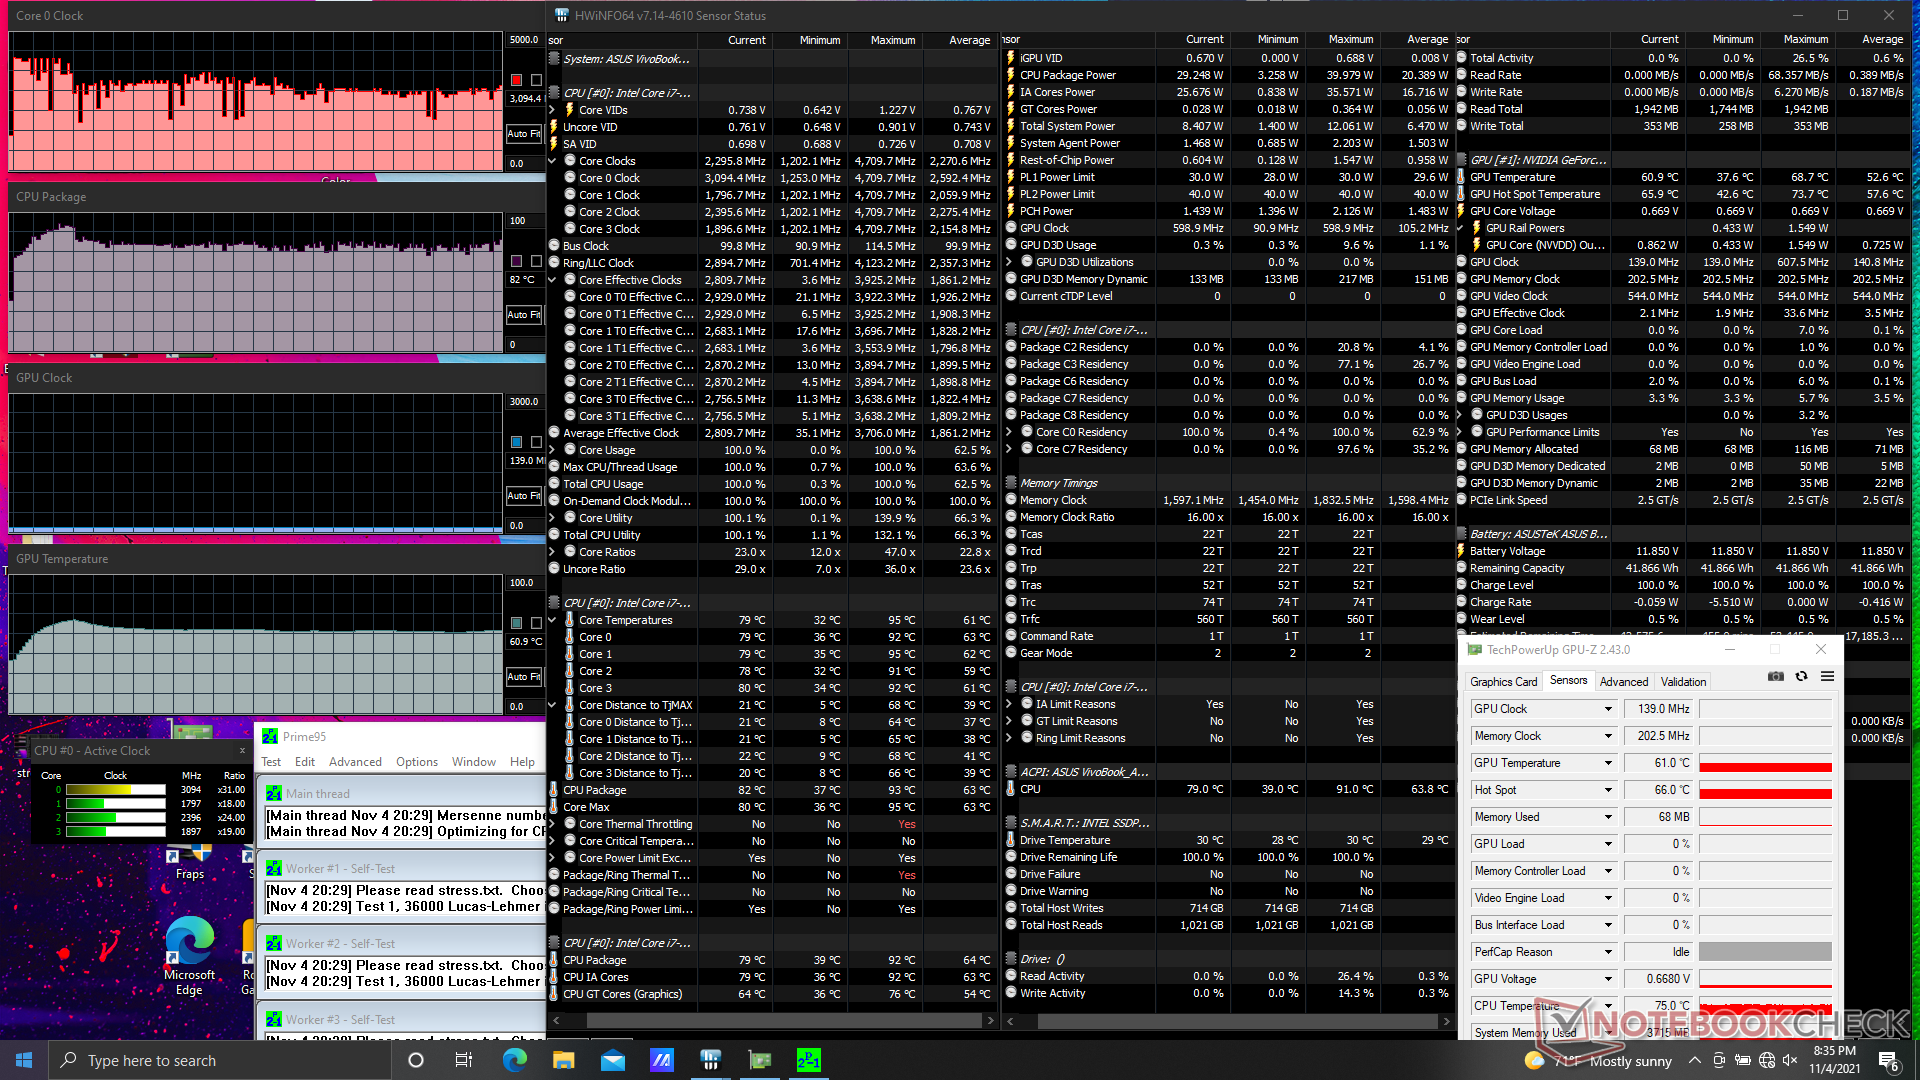
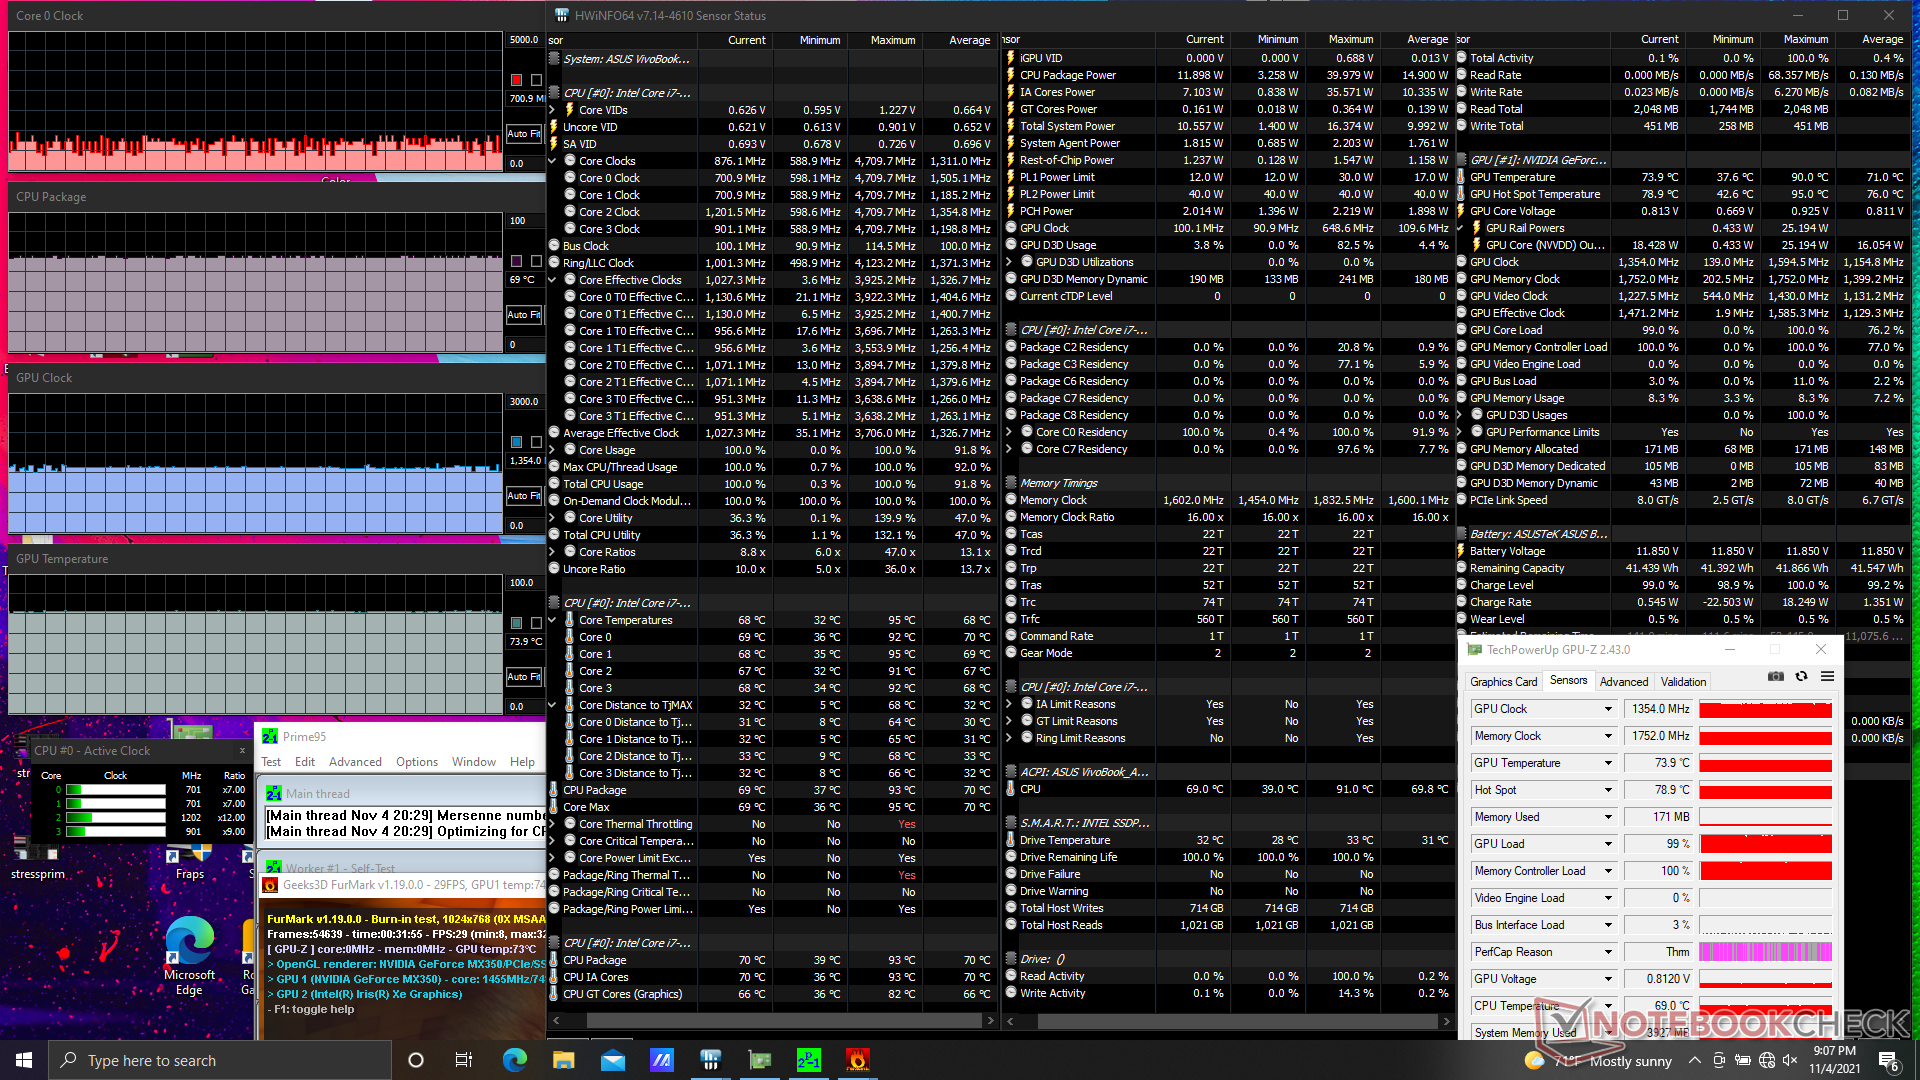
Test di stress
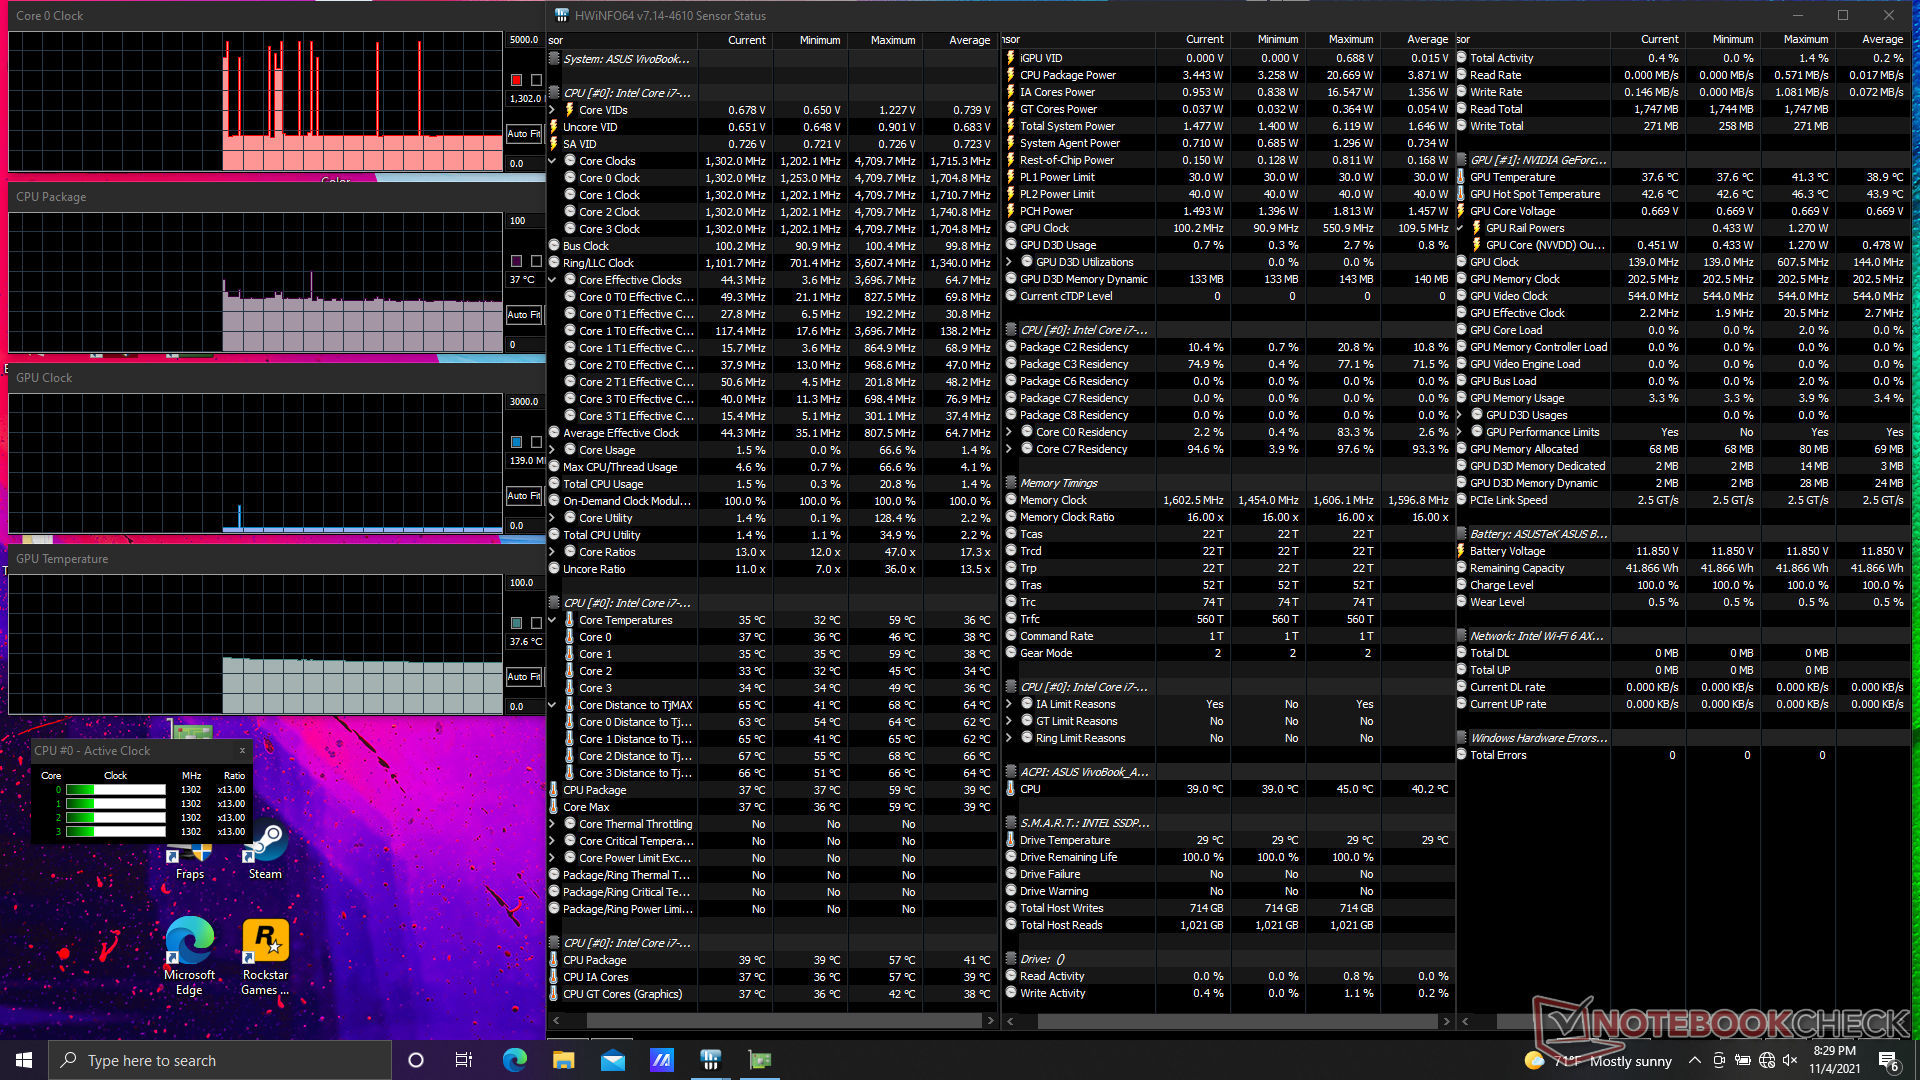
Quando stressato sotto Prime95, la CPU aumenterebbe a 4.1 GHz per i primi 30 secondi o giù di lì fino a raggiungere una temperatura del core di 91 C. Le frequenze di clock scenderebbero poi sotto i 3.1 GHz per mantenere una temperatura del core più fredda di 78 C. Il Notebook Quadroche usa la stessa CPU Core i7-1165G7, si stabilizzerebbe ad una temperatura leggermente più alta di 82 C quando sottoposto a carichi simili.
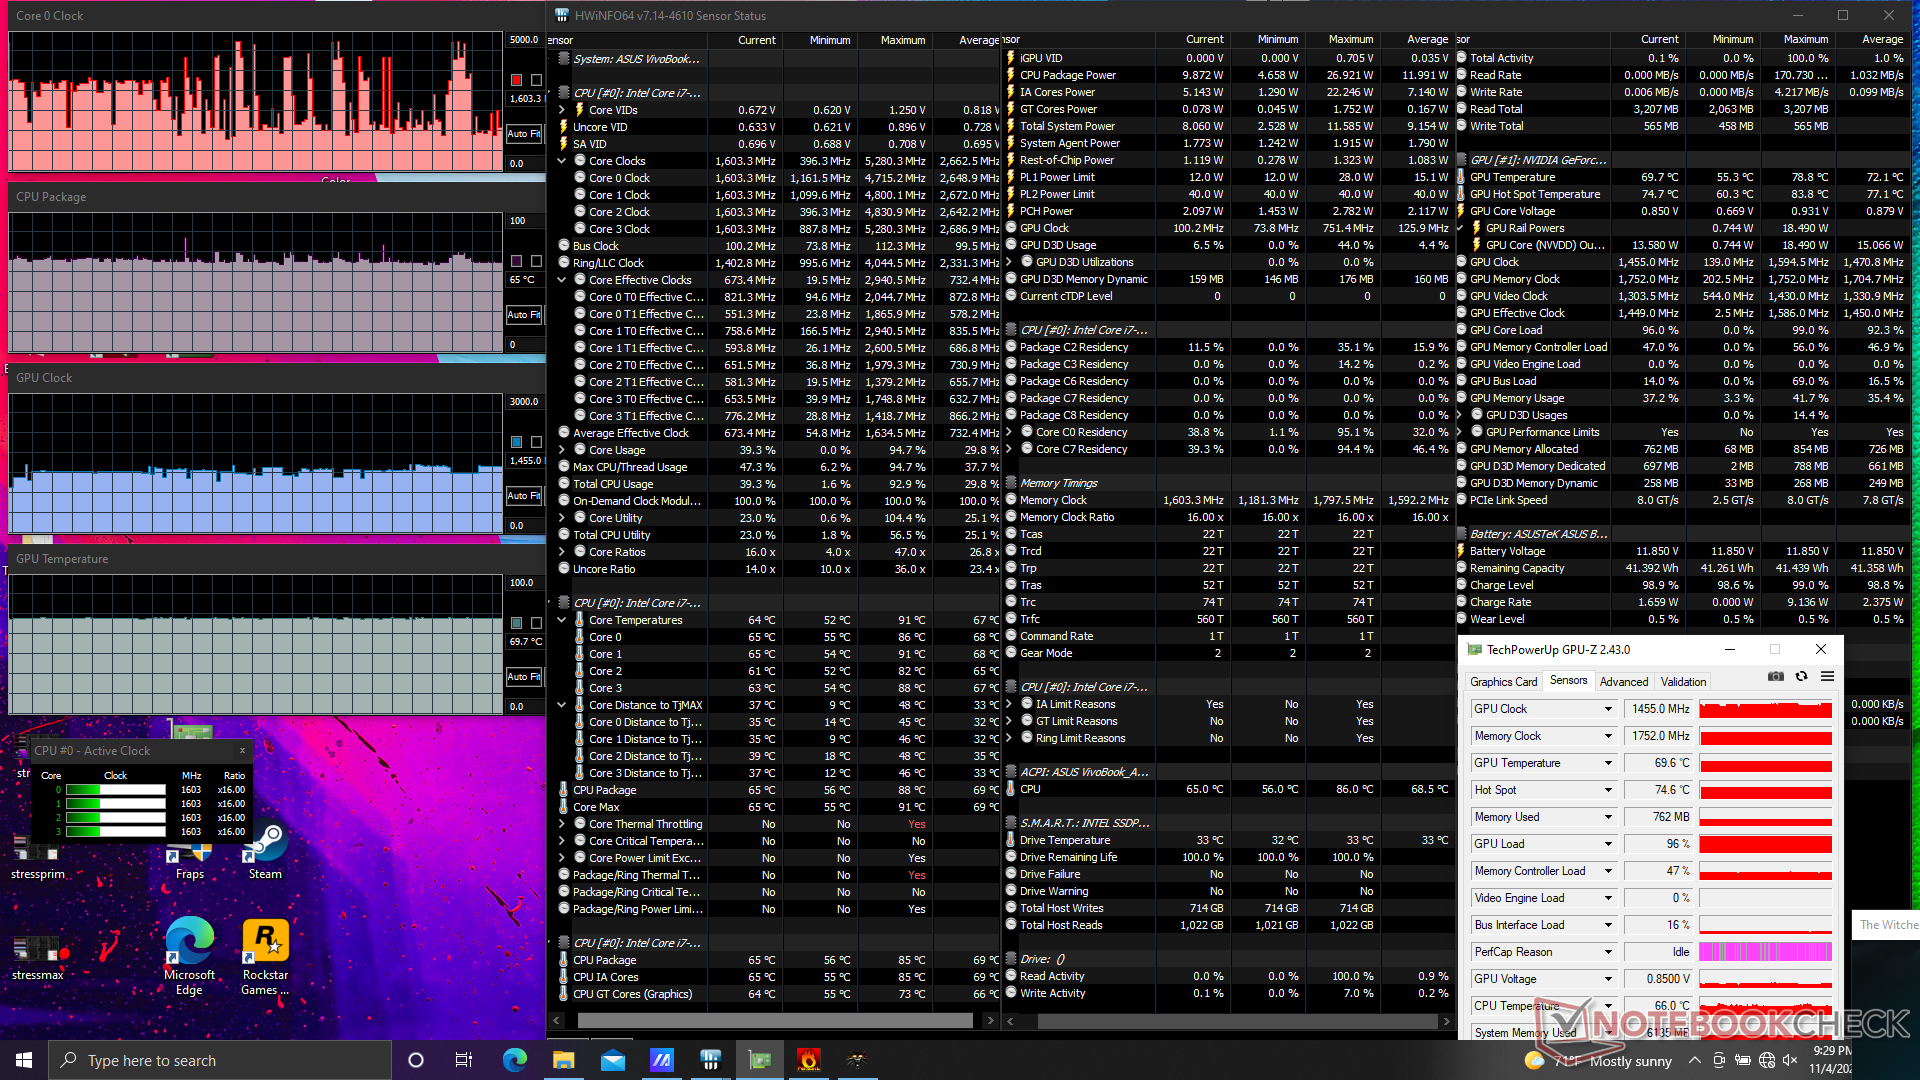
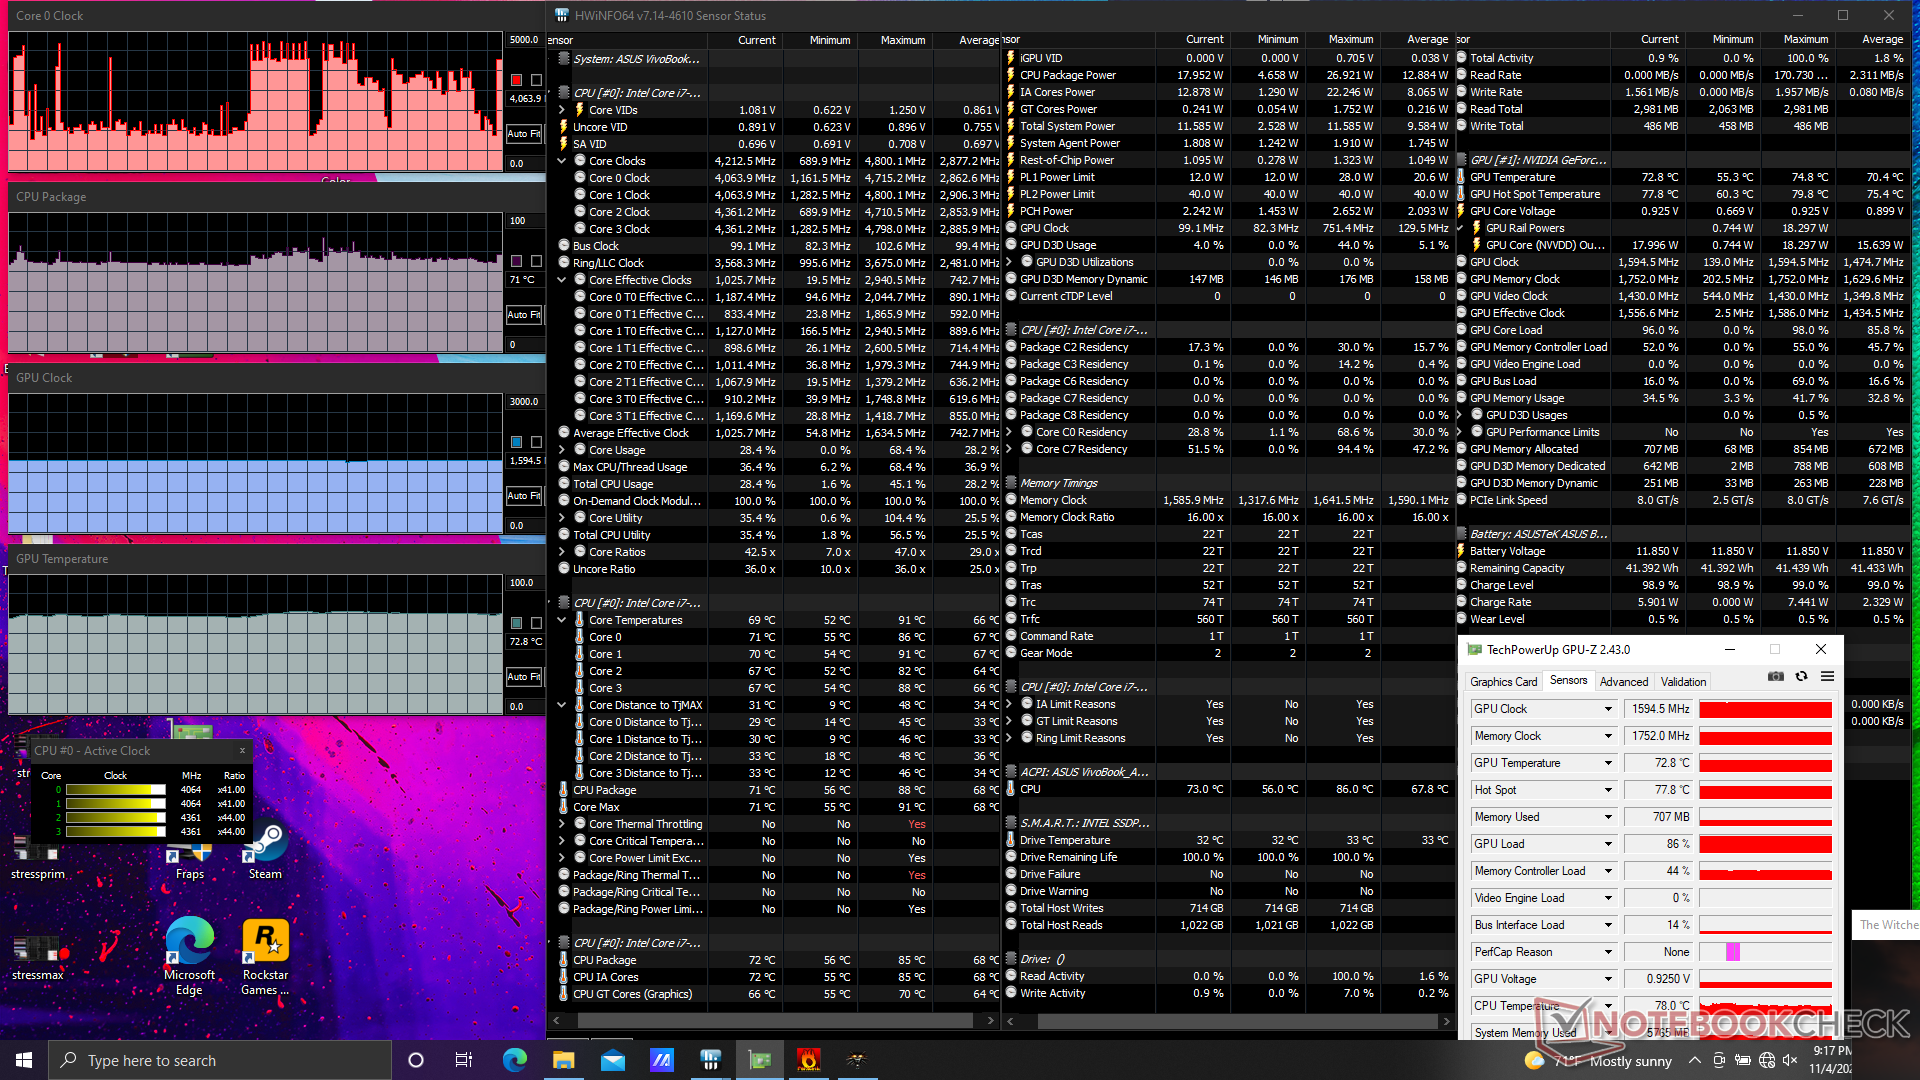
L'esecuzione in modalità Performance porta a prestazioni grafiche leggermente più veloci. La frequenza di clock della GPU sarebbe tra 1100 e 1455 MHz quando si esegue Witcher 3 in modalità bilanciata rispetto a un costante 1595 MHz quando si esegue lo stesso gioco in modalità Performance. Così, gli utenti devono far fronte al rumore della ventola più forte associato alla modalità Performance se vogliono sfruttare il portatile al massimo.
Il funzionamento a batterie avrà un impatto sulle prestazioni. Un test 3DMark 11 a batterie restituirebbe punteggi di Fisica e Grafica di 8064 e 6075 punti, rispettivamente, rispetto a 11534 e 6293 punti quando è in funzione.
| Clock della CPU (GHz)Clock della GPU(MHz)Temperatura media dellaCPU (°C)Temperaturamedia dellaGPU (°C) |
| Sistema inattivo |
| StressPrime95 |
| Stress Prime95 + FurMark |
| Witcher 3 Stress (modalità bilanciata) |
| Witcher 3 Stress (modalità Performance) |
Altoparlanti
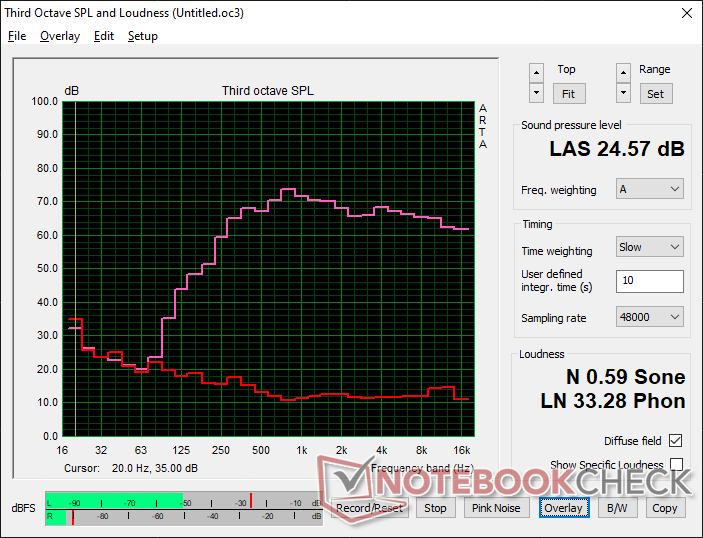
Asus Vivobook 15 K513EQ analisi audio
(±) | potenza degli altiparlanti media ma buona (80.8 dB)
Bassi 100 - 315 Hz
(-) | quasi nessun basso - in media 15.3% inferiori alla media
(±) | la linearità dei bassi è media (13% delta rispetto alla precedente frequenza)
Medi 400 - 2000 Hz
(+) | medi bilanciati - solo only 4.2% rispetto alla media
(+) | medi lineari (3.8% delta rispetto alla precedente frequenza)
Alti 2 - 16 kHz
(+) | Alti bilanciati - appena 0.8% dalla media
(+) | alti lineari (2.3% delta rispetto alla precedente frequenza)
Nel complesso 100 - 16.000 Hz
(+) | suono nel complesso lineare (12.5% differenza dalla media)
Rispetto alla stessa classe
» 24% di tutti i dispositivi testati in questa classe è stato migliore, 3% simile, 73% peggiore
» Il migliore ha avuto un delta di 5%, medio di 17%, peggiore di 45%
Rispetto a tutti i dispositivi testati
» 11% di tutti i dispositivi testati in questa classe è stato migliore, 2% similare, 87% peggiore
» Il migliore ha avuto un delta di 4%, medio di 24%, peggiore di 134%
Apple MacBook 12 (Early 2016) 1.1 GHz analisi audio
(+) | gli altoparlanti sono relativamente potenti (83.6 dB)
Bassi 100 - 315 Hz
(±) | bassi ridotti - in media 11.3% inferiori alla media
(±) | la linearità dei bassi è media (14.2% delta rispetto alla precedente frequenza)
Medi 400 - 2000 Hz
(+) | medi bilanciati - solo only 2.4% rispetto alla media
(+) | medi lineari (5.5% delta rispetto alla precedente frequenza)
Alti 2 - 16 kHz
(+) | Alti bilanciati - appena 2% dalla media
(+) | alti lineari (4.5% delta rispetto alla precedente frequenza)
Nel complesso 100 - 16.000 Hz
(+) | suono nel complesso lineare (10.2% differenza dalla media)
Rispetto alla stessa classe
» 7% di tutti i dispositivi testati in questa classe è stato migliore, 2% simile, 91% peggiore
» Il migliore ha avuto un delta di 5%, medio di 18%, peggiore di 53%
Rispetto a tutti i dispositivi testati
» 5% di tutti i dispositivi testati in questa classe è stato migliore, 1% similare, 94% peggiore
» Il migliore ha avuto un delta di 4%, medio di 24%, peggiore di 134%
Gestione dell'energia
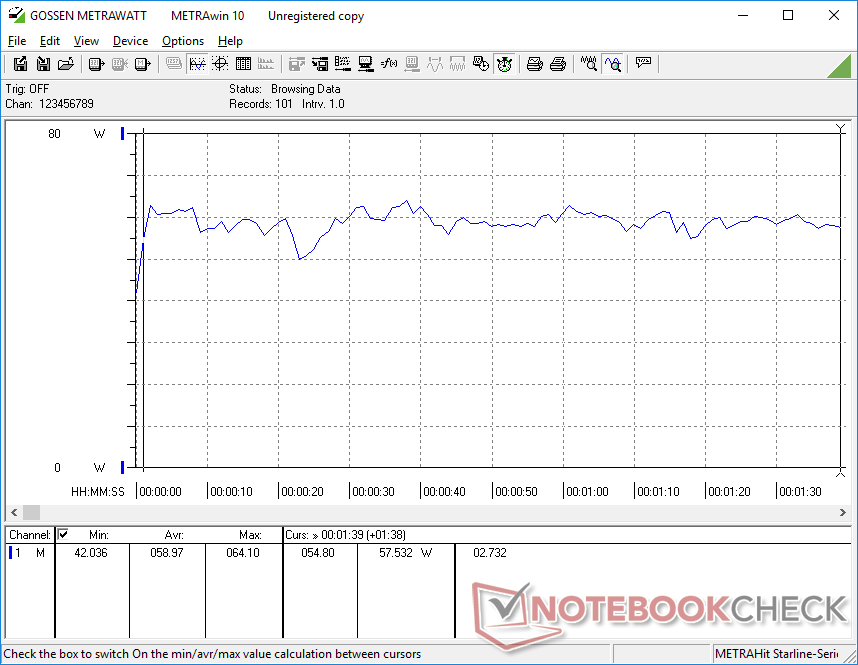
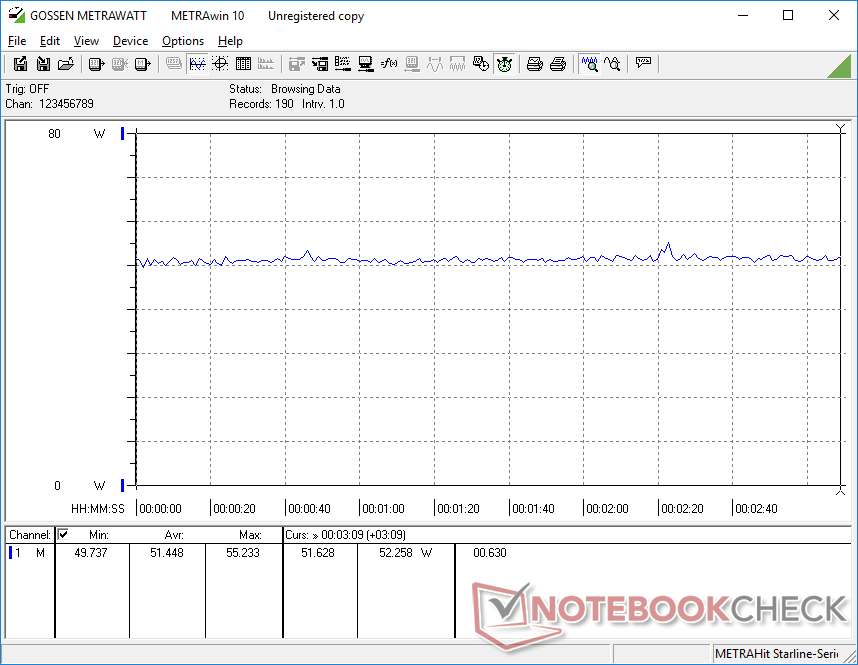
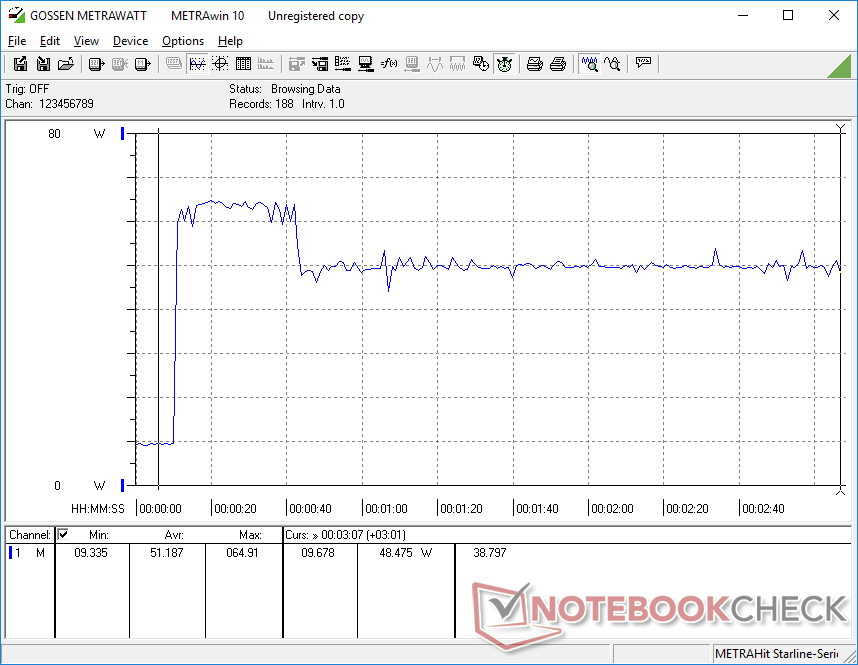
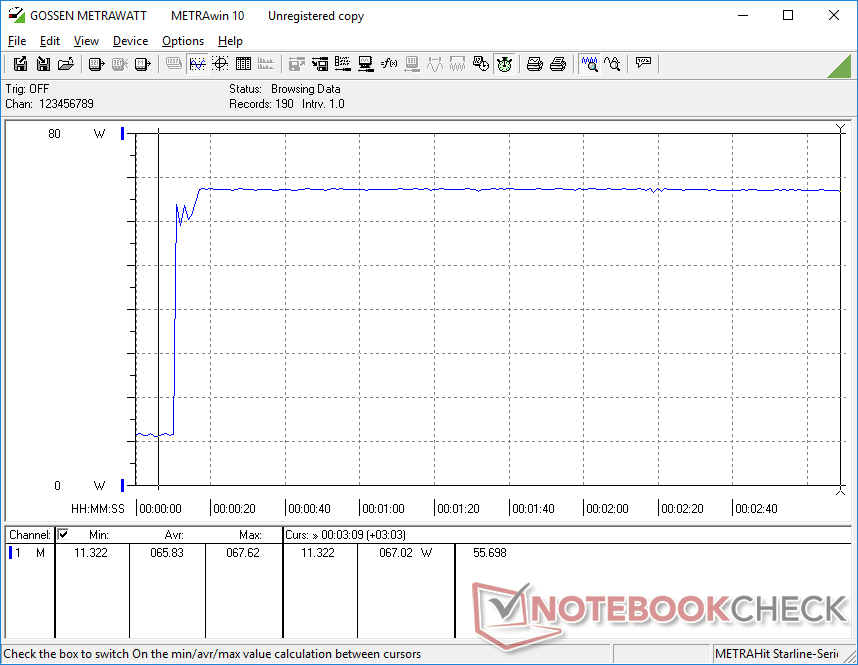
Consumo energetico - Richieste più elevate a causa della GPU Nvidia
L'inattività sul desktop consuma da 3 W a 9 W a seconda dell'impostazione della luminosità e del profilo energetico. Il consumo di energia dipende anche dai colori che vengono visualizzati poiché la nostra unità utilizza un pannello OLED come dettagliato dai nostri risultati qui.
L'esecuzione di carichi più elevati come i giochi consuma tra 51 W e 59 W rispetto a circa 40 W ciascuno sul Lenovo IdeaPad 5 15ALC05 alimentato da AMD o Iris XeDell Inspiron 15 3501. La GPU Nvidia discreta è più responsabile del notevole aumento del 48 per cento nel consumo di energia rispetto ad altri Ultrabooks alimentati solo da grafica integrata. Naturalmente, i proprietari beneficeranno anche delle prestazioni più affidabili e generalmente più veloci di GeForce MX350.
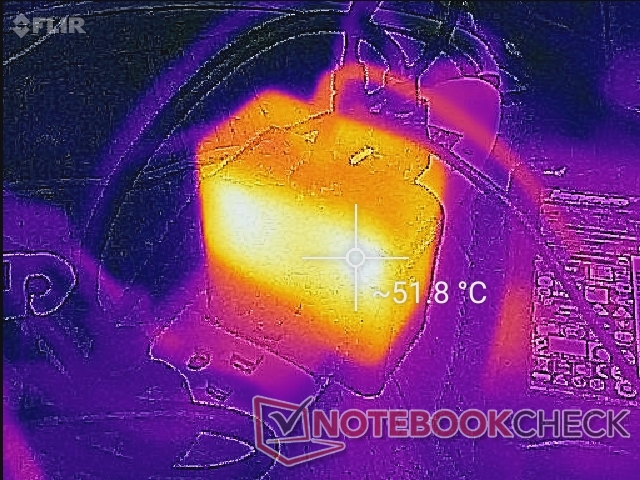
Siamo in grado di registrare un massimo di 67,6 W durante l'esecuzione di carichi estremi Prime95 e FurMark. Il piccolo adattatore (~6.4 x 6.4 x 3 cm) è valutato solo per 65 W, il che significa che il tasso di carica della batteria rallenterà a un passo se si eseguono carichi così elevati. Il sistema avrebbe potuto potenzialmente beneficiare di un adattatore AC più grande e più capace.
| Off / Standby | |
| Idle | |
| Sotto carico |
|
Leggenda:
min: | |
| Asus Vivobook 15 K513EQ i7-1165G7, GeForce MX350, Intel SSD 660p SSDPEKNW512G8, OLED, 1920x1080, 15.6" | Asus VivoBook 15 Pro M3500QC-L1062 R5 5600H, GeForce RTX 3050 4GB Laptop GPU, SK Hynix HFM512GD3JX013N, AMOLED, 1920x1080, 15.6" | Asus VivoBook S15 S533EQ-BQ002T i7-1165G7, GeForce MX350, Intel SSD 660p 1TB SSDPEKNW010T8, IPS, 1920x1080, 15.6" | Lenovo IdeaPad 5 15ALC05 R5 5500U, Vega 7, , IPS, 1920x1080, 15.6" | Dell Inspiron 15 3501 i7-1165G7, Iris Xe G7 96EUs, Samsung PM991a MZ9LQ512HBLU-00BD1, IPS, 1920x1080, 15.6" | HP Pavilion 15-eg i7-1165G7, GeForce MX450, Samsung PM991 MZVLQ1T0HALB, IPS, 1920x1080, 15.6" | |
|---|---|---|---|---|---|---|
| Power Consumption | -33% | 7% | 9% | 20% | -20% | |
| Idle Minimum * (Watt) | 3.7 | 4.7 -27% | 3 19% | 3.7 -0% | 3.6 3% | 4.9 -32% |
| Idle Average * (Watt) | 6.3 | 9.4 -49% | 6.4 -2% | 7.9 -25% | 6.4 -2% | 7.9 -25% |
| Idle Maximum * (Watt) | 9.7 | 10 -3% | 7.9 19% | 9.3 4% | 7.9 19% | 14.2 -46% |
| Load Average * (Watt) | 59 | 74.3 -26% | 59 -0% | 41 31% | 39 34% | 64.3 -9% |
| Witcher 3 ultra * (Watt) | 51.4 | 67.7 -32% | 48 7% | 41 20% | 37.6 27% | 55.6 -8% |
| Load Maximum * (Watt) | 67.7 | 106.9 -58% | 68 -0% | 52.2 23% | 41.8 38% | 65.4 3% |
* ... Meglio usare valori piccoli
Power Consumption Witcher 3 / Stresstest
Durata della batteria - Piccola capacità significa tempi di esecuzione più brevi
La capacità della batteria è ridotta a soli 41 Wh rispetto ai 71 Wh del più costoso ZenBook 15. I tempi di esecuzione sono solo nella media con circa 6 ore di utilizzo nel mondo reale WLAN, mentre il già citato ZenBook può raggiungere oltre 12 ore con carichi simili. Come sistema economico, tuttavia, 6 ore sono paragonabili a modelli come l'HP Pavilion 15 o Dell Inspiron 15.
La ricarica da vuoto a pieno richiede poco meno di 90 minuti.
| Asus Vivobook 15 K513EQ i7-1165G7, GeForce MX350, 42 Wh | Asus VivoBook 15 Pro M3500QC-L1062 R5 5600H, GeForce RTX 3050 4GB Laptop GPU, 63 Wh | Asus VivoBook S15 S533EQ-BQ002T i7-1165G7, GeForce MX350, 50 Wh | Lenovo IdeaPad 5 15ALC05 R5 5500U, Vega 7, 70 Wh | Dell Inspiron 15 3501 i7-1165G7, Iris Xe G7 96EUs, 42 Wh | HP Pavilion 15-eg i7-1165G7, GeForce MX450, 41 Wh | |
|---|---|---|---|---|---|---|
| Autonomia della batteria | 19% | 40% | 101% | 13% | 5% | |
| Reader / Idle (h) | 13.3 | 15 13% | ||||
| WiFi v1.3 (h) | 6 | 8.3 38% | 8.4 40% | 14 133% | 6.8 13% | 6.6 10% |
| Load (h) | 1.3 | 1.3 0% | 2.2 69% | 1.2 -8% | ||
| H.264 (h) | 12.1 | 15.4 | ||||
| Witcher 3 ultra (h) | 1.2 | 1.8 |
Pro
Contro
Verdetto - OLED a prezzi accessibili
La parola "OLED" di solito evoca un senso di lusso o prezzi più alti. Asus sta cambiando tutto questo introducendo nuovi pannelli OLED 1080p per la sua serie VivoBook economica invece dei più costosi pannelli OLED 4K che si trovano tipicamente sui portatili di fascia alta. Gli utenti possono ora possedere un sistema equipaggiato con l'ultima CPU Intel Core i7 serie U, grafica discreta GeForce MX, e un luminoso display OLED in grado di riprodurre i colori DCI-P3, il tutto per poco più di 900 dollari. Gli utenti insoddisfatti con "solo" ~95 per cento di copertura sRGB sulla maggior parte degli Ultrabook di fascia media come il Lenovo IdeaPad, MSI Moderno Dell Inspiron troveranno il nuovo VivoBook OLED molto attraente per questo motivo.
Il VivoBook 15 OLED sta stabilendo un nuovo standard per gli Ultrabook economici e di fascia media in termini di qualità dell'immagine e profilo dei colori. Anche le prestazioni sono eccellenti, mentre lo chassis per lo più in plastica potrebbe utilizzare alcuni aggiornamenti.
Il resto del portatile è abbastanza standard, nel bene e nel male. È sicuramente strano vedere un display OLED così nitido e colorato su un portatile altrimenti economico con una base di plastica, un clickpad spugnoso e una piccola batteria interna. Dovrete spendere un paio di centinaia di dollari in più su uno ZenBook più elegante per avere l'esperienza completa dell'ammiraglia. Per quanto riguarda i portatili di fascia media, tuttavia, il VivoBook 15 K513 è dotato di uno dei migliori display che si possono ottenere in questa fascia di prezzo.
Prezzo e disponibilità
Asus Vivobook 15 K513EQ
- 08/30/2022 v7 (old)
Allen Ngo
Price comparison

