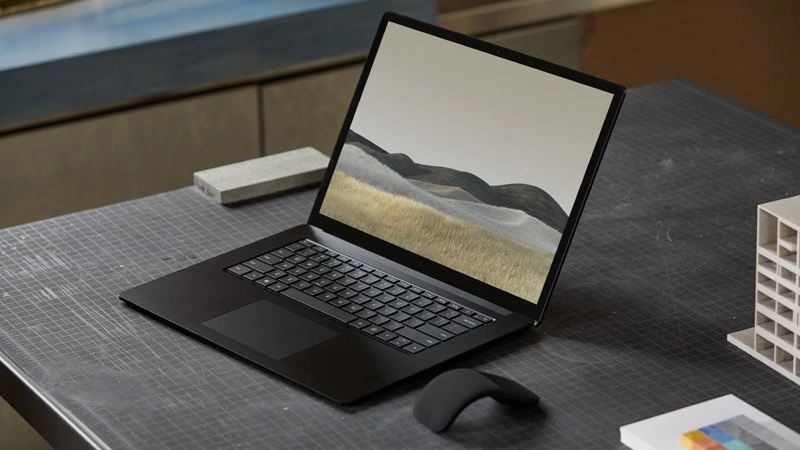
Recensione del Laptop Microsoft Surface 3 da 15" con Core i7: meglio con Ice Lake
Il Microsoft Surface Laptop 3 da 15" è rappresentato da quattro SKU principali nell'ordine seguente, dalla meno costosa alla più costosa: Ryzen 5 3580U, Core i5-1035G7, Ryzen 7 3780U e Core i7-1065G7. Abbiamo recentemente verificato la configurazione AMD Ryzen 5 per vedere cosa può offrire il Surface Laptop al suo livello base. Oggi controlleremo la SKU Intel Core i7 per vedere cosa può fare il Surface Laptop quando è al suo meglio.
Raccomandiamo di dare un'occhiata alla nostra recensione della SKU Surface Laptop 3 Ryzen 5 per saperne di più su telaio, tastiera, display e altre caratteristiche esterne, dato che queste caratteristiche sono identiche tra i modelli Intel e AMD. Questa recensione si concentrerà invece sulle eventuali differenze interne tra le SKU Intel Core i7 e AMD Ryzen 5, tra cui la temperatura, il consumo energetico, la durata della batteria e, naturalmente, le prestazioni. Confrontare la nostra SKU Core i7 con la Ryzen 7 avrebbe dato risultati più interessanti, ma per questo si dovrà aspettare quando metteremo le mani su un'unità Ryzen 7.
Altre recensioni Microsoft:
Punteggio | Data | Modello | Peso | Altezza | Dimensione | Risoluzione | Prezzo |
|---|---|---|---|---|---|---|---|
| 83.9 % v7 (old) | 12/2019 | Microsoft Surface Laptop 3 15 i7-1065G7 i7-1065G7, Iris Plus Graphics G7 (Ice Lake 64 EU) | 1.5 kg | 14.7 mm | 15.00" | 2496x1664 | |
| 86.3 % v7 (old) | 10/2019 | Dell XPS 15 7590 i5 iGPU FHD i5-9300H, UHD Graphics 630 | 1.9 kg | 17 mm | 15.60" | 1920x1080 | |
| 86 % v7 (old) | 12/2019 | Lenovo Yoga C940-15IRH i7-9750H, GeForce GTX 1650 Max-Q | 2 kg | 19.7 mm | 15.60" | 1920x1080 | |
| 83.9 % v7 (old) | 03/2019 | HP Spectre x360 15-df0126ng i7-8750H, GeForce GTX 1050 Ti Max-Q | 2.2 kg | 19.3 mm | 15.60" | 3840x2160 | |
| 89.7 % v7 (old) | 12/2019 | Apple MacBook Pro 16 2019 i9 5500M i9-9880H, Radeon Pro 5500M | 2 kg | 16.2 mm | 16.00" | 3072x1920 |
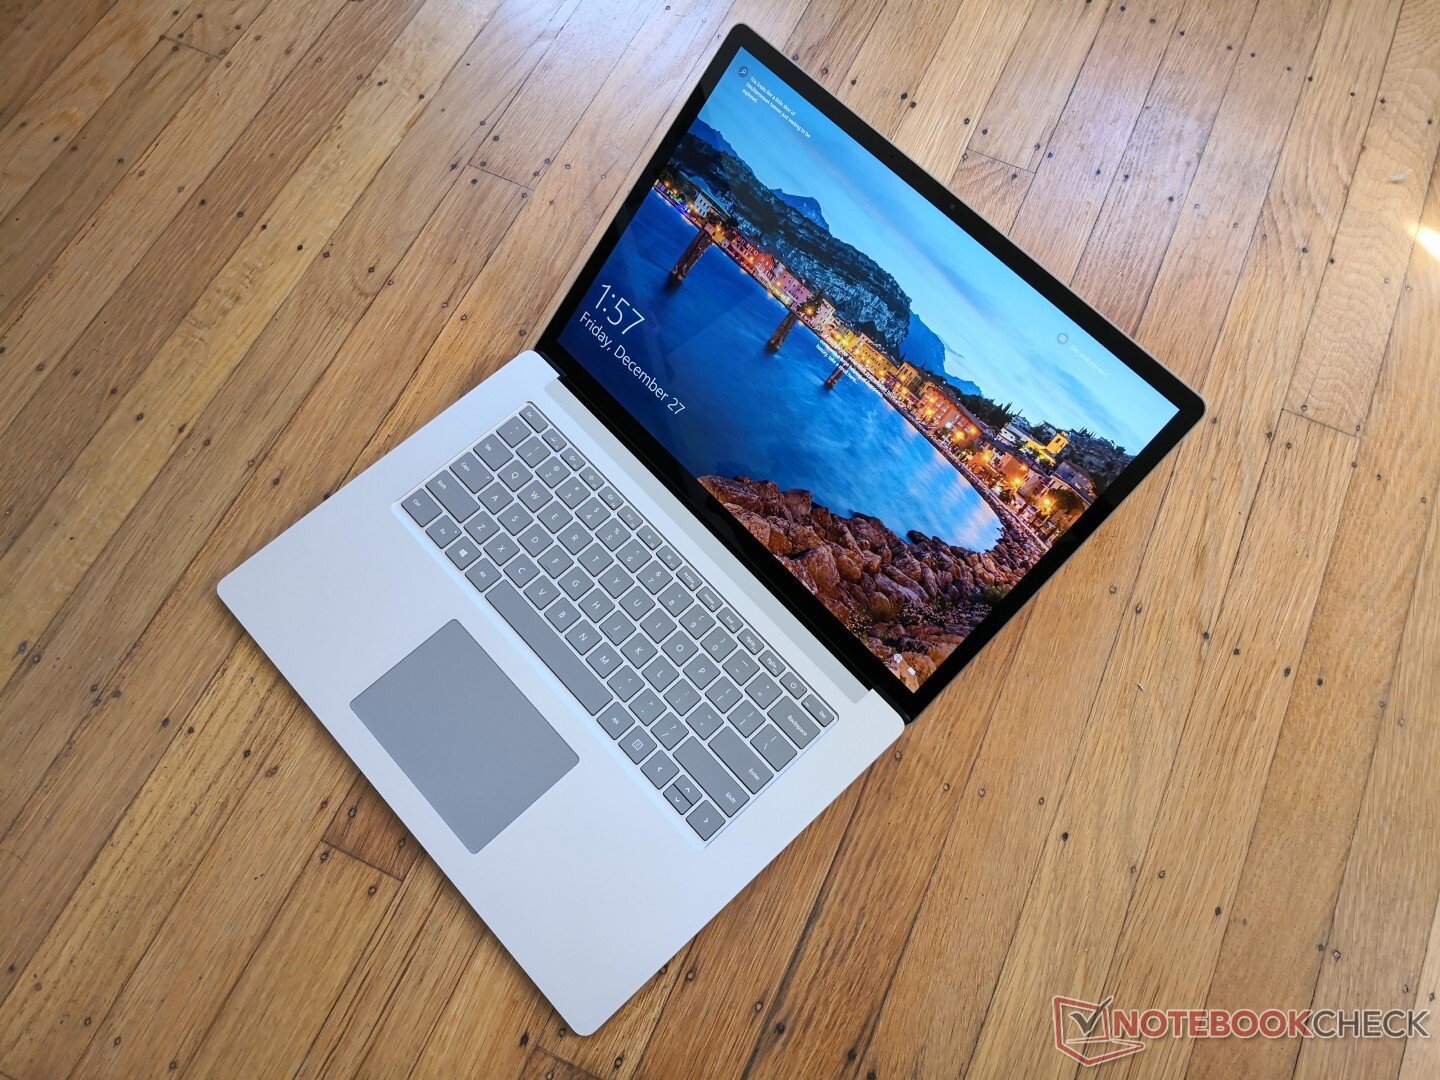
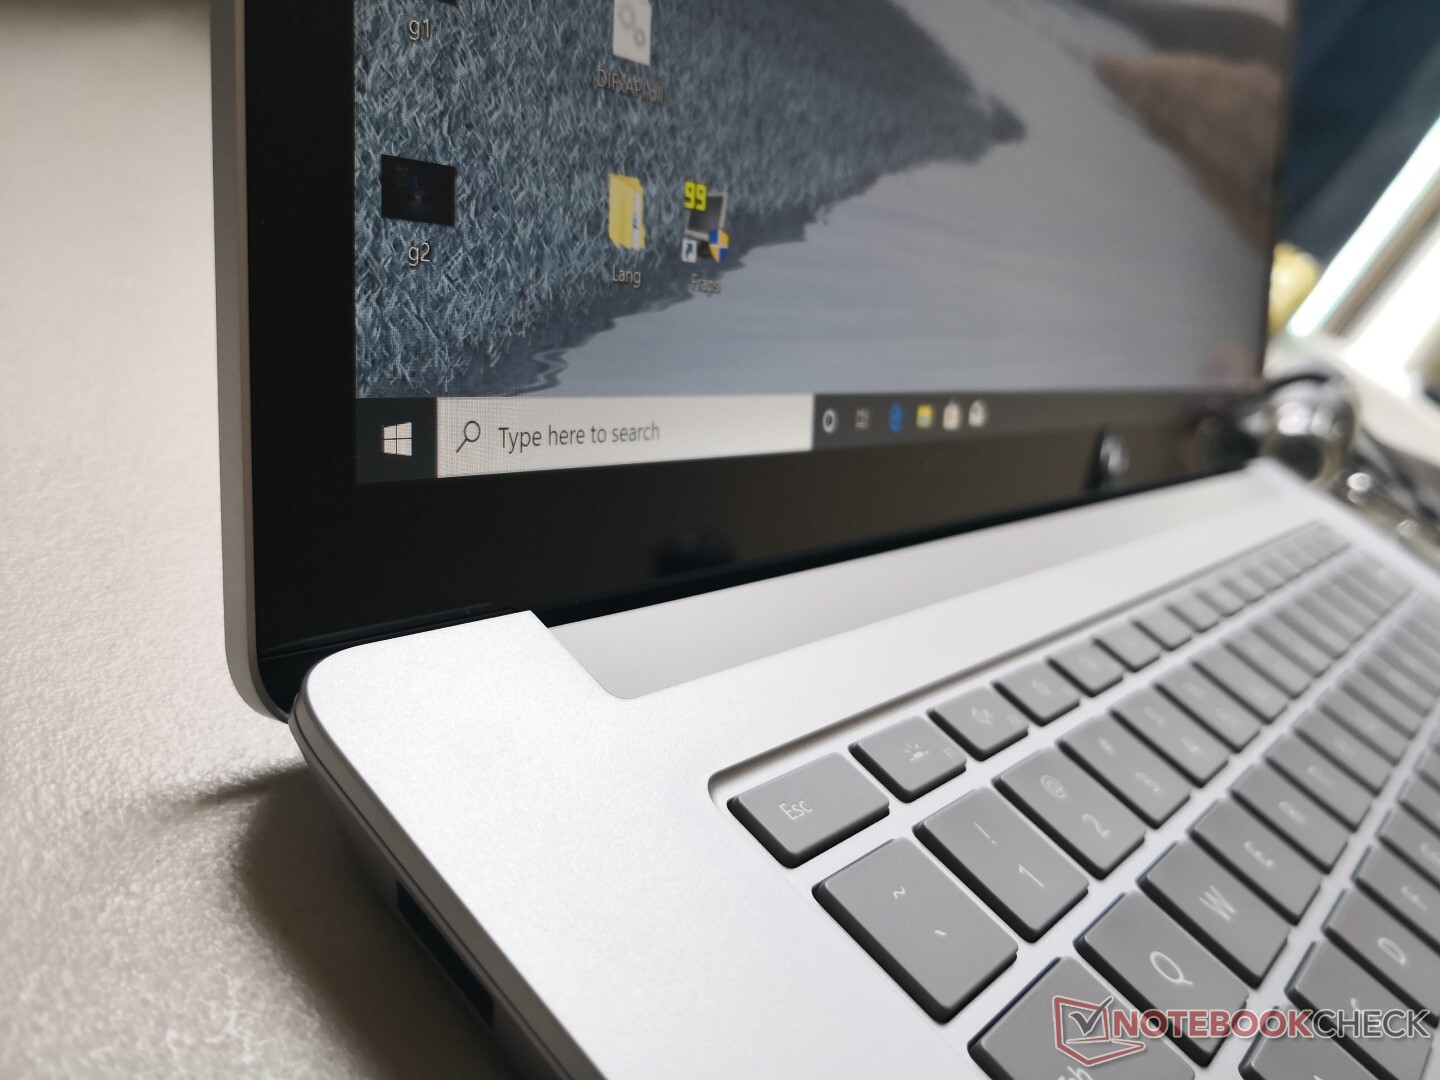
Case
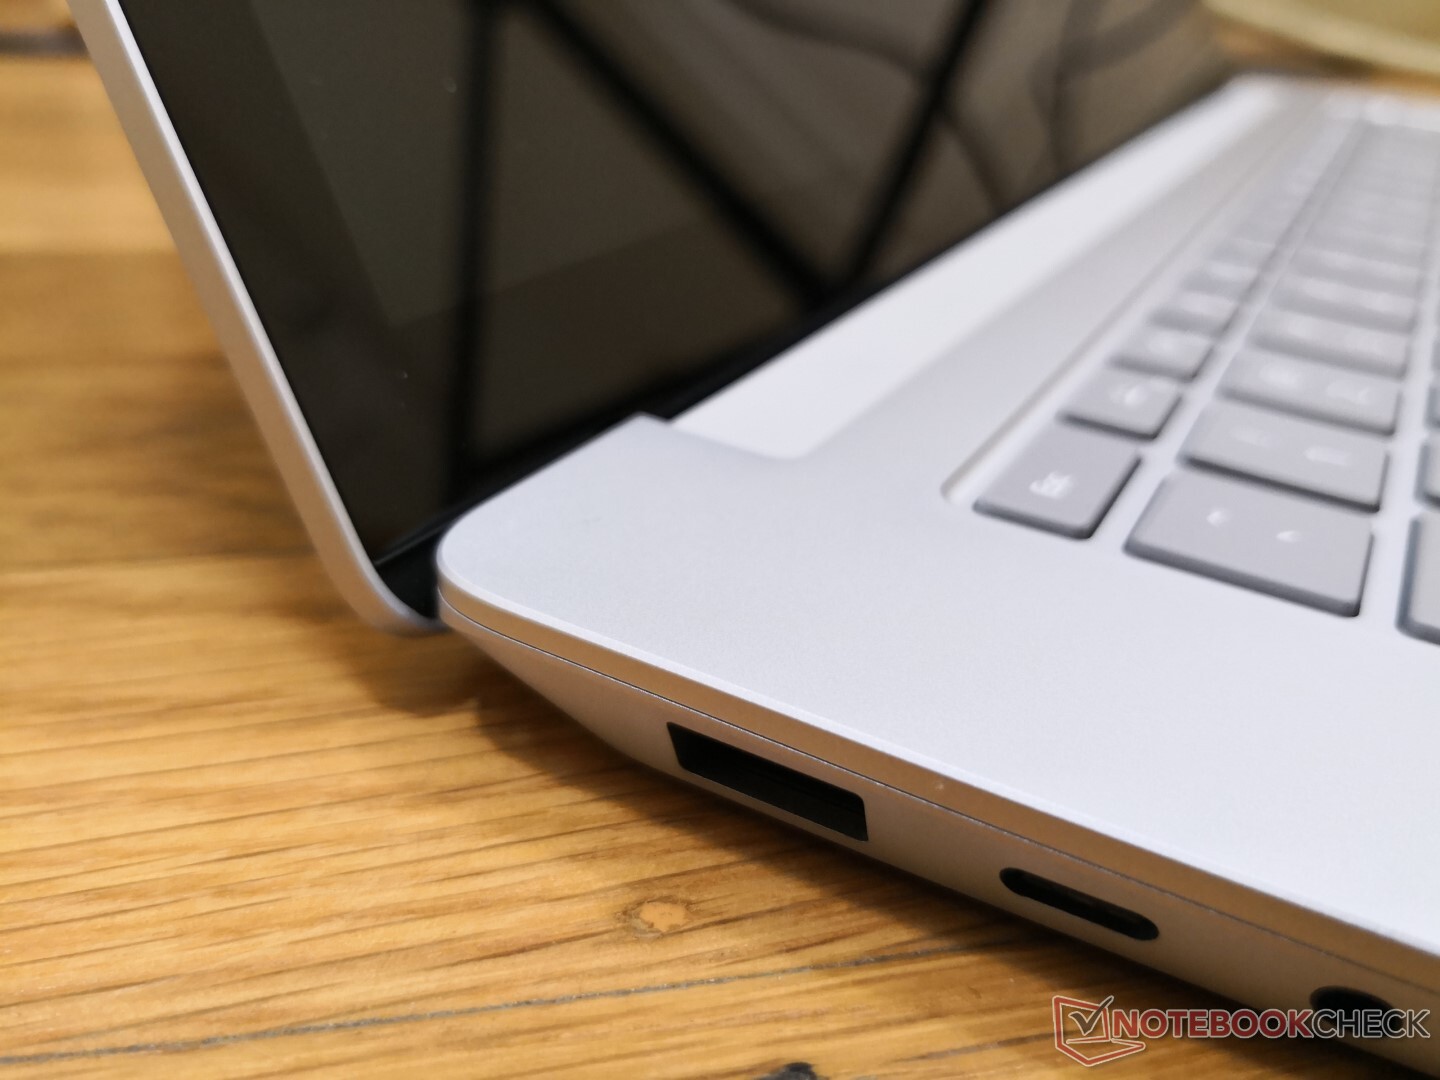
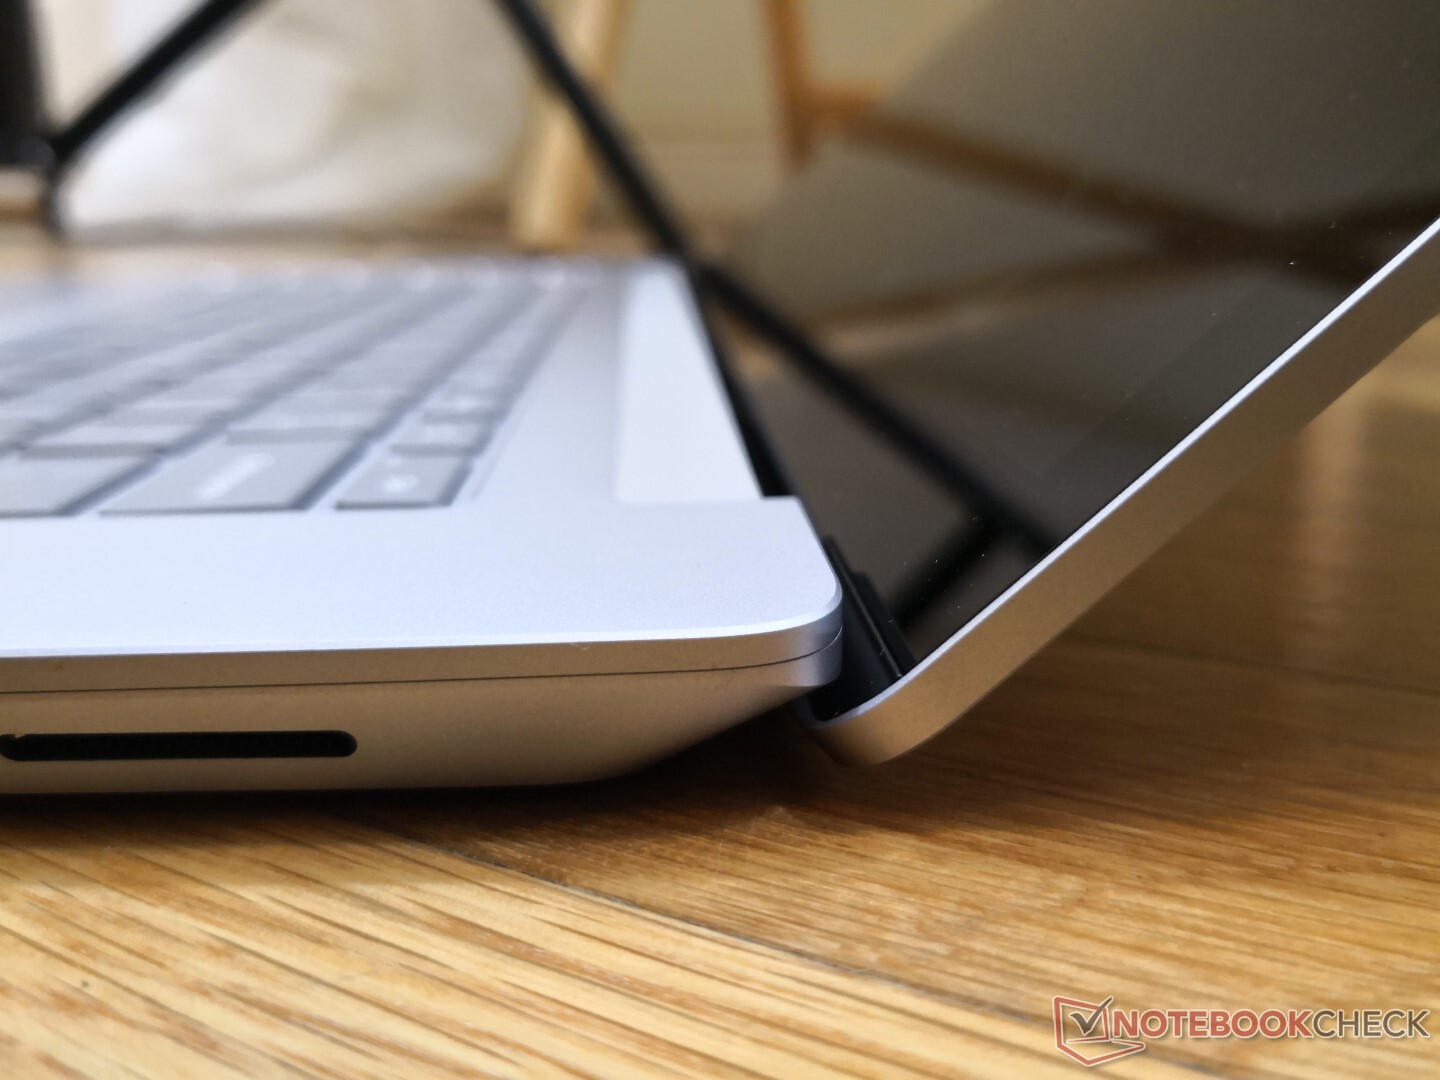

Connessioni
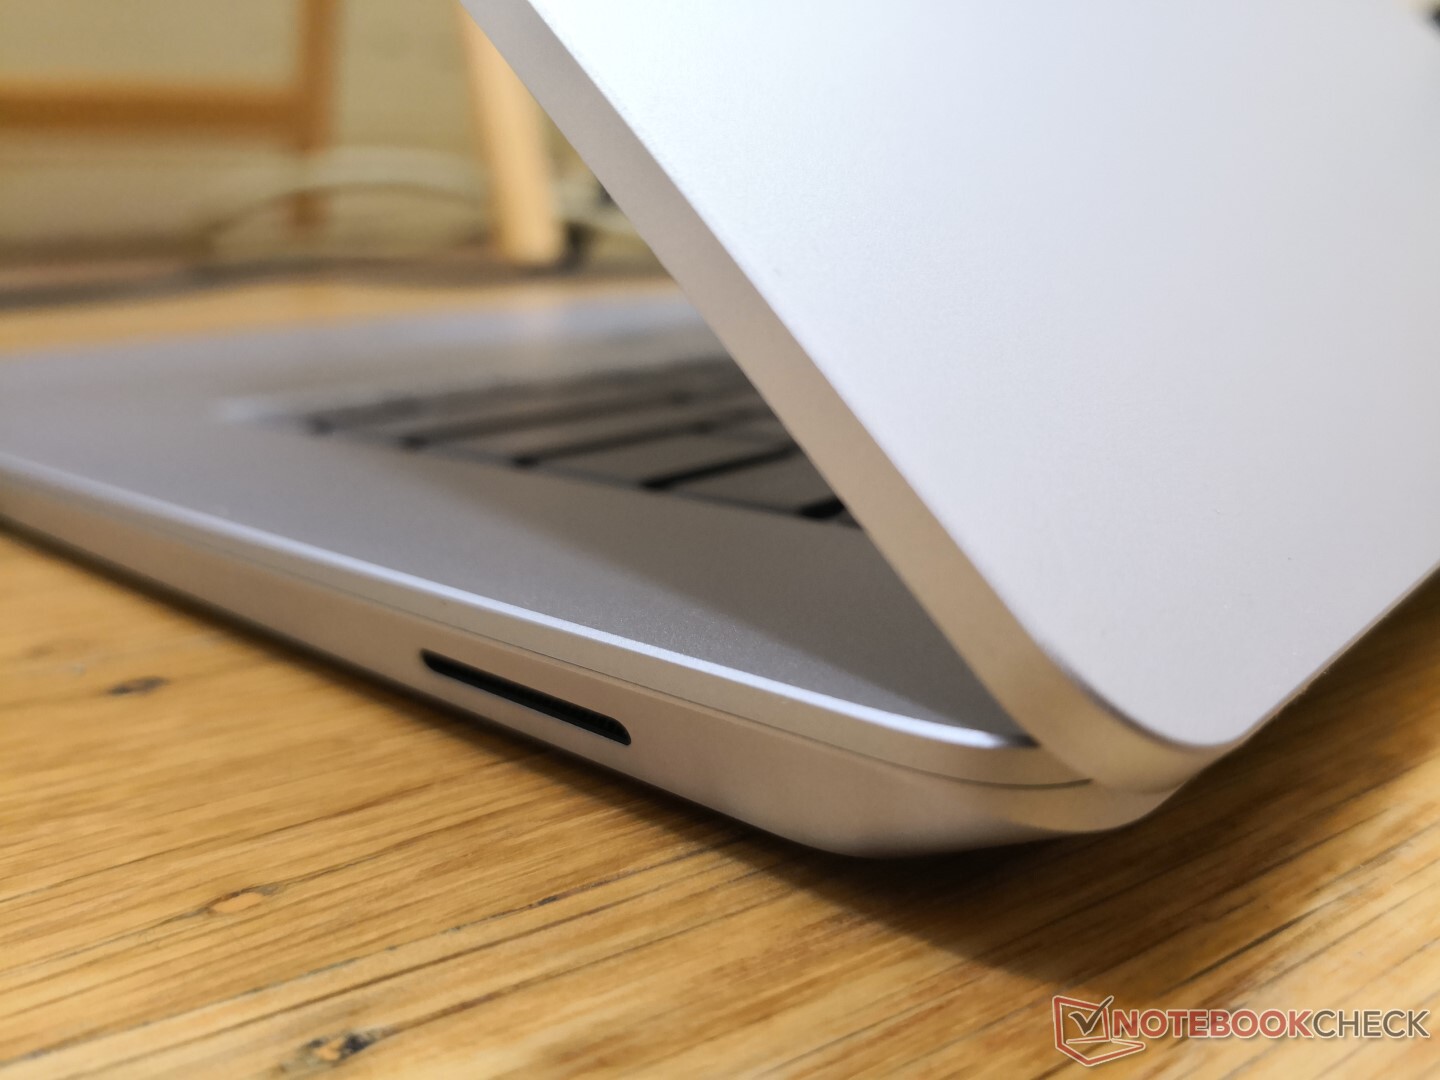
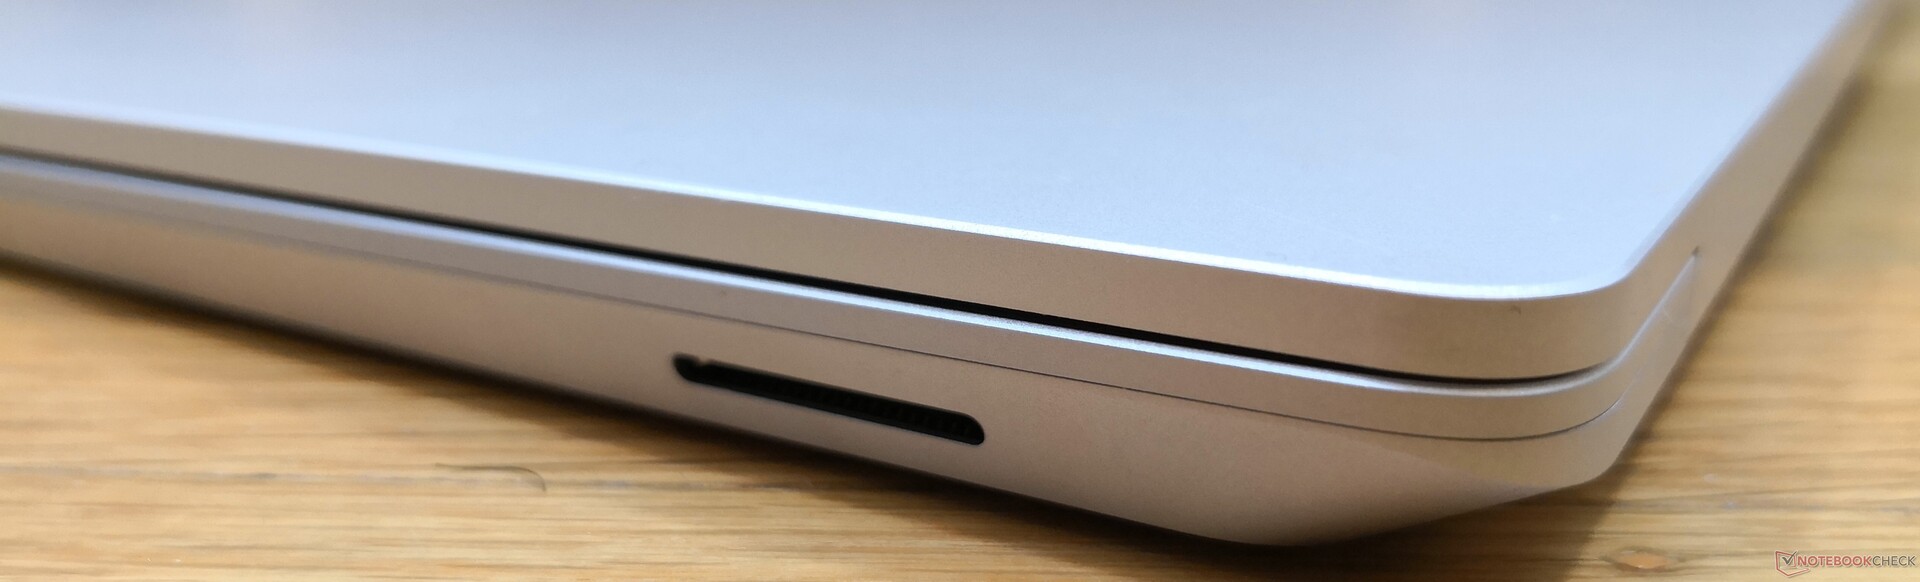
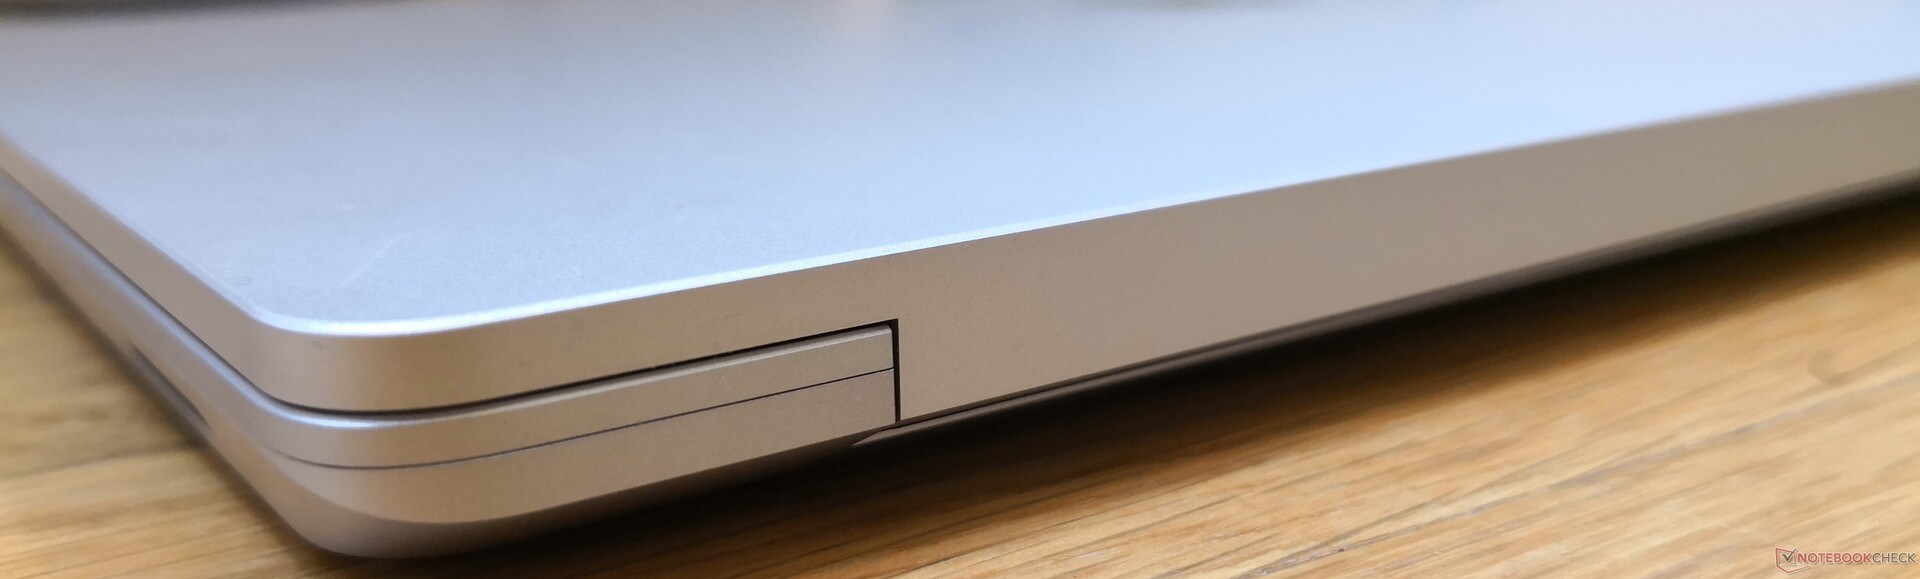
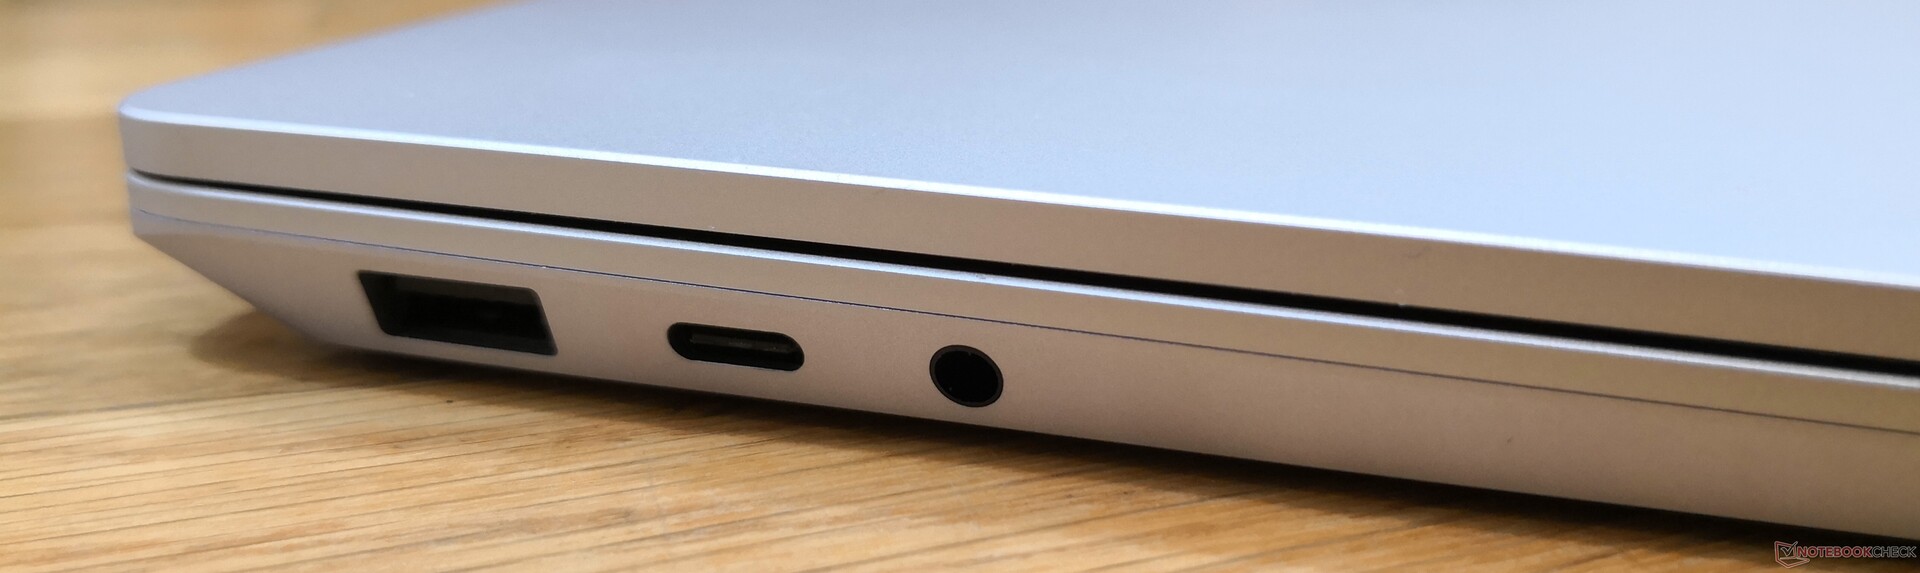
Le opzioni delle porte sono limitate per un portatile da 15". Il più piccolo Huawei MateBook X Pro, ad esempio, è dotato di due porte USB Type-C, Thunderbolt 3, e una porta USB Type-A, mentre il portatile Microsoft offre solo una porta USB Type-C senza compatibilità Thunderbolt. Un lettore SD sarebbe stato apprezzato soprattutto dai creatori di contenuti e dagli utenti che sono sempre in movimento. Dovrete acquistare la costosa Surface Dock se volete sfruttare al massimo le capacità di docking del Surface Laptop 3.
Comunicazioni
Le SKU Intel sono fornite di serie dell'Intel AX201 per la connettività Wi-Fi 6 (802.11ax) mentre le SKU AMD sono fornite del più lento Atheros/Qualcomm QCA6174 per la sola connettività Wi-Fi 5. La prima può offrire più di due volte la velocità di trasferimento della seconda nel caso in cui vi capitasse di essere uno dei pochi utenti con un router Wi-Fi 6 nuovo di zecca. Per il resto, le prestazioni della WLAN non cambieranno durante i carichi giornalieri, poiché la ragione principale per possedere un laptop Wi-Fi 6 in questo momento è soprattutto la prospettiva del futuro. Si noti che l'AX201 è funzionalmente identico all'AX200, salvo alcune modifiche hardware sotto il cofano.
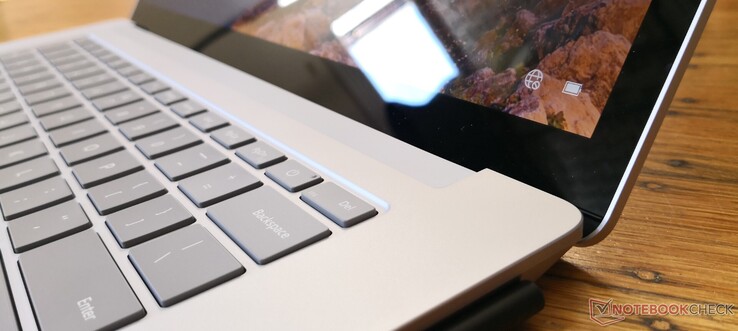
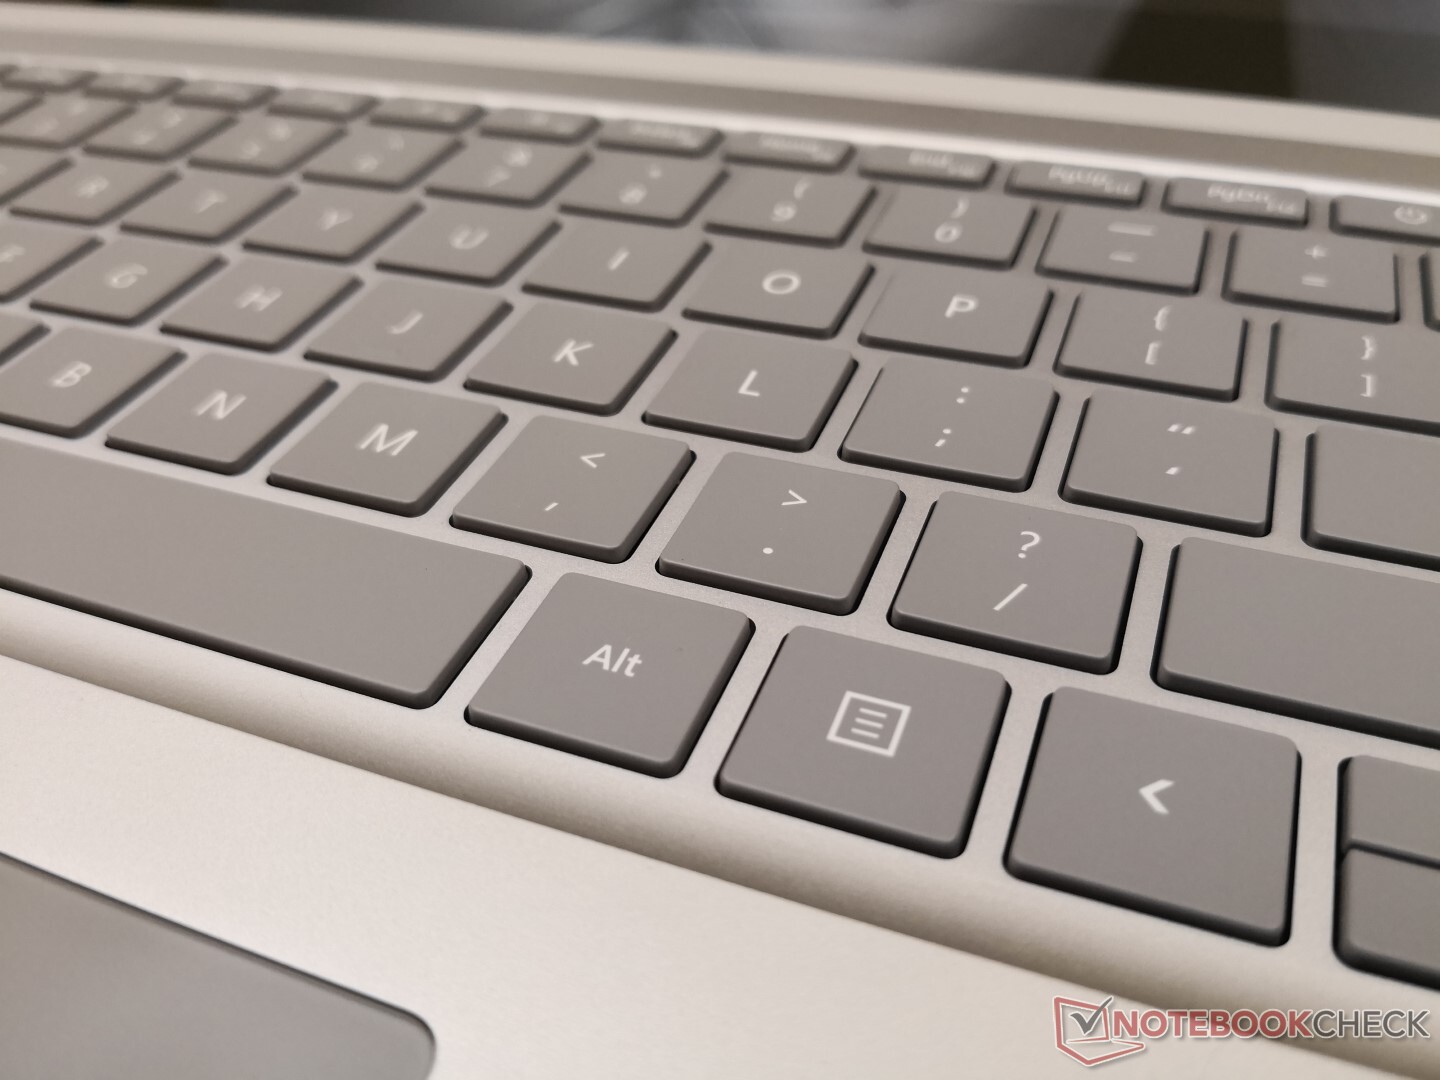
Dispositivi di Input
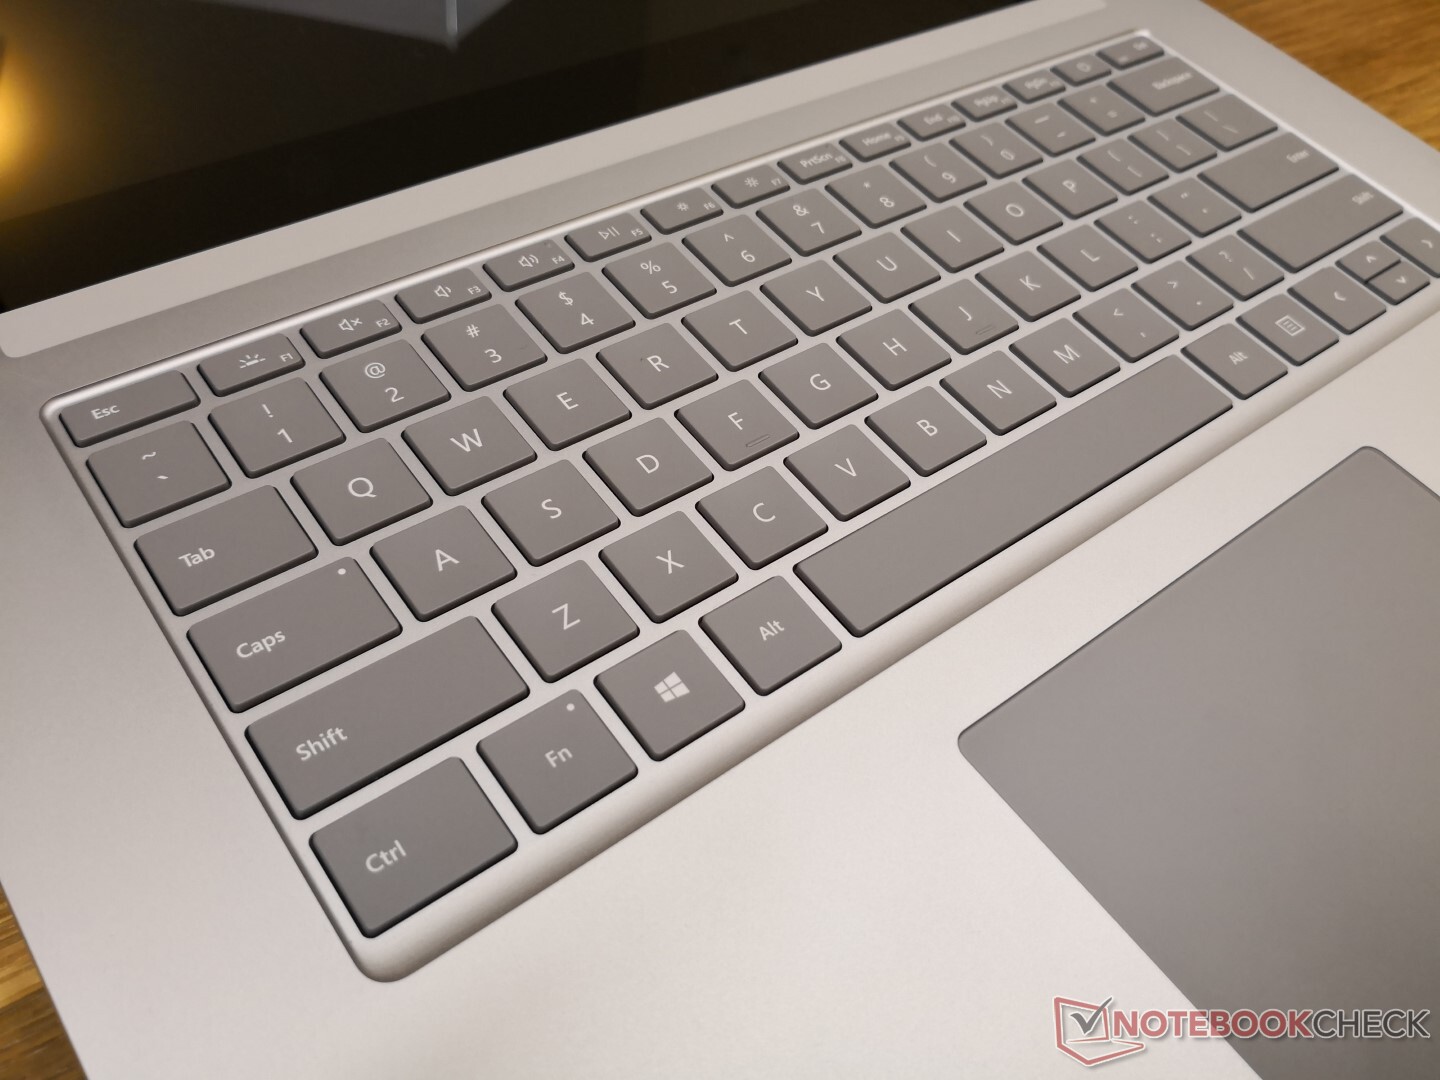
Tastiera e Touchpad
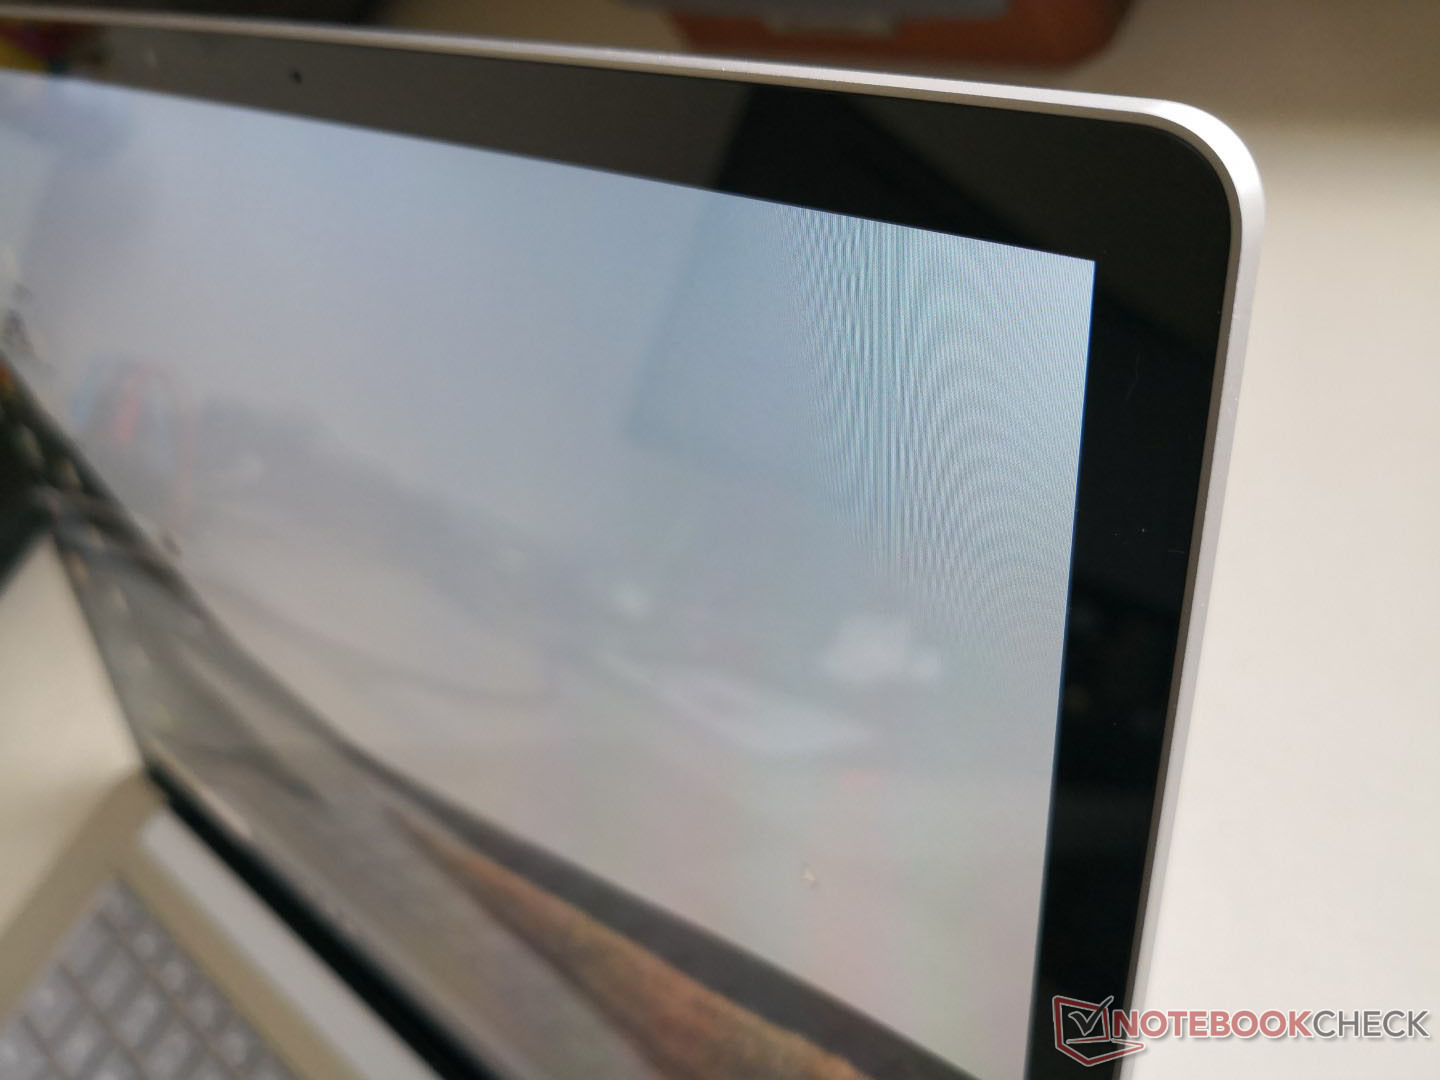
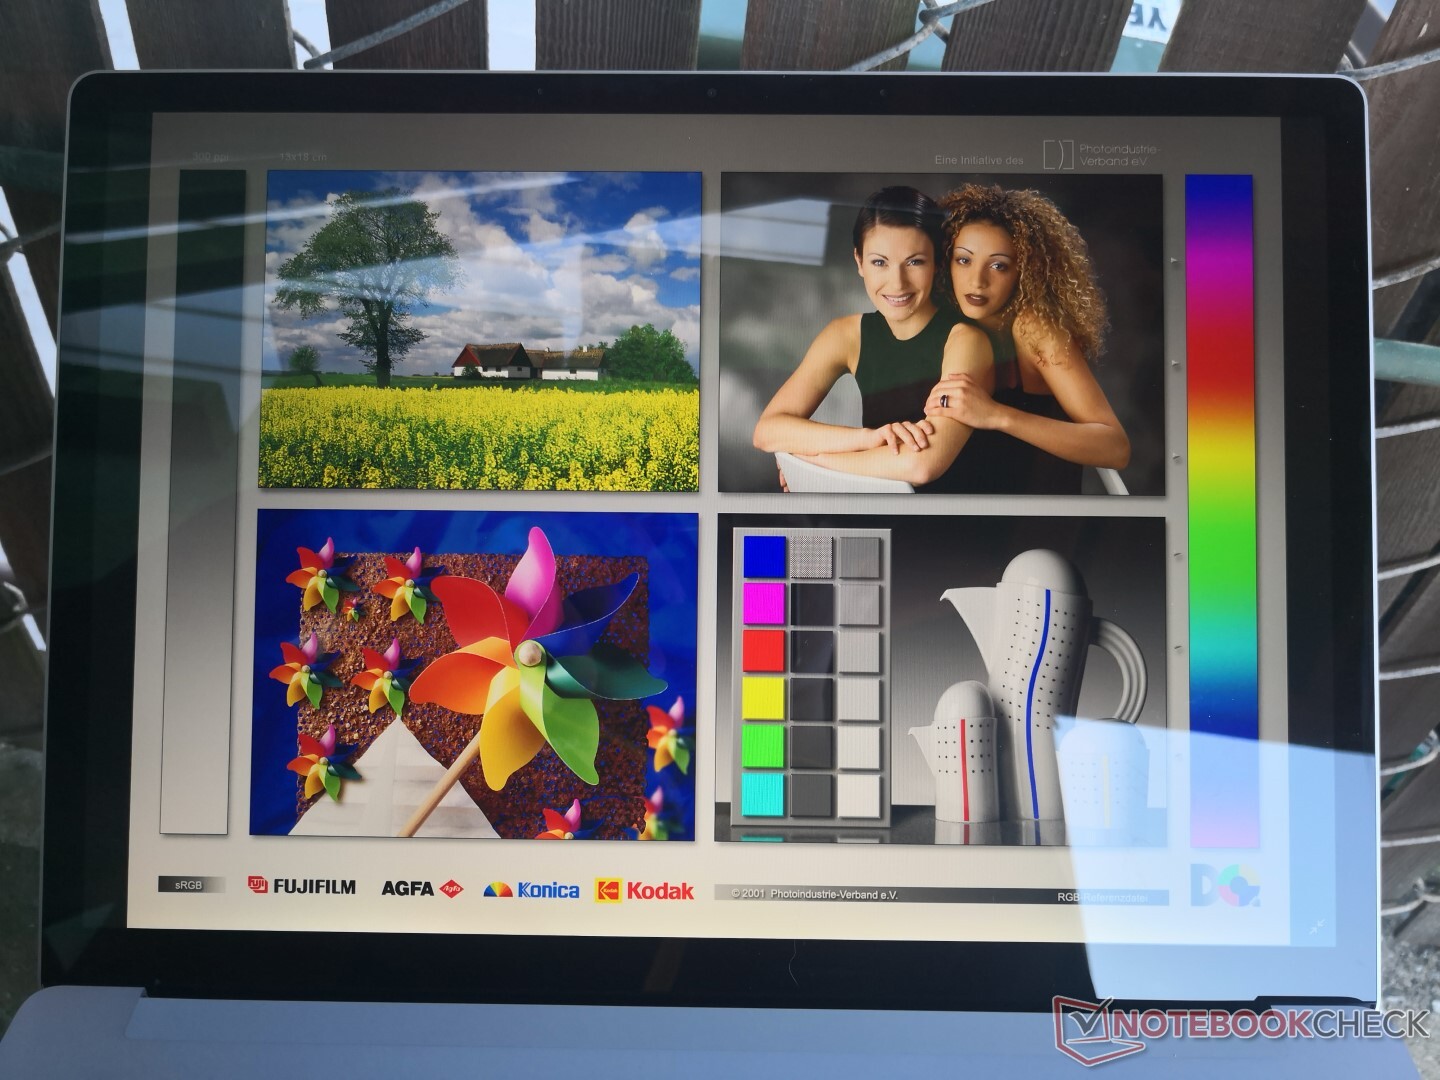
Display
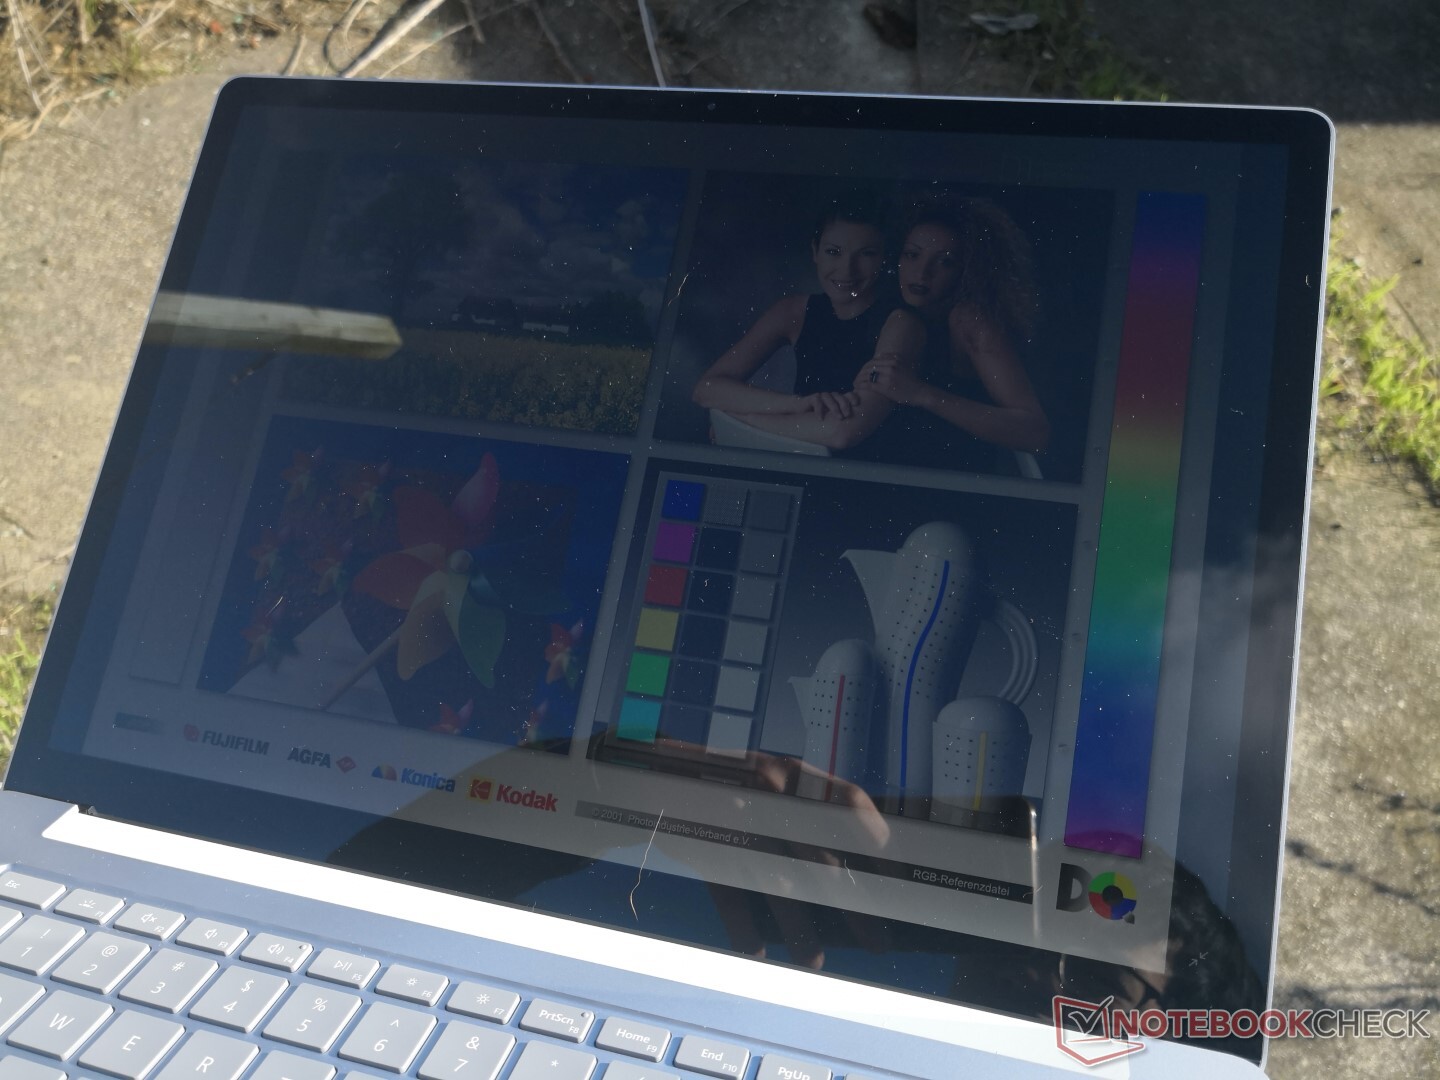
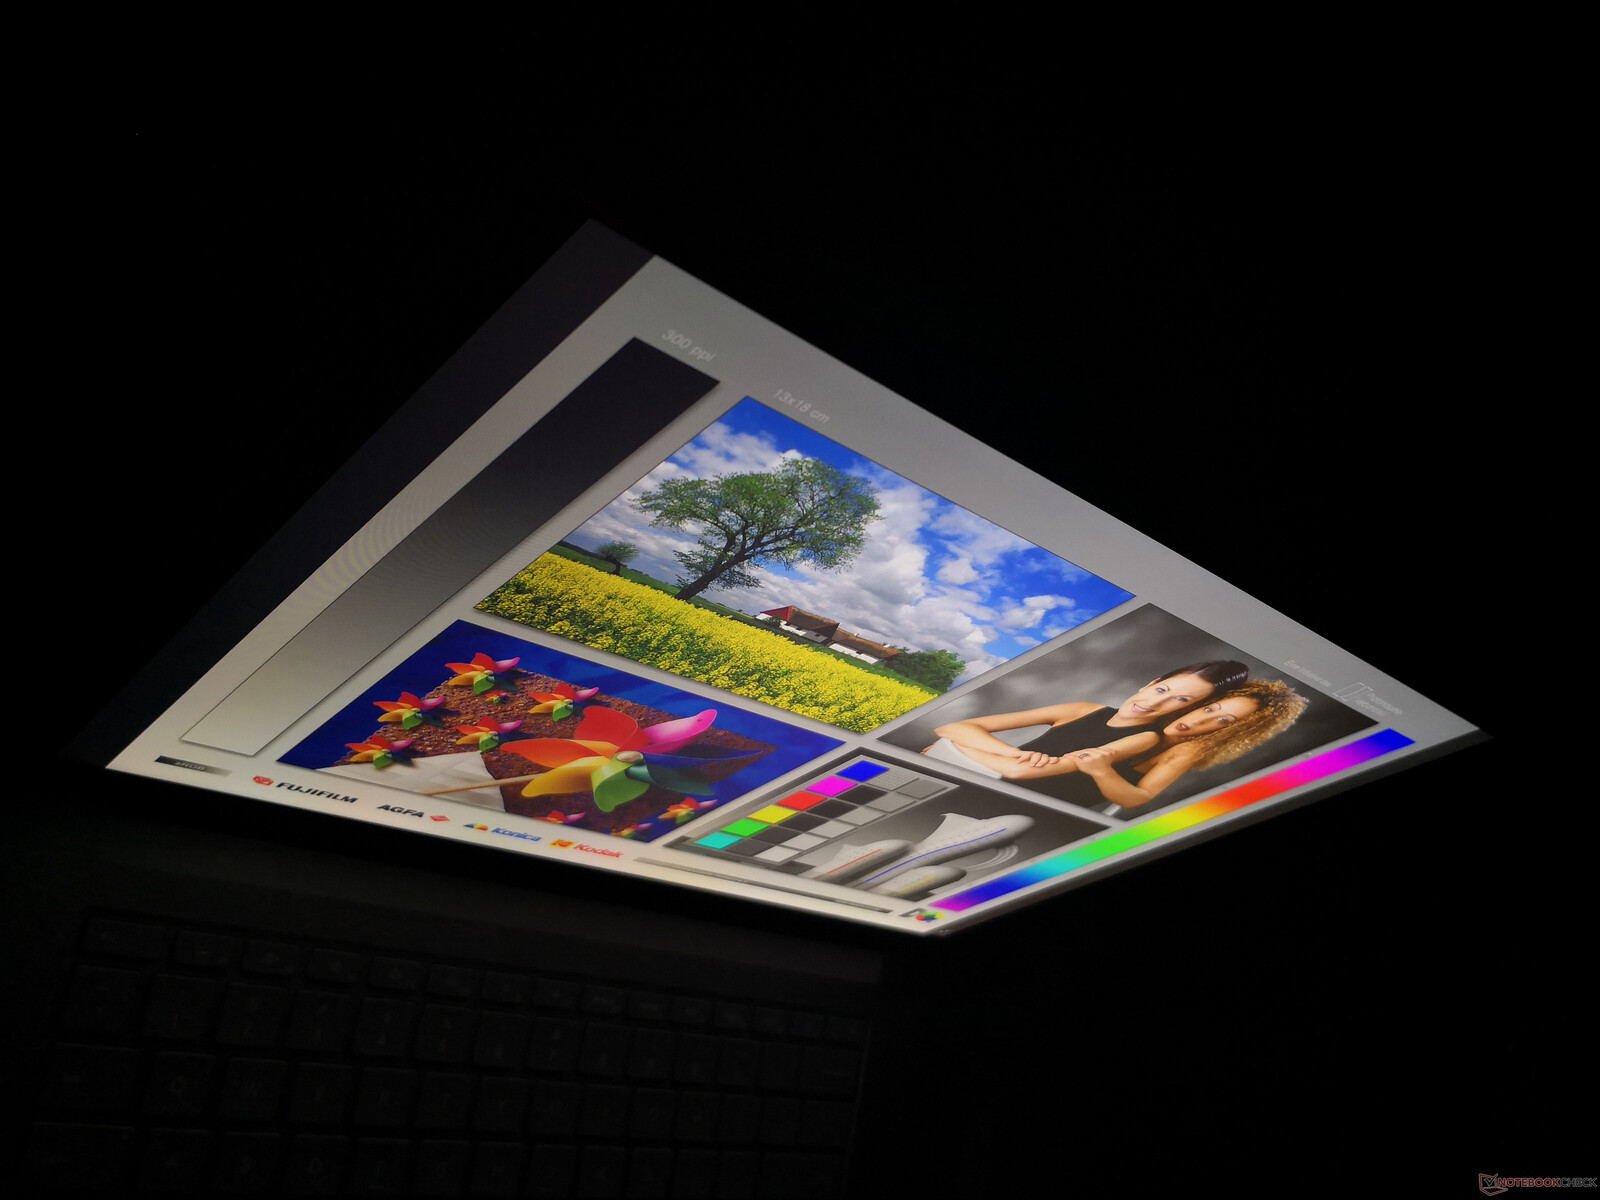
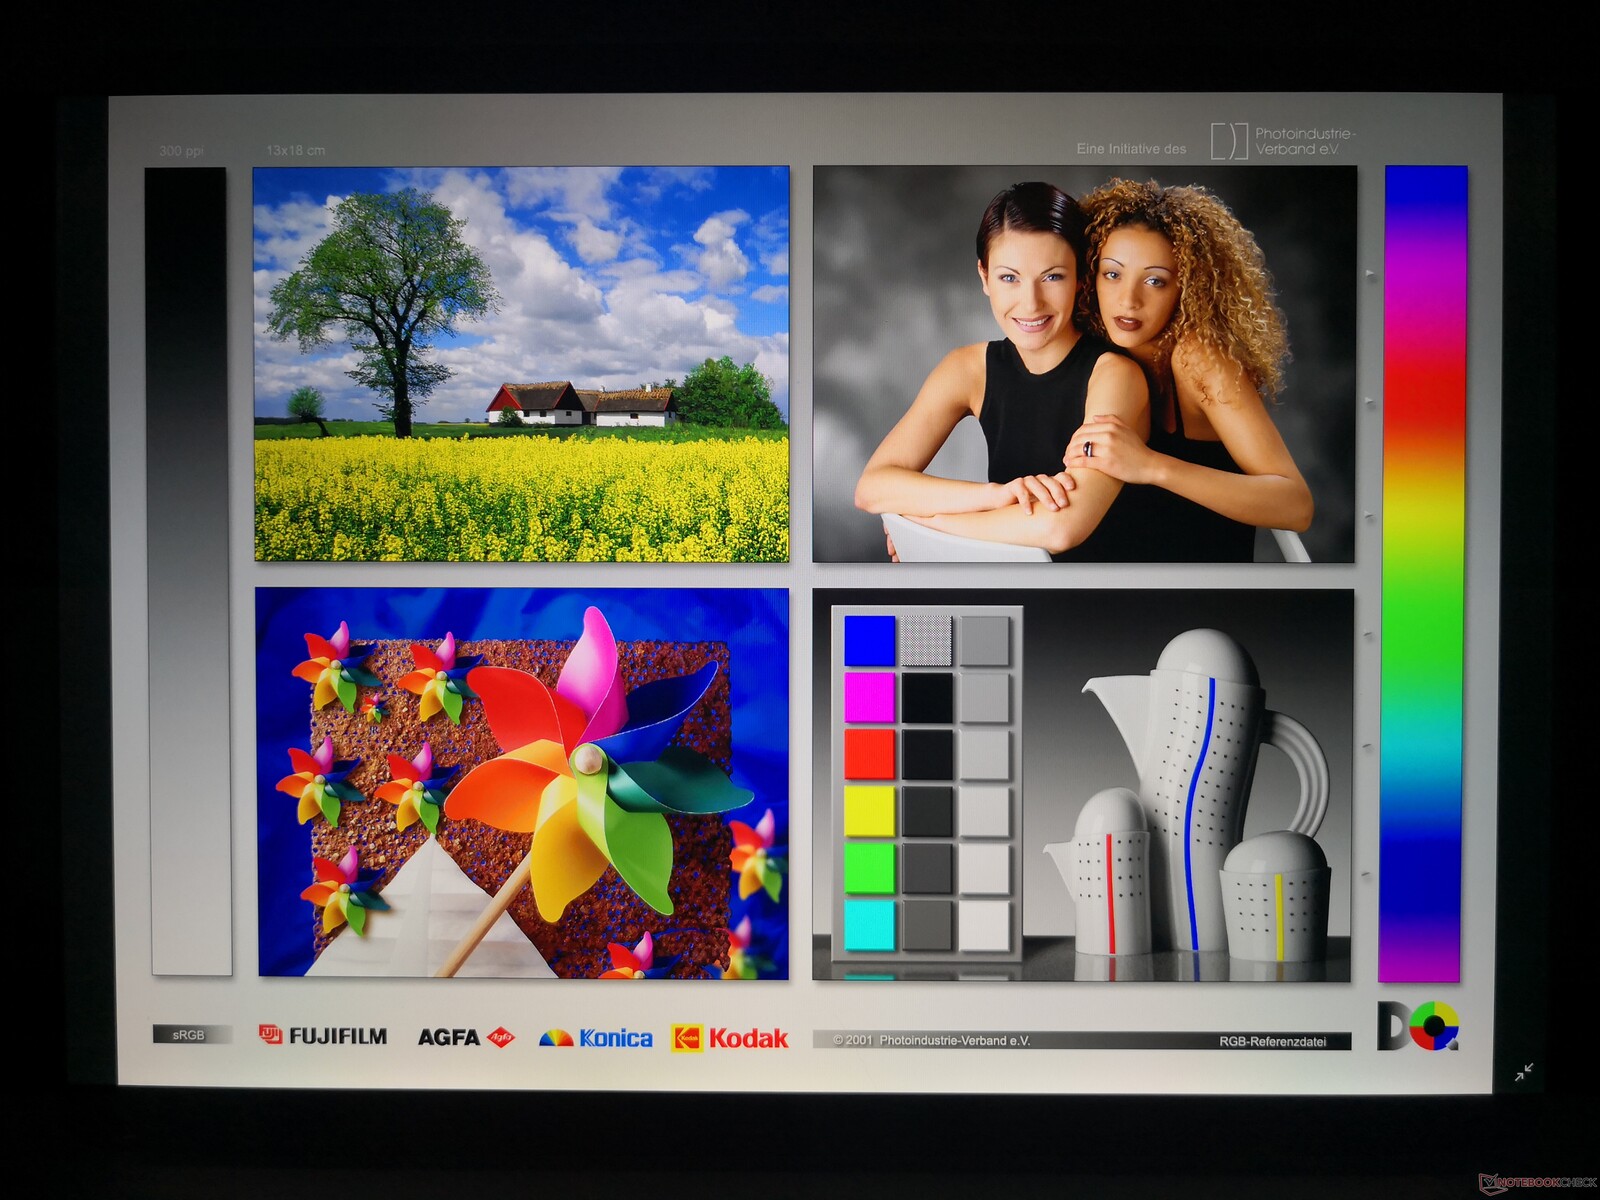
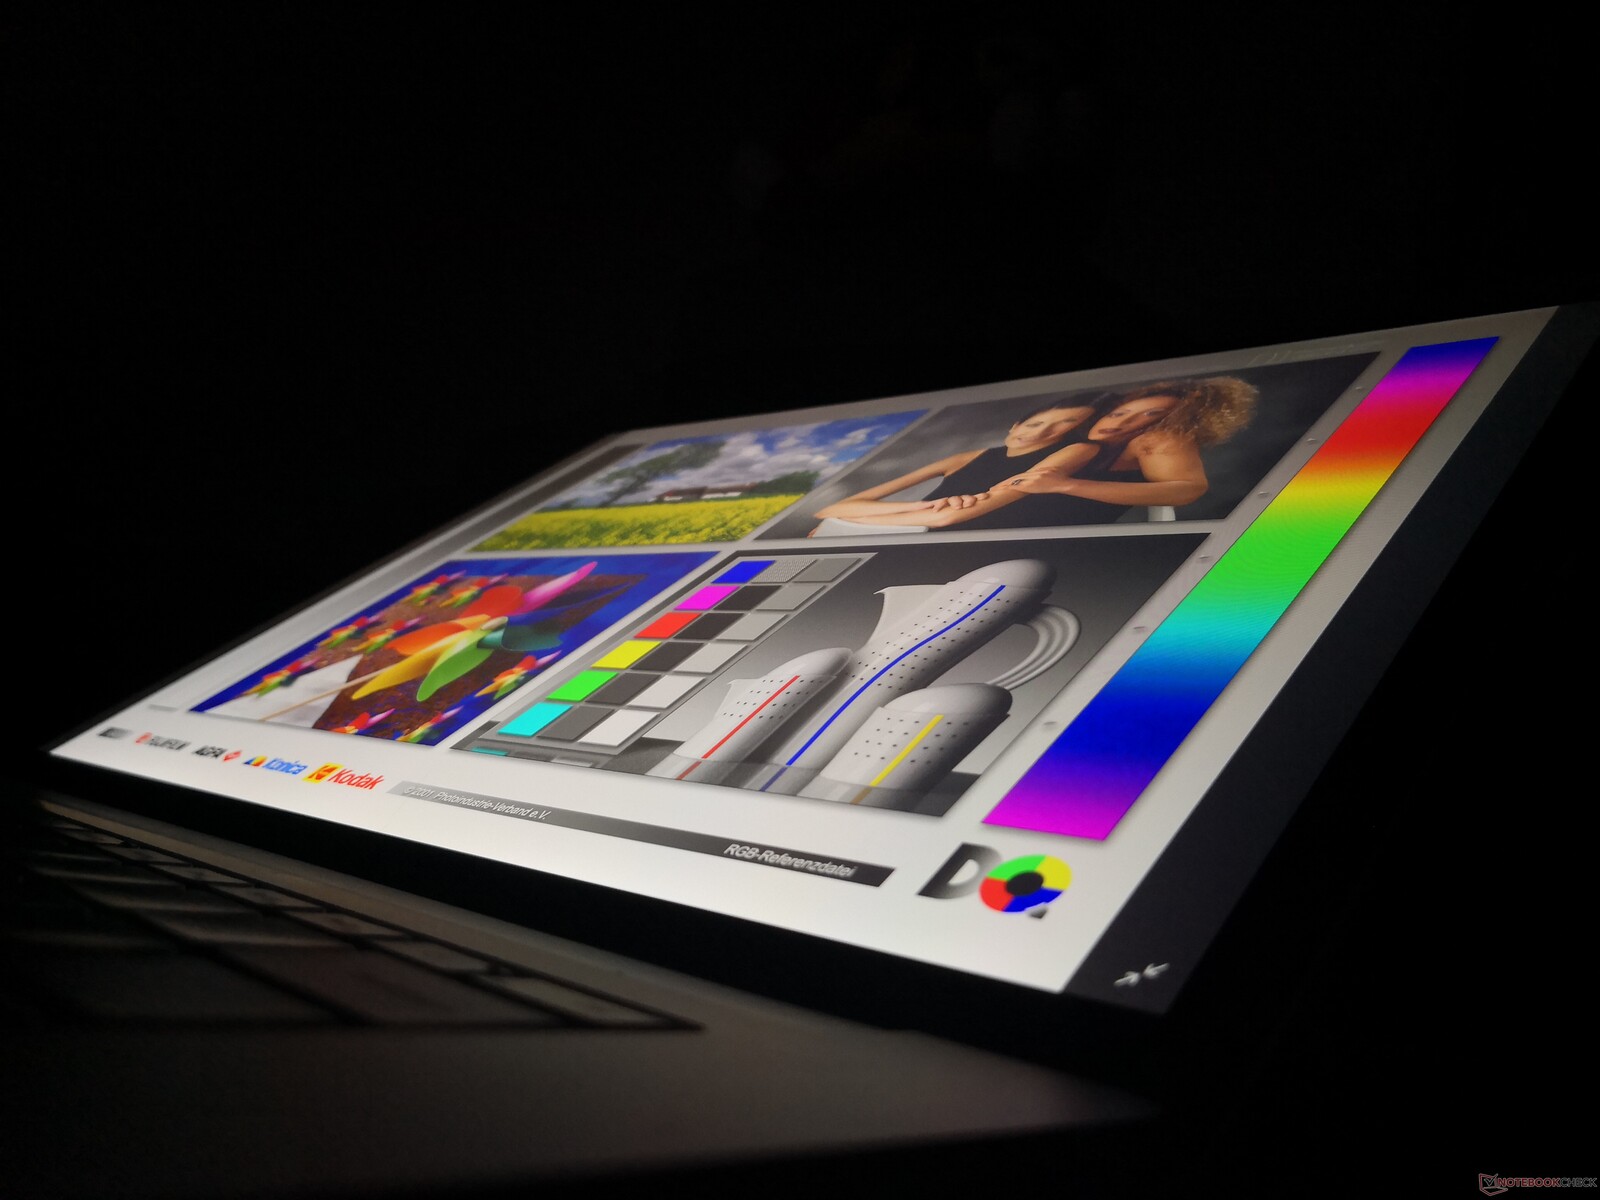
Microsoft utilizza lo stesso pannello IPS Sharp LQ150P1JX51 in tutte le suoe 3 SKU Surface Laptop 3. Le nostre misurazioni indipendenti mostrano che le caratteristiche principali del display sono identiche tra le opzioni Intel e AMD, tra cui la luminosità, il contrasto, i colori, i tempi di risposta e persino la frequenza di modulazione della larghezza di impulso. I concorrenti Apple MacBook Pro 16 e Dell XPS 15 hanno display più luminosi per una migliore visibilità all'aperto.

| |||||||||||||||||||||||||
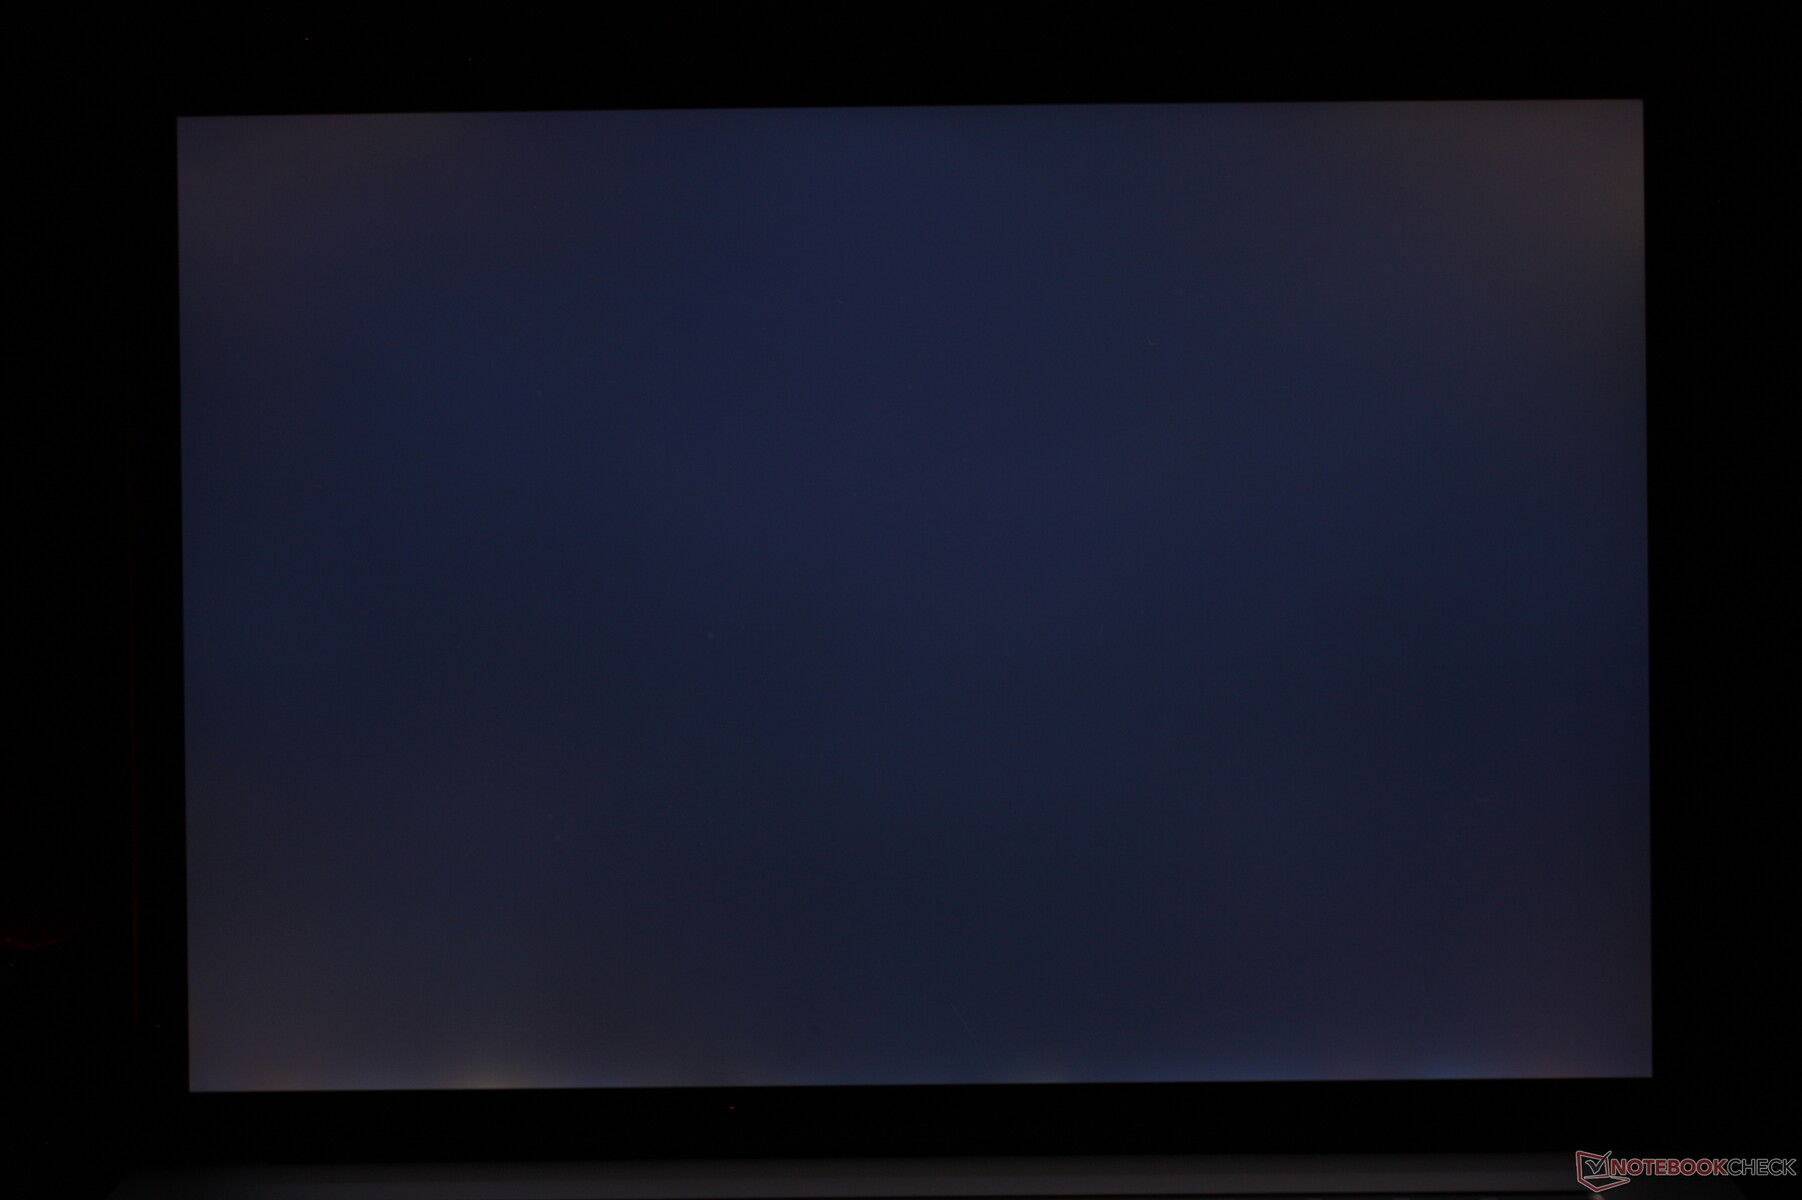
Distribuzione della luminosità: 78 %
Al centro con la batteria: 412.4 cd/m²
Contrasto: 1178:1 (Nero: 0.35 cd/m²)
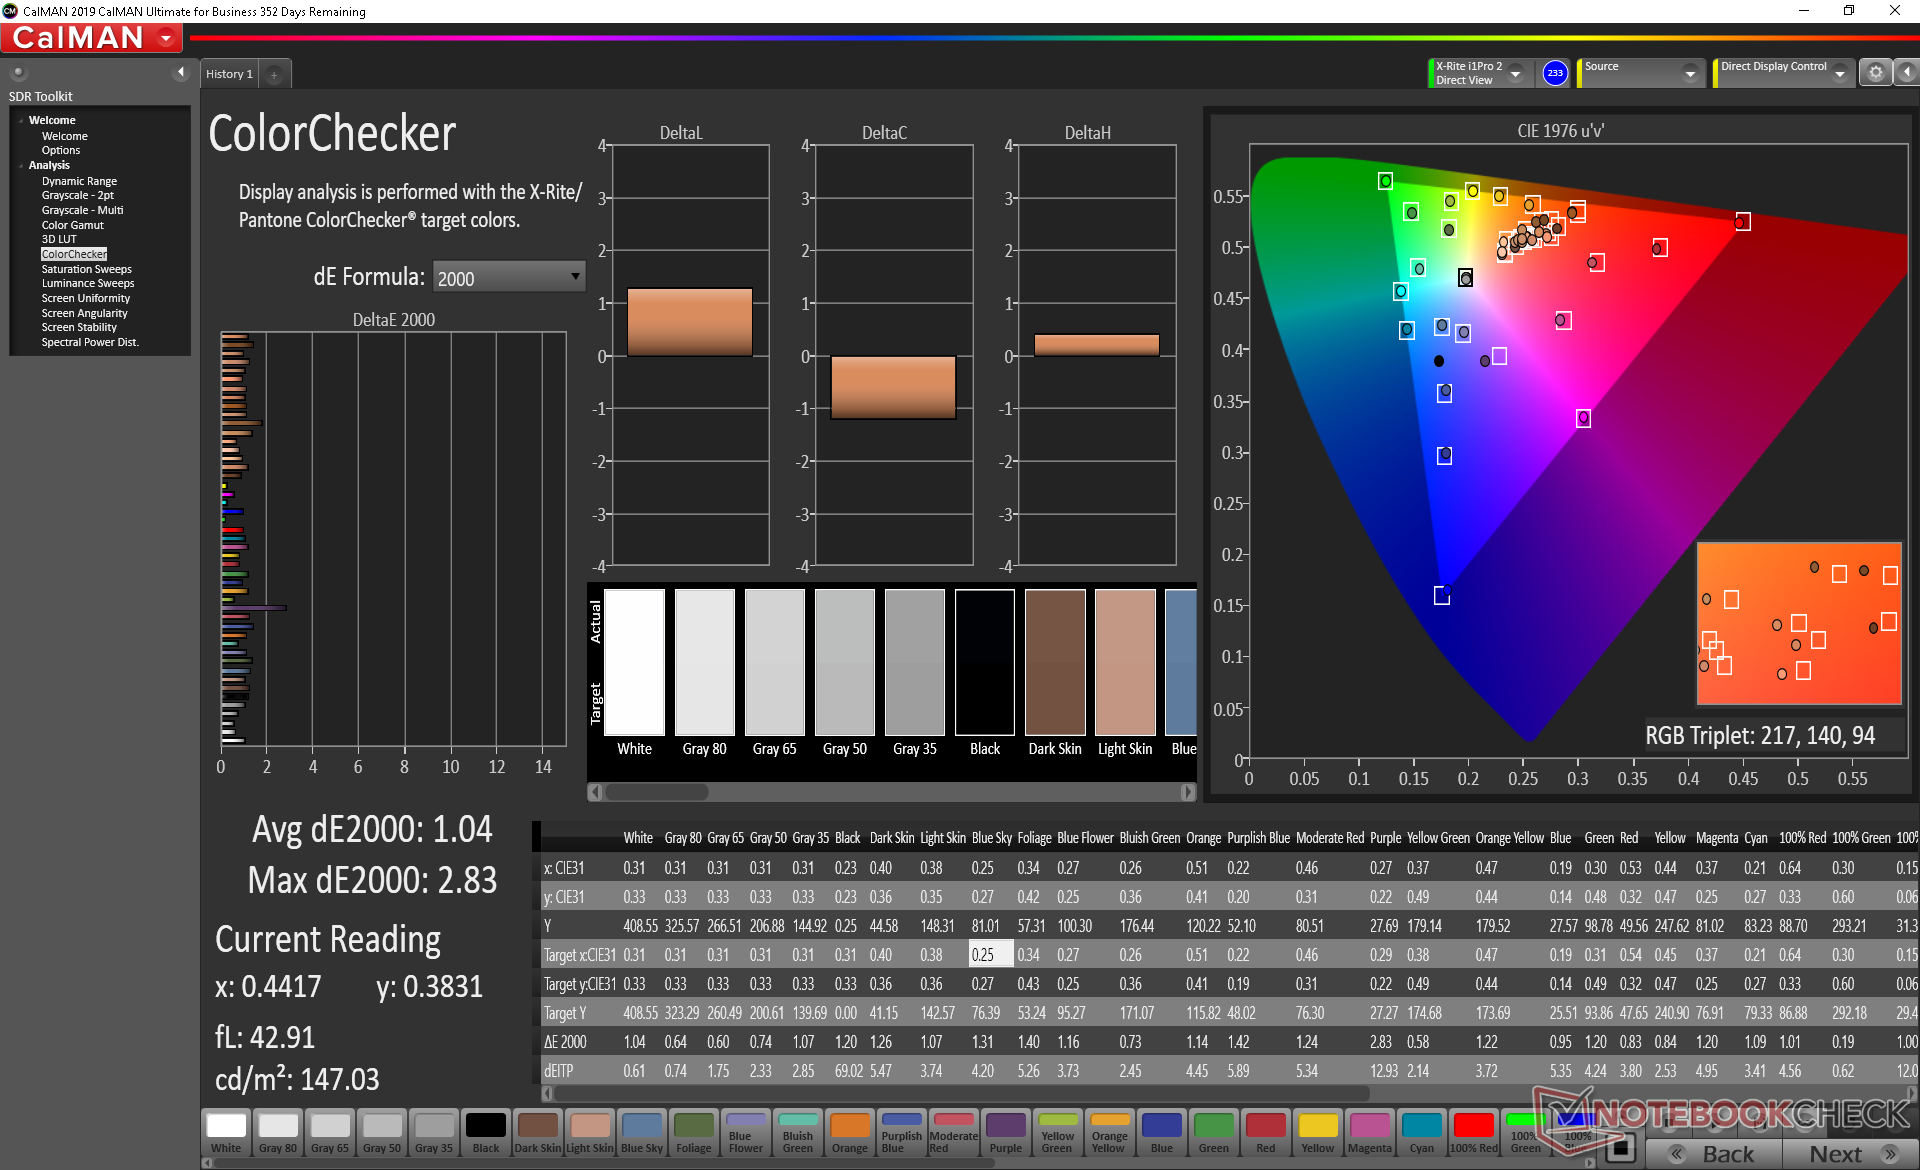
ΔE ColorChecker Calman: 1.04 | ∀{0.5-29.43 Ø4.73}
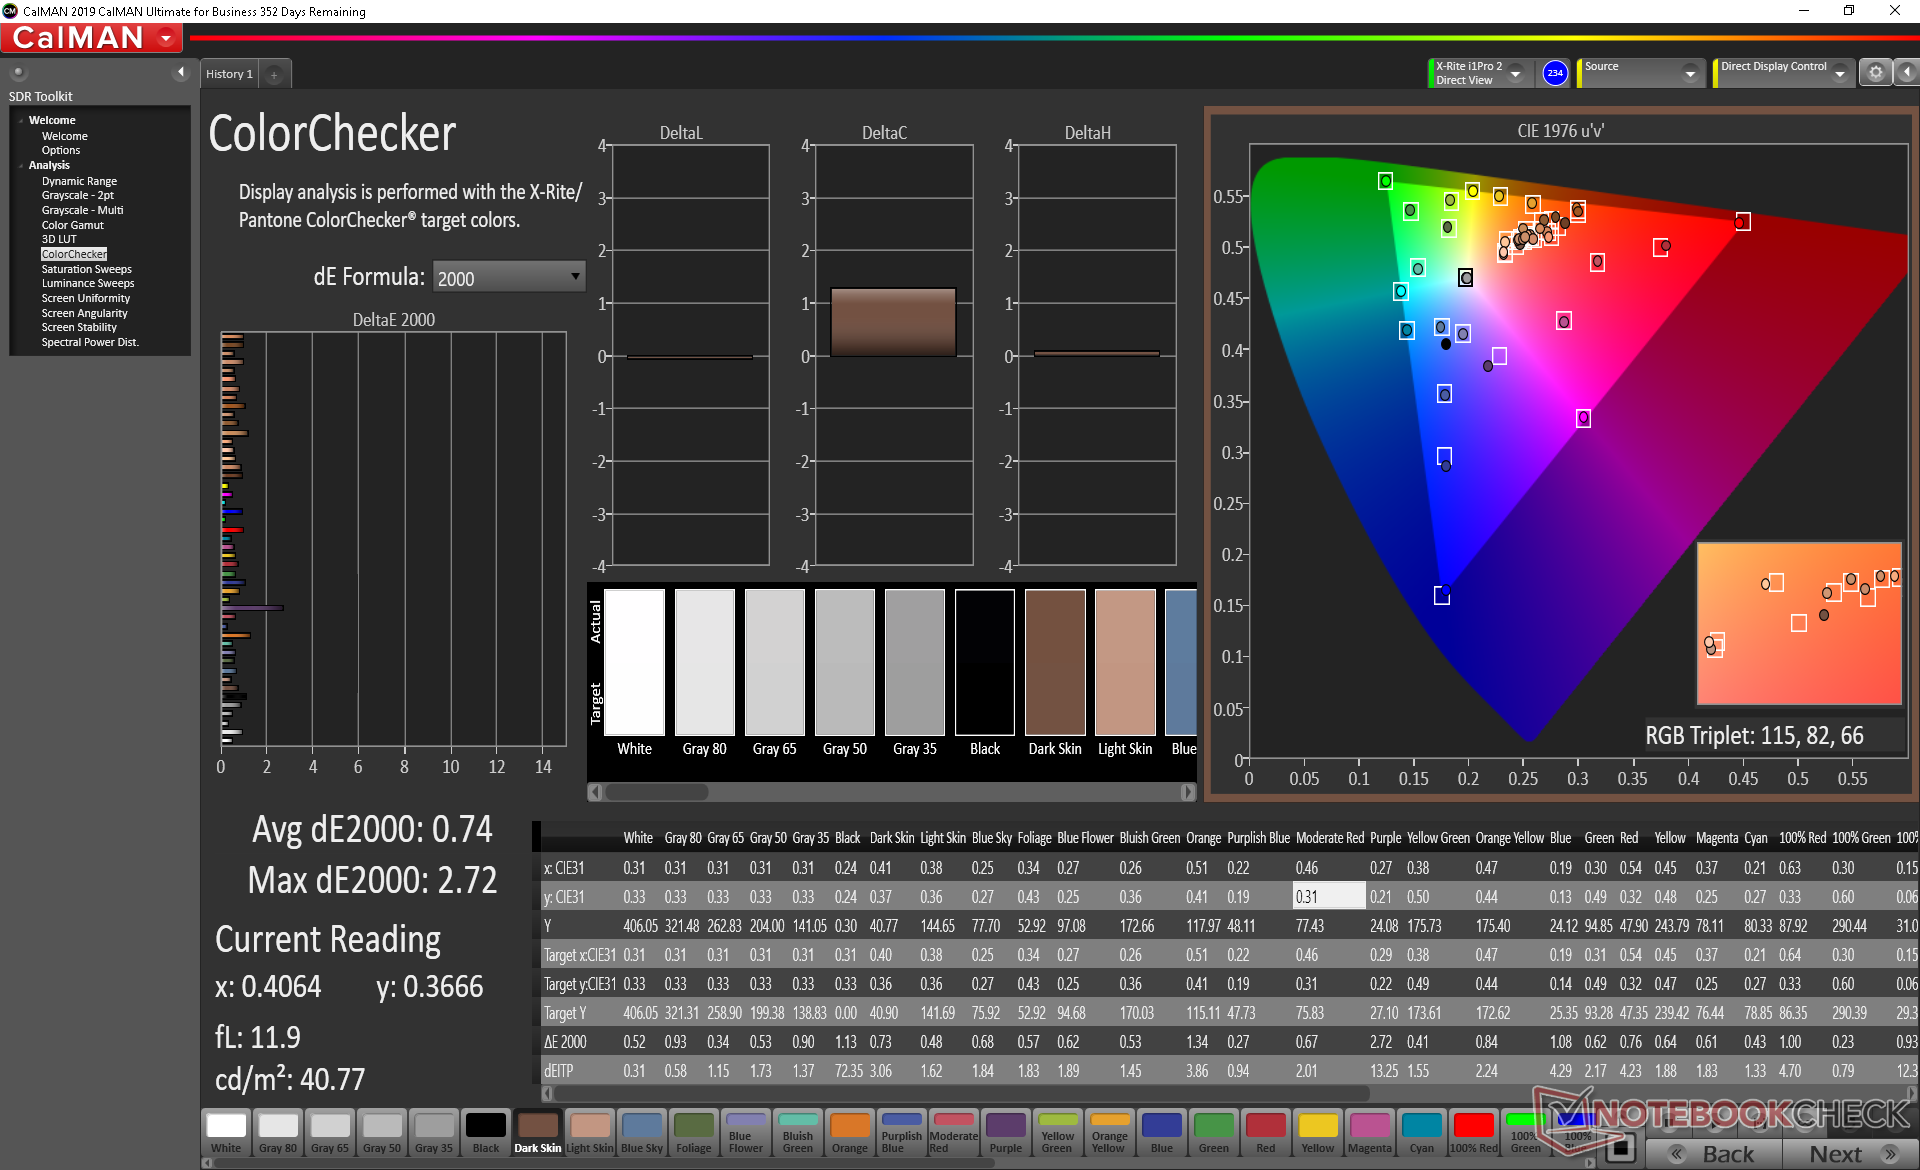
calibrated: 0.74
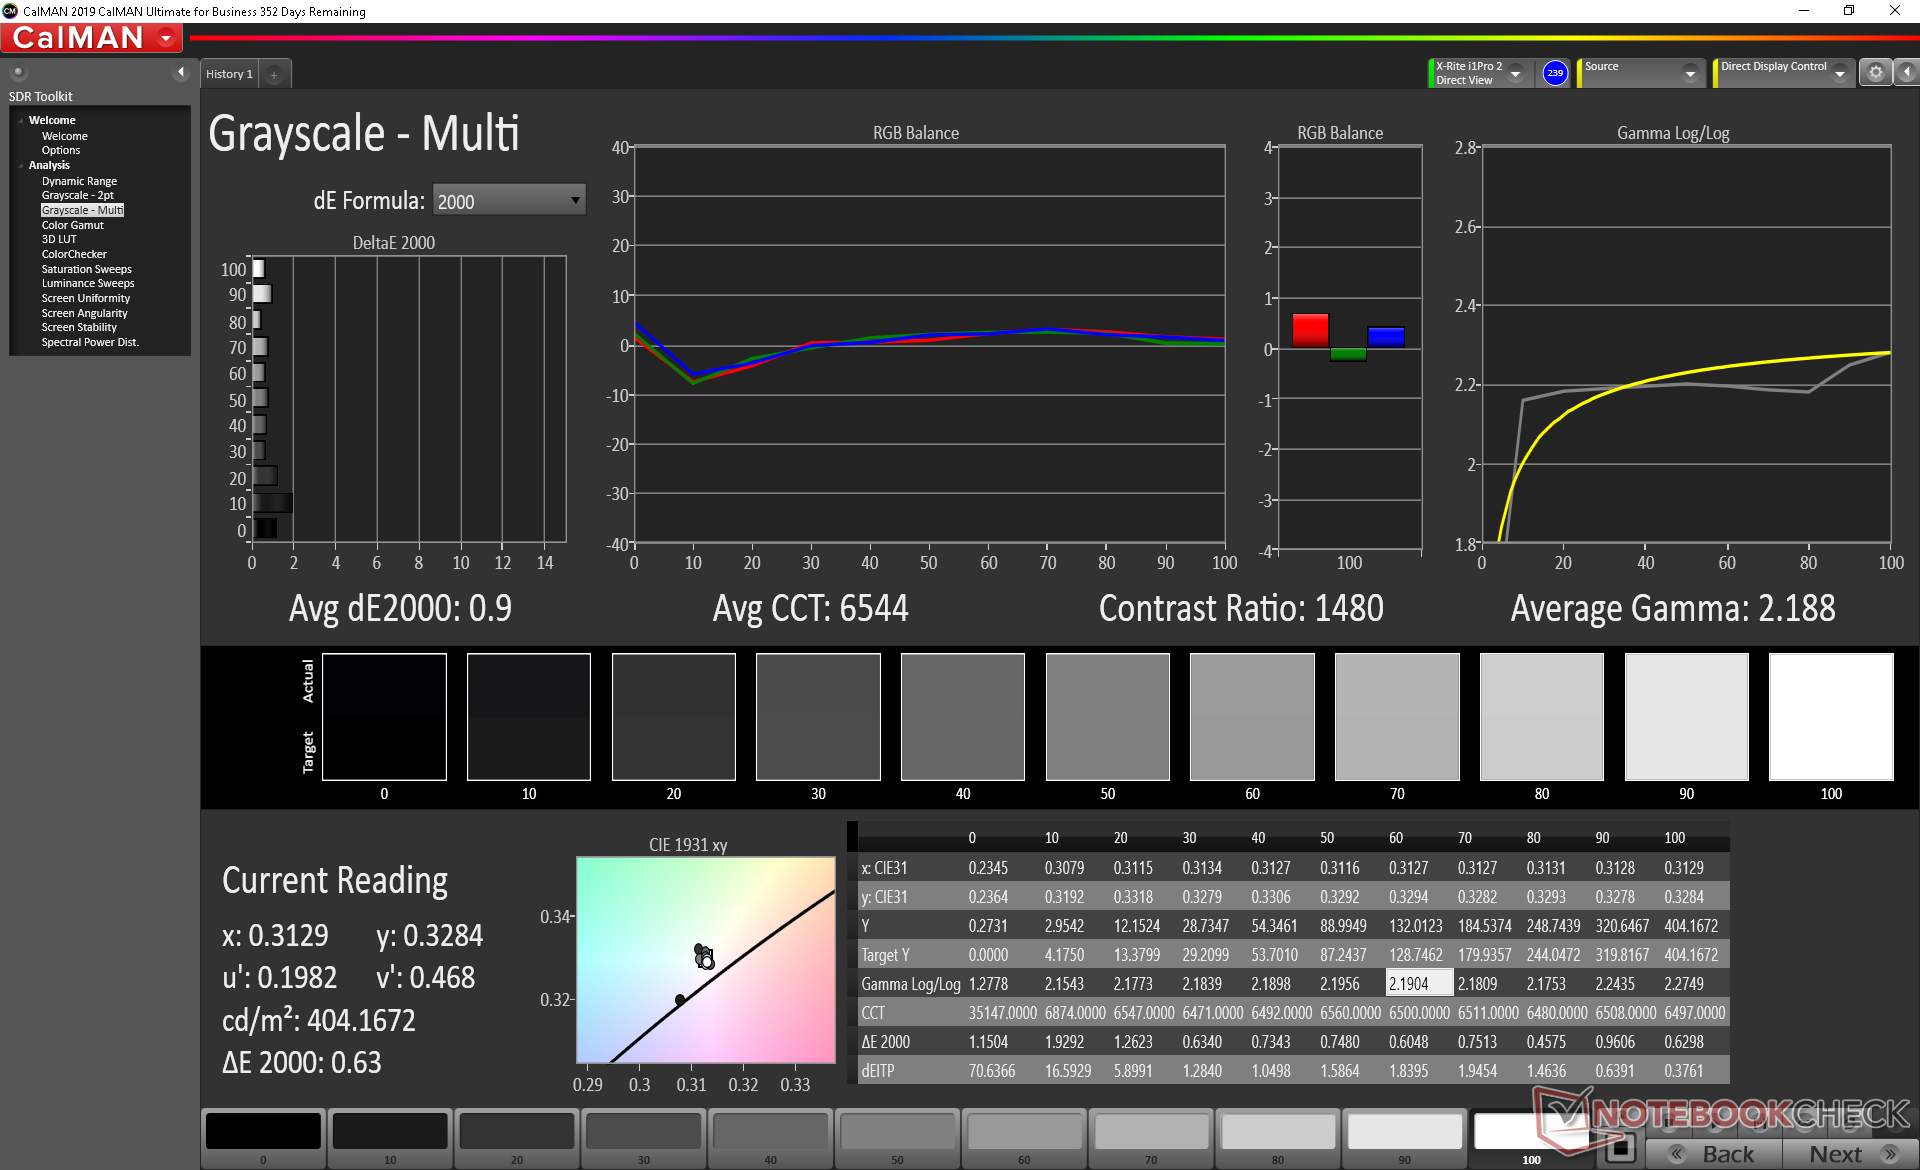
ΔE Greyscale Calman: 1.3 | ∀{0.09-98 Ø4.97}
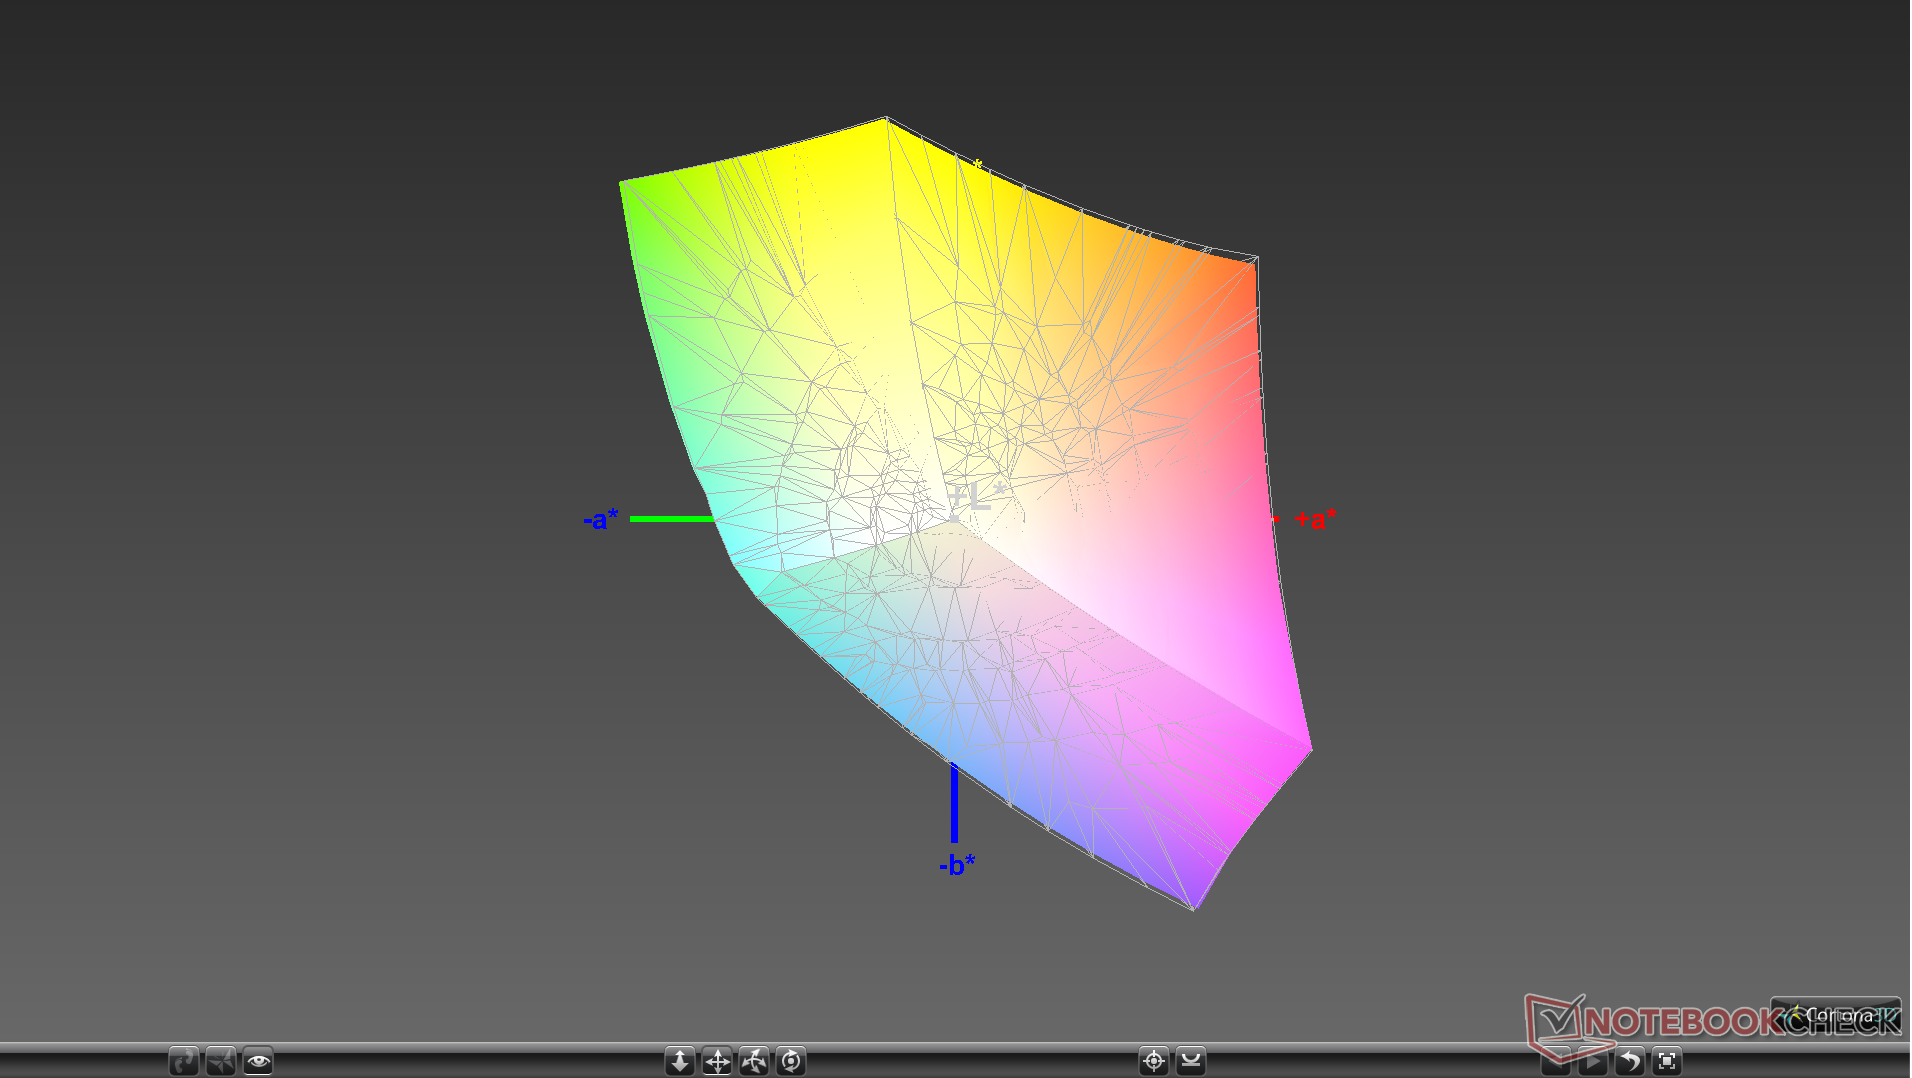
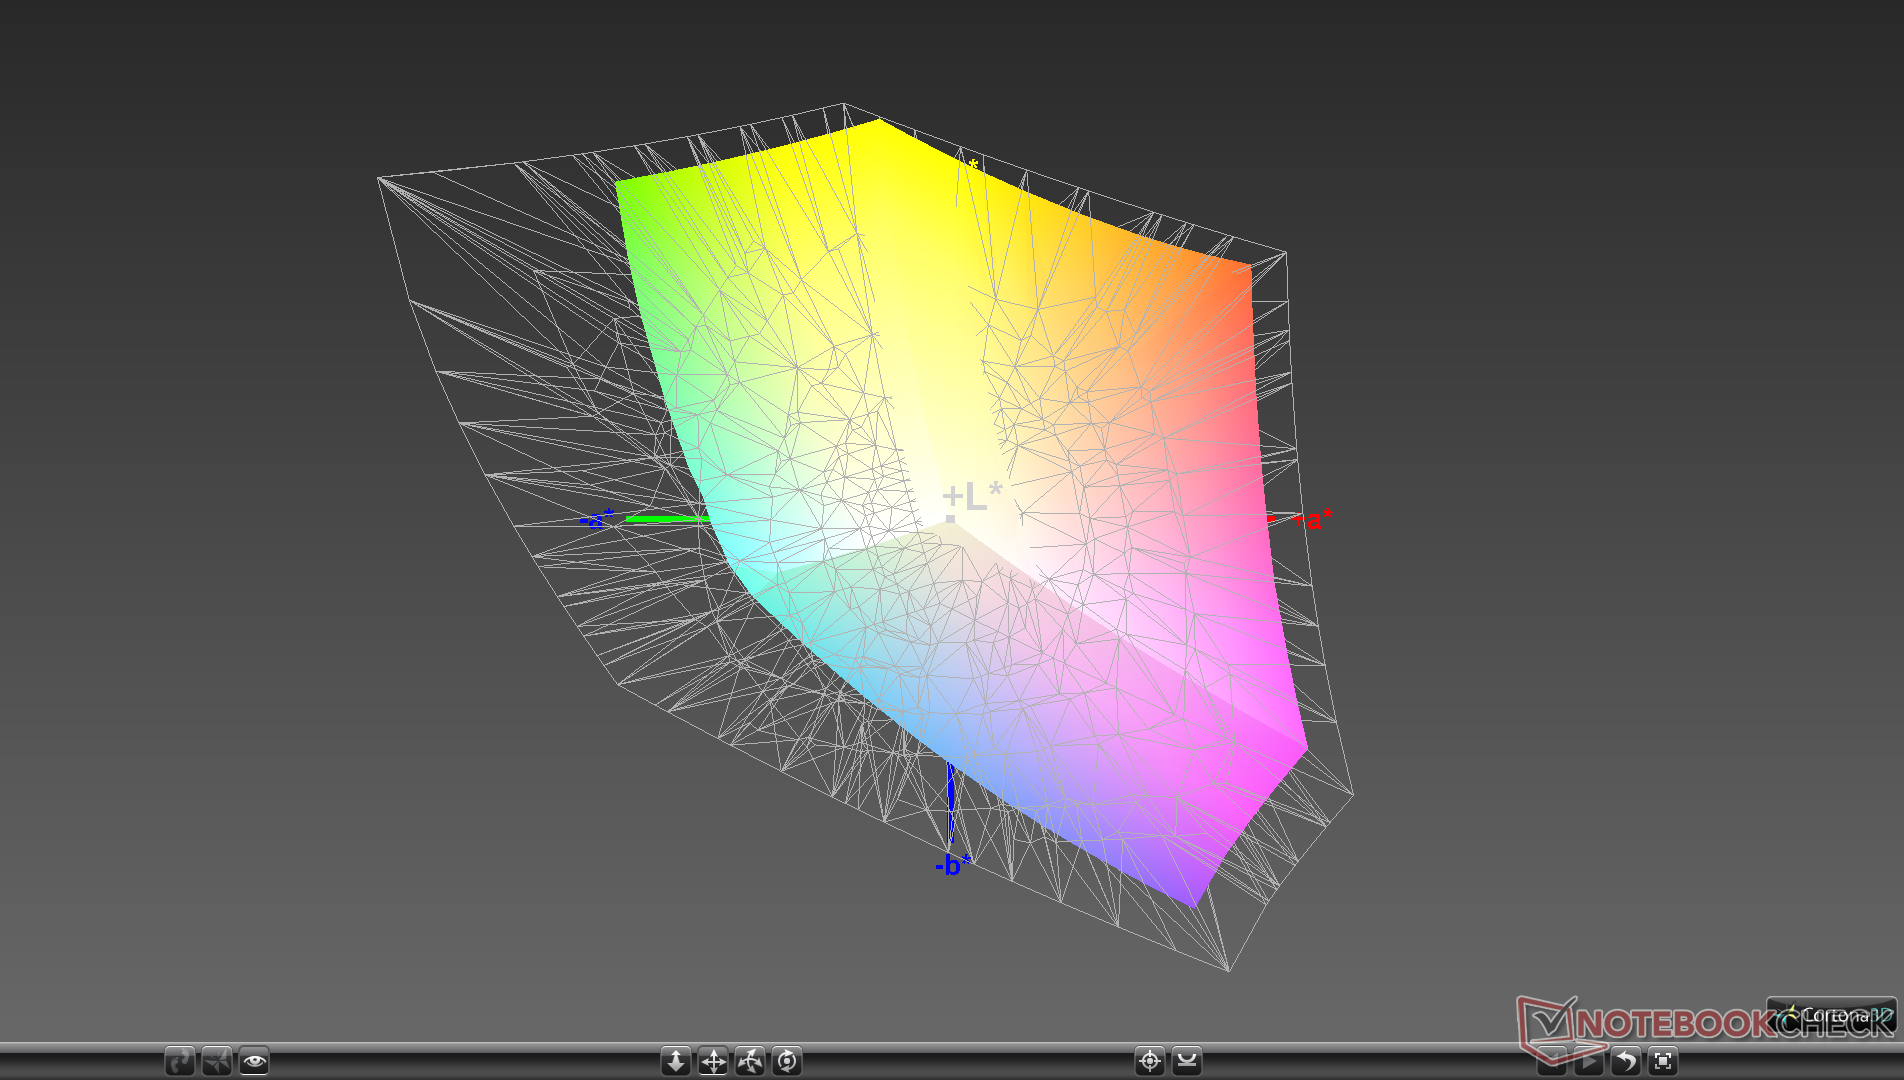
98.4% sRGB (Argyll 1.6.3 3D)
62.4% AdobeRGB 1998 (Argyll 1.6.3 3D)
67.8% AdobeRGB 1998 (Argyll 3D)
98.4% sRGB (Argyll 3D)
65.6% Display P3 (Argyll 3D)
Gamma: 2.07
CCT: 6634 K
| Microsoft Surface Laptop 3 15 i7-1065G7 Sharp LQ150P1JX51, IPS, 15", 2496x1664 | Apple MacBook Pro 16 2019 i9 5500M APPA044, IPS, 16", 3072x1920 | Dell XPS 15 7590 i5 iGPU FHD LQ156M1, IPS, 15.6", 1920x1080 | Asus ZenBook 15 UX534FT-DB77 BOE NV156FHM-N63, IPS, 15.6", 1920x1080 | MSI Prestige 15 A10SC Sharp LQ156D1JW42, IPS, 15.6", 3840x2160 | Microsoft Surface Laptop 3 15 Ryzen 5 3580U Sharp LQ150P1JX51, IPS, 15", 2496x1664 | |
|---|---|---|---|---|---|---|
| Display | 1% | -5% | 22% | -1% | ||
| Display P3 Coverage (%) | 65.6 | 66.5 1% | 66.6 2% | 82 25% | 66.9 2% | |
| sRGB Coverage (%) | 98.4 | 98 0% | 87.7 -11% | 98.3 0% | 99.3 1% | |
| AdobeRGB 1998 Coverage (%) | 67.8 | 68.4 1% | 64.1 -5% | 96.2 42% | 63.7 -6% | |
| Response Times | 7% | 11% | 20% | -8% | 10% | |
| Response Time Grey 50% / Grey 80% * (ms) | 56 ? | 52.4 ? 6% | 52.8 ? 6% | 41.2 ? 26% | 60 ? -7% | 47.2 ? 16% |
| Response Time Black / White * (ms) | 38 ? | 34.9 ? 8% | 32 ? 16% | 33.2 ? 13% | 41.2 ? -8% | 36.8 ? 3% |
| PWM Frequency (Hz) | 21370 ? | 131700 | 1020 ? | 26040 ? | 21370 ? | |
| Screen | -14% | -34% | -132% | -65% | -31% | |
| Brightness middle (cd/m²) | 412.4 | 519 26% | 588 43% | 312.6 -24% | 464.5 13% | 416.9 1% |
| Brightness (cd/m²) | 374 | 477 28% | 555 48% | 290 -22% | 451 21% | 389 4% |
| Brightness Distribution (%) | 78 | 86 10% | 89 14% | 85 9% | 92 18% | 86 10% |
| Black Level * (cd/m²) | 0.35 | 0.39 -11% | 0.4 -14% | 0.31 11% | 0.5 -43% | 0.4 -14% |
| Contrast (:1) | 1178 | 1331 13% | 1470 25% | 1008 -14% | 929 -21% | 1042 -12% |
| Colorchecker dE 2000 * | 1.04 | 2.28 -119% | 2.5 -140% | 5.78 -456% | 3.36 -223% | 2.75 -164% |
| Colorchecker dE 2000 max. * | 2.83 | 6.54 -131% | 6.3 -123% | 8.86 -213% | 7.06 -149% | 6.64 -135% |
| Colorchecker dE 2000 calibrated * | 0.74 | 0.86 -16% | 0.6 19% | 3.78 -411% | 3.42 -362% | 0.71 4% |
| Greyscale dE 2000 * | 1.3 | 0.9 31% | 4.5 -246% | 5.4 -315% | 1.3 -0% | 1.8 -38% |
| Gamma | 2.07 106% | 2145 0% | 2.2 100% | 2.21 100% | 2.14 103% | 2.09 105% |
| CCT | 6634 98% | 6572 99% | 6836 95% | 7864 83% | 6596 99% | 6646 98% |
| Color Space (Percent of AdobeRGB 1998) (%) | 62.4 | 78 25% | 63.2 1% | 57.1 -8% | 84.8 36% | 63.4 2% |
| Color Space (Percent of sRGB) (%) | 98.4 | 98 0% | 87.4 -11% | 98.3 0% | 99.4 1% | |
| Media totale (Programma / Settaggio) | -4% /
-11% | -7% /
-22% | -39% /
-89% | -17% /
-41% | -7% /
-20% |
* ... Meglio usare valori piccoli
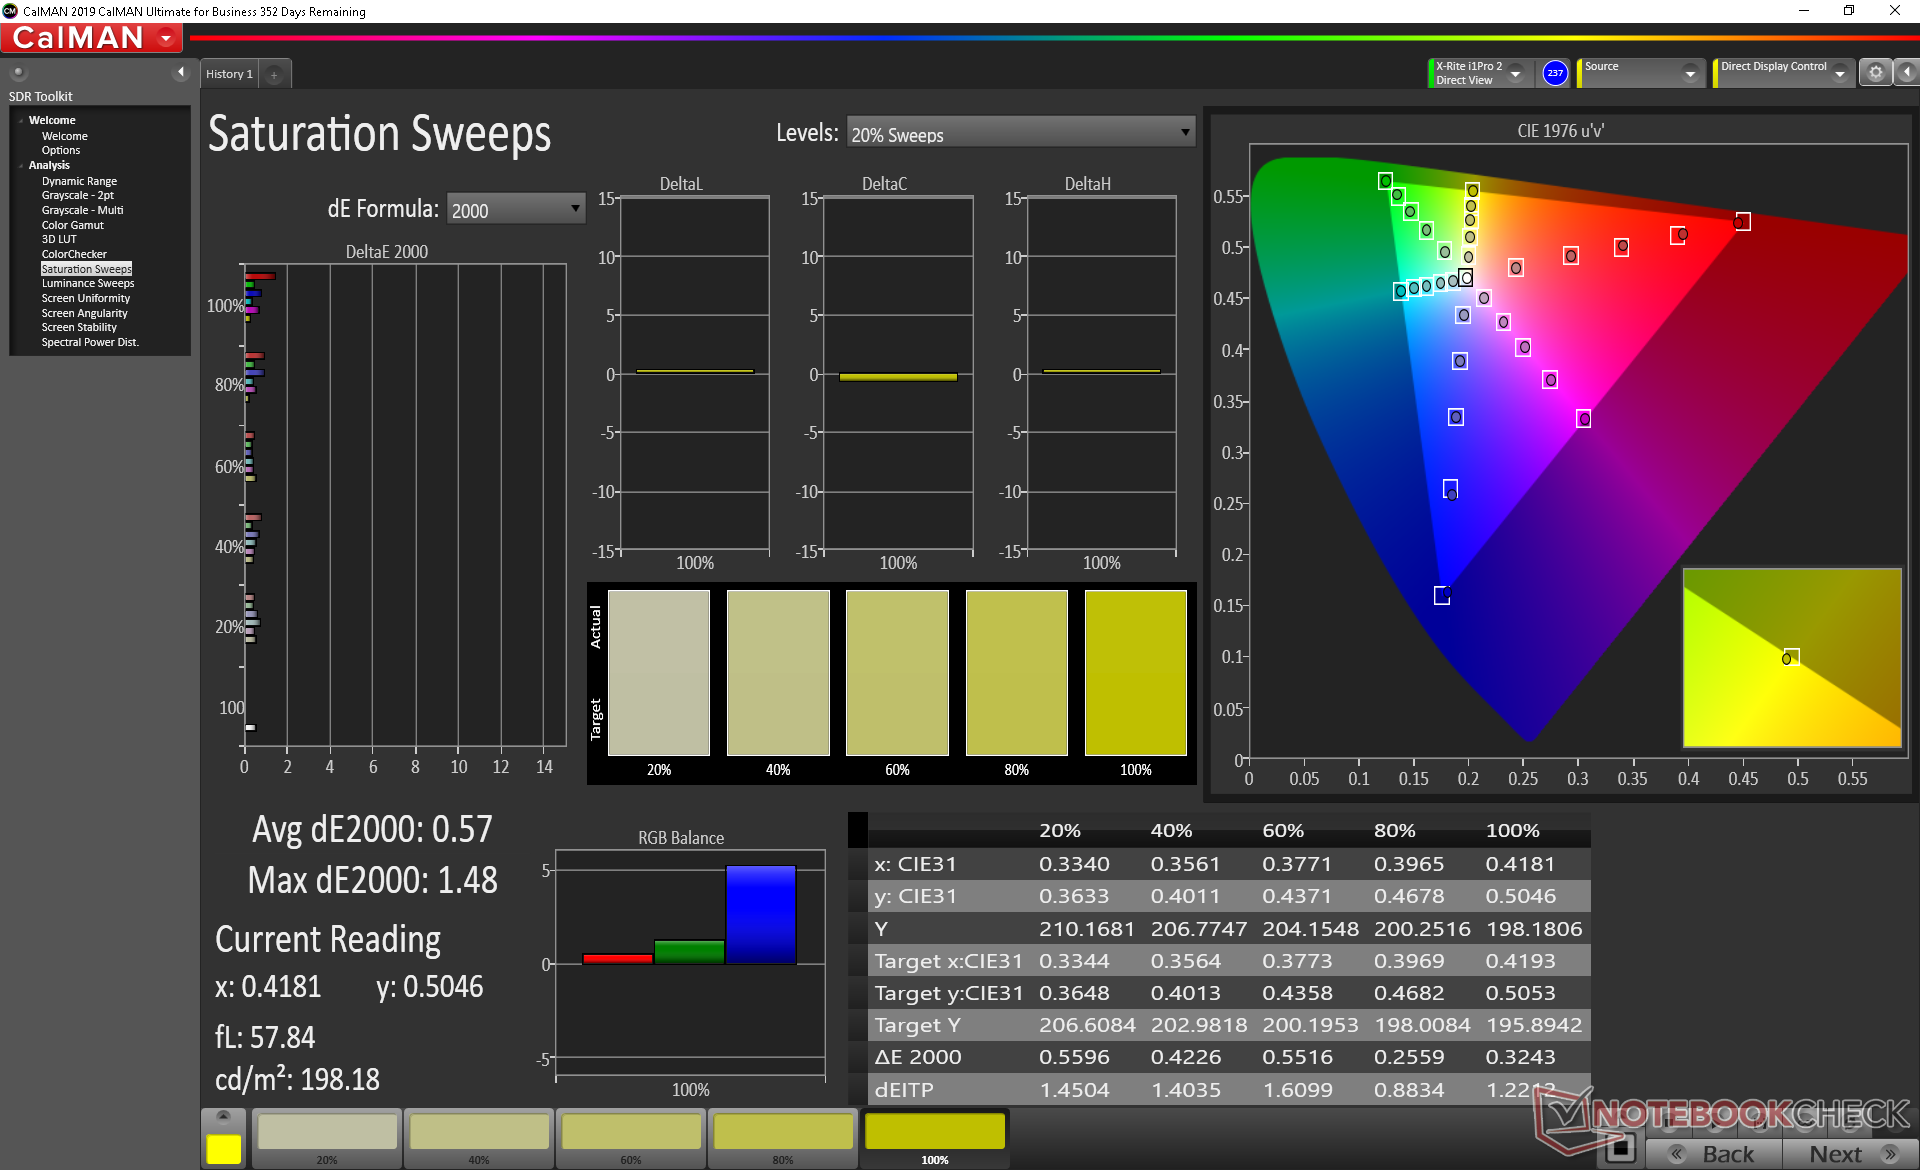
Lo spazio colore copre l'sRGB e circa il 62% dello standard AdobeRGB. La copertura completa di AdobeRGB non è disponibile a differenza di XPS 15, Asus ZenBook Pro 15 o MSI Prestige 15.
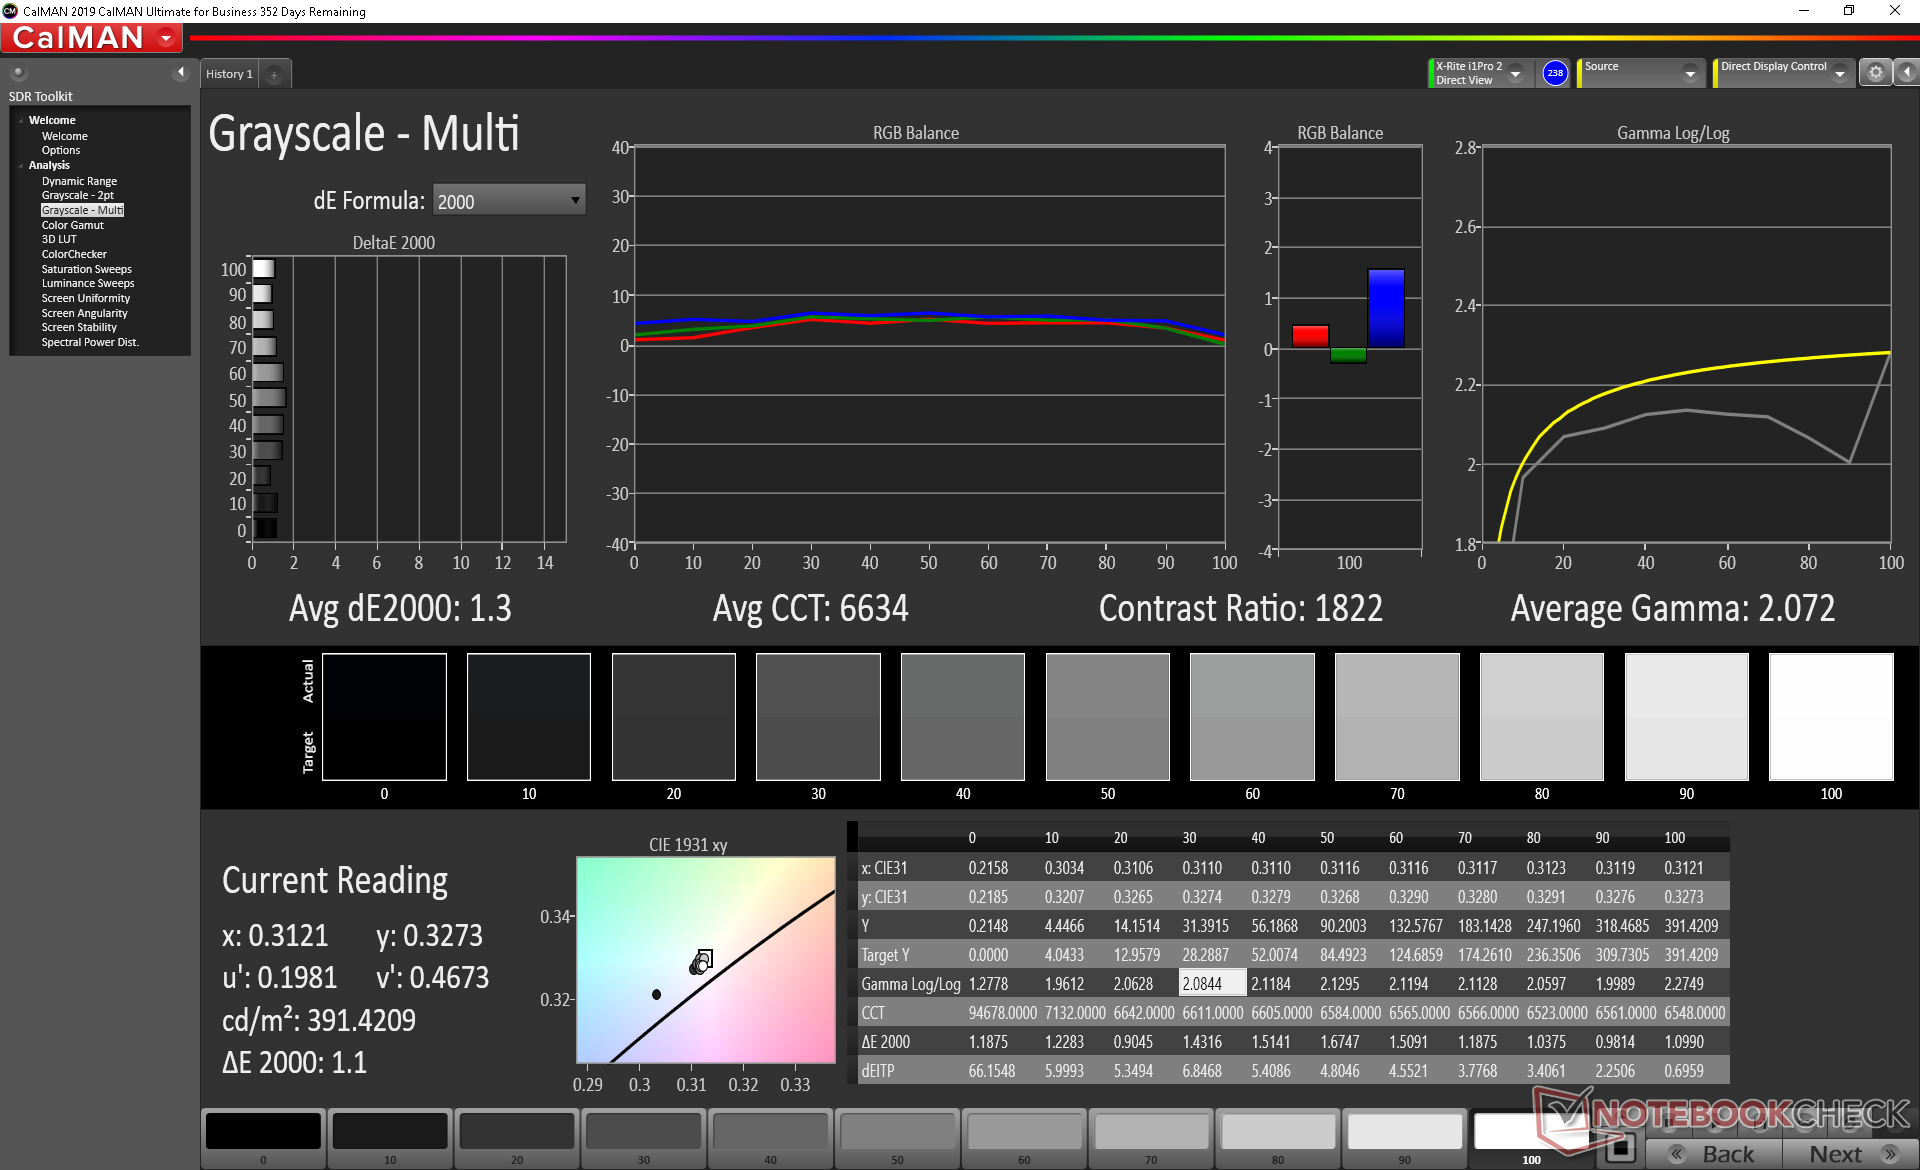
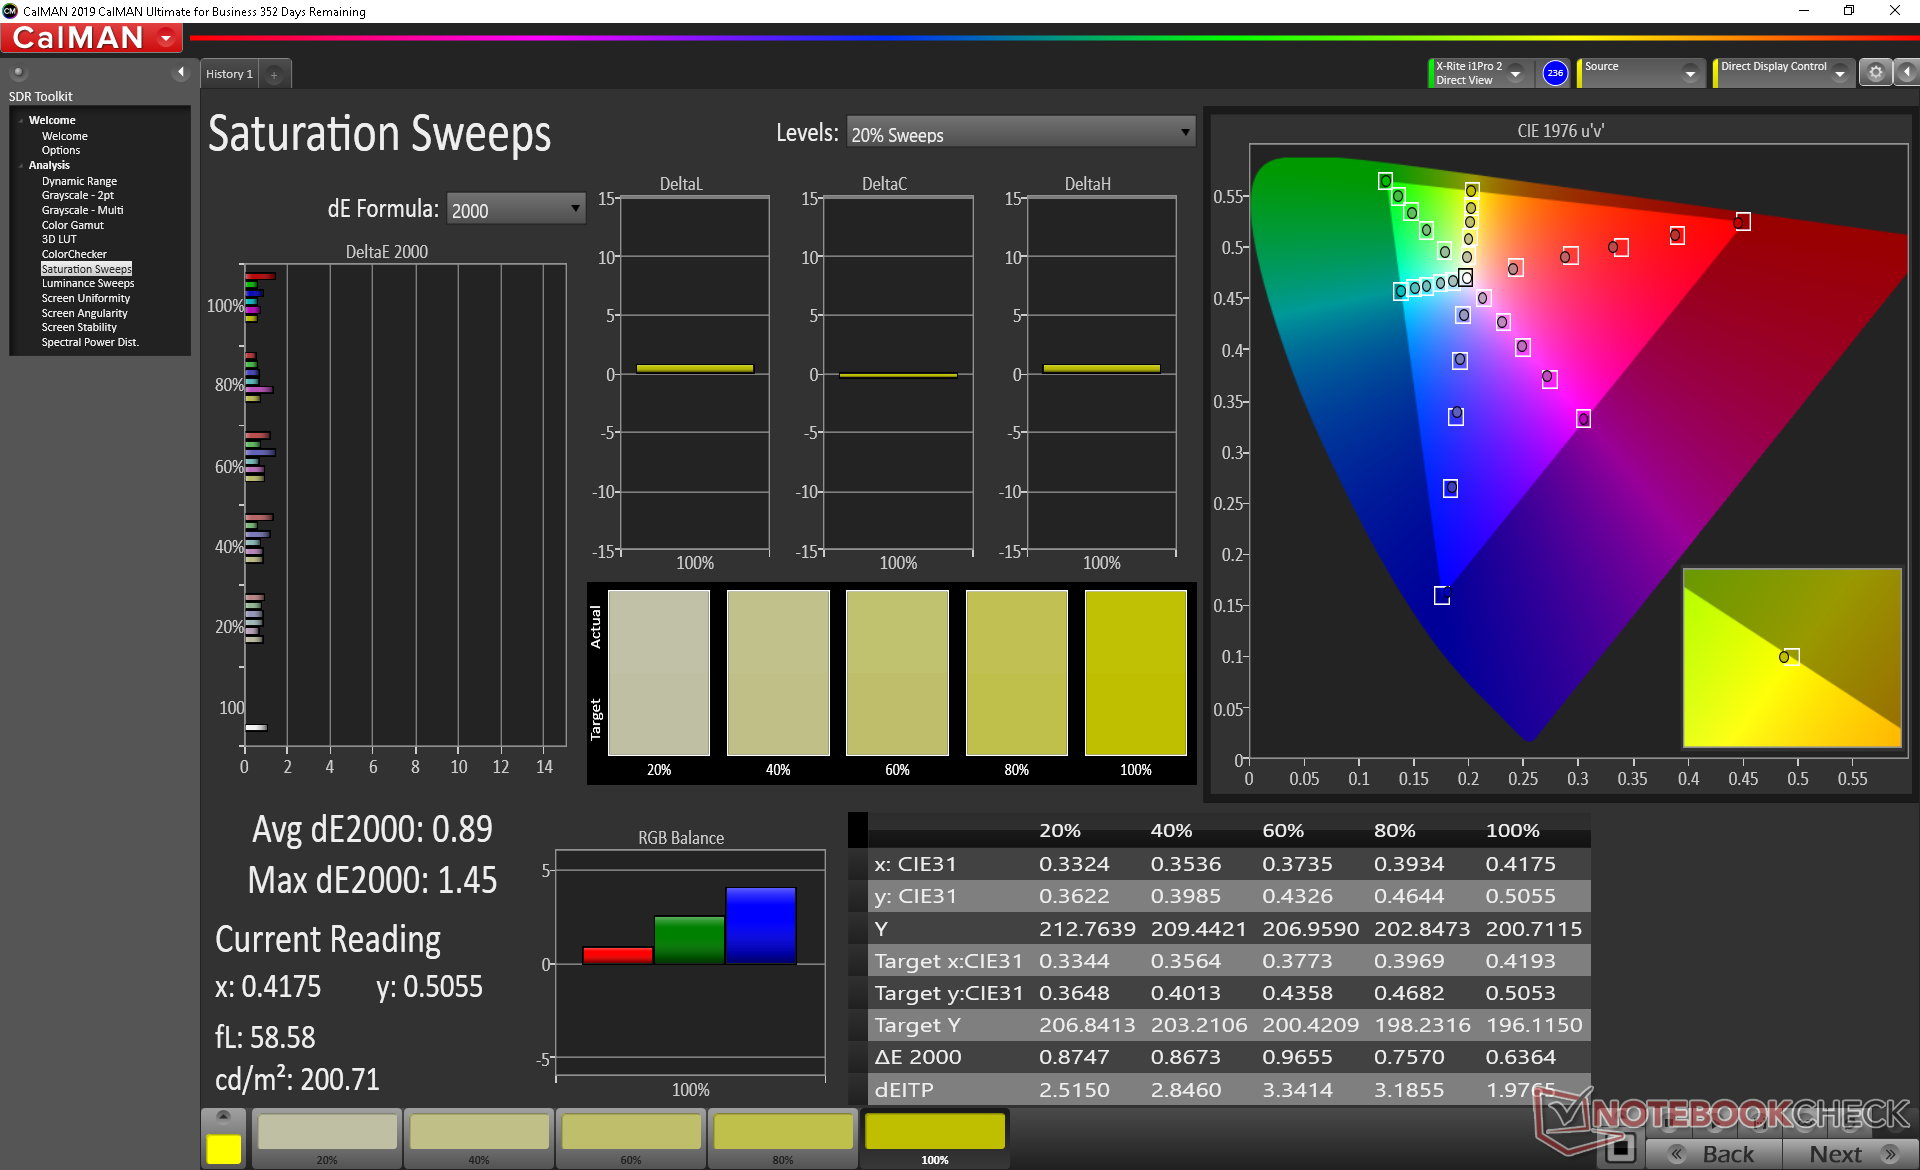
La nostra unità Intel è meglio calibrata rispetto alla nostra unità Ryzen. Intel dice che non è stata eseguita alcuna post-calibrazione sul nostro test il che suggerisce che alcune SKU del Surface Laptop 3 possono essere meglio calibrate di altre. I valori medi della scala di grigi e del colore DeltaE sono già bassi, rispettivamente a soli 1,3 e 0,89. La calibrazione del display migliora ulteriormente questi valori solo marginalmente.
Tempi di risposta del Display
| ↔ Tempi di risposta dal Nero al Bianco | ||
|---|---|---|
| 38 ms ... aumenta ↗ e diminuisce ↘ combinato | ↗ 21.2 ms Incremento | 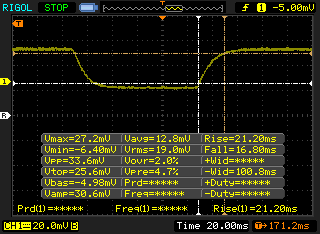 |
| ↘ 16.8 ms Calo | ||
| Lo schermo mostra tempi di risposta lenti nei nostri tests e sarà insoddisfacente per i gamers. In confronto, tutti i dispositivi di test variano da 0.1 (minimo) a 240 (massimo) ms. » 96 % di tutti i dispositivi è migliore. Questo significa che i tempi di risposta rilevati sono peggiori rispetto alla media di tutti i dispositivi testati (19.9 ms). | ||
| ↔ Tempo di risposta dal 50% Grigio all'80% Grigio | ||
| 56 ms ... aumenta ↗ e diminuisce ↘ combinato | ↗ 27.6 ms Incremento | 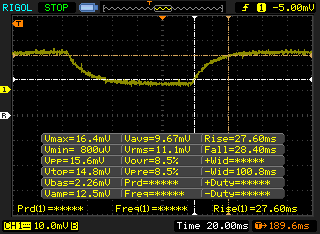 |
| ↘ 28.4 ms Calo | ||
| Lo schermo mostra tempi di risposta lenti nei nostri tests e sarà insoddisfacente per i gamers. In confronto, tutti i dispositivi di test variano da 0.165 (minimo) a 636 (massimo) ms. » 93 % di tutti i dispositivi è migliore. Questo significa che i tempi di risposta rilevati sono peggiori rispetto alla media di tutti i dispositivi testati (31.1 ms). | ||
Sfarfallio dello schermo / PWM (Pulse-Width Modulation)
| flickering dello schermo / PWM rilevato | 21370 Hz | ≤ 51 % settaggio luminosita' | 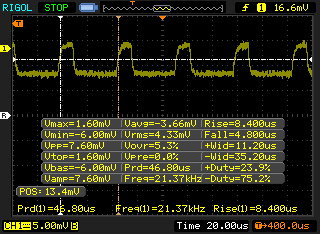 |
Il display sfarfalla a 21370 Hz (Probabilmente a causa dell'uso di PWM) Flickering rilevato ad una luminosita' di 51 % o inferiore. Non dovrebbe verificarsi flickering o PWM sopra questo valore di luminosita'. La frequenza di 21370 Hz è abbastanza alta, quindi la maggioranza degli utenti sensibili al PWM non dovrebbero notare alcun flickering. In confronto: 52 % di tutti i dispositivi testati non utilizza PWM per ridurre la luminosita' del display. Se è rilevato PWM, una media di 7798 (minimo: 5 - massimo: 343500) Hz è stata rilevata. | |||

Performance
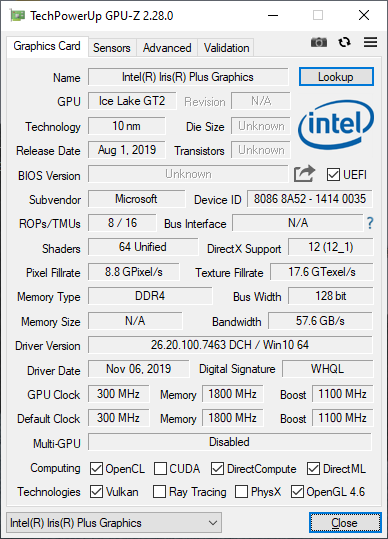
La SKU Core i7-1065G7 è commercializzata come la più veloce configurazione Surface Laptop 3 di Microsoft. Esso compete direttamente con il Ryzen 7 3780U di AMD nello stesso modo in cui la SKU Core i5-1035G7 compete con il Ryzen 5 3580U. Tenete presente che questa stessa CPU Intel Ice Lake si trova anche sull'ultimo Surface Pro 7. Anche se non si gioca, la potenza grafica extra dell'Iris Plus G7 integrato dovrebbe rivelarsi utile per gli editor grafici, per accelerare la codifica o la decodifica video e per il supporto di monitor esterni a risoluzioni più elevate.
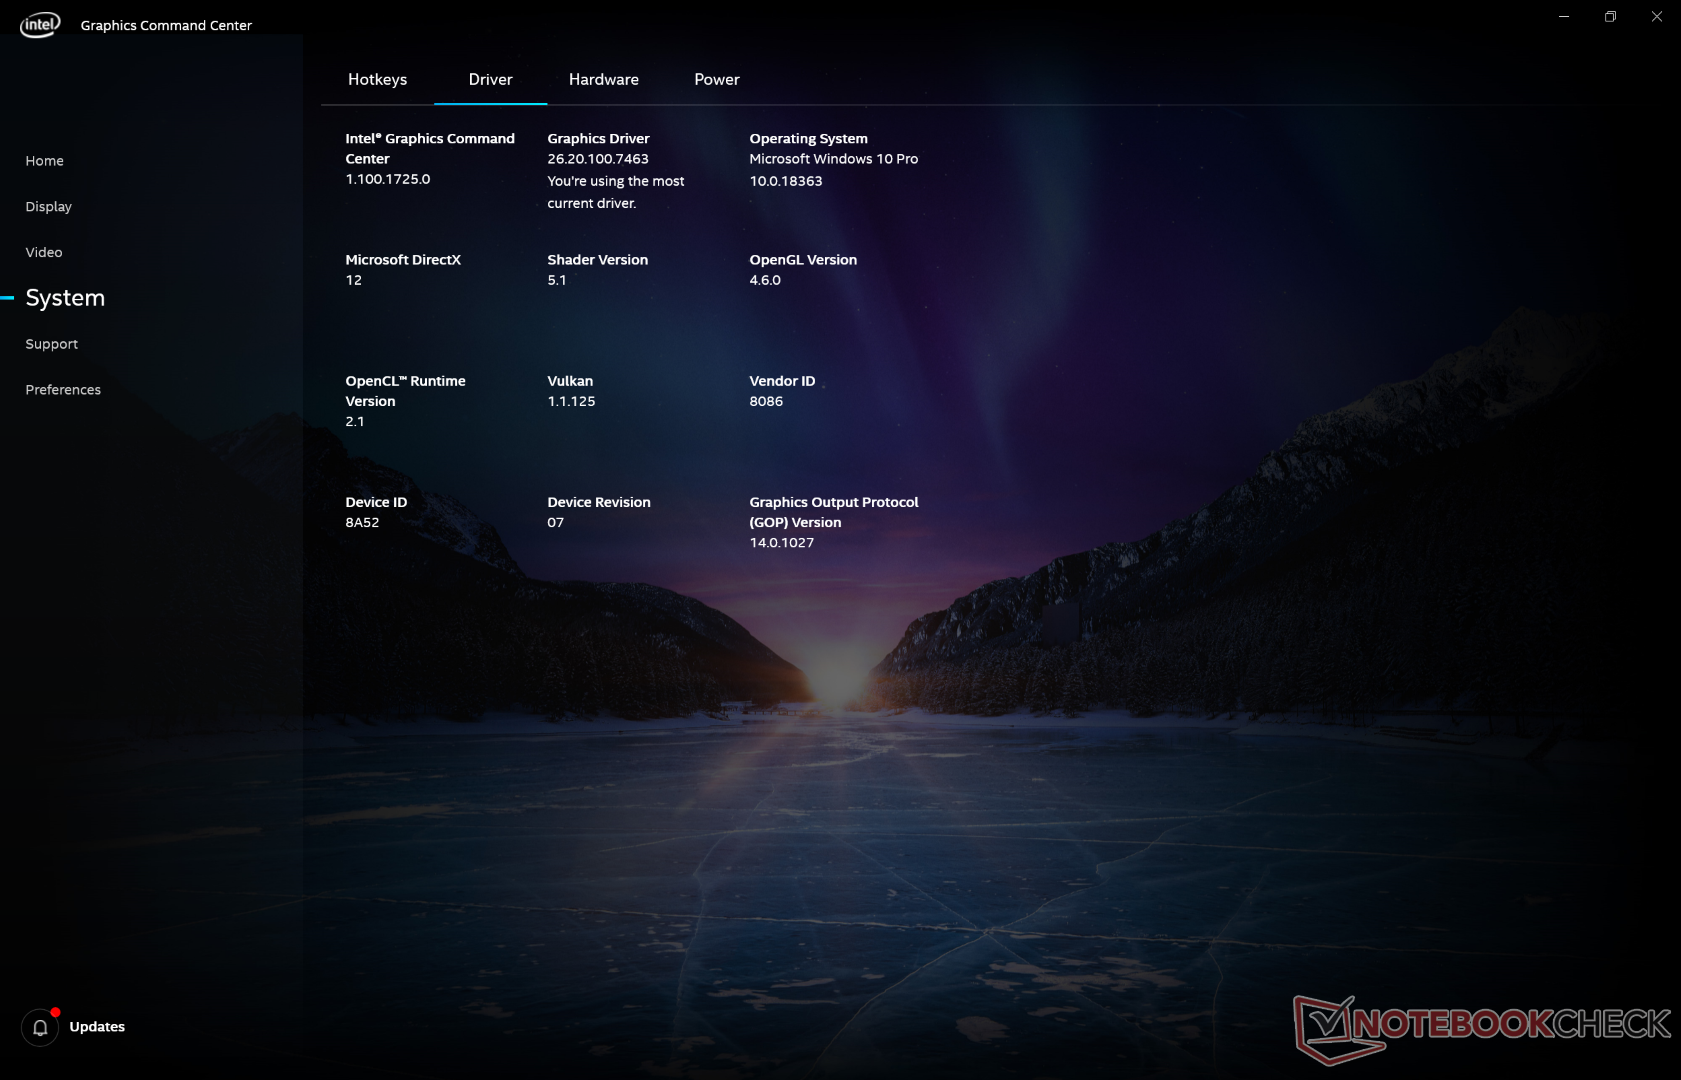
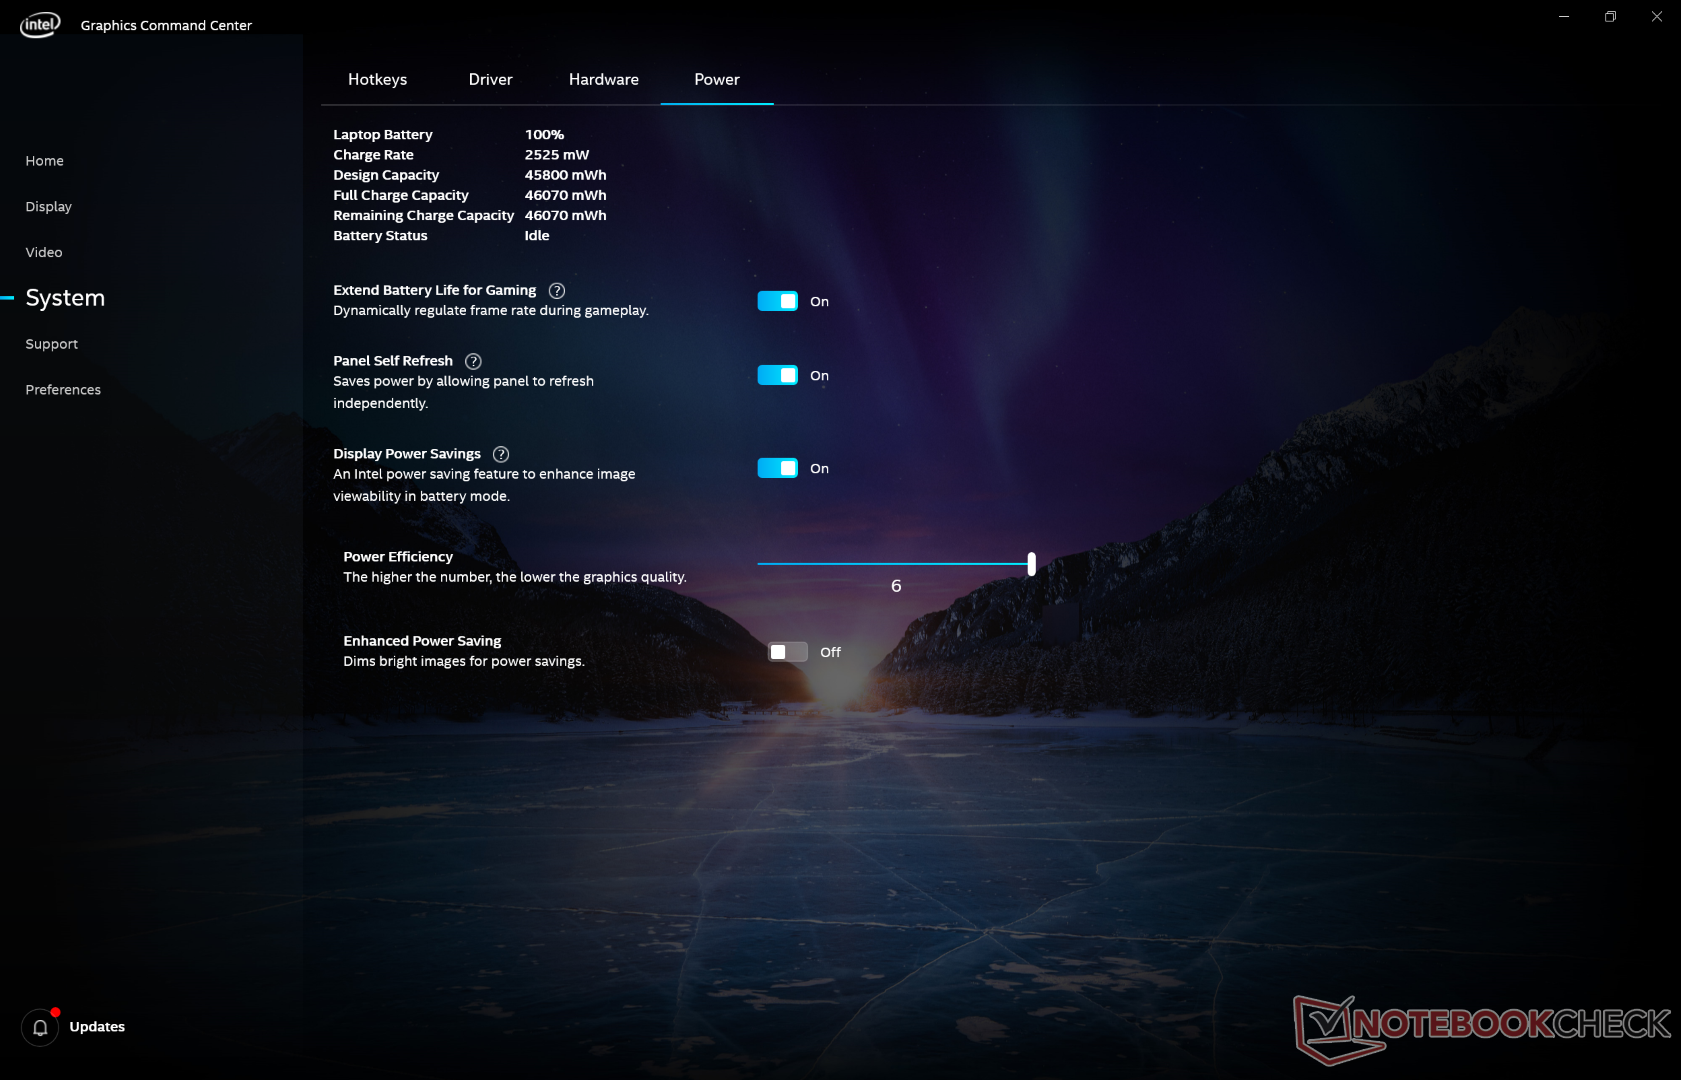
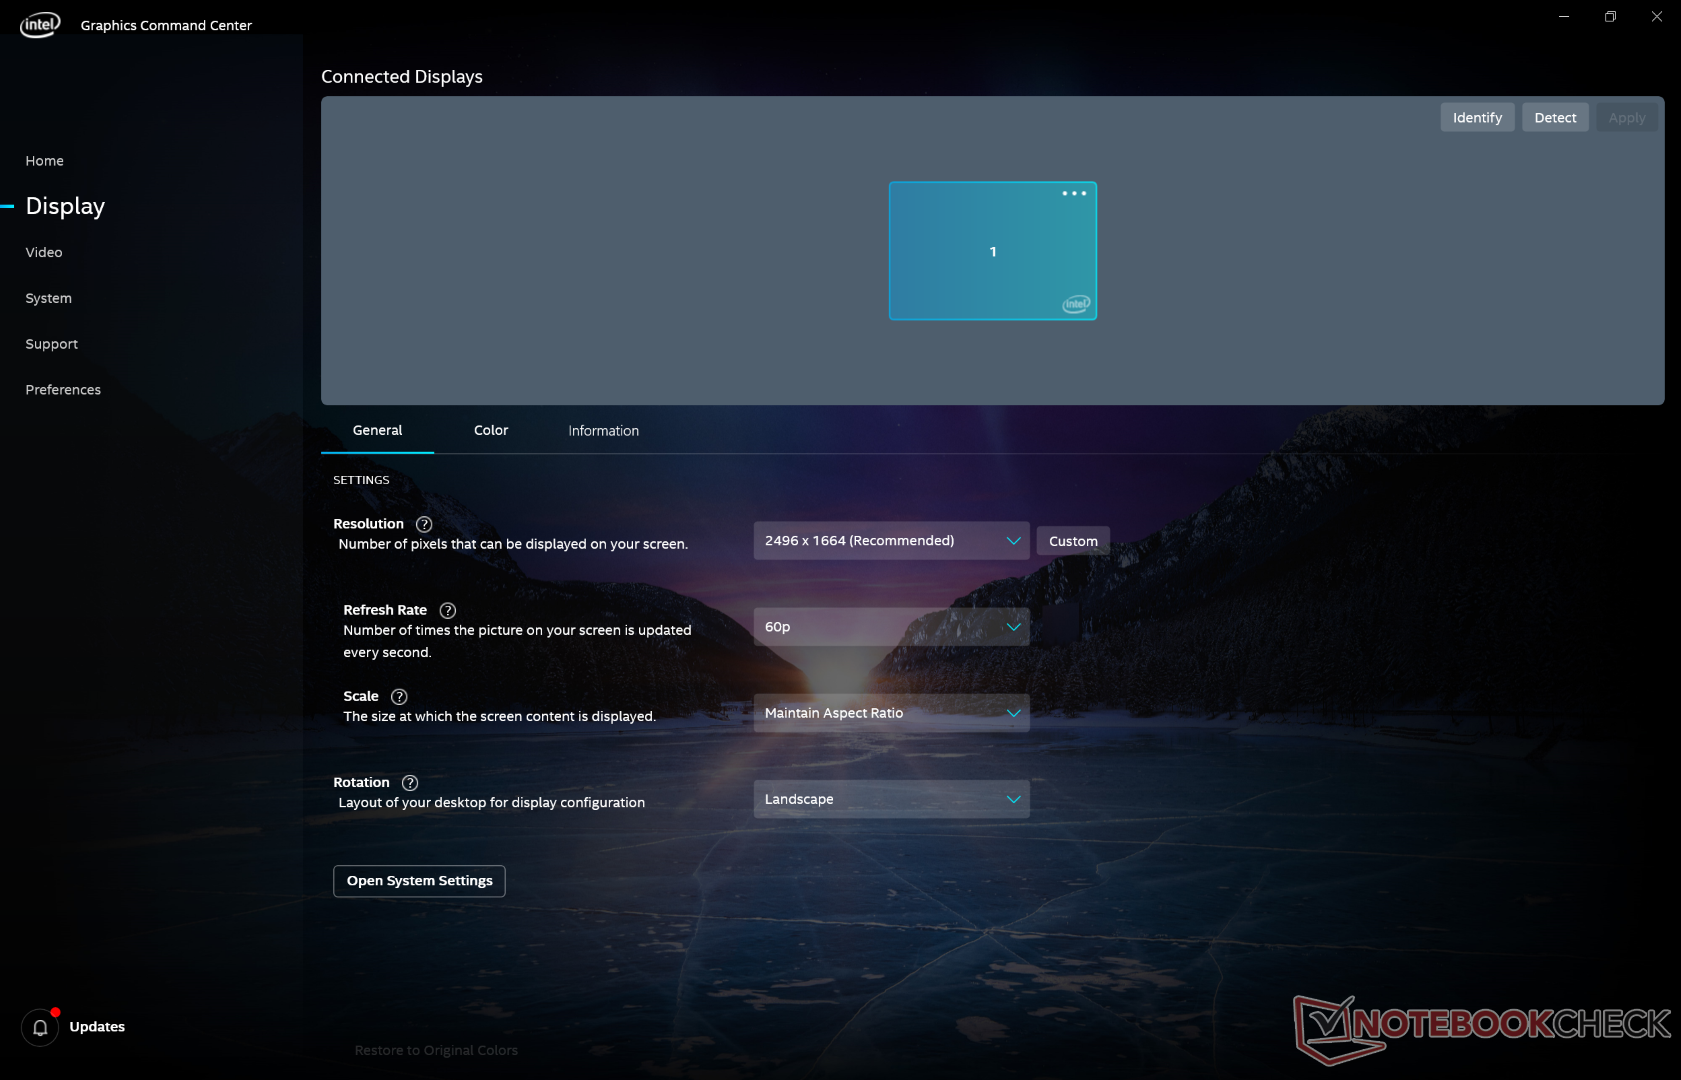
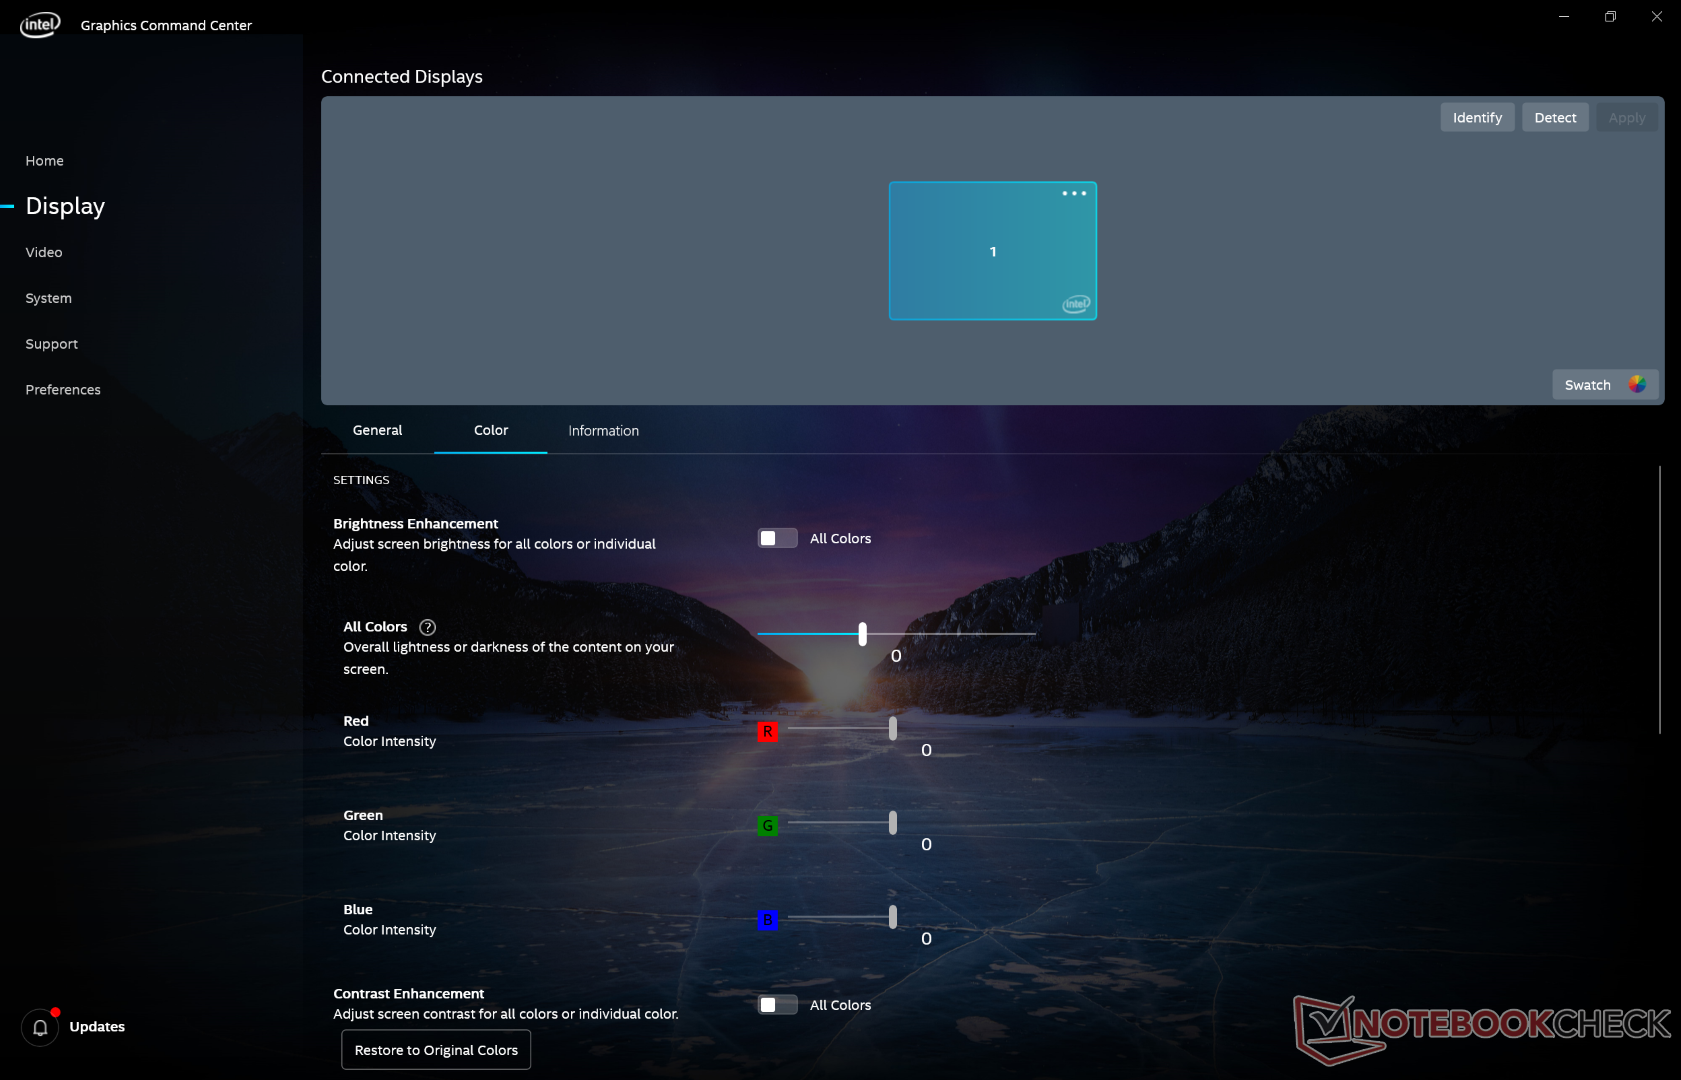
La nostra unità viene fornita con il software Intel Command Center preinstallato, che sostituisce il vecchio Intel Graphics Control Center. La nuova applicazione offre più impostazioni visive con un'interfaccia utente modificata. Anche i futuri portatili dotati di grafica Intel verranno forniti con Command Center.
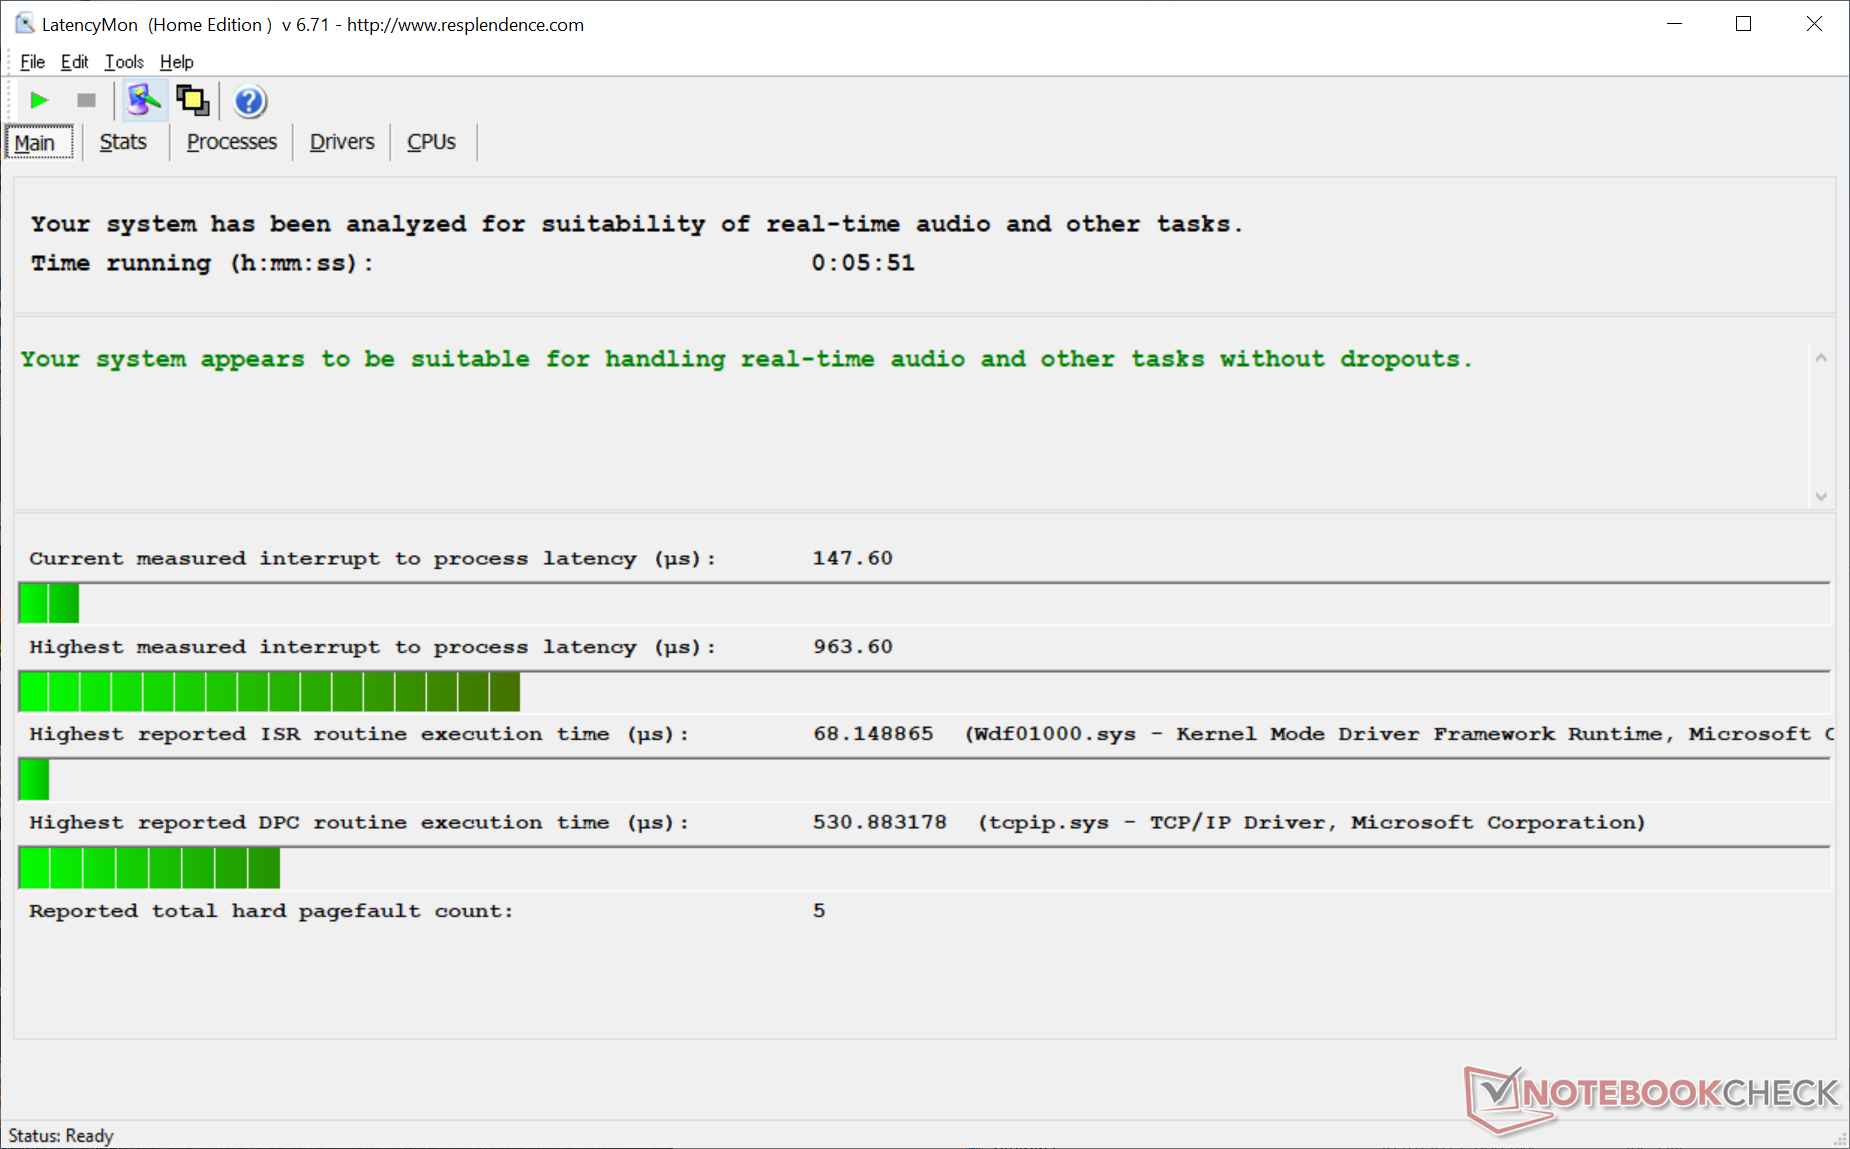
LatencyMon non mostra problemi ricorrenti di latenza del DPC indipendentemente dal Wi-Fi, a differenza di quanto osservato sulla nostra unità Ryzen.
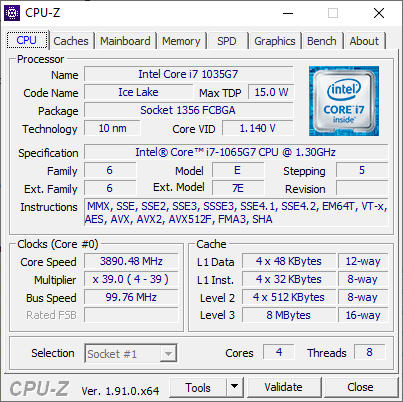
Processore
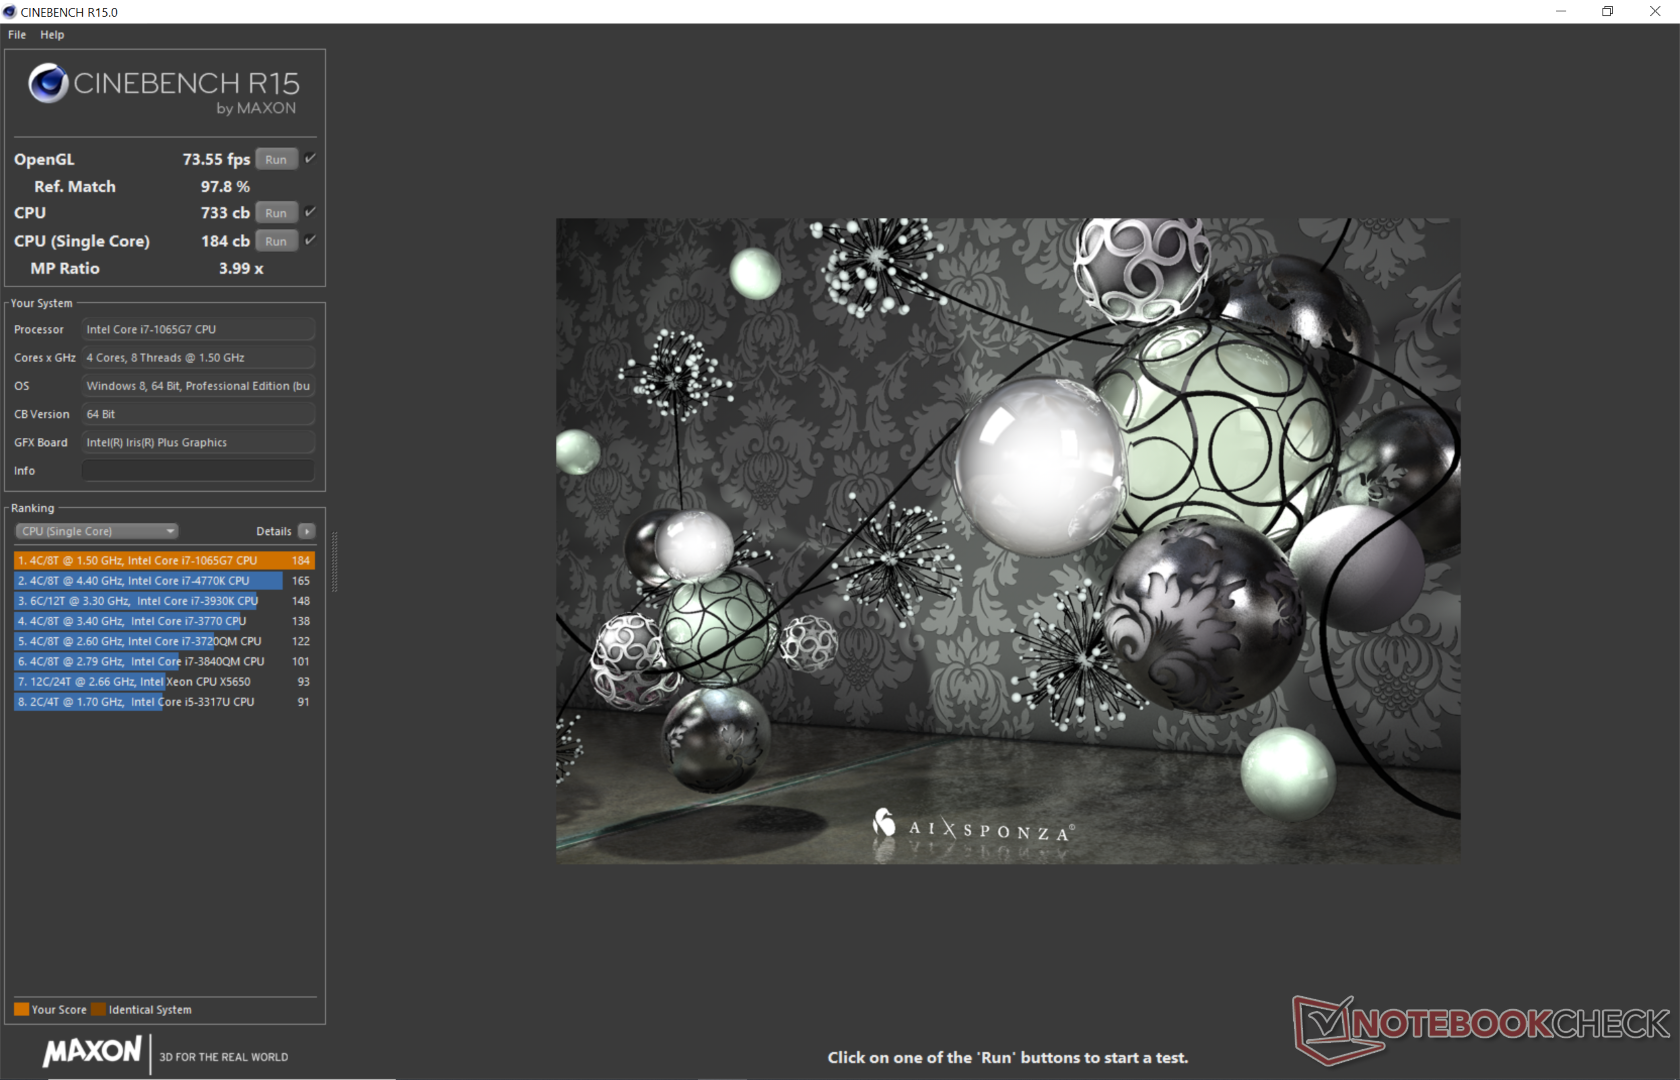
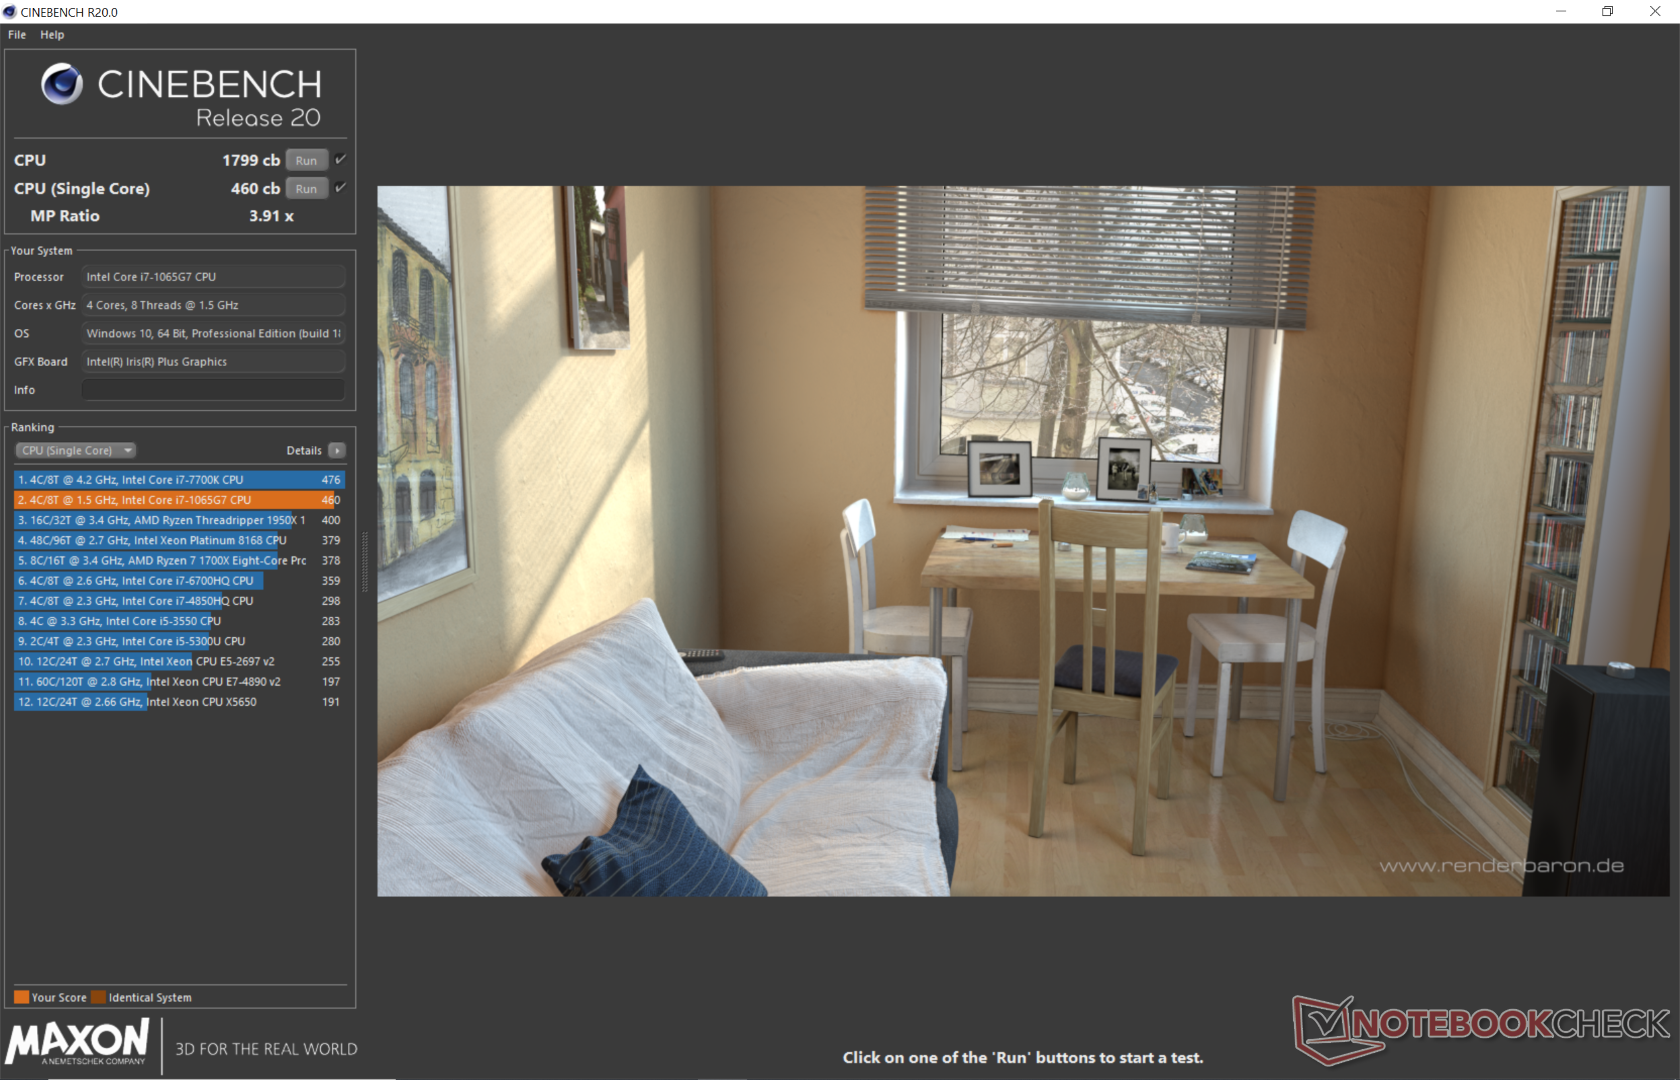
Essendo il nostro 9° Core i7-1065G7 nel nostro database, stiamo iniziando a vedere di cosa è capace il processore. L'implementazione della CPU da 25 W da parte di Microsoft sembra essere migliore della maggior parte delle altre, poiché il suo punteggio multithread CineBench è dell'11% più veloce rispetto alla media i7-1065G7. Le prestazioni grezze sono quindi superiori del 16% rispetto al Ryzen 5 3580U ed entro pochi punti percentuali rispetto al Core i5-9300H.
La sostenibilità delle prestazioni è migliore del previsto, il che spiega i punteggi di riferimento della CPU superiori alla media. Quando si esegue CineBench R15 Multi-Thread in loop, ad esempio, le prestazioni diminuiscono solo del 6-7% nel tempo rispetto al 17% del Lenovo Yoga C940, analogamente equipaggiato. Le prestazioni sono più stabili anche in condizioni di stress, come mostra il nostro grafico qui sotto.
Un altro vantaggio rispetto ad AMD è l'accelerazione AI basata su hardware. Il problema è che la maggior parte delle applicazioni e persino Windows stesso devono ancora sfruttare questa tecnologia emergente, il che significa che i vostri carichi di lavoro quotidiani non beneficeranno probabilmente delle capacità di IA di Ice Lake, se non addirittura delle capacità di Ice Lake.
Consultate la nostra pagina dedicata sul Core i7-1065G7 per maggiori informazioni tecniche e confronti di benchmarks.
Prestazioni di sistema
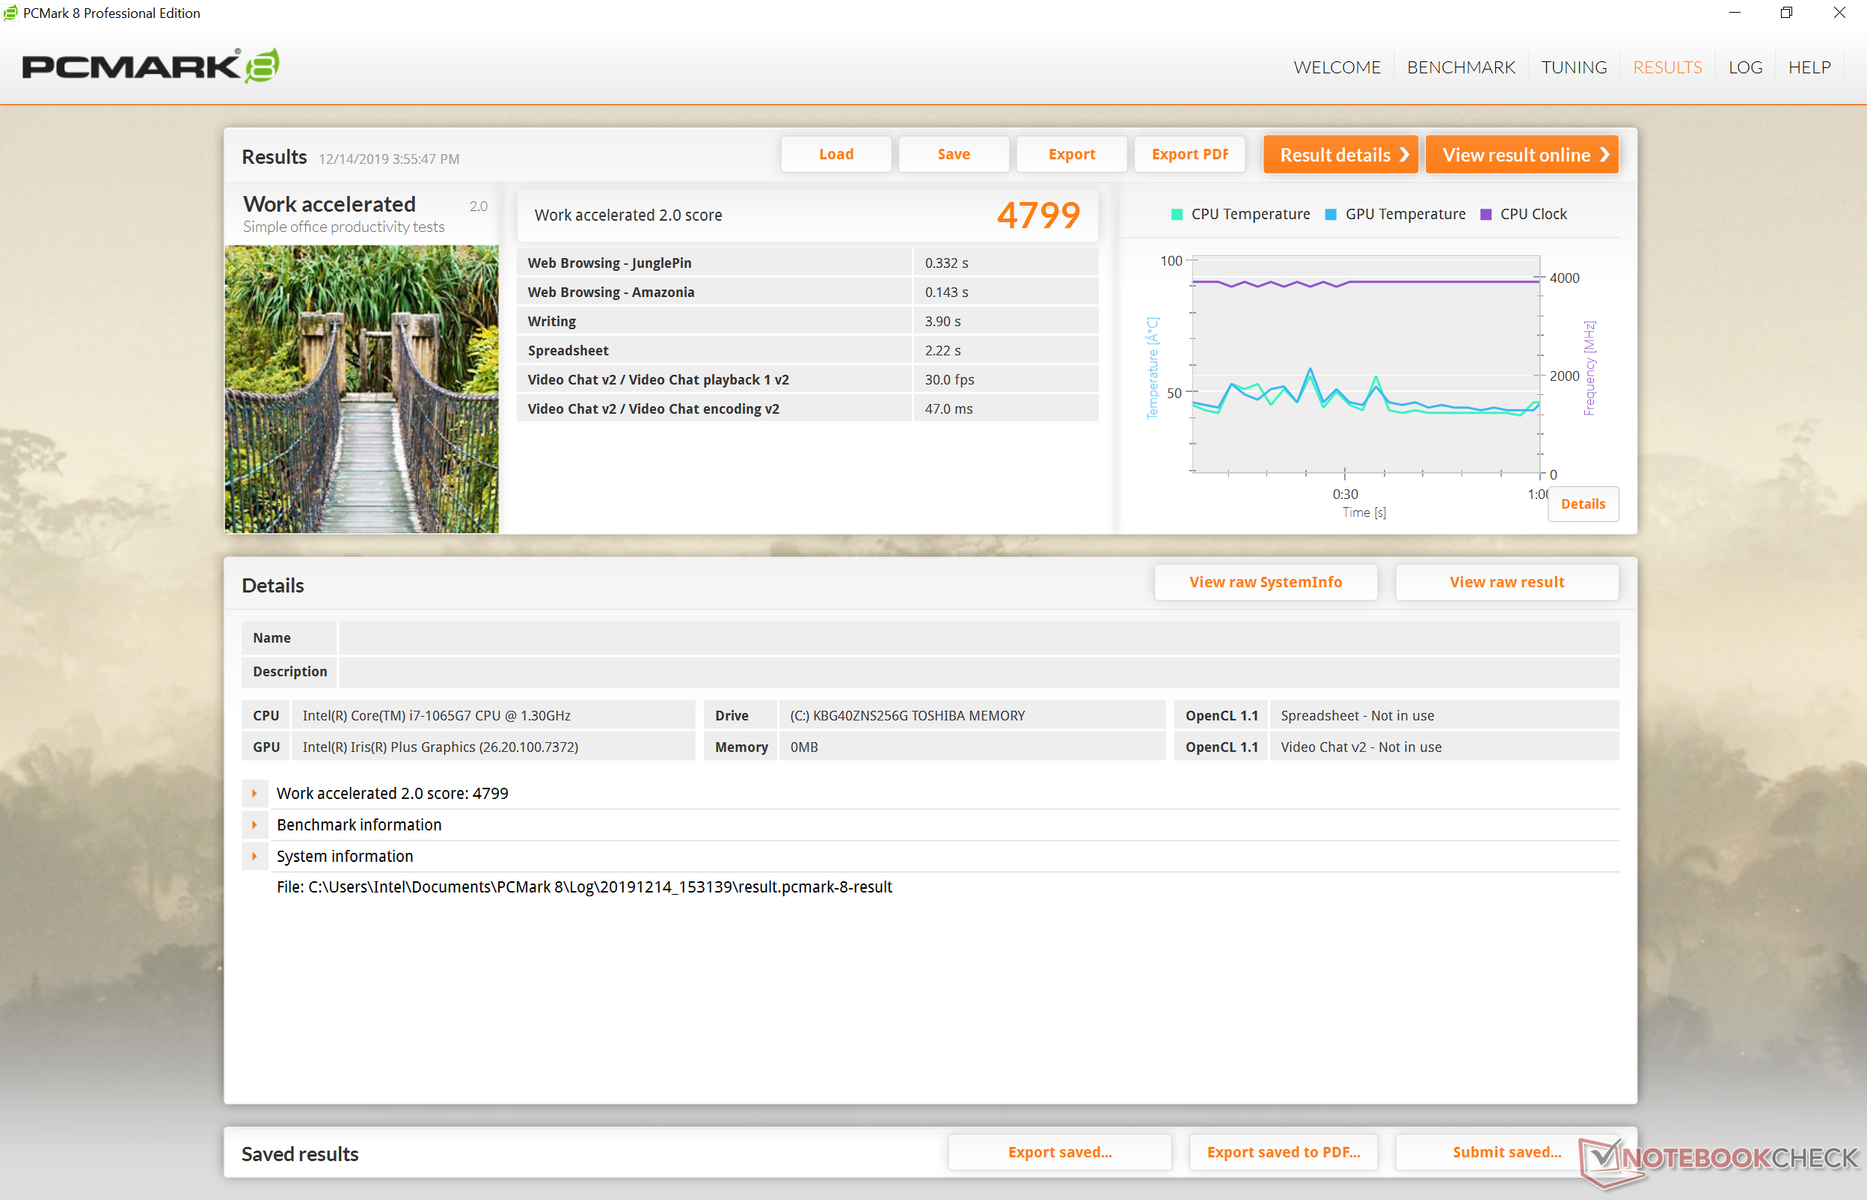
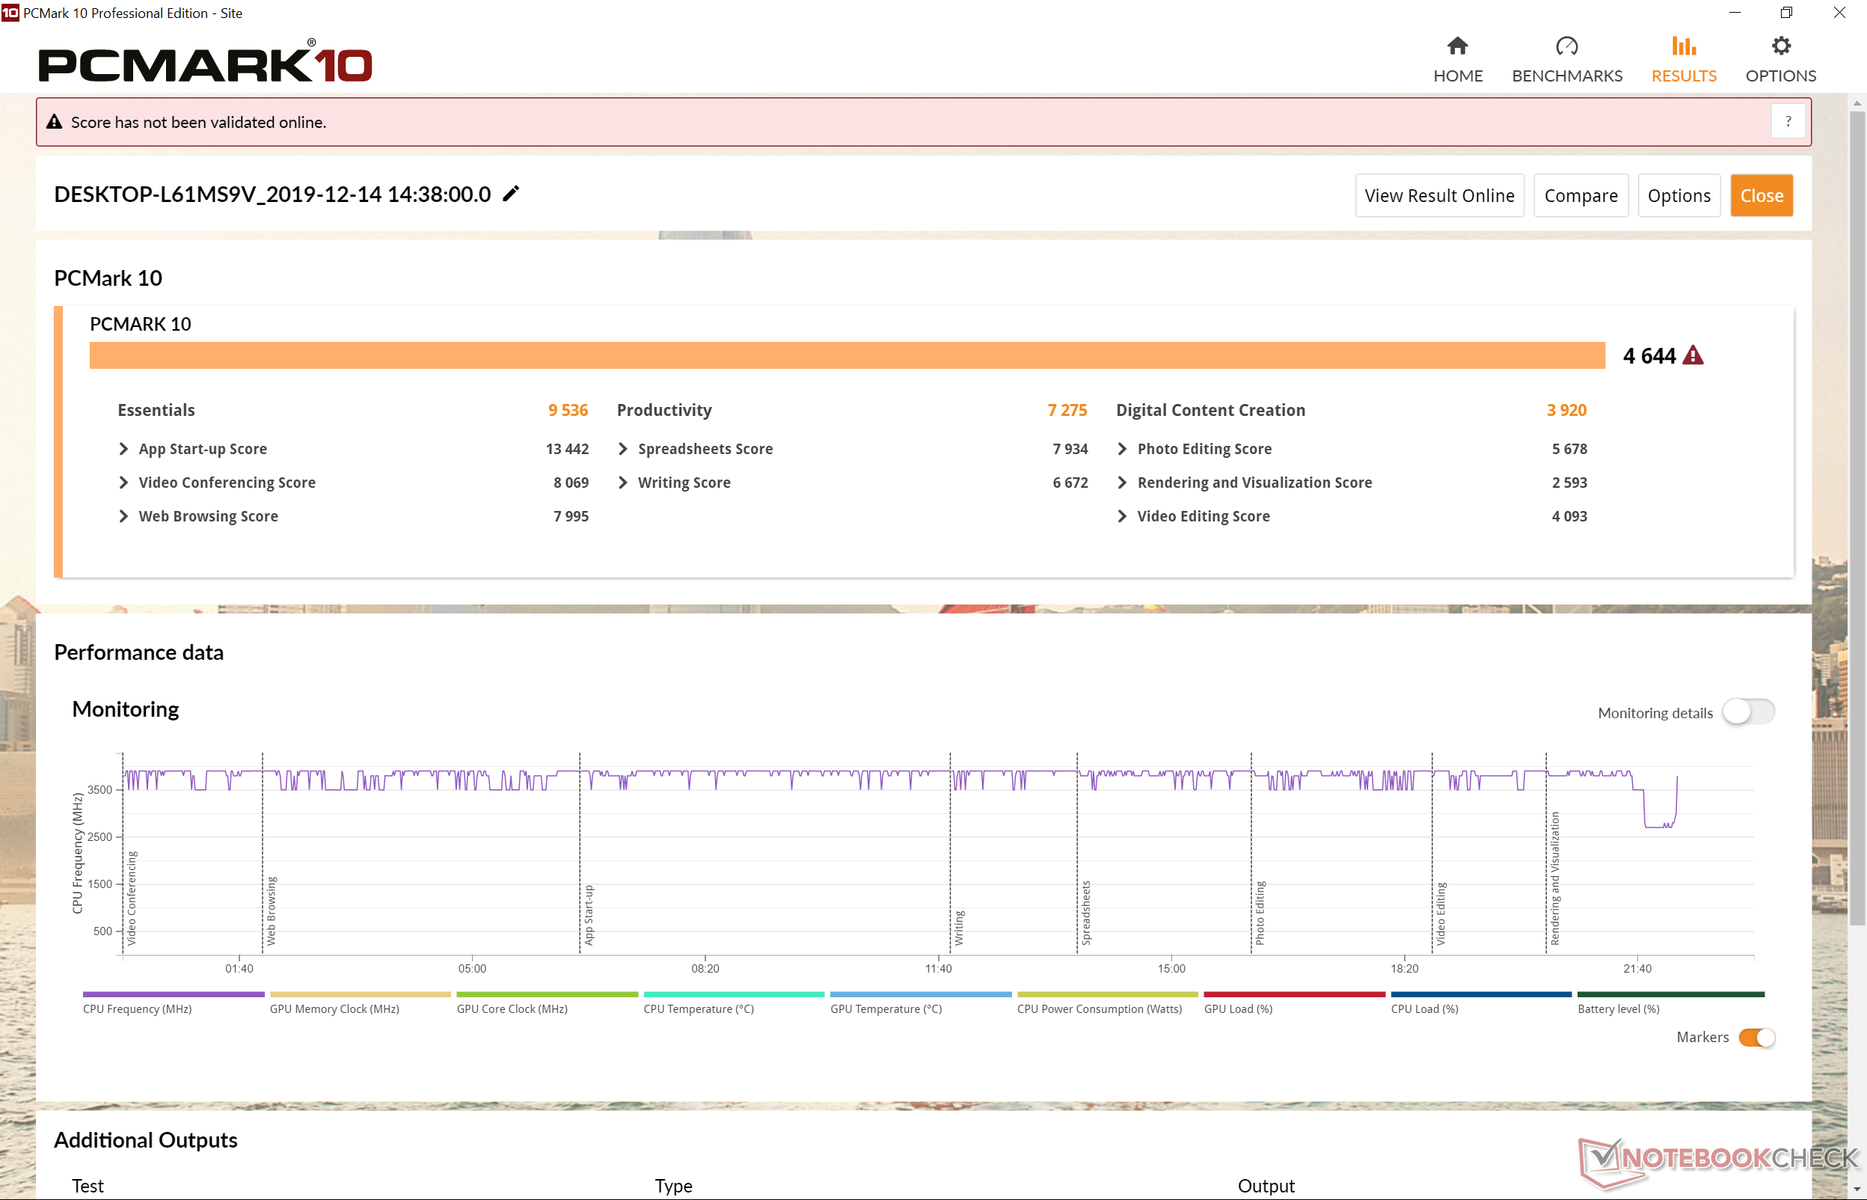
I punteggi di PCMark sono dal 4 al 21% superiori alla SKU Ryzen 5 a seconda del benchmark. Il suo punteggio Digital Creation, ad esempio, è solo del 4% più alto rispetto all'AMD il che suggerisce che la differenza di prestazioni nel mondo reale tra Iris Plus e la serie Vega 8/9/10/11 non è così ampia come Intel vorrebbe farvi credere. Intel ha il suo più grande vantaggio nel benchmark PCMark Essentials che verifica quanto velocemente e senza intoppi il sistema possa multitasking tra la navigazione web e il lancio delle applicazioni. Il chipset Intel è probabilmente meglio ottimizzato per tali applicazioni quotidiane.
Non abbiamo avuto problemi di software o hardware durante il tempo trascorso con l'unità di test.
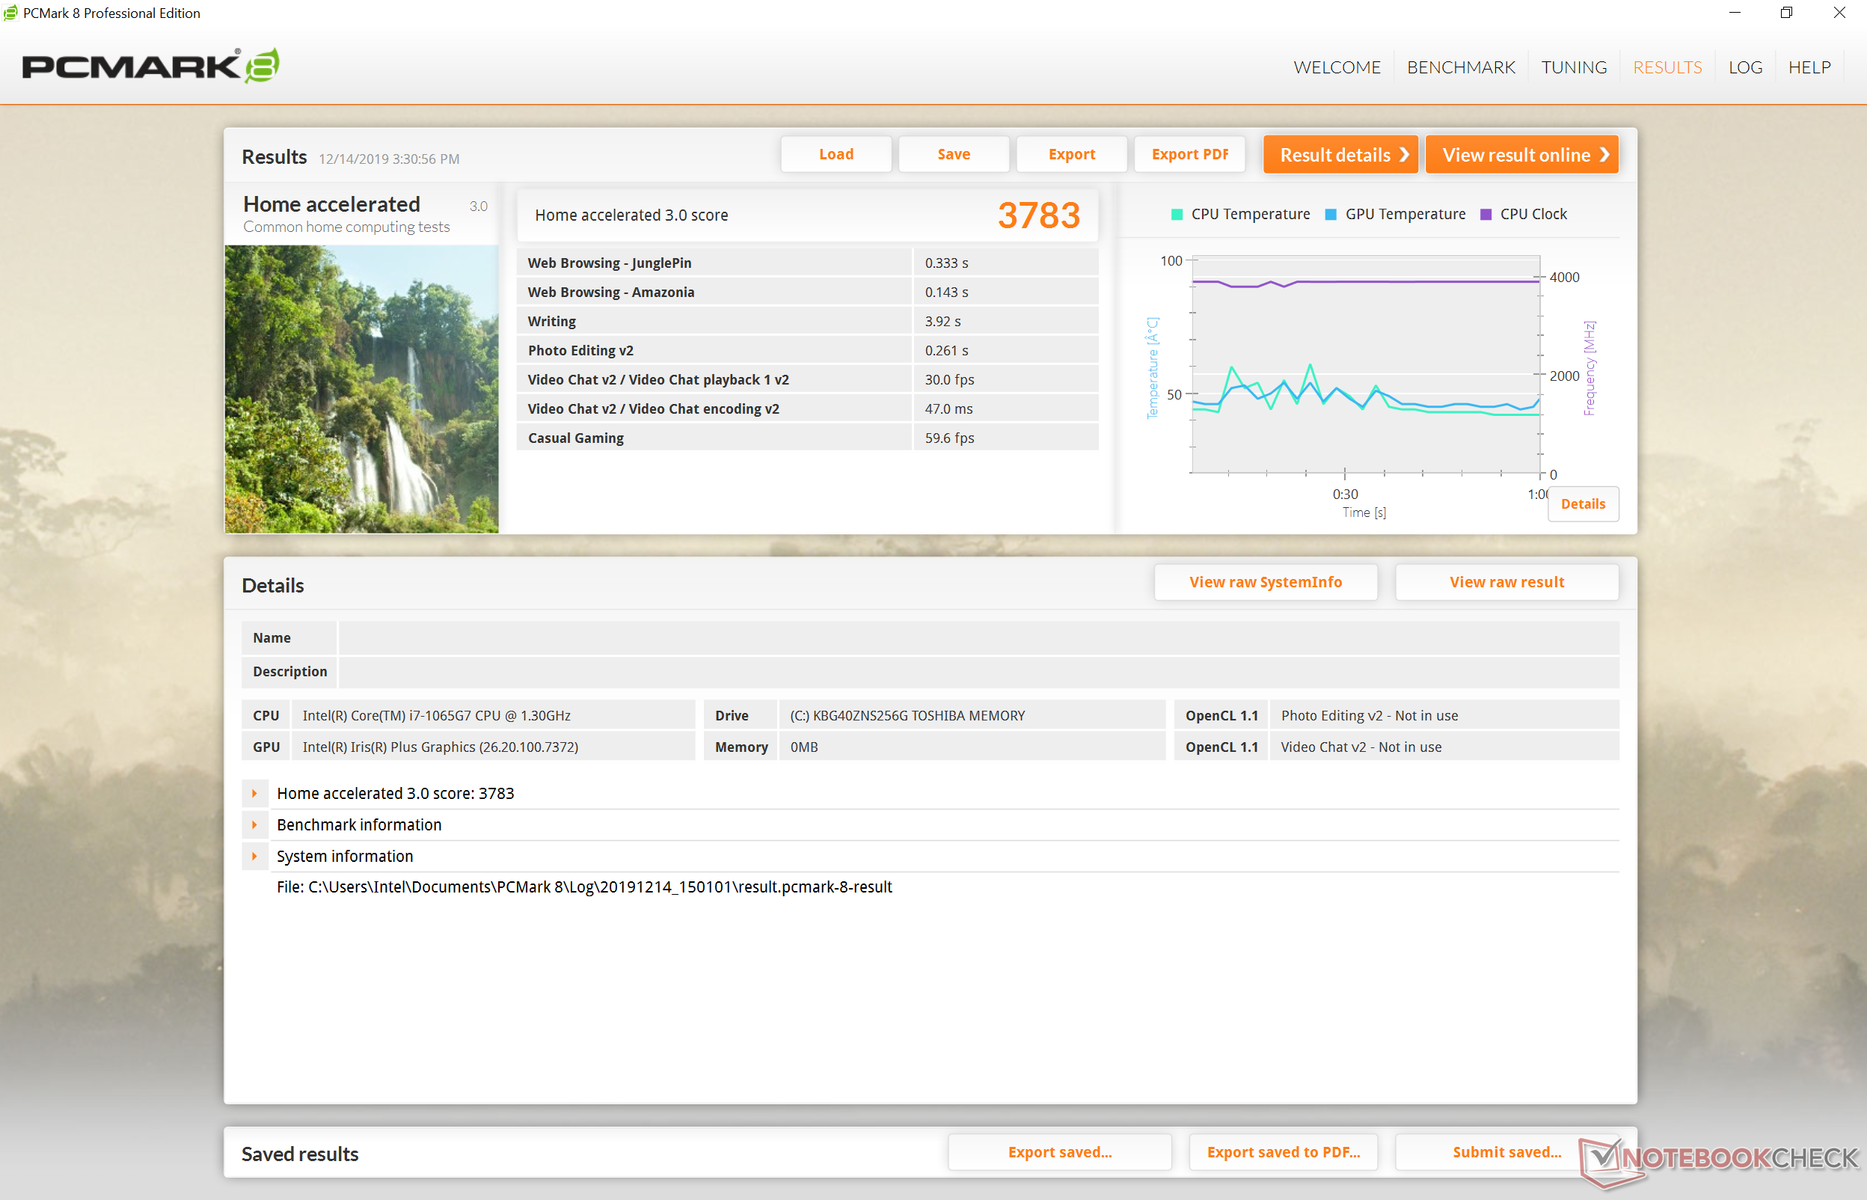
| PCMark 8 Home Score Accelerated v2 | 3783 punti | |
| PCMark 8 Work Score Accelerated v2 | 4799 punti | |
| PCMark 10 Score | 4644 punti | |
Aiuto | ||
Dispositivi di archiviazione
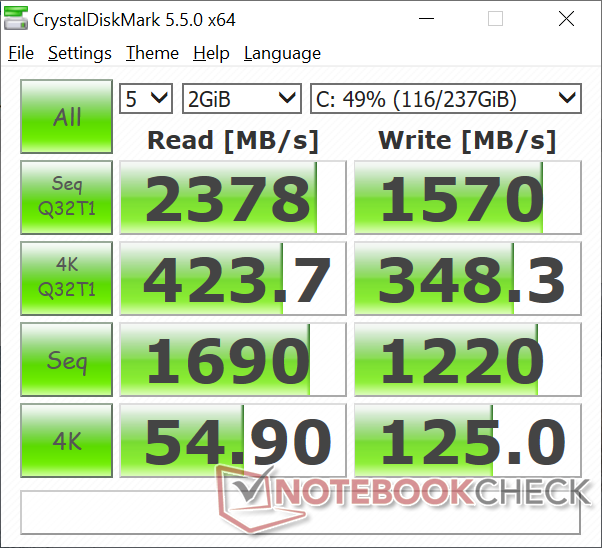
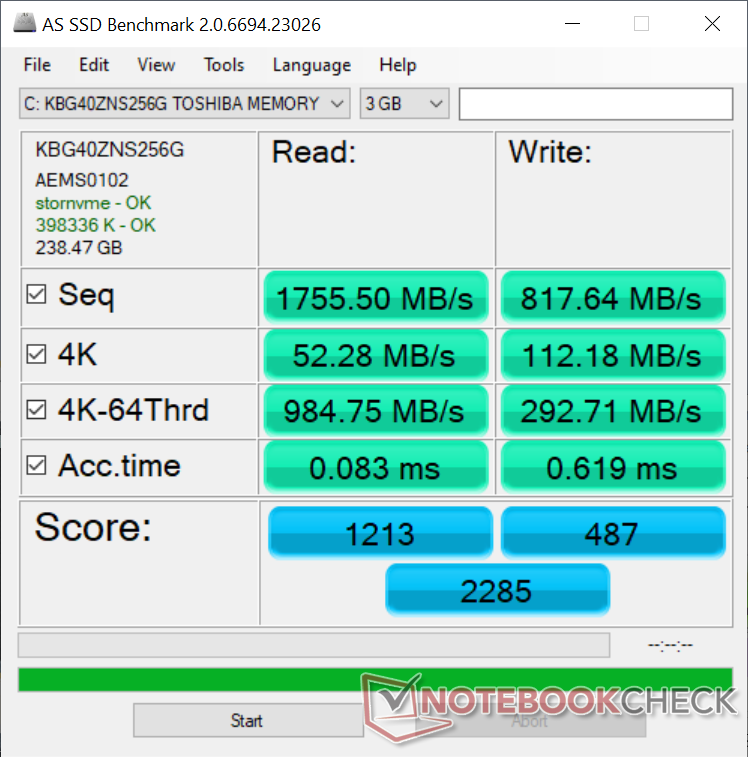
È interessante notare che la nostra Intel SKU viene fornita con un SSD Toshiba KBG40ZNS256G NVMe da 256 GB a differenza del 256 GB SK Hynix BC501 nella nostra SKU Ryzen 5 a suggerire che Microsoft si sta rivolgendo a più fornitori per la sua serie Surface Laptop 3. Si tratta quindi di una scommessa sapere quale SSD si finirà per acquistare.
L'unità Toshiba supera l'unità SK Hynix. AS SSD mostra valori di lettura e scrittura sequenziali di 1755 MB/s e 818 MB/s, rispettivamente, rispetto ai 1122 MB/s e 514 MB/s della nostra SKU Ryzen 5. Sebbene sia un miglioramento, le velocità di trasferimento sono semplicemente medie se paragonate all'SSD Apple o all'SSD Lite-On come si trova sull'Apple MacBook Pro 16 o Razer Blade Stealth. È deludente vedere che Microsoft ha fatto dei tagli sulla sua prima serie di laptop.
Confrontate la nostra tabella di HDD ed SSD per ulteriori confronti di benchmarks.
| Microsoft Surface Laptop 3 15 i7-1065G7 Toshiba KBG40ZNS256G NVMe | Apple MacBook Pro 16 2019 i9 5500M Apple SSD AP1024 7171 | Asus ZenBook 15 UX534FT-DB77 Samsung SSD PM981 MZVLB1T0HALR | MSI Prestige 15 A10SC Samsung SSD PM981 MZVLB1T0HALR | Microsoft Surface Laptop 3 15 Ryzen 5 3580U SK hynix BC501 HFM256GDGTNG | Razer Blade Stealth 13, Core i7-1065G7 Lite-On CA3-8D512 | |
|---|---|---|---|---|---|---|
| AS SSD | 82% | 66% | 85% | -21% | 13% | |
| Seq Read (MB/s) | 1756 | 2531 44% | 1887 7% | 1274 -27% | 1122 -36% | 2666 52% |
| Seq Write (MB/s) | 818 | 2289 180% | 1432 75% | 1395 71% | 514 -37% | 1497 83% |
| 4K Read (MB/s) | 52.3 | 15.85 -70% | 52.3 0% | 50.3 -4% | 34.98 -33% | 53.7 3% |
| 4K Write (MB/s) | 112.2 | 39.88 -64% | 146 30% | 119.8 7% | 96.8 -14% | 133.7 19% |
| 4K-64 Read (MB/s) | 985 | 1267 29% | 969 -2% | 1599 62% | 492 -50% | 652 -34% |
| 4K-64 Write (MB/s) | 292.7 | 1749 498% | 1375 370% | 1455 397% | 339.9 16% | 272 -7% |
| Access Time Read * (ms) | 0.083 | 0.122 -47% | 0.034 59% | 0.044 47% | 0.056 33% | 0.075 10% |
| Access Time Write * (ms) | 0.619 | 0.095 85% | 0.075 88% | 0.092 85% | 0.11 82% | 0.032 95% |
| Score Read (Points) | 1213 | 1536 27% | 1210 0% | 1777 46% | 639 -47% | 972 -20% |
| Score Write (Points) | 487 | 2018 314% | 1664 242% | 1714 252% | 488 0% | 555 14% |
| Score Total (Points) | 2285 | 4317 89% | 3483 52% | 4411 93% | 1434 -37% | 1982 -13% |
| Copy ISO MB/s (MB/s) | 1192 | 1995 67% | 1375 15% | 2830 137% | 828 -31% | 1495 25% |
| Copy Program MB/s (MB/s) | 604 | 584 -3% | 468 -23% | 609 1% | 200.5 -67% | 458.4 -24% |
| Copy Game MB/s (MB/s) | 1136 | 1135 0% | 1287 13% | 1424 25% | 387.4 -66% | 964 -15% |
* ... Meglio usare valori piccoli

Prestazioni GPU
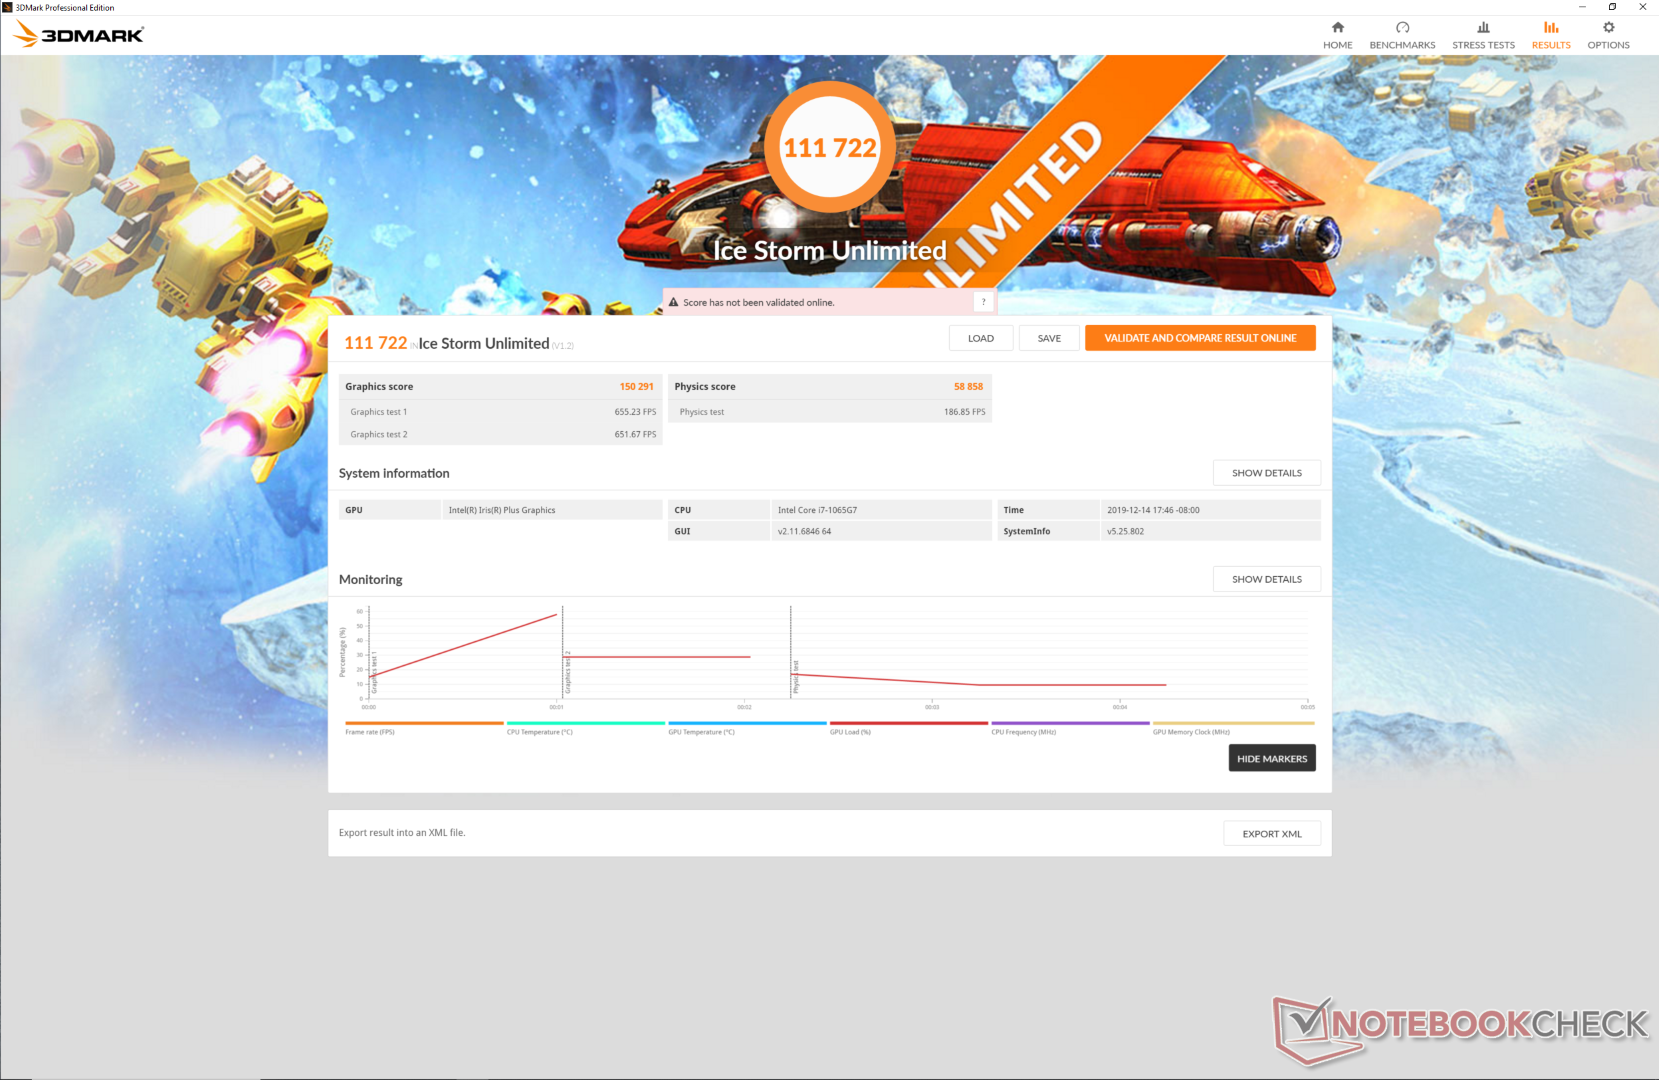
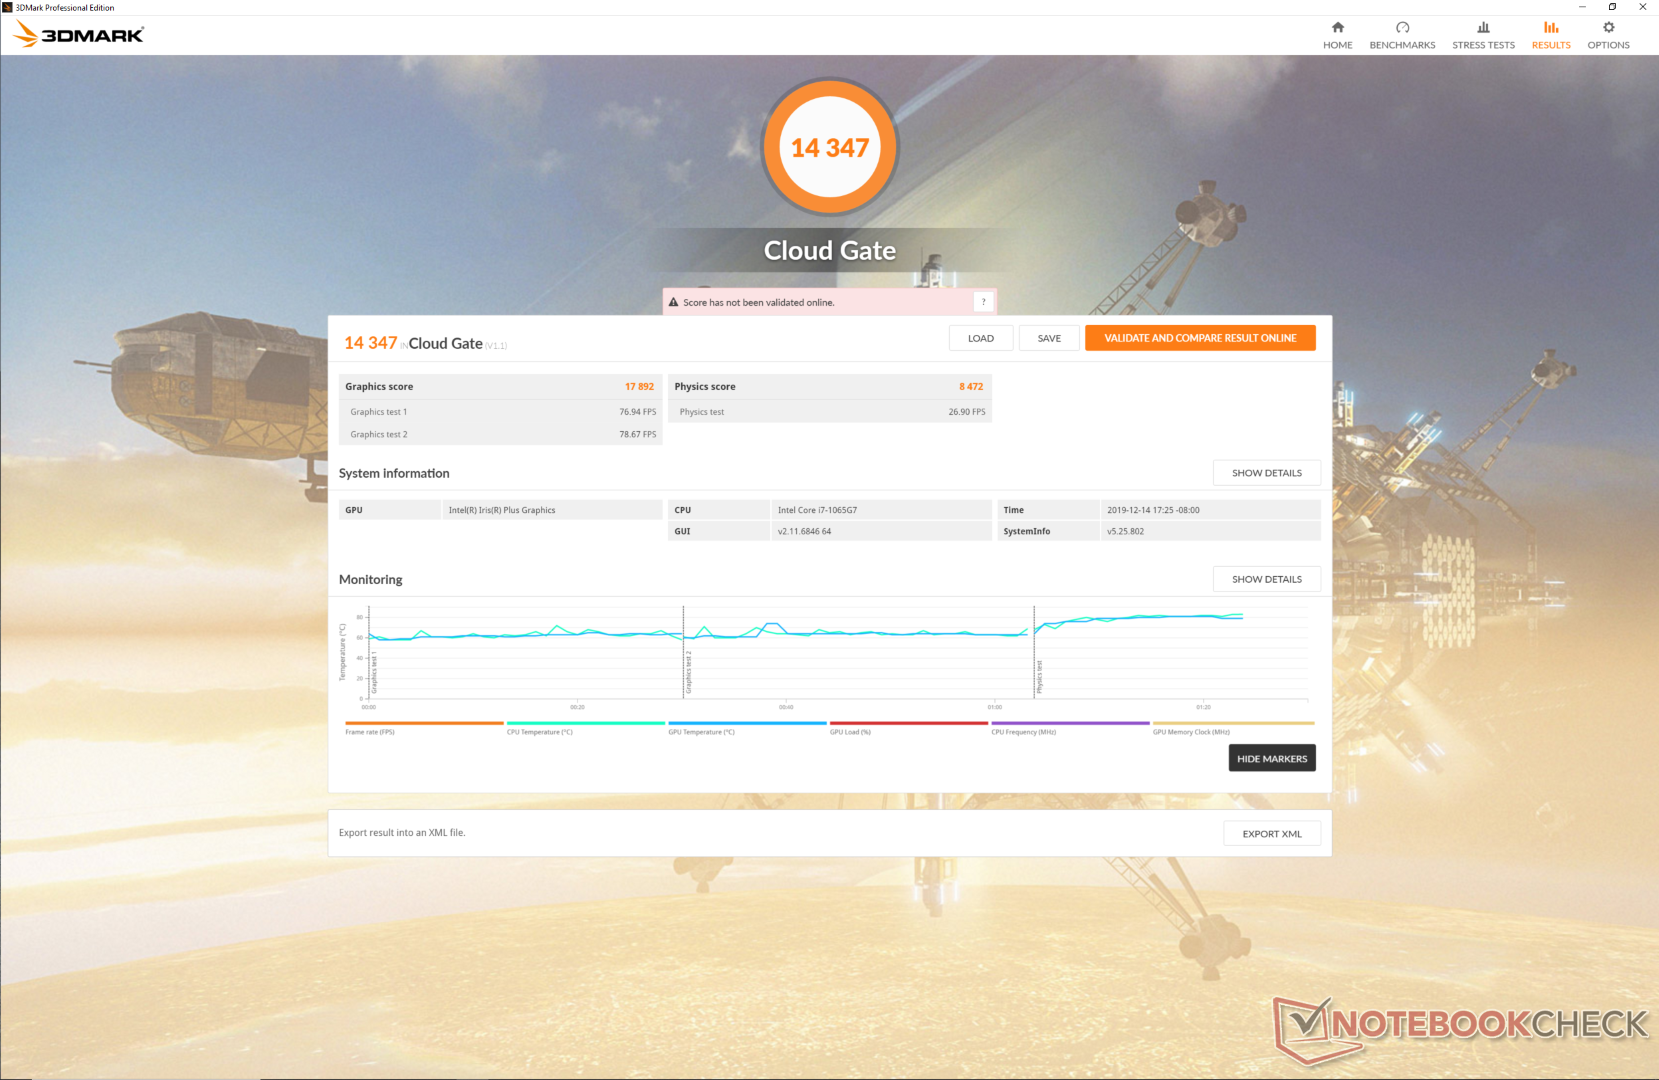
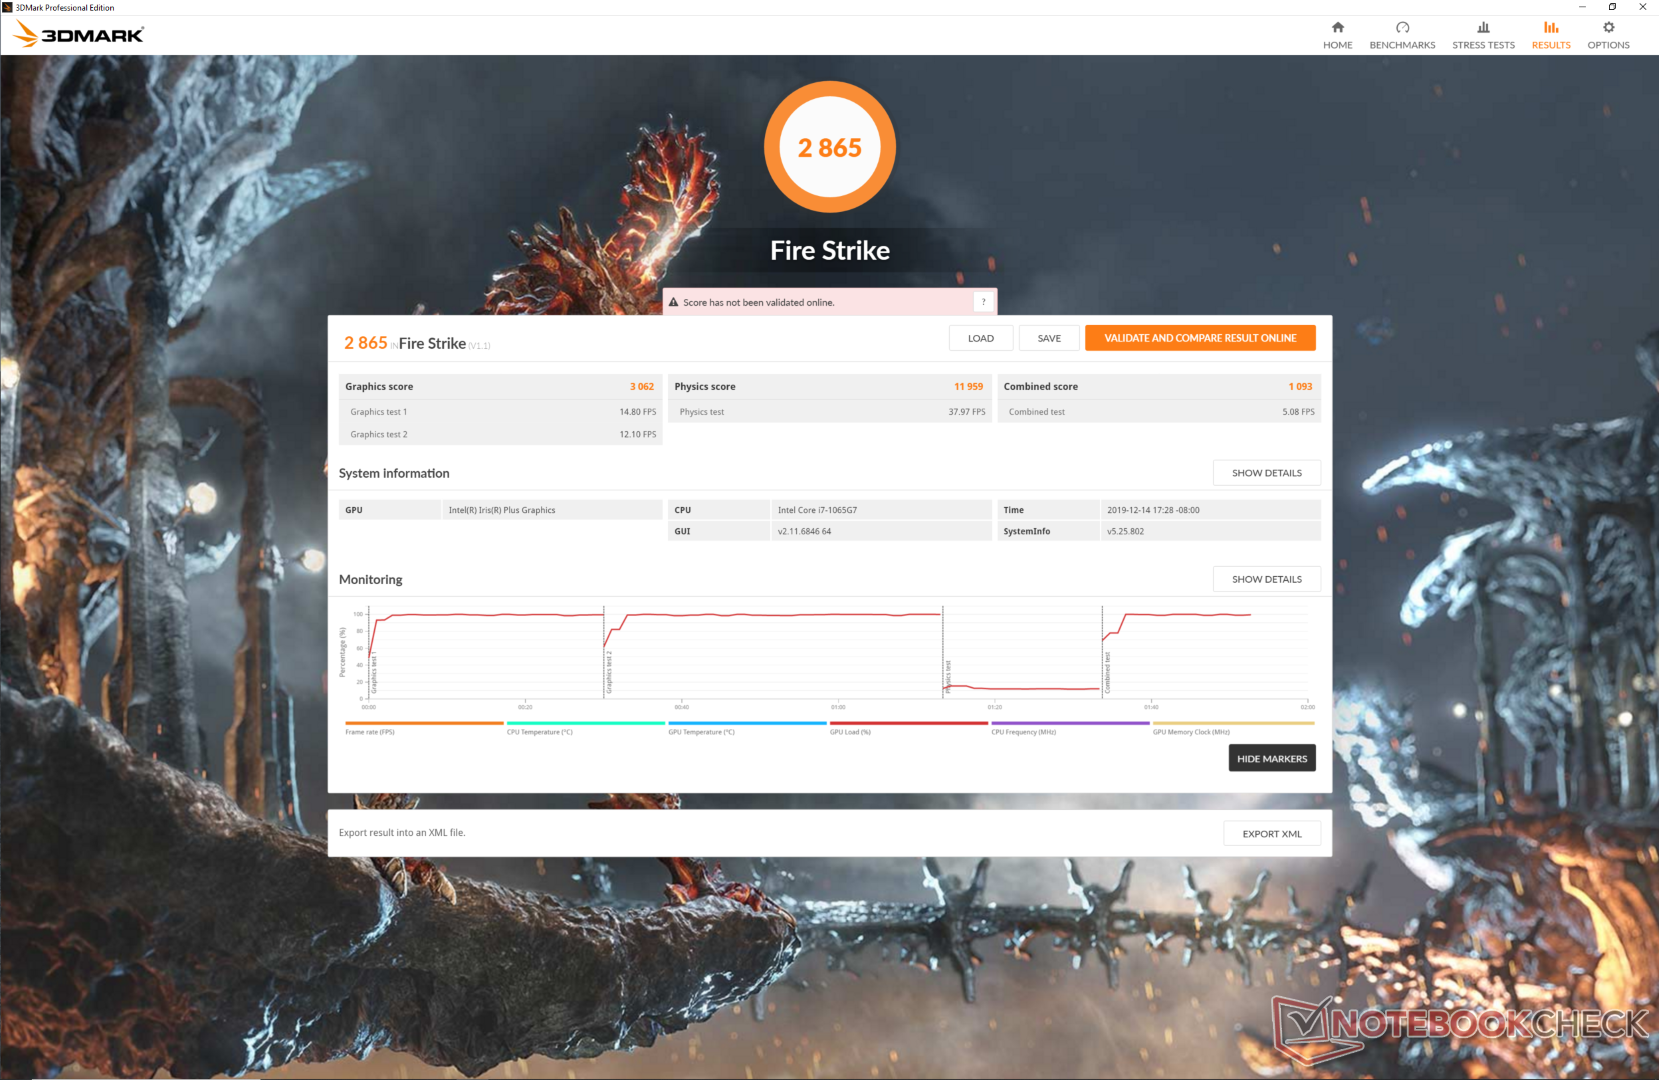
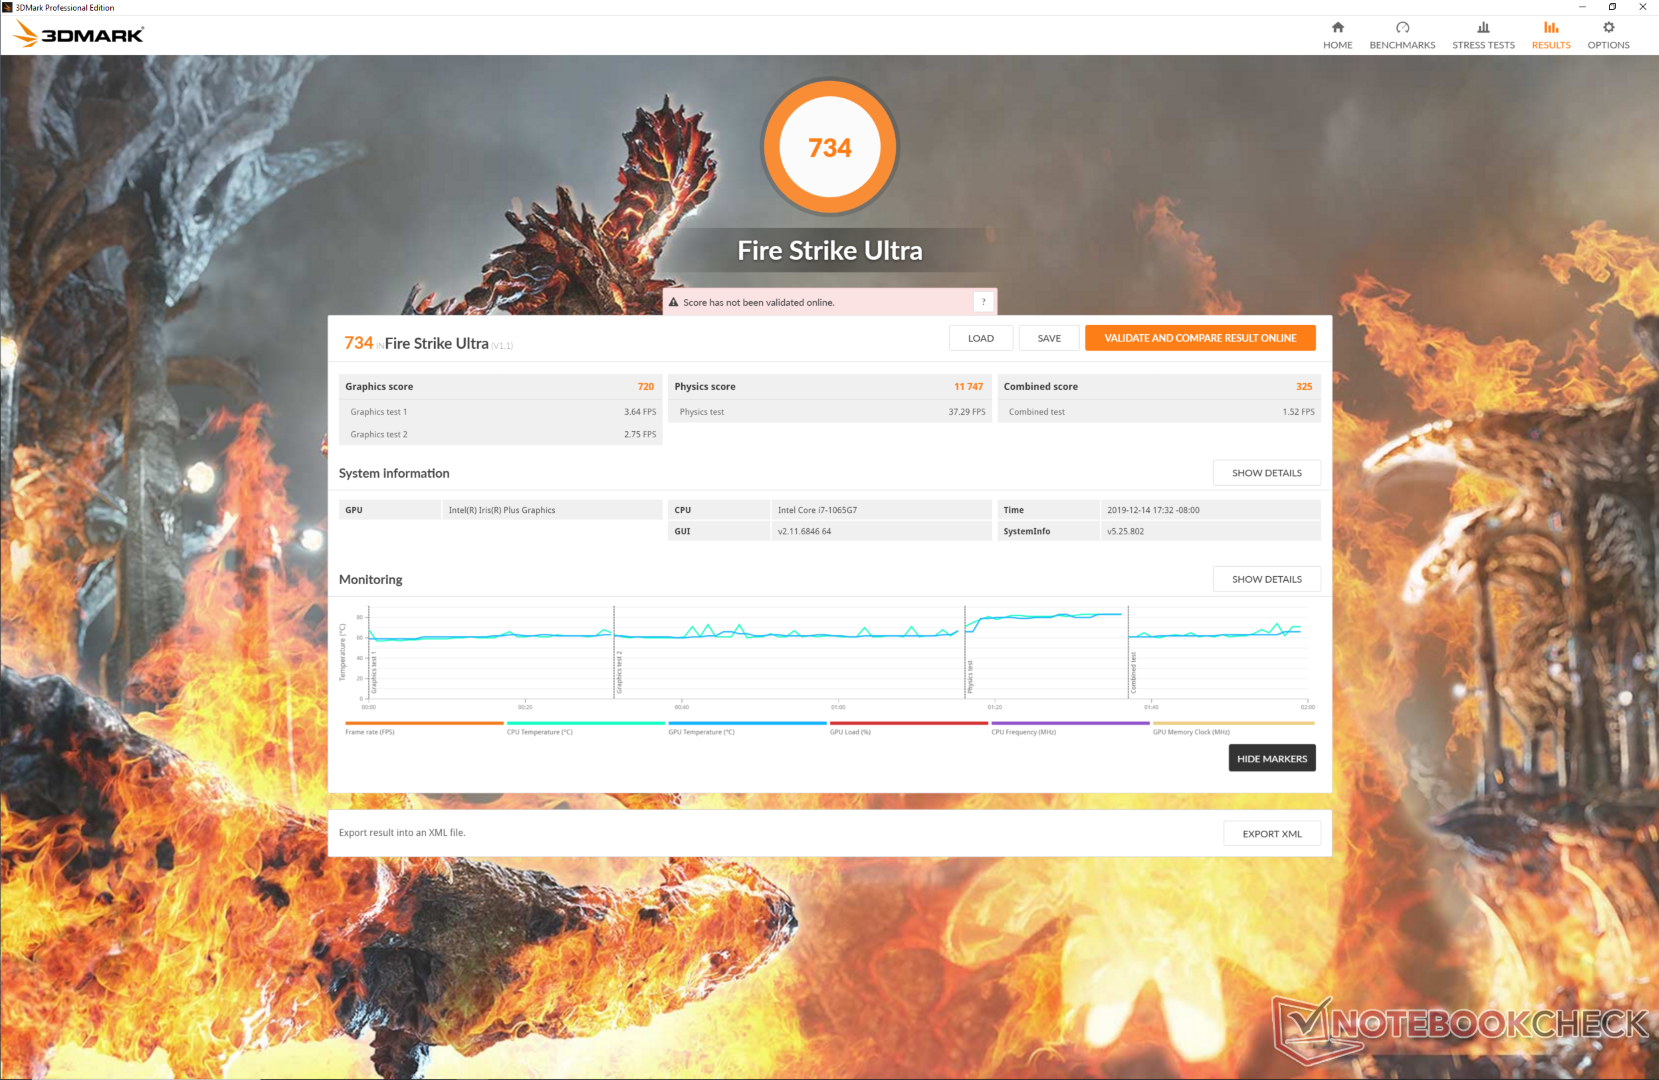
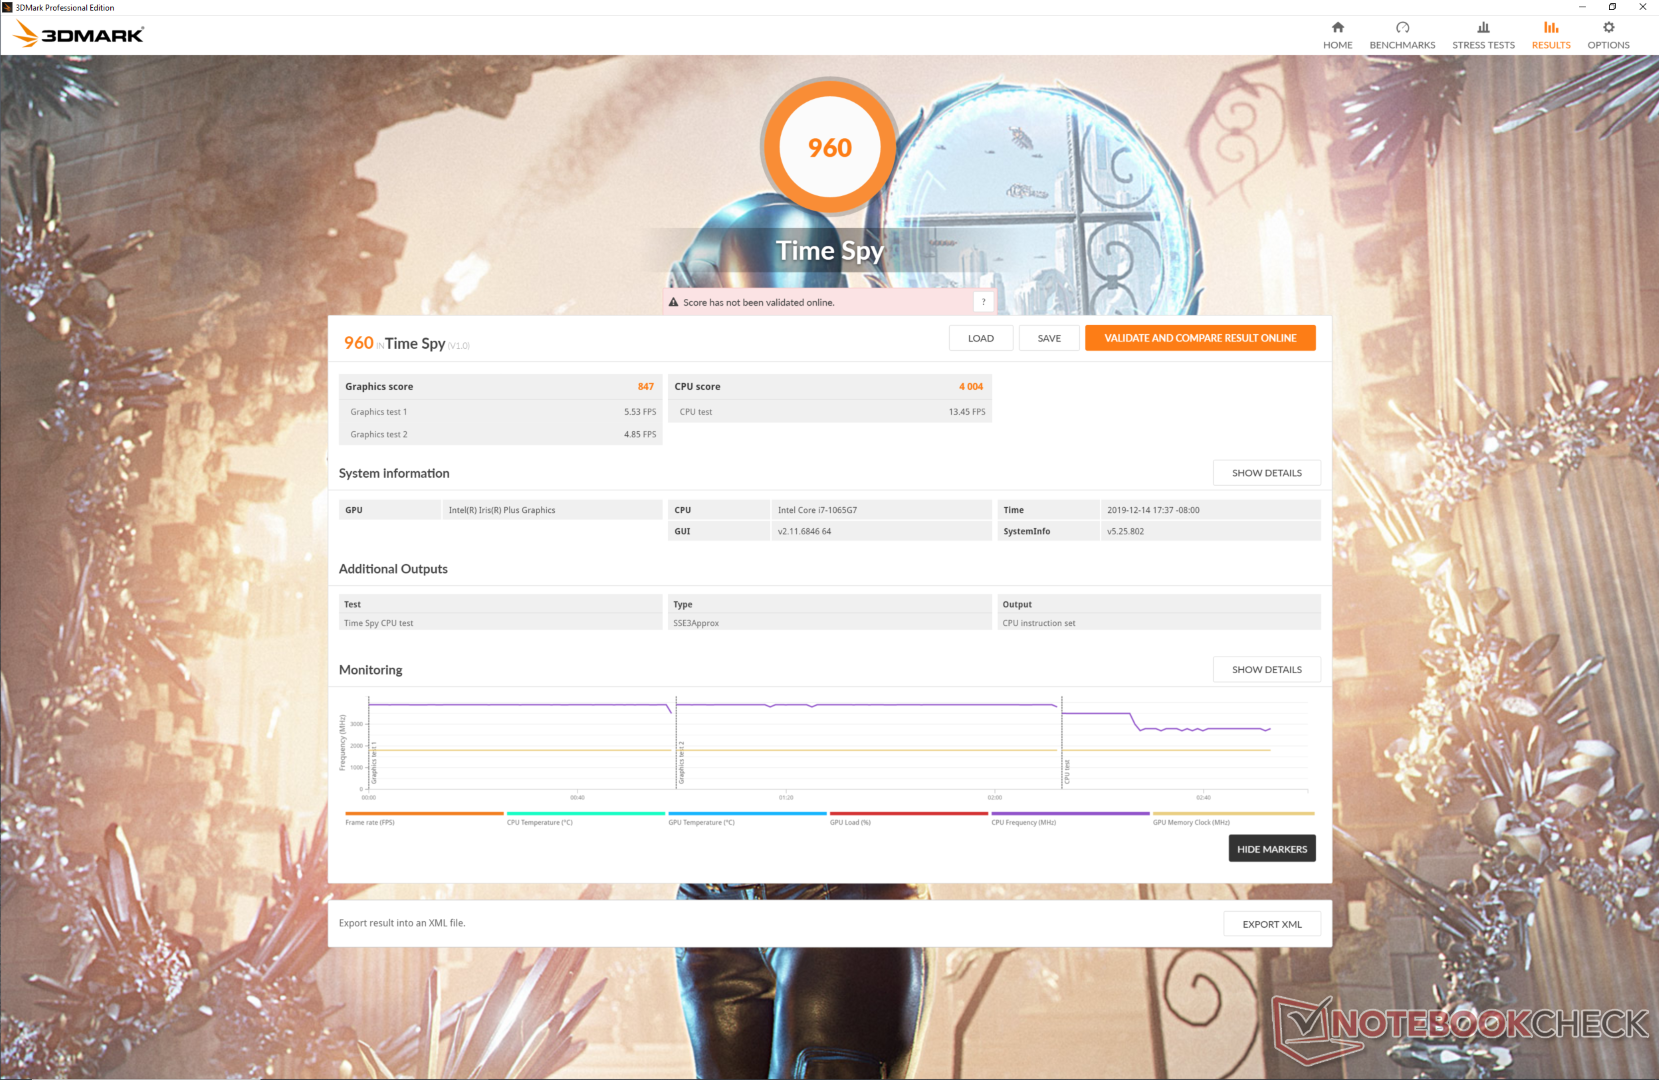
I punteggi di 3DMark mostrano che la GPU Iris Plus integrata è alla pari con la RX Vega 9 nel Ryzen 5 3580U nel peggiore dei casi o circa il 15% più veloce nel migliore dei casi. Negli scenari di gioco reali, tuttavia, la GPU Intel ha il potenziale per essere molto più veloce. Rocket League e F1 2019, ad esempio, possono funzionare fino al 40% più velocemente della RX Vega 9, mentre altri giochi come Overwatch e Shadow of the Tomb Raider sono collo a collo tra le SKU Intel e AMD. Se avete intenzione di giocare titoli popolari come Fortnite o Rocket League, allora potreste voler considerare le opzioni Intel Iris Plus per massimizzare le prestazioni. 3DMark continua ad essere un carrivo indicatore delle prestazioni di gioco nel mondo reale per le serie di GPU integrate Intel Iris Plus e AMD RX Vega.
Ulteriori benchmarks e confronti di gioco possono essere trovati sulla nostra pagina Iris Plus G7 qui.
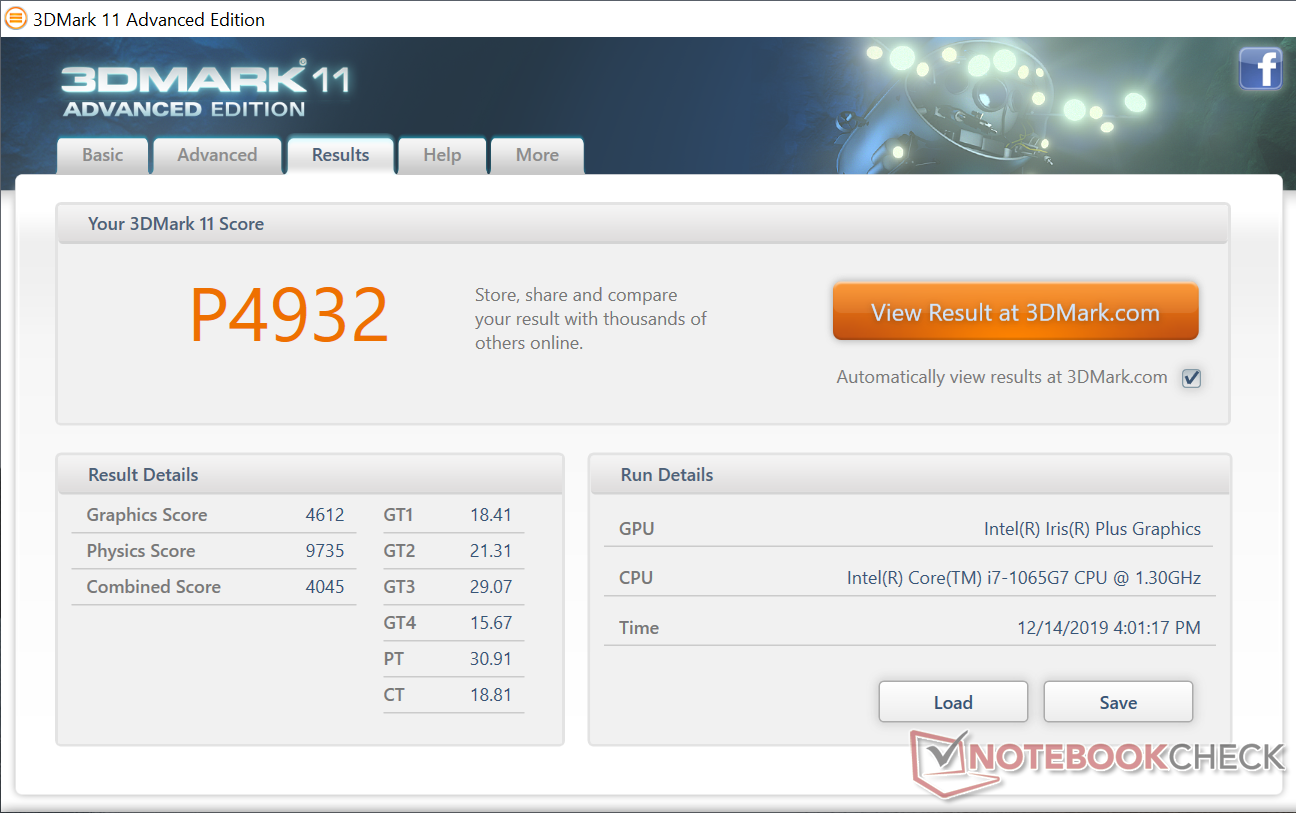
| 3DMark 11 Performance | 4932 punti | |
| 3DMark Ice Storm Standard Score | 67987 punti | |
| 3DMark Cloud Gate Standard Score | 14347 punti | |
| 3DMark Fire Strike Score | 2865 punti | |
| 3DMark Time Spy Score | 960 punti | |
Aiuto | ||
| F1 2019 | |
| 1280x720 Ultra Low Preset | |
| Microsoft Surface Laptop 3 15 i7-1065G7 | |
| Microsoft Surface Laptop 3 15 Ryzen 5 3580U | |
| Media Intel Iris Plus Graphics G7 (Ice Lake 64 EU) (35 - 63, n=5) | |
| 1920x1080 Medium Preset AA:T AF:16x | |
| Microsoft Surface Laptop 3 15 i7-1065G7 | |
| Media Intel Iris Plus Graphics G7 (Ice Lake 64 EU) (22 - 31, n=5) | |
| Microsoft Surface Laptop 3 15 Ryzen 5 3580U | |
| 1920x1080 High Preset AA:T AF:16x | |
| Microsoft Surface Laptop 3 15 i7-1065G7 | |
| Media Intel Iris Plus Graphics G7 (Ice Lake 64 EU) (19 - 27, n=4) | |
| Microsoft Surface Laptop 3 15 Ryzen 5 3580U | |
| 1920x1080 Ultra High Preset AA:T AF:16x | |
| Microsoft Surface Laptop 3 15 i7-1065G7 | |
| Media Intel Iris Plus Graphics G7 (Ice Lake 64 EU) (12 - 21, n=4) | |
| Microsoft Surface Laptop 3 15 Ryzen 5 3580U | |
| Borderlands 3 | |
| 1280x720 Very Low Overall Quality (DX11) | |
| Microsoft Surface Laptop 3 15 i7-1065G7 | |
| Media Intel Iris Plus Graphics G7 (Ice Lake 64 EU) (26.7 - 37, n=4) | |
| Microsoft Surface Laptop 3 15 Ryzen 5 3580U | |
| 1920x1080 Medium Overall Quality (DX11) | |
| Microsoft Surface Laptop 3 15 i7-1065G7 | |
| Media Intel Iris Plus Graphics G7 (Ice Lake 64 EU) (11.7 - 16, n=3) | |
| Microsoft Surface Laptop 3 15 Ryzen 5 3580U | |
| 1920x1080 High Overall Quality (DX11) | |
| Microsoft Surface Laptop 3 15 i7-1065G7 | |
| Media Intel Iris Plus Graphics G7 (Ice Lake 64 EU) (7.73 - 10, n=3) | |
| Microsoft Surface Laptop 3 15 Ryzen 5 3580U | |
| basso | medio | alto | ultra | |
|---|---|---|---|---|
| StarCraft II: Heart of the Swarm (2013) | 358.2 | 100.9 | 64.8 | |
| BioShock Infinite (2013) | 109.6 | 73 | 61.5 | 22.6 |
| The Witcher 3 (2015) | 56.4 | 36.8 | 20.1 | 10 |
| Overwatch (2016) | 90 | 64 | 32.9 | 19.7 |
| Rocket League (2017) | 96.1 | 61 | 42.8 | |
| Shadow of the Tomb Raider (2018) | 31 | |||
| F1 2019 (2019) | 63 | 31 | 27 | 17 |
| Borderlands 3 (2019) | 37 | 16 | 10 |
Emissioni
Rumorosità di sistema
Avevamo previsto alcune differenze nel rumore delle ventole tra le SKU Intel e AMD, ma non è così. Le nostre misurazioni del microfono durante l'esecuzione di 3DMark 06, Witcher 3, o Prime95 hanno portato essenzialmente agli stessi risultati della nostra configurazione AMD del mese scorso. Il Surface Laptop 3 è per lo più inudibile durante i carichi medio-bassi, con il rumore delle ventole che aumenta notevolmente solo quando si eseguono carichi più alti, come i giochi per periodi prolungati.
La nostra unità di prova mostra un leggero rumore elettronico quando si posiziona un orecchio vicino alla tastiera. Il rumore elettronico è abbastanza lieve da non costituire un problema.
| Microsoft Surface Laptop 3 15 i7-1065G7 Iris Plus Graphics G7 (Ice Lake 64 EU), i7-1065G7, Toshiba KBG40ZNS256G NVMe | Apple MacBook Pro 16 2019 i9 5500M Radeon Pro 5500M, i9-9880H, Apple SSD AP1024 7171 | Dell XPS 15 7590 i5 iGPU FHD UHD Graphics 630, i5-9300H, Toshiba XG6 KXG60ZNV512G | Asus ZenBook 15 UX534FT-DB77 GeForce GTX 1650 Max-Q, i7-8565U, Samsung SSD PM981 MZVLB1T0HALR | Razer Blade Stealth i7-8565U GeForce MX150, i7-8565U, Lite-On CA3-8D256-Q11 | Microsoft Surface Laptop 3 15 Ryzen 5 3580U Vega 9, R5 3580U, SK hynix BC501 HFM256GDGTNG | |
|---|---|---|---|---|---|---|
| Noise | -13% | -2% | -2% | -8% | 2% | |
| off /ambiente * (dB) | 28.5 | 29.8 -5% | 29.3 -3% | 28.4 -0% | 28.4 -0% | 28 2% |
| Idle Minimum * (dB) | 28.5 | 29.9 -5% | 29.3 -3% | 28.4 -0% | 28.5 -0% | 28 2% |
| Idle Average * (dB) | 28.5 | 29.9 -5% | 29.3 -3% | 28.4 -0% | 29 -2% | 28 2% |
| Idle Maximum * (dB) | 28.7 | 29.9 -4% | 29.8 -4% | 28.4 1% | 29.1 -1% | 28 2% |
| Load Average * (dB) | 30 | 43 -43% | 32.4 -8% | 33.9 -13% | 42.8 -43% | 29.2 3% |
| Witcher 3 ultra * (dB) | 39.2 | 45.4 -16% | 39.8 -2% | 41.4 -6% | 39 1% | |
| Load Maximum * (dB) | 41.2 | 46.1 -12% | 37.2 10% | 40.2 2% | 41.6 -1% | 41.4 -0% |
* ... Meglio usare valori piccoli
Rumorosità
| Idle |
| 28.5 / 28.5 / 28.7 dB(A) |
| Sotto carico |
| 30 / 41.2 dB(A) |
 | ||
30 dB silenzioso 40 dB(A) udibile 50 dB(A) rumoroso |
||
min: | ||
Temperature
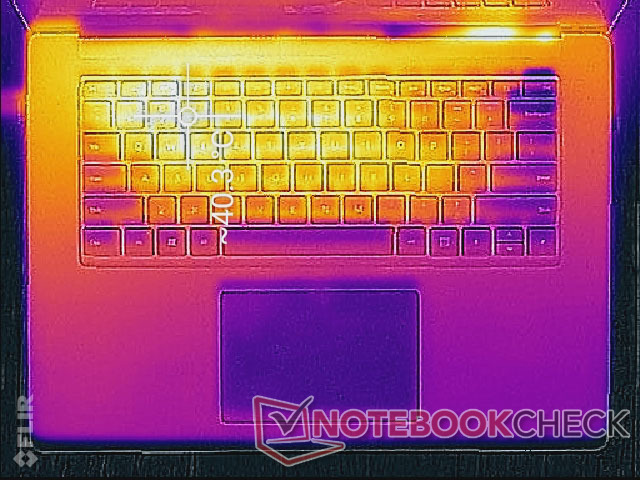
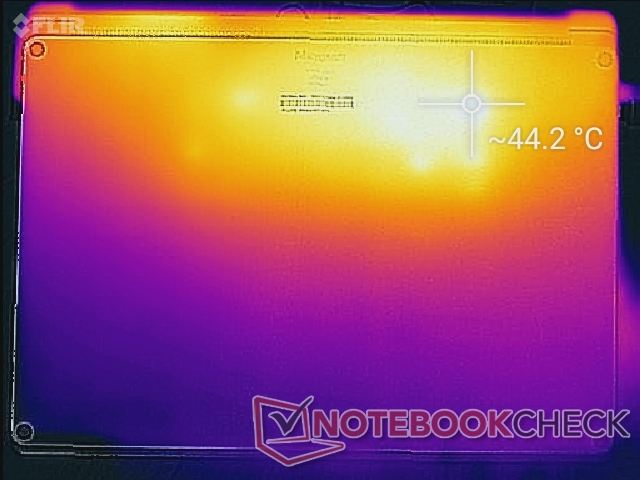
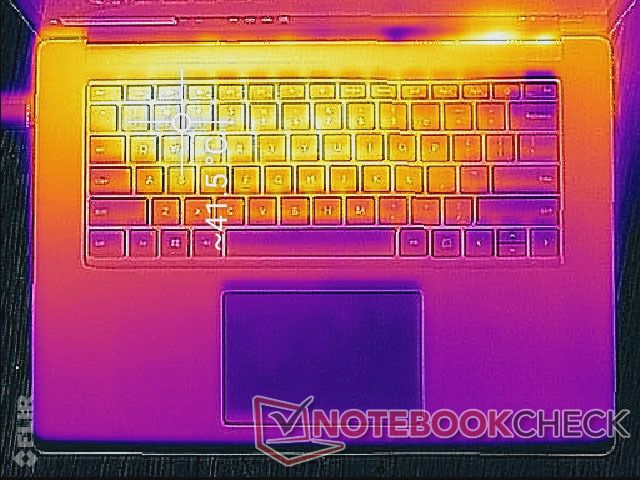
Non ci sono grandi differenze nello sviluppo della temperatura di superficie tra le SKU Intel e AMD, nonostante le differenze di prestazioni. Eseguendo sia Prime95 che FurMark si ottengono contemporaneamente hot spot da 41 °C a 46 °C sull'Intel rispetto a 42 °C a 50 °C sull'AMD. Prepararsi a tasti WASD molto caldi quando si gioca o si eseguono carichi elevati, a differenza della maggior parte dei portatili da gioco.
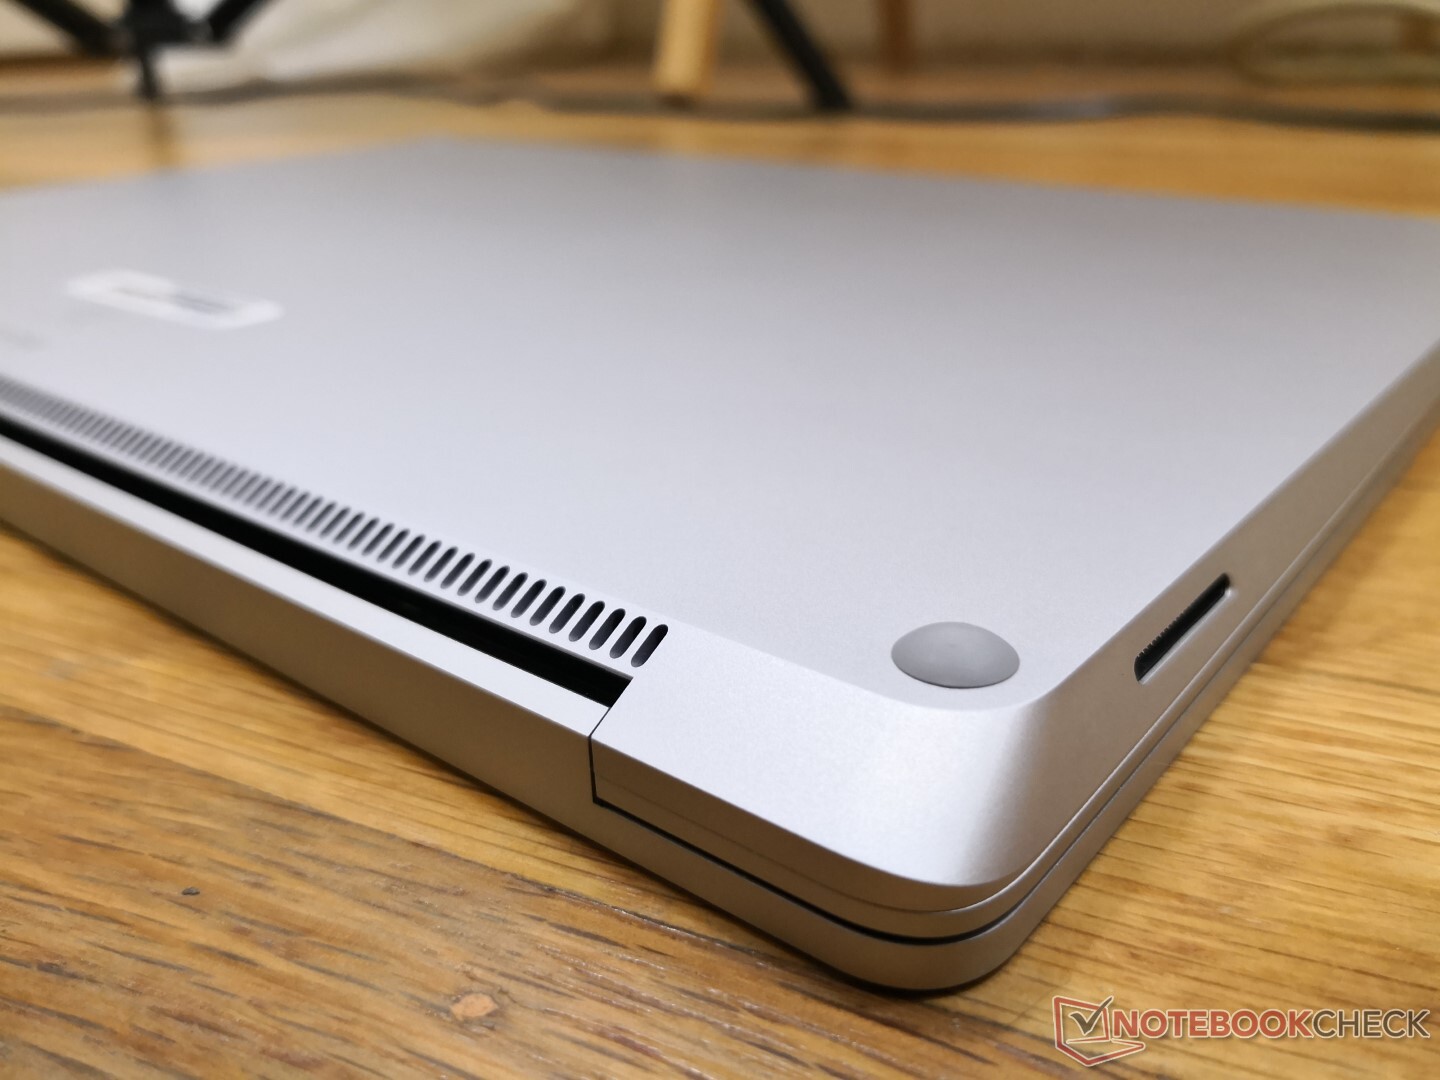
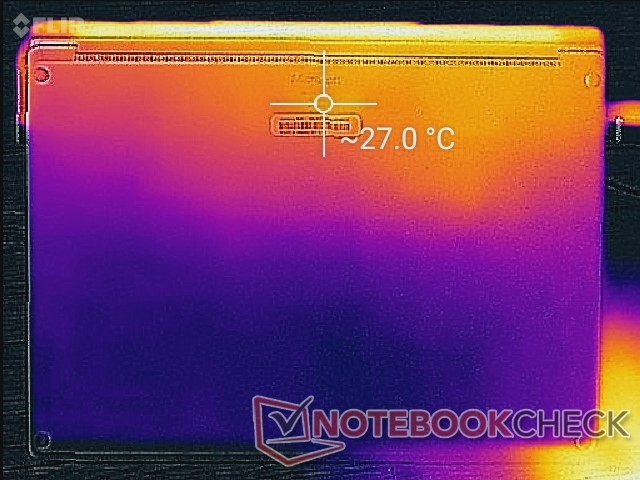
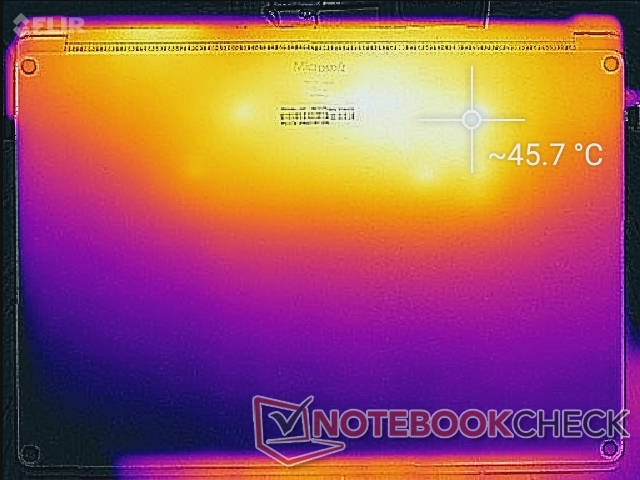
La mancanza di griglie di ventilazione sul pannello inferiore significa che è possibile utilizzare il laptop sul proprio giro senza bloccare il flusso d'aria. D'altra parte, la metà posteriore del laptop sarà più calda del solito.
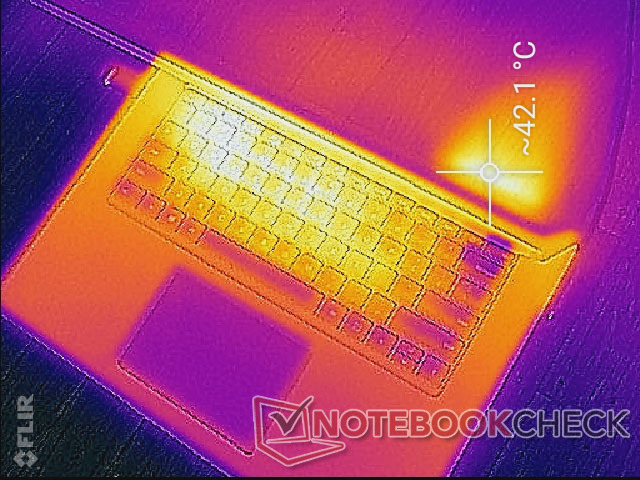
(±) La temperatura massima sul lato superiore è di 41.8 °C / 107 F, rispetto alla media di 34.3 °C / 94 F, che varia da 21.2 a 62.5 °C per questa classe Office.
(-) Il lato inferiore si riscalda fino ad un massimo di 45.6 °C / 114 F, rispetto alla media di 36.8 °C / 98 F
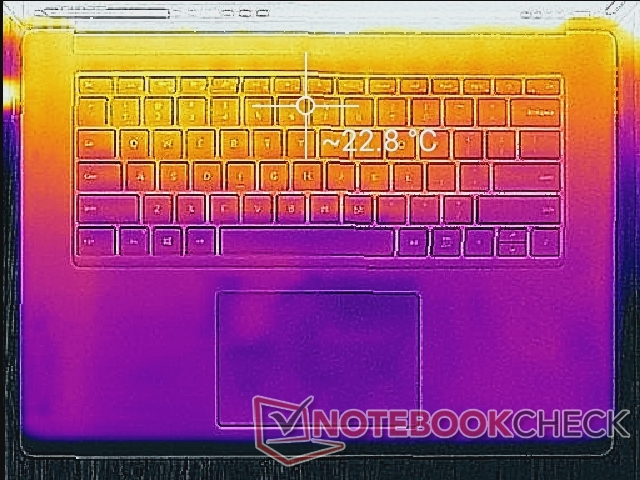
(+) In idle, la temperatura media del lato superiore è di 21.6 °C / 71 F, rispetto alla media deld ispositivo di 29.5 °C / 85 F.
(±) Riproducendo The Witcher 3, la temperatura media per il lato superiore e' di 32.2 °C / 90 F, rispetto alla media del dispositivo di 29.5 °C / 85 F.
(+) I poggiapolsi e il touchpad sono piu' freddi della temperatura della pelle con un massimo di 29 °C / 84.2 F e sono quindi freddi al tatto.
(±) La temperatura media della zona del palmo della mano di dispositivi simili e'stata di 27.5 °C / 81.5 F (-1.5 °C / -2.7 F).
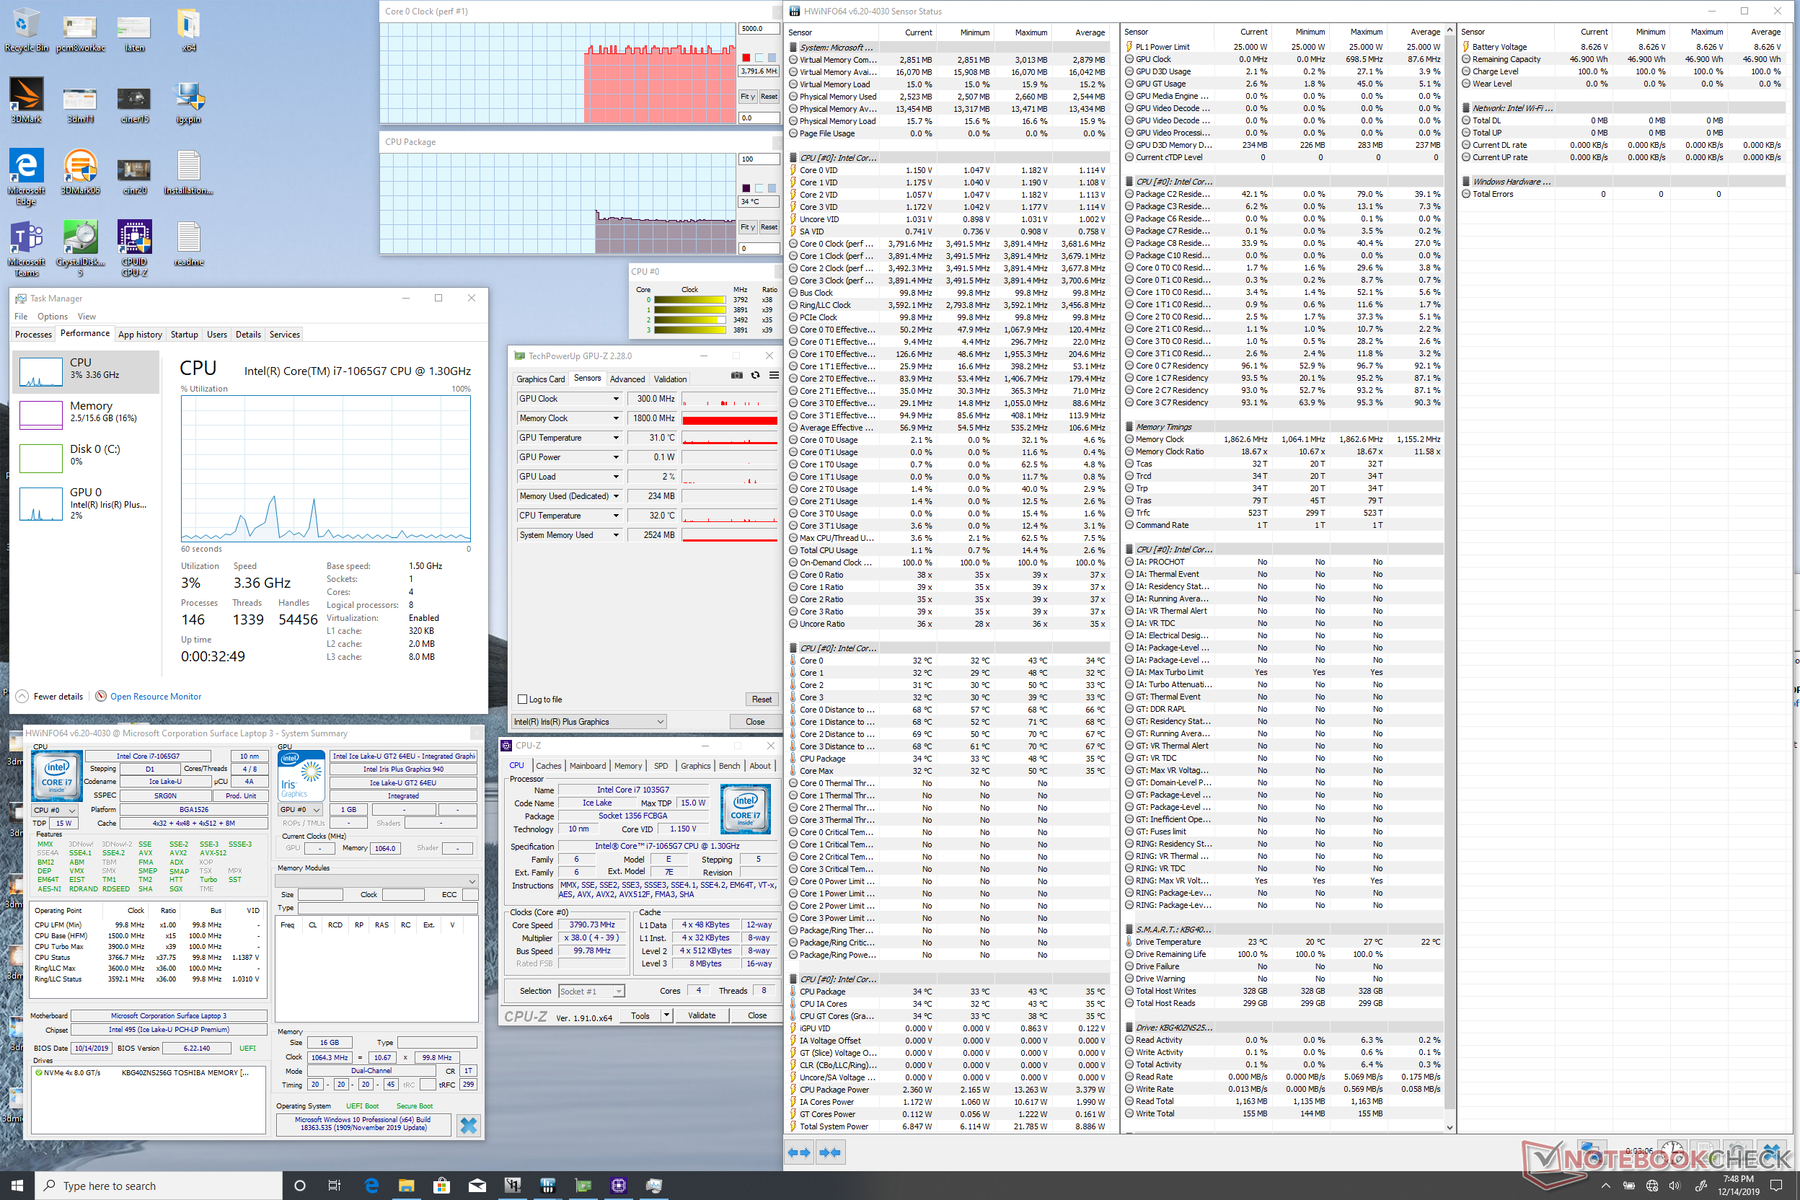
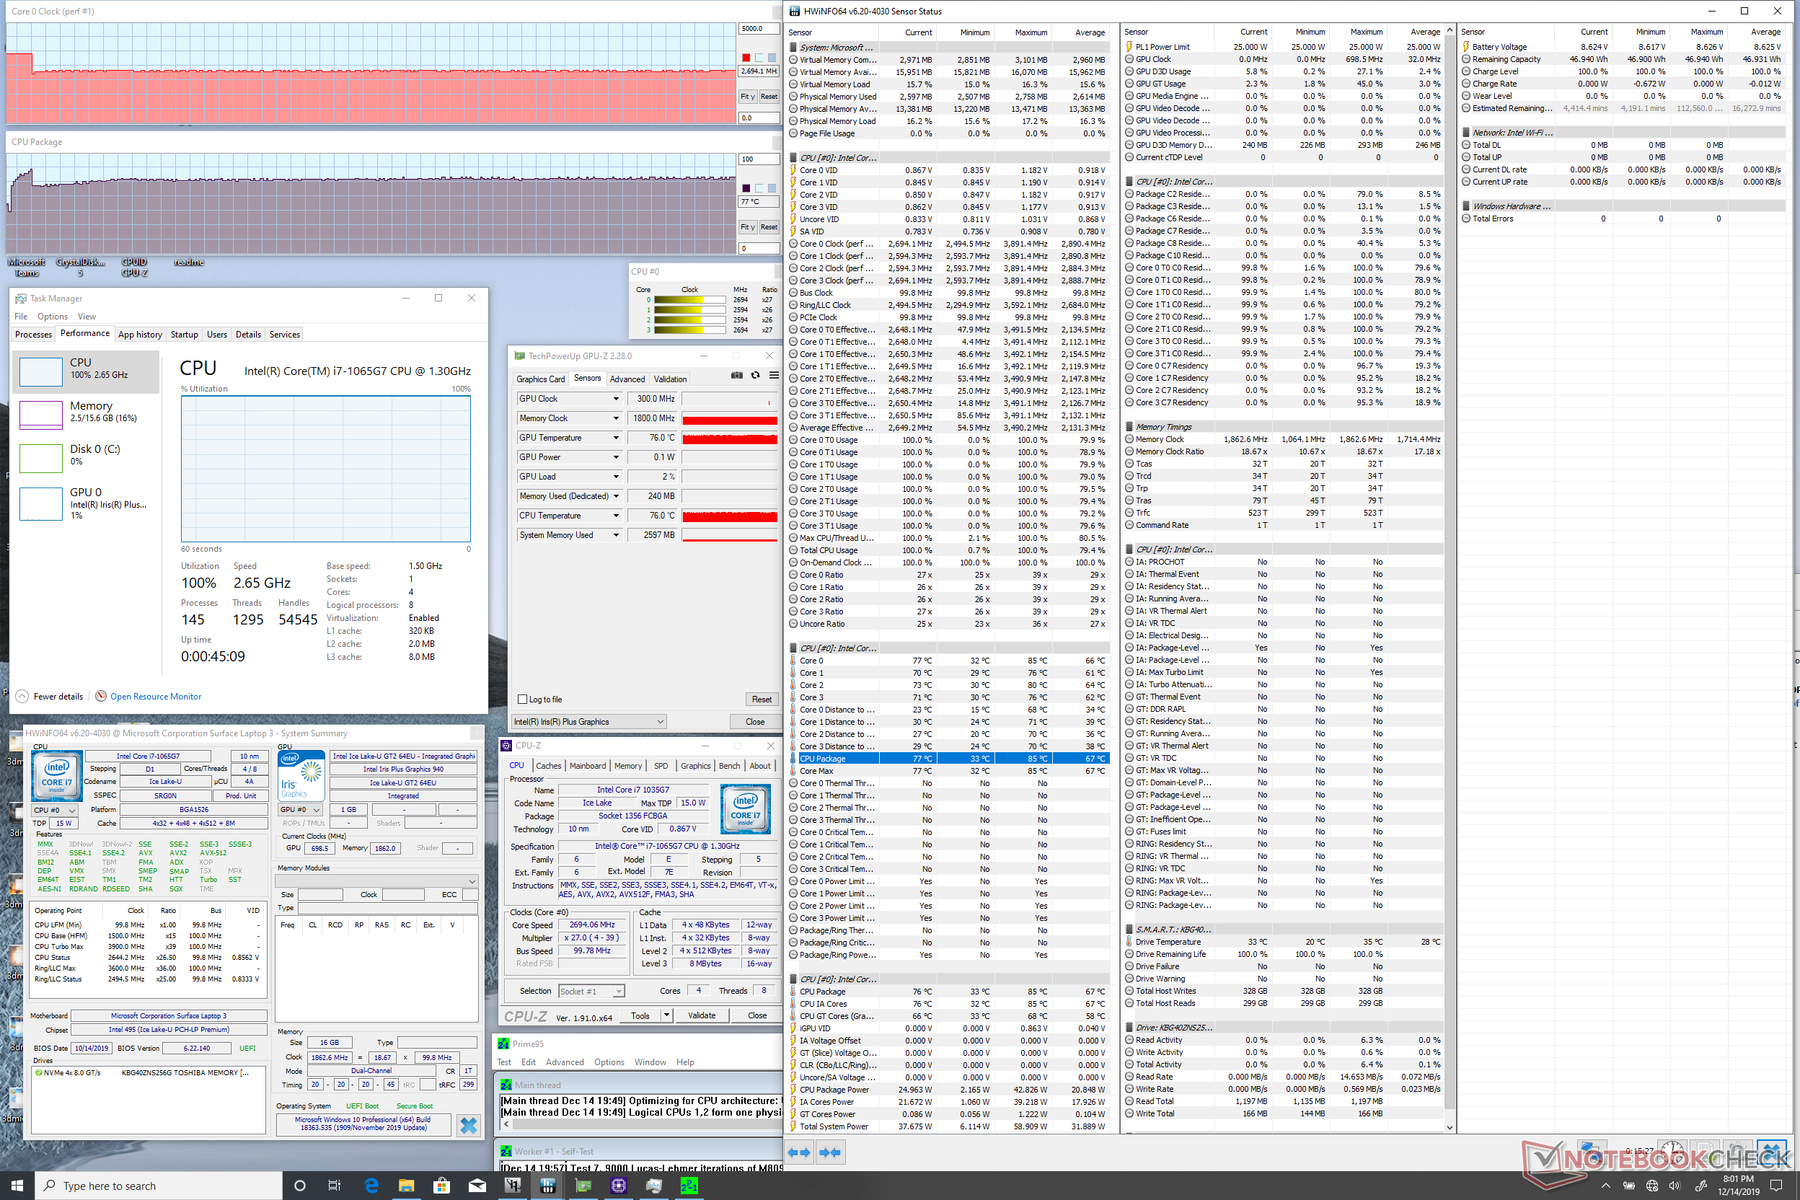
Stress Test
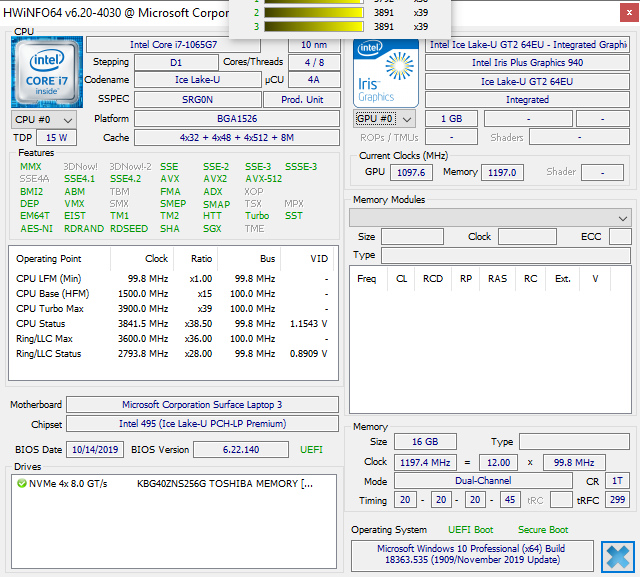
Stressiamo il sistema con carichi sintetici per identificare eventuali problemi di strozzamento o di stabilità. Quando si esegue Prime95, i clock della CPU girano a 3,5 GHz per i primi 20 secondi circa fino a raggiungere un limite di temperatura del core di 85 °C. Successivamente, i clock scendono a 2,6 - 2,7 GHz per mantenere una temperatura del core più fredda di 75 °C. Sia i clock (2,7 GHz vs. 2,4 GHz) che la temperatura del core (77 °C vs. 66 °C Tctl/Tdie) si stabilizzano a valori più alti sul Core i7 se confrontati con la SKU Ryzen 5 3580U. Si tenga presente che HWiNFO riporta le temperature del core in modo diverso tra le CPU Intel e AMD e quindi queste differenze di temperatura potrebbero non essere direttamente paragonabili in questo caso.
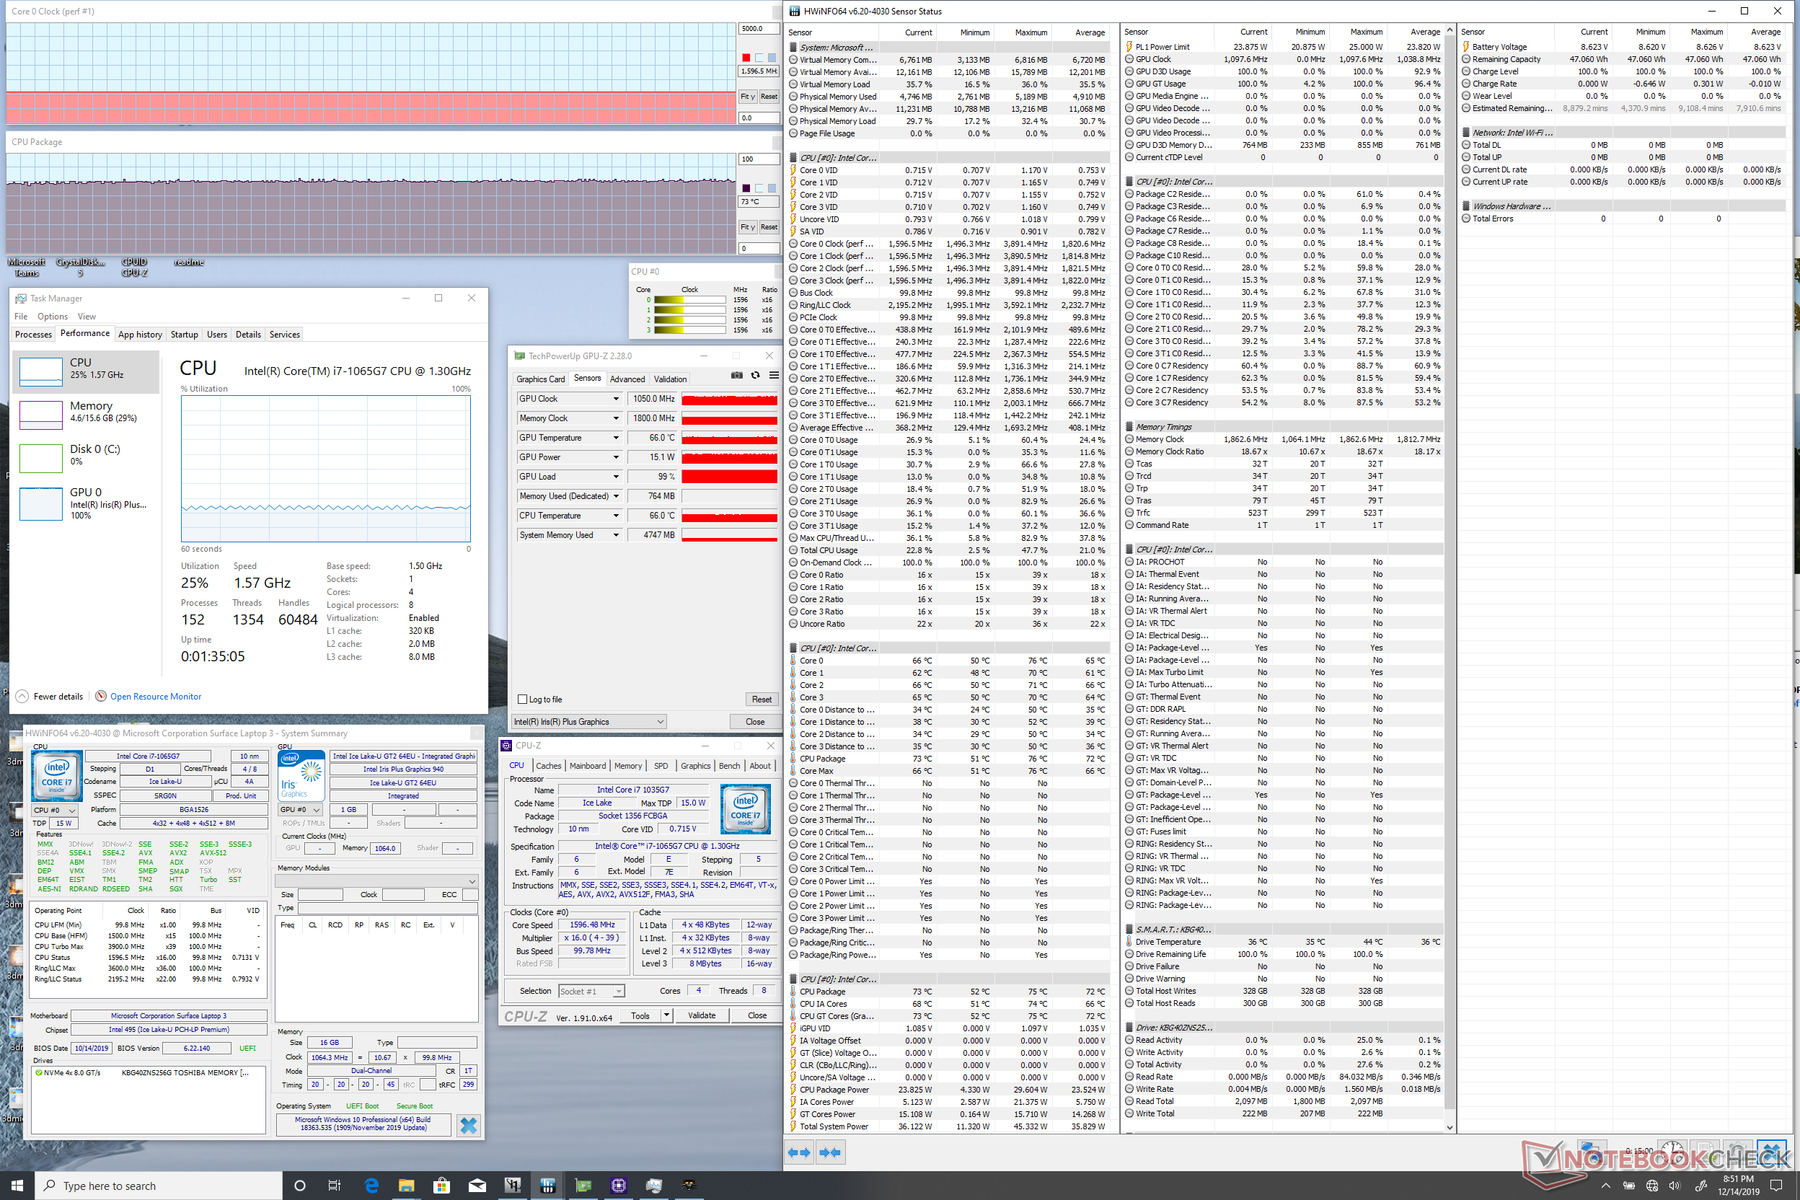
L'esecuzione di Witcher 3 è più rappresentativa dei carichi reali più impegnativi. Sia la velocità di clock della GPU che la temperatura del core sono di nuovo più elevate sulla nostra SKU Intel rispetto alla SKU Ryzen 5 (1050 MHz vs. 800 MHz e 73 C vs. 58 C) secondo la GPU-Z.
L'uso della batteria non limiterà le prestazioni, il che significa che gli utenti possono ottenere il massimo delle prestazioni del sistema se lontani da una presa di corrente. Un Fire Strike eseguito a batterie restituisce i punteggi Physics e Graphics di 12008 e 3060 punti, rispettivamente, rispetto ai 11959 e 3062 punti otteniti con l'alimentazione da rete elettrica.
| CPU Clock (GHz) | GPU Clock (MHz) | Average CPU Temperature (°C) | |
| System Idle | -- | -- | 34 |
| Prime95 Stress | 2.6 - 2.7 | -- | 77 |
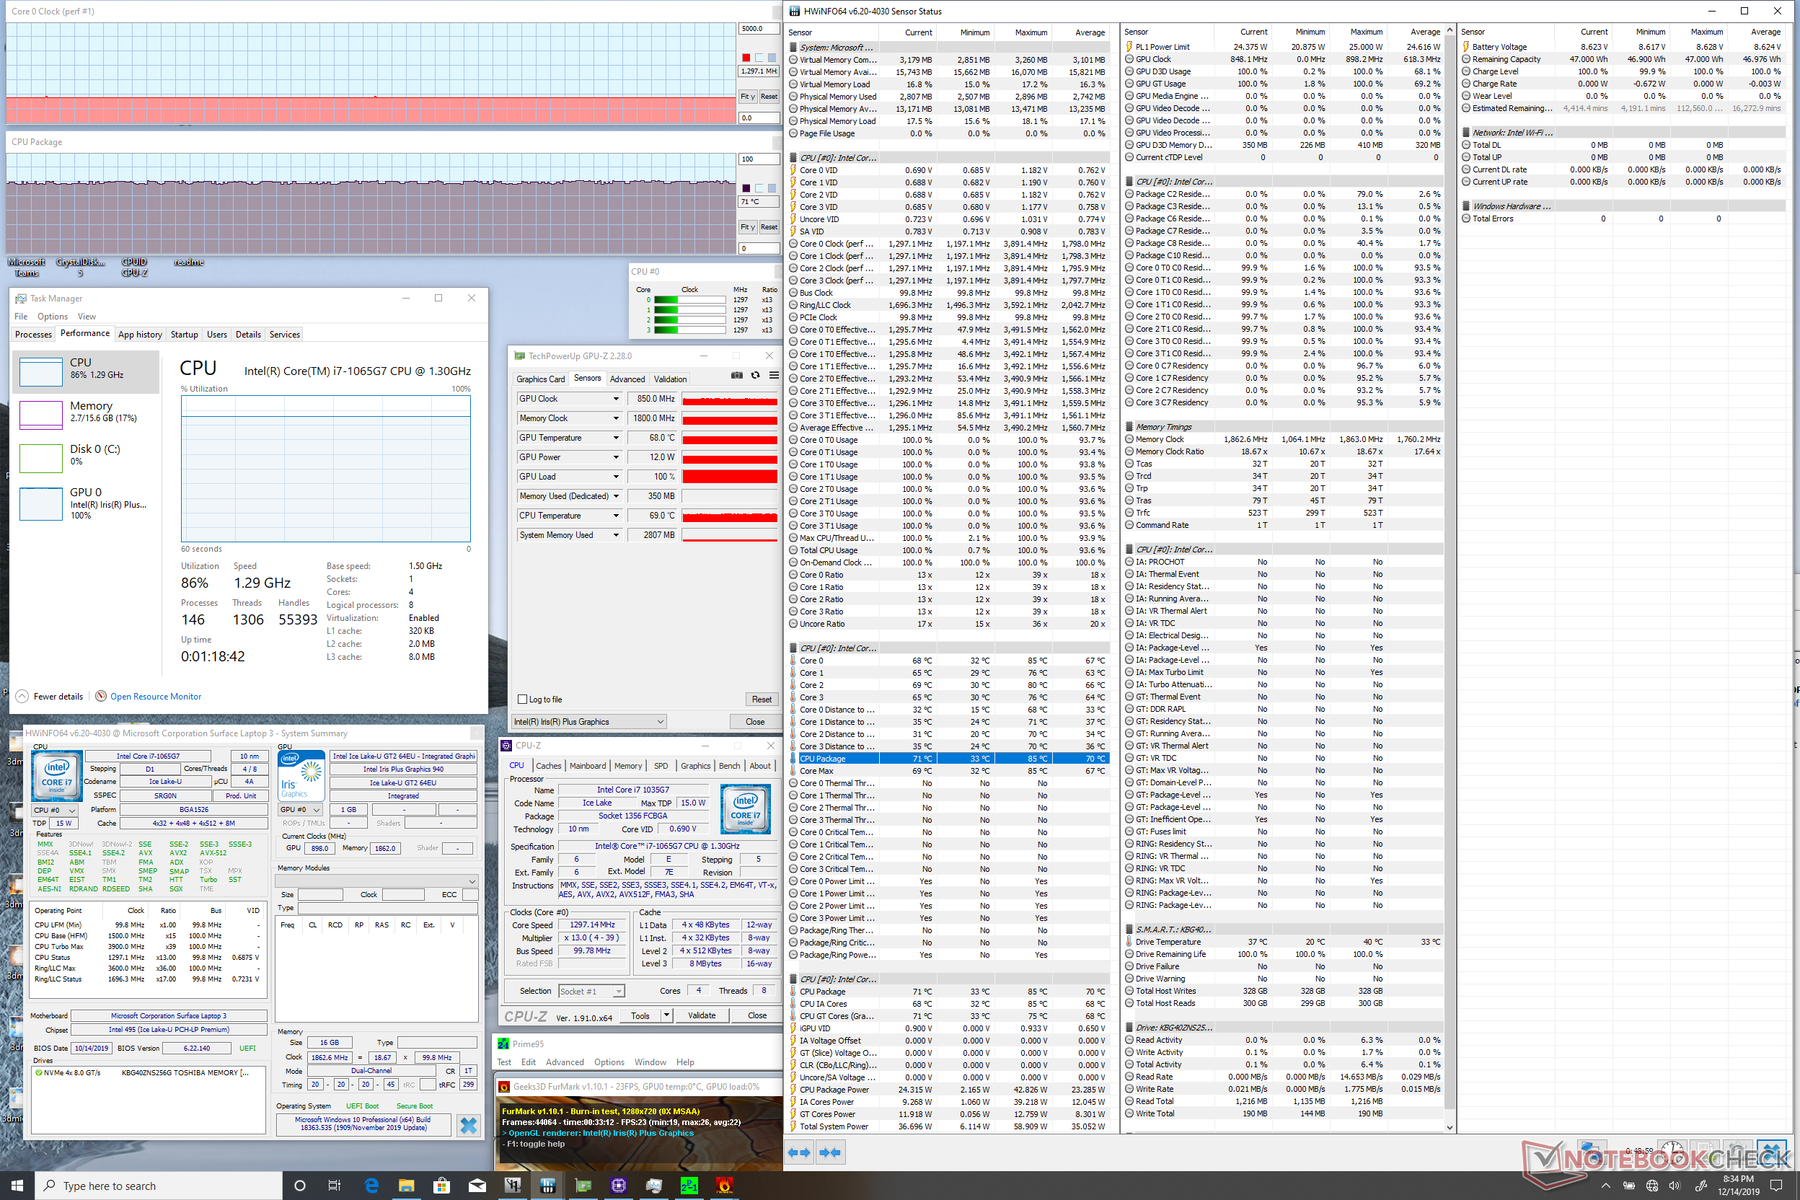
| Prime95 + FurMark Stress | 1.3 | 850 | 71 |
| Witcher 3 Stress | 1.6 | 1050 | 73 |
Altoparlanti

Microsoft Surface Laptop 3 15 i7-1065G7 analisi audio
(±) | potenza degli altiparlanti media ma buona (80.5 dB)
Bassi 100 - 315 Hz
(±) | bassi ridotti - in media 5.3% inferiori alla media
(±) | la linearità dei bassi è media (10.3% delta rispetto alla precedente frequenza)
Medi 400 - 2000 Hz
(+) | medi bilanciati - solo only 2.7% rispetto alla media
(+) | medi lineari (6.7% delta rispetto alla precedente frequenza)
Alti 2 - 16 kHz
(+) | Alti bilanciati - appena 2.7% dalla media
(±) | la linearità degli alti è media (8.5% delta rispetto alla precedente frequenza)
Nel complesso 100 - 16.000 Hz
(+) | suono nel complesso lineare (11.7% differenza dalla media)
Rispetto alla stessa classe
» 3% di tutti i dispositivi testati in questa classe è stato migliore, 2% simile, 95% peggiore
» Il migliore ha avuto un delta di 7%, medio di 21%, peggiore di 53%
Rispetto a tutti i dispositivi testati
» 8% di tutti i dispositivi testati in questa classe è stato migliore, 3% similare, 89% peggiore
» Il migliore ha avuto un delta di 4%, medio di 24%, peggiore di 134%
Apple MacBook 12 (Early 2016) 1.1 GHz analisi audio
(+) | gli altoparlanti sono relativamente potenti (83.6 dB)
Bassi 100 - 315 Hz
(±) | bassi ridotti - in media 11.3% inferiori alla media
(±) | la linearità dei bassi è media (14.2% delta rispetto alla precedente frequenza)
Medi 400 - 2000 Hz
(+) | medi bilanciati - solo only 2.4% rispetto alla media
(+) | medi lineari (5.5% delta rispetto alla precedente frequenza)
Alti 2 - 16 kHz
(+) | Alti bilanciati - appena 2% dalla media
(+) | alti lineari (4.5% delta rispetto alla precedente frequenza)
Nel complesso 100 - 16.000 Hz
(+) | suono nel complesso lineare (10.2% differenza dalla media)
Rispetto alla stessa classe
» 7% di tutti i dispositivi testati in questa classe è stato migliore, 2% simile, 91% peggiore
» Il migliore ha avuto un delta di 5%, medio di 18%, peggiore di 53%
Rispetto a tutti i dispositivi testati
» 5% di tutti i dispositivi testati in questa classe è stato migliore, 1% similare, 94% peggiore
» Il migliore ha avuto un delta di 4%, medio di 24%, peggiore di 134%
Gestione Energetica
Consumo Energetico
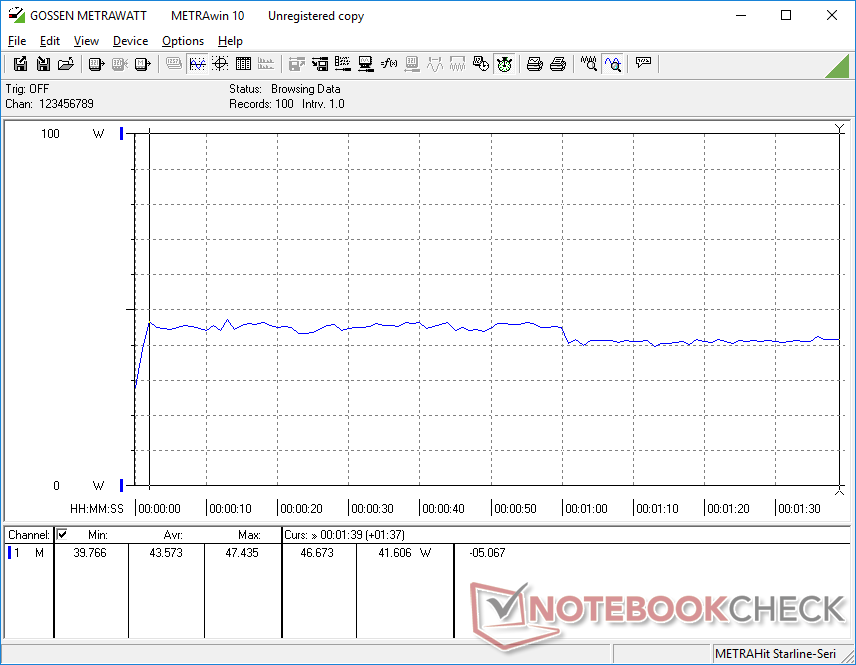
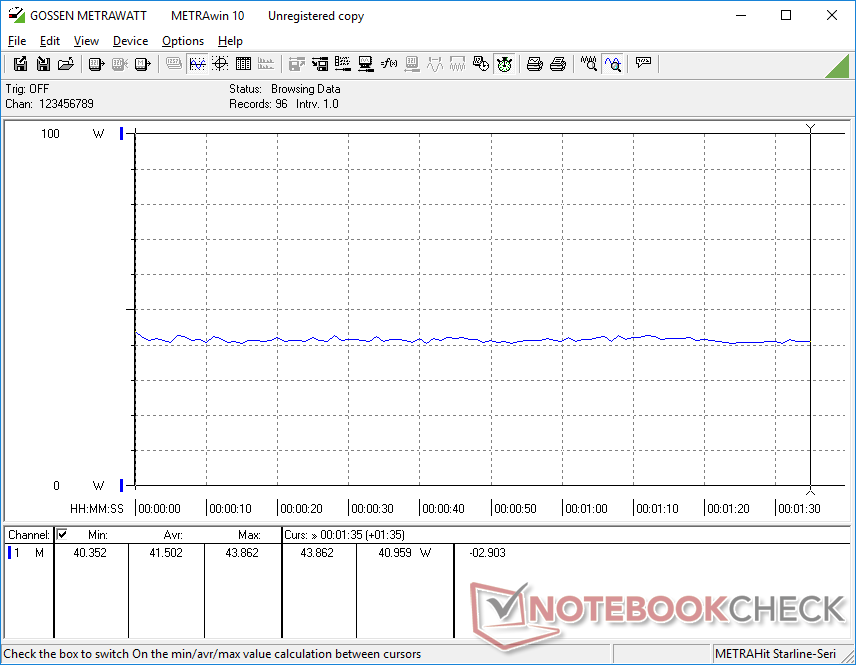
Da fermo sulla scrivania assorbe tra 4 W e 8 W rispetto ai 3 W e 7 W della nostra SKU Ryzen 5. Tuttavia, sospettiamo che le differenze nell'attività di fondo siano probabilmente responsabili della discrepanza, soprattutto a questi valori bassi. I numeri di consumo energetico più interessanti arrivano quando si gioca, dato che il portatile Intel consuma in media poco meno di 42 W rispetto ai 45 W della SKU Ryzen 5, anche se il portatile Intel offre migliori prestazioni di gioco a tutto tondo. In altre parole, Intel ha le prestazioni superiori per Watt rispetto ad AMD.
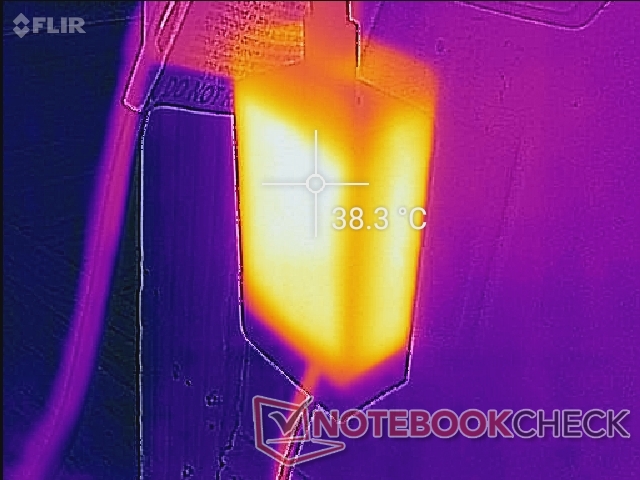
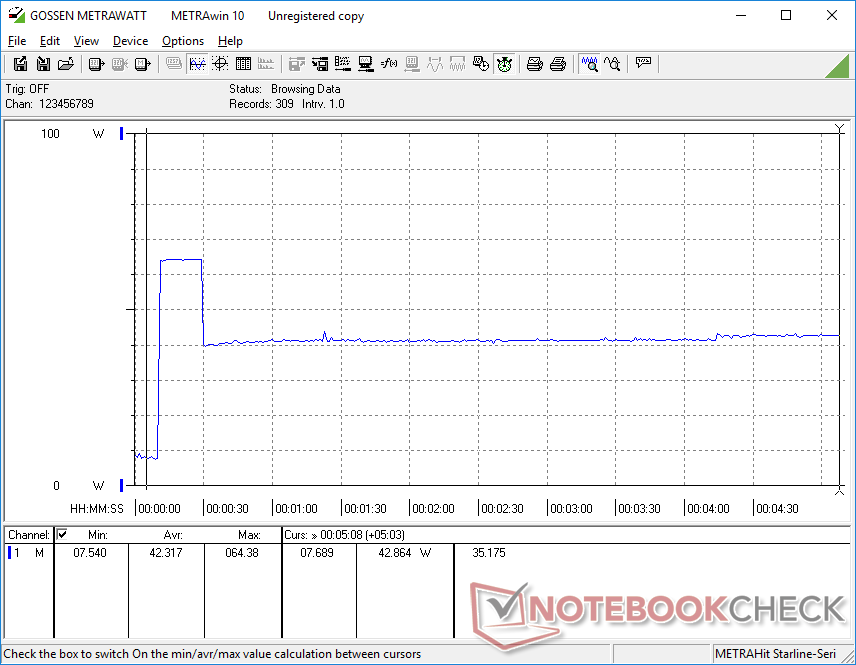
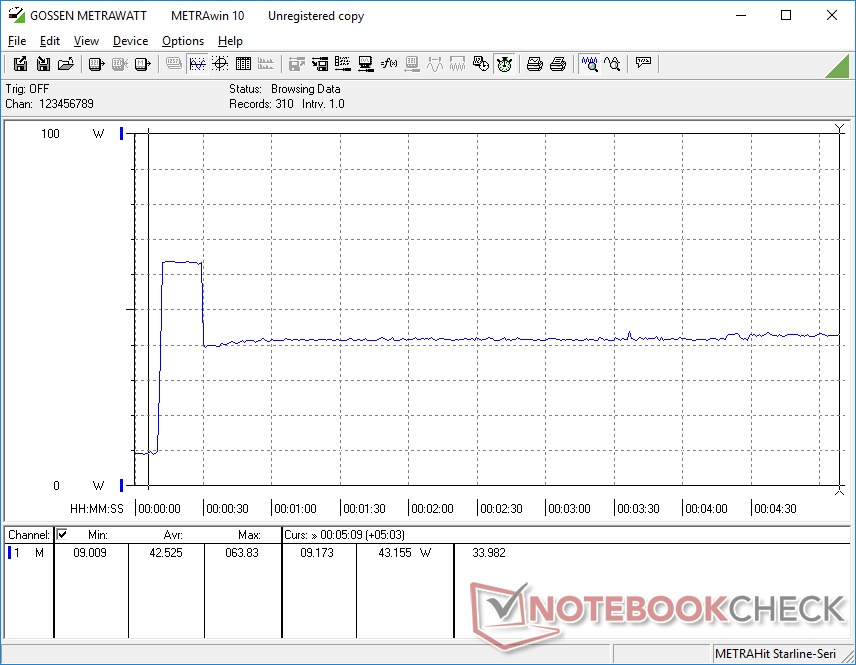
Siamo in grado di registrare un assorbimento massimo di 64,4 W dal piccolo (~9 x 5 x 2,5 cm) adattatore da 65 W quando si utilizzano i carichi Prime95 e FurMark. Tuttavia, questo dura solo per circa 20 secondi prima che il consumo scenda e si stabilizzi a 43 W per motivi termici.
| Off / Standby | |
| Idle | |
| Sotto carico |
|
Leggenda:
min: | |
| Microsoft Surface Laptop 3 15 i7-1065G7 i7-1065G7, Iris Plus Graphics G7 (Ice Lake 64 EU), Toshiba KBG40ZNS256G NVMe, IPS, 2496x1664, 15" | Dell XPS 15 7590 i5 iGPU FHD i5-9300H, UHD Graphics 630, Toshiba XG6 KXG60ZNV512G, IPS, 1920x1080, 15.6" | Asus ZenBook 15 UX534FT-DB77 i7-8565U, GeForce GTX 1650 Max-Q, Samsung SSD PM981 MZVLB1T0HALR, IPS, 1920x1080, 15.6" | MSI Prestige 15 A10SC i7-10710U, GeForce GTX 1650 Max-Q, Samsung SSD PM981 MZVLB1T0HALR, IPS, 3840x2160, 15.6" | Razer Blade Stealth i7-8565U i7-8565U, GeForce MX150, Lite-On CA3-8D256-Q11, IPS, 1920x1080, 13.3" | Microsoft Surface Laptop 3 15 Ryzen 5 3580U R5 3580U, Vega 9, SK hynix BC501 HFM256GDGTNG, IPS, 2496x1664, 15" | |
|---|---|---|---|---|---|---|
| Power Consumption | -17% | -74% | -68% | -28% | 10% | |
| Idle Minimum * (Watt) | 4.4 | 3.79 14% | 5 -14% | 6.1 -39% | 6.7 -52% | 3.3 25% |
| Idle Average * (Watt) | 8.3 | 6.9 17% | 13.2 -59% | 13.2 -59% | 8.6 -4% | 7.1 14% |
| Idle Maximum * (Watt) | 8.6 | 9.2 -7% | 24 -179% | 19.2 -123% | 9.4 -9% | 7.2 16% |
| Load Average * (Watt) | 43.6 | 62 -42% | 70 -61% | 75 -72% | 64.1 -47% | 44.8 -3% |
| Witcher 3 ultra * (Watt) | 41.5 | 63.3 -53% | 74 -78% | 63.7 -53% | 45.1 -9% | |
| Load Maximum * (Watt) | 64.4 | 108 -68% | 114 -77% | 89.7 -39% | 64.1 -0% | 53 18% |
* ... Meglio usare valori piccoli
Autonomia della Batteria
La capacità della batteria è ridotta per un laptop da 15" a soli 45 Wh. Anche il Huawei MateBook X Pro, ad esempio, è dotato di una batteria con una capacità superiore di 57 Wh. I tempi di autonomia sono ancora rispettabili a poco più di 8 ore di utilizzo della WLAN nel mondo reale, risultando quasi un'ora più brevi rispetto alla più lenta SKU Ryzen 5.
Un dato degno di nota è che l'inattività sul desktop con le impostazioni e il livello di luminosità più bassi possibili durerà circa 35 ore prima di doversi ricaricare. Anche se uno scenario non realistico, mostra che gli utenti possono allungare l'autonomia della batteria più a lungo del solito, se necessario.
La ricarica completa richiede circa 2 ore. Anche la ricarica tramite USB Type-C con i nostri adattatori Dell da 130 W o Lenovo da 65 W funziona.
| Microsoft Surface Laptop 3 15 i7-1065G7 i7-1065G7, Iris Plus Graphics G7 (Ice Lake 64 EU), 45 Wh | Apple MacBook Pro 16 2019 i9 5500M i9-9880H, Radeon Pro 5500M, 99.8 Wh | Dell XPS 15 7590 i5 iGPU FHD i5-9300H, UHD Graphics 630, 97 Wh | Lenovo Yoga C940-15IRH i7-9750H, GeForce GTX 1650 Max-Q, 69 Wh | HP Spectre x360 15-df0126ng i7-8750H, GeForce GTX 1050 Ti Max-Q, 84 Wh | Asus ZenBook 15 UX534FT-DB77 i7-8565U, GeForce GTX 1650 Max-Q, 71 Wh | MSI Prestige 15 A10SC i7-10710U, GeForce GTX 1650 Max-Q, 82 Wh | Microsoft Surface Laptop 3 15 Ryzen 5 3580U R5 3580U, Vega 9, 45 Wh | |
|---|---|---|---|---|---|---|---|---|
| Autonomia della batteria | -1% | 31% | -26% | -6% | 5% | -14% | -16% | |
| Reader / Idle (h) | 35 | 18.2 -48% | 18.8 -46% | 21.5 -39% | 19.1 -45% | 18.7 -47% | ||
| WiFi v1.3 (h) | 8.2 | 12 46% | 14.1 72% | 9.7 18% | 8.8 7% | 8.4 2% | 7.6 -7% | 9.1 11% |
| Load (h) | 1.9 | 1 -47% | 1.7 -11% | 1 -47% | 2.3 21% | 2.9 53% | 2.1 11% | 1.7 -11% |
| Witcher 3 ultra (h) | 0.9 |
Pro
Contro
Giudizio Complessivo
I principali vantaggi della nostra SKU Core i7 rispetto alla SKU Ryzen 5 includono la compatibilità Wi-Fi 6, prestazioni di archiviazione più veloci, prestazioni della CPU superiori, accelerazione AI integrata, prestazioni di gioco migliori e prestazioni per Watt più elevate. Altri aspetti come il display, la durata della batteria WLAN, la temperatura della superficie e il rumore della ventola sono uguali o quasi identici.
Non sorprende che la nostra SKU Core i7 sia in grado di superare la nostra più economica SKU Ryzen 5, ma è il margine che ci interessa di più. Le prestazioni della CPU, ad esempio, non sono molto più veloci, il che significa che non si dovrebbe scegliere Intel piuttosto che AMD in base alla sola potenza del processore. Le prestazioni di gioco sono anche molto inconsistenti, dato che alcuni giochi funzionano meglio su Intel e altri sono collo a collo. Nel frattempo, l'accelerazione dell'IA continua ad essere una novità per la maggior parte degli utenti dell'ufficio a partire da questa recensione, poiché non ha un'influenza diretta sulle comuni attività quotidiane. Intel può davvero sfruttare i suoi vantaggi rispetto ad AMD nel campo dell'IA, ma questo non significherà molto per i consumatori se le applicazioni non saranno ottimizzate per sfruttare l'accelerazione AI in primo luogo.
In breve, le differenze di prestazioni quotidiane tra le SKU Surface Laptop 3 Core i7 e Ryzen 5 sono inferiori al previsto, soprattutto se si considera il sovrapprezzo che Microsoft sta applicando per le sue SKU Intel. Se siete un power user che vuole il meglio che il Surface Laptop possa offrire, allora le opzioni Intel sono un gioco da ragazzi. Altrimenti, vi sarebbe difficile capire la differenza tra un Intel e un AMD Surface Laptop 3 se il vostro carico di lavoro consiste principalmente nell'elaborazione di testi, nella navigazione sul web o nello streaming video.
Microsoft Surface Laptop 3 15 i7-1065G7
- 02/23/2020 v7 (old)
Allen Ngo
Price comparison
