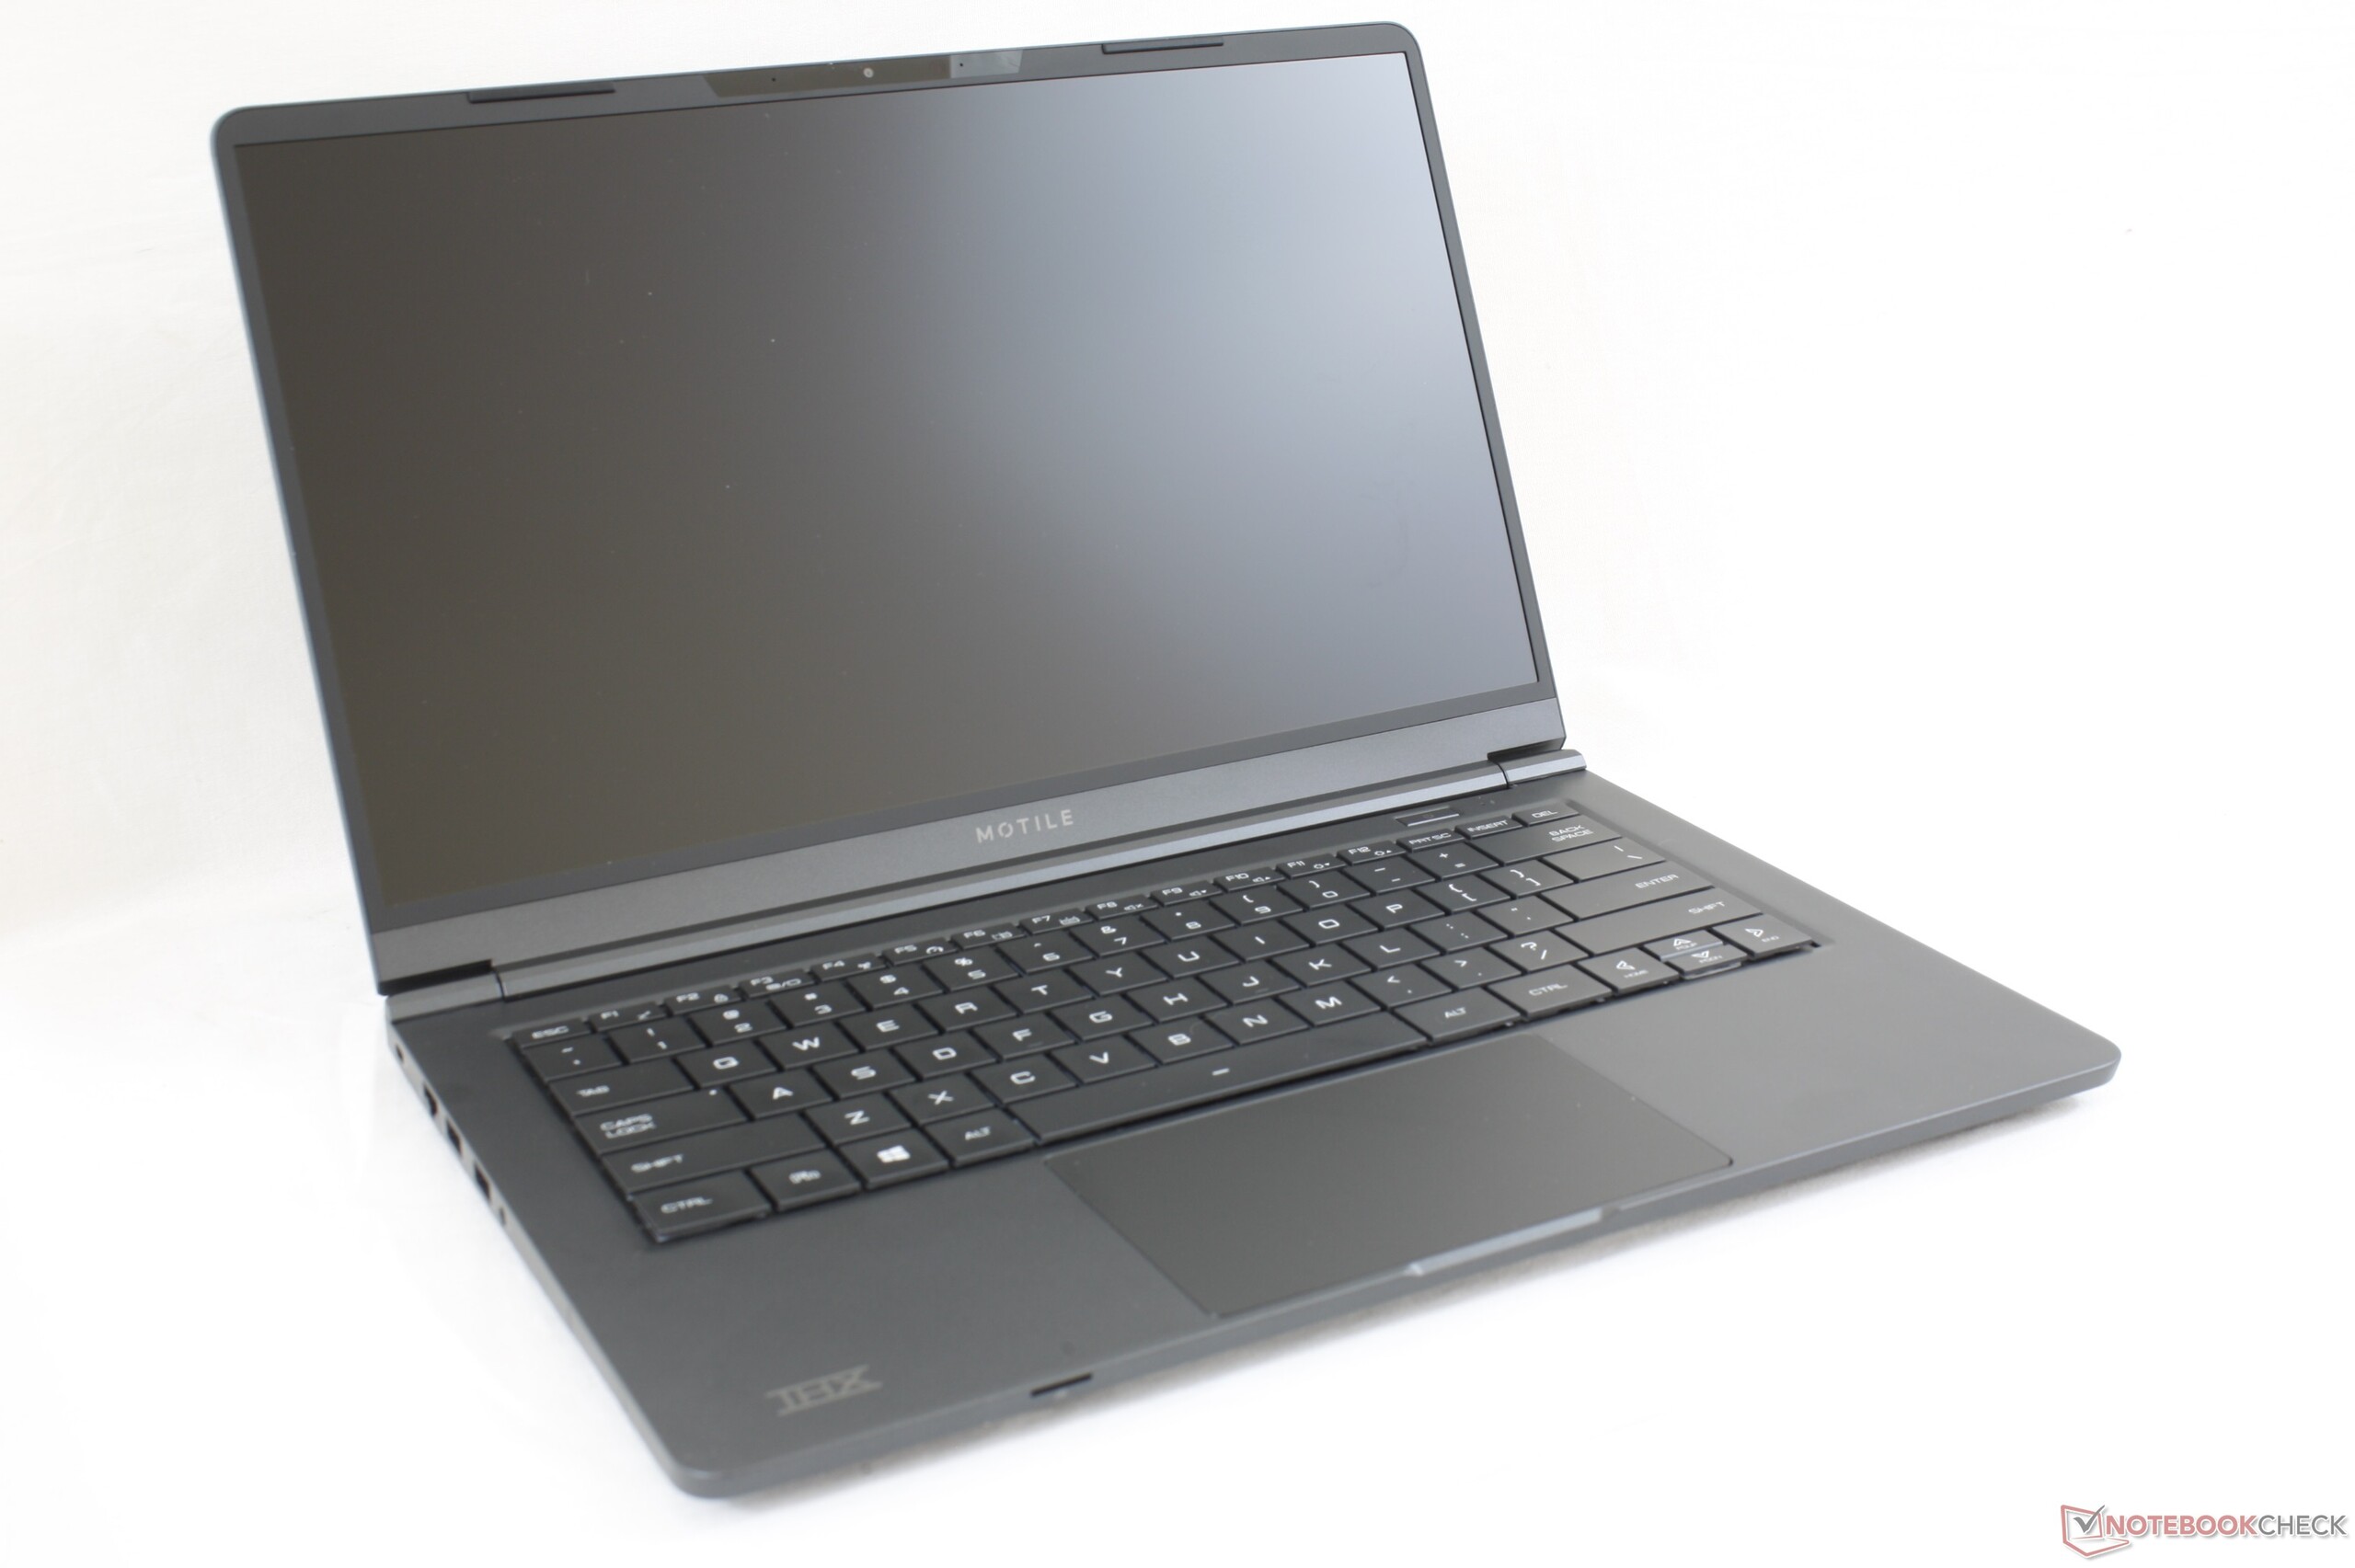
Recensione del Laptop Walmart Motile M142: non male per $500
Punteggio | Data | Modello | Peso | Altezza | Dimensione | Risoluzione | Prezzo |
|---|---|---|---|---|---|---|---|
| 77.7 % v7 (old) | 11/2019 | Walmart Motile M142 R5 3500U, Vega 8 | 1.1 kg | 18 mm | 14.00" | 1920x1080 | |
| 82.7 % v7 (old) | 11/2019 | Acer Swift 3 SF314-41-R8HZ R5 3500U, Vega 8 | 1.5 kg | 18 mm | 14.00" | 1920x1080 | |
| 79.7 % v6 (old) | 08/2019 | Dell Inspiron 15 5000 5585 R7 3700U, Vega 10 | 1.8 kg | 19.5 mm | 15.60" | 1920x1080 | |
| 80.7 % v6 (old) | 05/2018 | Asus VivoBook 15 X542UF-DM143T i5-8250U, GeForce MX130 | 2.3 kg | 23 mm | 15.60" | 1920x1080 | |
| 84.9 % v6 (old) | 07/2019 | Lenovo IdeaPad S540-14IWL i5-8265U, GeForce MX250 | 1.4 kg | 15.9 mm | 14.00" | 1920x1080 |
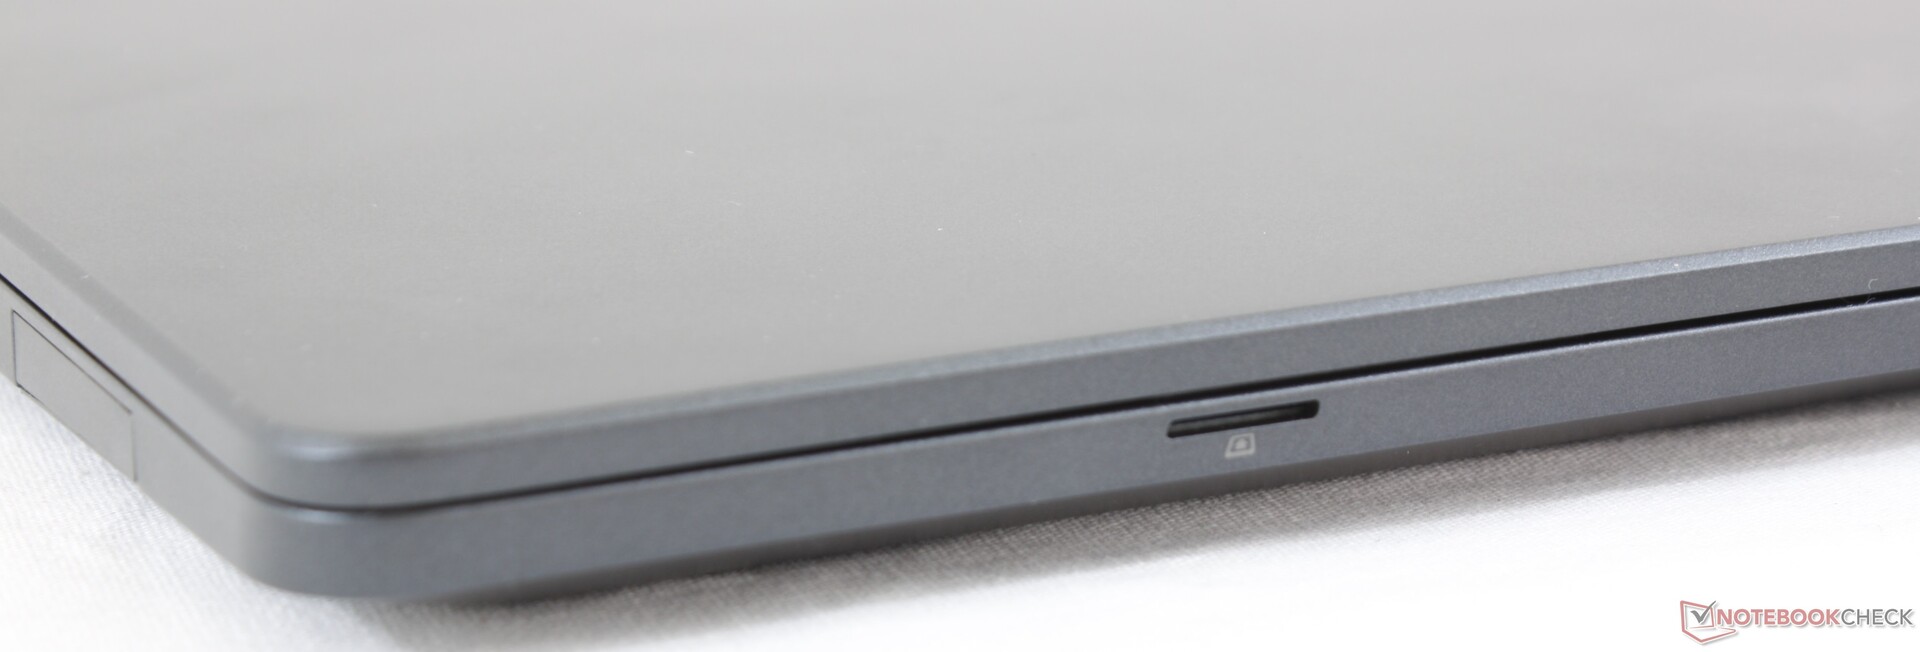
| SD Card Reader | |
| average JPG Copy Test (av. of 3 runs) | |
| Lenovo IdeaPad S540-14IWL (Toshiba Exceria Pro SDXC 64 GB UHS-II) | |
| Acer Swift 3 SF314-41-R8HZ (Toshiba Exceria Pro SDXC 64 GB UHS-II) | |
| HP 14-dk0008ng (Toshiba Exceria Pro SDXC 64 GB UHS-II) | |
| Walmart Motile M142 (Toshiba Exceria Pro M501 64 GB UHS-II) | |
| Asus VivoBook 14 X403FA (Toshiba Exceria Pro SDXC 64 GB UHS-II) | |
| maximum AS SSD Seq Read Test (1GB) | |
| Lenovo IdeaPad S540-14IWL (Toshiba Exceria Pro SDXC 64 GB UHS-II) | |
| HP 14-dk0008ng (Toshiba Exceria Pro SDXC 64 GB UHS-II) | |
| Acer Swift 3 SF314-41-R8HZ (Toshiba Exceria Pro SDXC 64 GB UHS-II) | |
| Walmart Motile M142 (Toshiba Exceria Pro M501 64 GB UHS-II) | |
| Asus VivoBook 14 X403FA (Toshiba Exceria Pro SDXC 64 GB UHS-II) | |
| |||||||||||||||||||||||||
Distribuzione della luminosità: 82 %
Al centro con la batteria: 229 cd/m²
Contrasto: 890:1 (Nero: 0.27 cd/m²)
ΔE ColorChecker Calman: 4.22 | ∀{0.5-29.43 Ø4.73}
calibrated: 3.76
ΔE Greyscale Calman: 2.3 | ∀{0.09-98 Ø4.97}
62.1% sRGB (Argyll 1.6.3 3D)
39.9% AdobeRGB 1998 (Argyll 1.6.3 3D)
43.43% AdobeRGB 1998 (Argyll 3D)
62.5% sRGB (Argyll 3D)
41.95% Display P3 (Argyll 3D)
Gamma: 2.39
CCT: 6585 K
| Walmart Motile M142 Chi Mei N140HCA-EAC, IPS, 14", 1920x1080 | Acer Swift 3 SF314-41-R8HZ Chi Mei N140HCA-EAC, IPS, 14", 1920x1080 | Lenovo Yoga C940-14IIL LP140WF9-SPE2, IPS LED, 14", 1920x1080 | Asus VivoBook 14 X403FA Chi Mei N140HCA-EAC, IPS, 14", 1920x1080 | Lenovo IdeaPad S540-14IWL NV140FHM-N48, IPS, 14", 1920x1080 | HP 14-dk0008ng AU Optronics AUO403D, IPS, 14", 1920x1080 | |
|---|---|---|---|---|---|---|
| Display | -1% | 56% | -3% | -5% | -6% | |
| Display P3 Coverage (%) | 41.95 | 41.43 -1% | 66 57% | 40.85 -3% | 40.1 -4% | 39.53 -6% |
| sRGB Coverage (%) | 62.5 | 61.8 -1% | 97.9 57% | 61.1 -2% | 59.2 -5% | 59.1 -5% |
| AdobeRGB 1998 Coverage (%) | 43.43 | 42.85 -1% | 67.3 55% | 42.25 -3% | 41.43 -5% | 40.84 -6% |
| Response Times | -8% | -30% | -12% | -20% | -8% | |
| Response Time Grey 50% / Grey 80% * (ms) | 35.2 ? | 38 ? -8% | 49.6 ? -41% | 40.8 ? -16% | 39.6 ? -13% | 38 ? -8% |
| Response Time Black / White * (ms) | 25.2 ? | 27 ? -7% | 30 ? -19% | 27.2 ? -8% | 32 ? -27% | 27 ? -7% |
| PWM Frequency (Hz) | 25000 ? | 250 ? | 24510 ? | 352.1 ? | ||
| Screen | -3% | 45% | -2% | 4% | 16% | |
| Brightness middle (cd/m²) | 240.3 | 233 -3% | 384 60% | 250 4% | 316 32% | 269 12% |
| Brightness (cd/m²) | 233 | 219 -6% | 363 56% | 236 1% | 301 29% | 257 10% |
| Brightness Distribution (%) | 82 | 75 -9% | 90 10% | 78 -5% | 88 7% | 89 9% |
| Black Level * (cd/m²) | 0.27 | 0.14 48% | 0.17 37% | 0.27 -0% | 0.28 -4% | 0.2 26% |
| Contrast (:1) | 890 | 1664 87% | 2259 154% | 926 4% | 1129 27% | 1345 51% |
| Colorchecker dE 2000 * | 4.22 | 5.9 -40% | 3.5 17% | 5 -18% | 5.3 -26% | 3.68 13% |
| Colorchecker dE 2000 max. * | 23.32 | 22.8 2% | 5.5 76% | 20.7 11% | 18.5 21% | 7.36 68% |
| Colorchecker dE 2000 calibrated * | 3.76 | 1 73% | 4.3 -14% | 4.8 -28% | 4.8 -28% | |
| Greyscale dE 2000 * | 2.3 | 4.8 -109% | 4.6 -100% | 2.4 -4% | 2.4 -4% | 1.69 27% |
| Gamma | 2.39 92% | 2.06 107% | 2.32 95% | 2.05 107% | 2.05 107% | 2.49 88% |
| CCT | 6585 99% | 6589 99% | 6884 94% | 6697 97% | 6644 98% | 6406 101% |
| Color Space (Percent of AdobeRGB 1998) (%) | 39.9 | 39 -2% | 62 55% | 38.9 -3% | 37.6 -6% | 38 -5% |
| Color Space (Percent of sRGB) (%) | 62.1 | 62 0% | 97.7 57% | 61 -2% | 58.3 -6% | 59 -5% |
| Media totale (Programma / Settaggio) | -4% /
-3% | 24% /
38% | -6% /
-4% | -7% /
-1% | 1% /
9% |
* ... Meglio usare valori piccoli
Tempi di risposta del Display
| ↔ Tempi di risposta dal Nero al Bianco | ||
|---|---|---|
| 25.2 ms ... aumenta ↗ e diminuisce ↘ combinato | ↗ 14.8 ms Incremento | 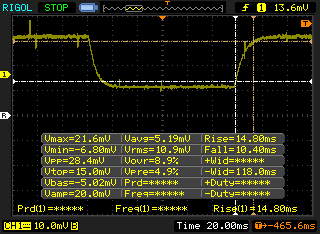 |
| ↘ 10.4 ms Calo | ||
| Lo schermo mostra tempi di risposta relativamente lenti nei nostri tests e potrebbe essere troppo lento per i gamers. In confronto, tutti i dispositivi di test variano da 0.1 (minimo) a 240 (massimo) ms. » 60 % di tutti i dispositivi è migliore. Questo significa che i tempi di risposta rilevati sono peggiori rispetto alla media di tutti i dispositivi testati (19.9 ms). | ||
| ↔ Tempo di risposta dal 50% Grigio all'80% Grigio | ||
| 35.2 ms ... aumenta ↗ e diminuisce ↘ combinato | ↗ 23.6 ms Incremento | 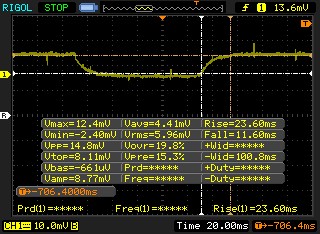 |
| ↘ 11.6 ms Calo | ||
| Lo schermo mostra tempi di risposta lenti nei nostri tests e sarà insoddisfacente per i gamers. In confronto, tutti i dispositivi di test variano da 0.165 (minimo) a 636 (massimo) ms. » 49 % di tutti i dispositivi è migliore. Questo significa che i tempi di risposta rilevati sono peggiori rispetto alla media di tutti i dispositivi testati (31.1 ms). | ||
Sfarfallio dello schermo / PWM (Pulse-Width Modulation)
| flickering dello schermo / PWM rilevato | 25000 Hz | ≤ 34 % settaggio luminosita' | 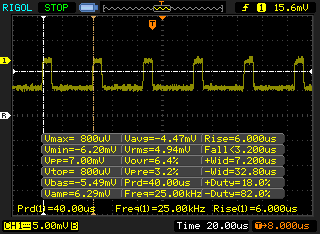 |
Il display sfarfalla a 25000 Hz (Probabilmente a causa dell'uso di PWM) Flickering rilevato ad una luminosita' di 34 % o inferiore. Non dovrebbe verificarsi flickering o PWM sopra questo valore di luminosita'. La frequenza di 25000 Hz è abbastanza alta, quindi la maggioranza degli utenti sensibili al PWM non dovrebbero notare alcun flickering. In confronto: 52 % di tutti i dispositivi testati non utilizza PWM per ridurre la luminosita' del display. Se è rilevato PWM, una media di 7794 (minimo: 5 - massimo: 343500) Hz è stata rilevata. | |||
| PCMark 8 Home Score Accelerated v2 | 3500 punti | |
| PCMark 8 Work Score Accelerated v2 | 4907 punti | |
| PCMark 10 Score | 3868 punti | |
Aiuto | ||
| Walmart Motile M142 BIWIN SSD 256 GB | Acer Swift 3 SF314-41-R8HZ WDC PC SN520 SDAPNUW-512G | Lenovo Yoga C940-14IIL Samsung SSD PM981 MZVLB512HAJQ | Asus VivoBook 14 X403FA Intel SSD 660p SSDPEKNW512G8 | Lenovo IdeaPad S540-14IWL Samsung SSD PM981 MZVLB512HAJQ | HP 14-dk0008ng Samsung PM871b MZNLN128HAHQ | |
|---|---|---|---|---|---|---|
| AS SSD | 170% | 278% | 130% | 262% | -13% | |
| Seq Read (MB/s) | 466.1 | 1466 215% | 2525 442% | 1633 250% | 1939 316% | 491.6 5% |
| Seq Write (MB/s) | 451.9 | 1360 201% | 1253 177% | 906 100% | 1755 288% | 473.9 5% |
| 4K Read (MB/s) | 26.42 | 38.06 44% | 59.1 124% | 56.6 114% | 61 131% | 26.82 2% |
| 4K Write (MB/s) | 77 | 86 12% | 134.1 74% | 152 97% | 138.9 80% | 57.8 -25% |
| 4K-64 Read (MB/s) | 192.1 | 1008 425% | 1010 426% | 322.9 68% | 1271 562% | 244.3 27% |
| 4K-64 Write (MB/s) | 198.4 | 956 382% | 1461 636% | 814 310% | 1330 570% | 154.9 -22% |
| Access Time Read * (ms) | 0.089 | 0.062 30% | 0.052 42% | 0.086 3% | 0.04 55% | 0.119 -34% |
| Access Time Write * (ms) | 0.123 | 0.042 66% | 0.029 76% | 0.045 63% | 0.028 77% | 0.062 50% |
| Score Read (Points) | 265 | 1193 350% | 1322 399% | 543 105% | 1526 476% | 320 21% |
| Score Write (Points) | 321 | 1178 267% | 1721 436% | 1056 229% | 1645 412% | 260 -19% |
| Score Total (Points) | 731 | 2981 308% | 3670 402% | 1863 155% | 3955 441% | 753 3% |
| Copy ISO MB/s (MB/s) | 452.1 | 802 77% | 2016 346% | 1406 211% | 1134 151% | 171.1 -62% |
| Copy Program MB/s (MB/s) | 267.8 | 205.2 -23% | 542 102% | 309.9 16% | 350.4 31% | 93.2 -65% |
| Copy Game MB/s (MB/s) | 411 | 509 24% | 1278 211% | 802 95% | 736 79% | 140.6 -66% |
| CrystalDiskMark 5.2 / 6 | 116% | 225% | 108% | 178% | -3% | |
| Write 4K (MB/s) | 88.8 | 134.3 51% | 128.4 45% | 130.8 47% | 157.6 77% | 90.6 2% |
| Read 4K (MB/s) | 35.67 | 43.56 22% | 46.37 30% | 55.1 54% | 46.39 30% | 33.17 -7% |
| Write Seq (MB/s) | 461.9 | 1434 210% | 1863 303% | 962 108% | 1214 163% | 483 5% |
| Read Seq (MB/s) | 536 | 1448 170% | 2340 337% | 1634 205% | 1295 142% | 511 -5% |
| Write 4K Q32T1 (MB/s) | 212 | 239.1 13% | 451.1 113% | 343.5 62% | 370.7 75% | 170.7 -19% |
| Read 4K Q32T1 (MB/s) | 228.2 | 327.6 44% | 415.3 82% | 339.7 49% | 461.1 102% | 235 3% |
| Write Seq Q32T1 (MB/s) | 476.8 | 1456 205% | 2985 526% | 984 106% | 1888 296% | 496.5 4% |
| Read Seq Q32T1 (MB/s) | 554 | 1734 213% | 2565 363% | 1858 235% | 3540 539% | 534 -4% |
| Write 4K Q8T8 (MB/s) | 451.4 | 1814 | ||||
| Read 4K Q8T8 (MB/s) | 1004 | 1023 | ||||
| Media totale (Programma / Settaggio) | 143% /
150% | 252% /
259% | 119% /
122% | 220% /
232% | -8% /
-9% |
* ... Meglio usare valori piccoli

| 3DMark 11 Performance | 3320 punti | |
| 3DMark Ice Storm Standard Score | 76281 punti | |
| 3DMark Cloud Gate Standard Score | 10994 punti | |
| 3DMark Fire Strike Score | 1779 punti | |
| 3DMark Time Spy Score | 697 punti | |
Aiuto | ||
| basso | medio | alto | ultra | |
|---|---|---|---|---|
| BioShock Infinite (2013) | 91.2 | 15.4 |
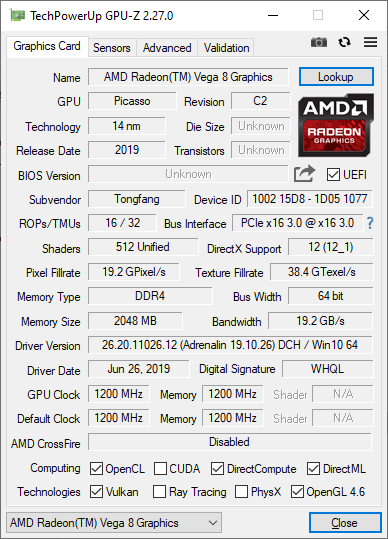
| Walmart Motile M142 Vega 8, R5 3500U, BIWIN SSD 256 GB | Acer Swift 3 SF314-41-R8HZ Vega 8, R5 3500U, WDC PC SN520 SDAPNUW-512G | Lenovo Yoga C940-14IIL Iris Plus Graphics G7 (Ice Lake 64 EU), i7-1065G7, Samsung SSD PM981 MZVLB512HAJQ | Asus VivoBook 14 X403FA UHD Graphics 620, i5-8265U, Intel SSD 660p SSDPEKNW512G8 | Lenovo IdeaPad S540-14IWL GeForce MX250, i5-8265U, Samsung SSD PM981 MZVLB512HAJQ | HP 14-dk0008ng Vega 10, R7 3700U, Samsung PM871b MZNLN128HAHQ | |
|---|---|---|---|---|---|---|
| Noise | -5% | 1% | 1% | -0% | -2% | |
| off /ambiente * (dB) | 29.1 | 30.4 -4% | 29.3 -1% | 28.8 1% | 29.3 -1% | 30.6 -5% |
| Idle Minimum * (dB) | 29.1 | 30.4 -4% | 29.3 -1% | 28.8 1% | 29.3 -1% | 31.4 -8% |
| Idle Average * (dB) | 29.1 | 30.9 -6% | 29.3 -1% | 28.8 1% | 29.3 -1% | 31.4 -8% |
| Idle Maximum * (dB) | 29.1 | 30.9 -6% | 29.3 -1% | 29.2 -0% | 29.3 -1% | 31.4 -8% |
| Load Average * (dB) | 31.1 | 36.3 -17% | 33.3 -7% | 35.2 -13% | 34.4 -11% | 32.5 -5% |
| Load Maximum * (dB) | 40.5 | 36.6 10% | 33.3 18% | 35.2 13% | 34.9 14% | 32.5 20% |
| Witcher 3 ultra * (dB) | 34.4 |
* ... Meglio usare valori piccoli
Rumorosità
| Idle |
| 29.1 / 29.1 / 29.1 dB(A) |
| Sotto carico |
| 31.1 / 40.5 dB(A) |
 | ||
30 dB silenzioso 40 dB(A) udibile 50 dB(A) rumoroso |
||
min: | ||
(-) La temperatura massima sul lato superiore è di 58.4 °C / 137 F, rispetto alla media di 36.8 °C / 98 F, che varia da 21 a 71 °C per questa classe Multimedia.
(-) Il lato inferiore si riscalda fino ad un massimo di 53.8 °C / 129 F, rispetto alla media di 39.1 °C / 102 F
(+) In idle, la temperatura media del lato superiore è di 26.4 °C / 80 F, rispetto alla media deld ispositivo di 31.3 °C / 88 F.
(+) I poggiapolsi e il touchpad raggiungono la temperatura massima della pelle (33 °C / 91.4 F) e quindi non sono caldi.
(-) La temperatura media della zona del palmo della mano di dispositivi simili e'stata di 28.7 °C / 83.7 F (-4.3 °C / -7.7 F).
Walmart Motile M142 analisi audio
(±) | potenza degli altiparlanti media ma buona (80.7 dB)
Bassi 100 - 315 Hz
(-) | quasi nessun basso - in media 19.8% inferiori alla media
(±) | la linearità dei bassi è media (11.3% delta rispetto alla precedente frequenza)
Medi 400 - 2000 Hz
(±) | medi elevati - circa 6% superiore alla media
(±) | linearità dei medi adeguata (11.7% delta rispetto alla precedente frequenza)
Alti 2 - 16 kHz
(+) | Alti bilanciati - appena 2.6% dalla media
(±) | la linearità degli alti è media (9.4% delta rispetto alla precedente frequenza)
Nel complesso 100 - 16.000 Hz
(±) | la linearità complessiva del suono è media (27.9% di differenza rispetto alla media
Rispetto alla stessa classe
» 94% di tutti i dispositivi testati in questa classe è stato migliore, 1% simile, 5% peggiore
» Il migliore ha avuto un delta di 5%, medio di 17%, peggiore di 45%
Rispetto a tutti i dispositivi testati
» 85% di tutti i dispositivi testati in questa classe è stato migliore, 3% similare, 12% peggiore
» Il migliore ha avuto un delta di 4%, medio di 24%, peggiore di 134%
Apple MacBook 12 (Early 2016) 1.1 GHz analisi audio
(+) | gli altoparlanti sono relativamente potenti (83.6 dB)
Bassi 100 - 315 Hz
(±) | bassi ridotti - in media 11.3% inferiori alla media
(±) | la linearità dei bassi è media (14.2% delta rispetto alla precedente frequenza)
Medi 400 - 2000 Hz
(+) | medi bilanciati - solo only 2.4% rispetto alla media
(+) | medi lineari (5.5% delta rispetto alla precedente frequenza)
Alti 2 - 16 kHz
(+) | Alti bilanciati - appena 2% dalla media
(+) | alti lineari (4.5% delta rispetto alla precedente frequenza)
Nel complesso 100 - 16.000 Hz
(+) | suono nel complesso lineare (10.2% differenza dalla media)
Rispetto alla stessa classe
» 7% di tutti i dispositivi testati in questa classe è stato migliore, 2% simile, 91% peggiore
» Il migliore ha avuto un delta di 5%, medio di 18%, peggiore di 53%
Rispetto a tutti i dispositivi testati
» 5% di tutti i dispositivi testati in questa classe è stato migliore, 1% similare, 94% peggiore
» Il migliore ha avuto un delta di 4%, medio di 24%, peggiore di 134%
| Off / Standby | |
| Idle | |
| Sotto carico |
|
Leggenda:
min: | |
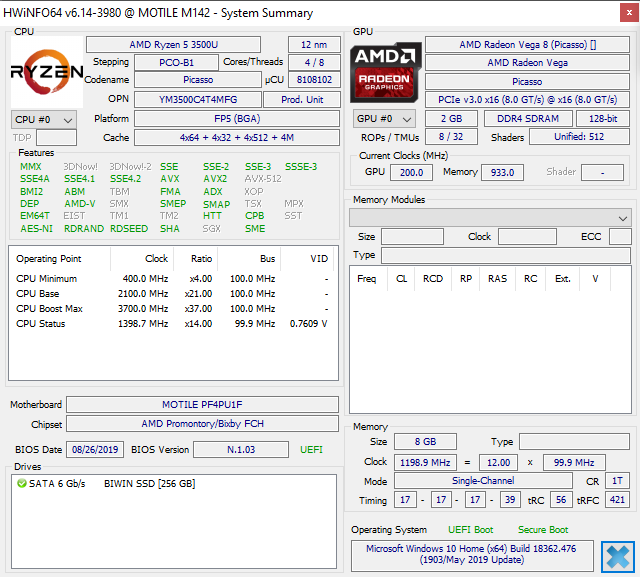
| Walmart Motile M142 R5 3500U, Vega 8, BIWIN SSD 256 GB, IPS, 1920x1080, 14" | Acer Swift 3 SF314-41-R8HZ R5 3500U, Vega 8, WDC PC SN520 SDAPNUW-512G, IPS, 1920x1080, 14" | Lenovo Yoga C940-14IIL i7-1065G7, Iris Plus Graphics G7 (Ice Lake 64 EU), Samsung SSD PM981 MZVLB512HAJQ, IPS LED, 1920x1080, 14" | Asus VivoBook 14 X403FA i5-8265U, UHD Graphics 620, Intel SSD 660p SSDPEKNW512G8, IPS, 1920x1080, 14" | Lenovo IdeaPad S540-14IWL i5-8265U, GeForce MX250, Samsung SSD PM981 MZVLB512HAJQ, IPS, 1920x1080, 14" | HP 14-dk0008ng R7 3700U, Vega 10, Samsung PM871b MZNLN128HAHQ, IPS, 1920x1080, 14" | |
|---|---|---|---|---|---|---|
| Power Consumption | 17% | 19% | 42% | 17% | 26% | |
| Idle Minimum * (Watt) | 5.3 | 5.7 -8% | 3.2 40% | 2.7 49% | 2.74 48% | 4.8 9% |
| Idle Average * (Watt) | 8.6 | 7.6 12% | 7 19% | 4.6 47% | 5.64 34% | 7.1 17% |
| Idle Maximum * (Watt) | 13.1 | 9 31% | 8.9 32% | 5.2 60% | 8.4 36% | 7.3 44% |
| Load Average * (Watt) | 50.6 | 40.1 21% | 47.6 6% | 35.9 29% | 61.3 -21% | 34 33% |
| Load Maximum * (Watt) | 61.6 | 42.4 31% | 63.1 -2% | 46 25% | 69.4 -13% | 45 27% |
| Witcher 3 ultra * (Watt) | 49.2 |
* ... Meglio usare valori piccoli
| Walmart Motile M142 R5 3500U, Vega 8, 47 Wh | Acer Swift 3 SF314-41-R8HZ R5 3500U, Vega 8, 48 Wh | Lenovo Yoga C940-14IIL i7-1065G7, Iris Plus Graphics G7 (Ice Lake 64 EU), 60 Wh | Asus VivoBook 14 X403FA i5-8265U, UHD Graphics 620, 72 Wh | Lenovo IdeaPad S540-14IWL i5-8265U, GeForce MX250, 48 Wh | HP 14-dk0008ng R7 3700U, Vega 10, 41.04 Wh | |
|---|---|---|---|---|---|---|
| Autonomia della batteria | 8% | 38% | 65% | 9% | -6% | |
| WiFi v1.3 (h) | 7.7 | 8.3 8% | 10.6 38% | 12.7 65% | 8.4 9% | 7.2 -6% |
| Load (h) | 1.1 | 2.6 | 1.5 | 0.8 | ||
| Reader / Idle (h) | 35.7 | 21.4 | 11.8 |
Pro
Contro
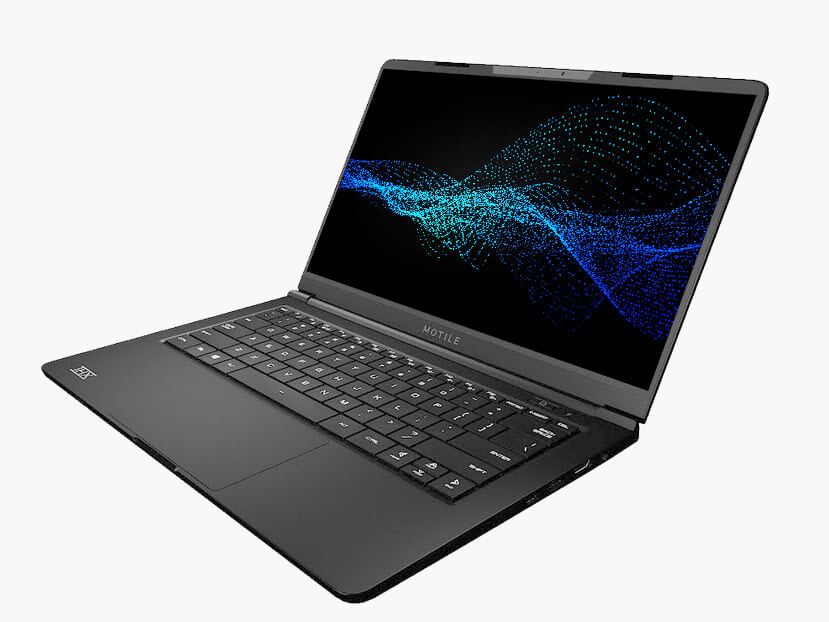
Il Walmart Motile M142 lanciato all'inizio di quest'anno per $ 700 USD era appena un po' più conveniente rispetto alla concorrenza Asus VivoBook, Acer Aspire 3, Dell Inspiron, o Lenovo IdeaPad serie IdeaPad. Era un prezzo giusto, dato che la Ryzen 5 3500U si comportava in modo simile alla maggior parte degli Ultrabooks Core i7, ma con un telaio di fascia media con un prezzo più accessibile.
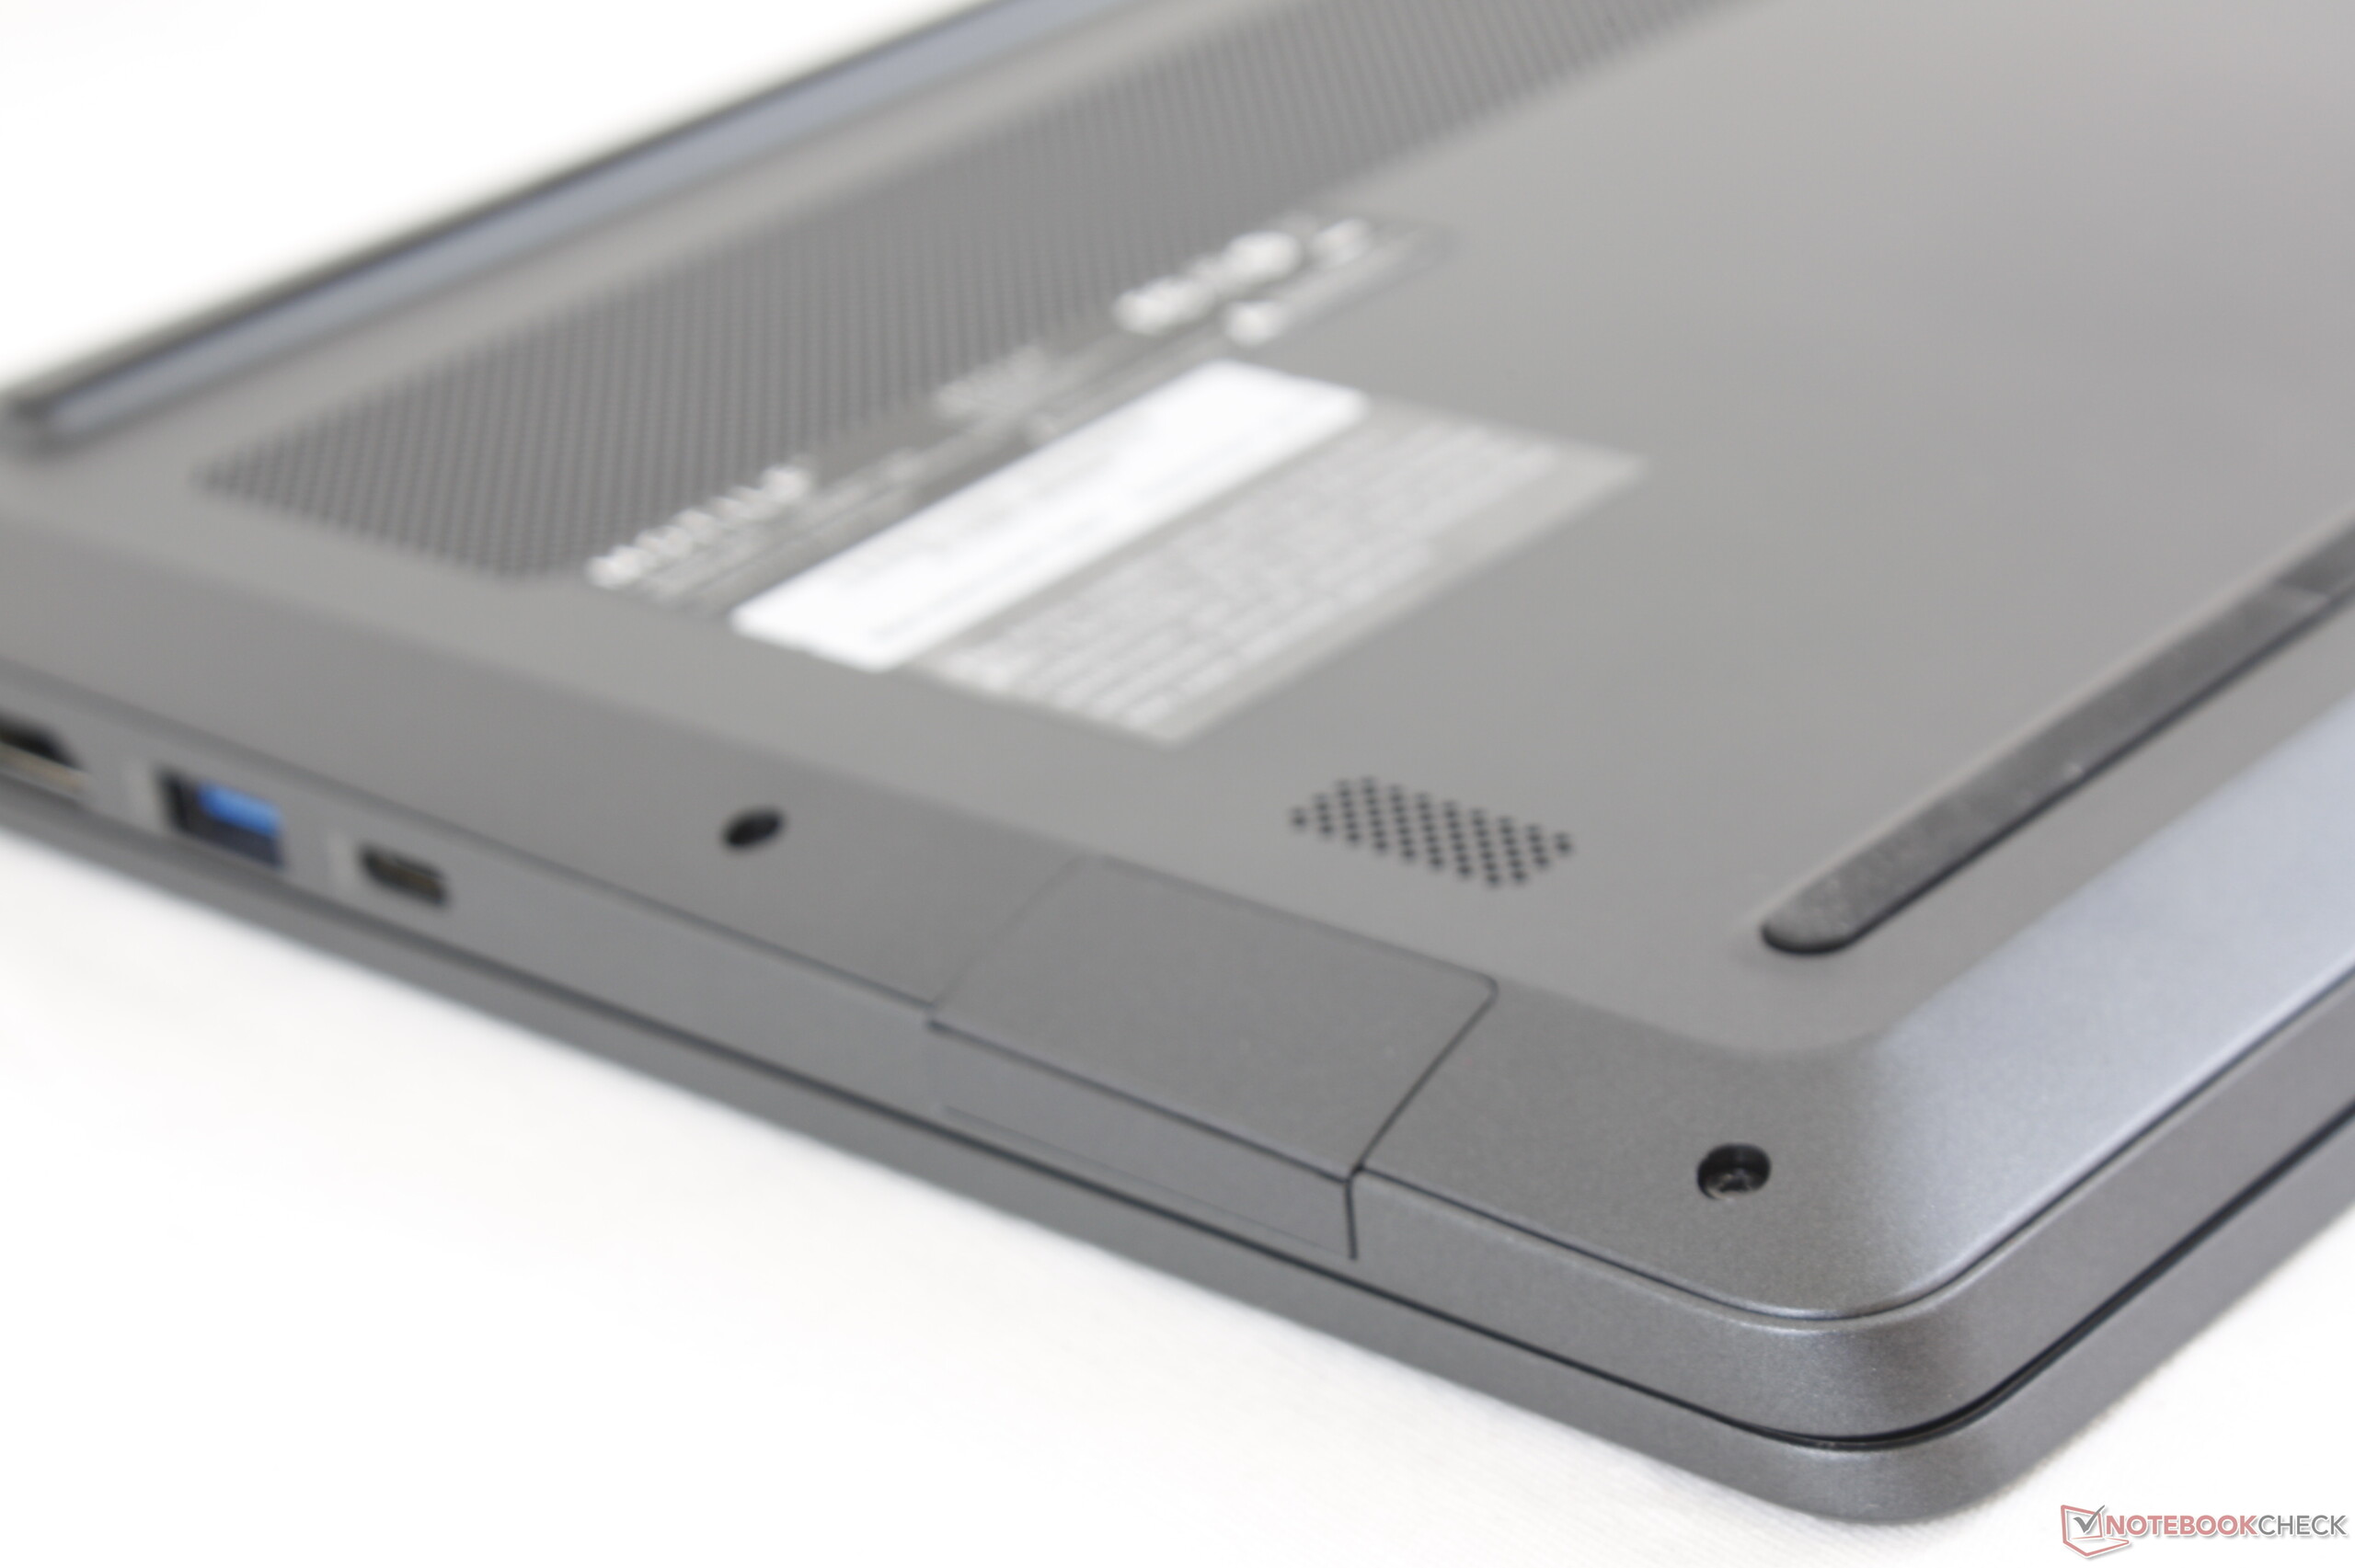
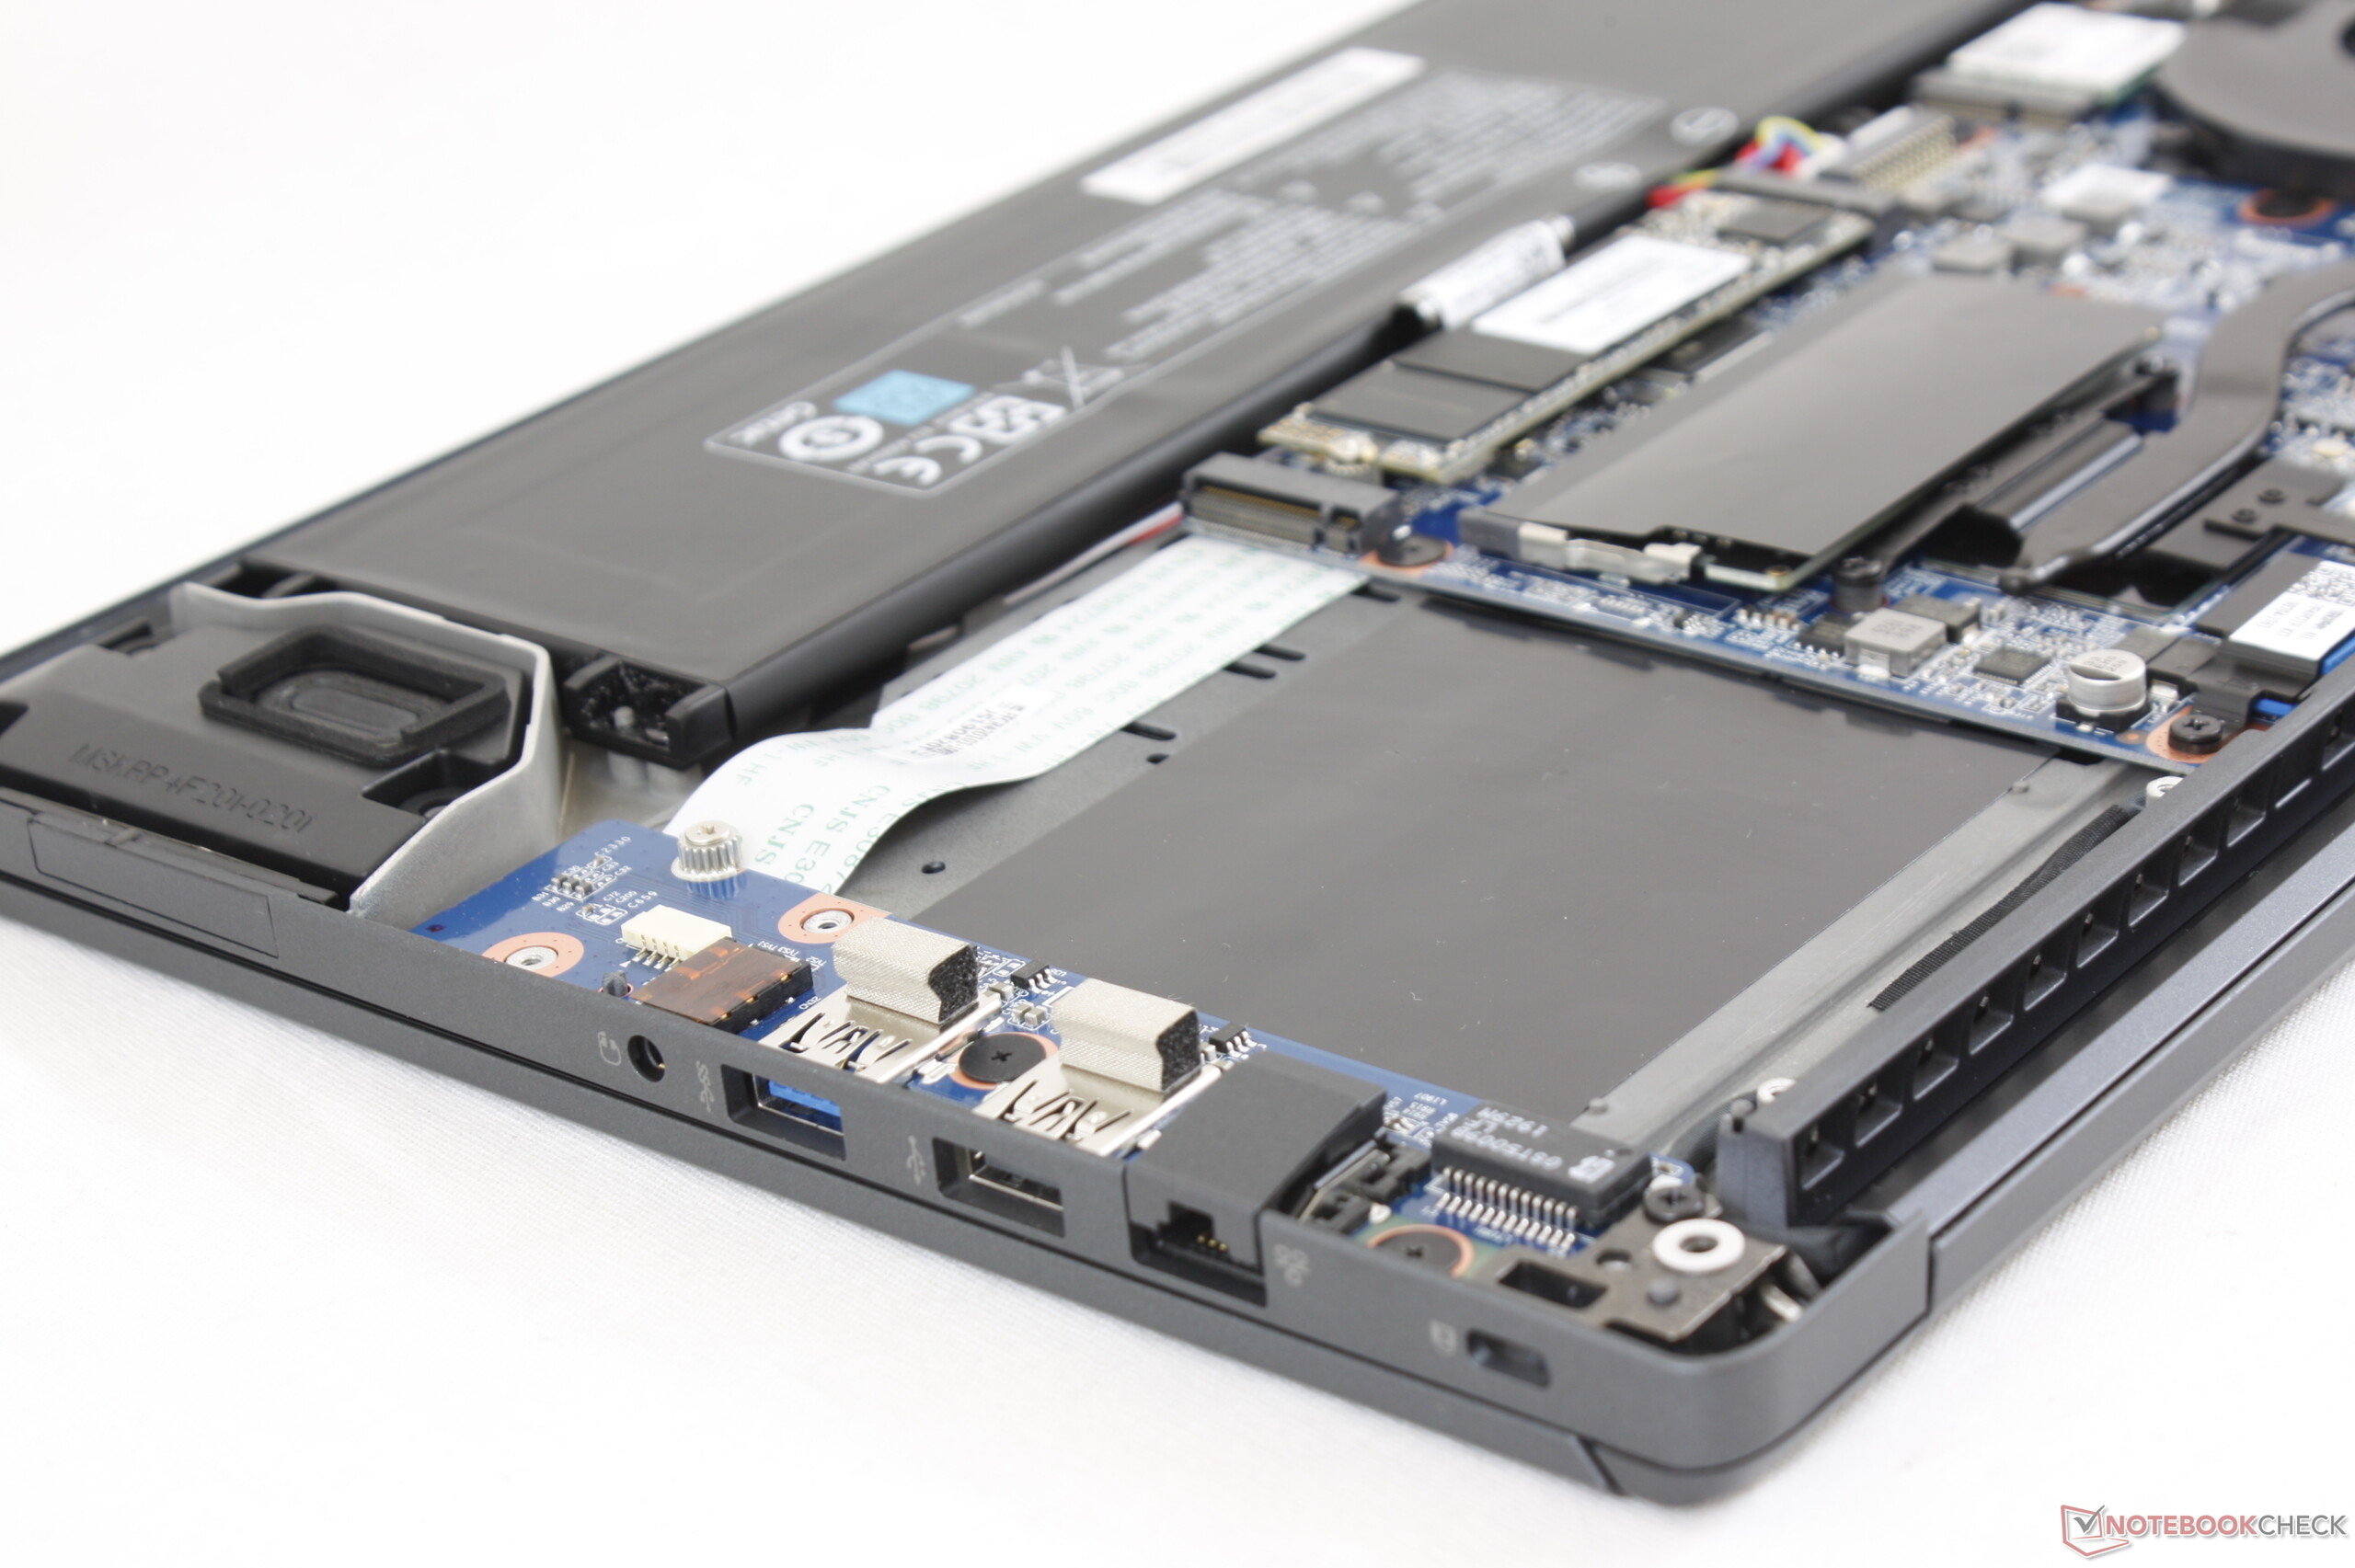
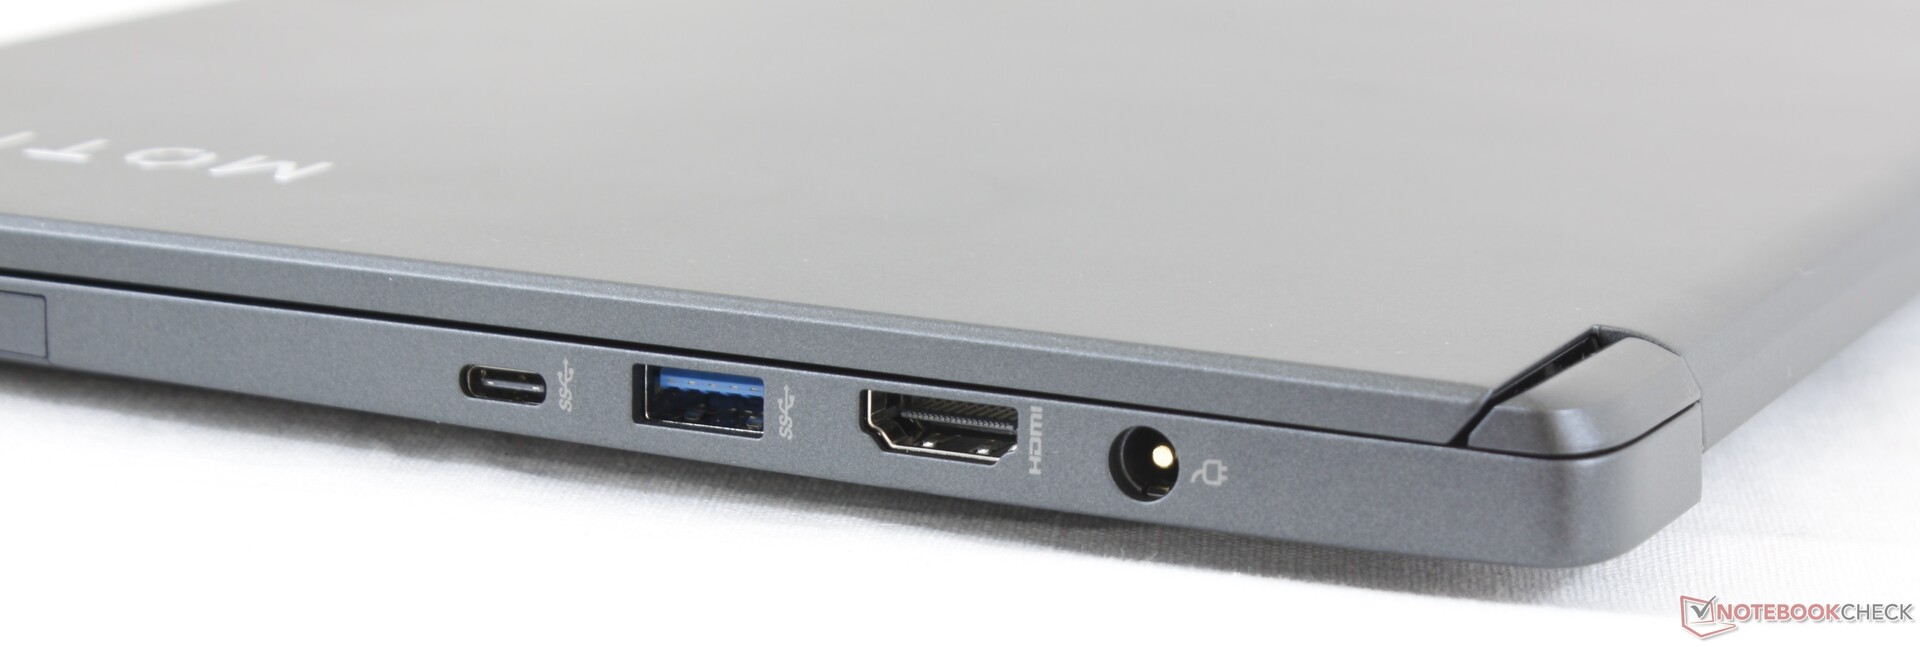
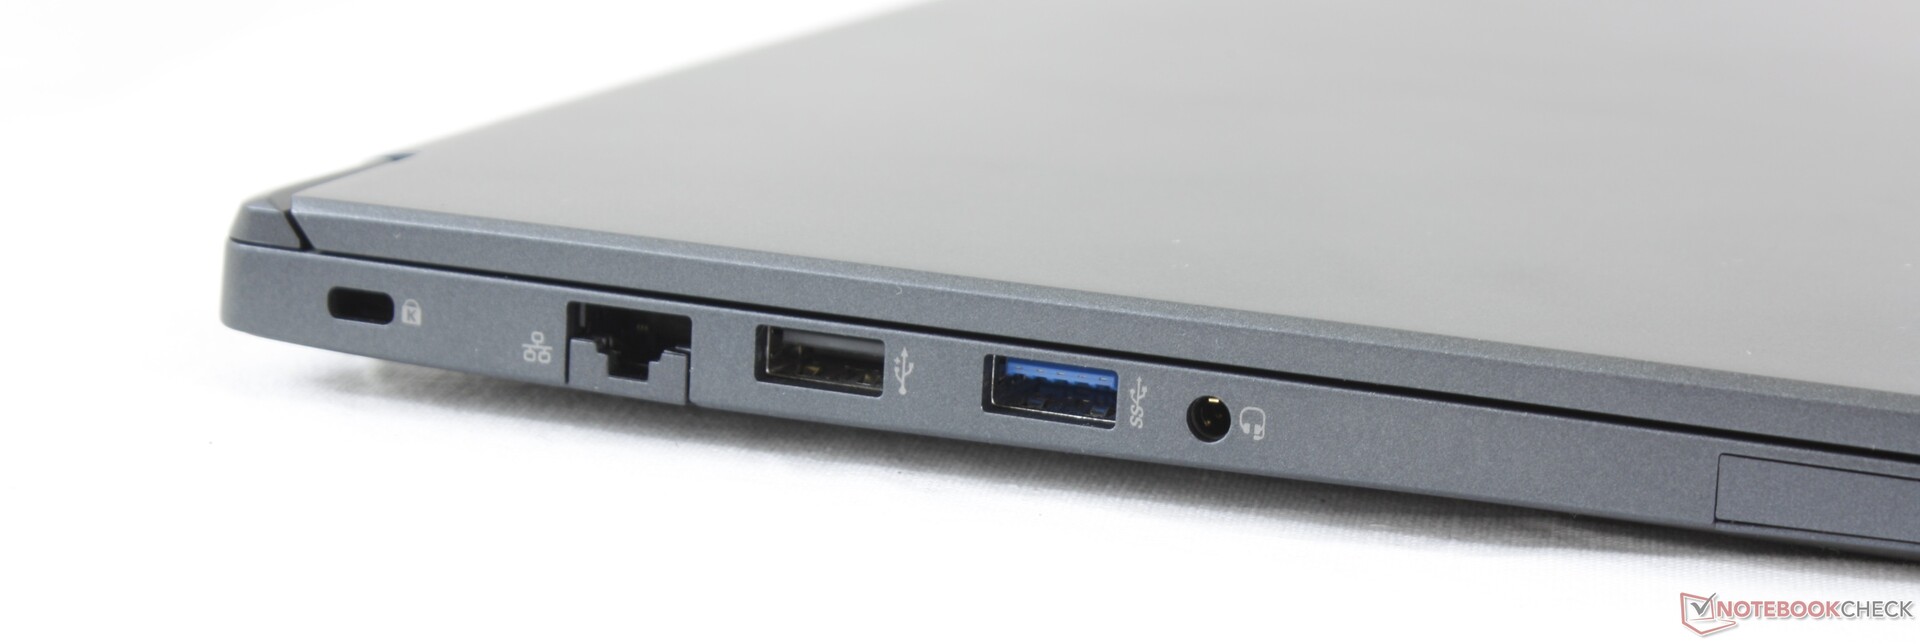
Ad un prezzo di vendita di $ 400 o $ 500, tuttavia, il Motile M142 diventa interessante. E' quasi veloce come un Ultrabook che vale il doppio del prezzo, pur essendo facile da manutenere e con una discreta selezione di porte. Il display è meglio calibrato rispetto a qualsiasi laptop sotto i 500 dollari che abbiamo testato, anche se lo spazio colore è ancora limitato.
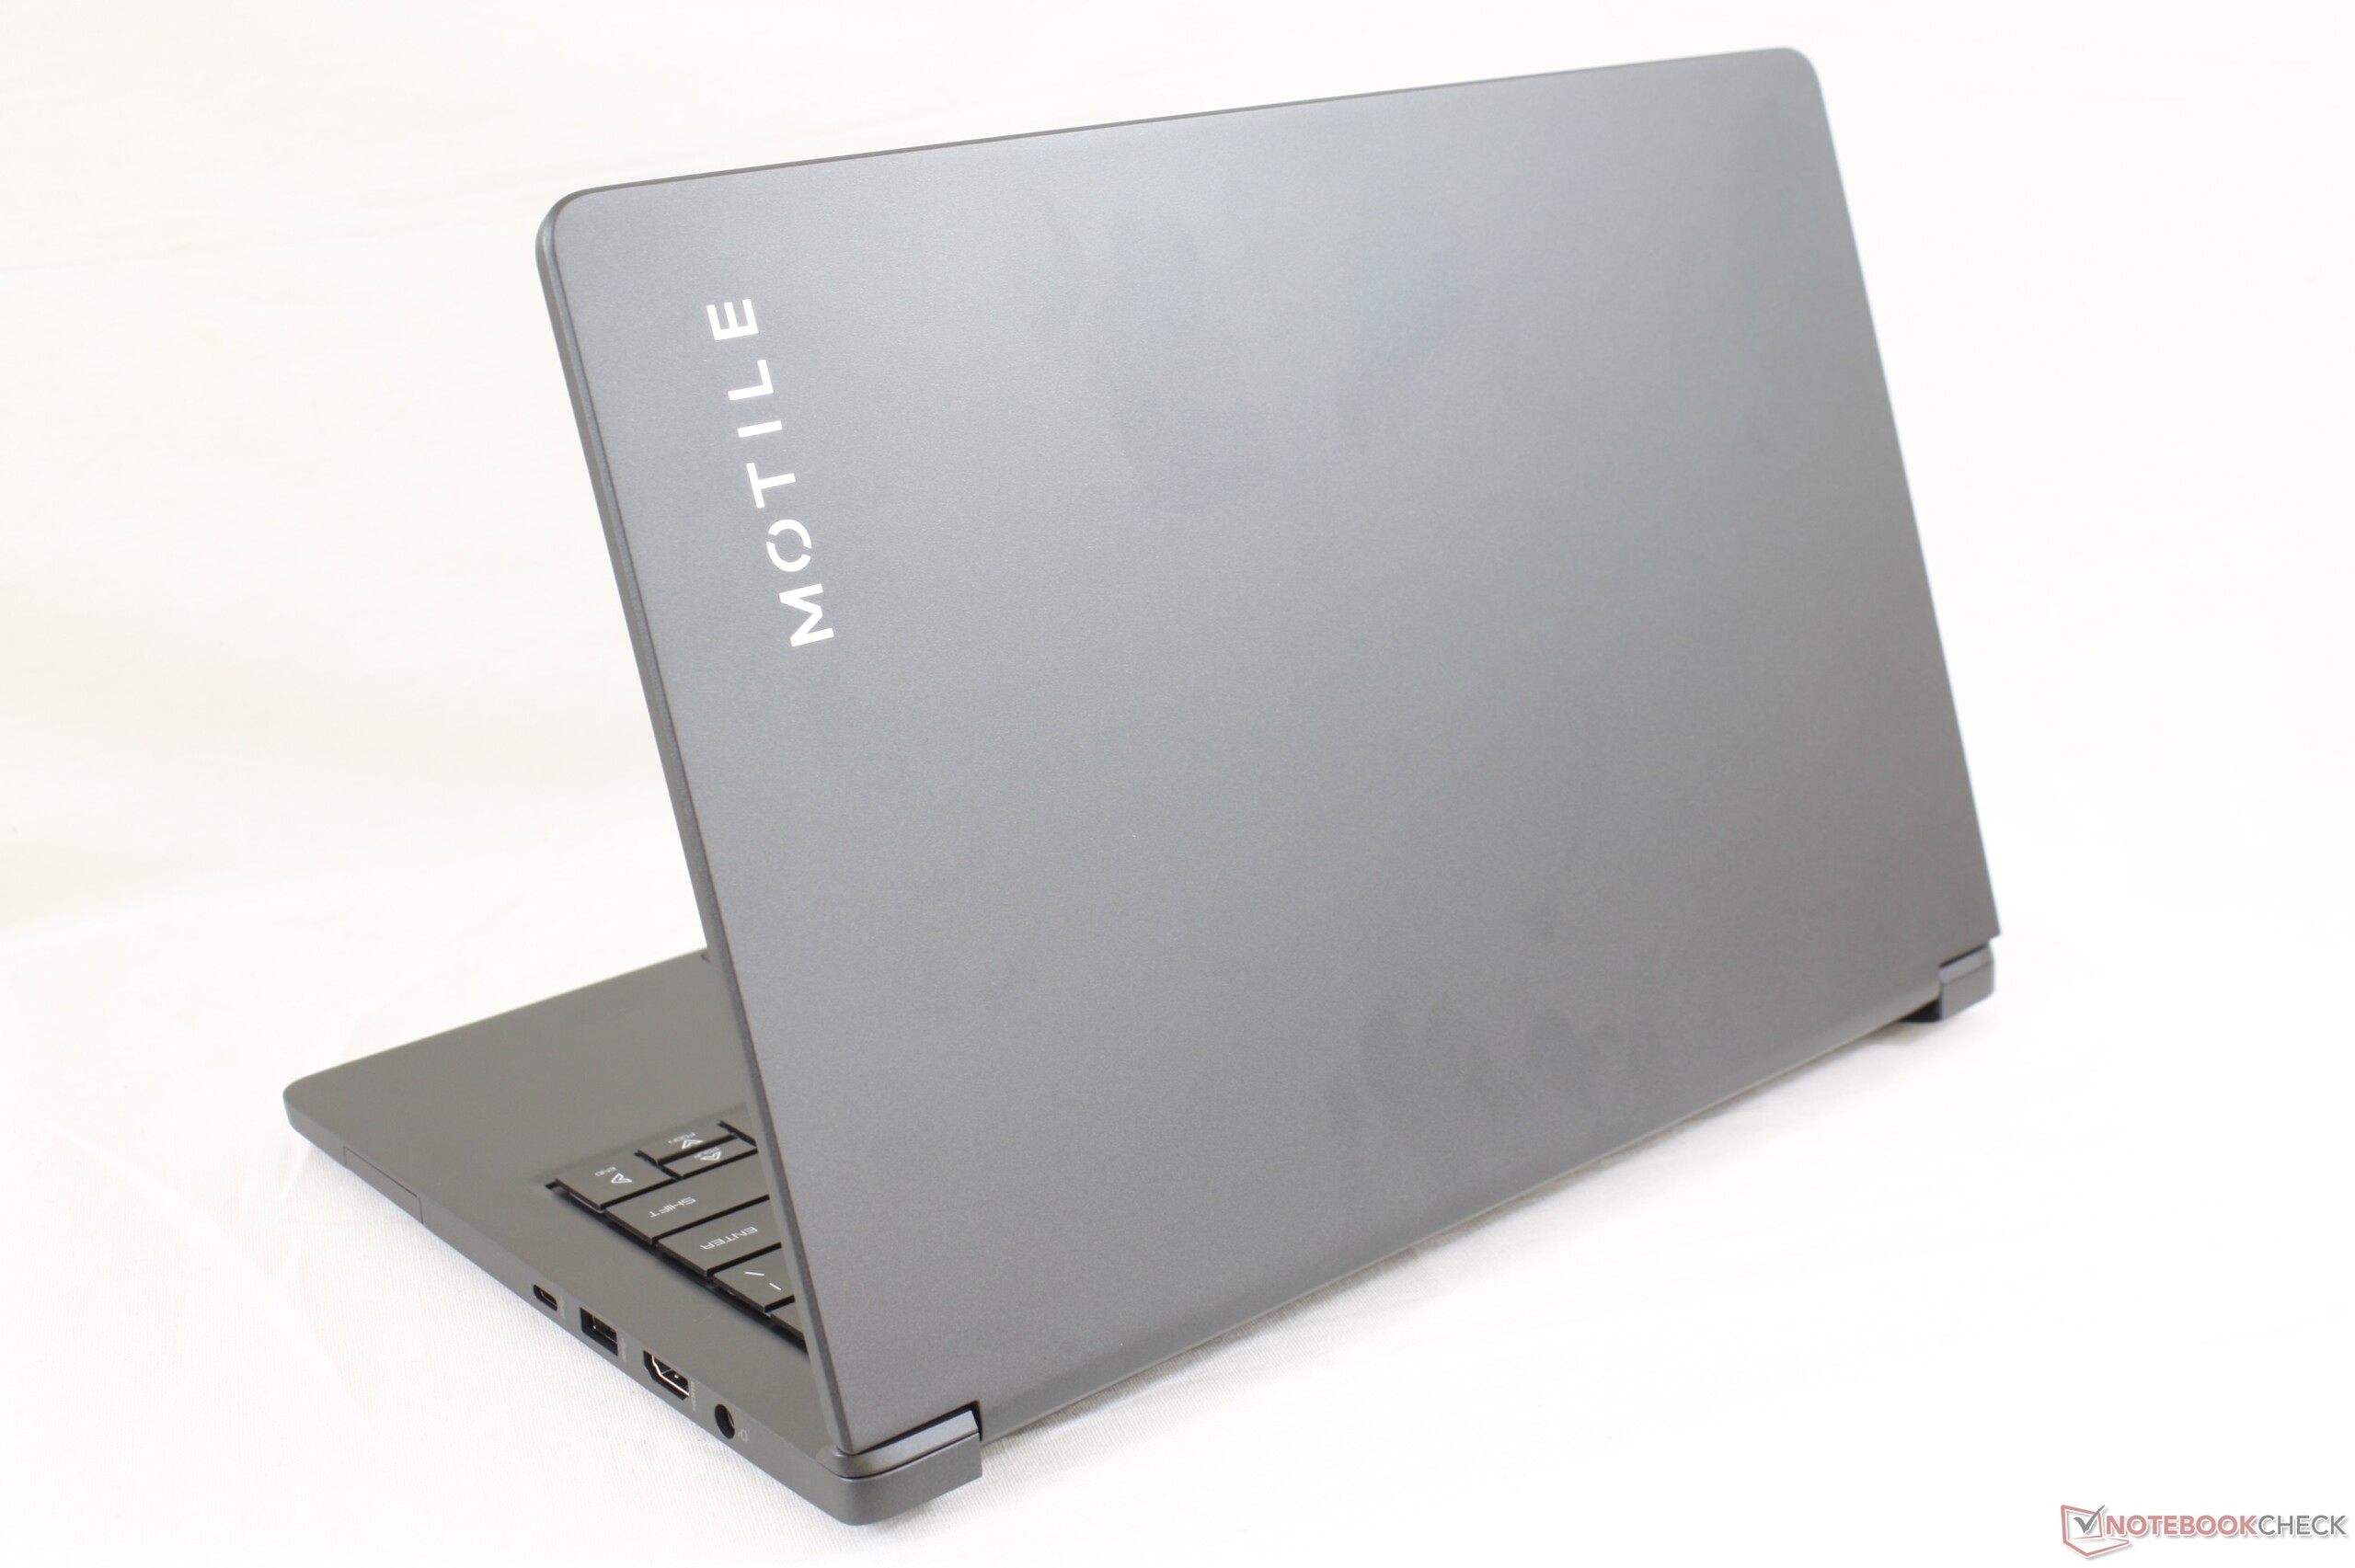
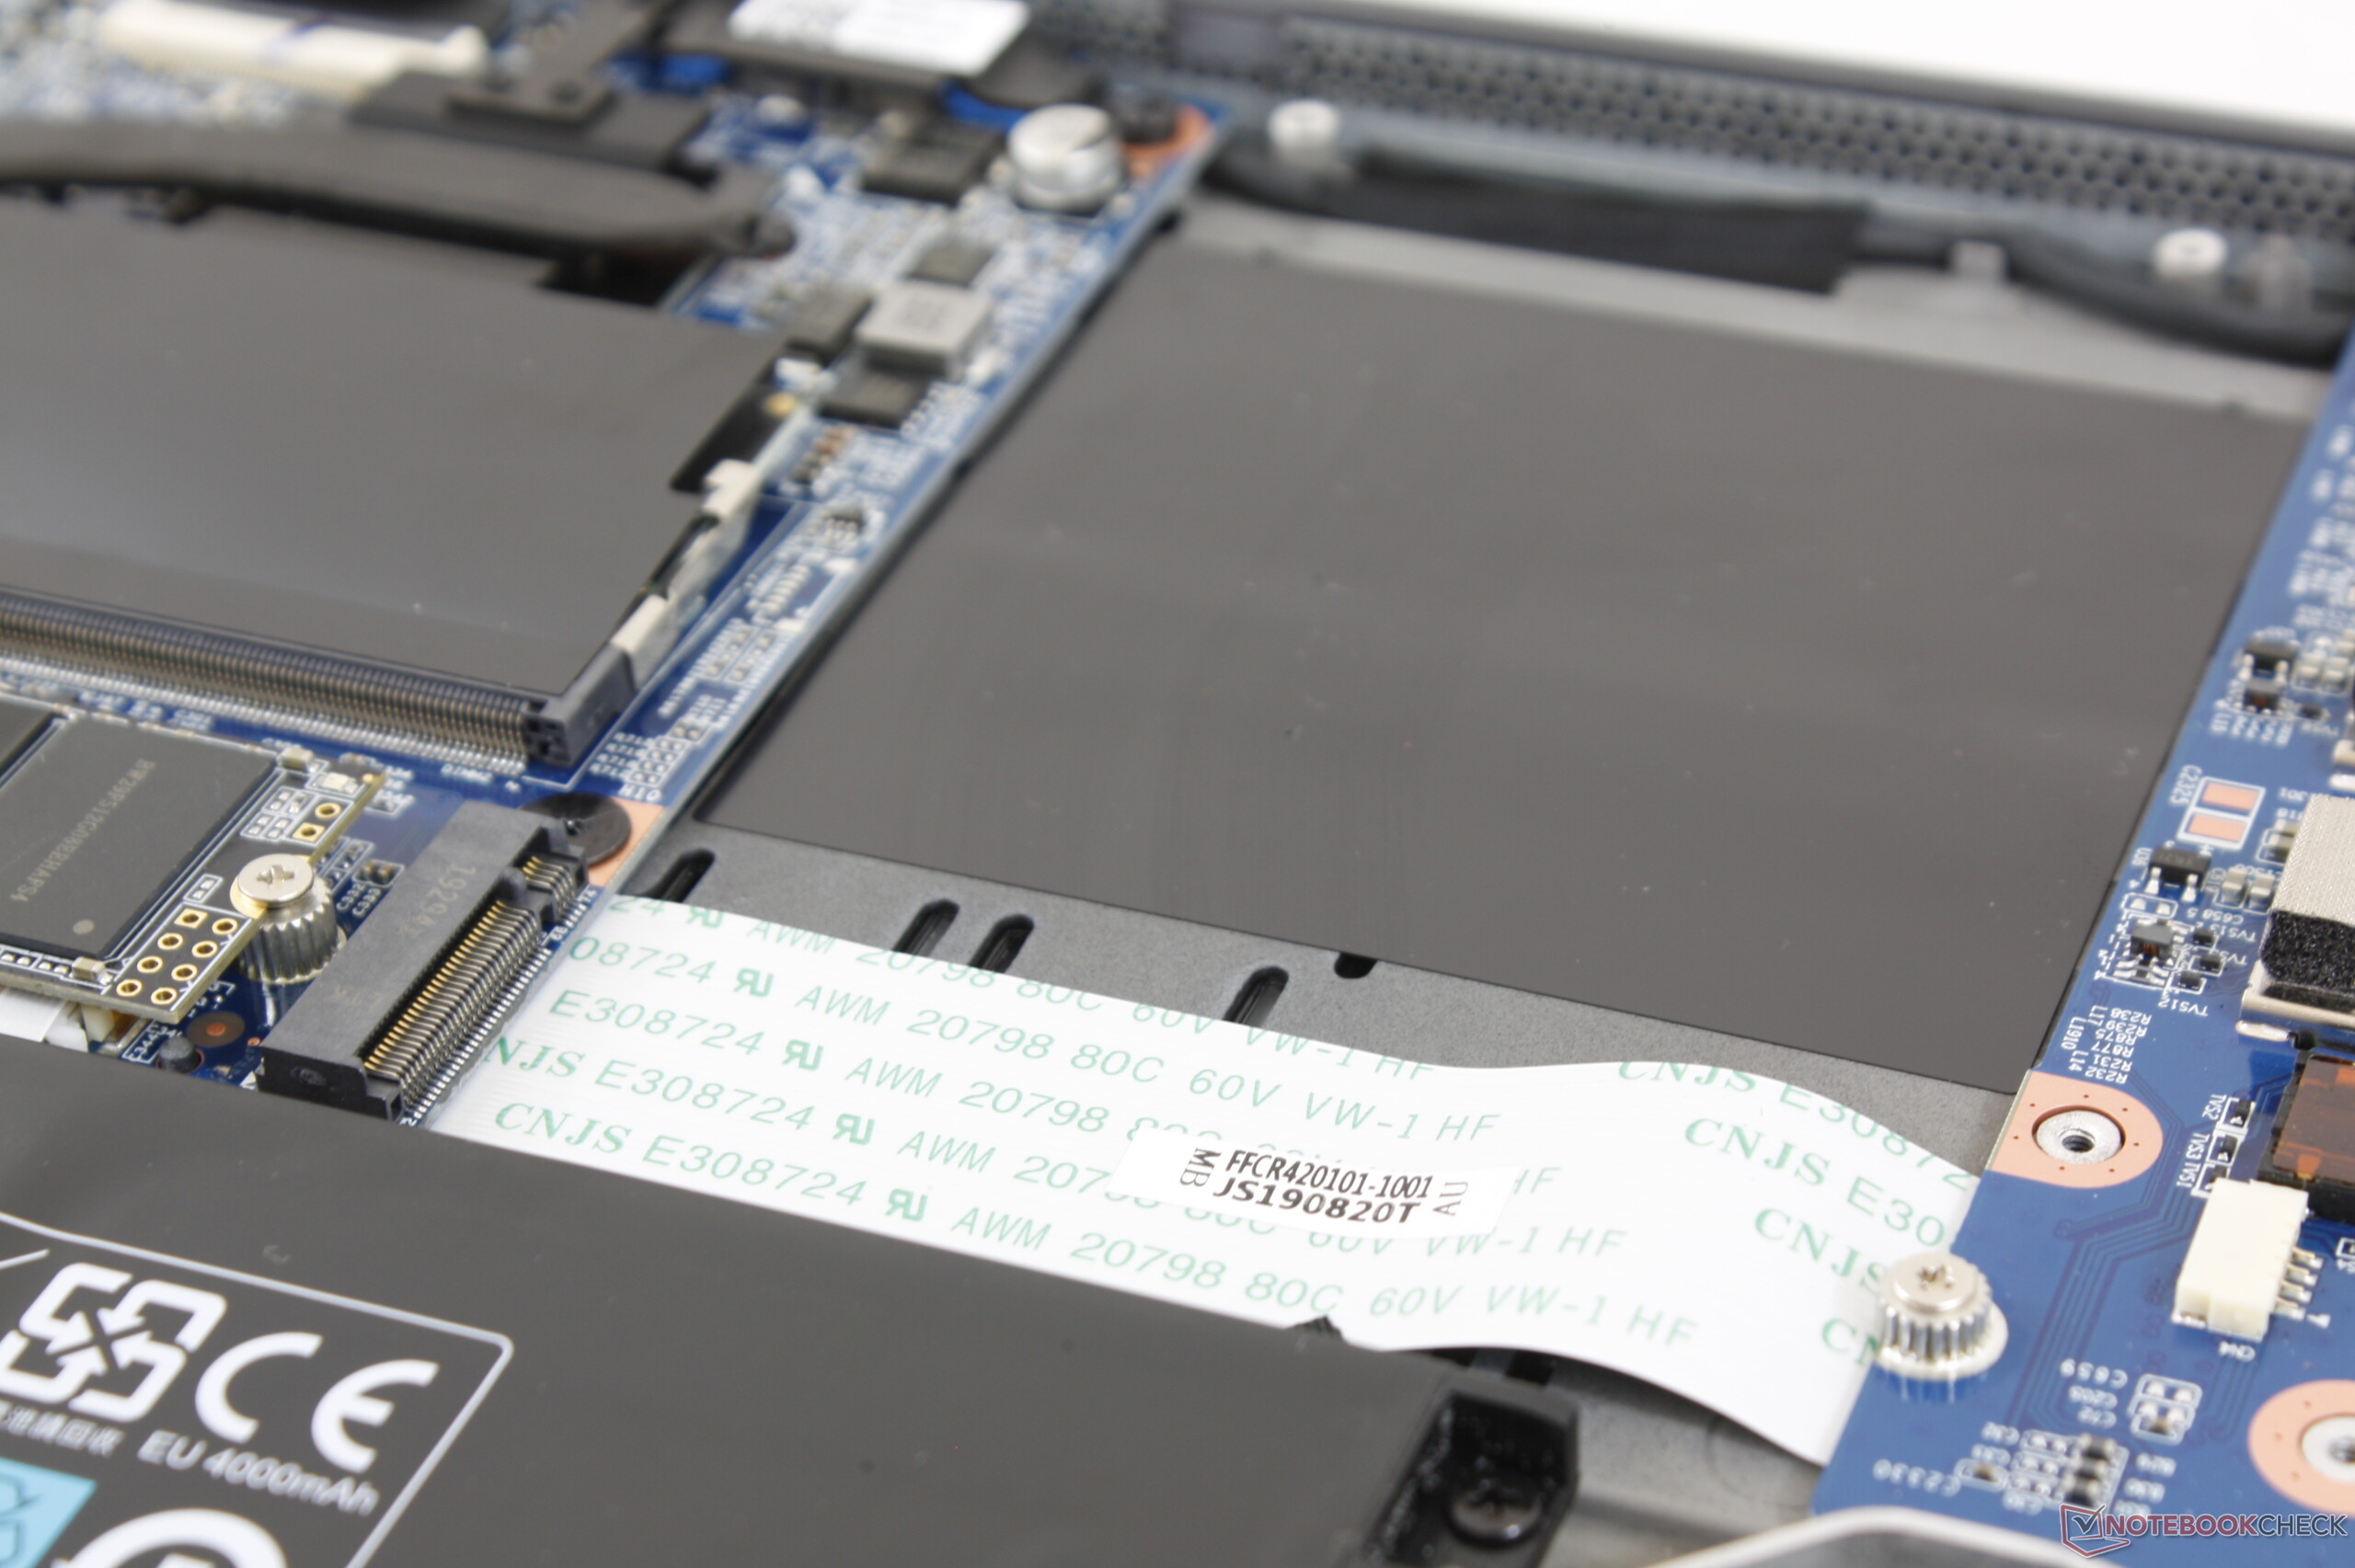
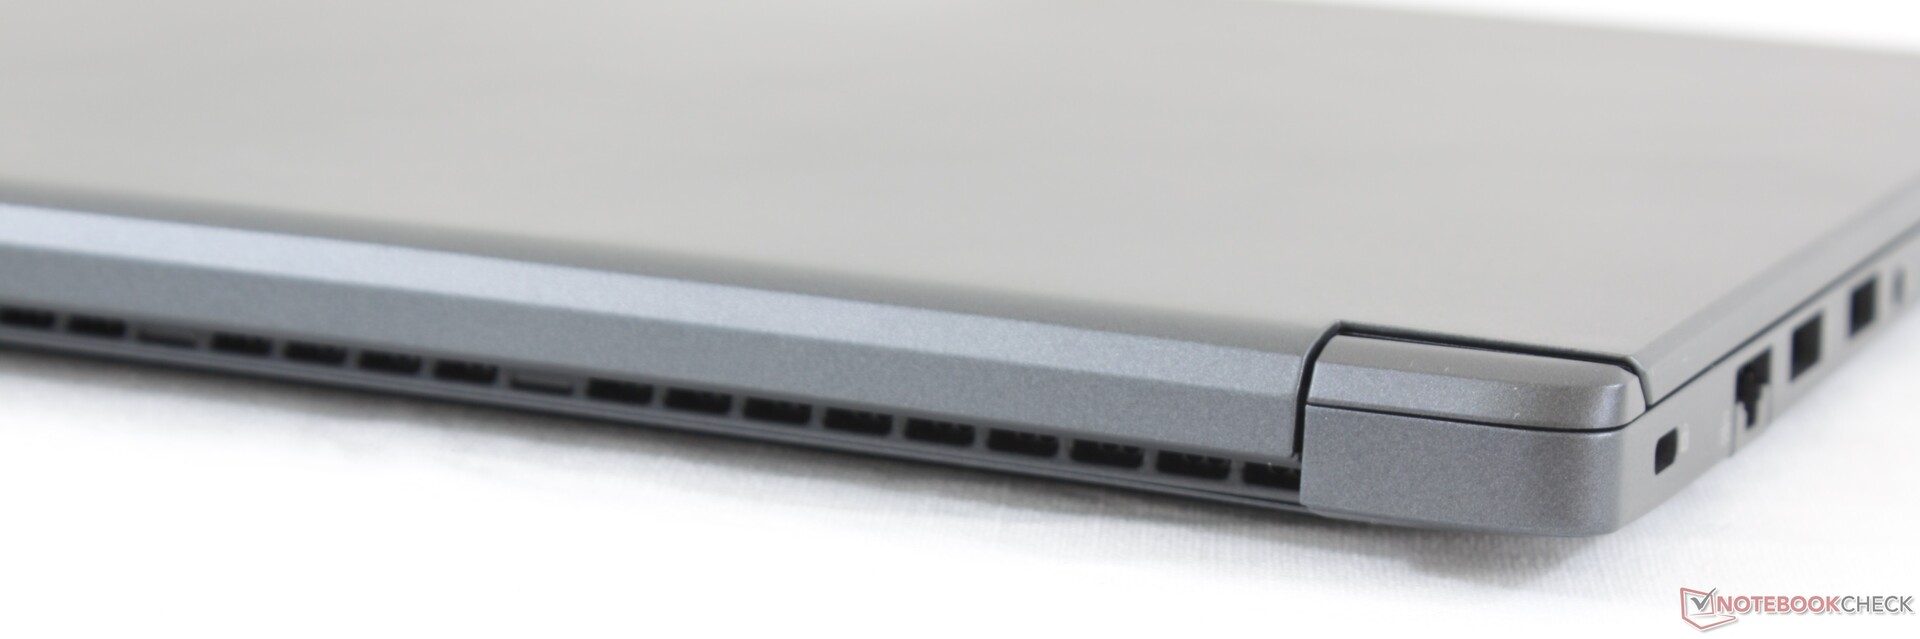
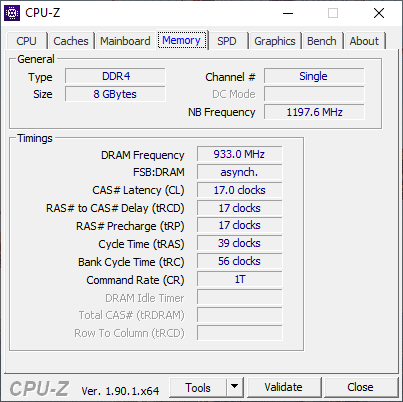
Ci sono varie pecche da tenere a mente. Il display scuro, il lento 1x1 wireless, la RAM single-channel, l'SSD SATA III, le cerniere deboli e la mancanza di USB Type-C PD sono tutti elementi che rispecchiano il prezzo di questo laptop. Mentre alcuni di questi inconvenienti saranno per lo più impercettibili per l'utente medio, le cerniere deboli ci hanno preoccupato per la longevità del sistema. Per il resto è difficile trovare un sistema da 14 pollici che possa eguagliare il Motile M142 sia nelle prestazioni che nella portabilità per meno di 500 dollari.
Per attività come la navigazione web, lo streaming, l'elaborazione di testi e per prendere appunti tra una lezione e l'altra, il leggero Walmart Motile M142 fa miracoli se si considera il suo prezzo contenuto. Si tratta di un eccellente computer portatile da considerare prima di decidere di investire in un'alternativa più duratura.
Walmart Motile M142
- 11/21/2019 v7 (old)
Allen Ngo
Price comparison
