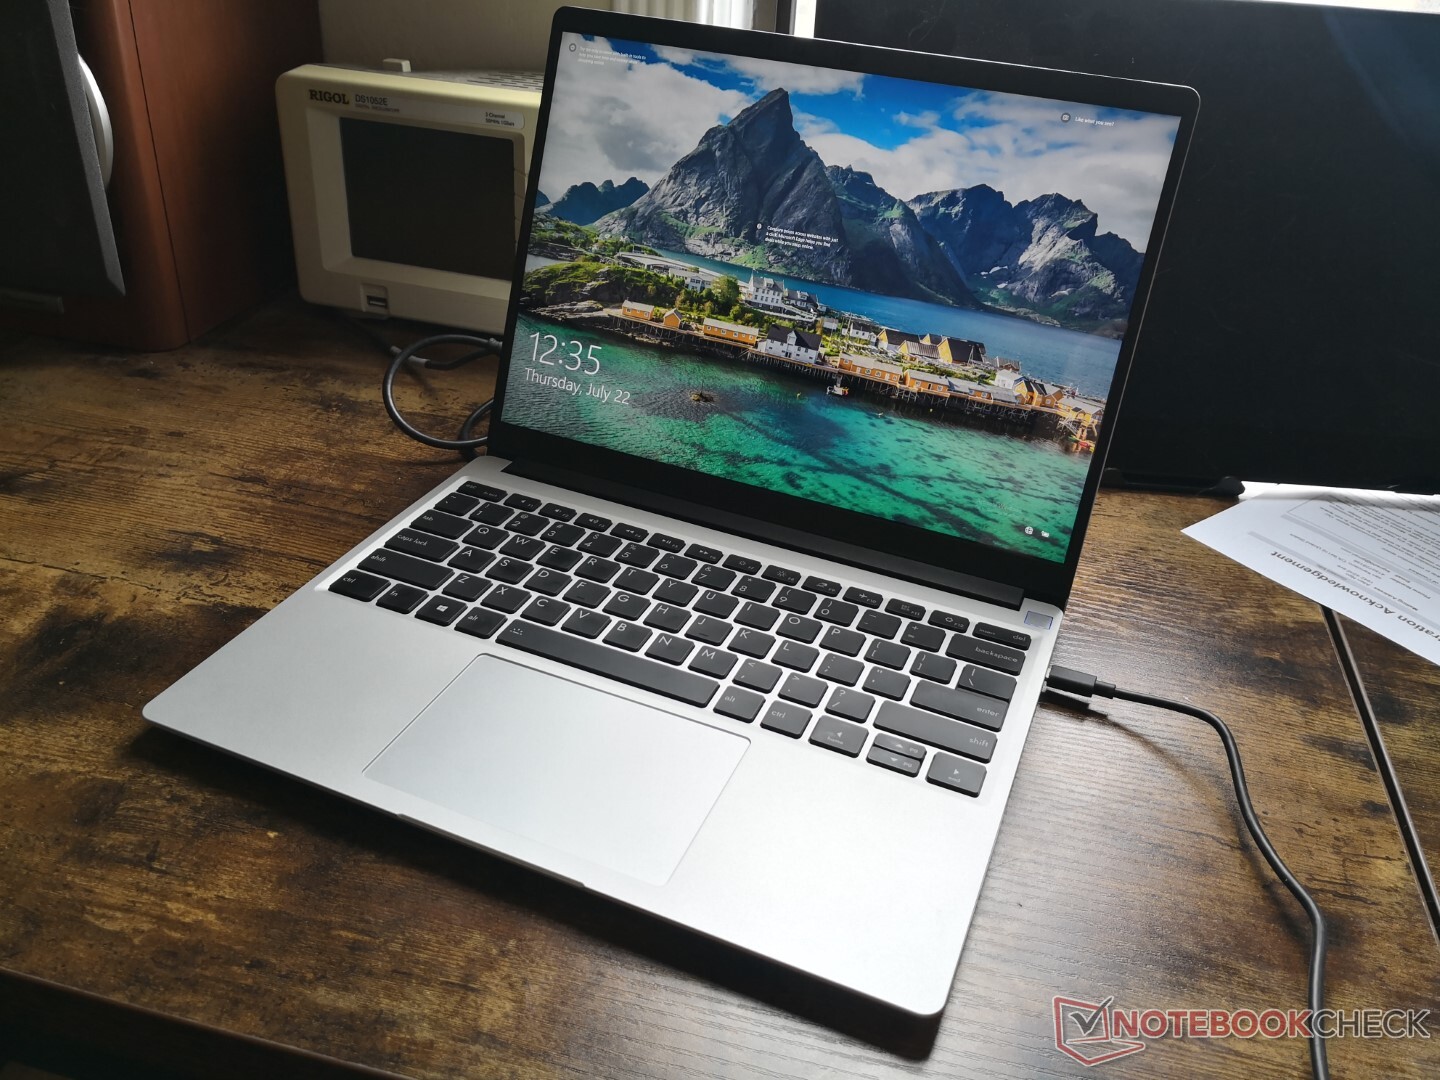
Recensione del Laptop Framework 13.5: Se Microsoft facesse un Surface Laptop riparabile, questo lo sarebbe
Confronto con i potenziali concorrenti
Punteggio | Data | Modello | Peso | Altezza | Dimensione | Risoluzione | Prezzo |
|---|---|---|---|---|---|---|---|
| 85.4 % v7 (old) | 07/2021 | Framework Laptop 13.5 i7-1165G7, Iris Xe G7 96EUs | 1.3 kg | 15.85 mm | 13.50" | 2256x1504 | |
| 89.5 % v7 (old) | 05/2021 | HP Spectre x360 14-ea0378ng i7-1165G7, Iris Xe G7 96EUs | 1.3 kg | 16.9 mm | 13.50" | 3000x2000 | |
| 84.7 % v7 (old) | 05/2021 | Microsoft Surface Laptop 4 13 i7 i7-1185G7, Iris Xe G7 96EUs | 1.3 kg | 14.5 mm | 13.50" | 2256x1504 | |
| 87.3 % v7 (old) | 04/2021 | Lenovo ThinkPad X1 Titanium Yoga G1 20QA001RGE i7-1160G7, Iris Xe G7 96EUs | 1.2 kg | 11.5 mm | 13.50" | 2256x1504 | |
| 85.7 % v7 (old) | 08/2021 | HP ProBook x360 435 G8 R7-5800U R7 5800U, Vega 8 | 1.5 kg | 18 mm | 13.30" | 1920x1080 | |
| 84.7 % v7 (old) | 07/2021 | Lenovo Yoga 6 13 82ND0009US R5 5500U, Vega 7 | 1.3 kg | 18.2 mm | 13.30" | 1920x1080 |
| SD Card Reader | |
| average JPG Copy Test (av. of 3 runs) | |
| HP Spectre x360 14-ea0378ng (Toshiba Exceria Pro M501 microSDXC 64GB) | |
| Framework Laptop 13.5 (AV Pro UHS-II V60) | |
| HP ProBook x360 435 G8 R7-5800U (AV Pro UHS-II V60) | |
| maximum AS SSD Seq Read Test (1GB) | |
| HP Spectre x360 14-ea0378ng (Toshiba Exceria Pro M501 microSDXC 64GB) | |
| Framework Laptop 13.5 (AV Pro UHS-II V60) | |
| HP ProBook x360 435 G8 R7-5800U (AV Pro UHS-II V60) | |


| |||||||||||||||||||||||||
Distribuzione della luminosità: 93 %
Al centro con la batteria: 449 cd/m²
Contrasto: 1151:1 (Nero: 0.39 cd/m²)
ΔE ColorChecker Calman: 2.34 | ∀{0.5-29.43 Ø4.72}
calibrated: 0.96
ΔE Greyscale Calman: 4.7 | ∀{0.09-98 Ø4.97}
70.3% AdobeRGB 1998 (Argyll 3D)
99.3% sRGB (Argyll 3D)
69% Display P3 (Argyll 3D)
Gamma: 2.29
CCT: 6760 K
| Framework Laptop 13.5 BOE CQ NE135FBM-N41, IPS, 13.5", 2256x1504 | HP Spectre x360 14-ea0378ng Samsung SDC4148, OLED, 13.5", 3000x2000 | Microsoft Surface Laptop 4 13 i7 LQ135P1JX51, IPS, 13.5", 2256x1504 | Lenovo ThinkPad X1 Titanium Yoga G1 20QA001RGE LPM135M467, IPS, 13.5", 2256x1504 | HP ProBook x360 435 G8 R7-5800U AUO4B2D, IPS, 13.3", 1920x1080 | Lenovo Yoga 6 13 82ND0009US AU Optronics B133HAN05.F, IPS, 13.3", 1920x1080 | |
|---|---|---|---|---|---|---|
| Display | 28% | -4% | -41% | 1% | ||
| Display P3 Coverage (%) | 69 | 99.9 45% | 64.7 -6% | 40.1 -42% | 69.7 1% | |
| sRGB Coverage (%) | 99.3 | 100 1% | 97.2 -2% | 59.9 -40% | 99.2 0% | |
| AdobeRGB 1998 Coverage (%) | 70.3 | 96.1 37% | 66.9 -5% | 41.4 -41% | 71.4 2% | |
| Response Times | 95% | -12% | 19% | 17% | 18% | |
| Response Time Grey 50% / Grey 80% * (ms) | 55.6 ? | 2 ? 96% | 62.8 ? -13% | 53.6 ? 4% | 42.8 ? 23% | 46.8 ? 16% |
| Response Time Black / White * (ms) | 36 ? | 2 ? 94% | 39.8 ? -11% | 24 ? 33% | 32 ? 11% | 28.8 ? 20% |
| PWM Frequency (Hz) | 250 ? | 21930 ? | ||||
| Screen | 346% | 10% | 27% | -62% | -12% | |
| Brightness middle (cd/m²) | 449 | 370 -18% | 413 -8% | 466 4% | 304 -32% | 291.5 -35% |
| Brightness (cd/m²) | 435 | 374 -14% | 400 -8% | 454 4% | 292 -33% | 294 -32% |
| Brightness Distribution (%) | 93 | 90 -3% | 94 1% | 94 1% | 89 -4% | 93 0% |
| Black Level * (cd/m²) | 0.39 | 0.01 97% | 0.29 26% | 0.23 41% | 0.23 41% | 0.19 51% |
| Contrast (:1) | 1151 | 37000 3115% | 1424 24% | 2026 76% | 1322 15% | 1534 33% |
| Colorchecker dE 2000 * | 2.34 | 2.57 -10% | 2.8 -20% | 2.1 10% | 5 -114% | 3.83 -64% |
| Colorchecker dE 2000 max. * | 7.07 | 4.52 36% | 7.2 -2% | 4.5 36% | 17.7 -150% | 8.43 -19% |
| Colorchecker dE 2000 calibrated * | 0.96 | 2.31 -141% | 0.8 17% | 4.2 -338% | 1.07 -11% | |
| Greyscale dE 2000 * | 4.7 | 2.2 53% | 1.9 60% | 2.7 43% | 2.1 55% | 6.2 -32% |
| Gamma | 2.29 96% | 2.36 93% | 2.12 104% | 2.08 106% | 2.03 108% | 2.2 100% |
| CCT | 6760 96% | 6154 106% | 6510 100% | 6210 105% | 6443 101% | 6469 100% |
| Color Space (Percent of AdobeRGB 1998) (%) | 85.8 | 61.6 | 61.1 | |||
| Color Space (Percent of sRGB) (%) | 100 | 97.2 | 94.9 | |||
| Media totale (Programma / Settaggio) | 156% /
242% | -2% /
4% | 23% /
25% | -29% /
-46% | 2% /
-5% |
* ... Meglio usare valori piccoli
Tempi di risposta del Display
| ↔ Tempi di risposta dal Nero al Bianco | ||
|---|---|---|
| 36 ms ... aumenta ↗ e diminuisce ↘ combinato | ↗ 21.2 ms Incremento | 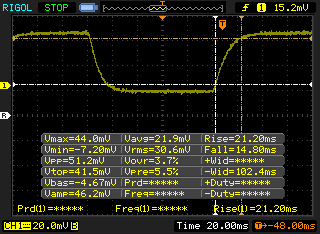 |
| ↘ 14.8 ms Calo | ||
| Lo schermo mostra tempi di risposta lenti nei nostri tests e sarà insoddisfacente per i gamers. In confronto, tutti i dispositivi di test variano da 0.1 (minimo) a 240 (massimo) ms. » 94 % di tutti i dispositivi è migliore. Questo significa che i tempi di risposta rilevati sono peggiori rispetto alla media di tutti i dispositivi testati (19.8 ms). | ||
| ↔ Tempo di risposta dal 50% Grigio all'80% Grigio | ||
| 55.6 ms ... aumenta ↗ e diminuisce ↘ combinato | ↗ 27.2 ms Incremento | 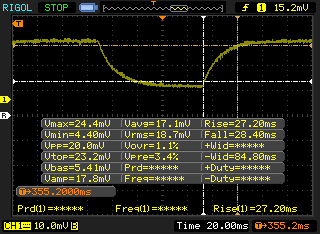 |
| ↘ 28.4 ms Calo | ||
| Lo schermo mostra tempi di risposta lenti nei nostri tests e sarà insoddisfacente per i gamers. In confronto, tutti i dispositivi di test variano da 0.165 (minimo) a 636 (massimo) ms. » 92 % di tutti i dispositivi è migliore. Questo significa che i tempi di risposta rilevati sono peggiori rispetto alla media di tutti i dispositivi testati (31 ms). | ||
Sfarfallio dello schermo / PWM (Pulse-Width Modulation)
| flickering dello schermo / PWM non rilevato |  | ||
In confronto: 52 % di tutti i dispositivi testati non utilizza PWM per ridurre la luminosita' del display. Se è rilevato PWM, una media di 7781 (minimo: 5 - massimo: 343500) Hz è stata rilevata. | |||
Cinebench R15 Multi Loop
Cinebench R23: Multi Core | Single Core
Cinebench R15: CPU Multi 64Bit | CPU Single 64Bit
Blender: v2.79 BMW27 CPU
7-Zip 18.03: 7z b 4 -mmt1 | 7z b 4
Geekbench 5.5: Single-Core | Multi-Core
HWBOT x265 Benchmark v2.2: 4k Preset
LibreOffice : 20 Documents To PDF
R Benchmark 2.5: Overall mean
| Cinebench R23 / Multi Core | |
| Asus ZenBook 13 OLED UM325UA | |
| VAIO Z VJZ141C11L | |
| Lenovo Yoga 6 13 82ND0009US | |
| Framework Laptop 13.5 | |
| Microsoft Surface Laptop 4 13 i7 | |
| Media Intel Core i7-1165G7 (2525 - 6862, n=64) | |
| HP Spectre x360 13-aw2003dx | |
| Asus VivoBook S13 S333JA-DS51 | |
| Cinebench R23 / Single Core | |
| VAIO Z VJZ141C11L | |
| Microsoft Surface Laptop 4 13 i7 | |
| Framework Laptop 13.5 | |
| Media Intel Core i7-1165G7 (1110 - 1539, n=59) | |
| HP Spectre x360 13-aw2003dx | |
| Asus ZenBook 13 OLED UM325UA | |
| Lenovo Yoga 6 13 82ND0009US | |
| Asus VivoBook S13 S333JA-DS51 | |
| Geekbench 5.5 / Single-Core | |
| VAIO Z VJZ141C11L | |
| Microsoft Surface Laptop 4 13 i7 | |
| Media Intel Core i7-1165G7 (1302 - 1595, n=77) | |
| HP Spectre x360 13-aw2003dx | |
| Acer Spin 5 SP513-54N-79EY | |
| Asus ZenBook 13 OLED UM325UA | |
| Asus VivoBook S13 S333JA-DS51 | |
| HP Envy x360 13-ay0010nr | |
| Geekbench 5.5 / Multi-Core | |
| Asus ZenBook 13 OLED UM325UA | |
| VAIO Z VJZ141C11L | |
| Microsoft Surface Laptop 4 13 i7 | |
| HP Spectre x360 13-aw2003dx | |
| Media Intel Core i7-1165G7 (3078 - 5926, n=77) | |
| HP Envy x360 13-ay0010nr | |
| Asus VivoBook S13 S333JA-DS51 | |
| Acer Spin 5 SP513-54N-79EY | |
| HWBOT x265 Benchmark v2.2 / 4k Preset | |
| Asus ZenBook 13 OLED UM325UA | |
| VAIO Z VJZ141C11L | |
| Lenovo Yoga 6 13 82ND0009US | |
| Framework Laptop 13.5 | |
| HP Envy x360 13-ay0010nr | |
| Media Intel Core i7-1165G7 (1.39 - 8.47, n=80) | |
| HP Spectre x360 13-aw2003dx | |
| Microsoft Surface Laptop 4 13 i7 | |
| Asus VivoBook S13 S333JA-DS51 | |
| LibreOffice / 20 Documents To PDF | |
| Lenovo Yoga 6 13 82ND0009US | |
| HP Envy x360 13-ay0010nr | |
| Asus VivoBook S13 S333JA-DS51 | |
| Asus ZenBook 13 OLED UM325UA | |
| HP Spectre x360 13-aw2003dx | |
| Acer Spin 5 SP513-54N-79EY | |
| Microsoft Surface Laptop 4 13 i7 | |
| Media Intel Core i7-1165G7 (21.5 - 88.1, n=78) | |
| VAIO Z VJZ141C11L | |
| Framework Laptop 13.5 | |
| R Benchmark 2.5 / Overall mean | |
| Asus VivoBook S13 S333JA-DS51 | |
| HP Spectre x360 13-aw2003dx | |
| Lenovo Yoga 6 13 82ND0009US | |
| HP Envy x360 13-ay0010nr | |
| Asus ZenBook 13 OLED UM325UA | |
| Media Intel Core i7-1165G7 (0.552 - 1.002, n=80) | |
| Microsoft Surface Laptop 4 13 i7 | |
| Framework Laptop 13.5 | |
| VAIO Z VJZ141C11L | |
* ... Meglio usare valori piccoli
| PCMark 10 / Score | |
| HP ProBook x360 435 G8 R7-5800U | |
| Lenovo Yoga 6 13 82ND0009US | |
| Media Intel Core i7-1165G7, Intel Iris Xe Graphics G7 96EUs (4531 - 5454, n=50) | |
| Microsoft Surface Laptop 4 13 i7 | |
| Framework Laptop 13.5 | |
| Lenovo ThinkPad X1 Titanium Yoga G1 20QA001RGE | |
| HP Spectre x360 14-ea0378ng | |
| PCMark 10 / Essentials | |
| Lenovo ThinkPad X1 Titanium Yoga G1 20QA001RGE | |
| Framework Laptop 13.5 | |
| Media Intel Core i7-1165G7, Intel Iris Xe Graphics G7 96EUs (8997 - 11505, n=50) | |
| Lenovo Yoga 6 13 82ND0009US | |
| HP ProBook x360 435 G8 R7-5800U | |
| HP Spectre x360 14-ea0378ng | |
| Microsoft Surface Laptop 4 13 i7 | |
| PCMark 10 / Productivity | |
| HP ProBook x360 435 G8 R7-5800U | |
| Lenovo Yoga 6 13 82ND0009US | |
| Media Intel Core i7-1165G7, Intel Iris Xe Graphics G7 96EUs (5570 - 7136, n=50) | |
| Microsoft Surface Laptop 4 13 i7 | |
| Lenovo ThinkPad X1 Titanium Yoga G1 20QA001RGE | |
| HP Spectre x360 14-ea0378ng | |
| Framework Laptop 13.5 | |
| PCMark 10 / Digital Content Creation | |
| Lenovo Yoga 6 13 82ND0009US | |
| HP ProBook x360 435 G8 R7-5800U | |
| Framework Laptop 13.5 | |
| Media Intel Core i7-1165G7, Intel Iris Xe Graphics G7 96EUs (4083 - 5550, n=50) | |
| Microsoft Surface Laptop 4 13 i7 | |
| HP Spectre x360 14-ea0378ng | |
| Lenovo ThinkPad X1 Titanium Yoga G1 20QA001RGE | |
| PCMark 10 Score | 4768 punti | |
Aiuto | ||
| DPC Latencies / LatencyMon - interrupt to process latency (max), Web, Youtube, Prime95 | |
| Framework Laptop 13.5 | |
| HP Spectre x360 14-ea0378ng | |
| Lenovo ThinkPad X1 Titanium Yoga G1 20QA001RGE | |
| Lenovo Yoga 6 13 82ND0009US | |
| Microsoft Surface Laptop 4 13 i7 | |
| HP ProBook x360 435 G8 R7-5800U | |
* ... Meglio usare valori piccoli
| Framework Laptop 13.5 Western Digital WD_BLACK SN850 WDS100T1X0E | HP Spectre x360 14-ea0378ng Intel Optane Memory H10 with Solid State Storage 32GB + 1TB HBRPEKNX0203AH(L/H) | Microsoft Surface Laptop 4 13 i7 Samsung PM991 MZ9LQ512HALU | Lenovo ThinkPad X1 Titanium Yoga G1 20QA001RGE Toshiba BG4 KBG40ZNT512G | HP ProBook x360 435 G8 R7-5800U Samsung PM991 MZVLQ512HALU | Lenovo Yoga 6 13 82ND0009US WDC PC SN530 SDBPMPZ-265G | |
|---|---|---|---|---|---|---|
| AS SSD | -76% | -81% | -69% | -76% | -101% | |
| Seq Read (MB/s) | 5613 | 1343 -76% | 1821 -68% | 1898 -66% | 1936 -66% | 1860 -67% |
| Seq Write (MB/s) | 4909 | 1222 -75% | 794 -84% | 1065 -78% | 1237 -75% | 500 -90% |
| 4K Read (MB/s) | 80.6 | 63.6 -21% | 47.54 -41% | 58 -28% | 40.35 -50% | 36.26 -55% |
| 4K Write (MB/s) | 256.6 | 107.8 -58% | 141.6 -45% | 200.7 -22% | 99.5 -61% | 118.6 -54% |
| 4K-64 Read (MB/s) | 2222 | 417.5 -81% | 782 -65% | 580 -74% | 645 -71% | 419 -81% |
| 4K-64 Write (MB/s) | 2050 | 496 -76% | 766 -63% | 779 -62% | 365.8 -82% | 219 -89% |
| Access Time Read * (ms) | 0.032 | 0.103 -222% | 0.191 -497% | 0.052 -63% | 0.104 -225% | 0.102 -219% |
| Access Time Write * (ms) | 0.044 | 0.043 2% | 0.027 39% | 0.16 -264% | 0.038 14% | 0.17 -286% |
| Score Read (Points) | 2864 | 615 -79% | 1012 -65% | 828 -71% | 879 -69% | 641 -78% |
| Score Write (Points) | 2797 | 726 -74% | 987 -65% | 1087 -61% | 589 -79% | 388 -86% |
| Score Total (Points) | 7098 | 1675 -76% | 2477 -65% | 2316 -67% | 1892 -73% | 1300 -82% |
| Copy ISO MB/s (MB/s) | 1926 | 334.9 -83% | 1243 -35% | 1659 -14% | 708 -63% | 880 -54% |
| Copy Program MB/s (MB/s) | 947 | 276.3 -71% | 628 -34% | 519 -45% | 132.1 -86% | 185.3 -80% |
| Copy Game MB/s (MB/s) | 1880 | 433.2 -77% | 976 -48% | 872 -54% | 326.7 -83% | 212.7 -89% |
| CrystalDiskMark 5.2 / 6 | -42% | -67% | -49% | -67% | -68% | |
| Write 4K (MB/s) | 299.4 | 128.9 -57% | 118.2 -61% | 226.6 -24% | 86.7 -71% | 89.2 -70% |
| Read 4K (MB/s) | 87.6 | 140 60% | 37.54 -57% | 62.8 -28% | 32.45 -63% | 33.09 -62% |
| Write Seq (MB/s) | 5205 | 1422 -73% | 1017 -80% | 1296 -75% | 1235 -76% | 988 -81% |
| Read Seq (MB/s) | 4276 | 1660 -61% | 926 -78% | 1445 -66% | 1417 -67% | 1322 -69% |
| Write 4K Q32T1 (MB/s) | 846 | 475.1 -44% | 354.2 -58% | 545 -36% | 390.8 -54% | 332.6 -61% |
| Read 4K Q32T1 (MB/s) | 905 | 581 -36% | 352.6 -61% | 687 -24% | 291 -68% | 389.3 -57% |
| Write Seq Q32T1 (MB/s) | 5189 | 1793 -65% | 1174 -77% | 1483 -71% | 1384 -73% | 984 -81% |
| Read Seq Q32T1 (MB/s) | 6921 | 2536 -63% | 2261 -67% | 2334 -66% | 2350 -66% | 2461 -64% |
| Media totale (Programma / Settaggio) | -59% /
-64% | -74% /
-76% | -59% /
-62% | -72% /
-73% | -85% /
-89% |
* ... Meglio usare valori piccoli

Throttling Disco: DiskSpd Read Loop, Queue Depth 8
| 3DMark 11 Performance | 5893 punti | |
| 3DMark Cloud Gate Standard Score | 15999 punti | |
| 3DMark Fire Strike Score | 2361 punti | |
| 3DMark Time Spy Score | 1361 punti | |
Aiuto | ||
Grafico FPS The Witcher 3
| basso | medio | alto | ultra | |
|---|---|---|---|---|
| The Witcher 3 (2015) | 75.9 | 45.1 | 22.1 | 12 |
| Dota 2 Reborn (2015) | 109 | 66.1 | 41.2 | 38.2 |
| Final Fantasy XV Benchmark (2018) | 29.4 | 15.7 | 12.1 | |
| X-Plane 11.11 (2018) | 41.3 | 36.5 | 29.5 |
| Framework Laptop 13.5 Iris Xe G7 96EUs, i7-1165G7, Western Digital WD_BLACK SN850 WDS100T1X0E | HP Spectre x360 14-ea0378ng Iris Xe G7 96EUs, i7-1165G7, Intel Optane Memory H10 with Solid State Storage 32GB + 1TB HBRPEKNX0203AH(L/H) | Microsoft Surface Laptop 4 13 i7 Iris Xe G7 96EUs, i7-1185G7, Samsung PM991 MZ9LQ512HALU | Lenovo ThinkPad X1 Titanium Yoga G1 20QA001RGE Iris Xe G7 96EUs, i7-1160G7, Toshiba BG4 KBG40ZNT512G | Lenovo Yoga 6 13 82ND0009US Vega 7, R5 5500U, WDC PC SN530 SDBPMPZ-265G | Asus Zenbook 14 UX433FN-A6023T GeForce MX150, i7-8565U, Intel SSD 660p SSDPEKNW512G8 | |
|---|---|---|---|---|---|---|
| Noise | 1% | 5% | 8% | 4% | -13% | |
| off /ambiente * (dB) | 23.9 | 26 -9% | 24.2 -1% | 25.1 -5% | 25.1 -5% | 30.7 -28% |
| Idle Minimum * (dB) | 23.9 | 26 -9% | 24.2 -1% | 25.1 -5% | 25.1 -5% | 30.7 -28% |
| Idle Average * (dB) | 23.9 | 26 -9% | 24.2 -1% | 25.1 -5% | 25.1 -5% | 30.7 -28% |
| Idle Maximum * (dB) | 23.9 | 26 -9% | 24.2 -1% | 27.1 -13% | 25.1 -5% | 30.7 -28% |
| Load Average * (dB) | 45.6 | 37.5 18% | 39.5 13% | 32.7 28% | 41 10% | 38.8 15% |
| Witcher 3 ultra * (dB) | 47.1 | 32.7 31% | 38.6 18% | |||
| Load Maximum * (dB) | 47.9 | 36.3 24% | 39.5 18% | 35.8 25% | 38.7 19% | 39.3 18% |
* ... Meglio usare valori piccoli
Rumorosità
| Idle |
| 23.9 / 23.9 / 23.9 dB(A) |
| Sotto carico |
| 45.6 / 47.9 dB(A) |
 | ||
30 dB silenzioso 40 dB(A) udibile 50 dB(A) rumoroso |
||
min: | ||
(-) La temperatura massima sul lato superiore è di 47.2 °C / 117 F, rispetto alla media di 34.3 °C / 94 F, che varia da 21.2 a 62.5 °C per questa classe Office.
(+) Il lato inferiore si riscalda fino ad un massimo di 39.4 °C / 103 F, rispetto alla media di 36.8 °C / 98 F
(+) In idle, la temperatura media del lato superiore è di 23.5 °C / 74 F, rispetto alla media deld ispositivo di 29.5 °C / 85 F.
(+) I poggiapolsi e il touchpad sono piu' freddi della temperatura della pelle con un massimo di 28.2 °C / 82.8 F e sono quindi freddi al tatto.
(±) La temperatura media della zona del palmo della mano di dispositivi simili e'stata di 27.5 °C / 81.5 F (-0.7 °C / -1.3 F).
Framework Laptop 13.5 analisi audio
(±) | potenza degli altiparlanti media ma buona (78.2 dB)
Bassi 100 - 315 Hz
(±) | bassi ridotti - in media 13.9% inferiori alla media
(±) | la linearità dei bassi è media (10.1% delta rispetto alla precedente frequenza)
Medi 400 - 2000 Hz
(+) | medi bilanciati - solo only 4% rispetto alla media
(+) | medi lineari (6% delta rispetto alla precedente frequenza)
Alti 2 - 16 kHz
(±) | alti elevati - circa 5.2% superiori alla media
(+) | alti lineari (6.1% delta rispetto alla precedente frequenza)
Nel complesso 100 - 16.000 Hz
(±) | la linearità complessiva del suono è media (17.3% di differenza rispetto alla media
Rispetto alla stessa classe
» 26% di tutti i dispositivi testati in questa classe è stato migliore, 7% simile, 67% peggiore
» Il migliore ha avuto un delta di 7%, medio di 21%, peggiore di 53%
Rispetto a tutti i dispositivi testati
» 32% di tutti i dispositivi testati in questa classe è stato migliore, 8% similare, 59% peggiore
» Il migliore ha avuto un delta di 4%, medio di 24%, peggiore di 134%
Apple MacBook 12 (Early 2016) 1.1 GHz analisi audio
(+) | gli altoparlanti sono relativamente potenti (83.6 dB)
Bassi 100 - 315 Hz
(±) | bassi ridotti - in media 11.3% inferiori alla media
(±) | la linearità dei bassi è media (14.2% delta rispetto alla precedente frequenza)
Medi 400 - 2000 Hz
(+) | medi bilanciati - solo only 2.4% rispetto alla media
(+) | medi lineari (5.5% delta rispetto alla precedente frequenza)
Alti 2 - 16 kHz
(+) | Alti bilanciati - appena 2% dalla media
(+) | alti lineari (4.5% delta rispetto alla precedente frequenza)
Nel complesso 100 - 16.000 Hz
(+) | suono nel complesso lineare (10.2% differenza dalla media)
Rispetto alla stessa classe
» 7% di tutti i dispositivi testati in questa classe è stato migliore, 2% simile, 91% peggiore
» Il migliore ha avuto un delta di 5%, medio di 18%, peggiore di 53%
Rispetto a tutti i dispositivi testati
» 5% di tutti i dispositivi testati in questa classe è stato migliore, 1% similare, 94% peggiore
» Il migliore ha avuto un delta di 4%, medio di 24%, peggiore di 134%
| Off / Standby | |
| Idle | |
| Sotto carico |
|
Leggenda:
min: | |
| Framework Laptop 13.5 i7-1165G7, Iris Xe G7 96EUs, Western Digital WD_BLACK SN850 WDS100T1X0E, IPS, 2256x1504, 13.5" | HP Spectre x360 14-ea0378ng i7-1165G7, Iris Xe G7 96EUs, Intel Optane Memory H10 with Solid State Storage 32GB + 1TB HBRPEKNX0203AH(L/H), OLED, 3000x2000, 13.5" | Microsoft Surface Laptop 4 13 i7 i7-1185G7, Iris Xe G7 96EUs, Samsung PM991 MZ9LQ512HALU, IPS, 2256x1504, 13.5" | Lenovo ThinkPad X1 Titanium Yoga G1 20QA001RGE i7-1160G7, Iris Xe G7 96EUs, Toshiba BG4 KBG40ZNT512G, IPS, 2256x1504, 13.5" | HP ProBook x360 435 G8 R7-5800U R7 5800U, Vega 8, Samsung PM991 MZVLQ512HALU, IPS, 1920x1080, 13.3" | Lenovo Yoga 6 13 82ND0009US R5 5500U, Vega 7, WDC PC SN530 SDBPMPZ-265G, IPS, 1920x1080, 13.3" | |
|---|---|---|---|---|---|---|
| Power Consumption | -14% | 15% | 14% | 24% | 14% | |
| Idle Minimum * (Watt) | 4.3 | 6.3 -47% | 2.6 40% | 3.9 9% | 3.2 26% | 5 -16% |
| Idle Average * (Watt) | 8.2 | 11.2 -37% | 6 27% | 7.3 11% | 5.5 33% | 6.3 23% |
| Idle Maximum * (Watt) | 8.7 | 13.3 -53% | 8.2 6% | 10.3 -18% | 6.4 26% | 6.9 21% |
| Load Average * (Watt) | 43.5 | 32 26% | 41.4 5% | 30.6 30% | 35.5 18% | 41.5 5% |
| Witcher 3 ultra * (Watt) | 43.5 | 25.5 41% | 36.4 16% | 33.2 24% | ||
| Load Maximum * (Watt) | 61.8 | 35.6 42% | 64.1 -4% | 57.1 8% | 47.5 23% | 46.5 25% |
* ... Meglio usare valori piccoli
Consumo energetico The Witcher 3 / Stresstest
| Framework Laptop 13.5 i7-1165G7, Iris Xe G7 96EUs, 55 Wh | HP Spectre x360 14-ea0378ng i7-1165G7, Iris Xe G7 96EUs, 66 Wh | Microsoft Surface Laptop 4 13 i7 i7-1185G7, Iris Xe G7 96EUs, 47.4 Wh | Lenovo ThinkPad X1 Titanium Yoga G1 20QA001RGE i7-1160G7, Iris Xe G7 96EUs, 44.5 Wh | HP ProBook x360 435 G8 R7-5800U R7 5800U, Vega 8, 45 Wh | Lenovo Yoga 6 13 82ND0009US R5 5500U, Vega 7, 60 Wh | |
|---|---|---|---|---|---|---|
| Autonomia della batteria | -2% | -5% | 5% | 19% | 65% | |
| WiFi v1.3 (h) | 8 | 7.8 -2% | 7.6 -5% | 8.4 5% | 9.5 19% | 13.2 65% |
| Reader / Idle (h) | 13.4 | 17.5 | ||||
| Load (h) | 2.6 | 1.4 | 1.9 | 1.1 | 2 |
Pro
Contro
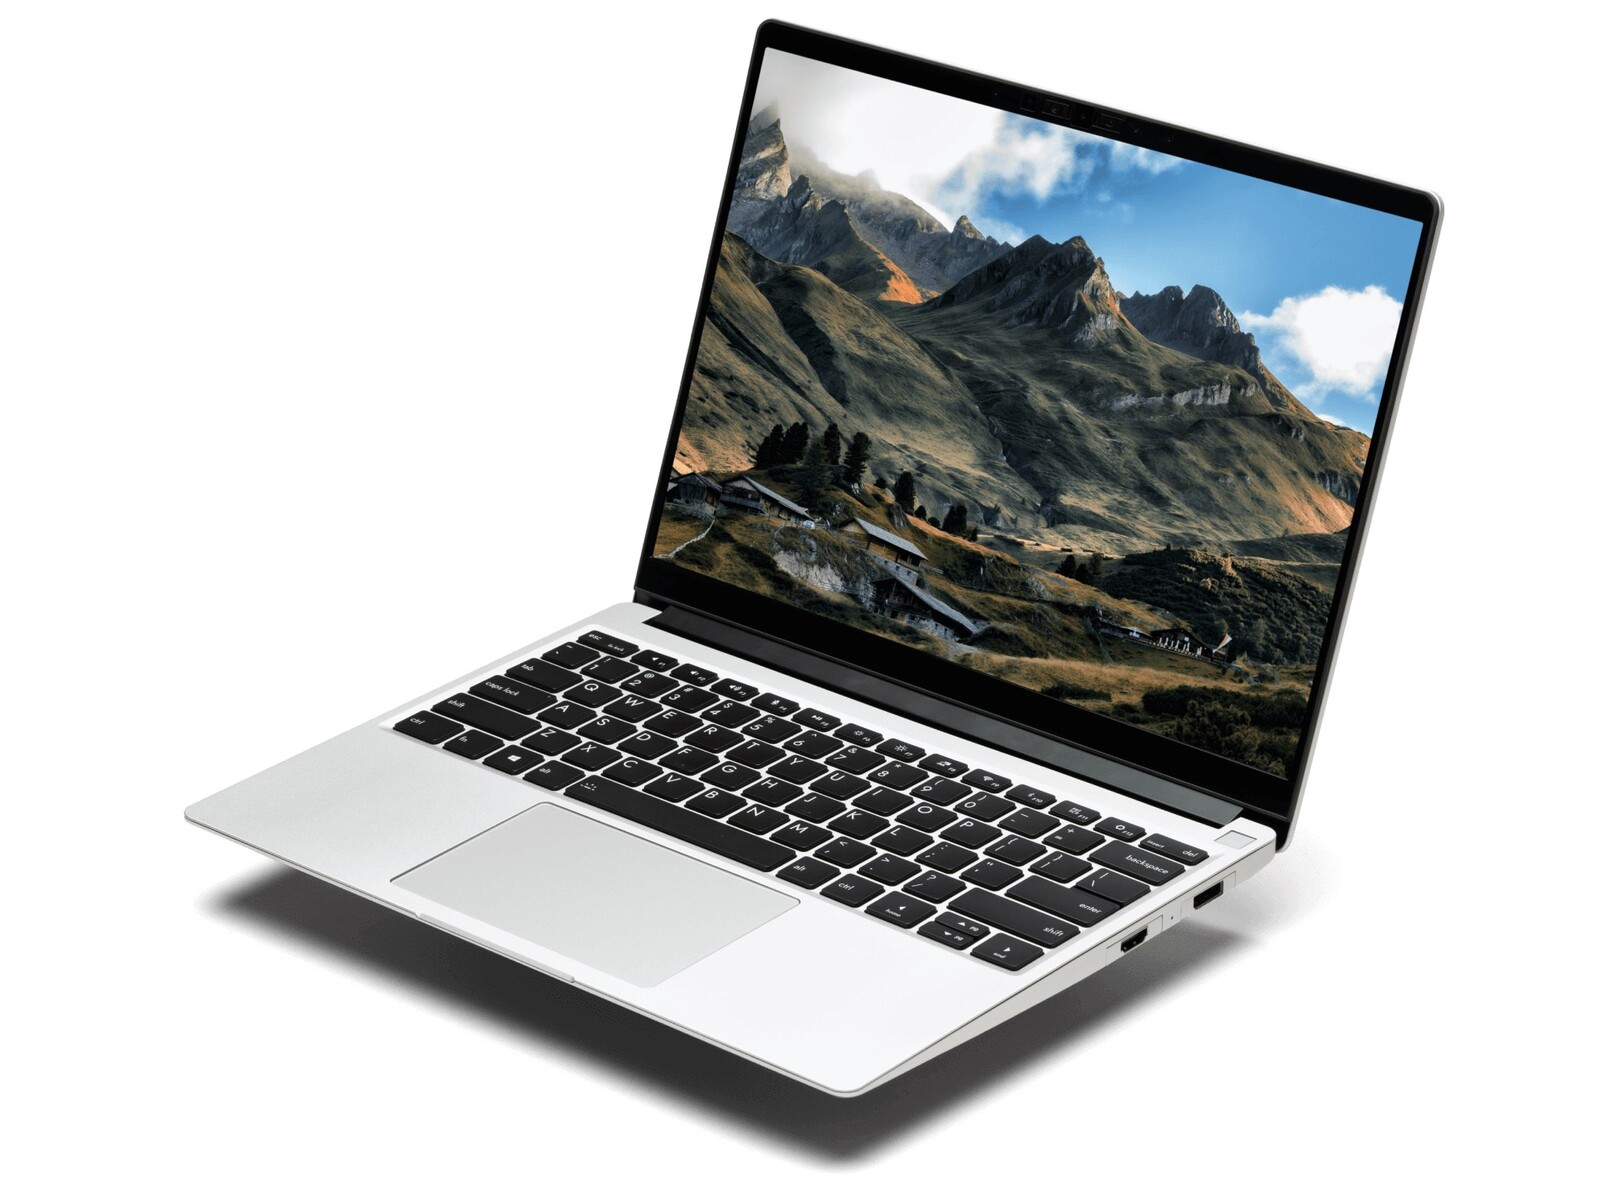
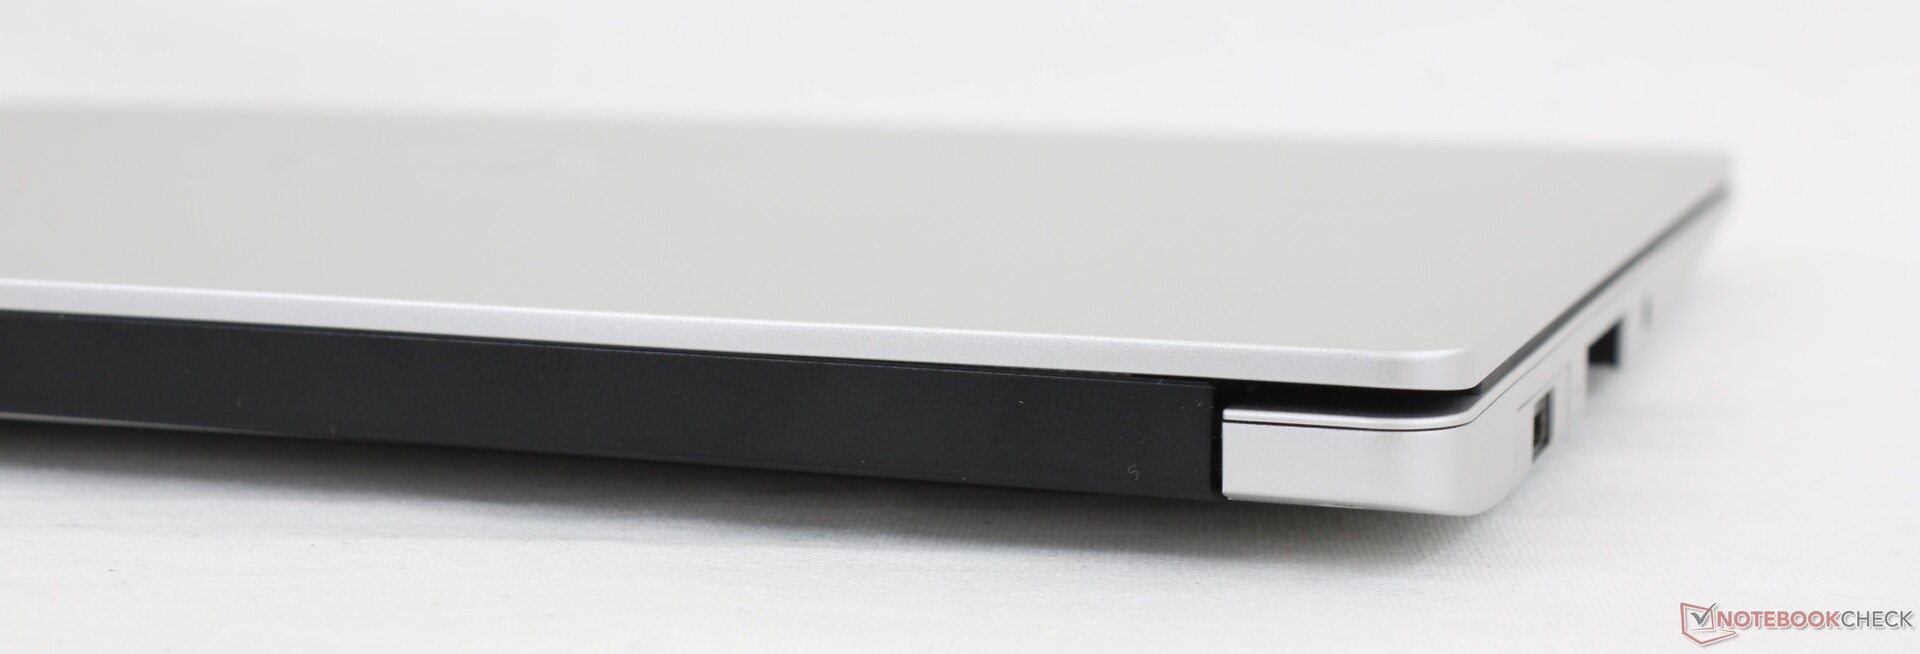
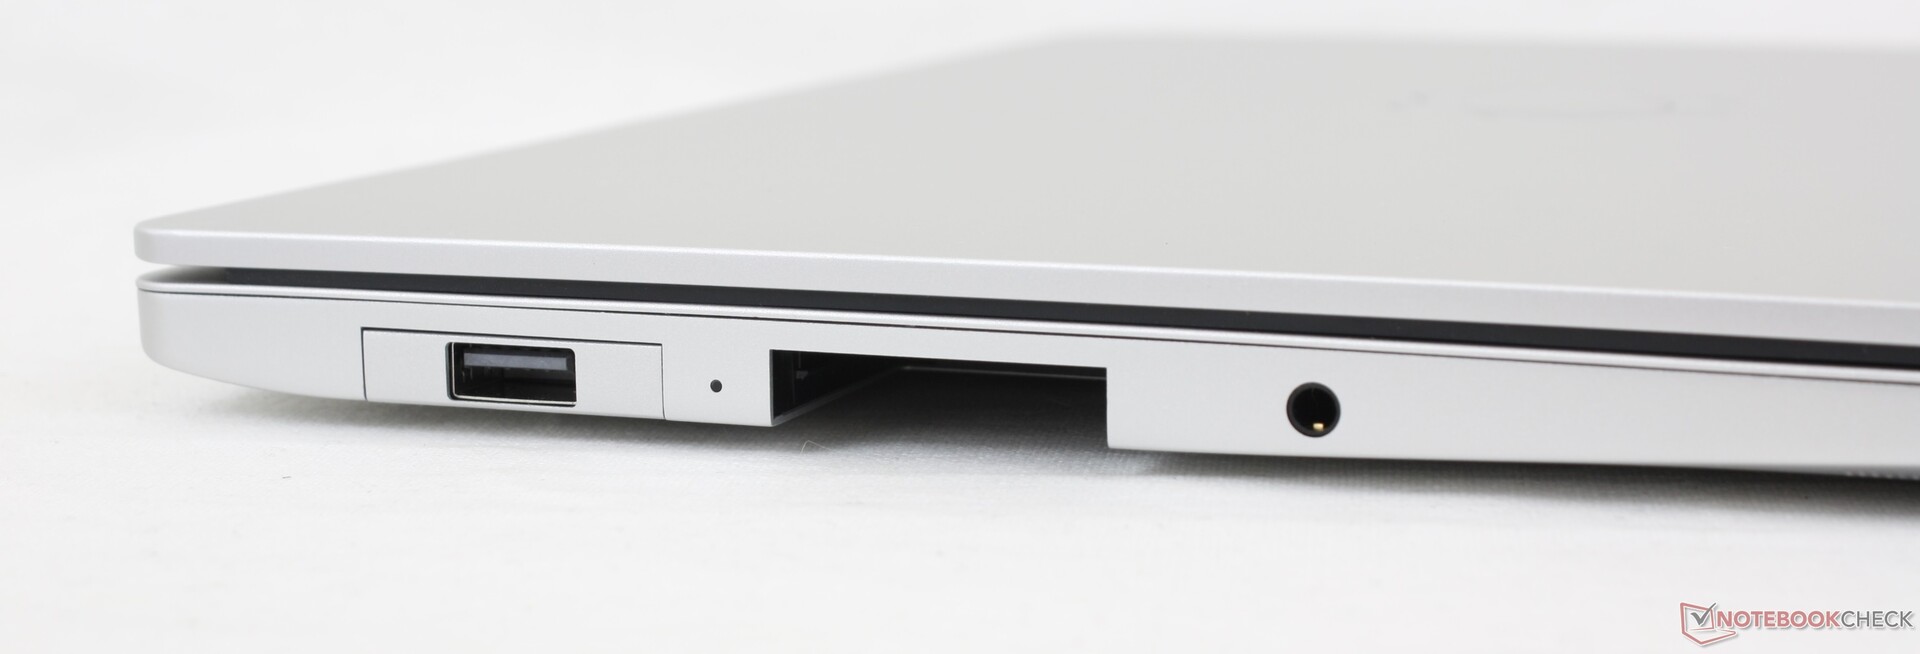
Spesso i produttori progettano computer portatili sottili e attraenti che sono fastidiosamente complicati se non impossibili da riparare. Anche semplici aggiornamenti come la RAM o lo storage sono solitamente scoraggiati. Questo portatile Framework è la prova che i modelli sottili e leggeri non devono necessariamente sacrificare l'assistenza all'utente finale o le caratteristiche uniche come le porte intercambiabili per la portabilità o le dimensioni.
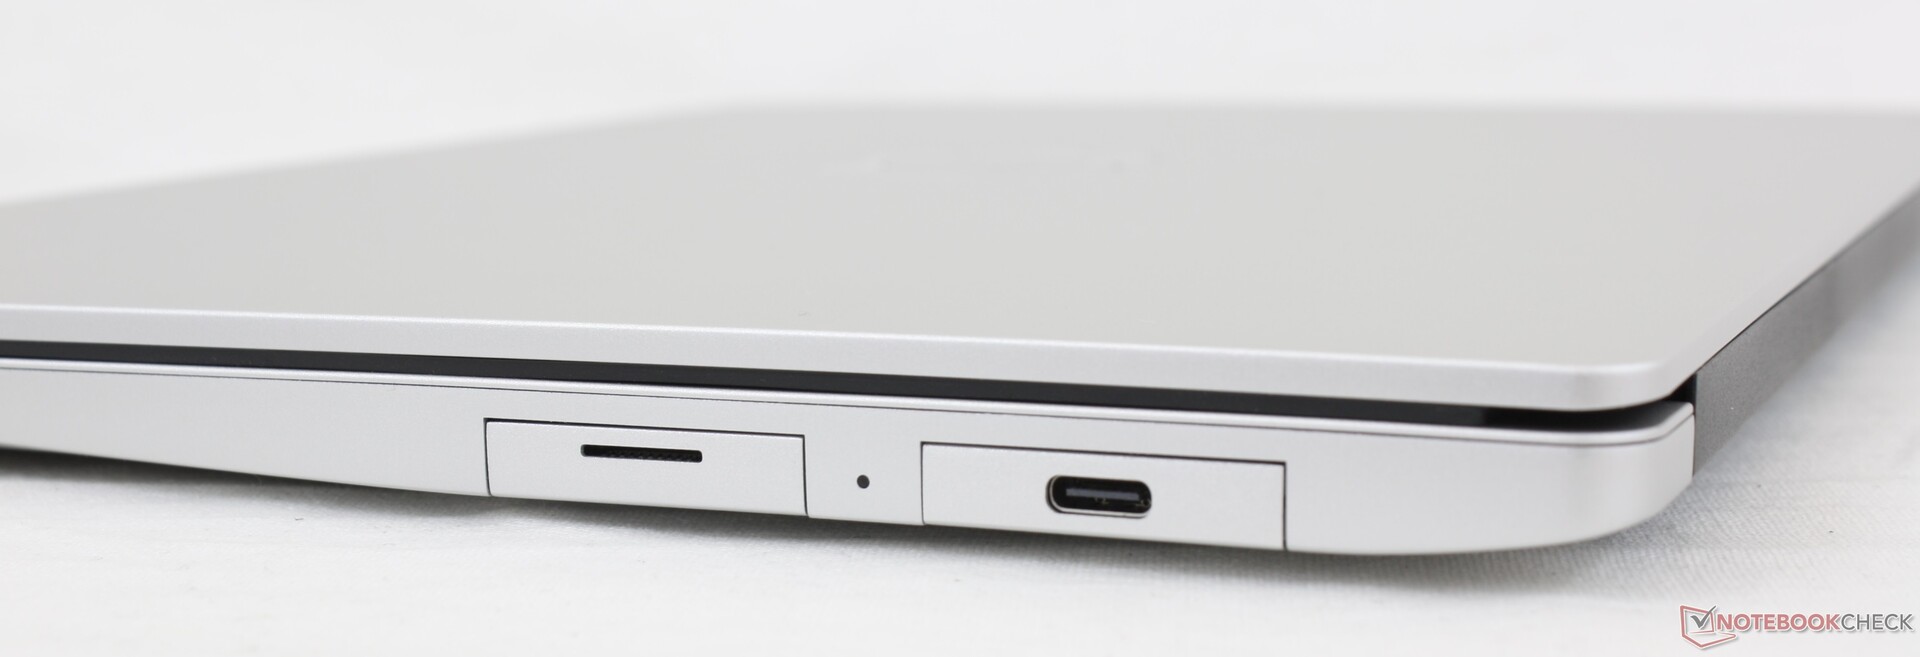
Il Framework Laptop batte il Surface Laptop per certi versi. Riesce ad essere più piccolo, significativamente più facile da riparare, e con più porte integrate senza sacrificare le prestazioni o la portabilità.
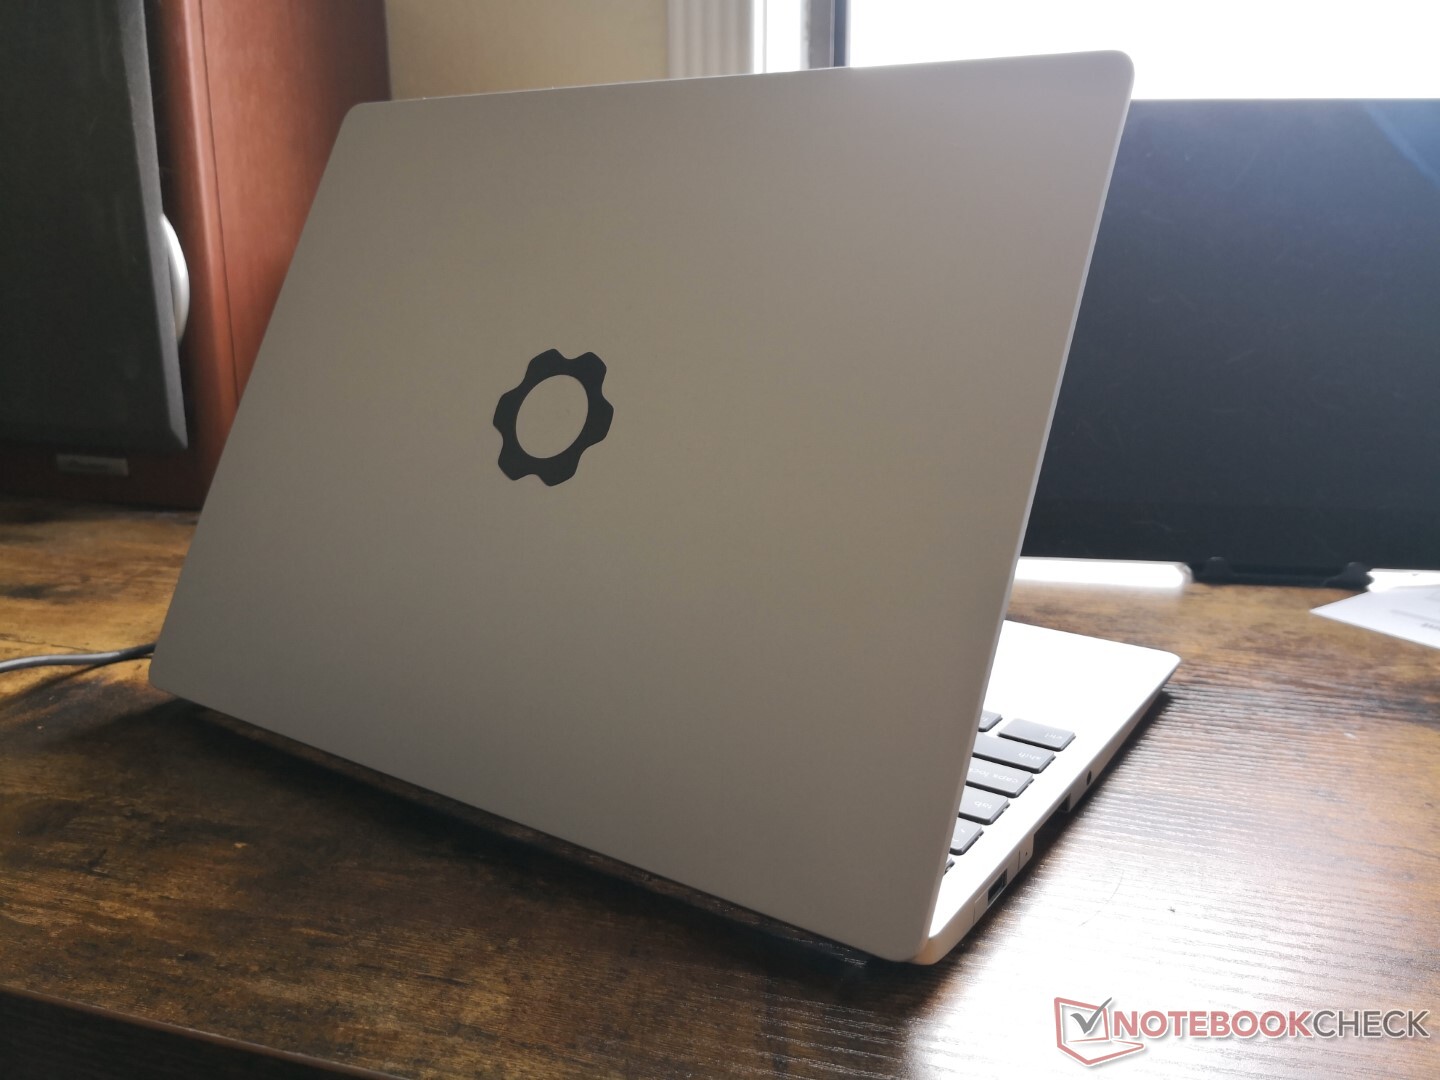
Alcune cose del portatile Framework potrebbero essere migliorate. La cover e le cerniere in particolare sono più deboli rispetto ai concorrenti Dell XPS 13, HP Spectre x360 14, Microsoft Surface Laptopo Lenovo ThinkBook. Inoltre, il rumore della ventola è più intenso quando si eseguono carichi più elevati. Non sono problemi, ma cerniere più rigide, una soluzione di raffreddamento più grande e più silenziosa, e un rinforzo in vetro edge-to-edge per il display renderebbero il quadro ancora migliore.
Framework Laptop 13.5
- 07/26/2021 v7 (old)
Allen Ngo
Price comparison
