Recensione del Framework Laptop 16: Debutto delle prestazioni della Radeon RX 7700S

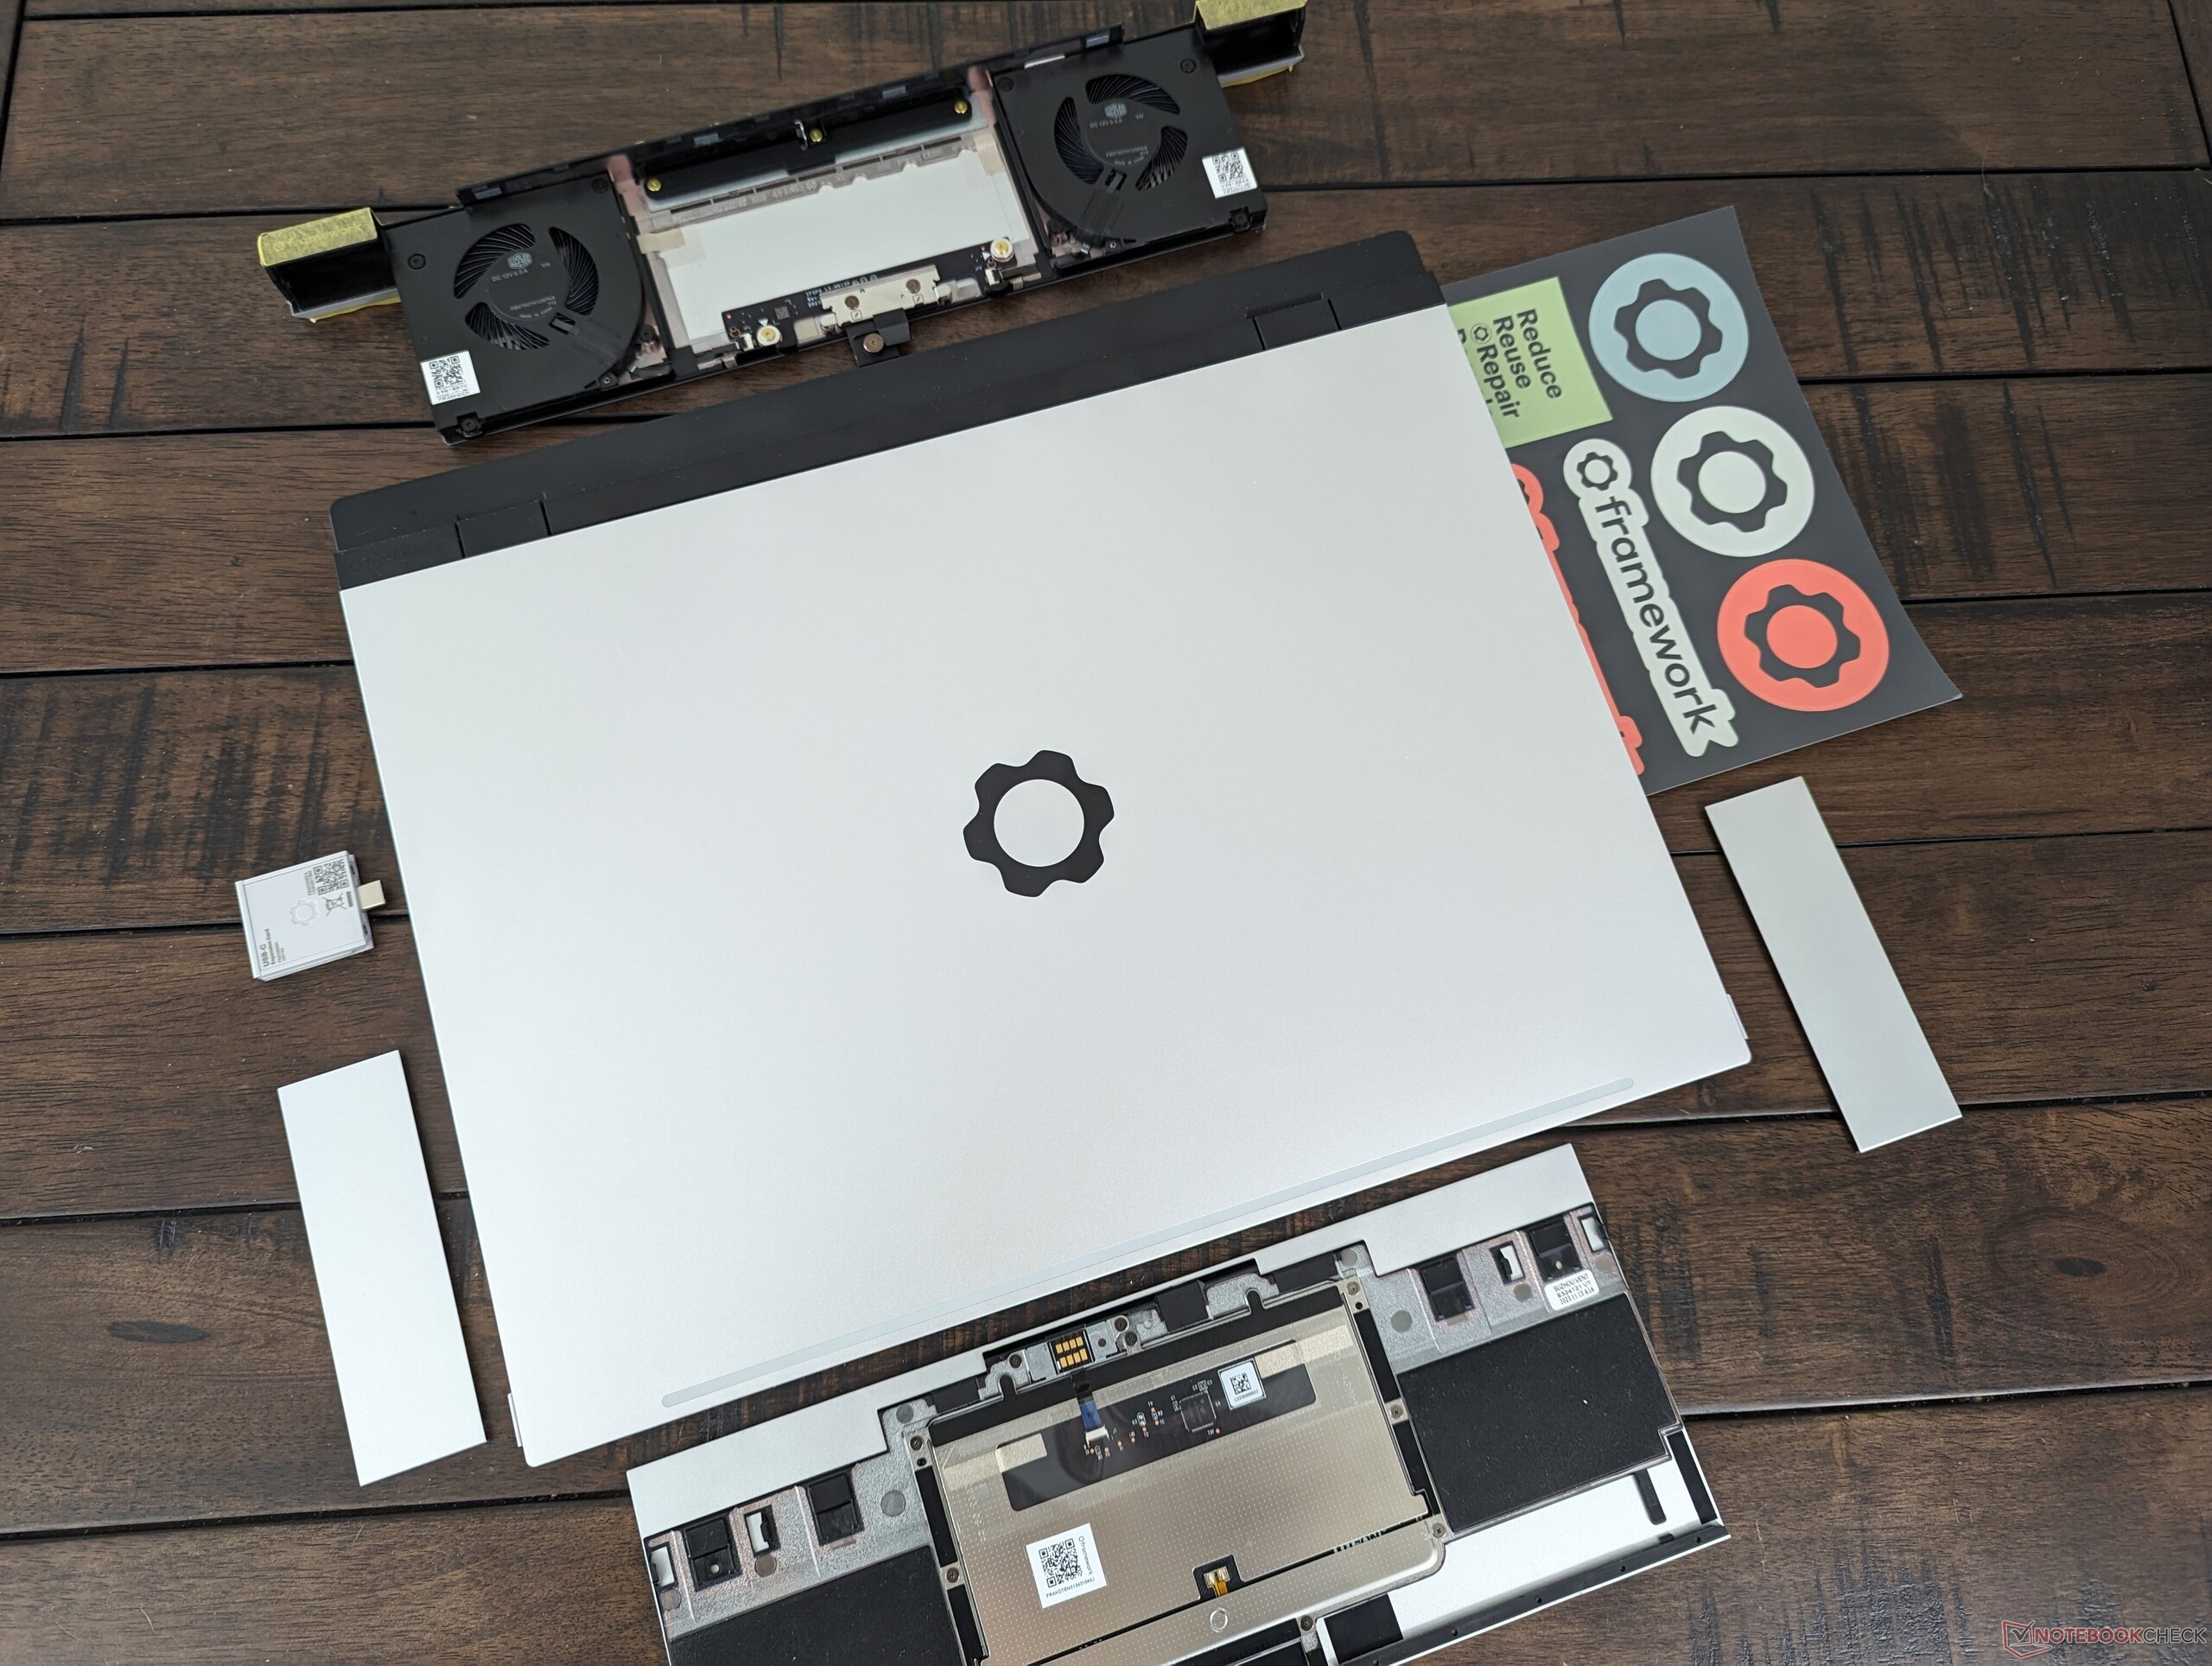
Rivelato alla GDC 2023il Framework Laptop 16 espande gli aspetti di riparabilità e sostenibilità del Framework 13.5, ma in un fattore di forma più grande da 16 pollici. Tuttavia, si tratta di molto di più di una versione più grande, in quanto le maggiori dimensioni dello schermo hanno consentito una personalizzazione ancora maggiore e parti opzionali rispetto al design originale da 13,5 pollici, tra cui grafica discreta rimovibile, distanziatori del touchpad, LED e numpad.
La nostra unità di recensione è la configurazione di fascia alta con Ryzen 9 7940HS e Radeon RX 7700S da 100 W, per un prezzo al dettaglio di circa 2.400 dollari. Le SKU di fascia più bassa vengono fornite con Ryzen 7 7840HS e nessuna GPU discreta, ma tutte le opzioni sono dotate dello stesso display IPS VRR da 1600p 165 Hz. Sono disponibili anche kit Barebone e DIY, come per il Laptop 13.5. Framework afferma che l'azienda ha lavorato a stretto contatto con AMD per la progettazione del Laptop 16, il che implica che non dovremmo trattenere il fiato per eventuali opzioni Intel-Nvidia in tempi brevi.
Sebbene il Laptop 16 sia assolutamente in grado di giocare grazie alle sue specifiche, Framework è attenta a non chiamarlo laptop da gioco per paura di etichettare il modello. Il Laptop 16 si rivolge invece a un pubblico più ampio, composto da utenti multimediali, creatori di contenuti e giocatori. Tra i concorrenti del Laptop 16 ci sono i portatili da 16 pollici di produttori più tradizionali, come il modello HP Spectre x360 16e l'imminente Dell XPS 16, Lenovo ThinkPad Z16o il Apple MacBook Pro 16.
Altre recensioni del quadro:
Potenziali concorrenti a confrontos
Punteggio | Data | Modello | Peso | Altezza | Dimensione | Risoluzione | Prezzo |
|---|---|---|---|---|---|---|---|
| 89.6 % v7 (old) | 01/2024 | Framework Laptop 16 R9 7940HS, Radeon RX 7700S | 2.4 kg | 20.95 mm | 16.00" | 2560x1600 | |
| 88.1 % v7 (old) | 12/2023 | MSI Prestige 16 B1MG-001US Ultra 7 155H, Arc 8-Core | 1.6 kg | 19.1 mm | 16.00" | 2560x1600 | |
| 88.6 % v7 (old) | 12/2023 | Lenovo ThinkPad Z16 Gen 2 R9 PRO 7940HS, Radeon RX 6550M | 1.8 kg | 15.8 mm | 16.00" | 3840x2400 | |
| 93.2 % v7 (old) | 11/2023 | Apple MacBook Pro 16 2023 M3 Max Apple M3 Max 16-Core, M3 Max 40-Core GPU | 2.1 kg | 16.9 mm | 16.00" | 3456x2234 | |
| 87.1 % v7 (old) | 08/2023 | Dell Inspiron 16 Plus 7630 i7-13700H, GeForce RTX 4060 Laptop GPU | 2.2 kg | 19.95 mm | 16.00" | 2560x1600 | |
| 87.3 % v7 (old) | 01/2023 | HP Spectre x360 2-in-1 16-f1075ng i7-12700H, Iris Xe G7 96EUs | 2 kg | 19.9 mm | 16.00" | 3072x1920 |
Caso - Quando la forma incontra la funzione
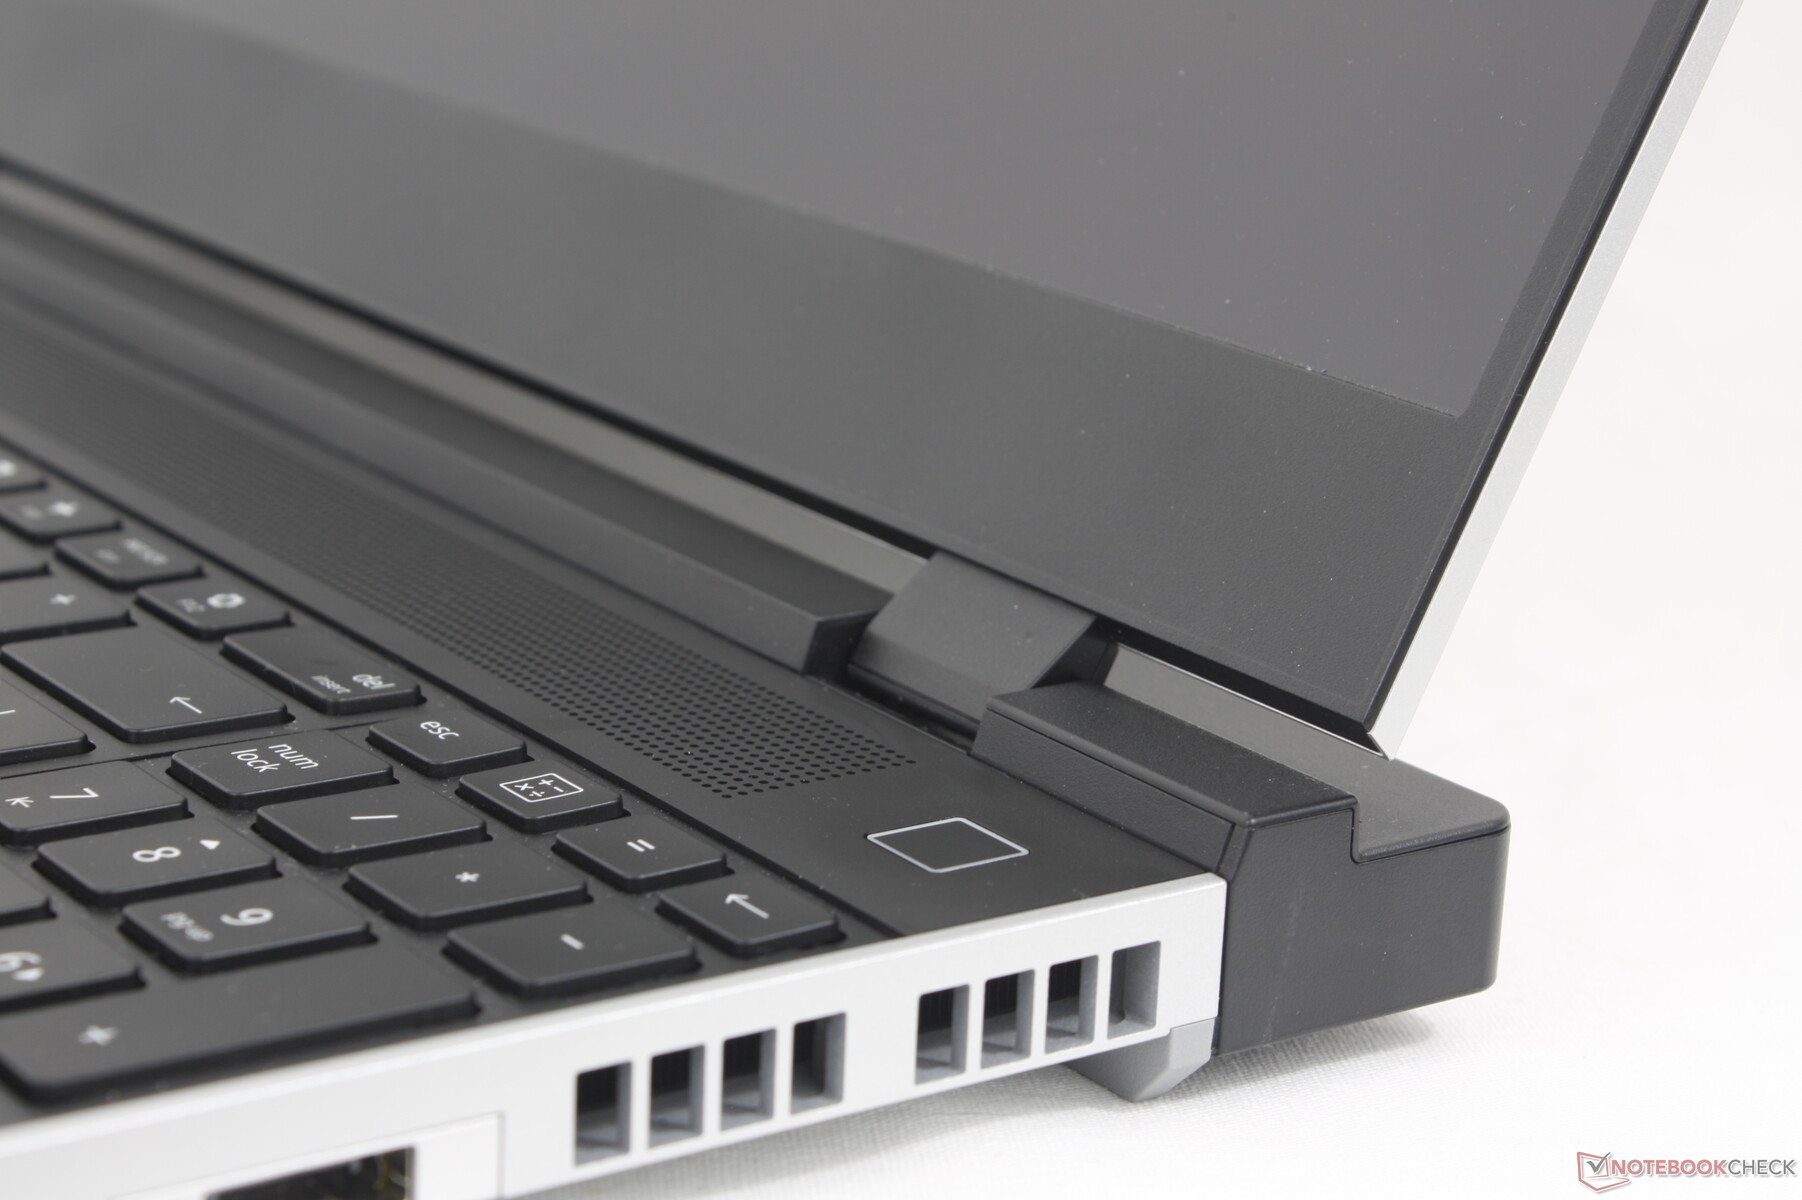
Il telaio è un'evoluzione del più piccolo Laptop 13.5. Sebbene i materiali siano in gran parte gli stessi, il Laptop 16 sembra più spesso e più rigido intorno alla base, per una prima impressione migliore, anche dopo aver tenuto conto di tutte le nuove parti rimovibili. Se si tenta di torcere la base o di deformare la tastiera, non si sentono quasi più scricchiolii e le distorsioni sono minime, il che rappresenta già un enorme miglioramento rispetto al più fragile Laptop 13.5.
Purtroppo, una caratteristica non è migliorata: il coperchio. Proprio come nel Laptop 13.5, il coperchio del Laptop 16 è più soggetto a torsioni e deformazioni rispetto ad altre alternative da 16 pollici, come HP Spectre x360 16 o Blade 16. Le cerniere possono essere decenti, ma il coperchio sembra ancora una volta l'aspetto più debole dello chassis.
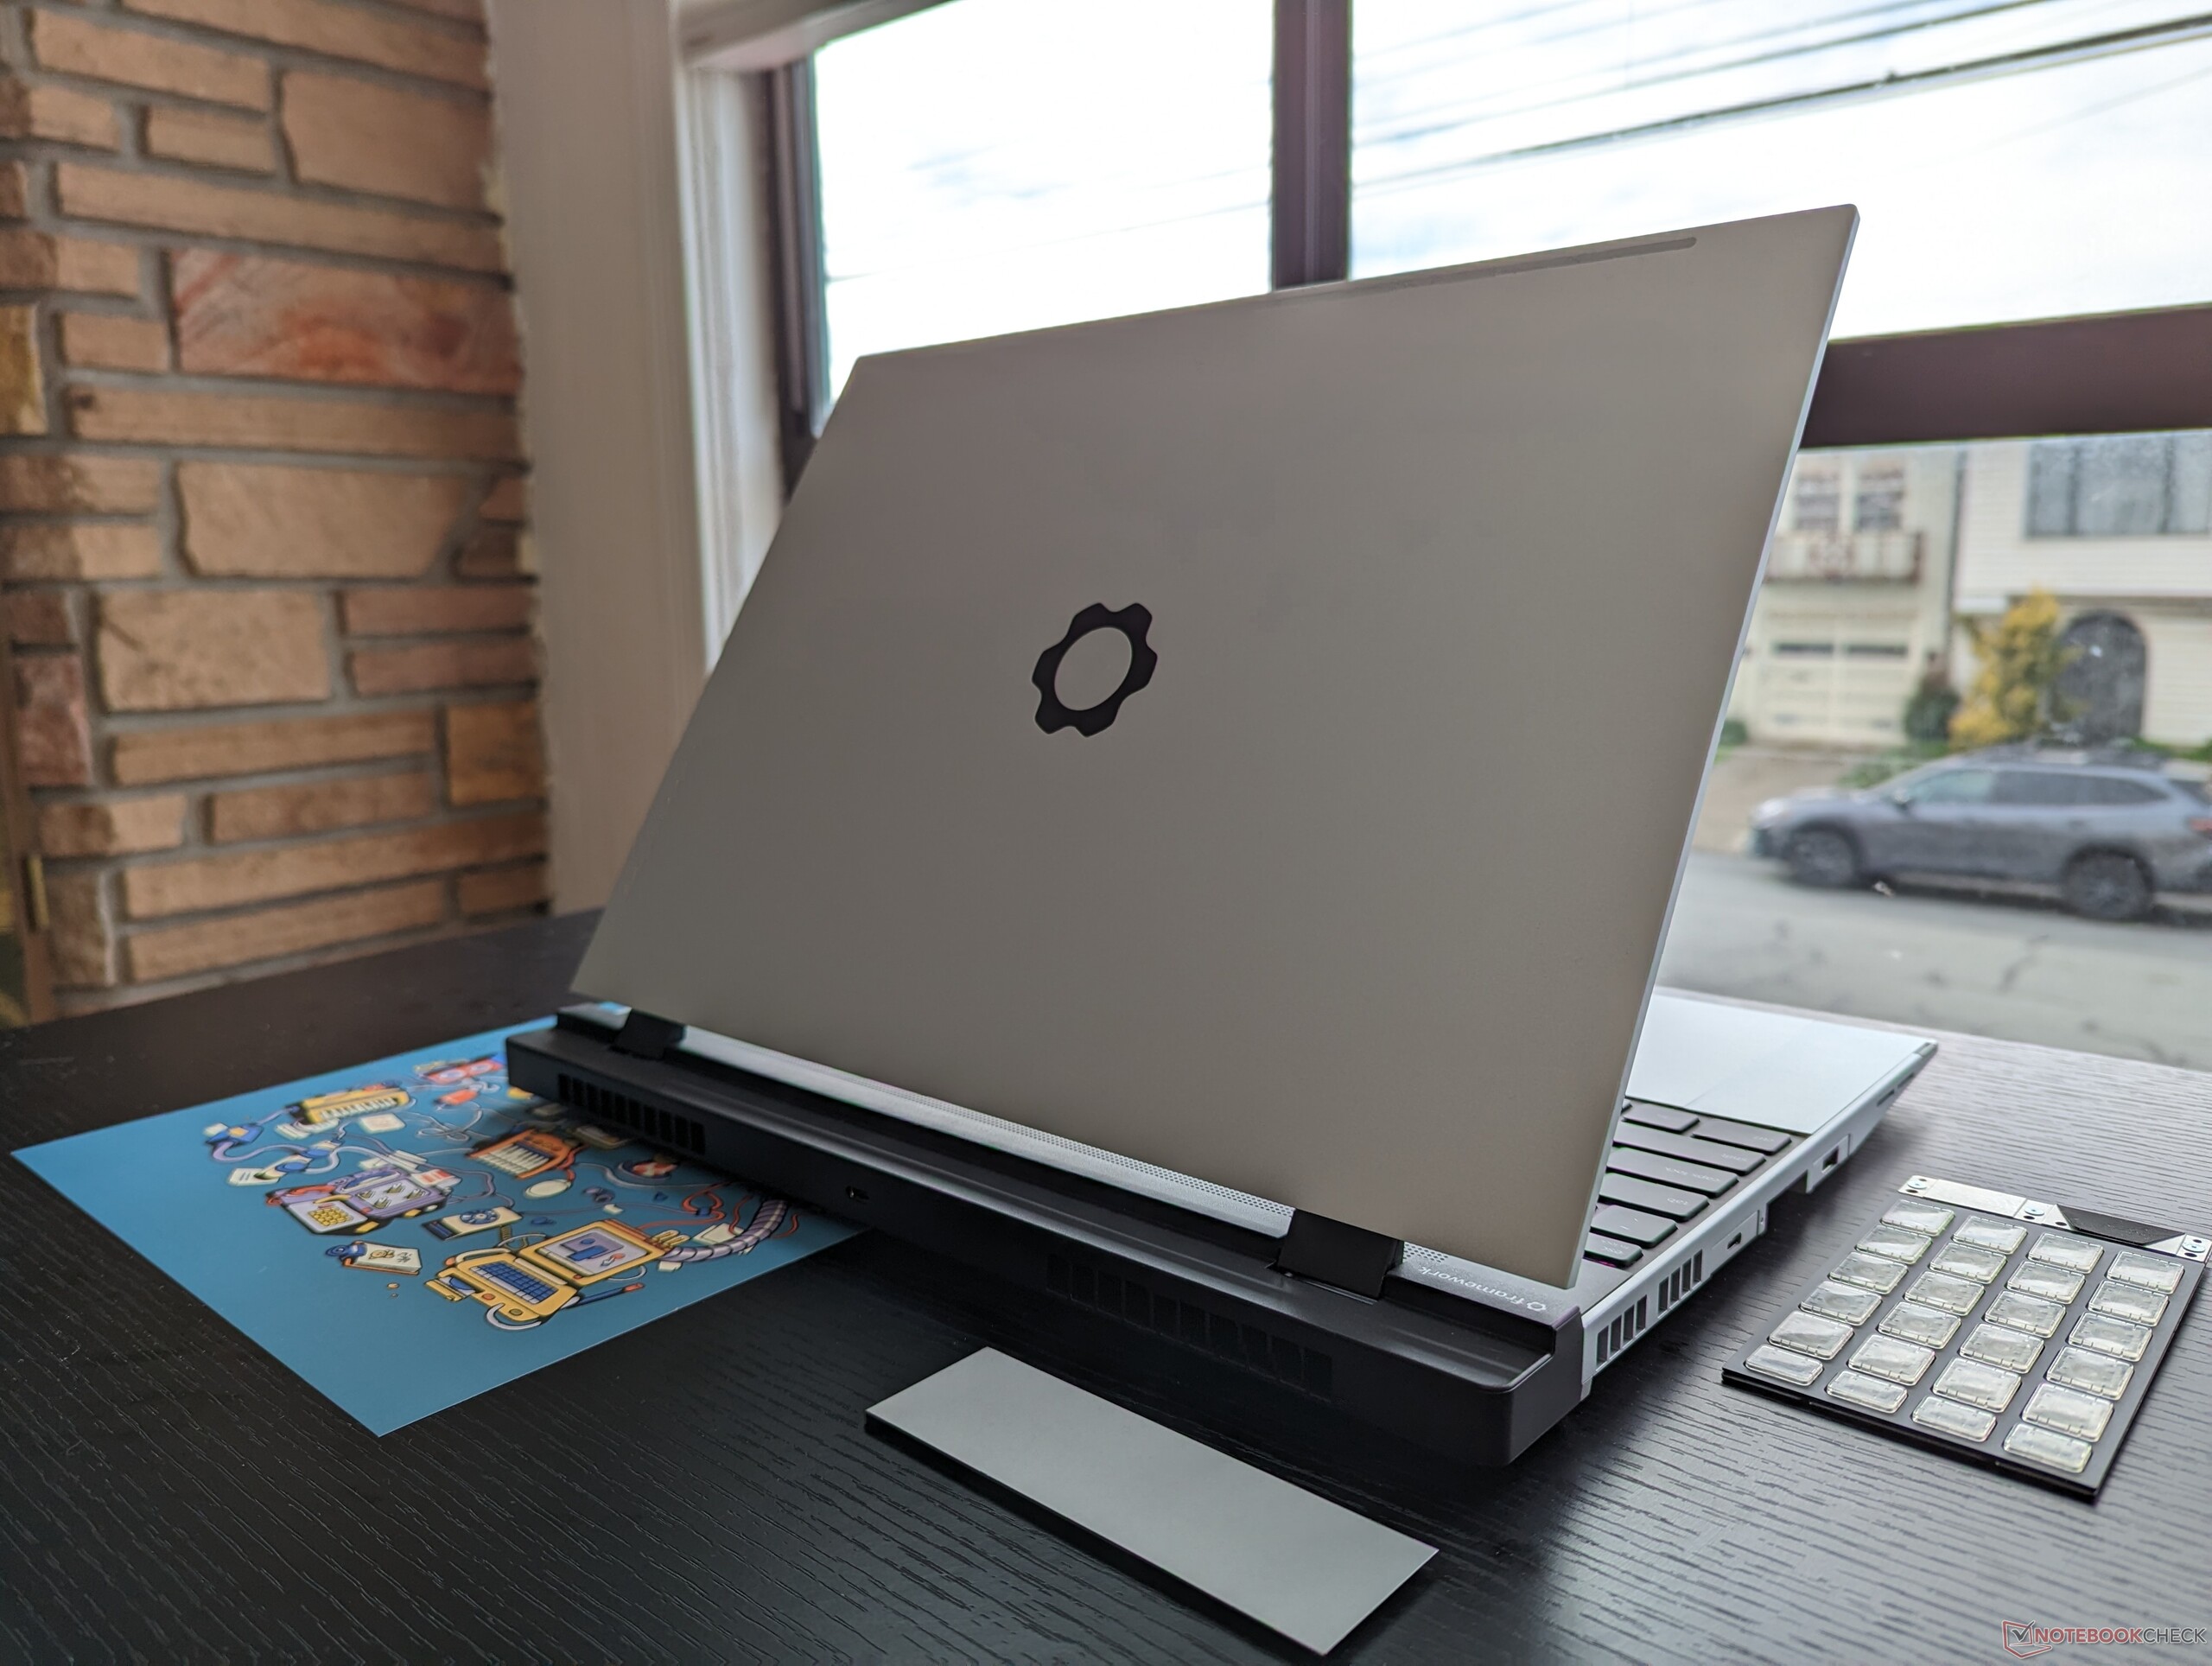
Le dimensioni e il peso variano a seconda che sia collegato il modulo dGPU o che sia invece collegato il modulo di copertura standard più piccolo. In effetti, il Laptop 16 diventa sensibilmente più pesante e più lungo di altri computer portatili multimediali da 16 pollici quando è collegato il modulo dGPU. Il suo design è già piuttosto lungo, 270 mm, con il solo modulo di copertura standard. Se la portabilità è un problema, può certamente fare di meglio con i computer portatili più tradizionali di Apple o con la serie Gram di LG Serie LG Gram.
| Con modulo di copertura dell'alloggiamento di espansione standard | 356.58 x 270,0 x 17,95 mm | 2.1 kg |
| Con modulo di alloggiamento per grafica discreta | 356.58 x 290,2 x 20,95 mm | 2.4 kg |
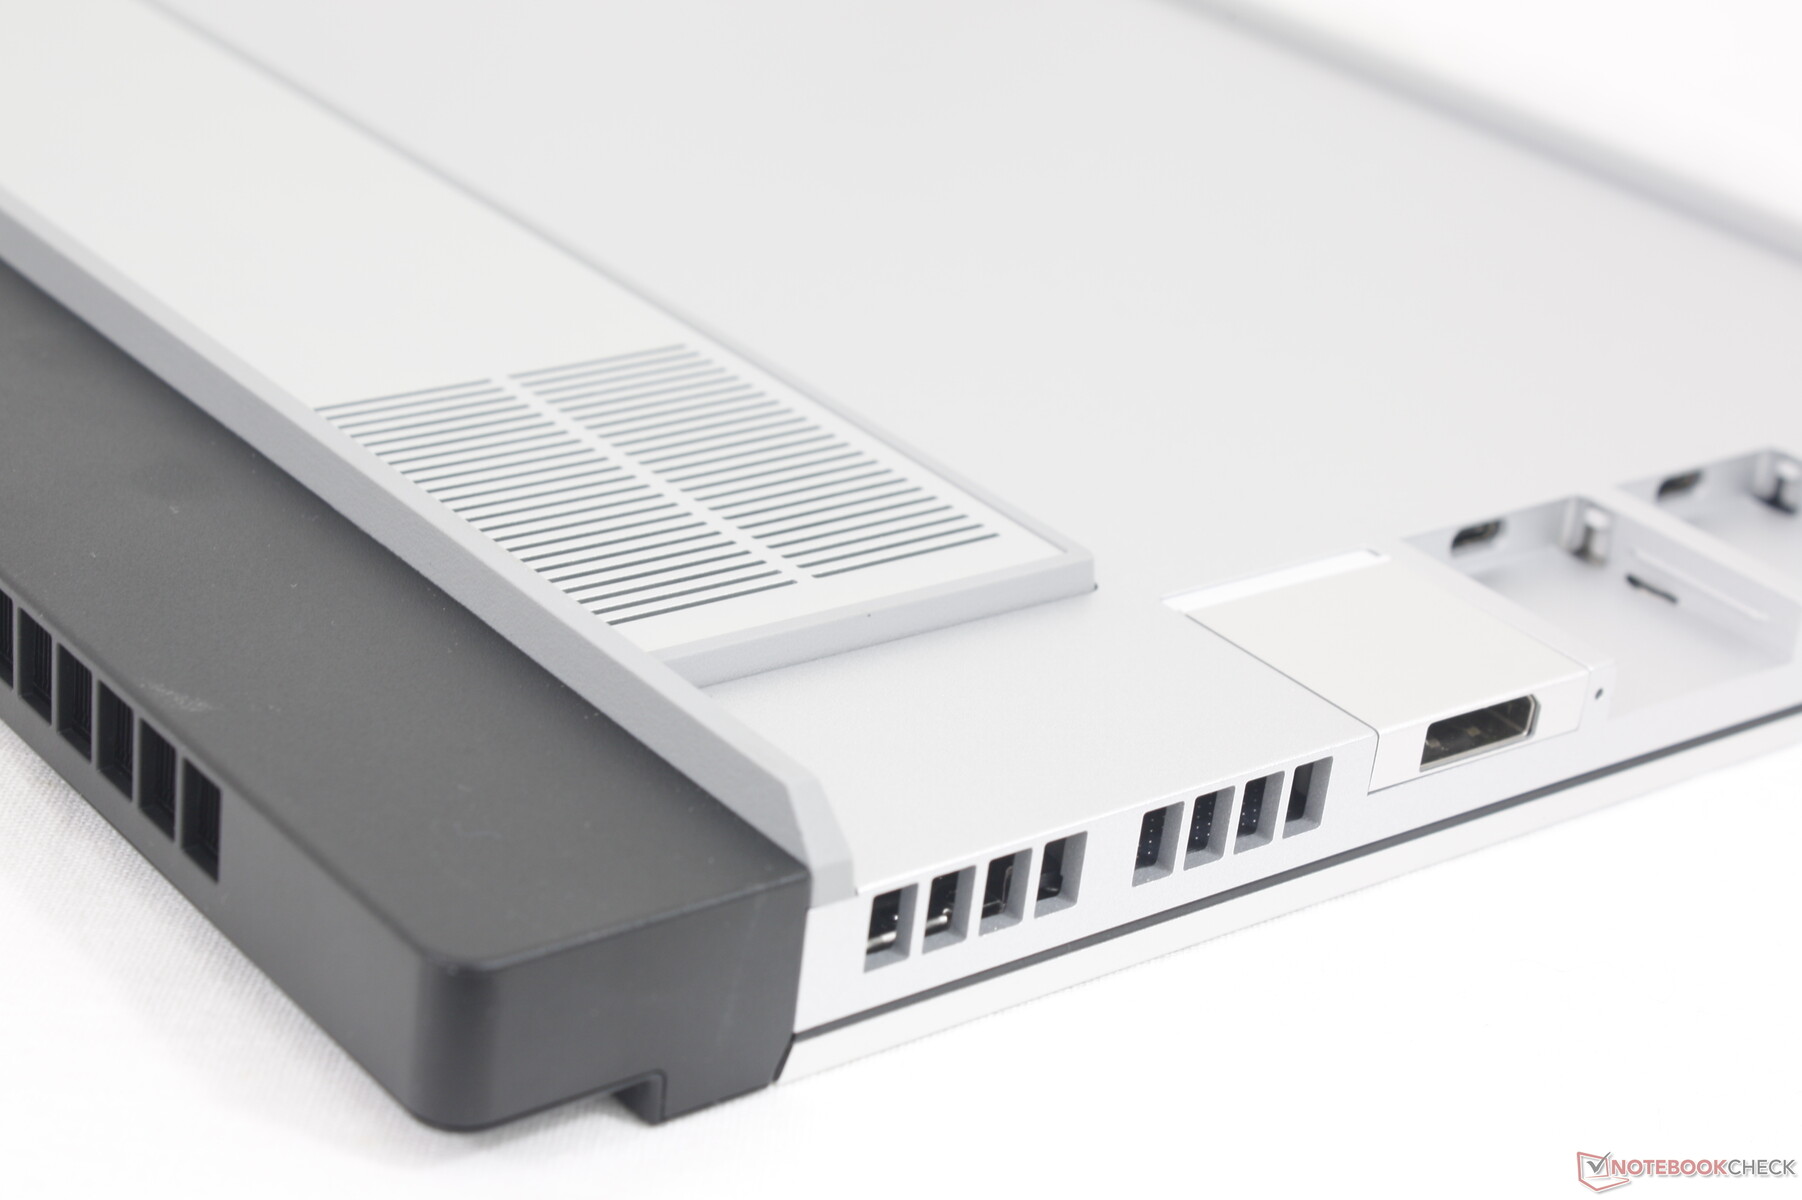
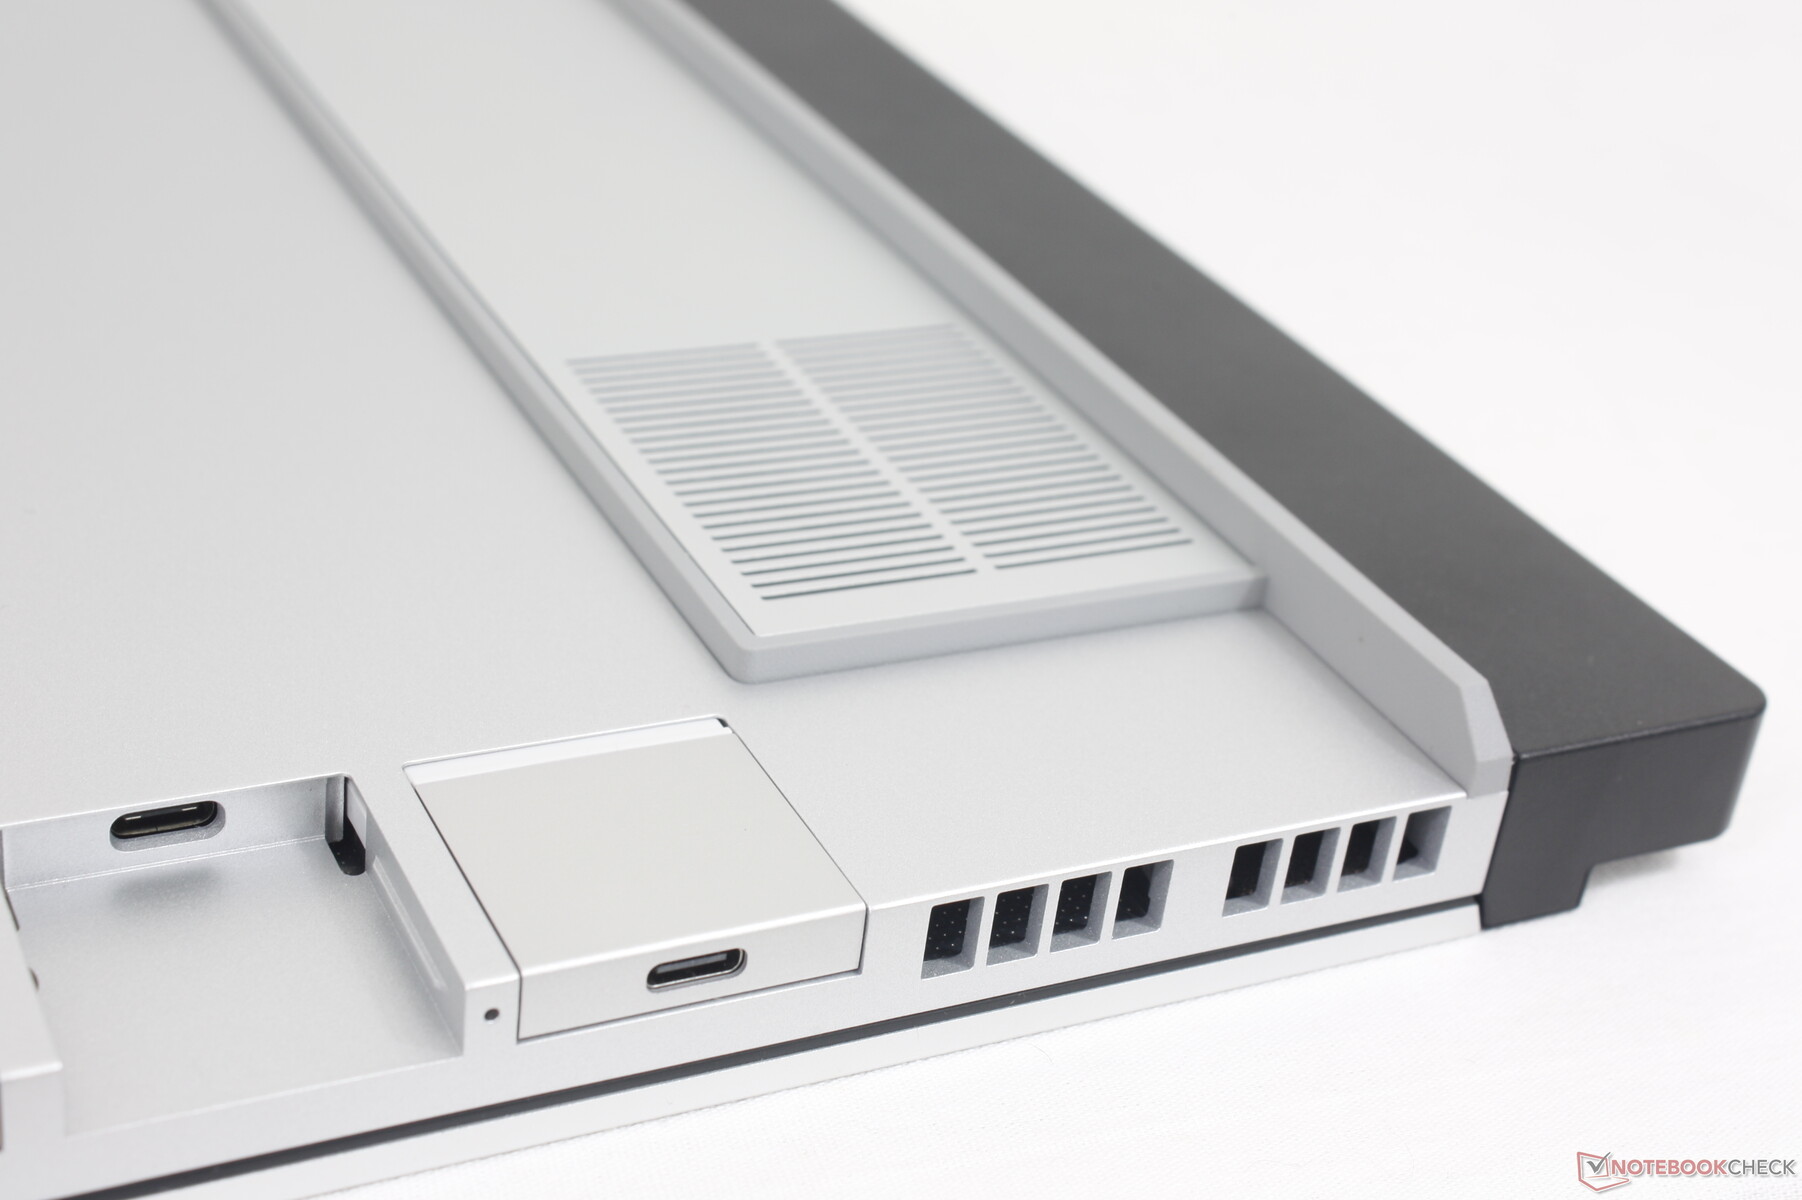
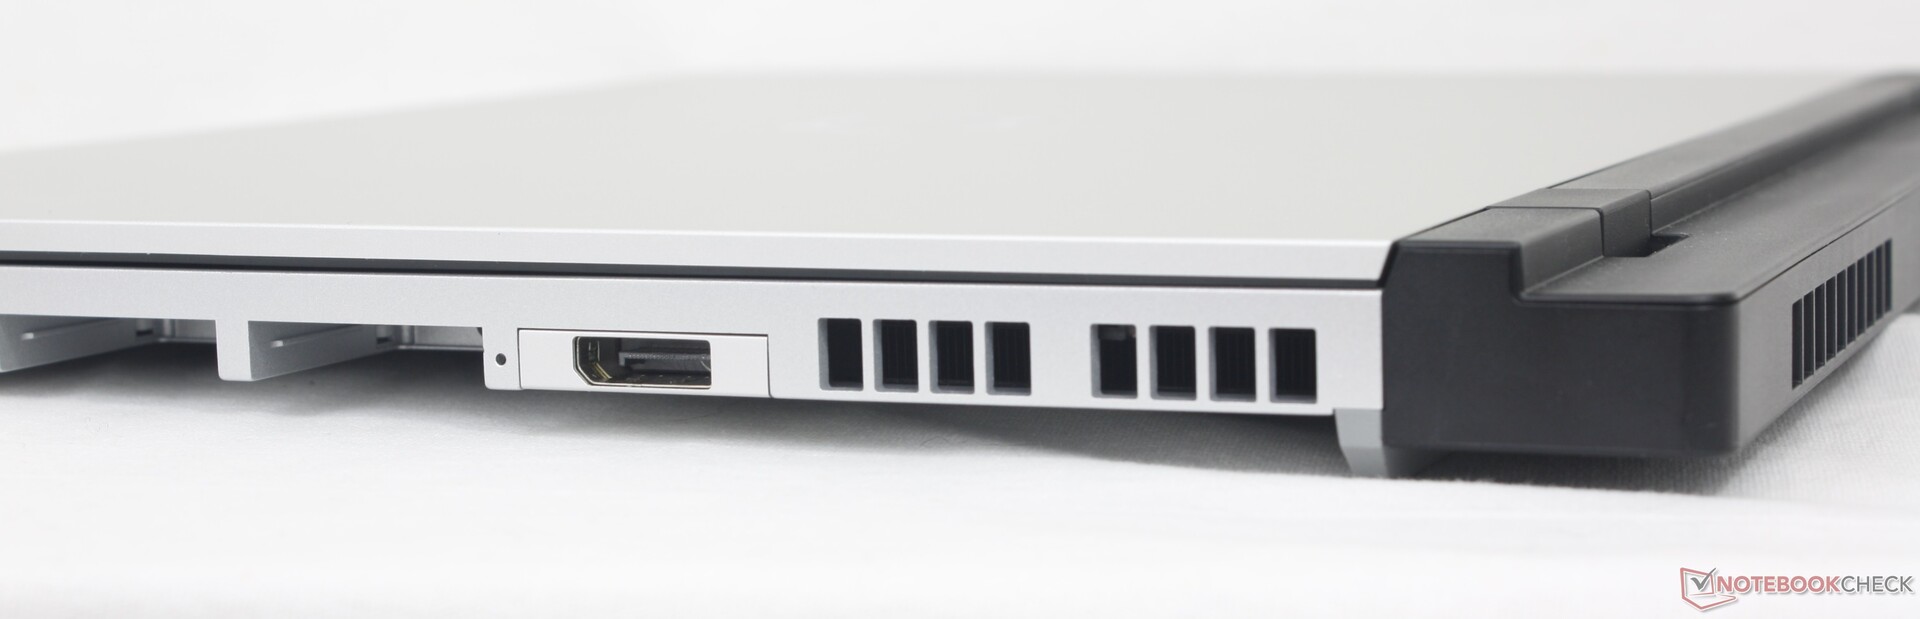
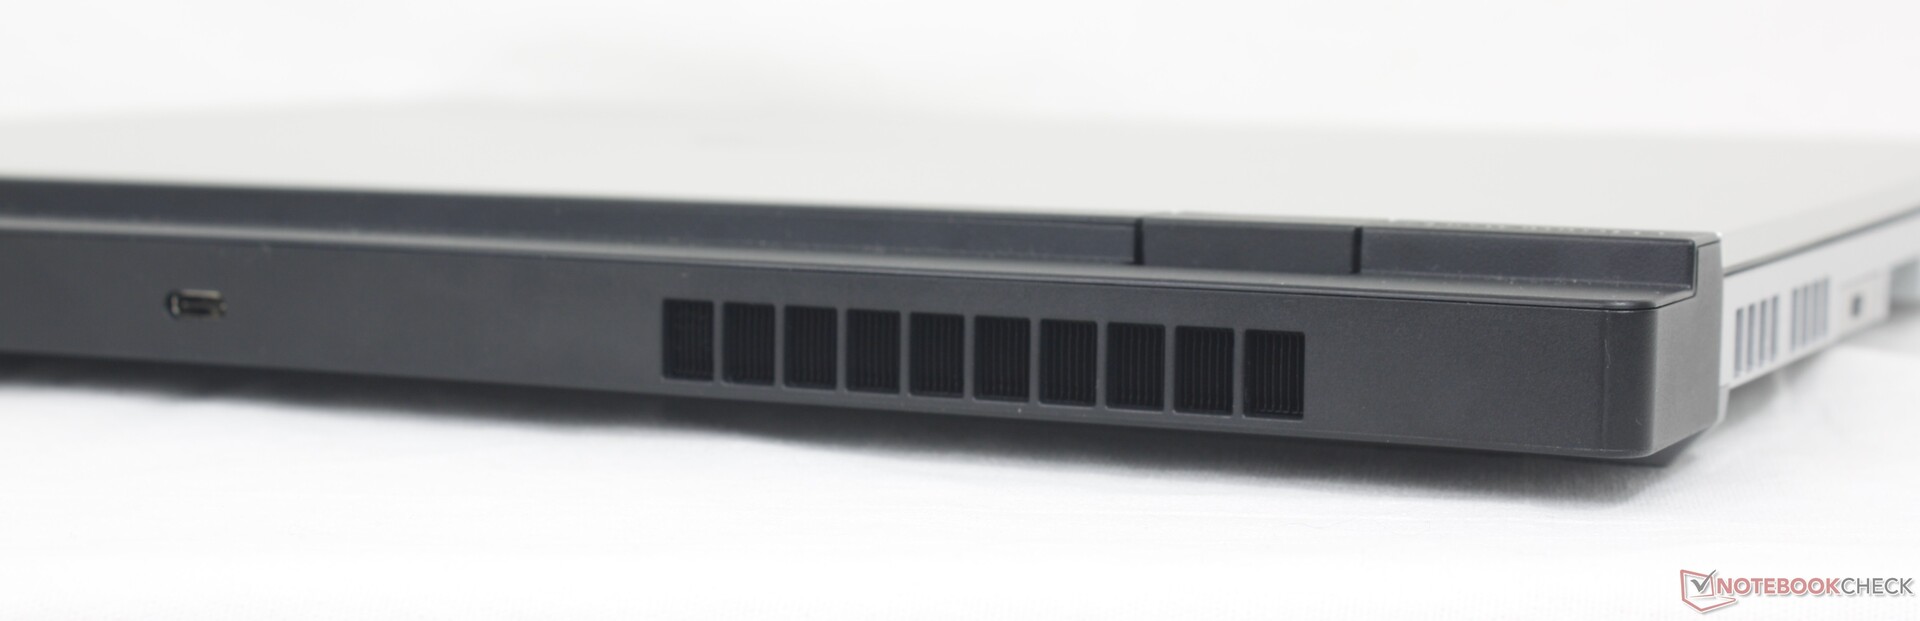
Connettività - Sei porte personalizzabili
Questo è l'unico portatile nella memoria recente a integrare un totale di sei porte USB-C e nient'altro - nemmeno un jack audio o un lucchetto Kensington. Tutte e sei le porte sono compatibili con la linea esistente di schede di espansione di Framework e quindi funzionano allo stesso modo di quelle del Laptop 13.5.
È importante notare che le sei porte USB-C non sono uguali, come mostra la nostra tabella qui sotto. Solo due sono USB4, tre sono compatibili con DP e quattro sono compatibili con l'adattatore USB-C AC. Non ci sono indicatori visivi per distinguere le porte.
| Slot per scheda di espansione # | Interfaccia | Compatibile con DisplayPort? | 240 W Compatibile con la ricarica USB-C? | USB-A Consumo di energia elevato? |
| 1 | USB4 | Y | Y | Y |
| 2 | USB 3.2 | N | Y | N |
| 3 | USB 3.2 | N | N | N |
| 4 | USB4 | Y | Y | Y |
| 5 | USB 3.2 | Y | Y | N |
| 6 | USB 3.2 | N | N | N |
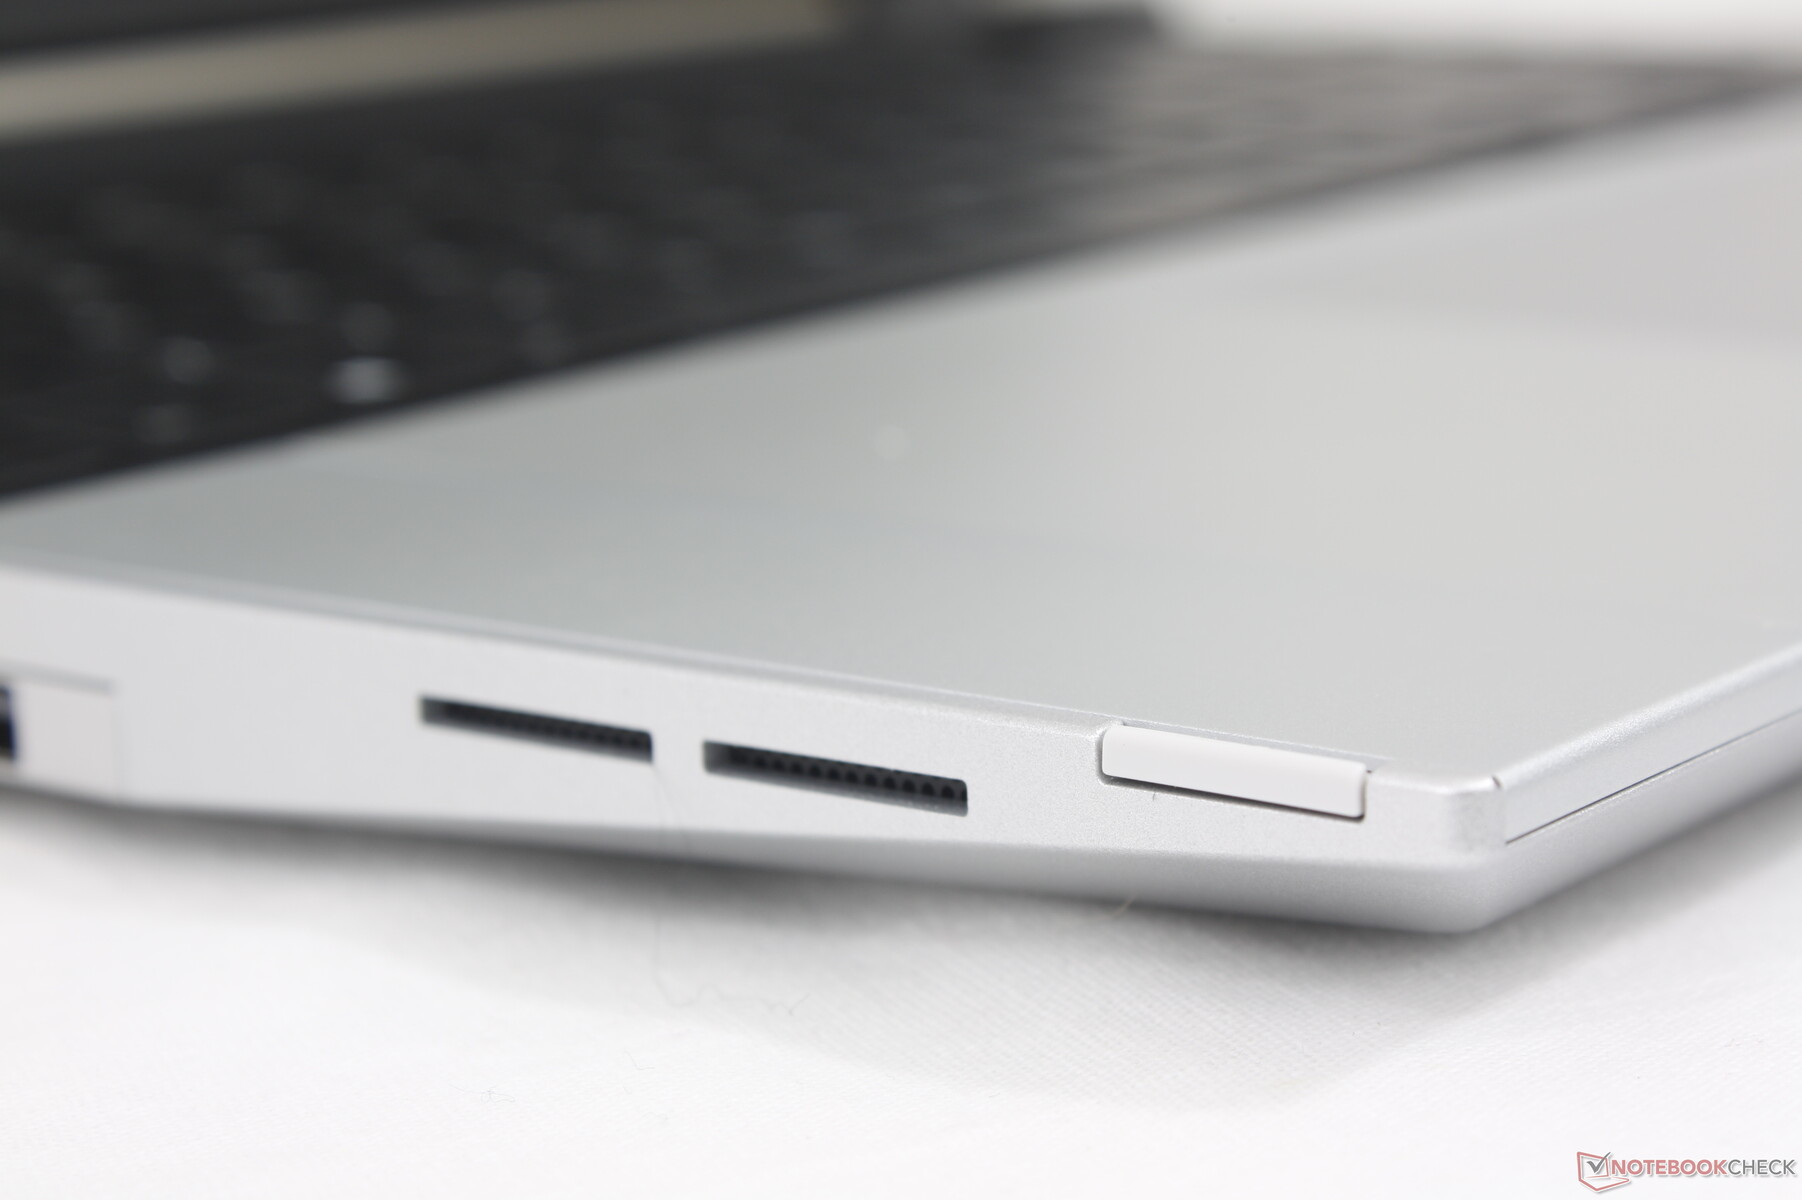
Inoltre, non ci sono ancora schede di espansione per i lettori SD full-size, WAN o RJ-45. Se queste porte sono importanti per lei, dovrà rivolgersi agli adattatori USB o alle docking station.
Una settima porta USB-C lungo il bordo posteriore diventa disponibile se è installato il modulo GPU discreto. Questa porta è compatibile con DP ma non con l'adattatore AC.
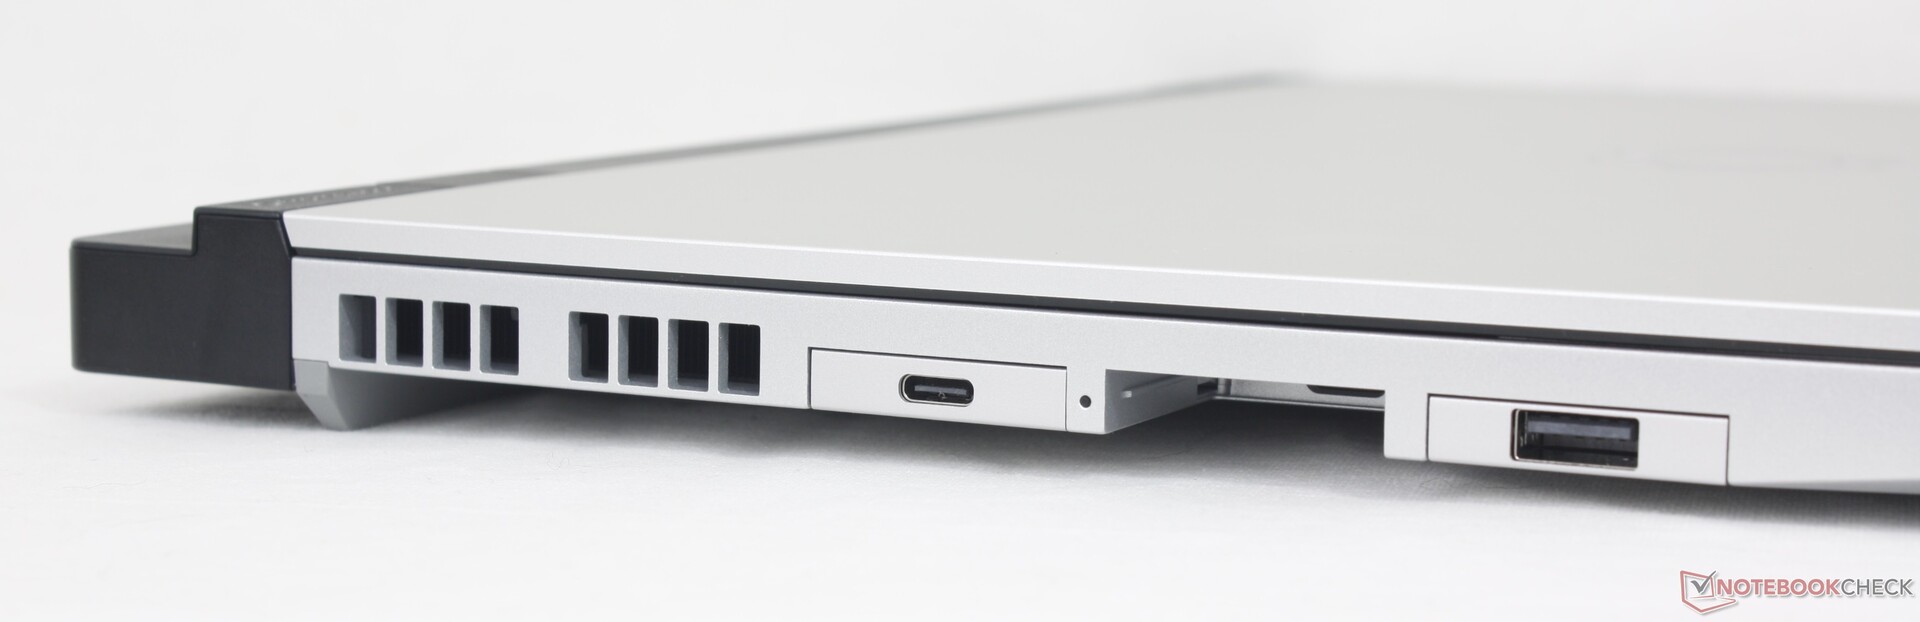
Lettore di schede SD
Il Laptop 16 utilizza lo stesso lettore di schede di espansione MicroSD presente sul Laptop 13.5 per ottenere velocità di lettura e scrittura simili. Con soli 80 MB/s circa, le prestazioni sono molto più lente rispetto ai lettori di schede dei modelli concorrenti come il ThinkPad Z16 Gen 2 o MacBook Pro 16.
Non abbiamo accesso alla scheda di espansione del lettore di schede SD del nostro Laptop 16 e quindi i dati relativi al Laptop 13.5 sono riportati di seguito al suo posto.
| SD Card Reader | |
| average JPG Copy Test (av. of 3 runs) | |
| MSI Prestige 16 B1MG-001US (Toshiba Exceria Pro SDXC 64 GB UHS-II) | |
| Apple MacBook Pro 16 2023 M3 Max (Angelbird AV Pro V60) | |
| Lenovo ThinkPad Z16 Gen 2 (Toshiba Exceria Pro SDXC 64 GB UHS-II) | |
| HP Spectre x360 2-in-1 16-f1075ng | |
| Framework Laptop 13.5 (AV Pro UHS-II V60) | |
| Dell Inspiron 16 Plus 7630 (AV Pro SD microSD 128 GB V60) | |
| maximum AS SSD Seq Read Test (1GB) | |
| Lenovo ThinkPad Z16 Gen 2 (Toshiba Exceria Pro SDXC 64 GB UHS-II) | |
| Apple MacBook Pro 16 2023 M3 Max (Angelbird AV Pro V60) | |
| MSI Prestige 16 B1MG-001US (Toshiba Exceria Pro SDXC 64 GB UHS-II) | |
| HP Spectre x360 2-in-1 16-f1075ng | |
| Framework Laptop 13.5 (AV Pro UHS-II V60) | |
| Dell Inspiron 16 Plus 7630 (AV Pro SD microSD 128 GB V60) | |
Comunicazione
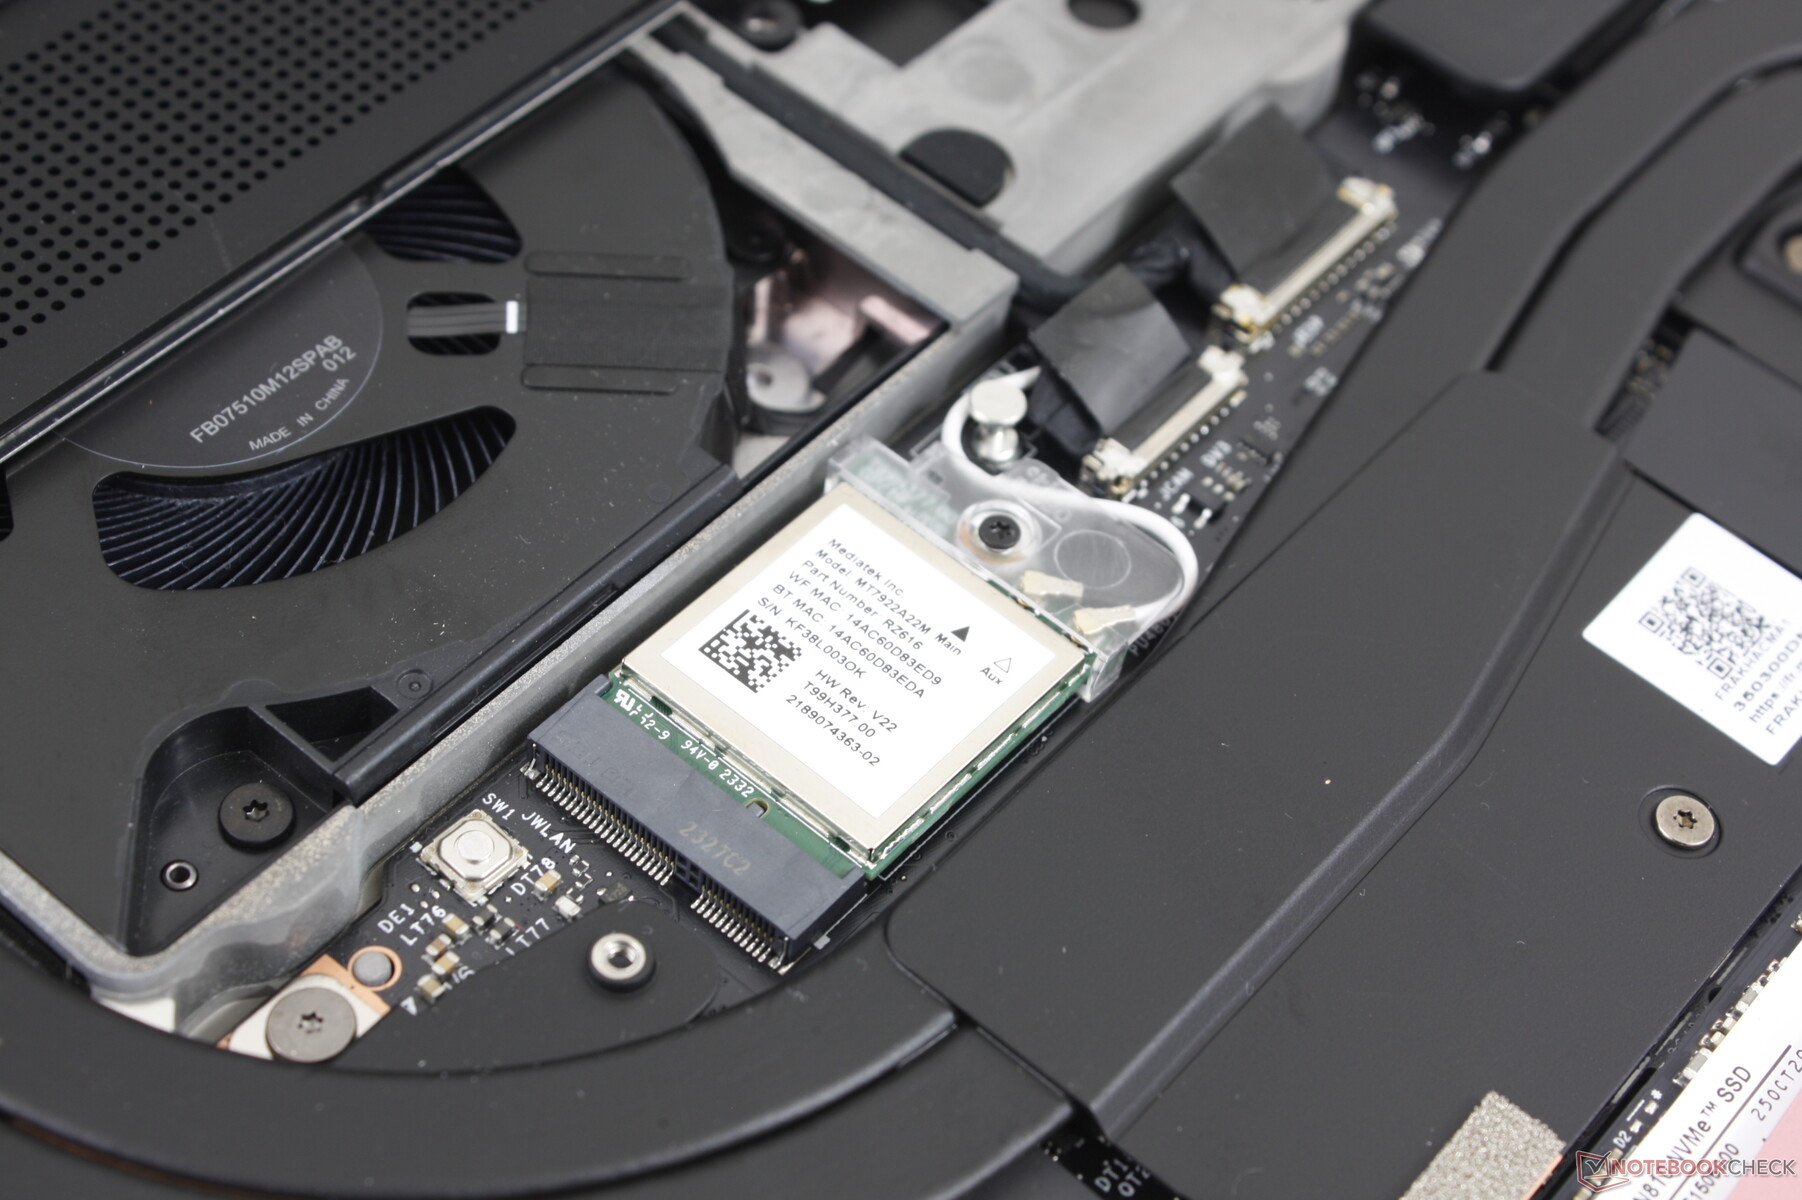
Il Wi-Fi 6 e 6E è fornito da un MediaTek MT7922 invece del solito AX211, in linea con il design Intel-free del modello. Abbiamo sperimentato connessioni costanti e affidabili quando è stato abbinato al nostro router di prova Asus AXE11000.
La rete WAN purtroppo non è supportata.
Webcam
Una webcam da 2 MP con IR e otturatore manuale è di serie, mentre i concorrenti, come le serie HP Spectre o Elite, sono stati forniti con webcam da 5 MP o superiori per oltre un anno. Speriamo che Framework possa offrire opzioni di webcam migliori in futuro.


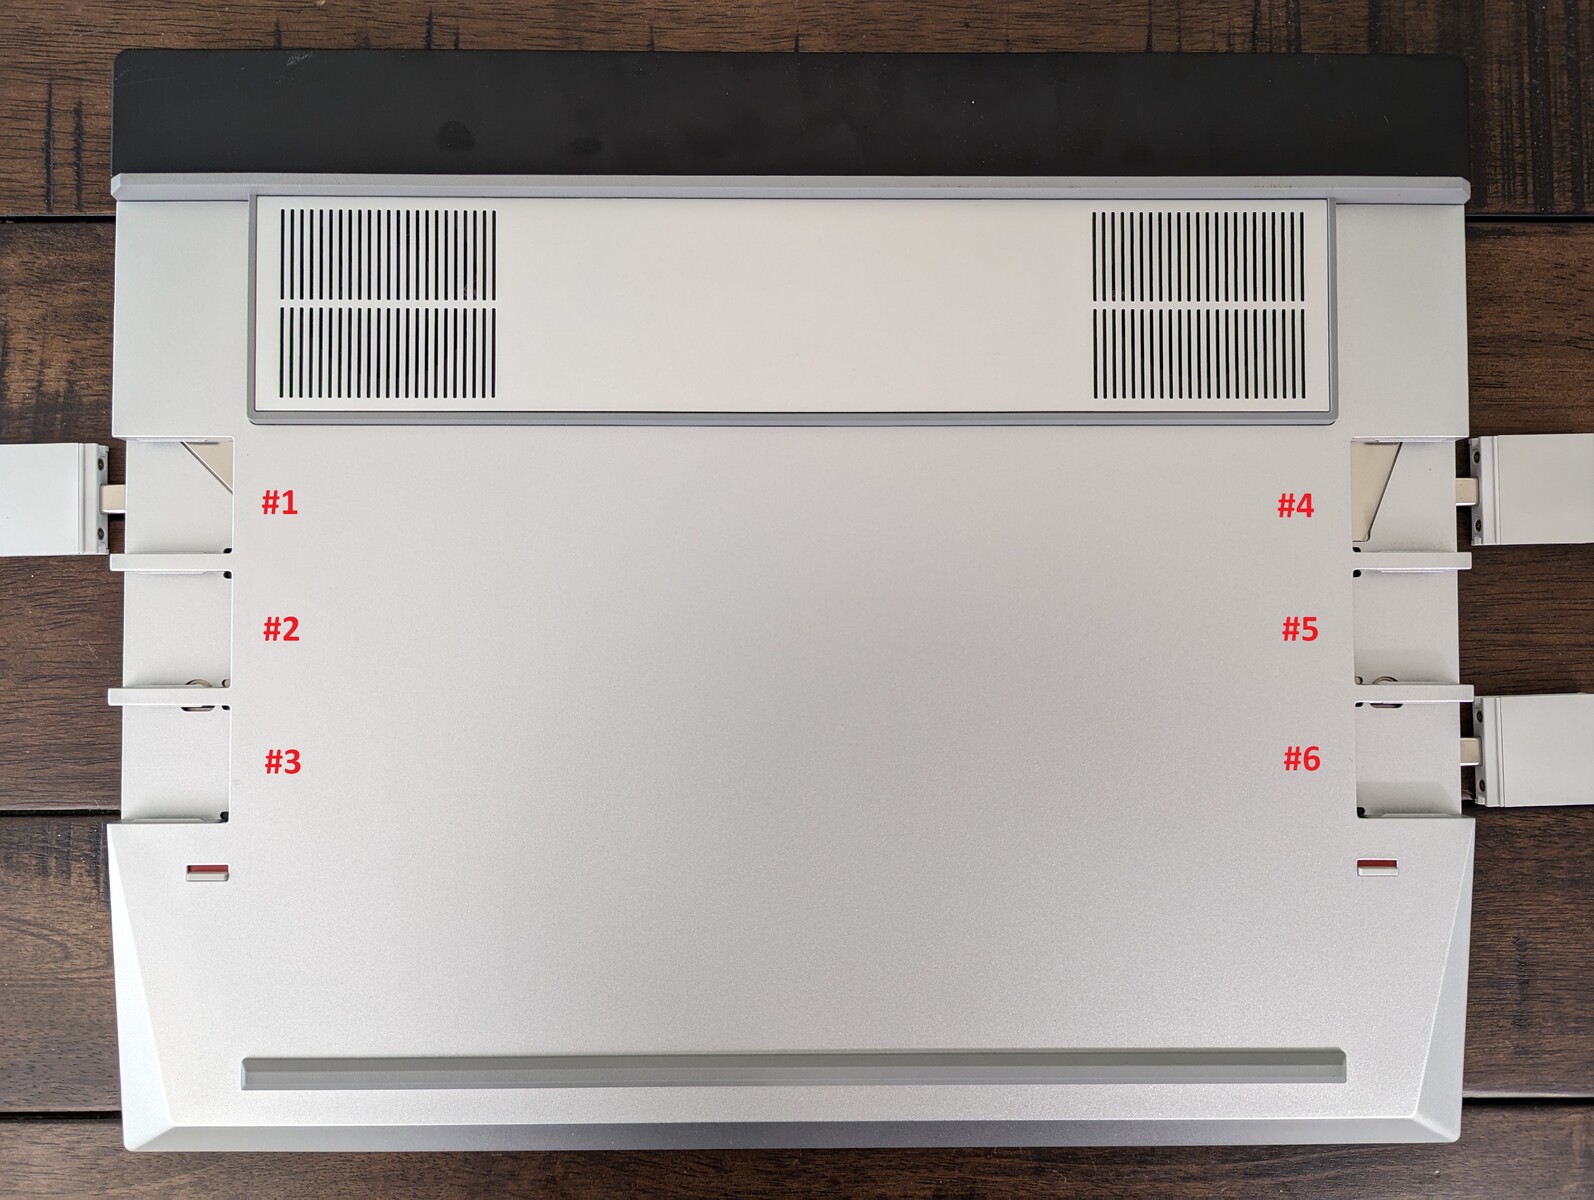
Accessori - Più opzioni della cintura di utilità di Batman
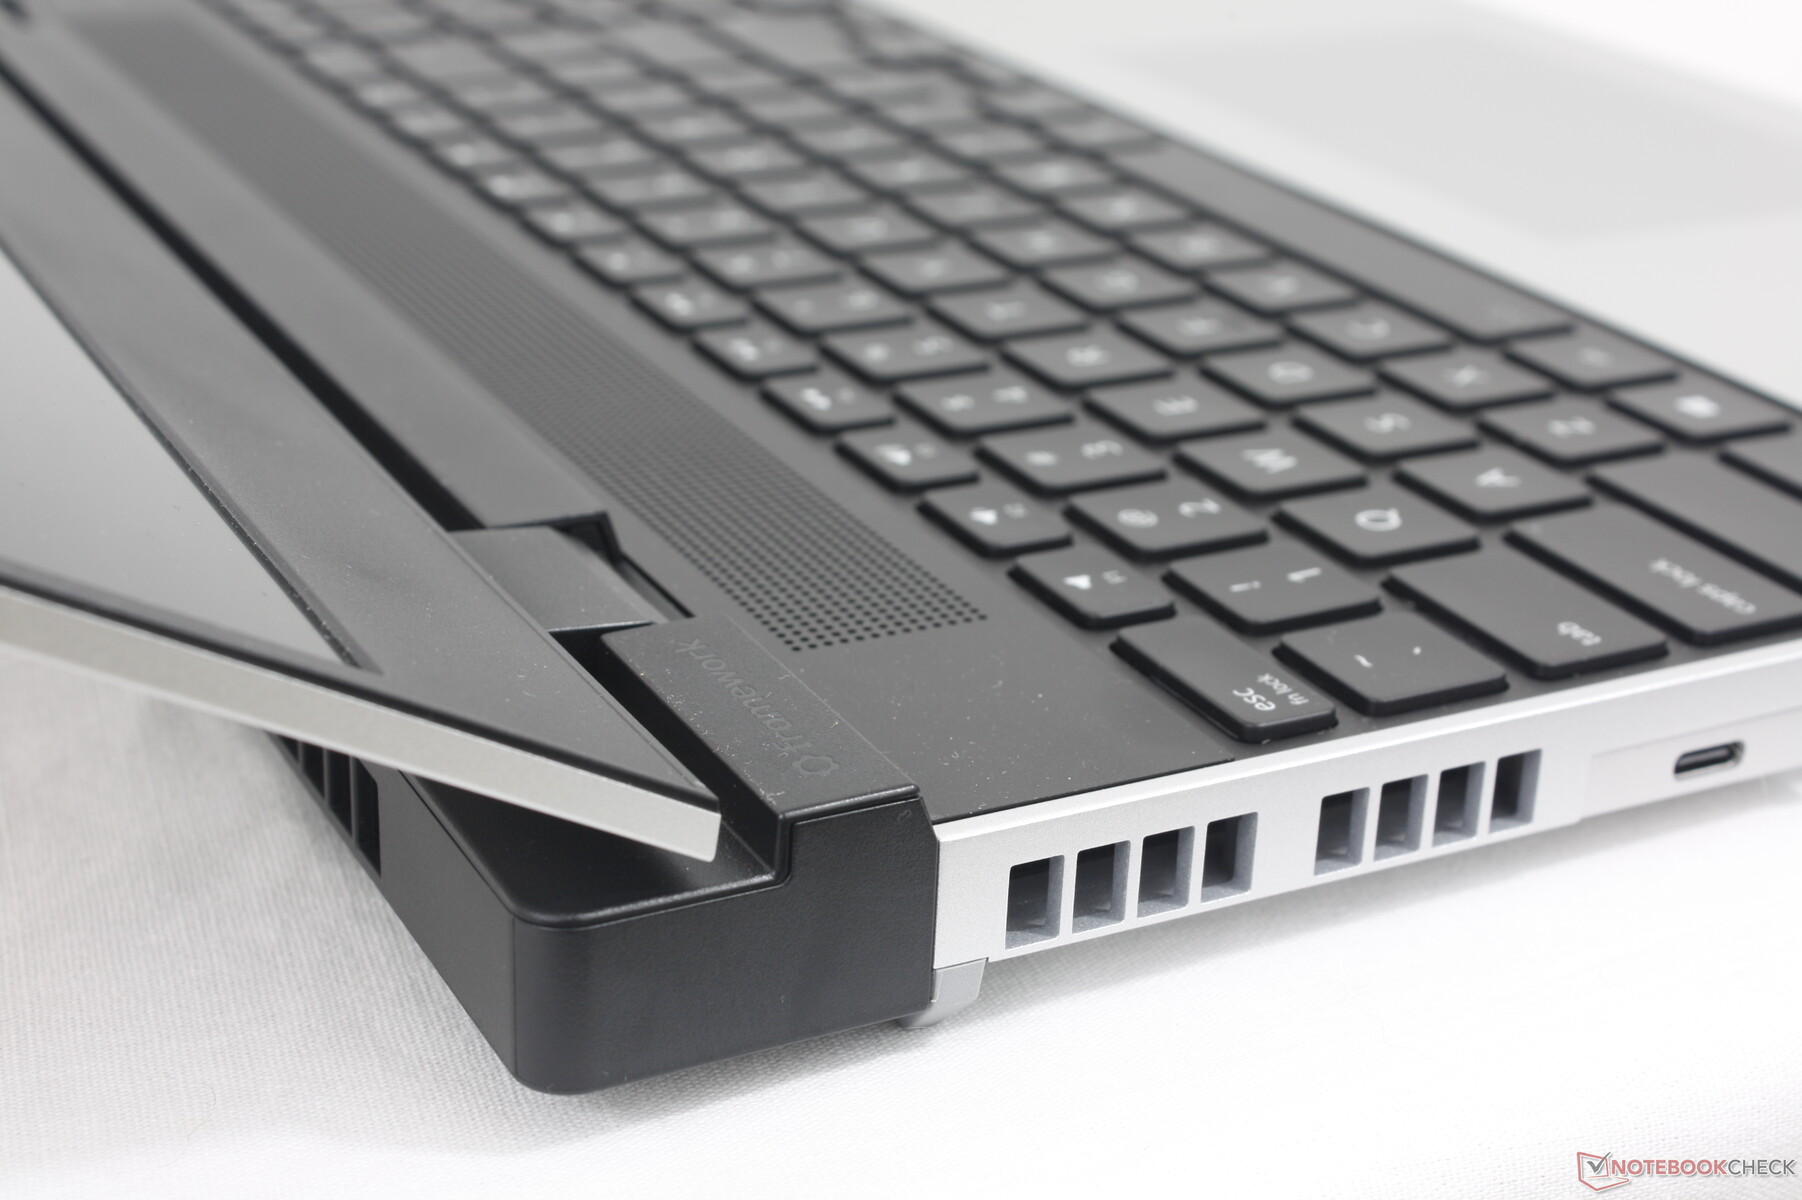
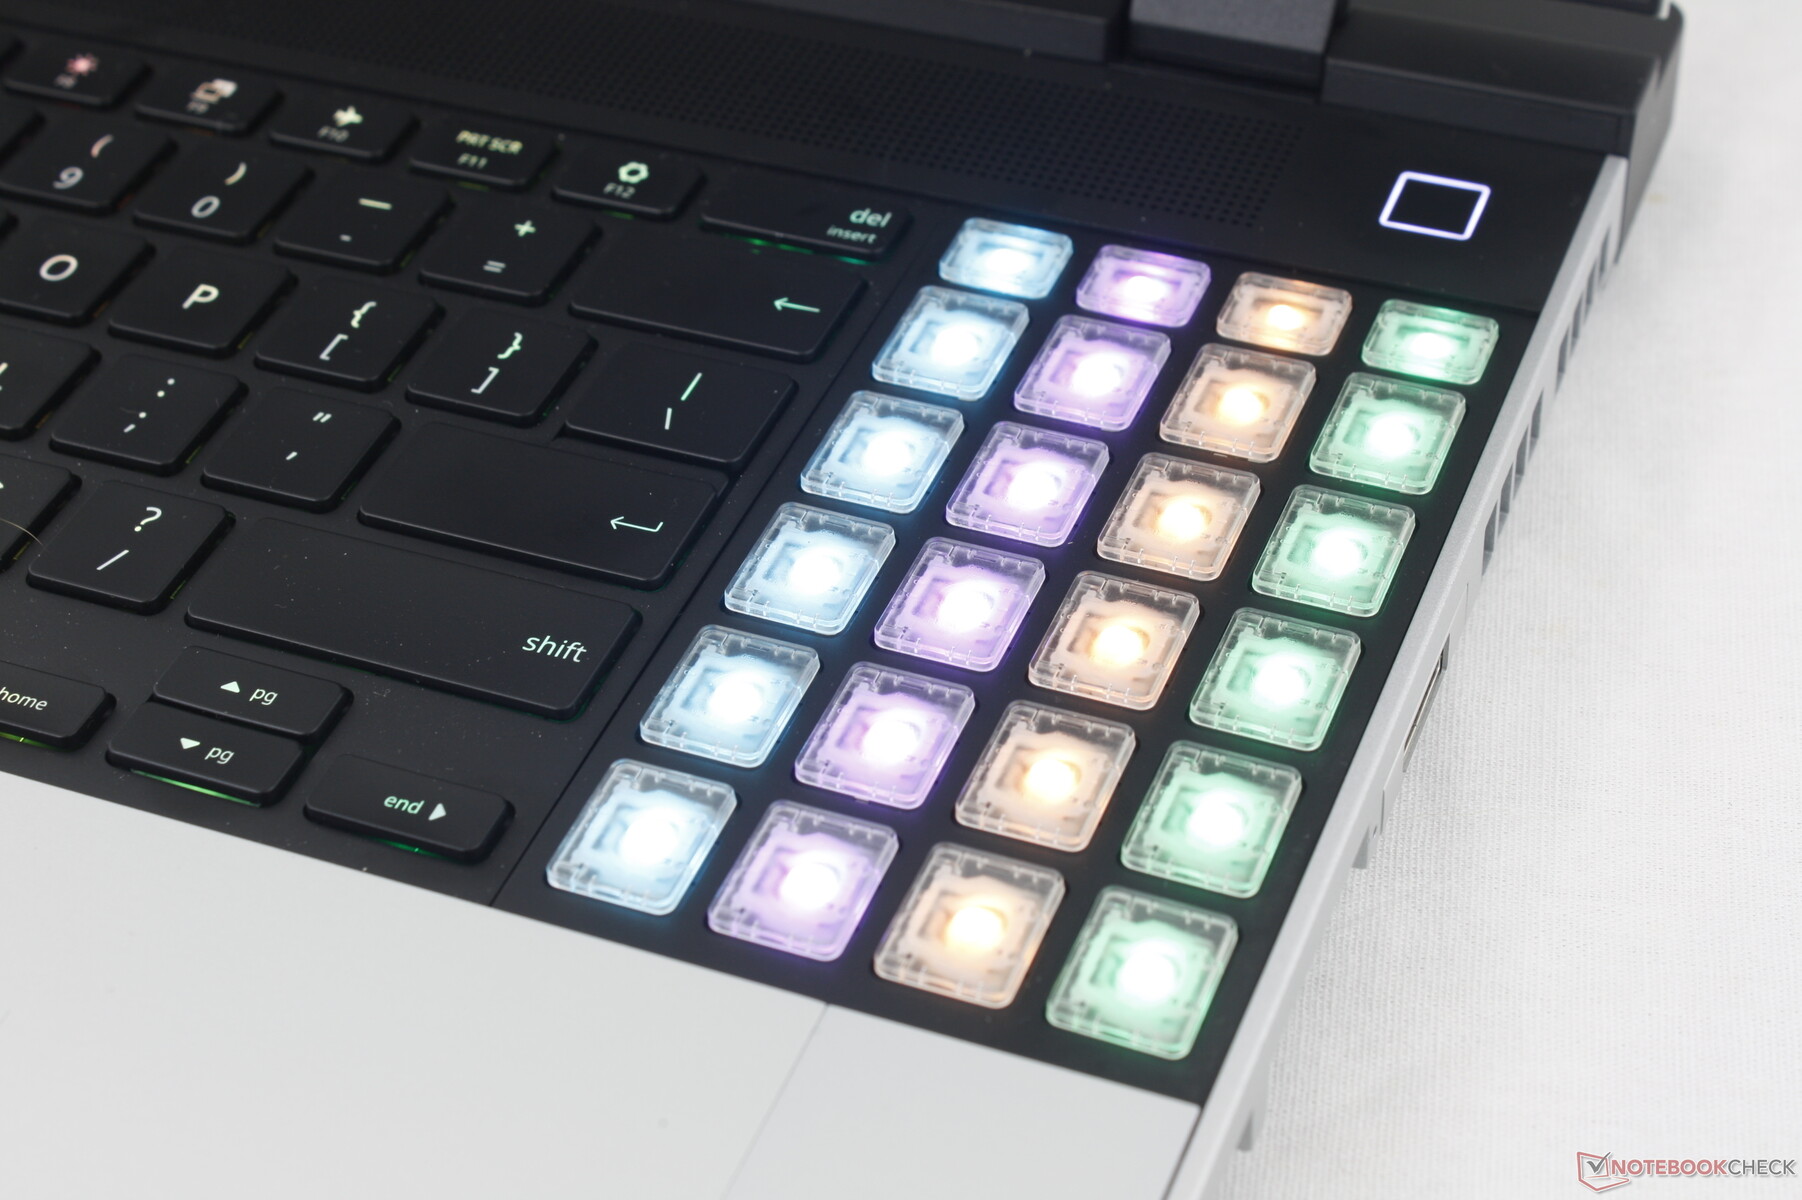
A differenza del tipico computer portatile, il Laptop 16 è probabilmente definito dai suoi accessori. I più importanti includono il modulo grafico discreto posteriore rimovibile, i moduli LED Matrix e il modulo Macropad RGB. Al momento è possibile scegliere solo una dGPU, ma è probabile che in futuro saranno disponibili altre opzioni.
Il Macropad RGB è un'opzione secondaria al tastierino numerico standard. I suoi input sono esattamente gli stessi di un normale tastierino numerico, ma i tasti sono visivamente diversi, in quanto sono trasparenti e con retroilluminazione RGB, mentre il tastierino numerico standard è stampato e ha solo una retroilluminazione bianca. I tasti chiari e colorati del Macropad possono interessare gli utenti hardcore o i giocatori che amano personalizzare gli input dei tasti.
Per quanto riguarda i moduli LED Matrix, questi sostituiscono i normali distanziatori e consistono in numerosi LED in una griglia simile a un pixel che può essere programmata per mostrare i livelli di durata della batteria, i testi scorrevoli, le notifiche o un orologio. I moduli LED Matrix non ci sono stati inviati per la recensione e quindi non li abbiamo testati personalmente.
Gli utenti che non desiderano i moduli dGPU o LED Matrix possono installare le coperture standard della piastra al loro posto. Questi coperchi vengono forniti con tutte le configurazioni del Laptop 16.
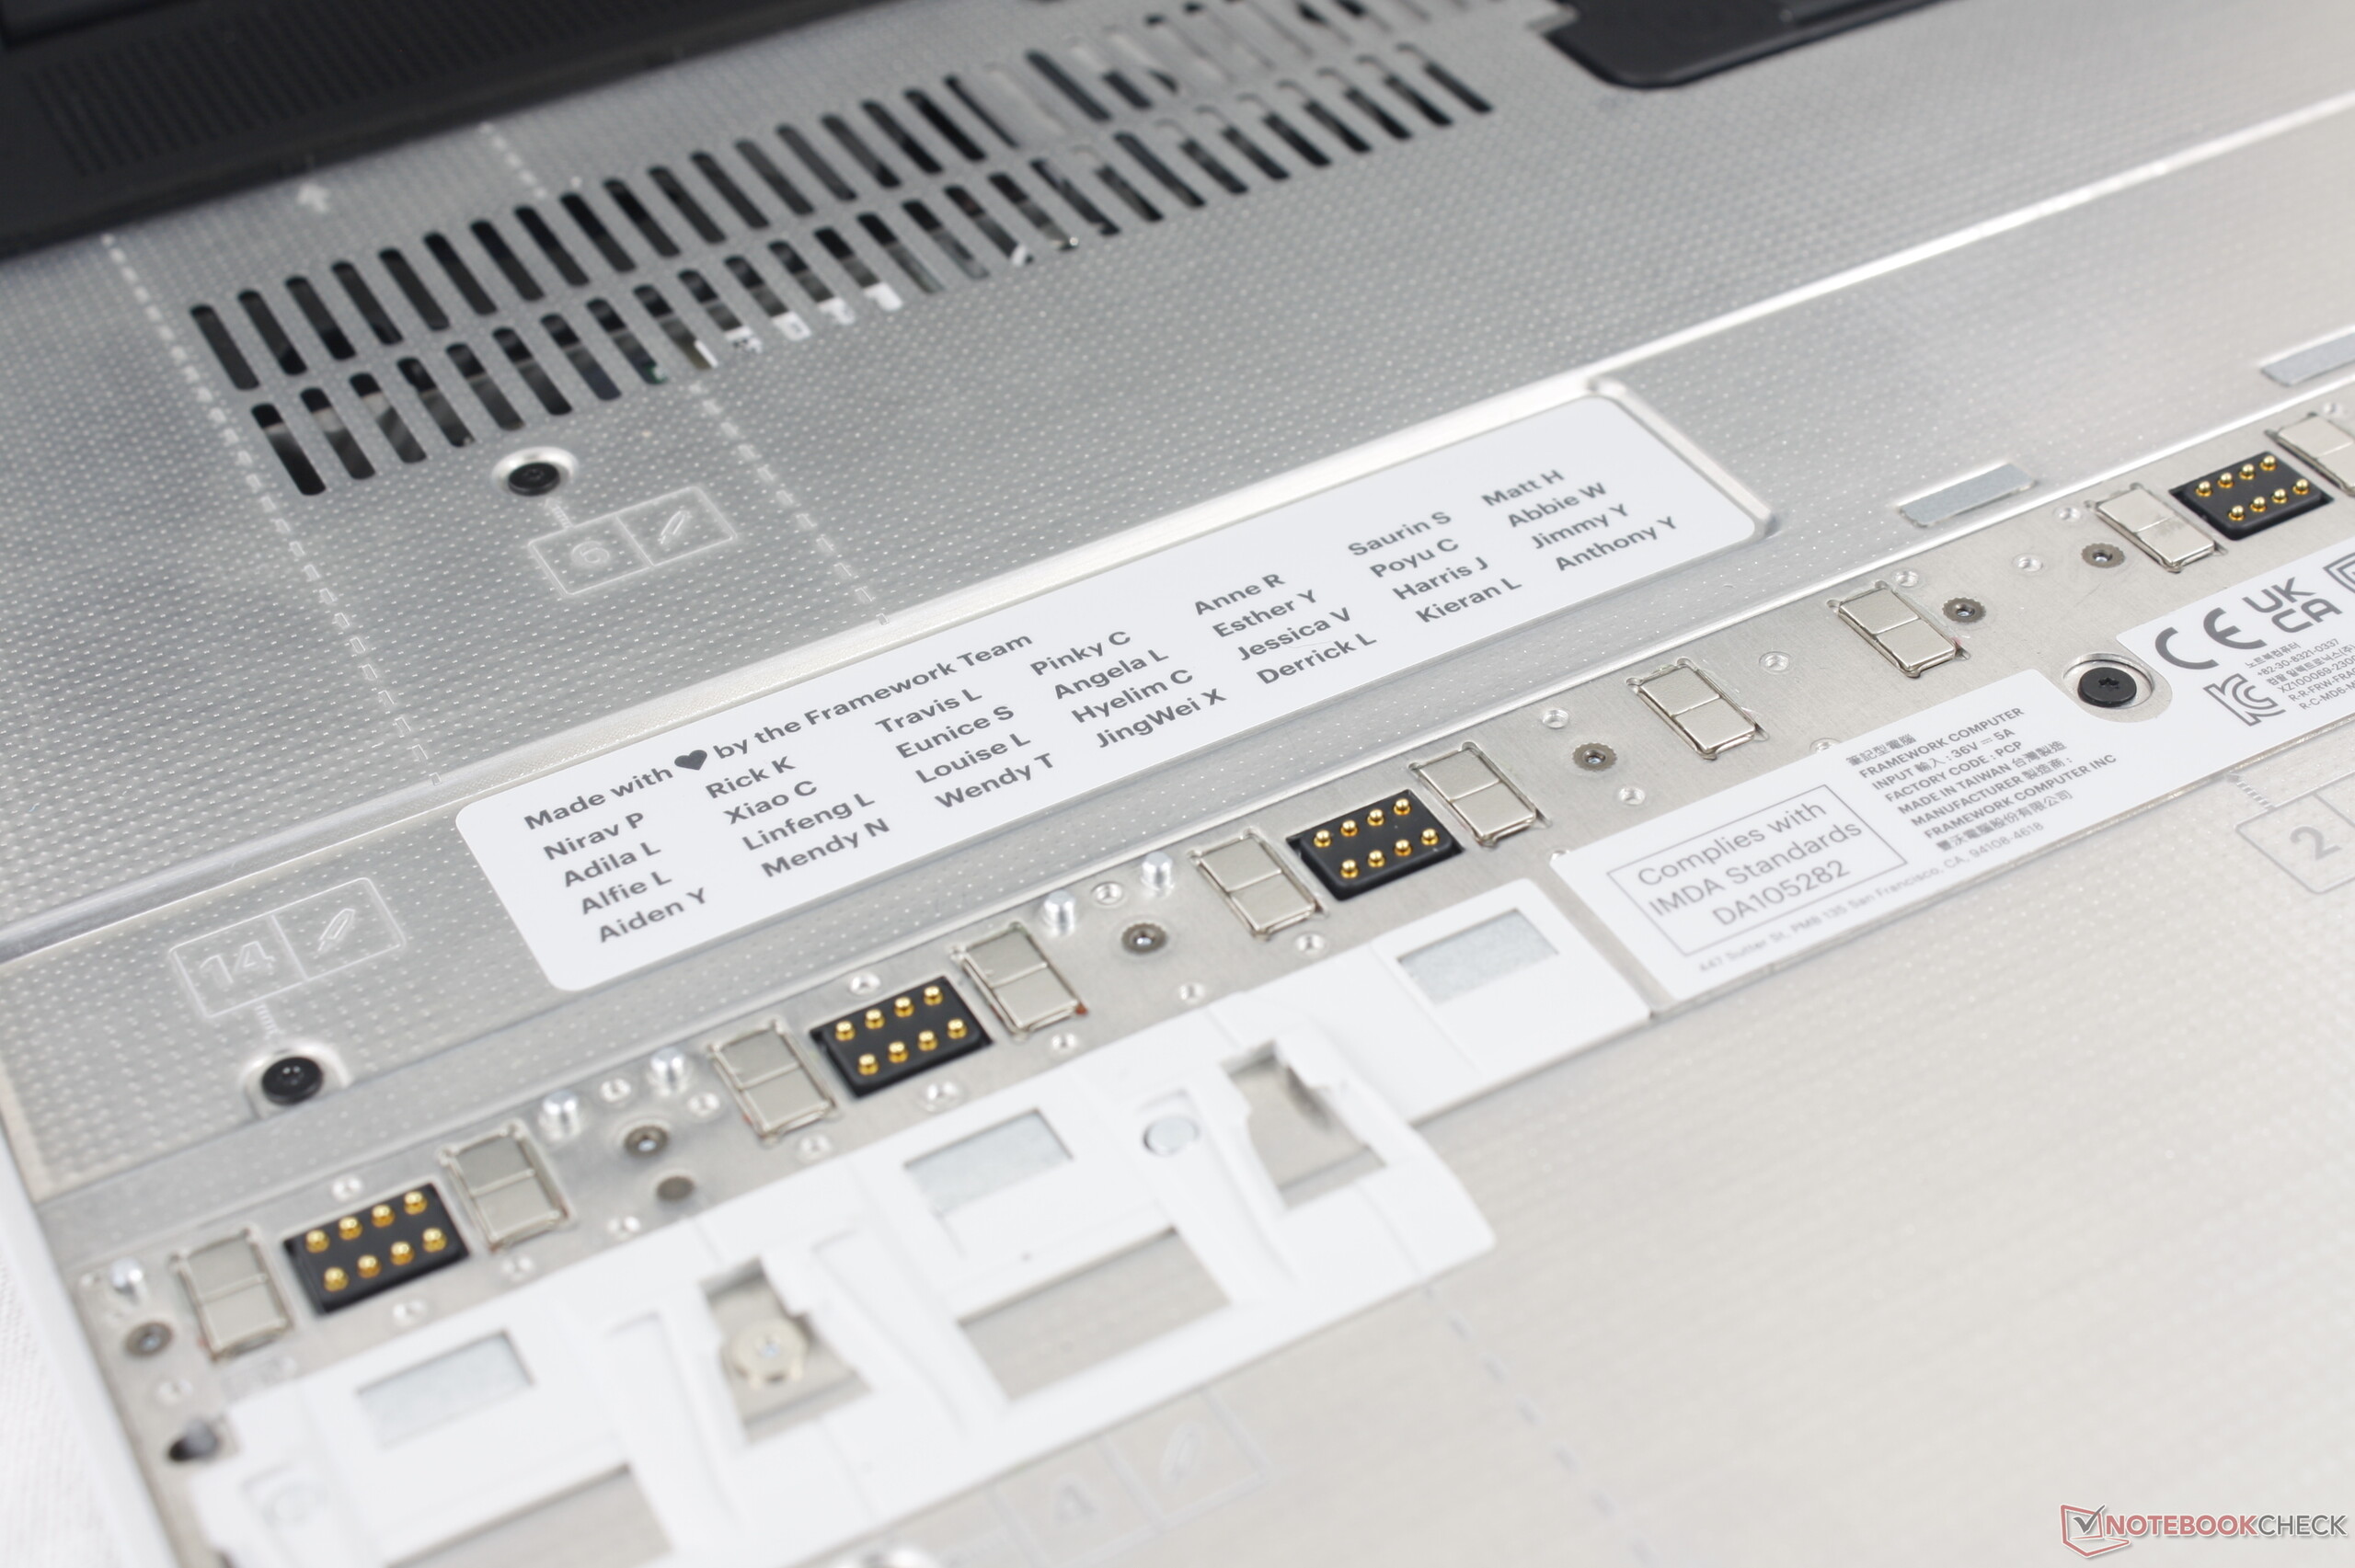
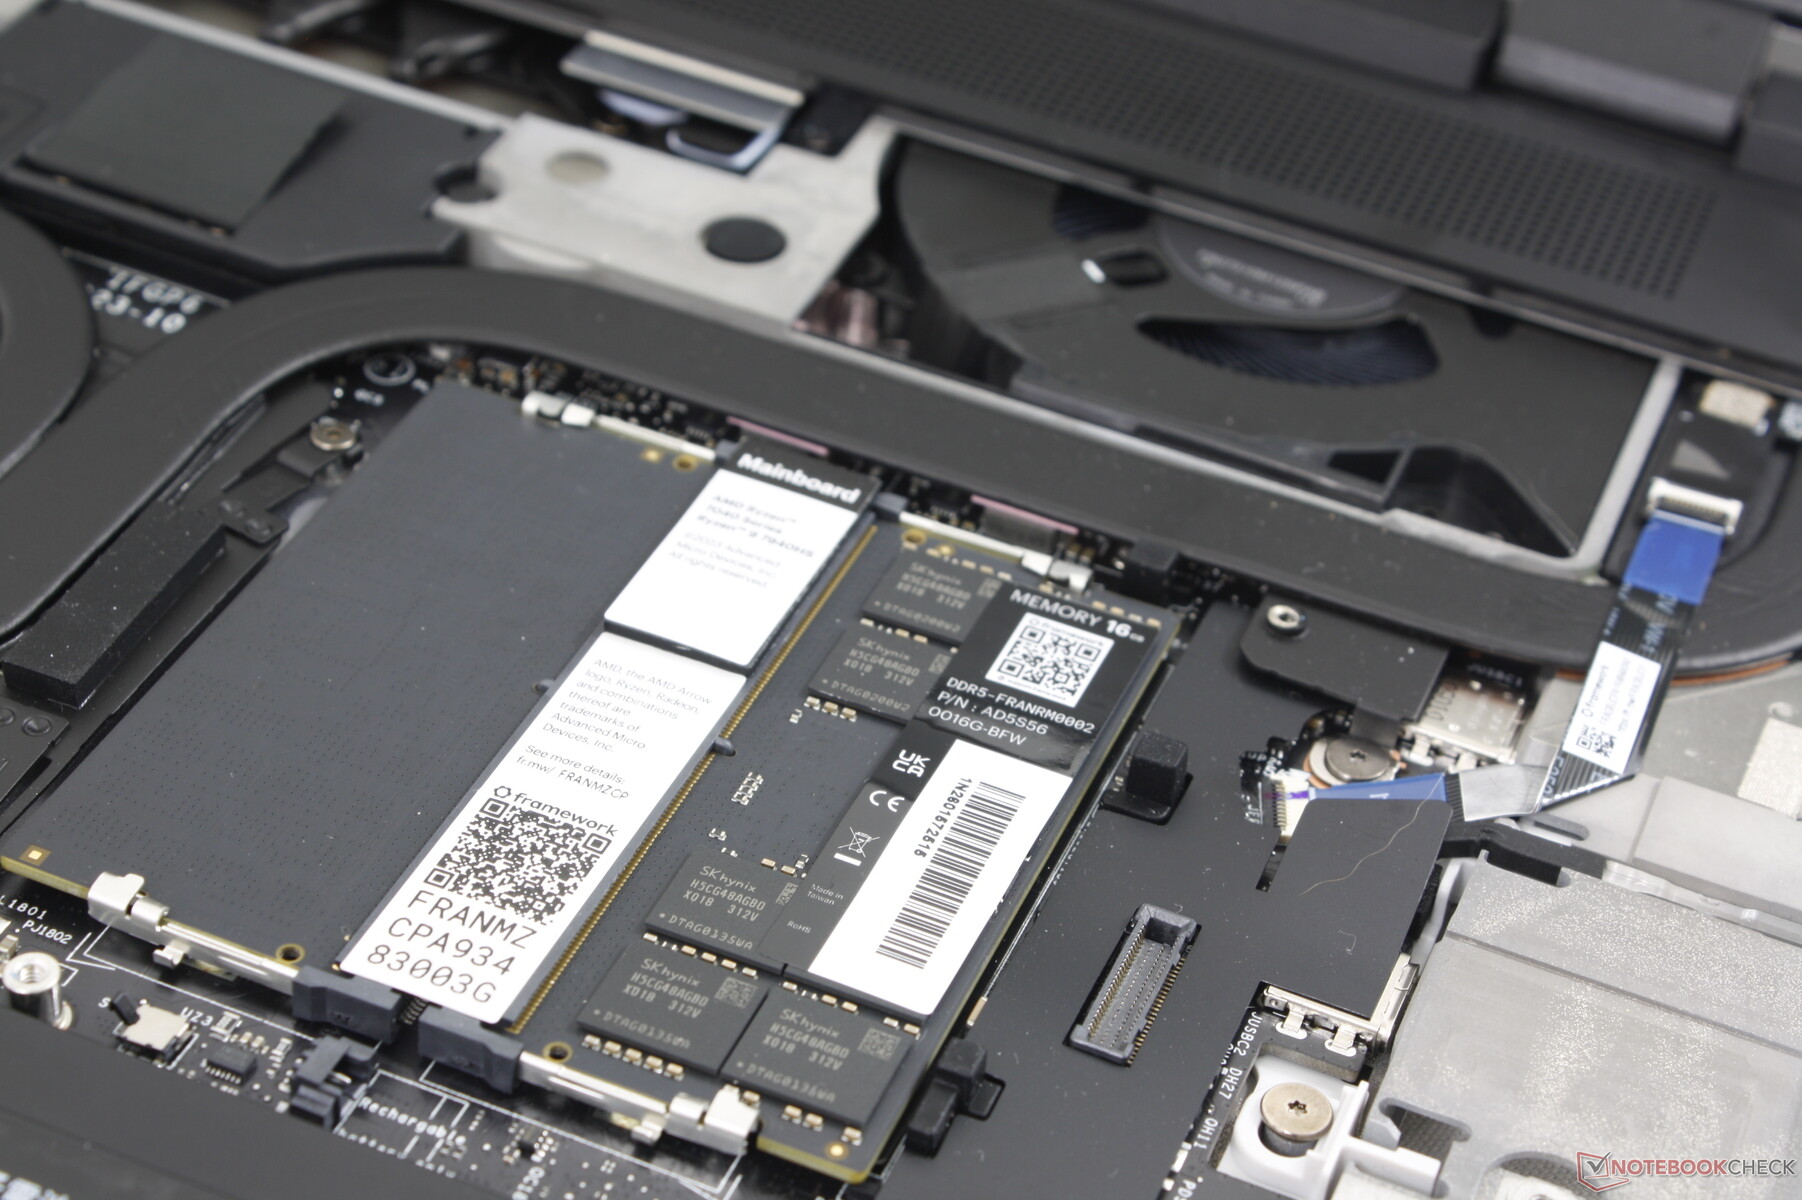
Al di là degli accessori, la maggior parte delle parti interne sono sostituibili e possono essere acquistate singolarmente dal produttore, compresa la scheda madre, proprio come nel Framework 13.5.
Manutenzione
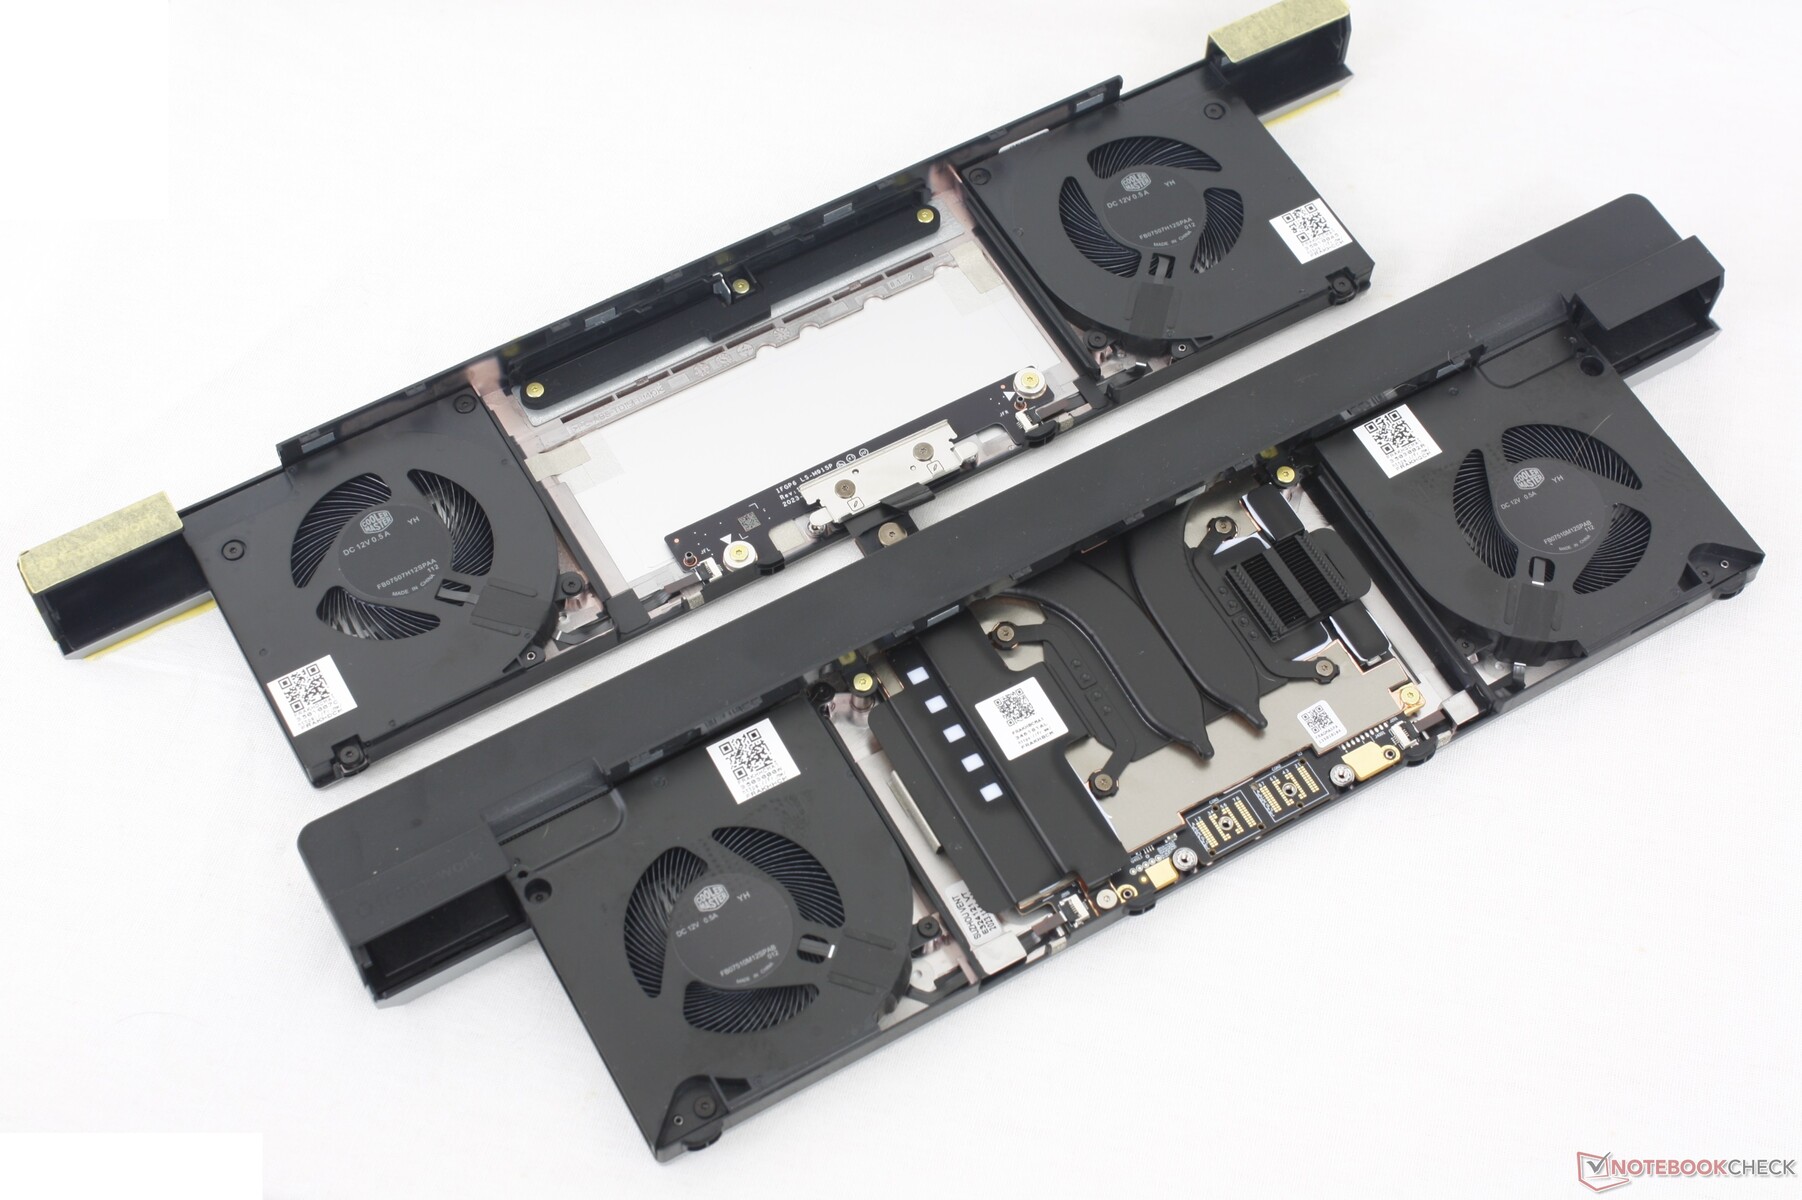
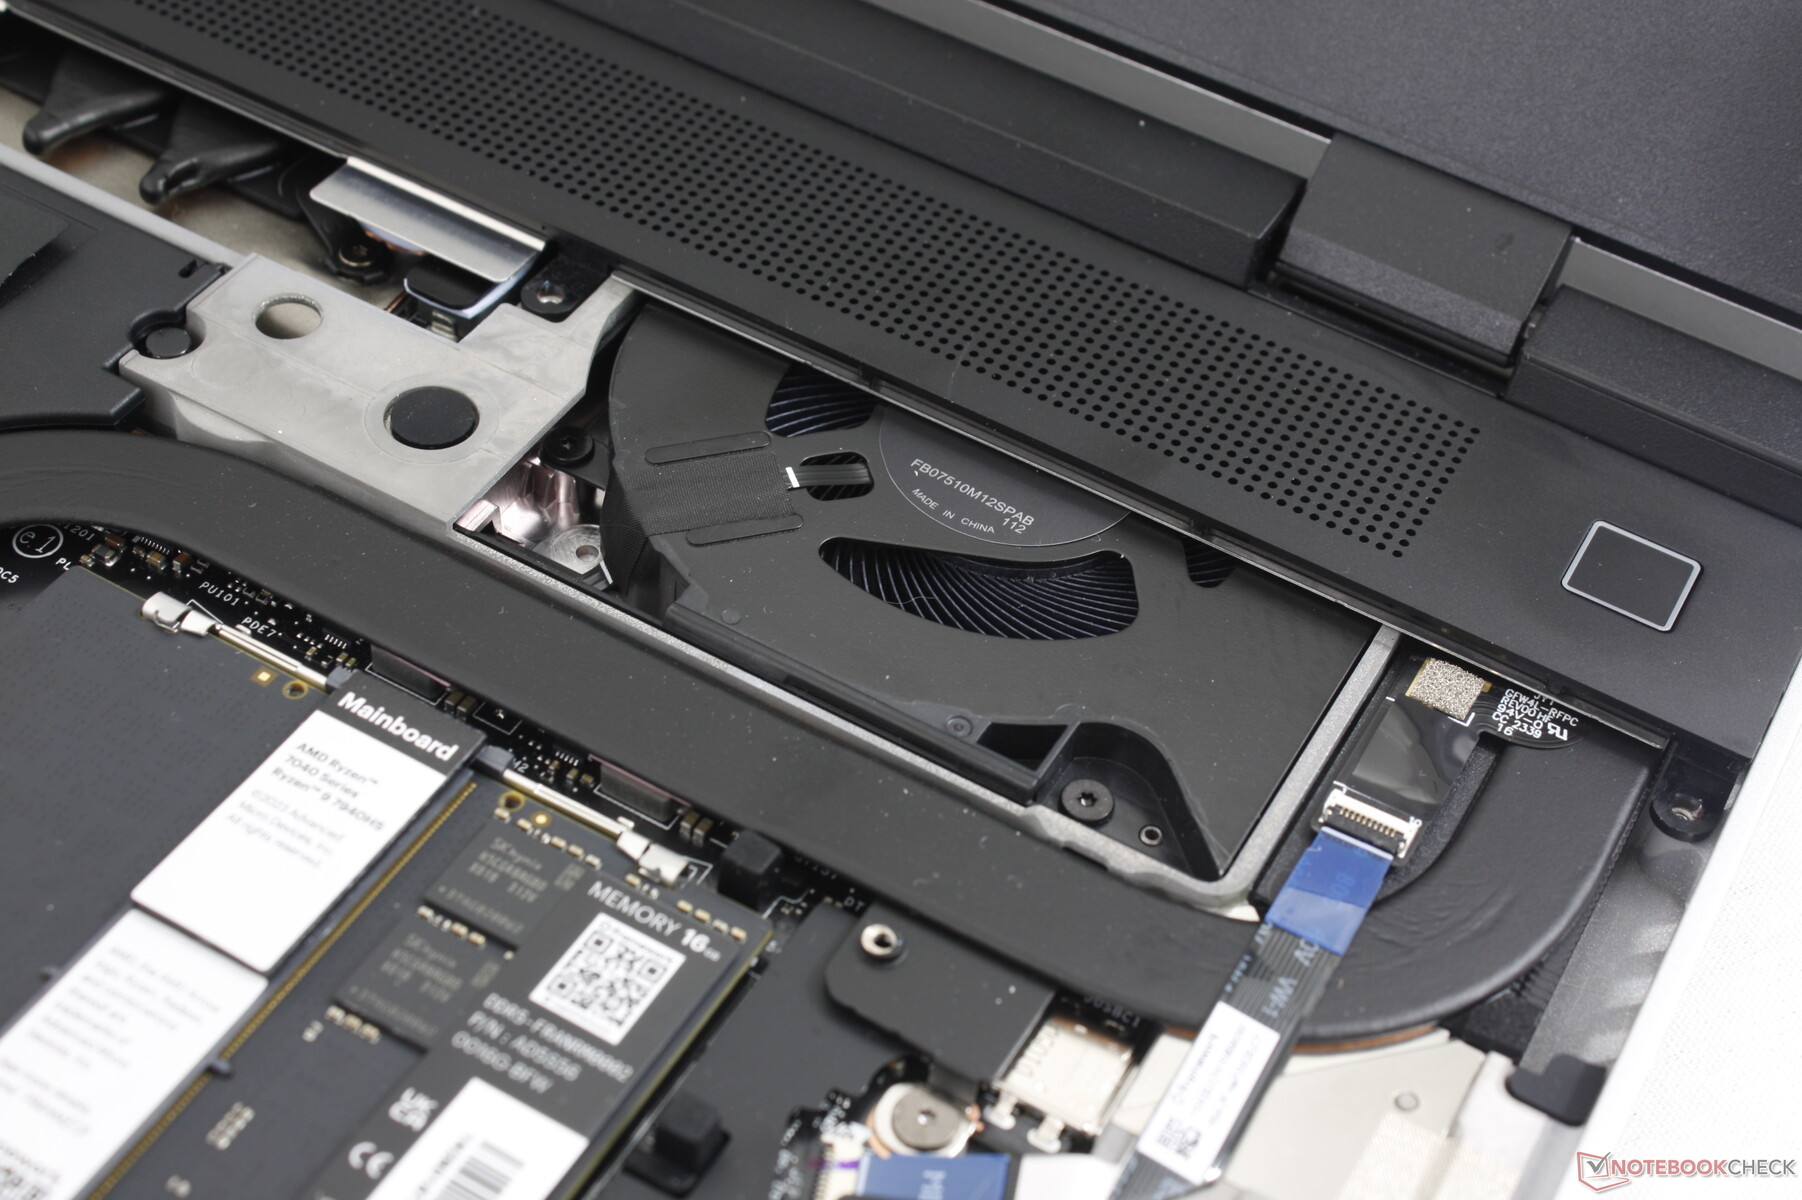
L'accesso alla scheda madre è più complesso del solito. Mentre per la maggior parte degli altri computer portatili è necessario rimuovere solo il pannello inferiore, il Laptop 16 richiede la rimozione della tastiera, del clickpad, di un cavo a nastro, di 15 viti Torx e di una piastra centrale in metallo per rivelare i componenti interni. Non è affatto difficile, ma il processo è leggermente più lungo rispetto a quello di un ThinkPad o EliteBook tradizionale.

Fortunatamente, Framework offre alcune delle guide alla riparazione più dettagliate e facili da seguire che abbiamo visto da qualsiasi produttore di laptop, per rendere la manutenzione un gioco da ragazzi. Consigliamo vivamente di consultare l'ampia pagina di assistenza ufficiale di https://frame.work/laptop-16-support#customize-your-laptopche copre tutto dai semplici aggiornamenti di RAM e SSD alla sostituzione della scheda madre e all'installazione del modulo dGPU. Non è necessario riscrivere l'intero processo di manutenzione, ma le procedure hanno una curva di apprendimento leggermente più alta rispetto al Laptop 13.5, a causa della complessità della nuova dGPU rimovibile e dei moduli di ingresso più grandi.
Sebbene molti dei moduli siano magnetici, è comunque necessario un cacciavite per installare la dGPU posteriore e alcuni moduli devono essere installati in un determinato ordine. Il modulo posteriore, in particolare, non è plug-and-play, in quanto il sistema deve essere spento e la tastiera e il clickpad devono essere prima rimossi. La buona notizia è che basta smontare e rimontare il sistema una sola volta prima che le procedure di manutenzione diventino una seconda natura. Framework incoraggia addirittura questo aspetto spedendo la tastiera e il clickpad staccati, il che costringe effettivamente l'utente a imparare il funzionamento di alcuni moduli prima di accendere il portatile per la prima volta.
L'uso di magneti e di chiusure per i moduli del touchpad è un approccio intuitivo alla manutenzione. Speriamo di vedere ampliato questo aspetto fino al punto in cui tutti i moduli e gli aggiornamenti potranno essere eseguiti senza l'ausilio di attrezzi.
Garanzia
La garanzia limitata standard di un anno del produttore si applica se l'acquisto avviene negli Stati Uniti. La protezione copre il computer portatile oltre alle sue parti e ai suoi moduli.
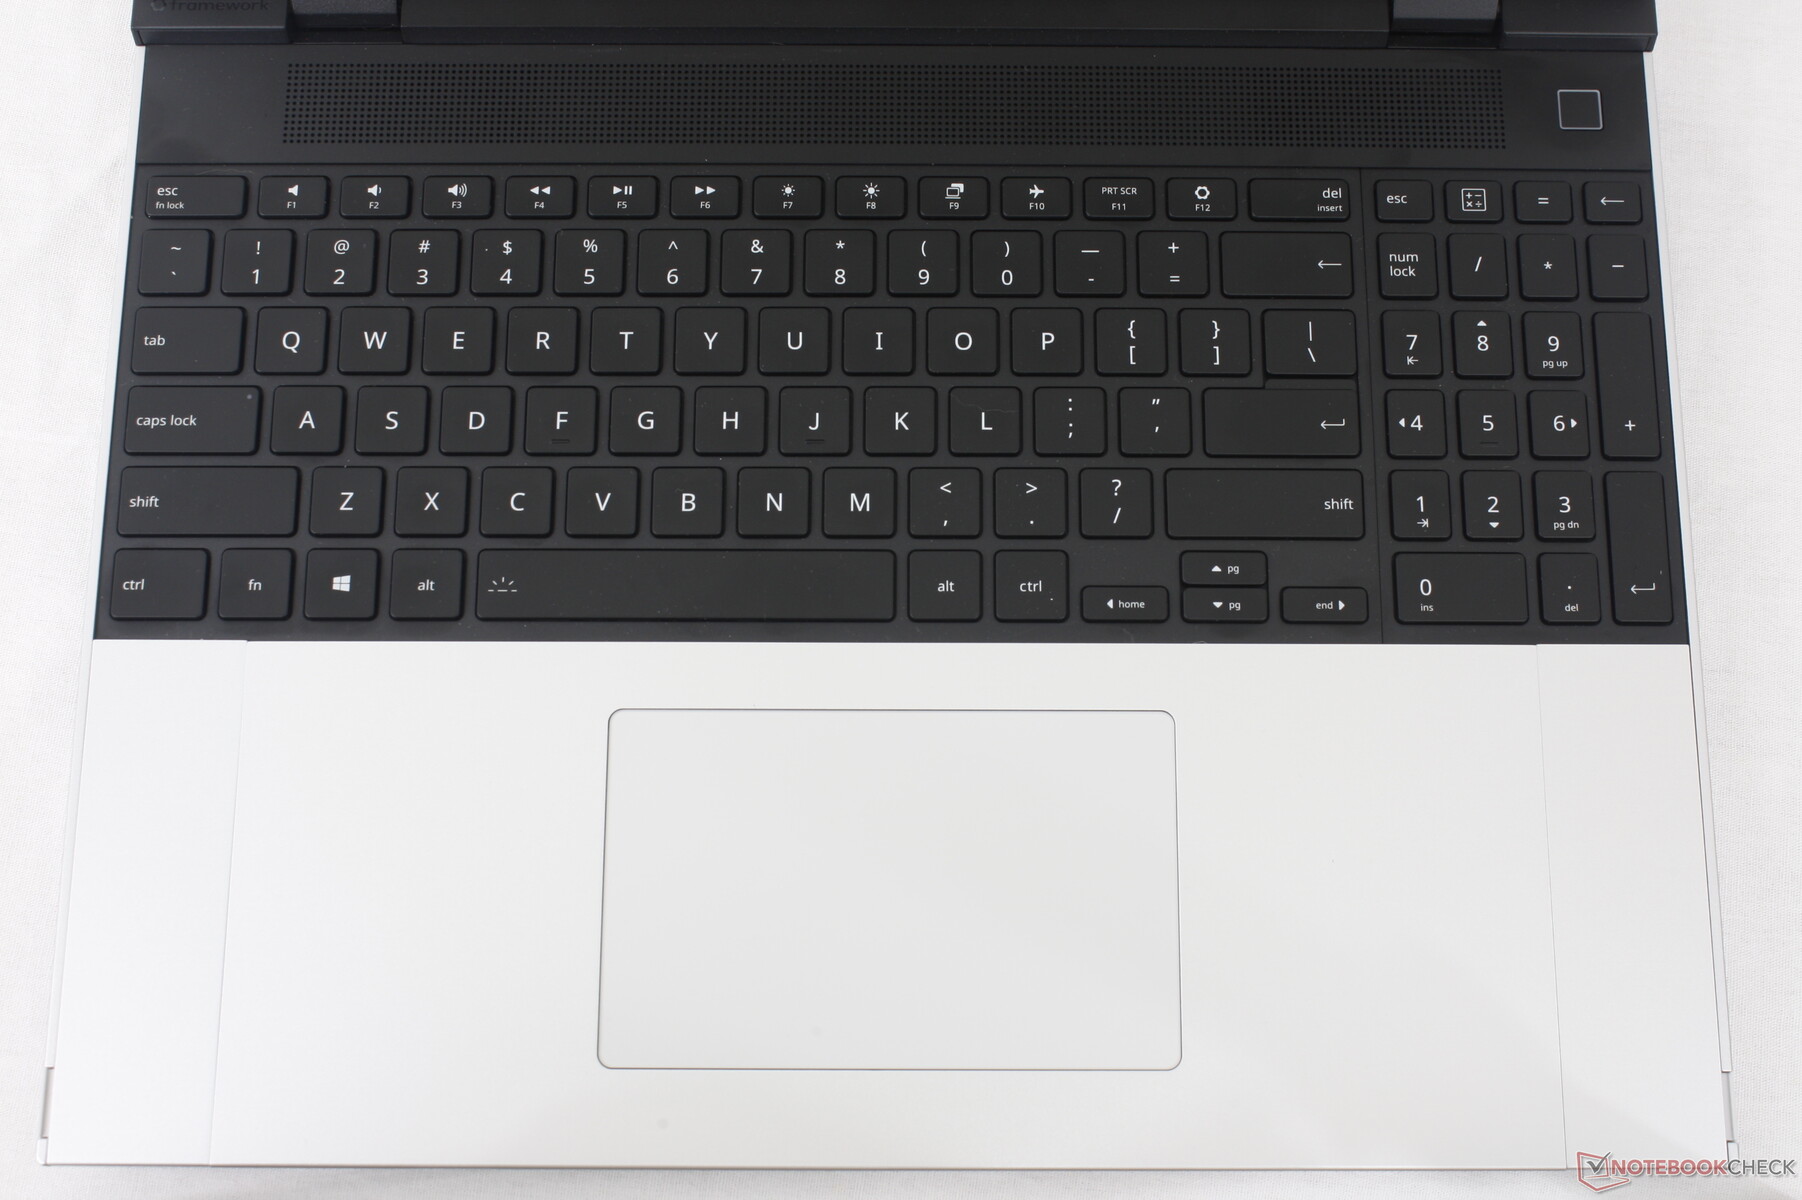
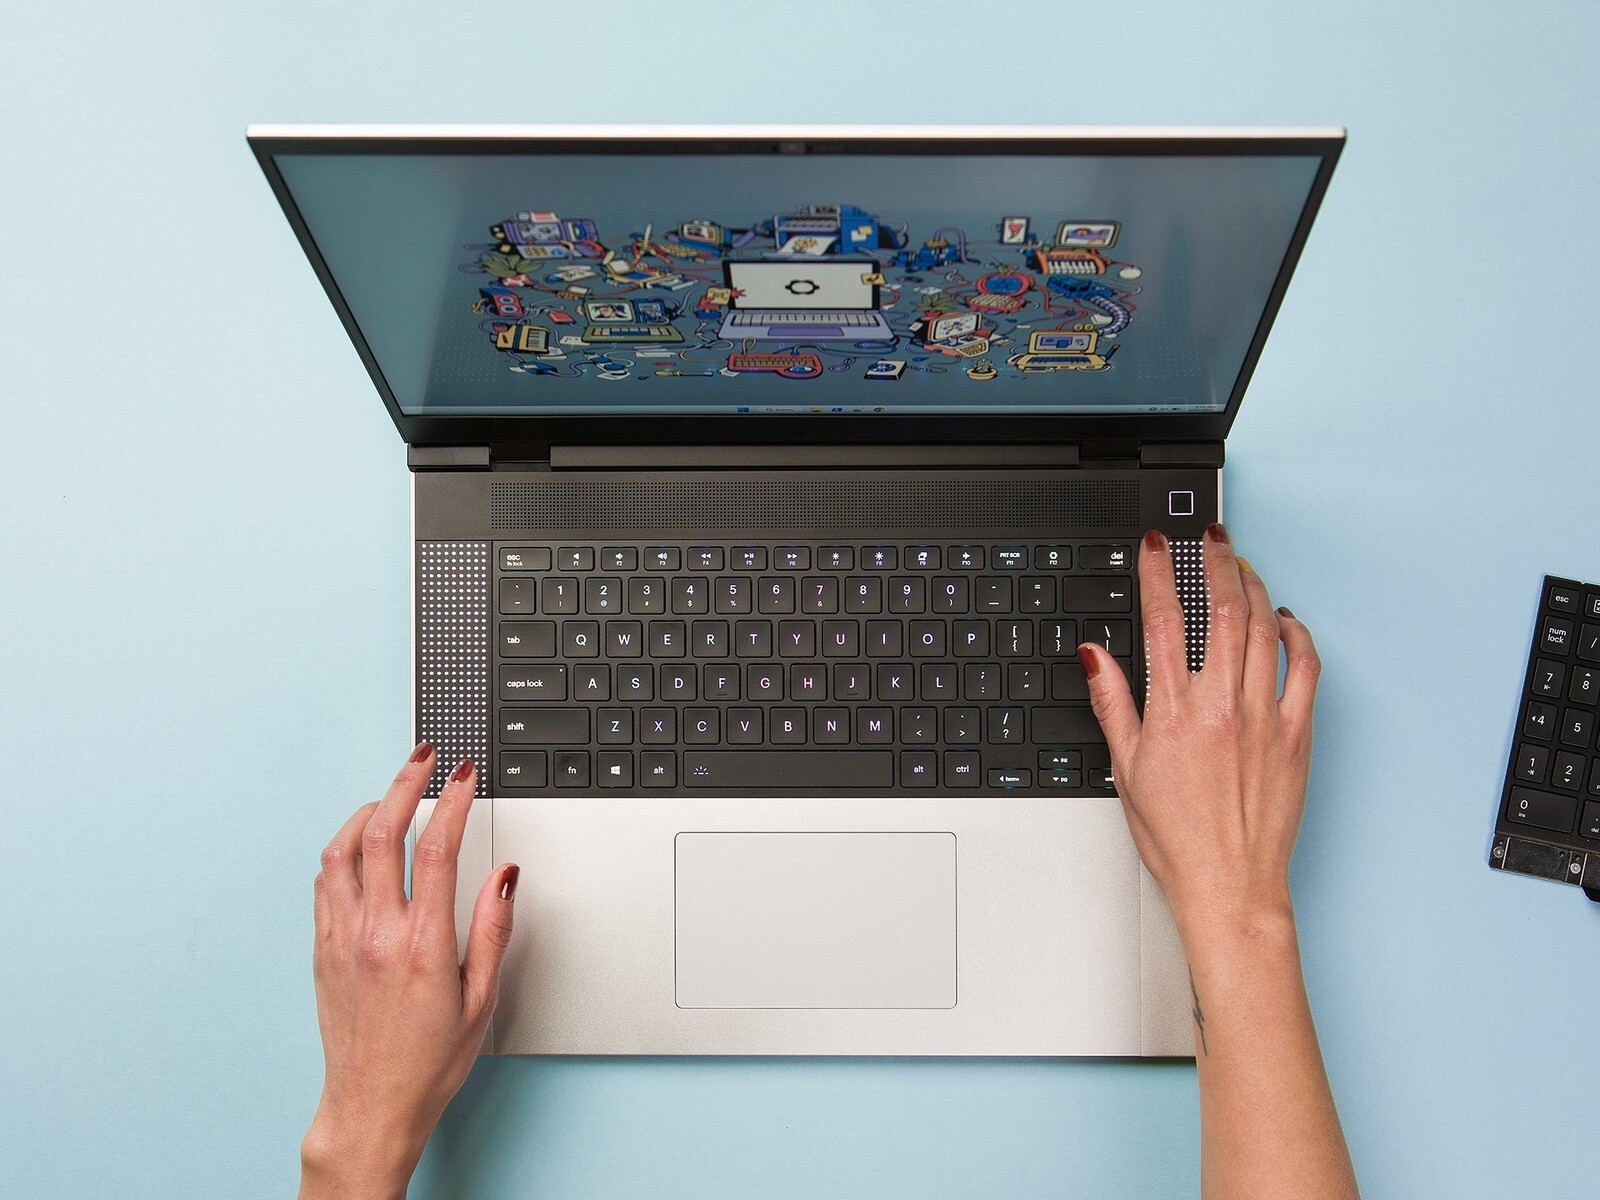
Dispositivi di input - rimovibili, sostituibili e riorganizzabili
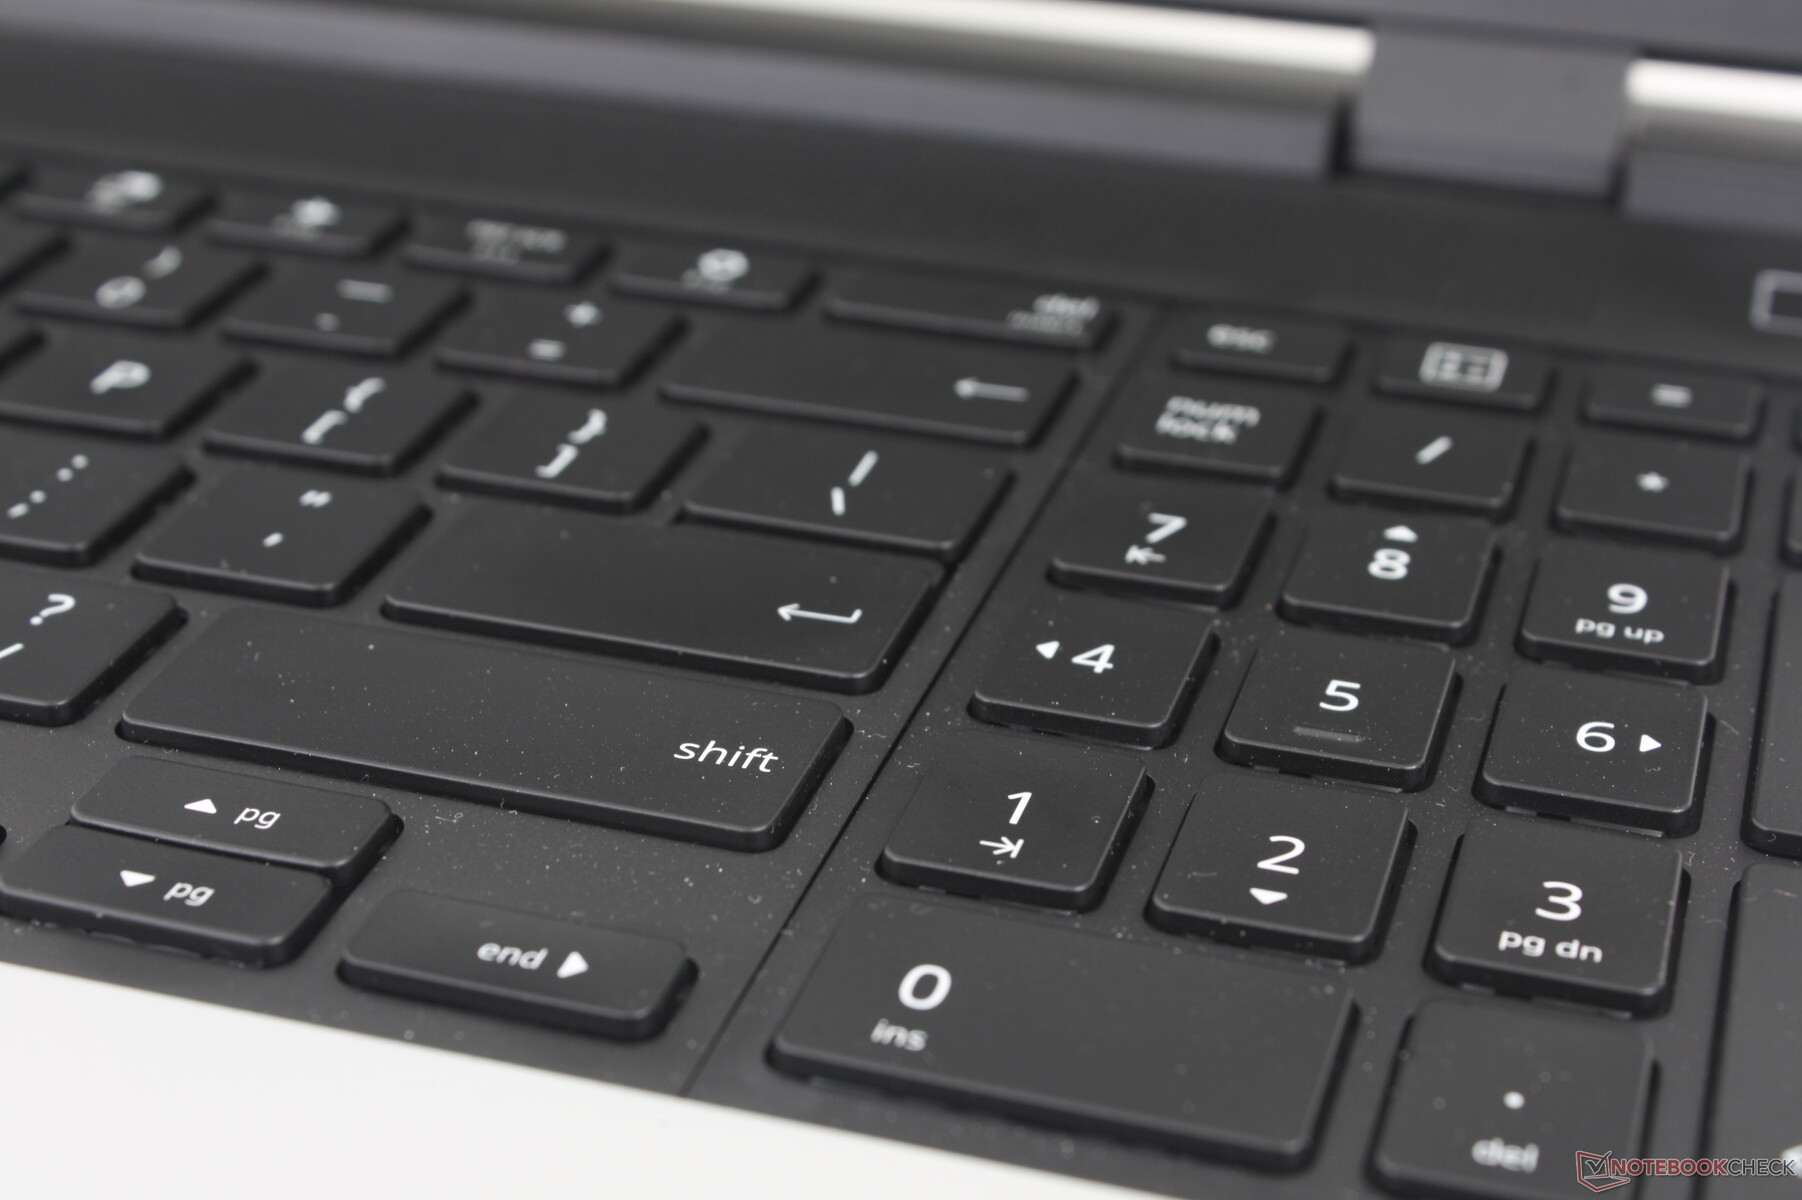
Tastiera
I tasti RGB per ogni tasto hanno una corsa di 1,5 mm, che è comune alla maggior parte degli Ultrabook. L'esperienza di digitazione non è ostacolata dall'aspetto rimovibile della tastiera, che è esattamente ciò che ci piace vedere. Gli utenti che preferiscono i computer portatili con una corsa dei tasti più profonda e solida dovrebbero provare l'HP Spectre.
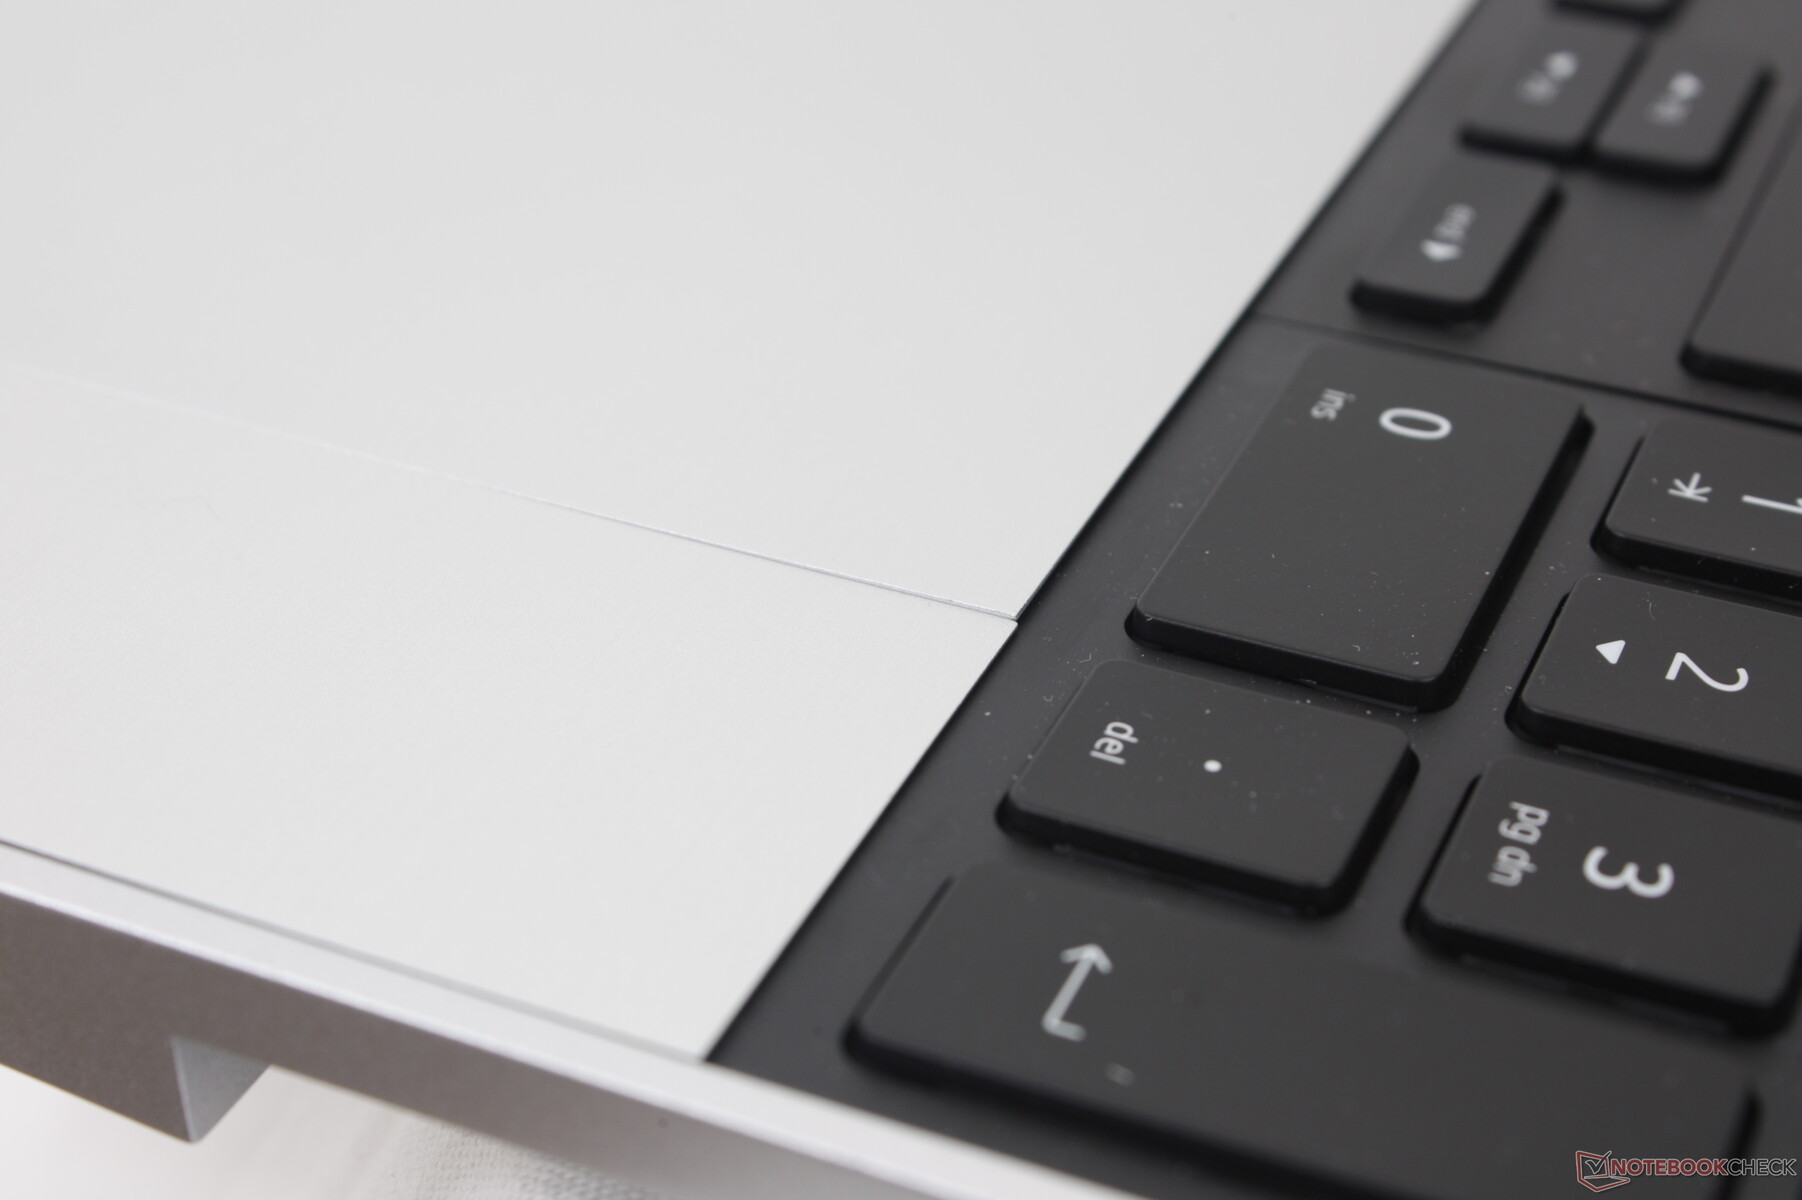
Stranamente, i tasti del numpad hanno solo una retroilluminazione bianca, mentre i tasti QWERTY principali sono illuminati in RGB. Gli utenti che preferiscono non avere alcun numpad possono invece installare dei distanziatori per centrare la tastiera QWERTY o installare un macropad RGB con tasti personalizzabili. La possibilità di riposizionare o centrare la tastiera a proprio piacimento non è una cosa che abbiamo visto su nessun altro portatile. Il tastierino numerico, ad esempio, può essere installato a sinistra o a destra della tastiera QWERTY per ottenere configurazioni davvero interessanti.
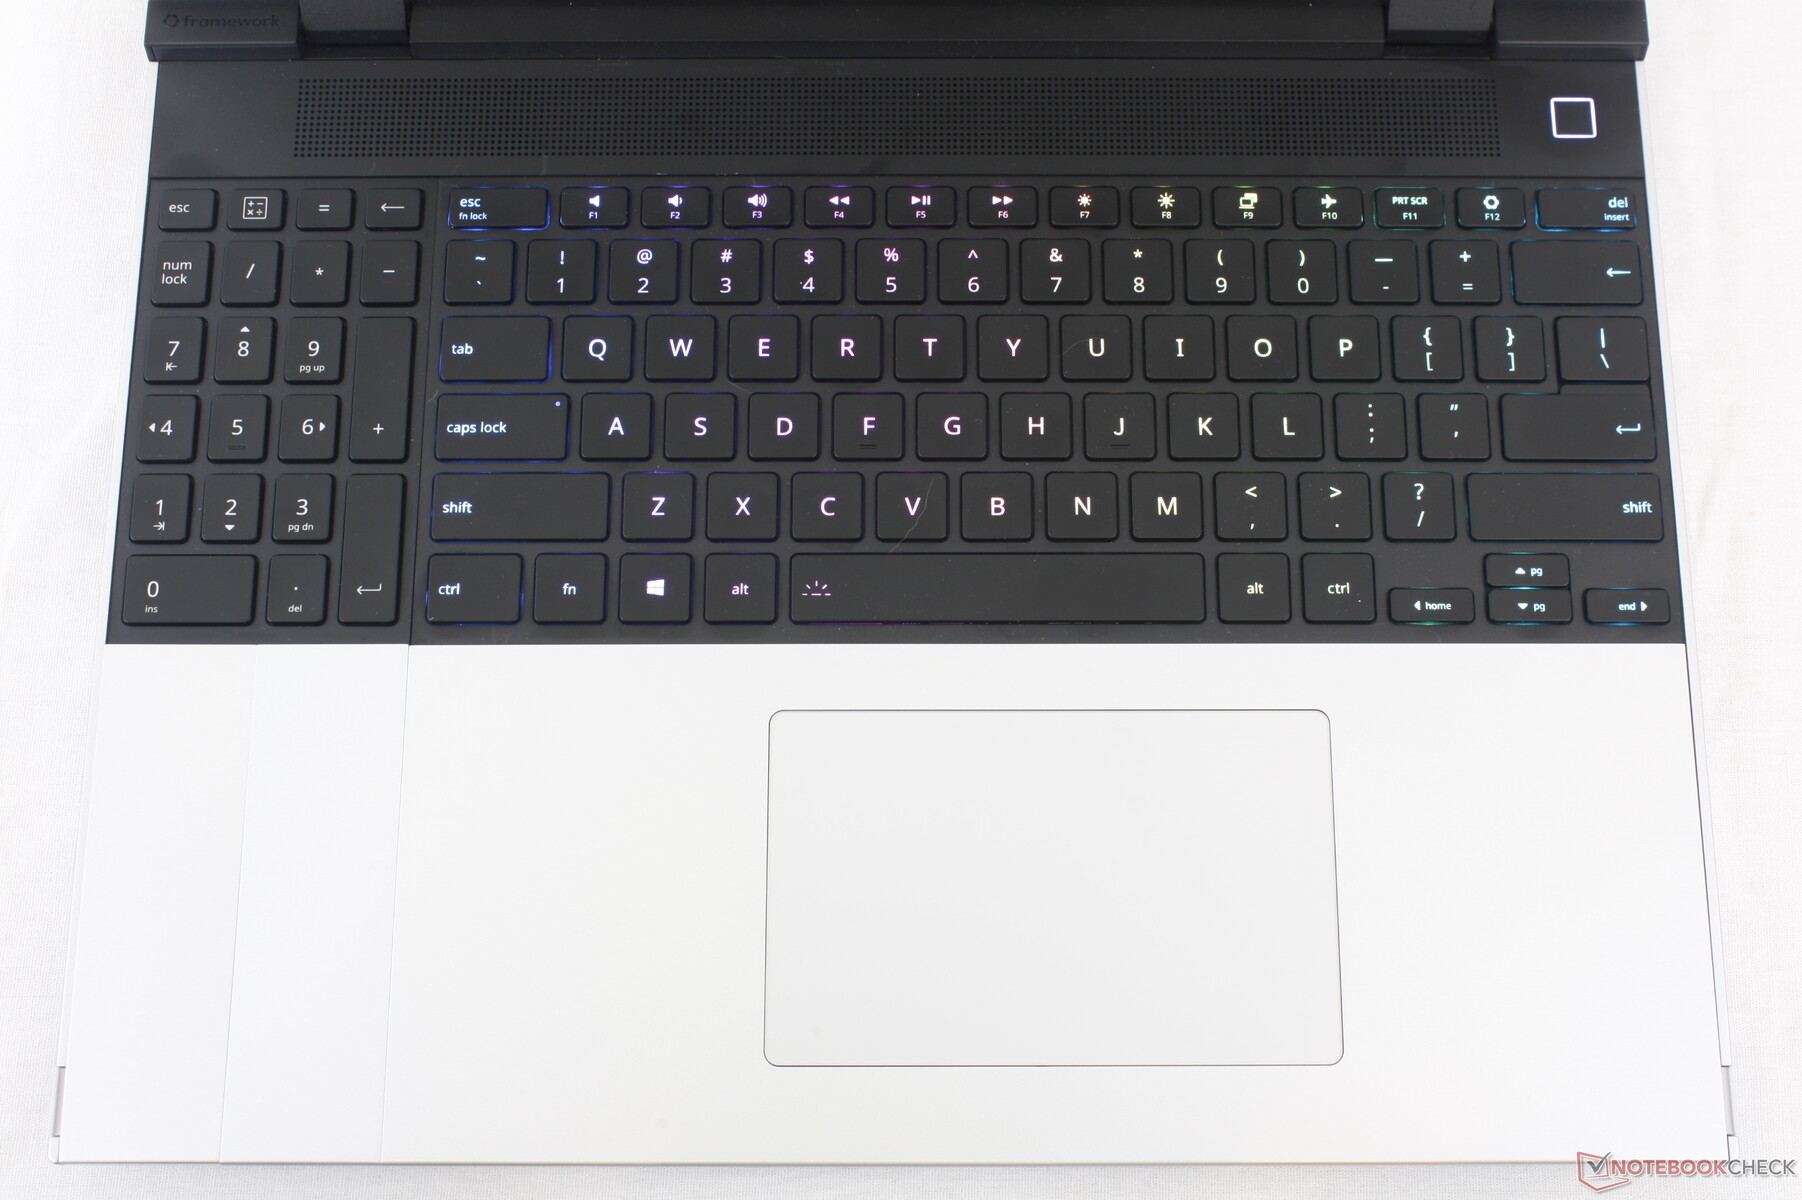
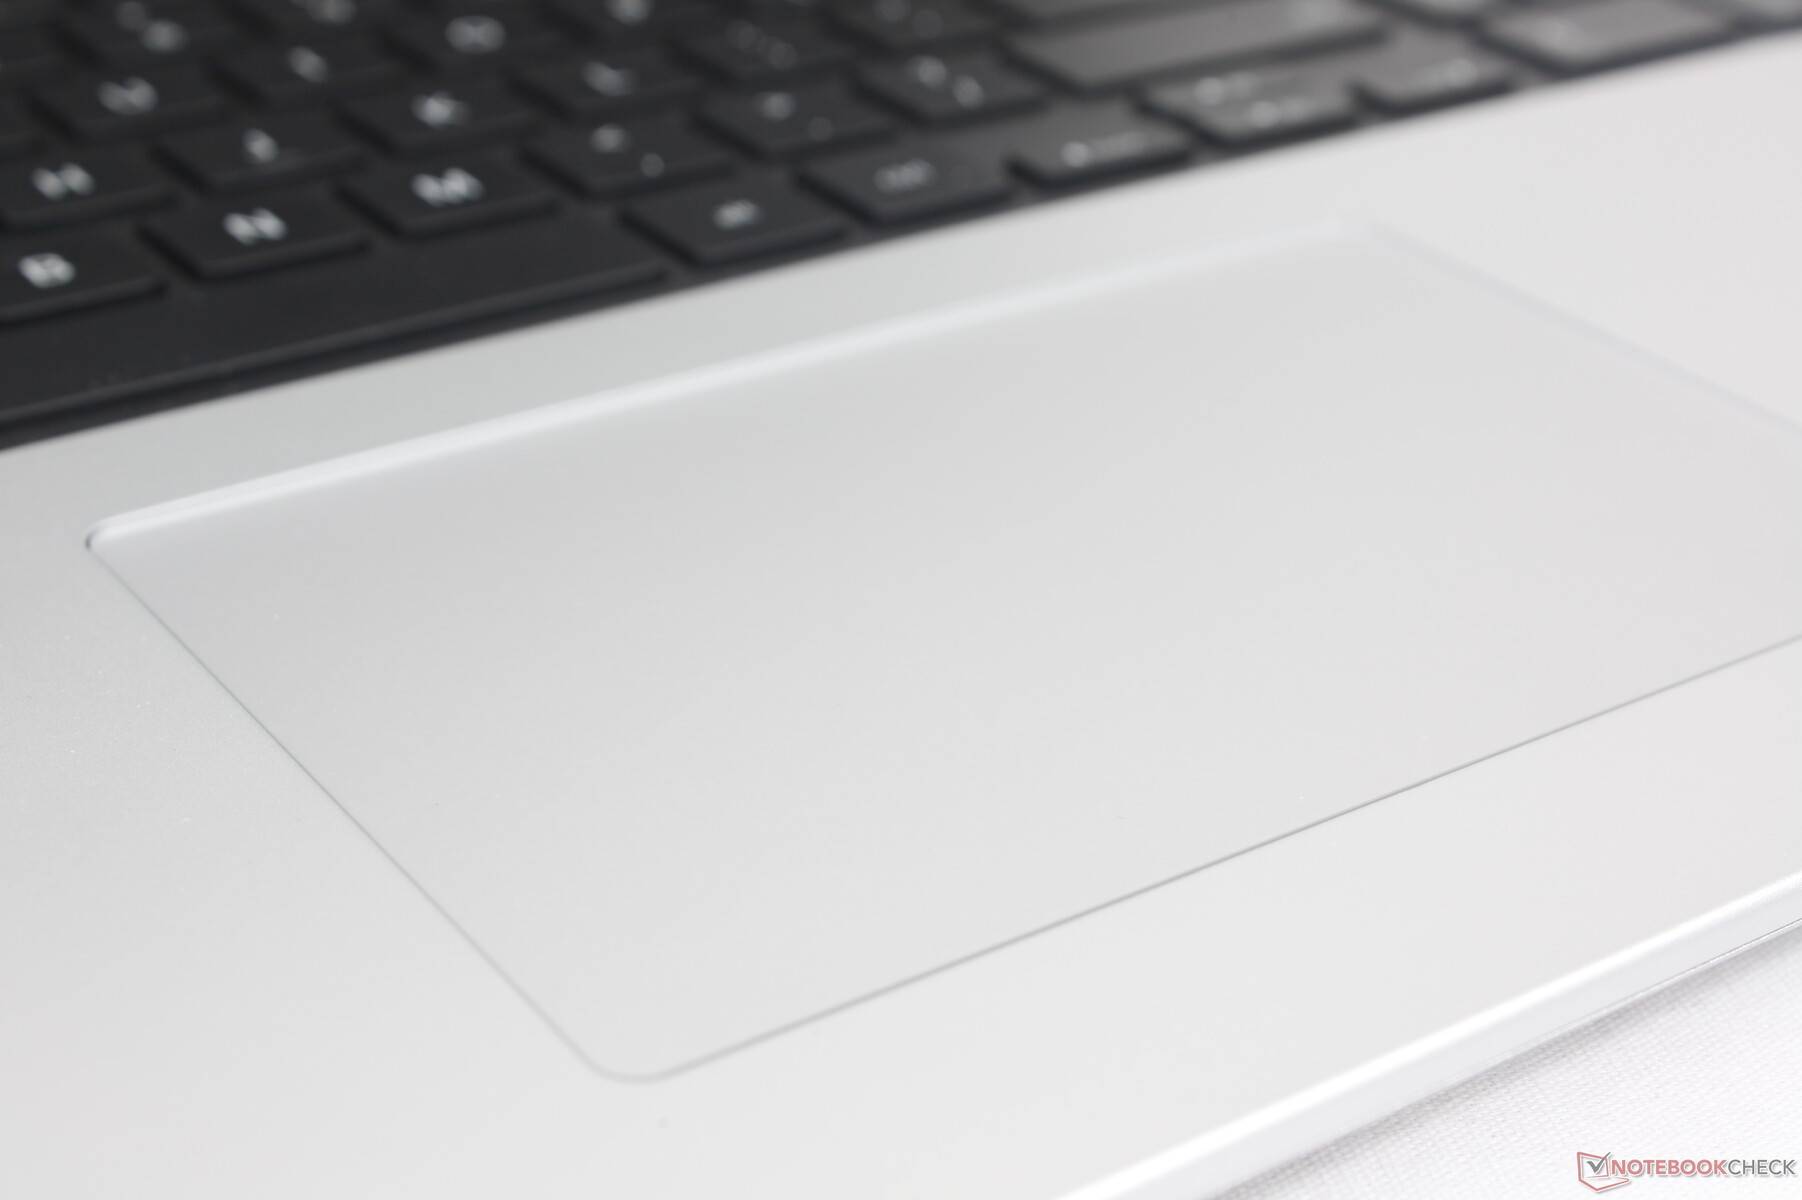
Touchpad
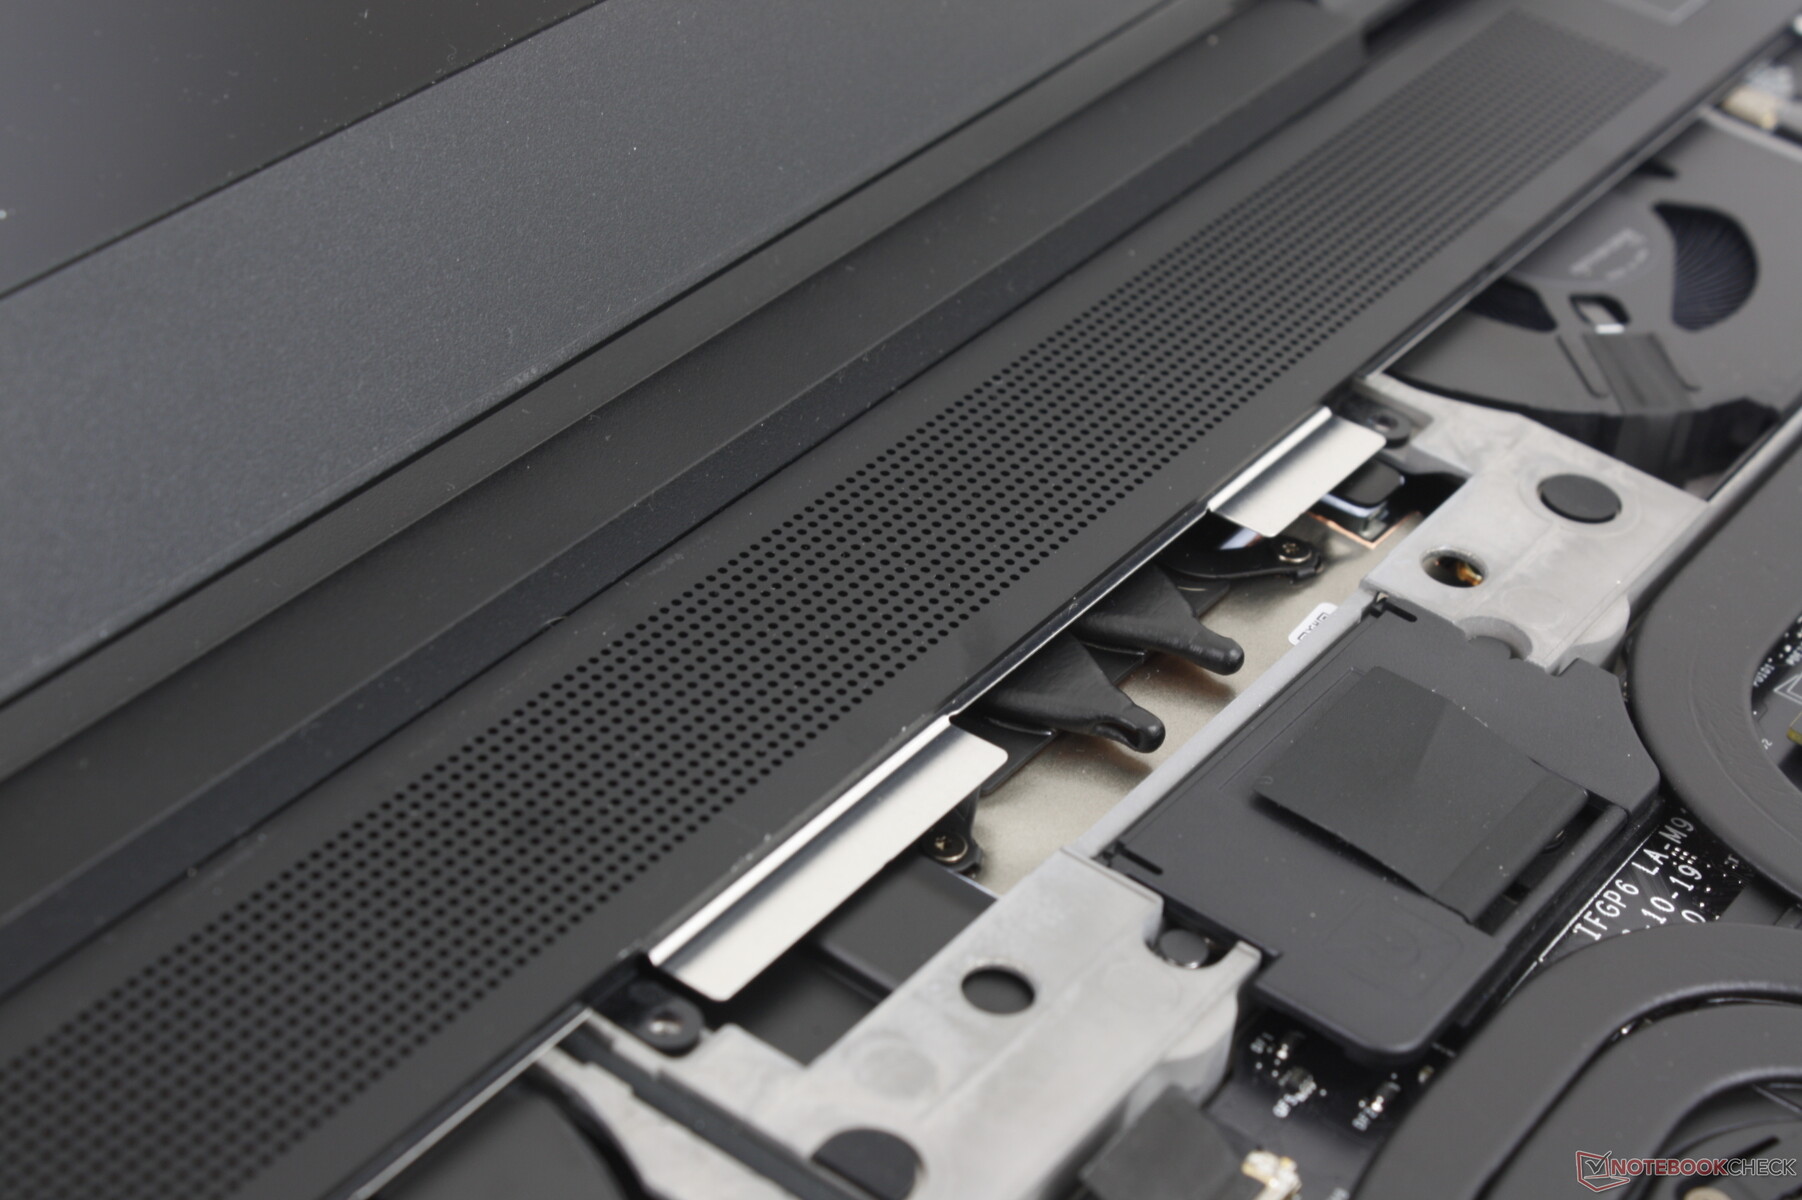
Con 12,3 x 7,7 cm, il clickpad di Precision è più piccolo di quello di MSI Prestige 16 (15 x 9 cm) e più o meno delle stesse dimensioni di quello dell' Inspiron 16 Plus (11,5 x 8 cm). La trazione è fluida sulla superficie di vetro opaco, con solo un po' di aderenza quando si scivola a velocità ridotta, per una maggiore precisione. Anche il clic è buono, in quanto il feedback non è così spugnoso come sul Prestige 16, ma il rumore è leggermente più forte.
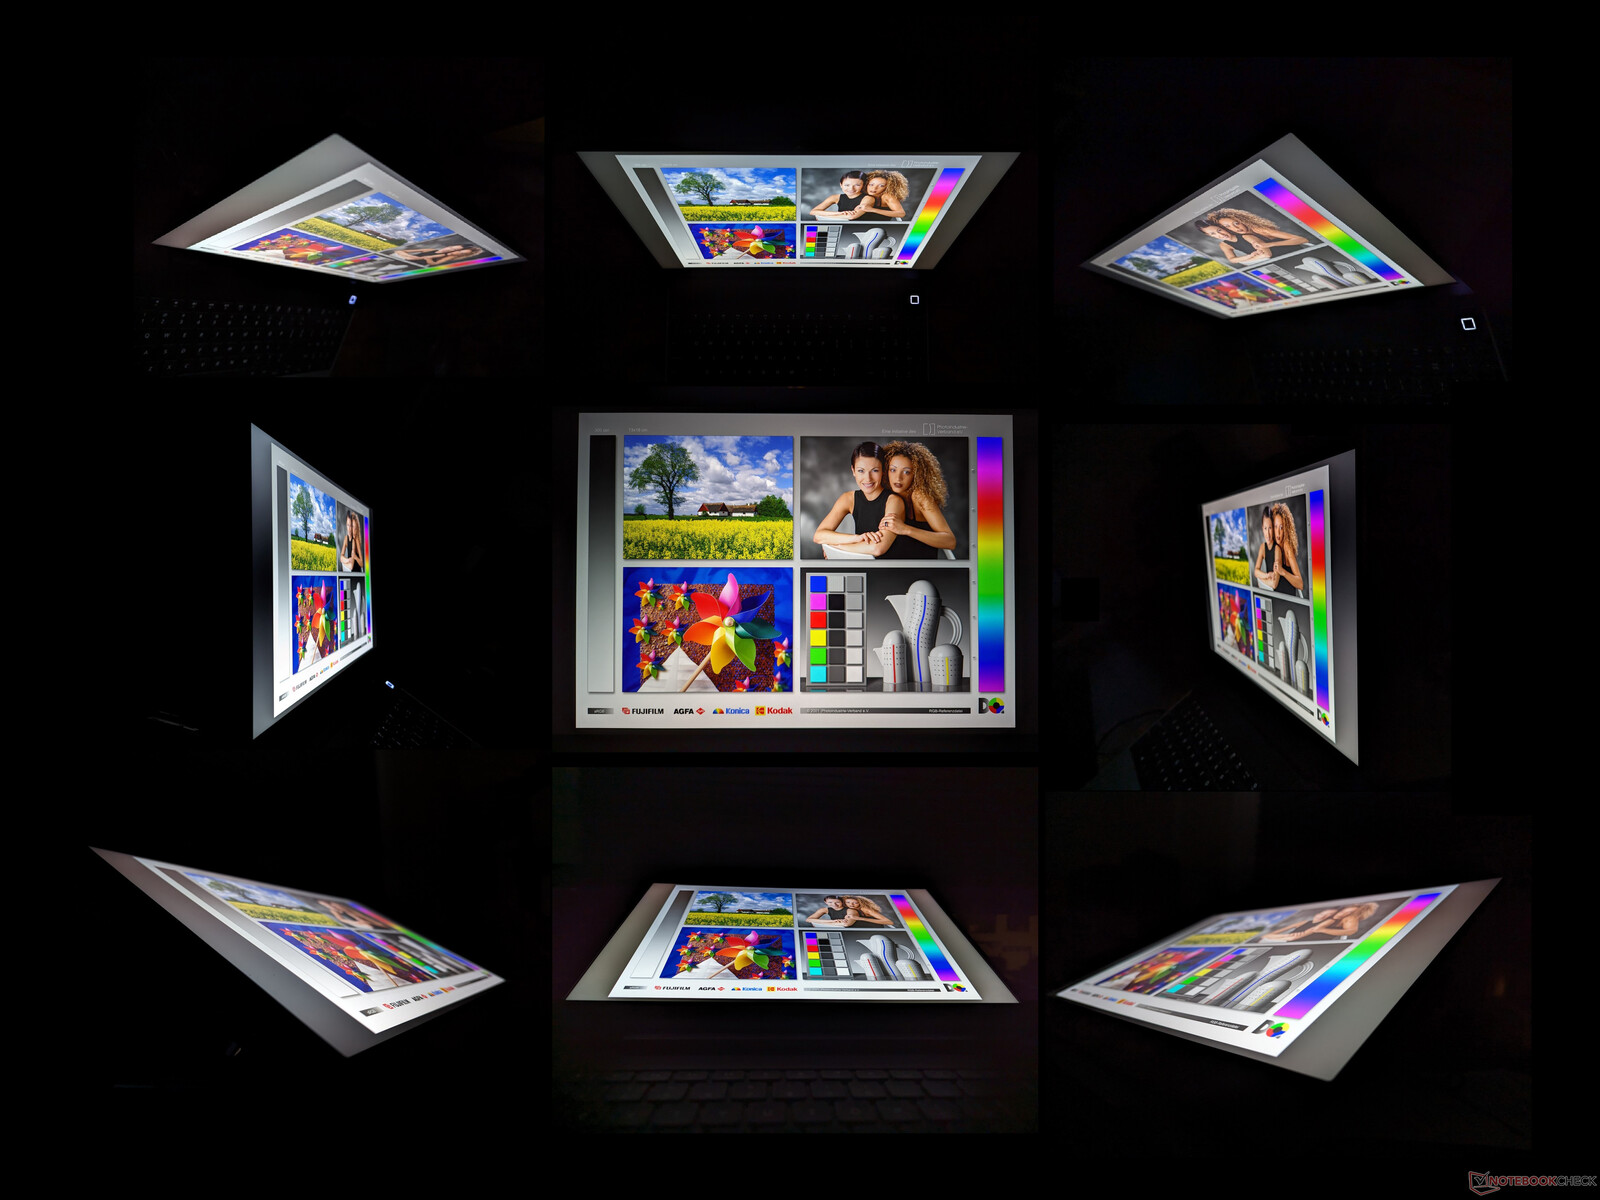
Un aspetto unico del clickpad è che può essere spostato a sinistra o a destra sui palmari, a seconda di come viene installato, come mostrano le immagini qui sotto. Si tratta di una funzione interessante per gli utenti che potrebbero preferire un clickpad decentrato.

Display - Mi spiace gente, niente OLED
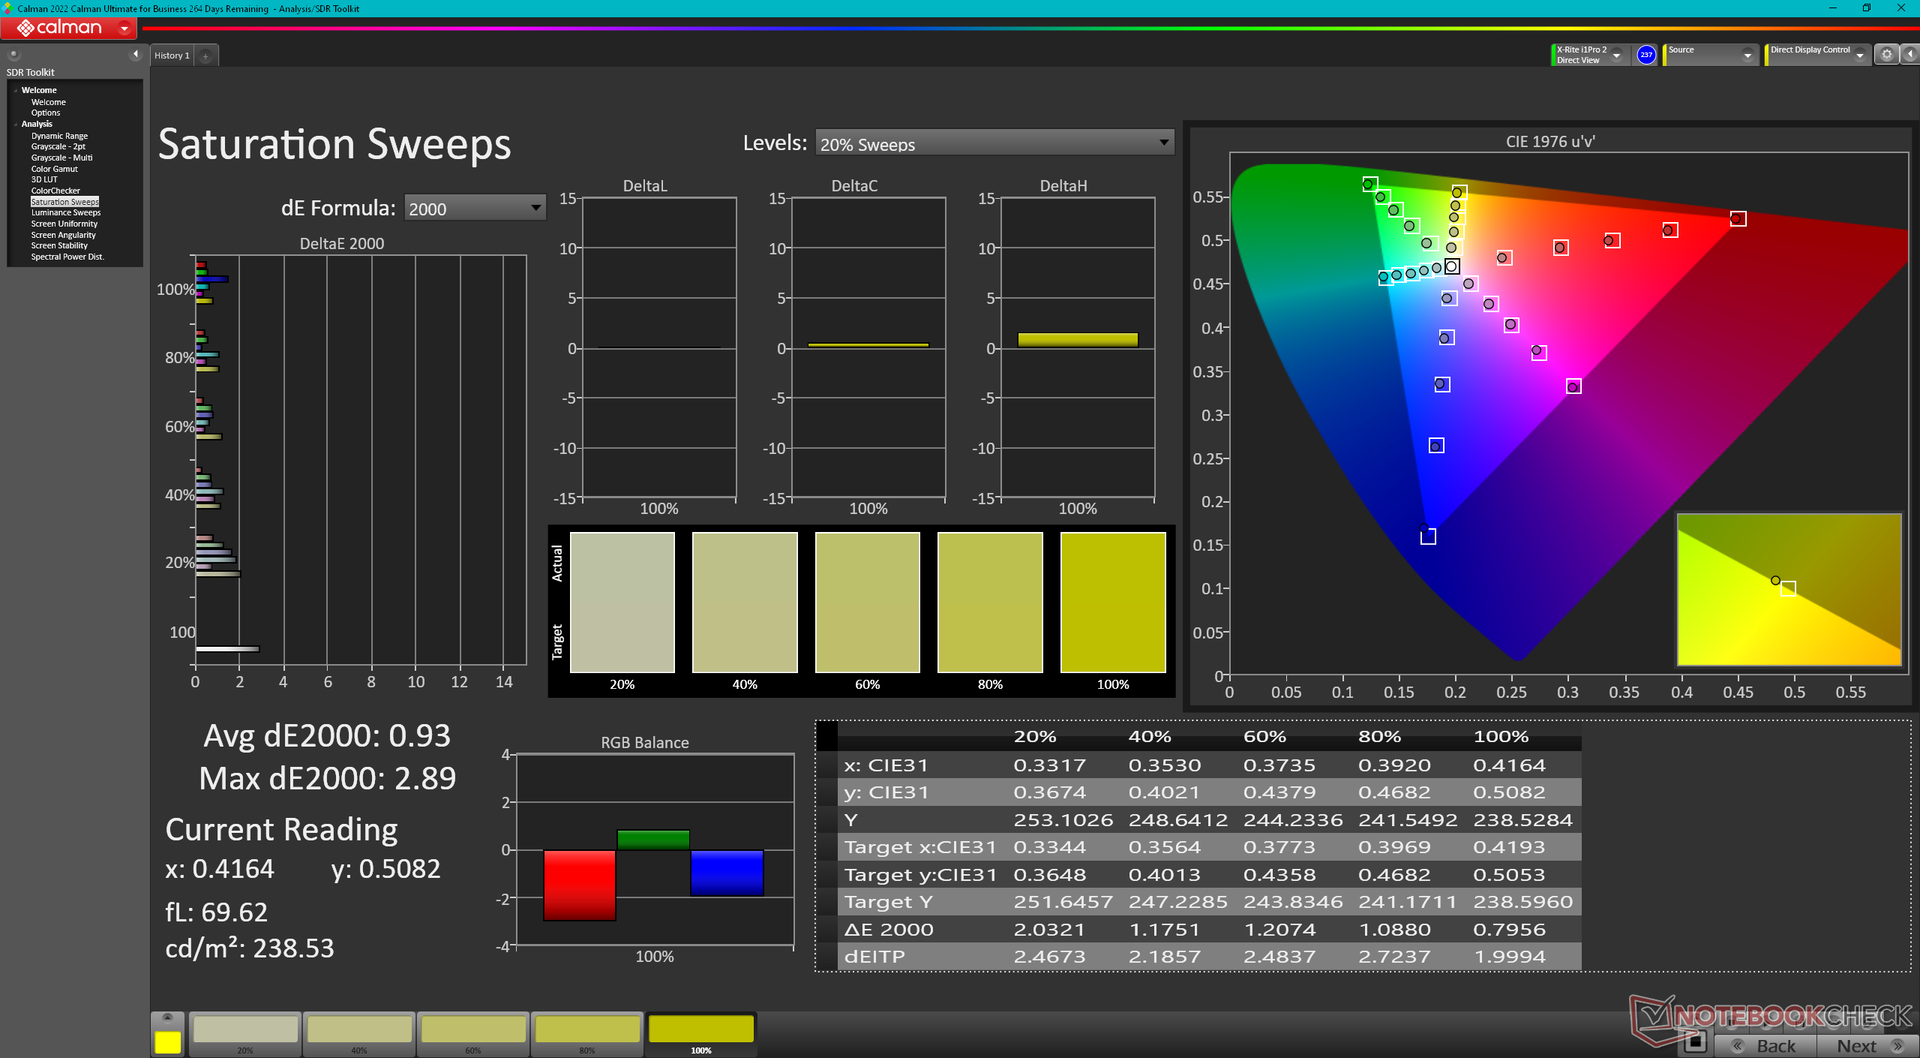
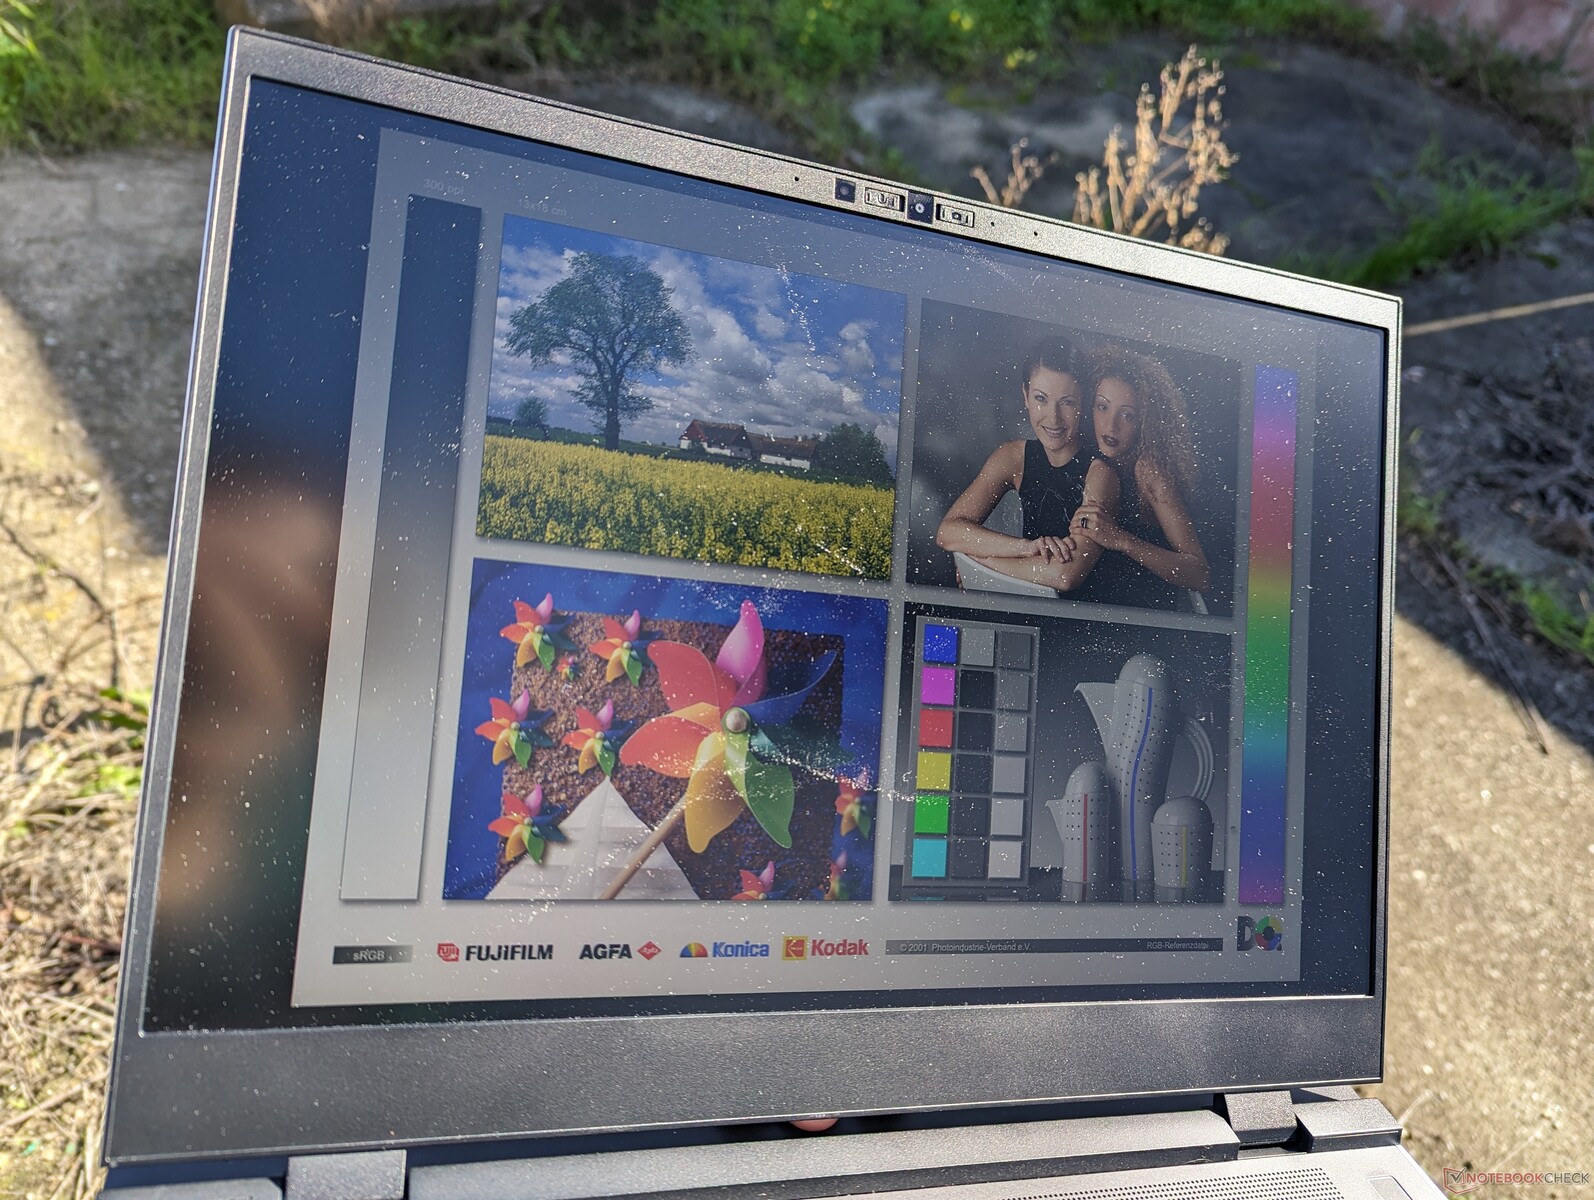
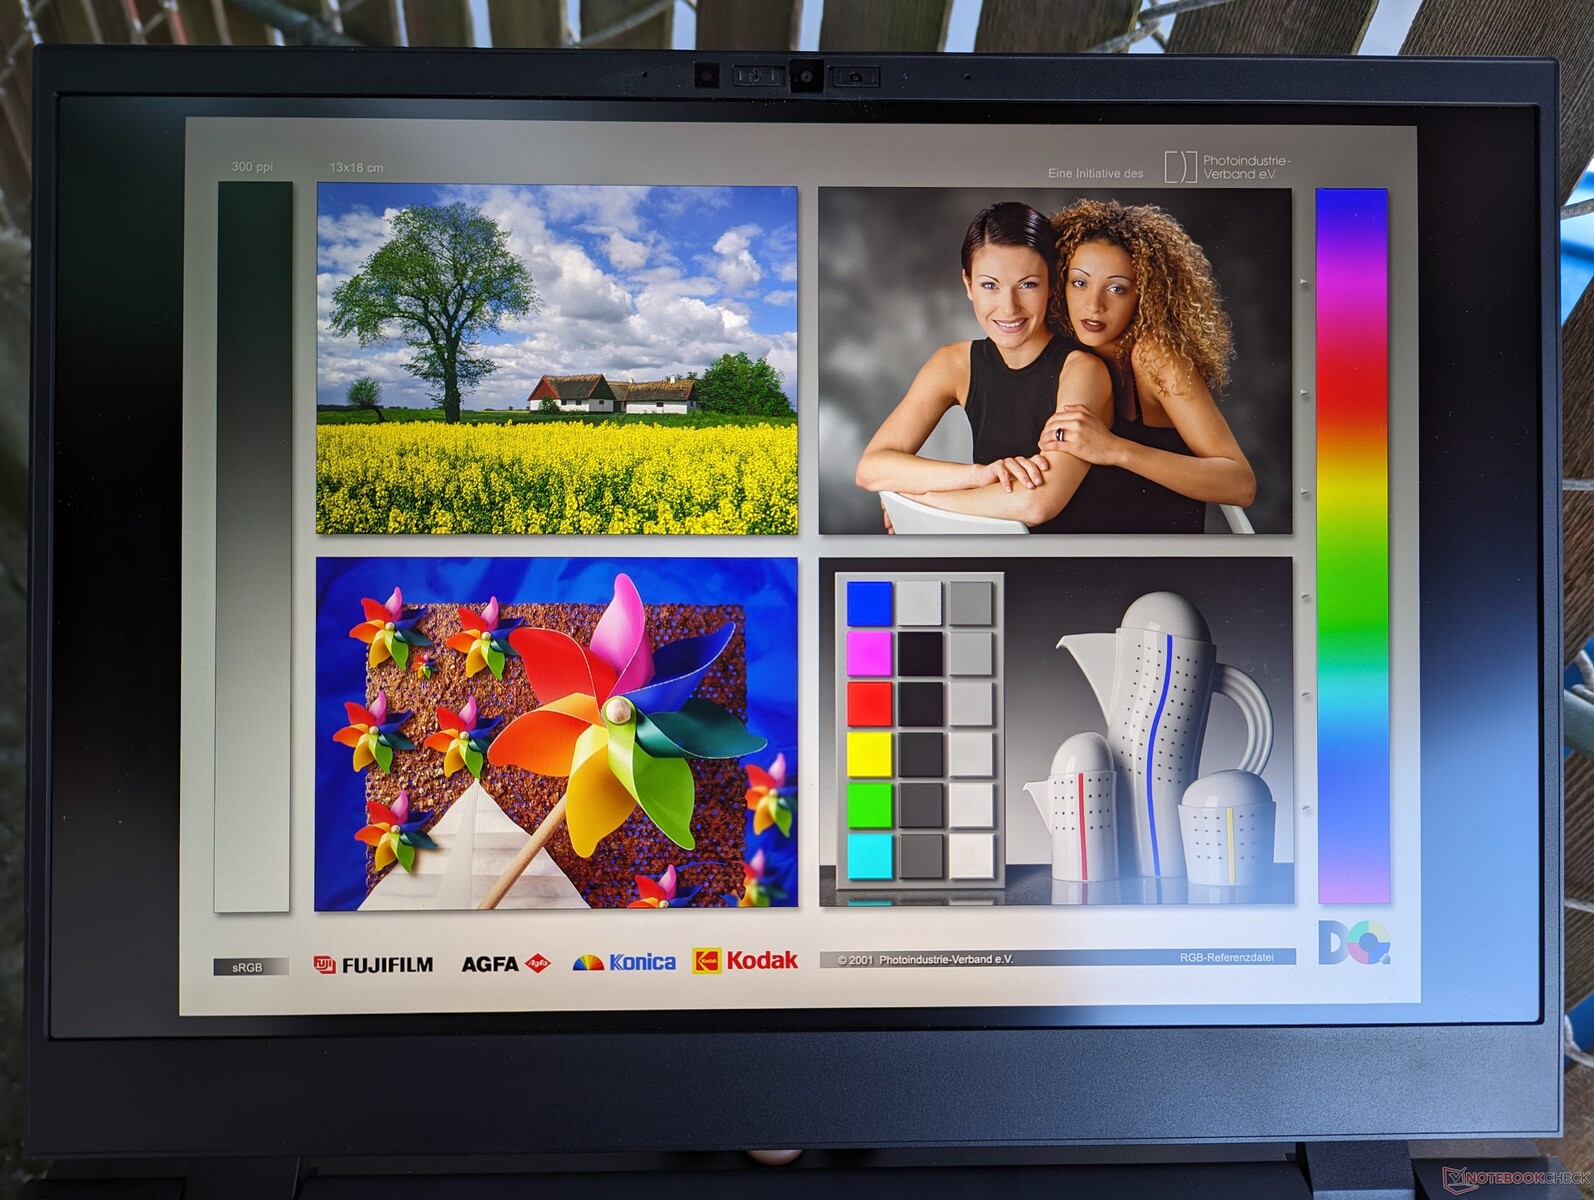
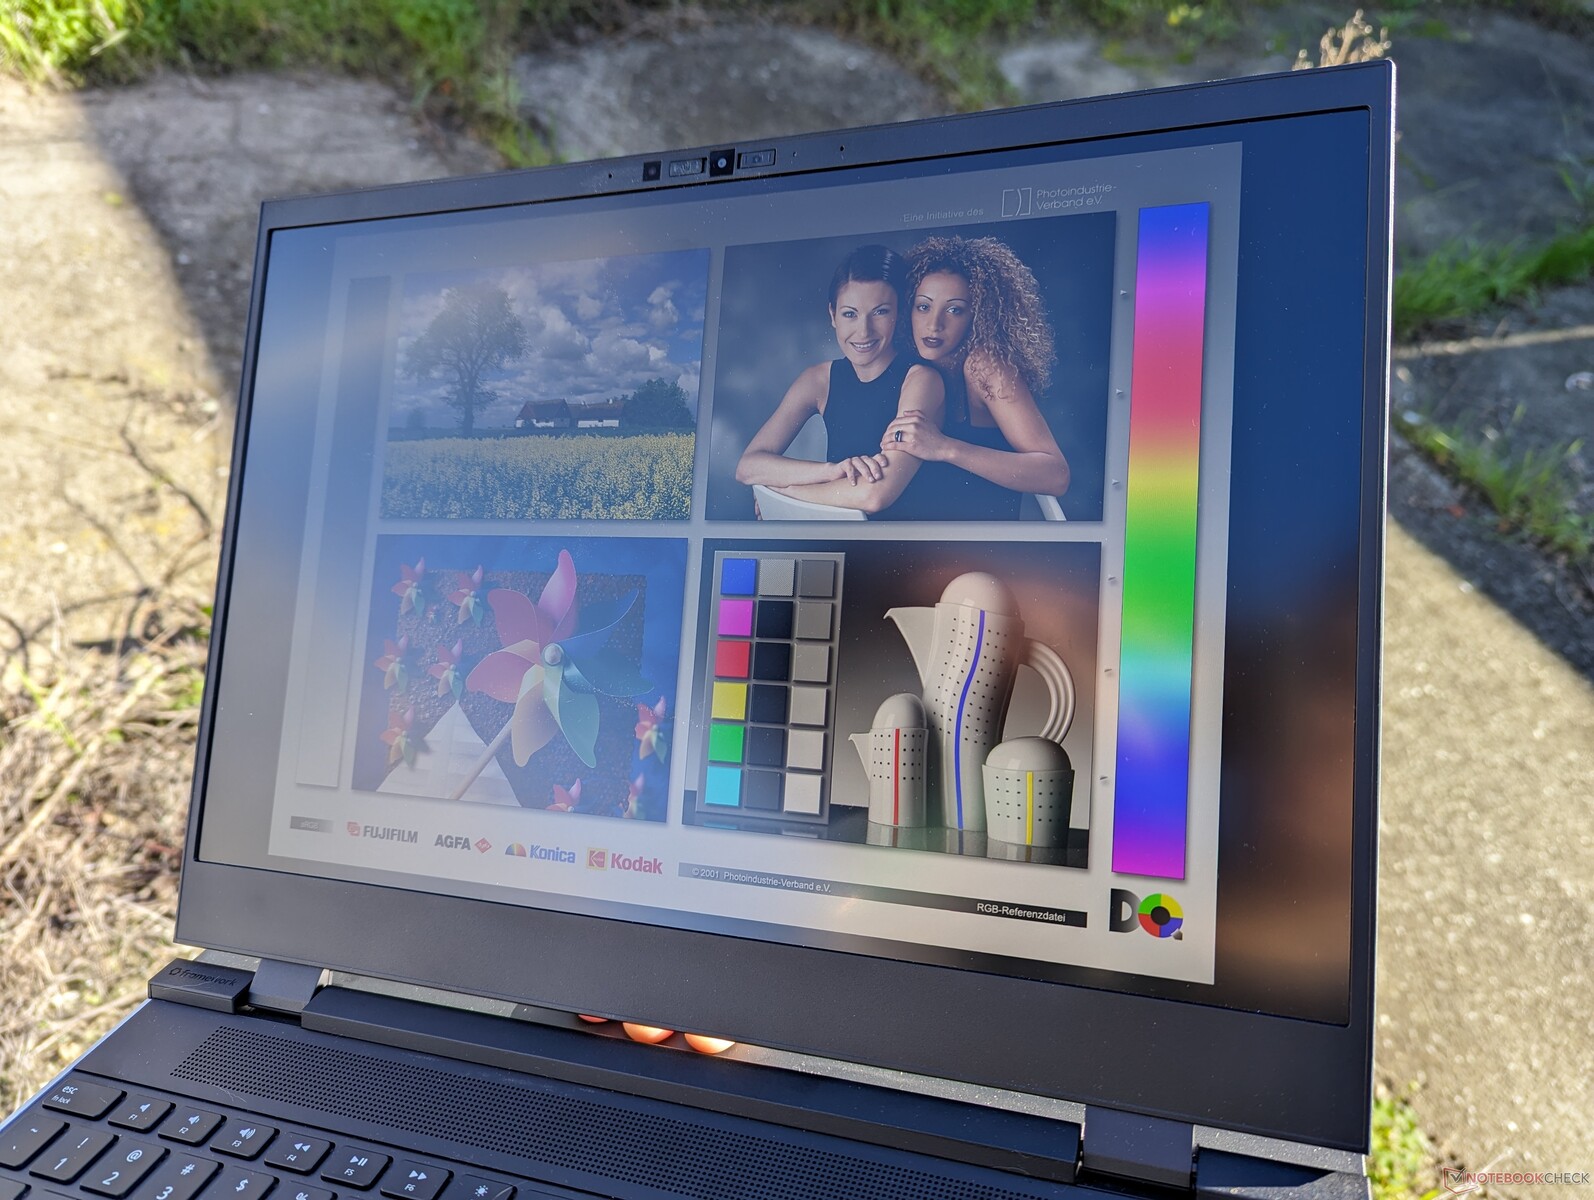
Non essendoci altre opzioni di display tra cui scegliere al momento della stesura di questo articolo, avevamo grandi aspettative per l'unico pannello IPS che viene fornito con ogni configurazione del Laptop 16. Fortunatamente, possiamo affermare con sicurezza che Framework non ha affatto rinunciato al display. Il pannello 2560 x 1600 offre tempi di risposta rapidi, colori DCI-P3, una retroilluminazione luminosa, un rapporto di contrasto relativamente elevato e persino una frequenza di aggiornamento variabile di 165 Hz con supporto FreeSync. Il Laptop 16 è di conseguenza uno dei primi portatili ad essere fornito con il pannello BOE NE160QDM-NZ6 VRR.
Essendo un pannello IPS, tuttavia, non raggiunge lo stesso rapporto di contrasto nero pece o gli stessi tempi di risposta di un'alternativa OLED tipica, come quelli presenti sul modello Asus VivoBook 16 serie Asus VivoBook 16. Manca anche il supporto HDR, che sta diventando una caratteristica sempre più comune nei computer portatili multimediali. Per un portatile che vanta l'aggiornabilità da parte dell'utente finale, è strano che non ci sia un'opzione di secondo display. Tuttavia, questo è ancora uno dei migliori display IPS da 16 pollici che abbiamo visto sia per l'editing che per i giochi.

| |||||||||||||||||||||||||
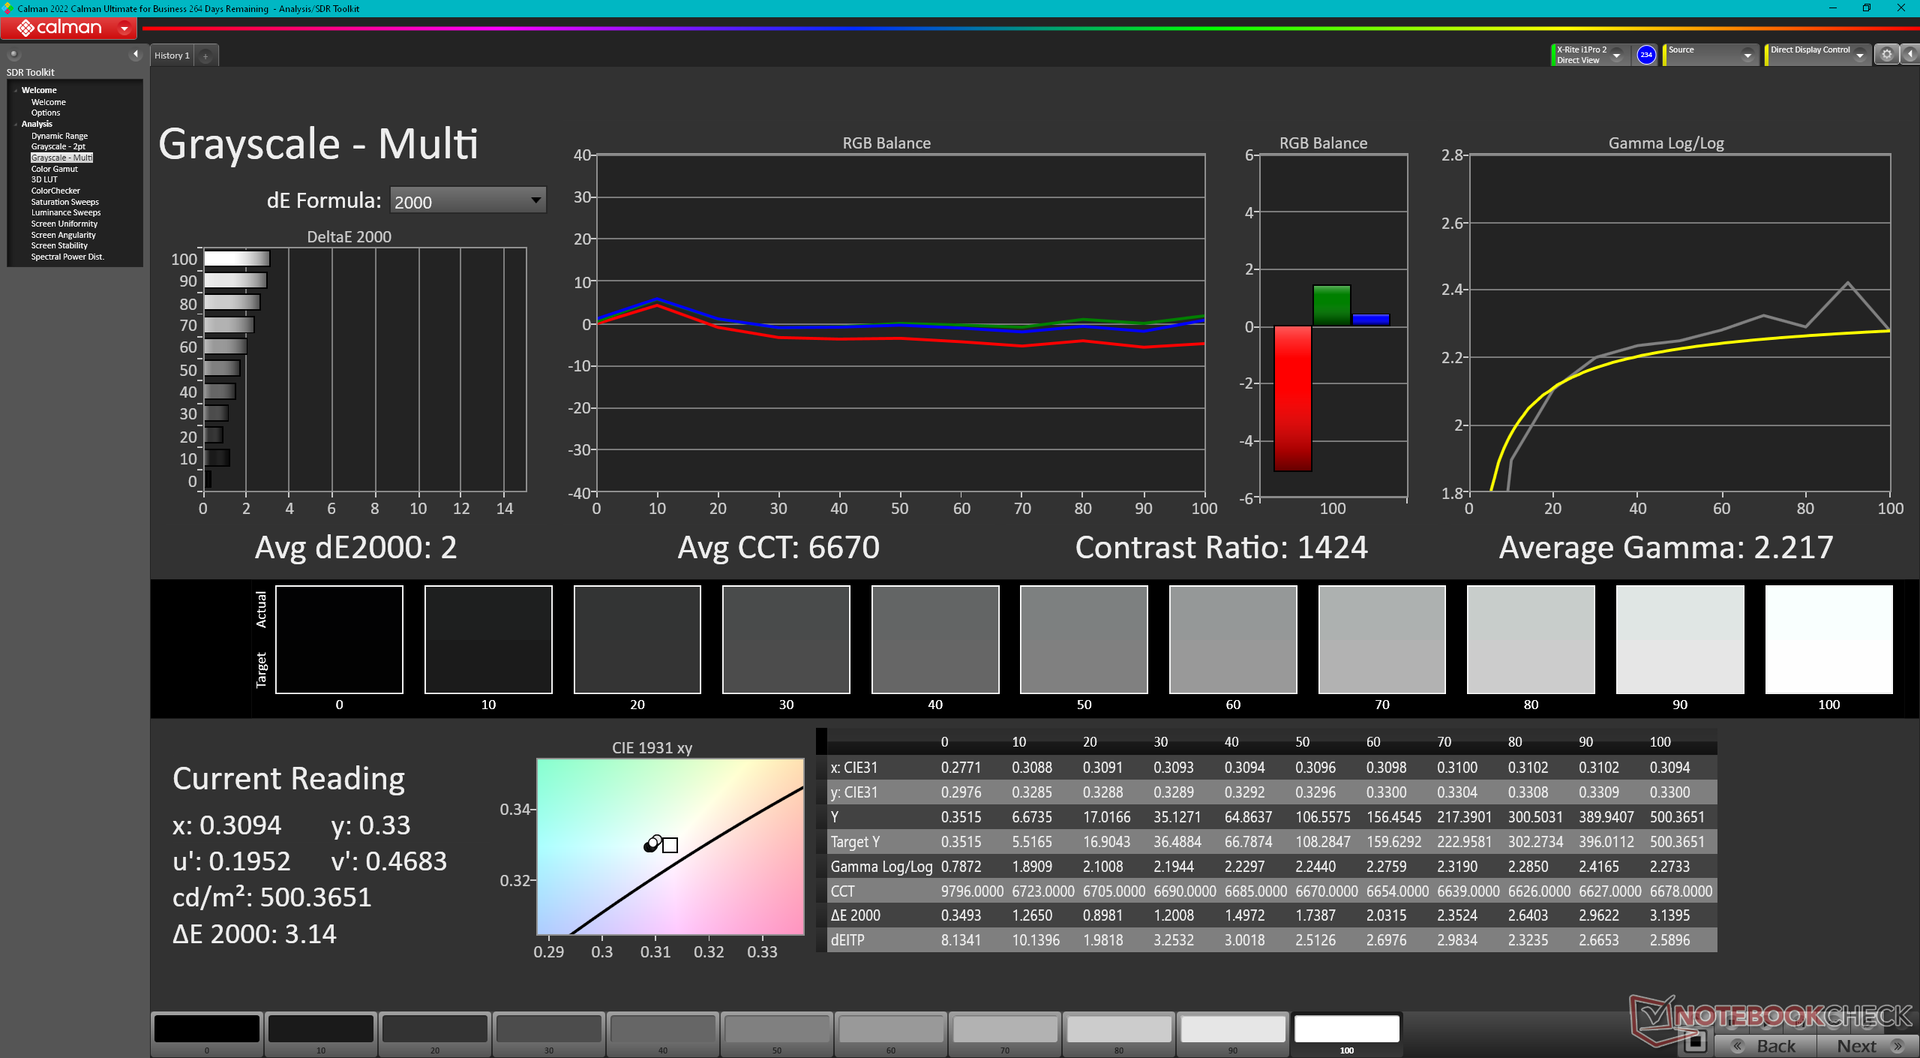
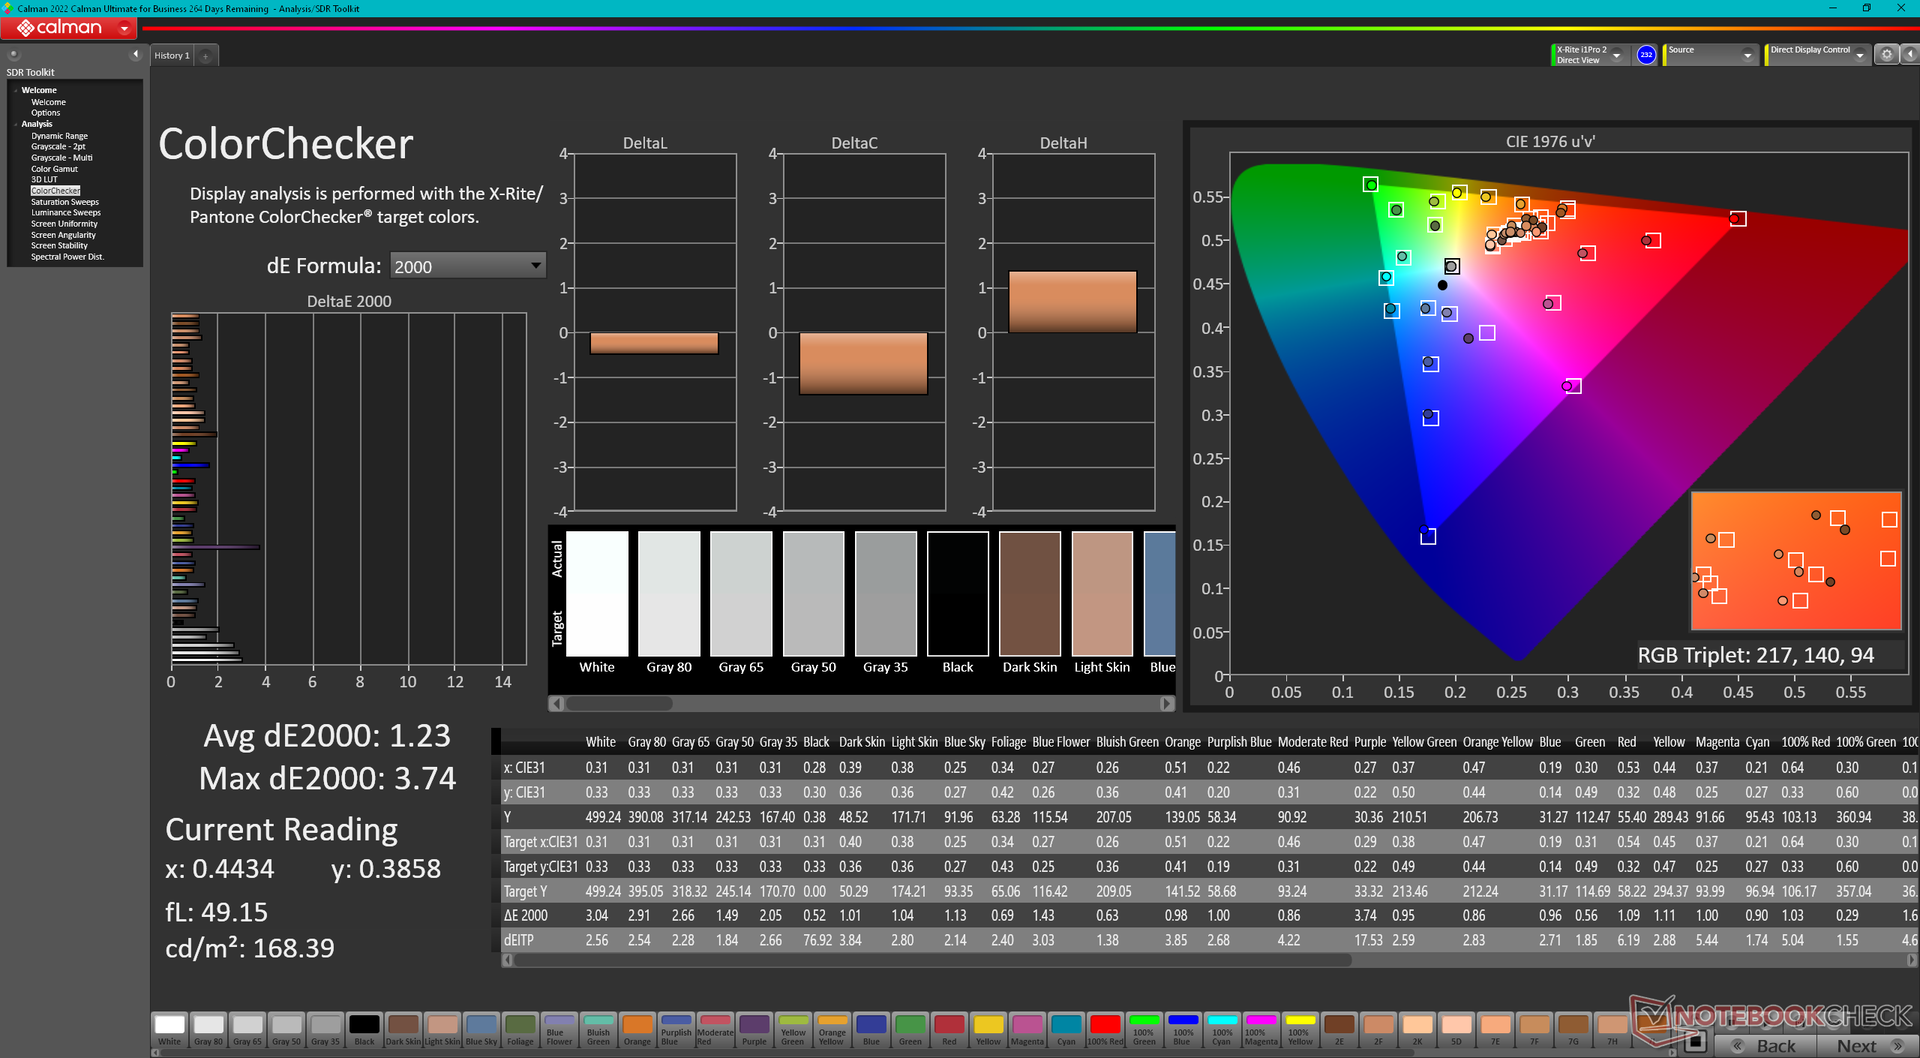
Distribuzione della luminosità: 84 %
Al centro con la batteria: 504.8 cd/m²
Contrasto: 1231:1 (Nero: 0.41 cd/m²)
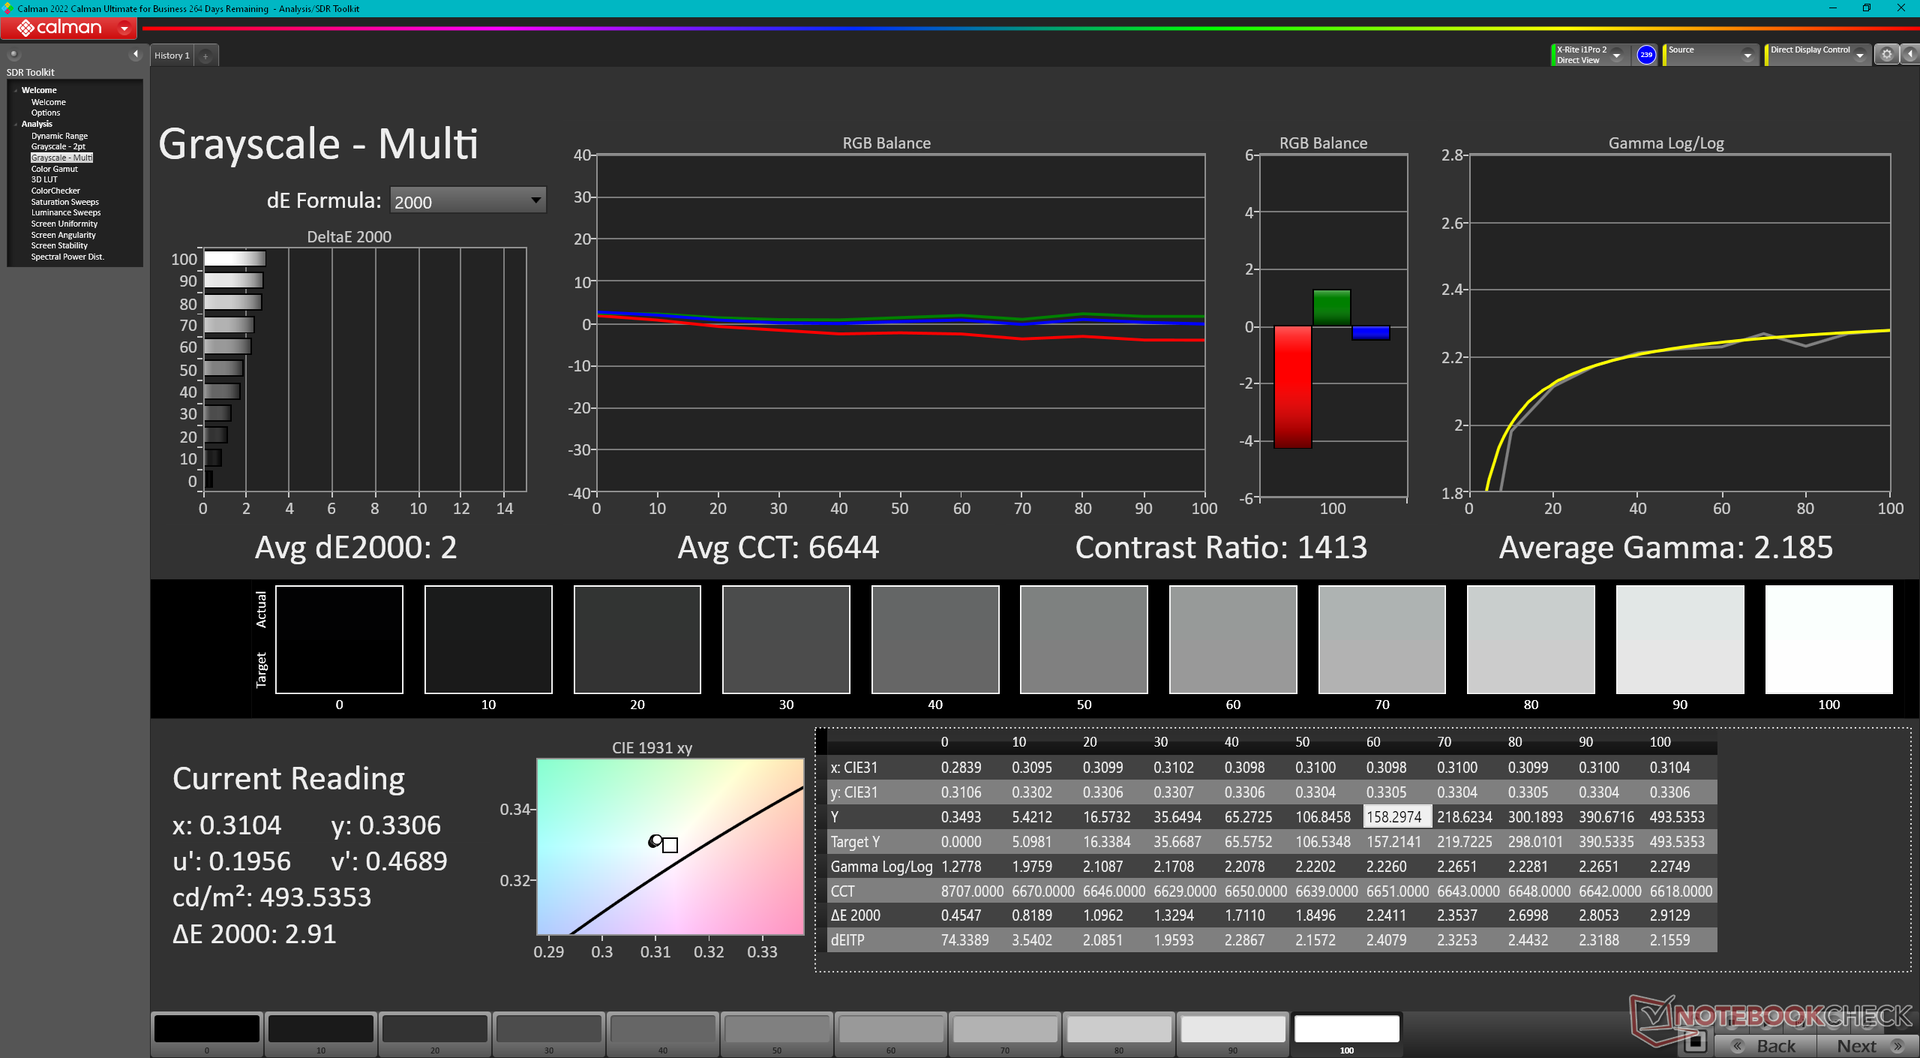
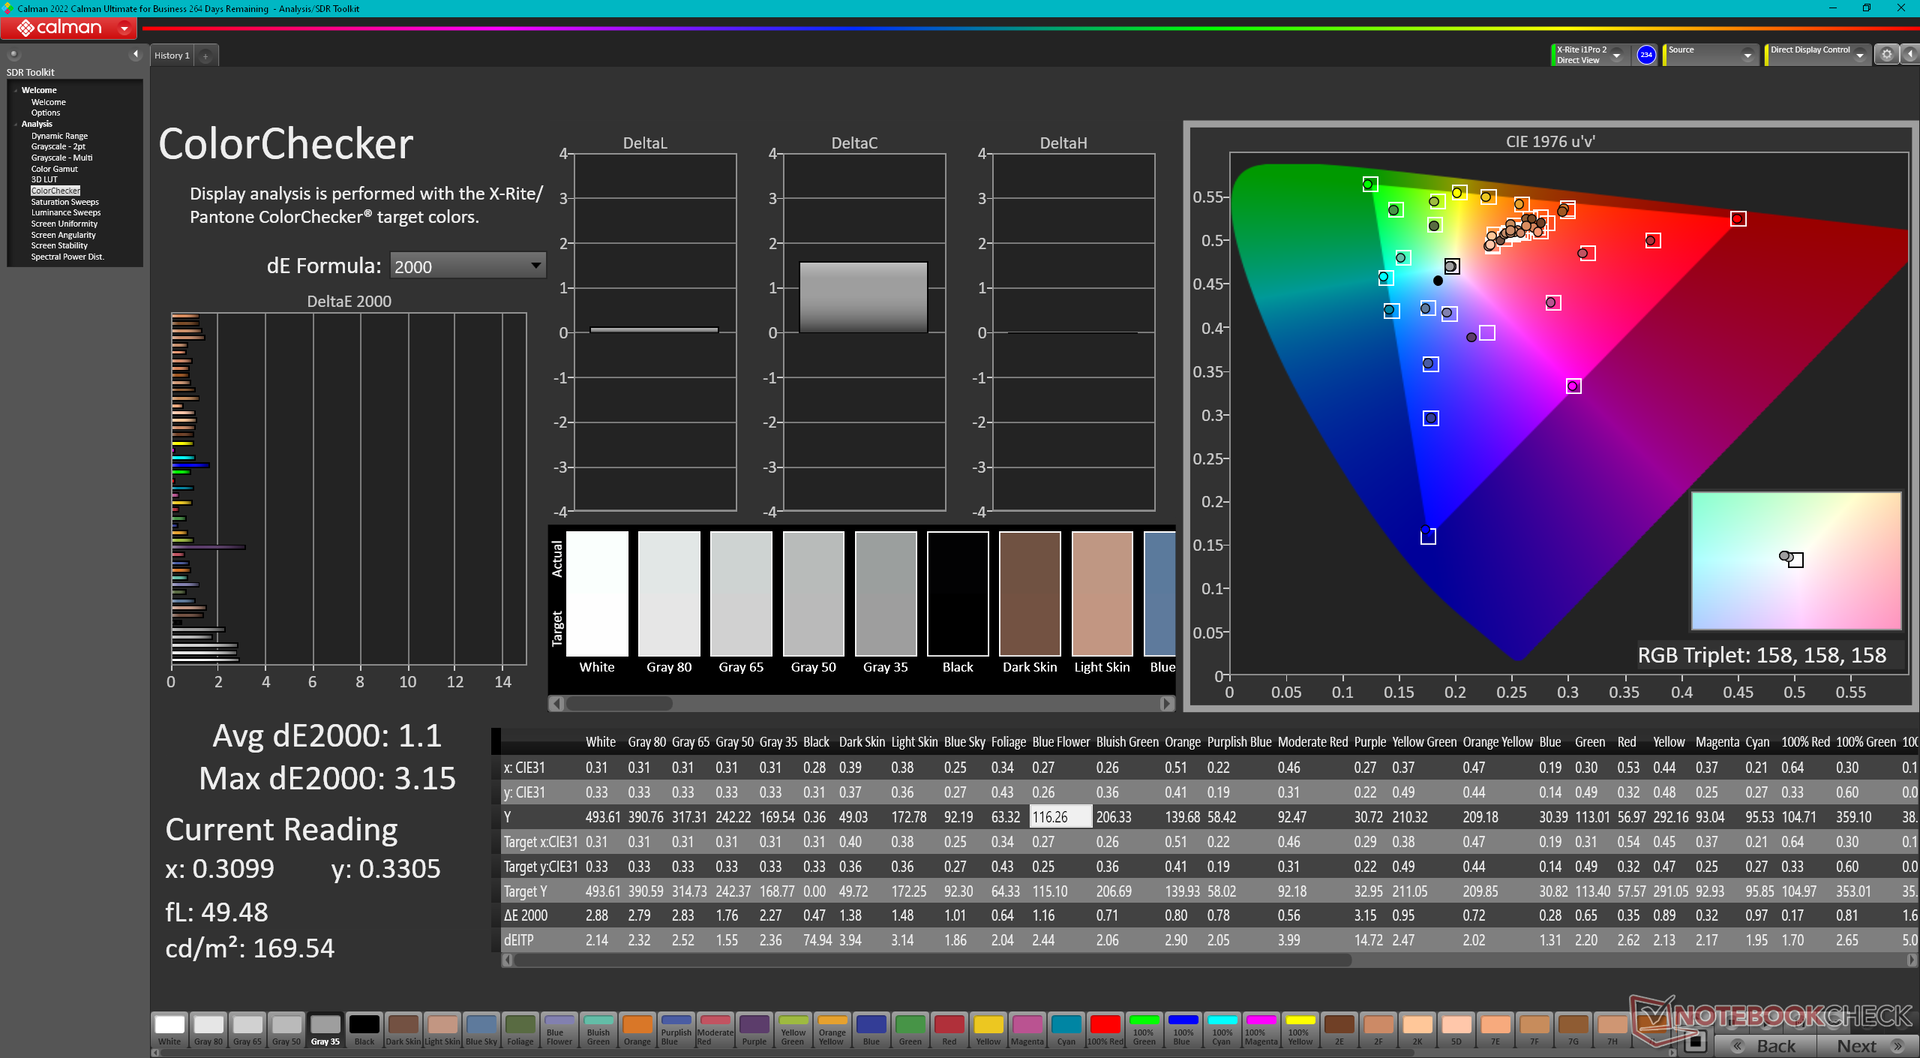
ΔE ColorChecker Calman: 1.23 | ∀{0.5-29.43 Ø4.71}
calibrated: 1.1
ΔE Greyscale Calman: 2 | ∀{0.09-98 Ø4.96}
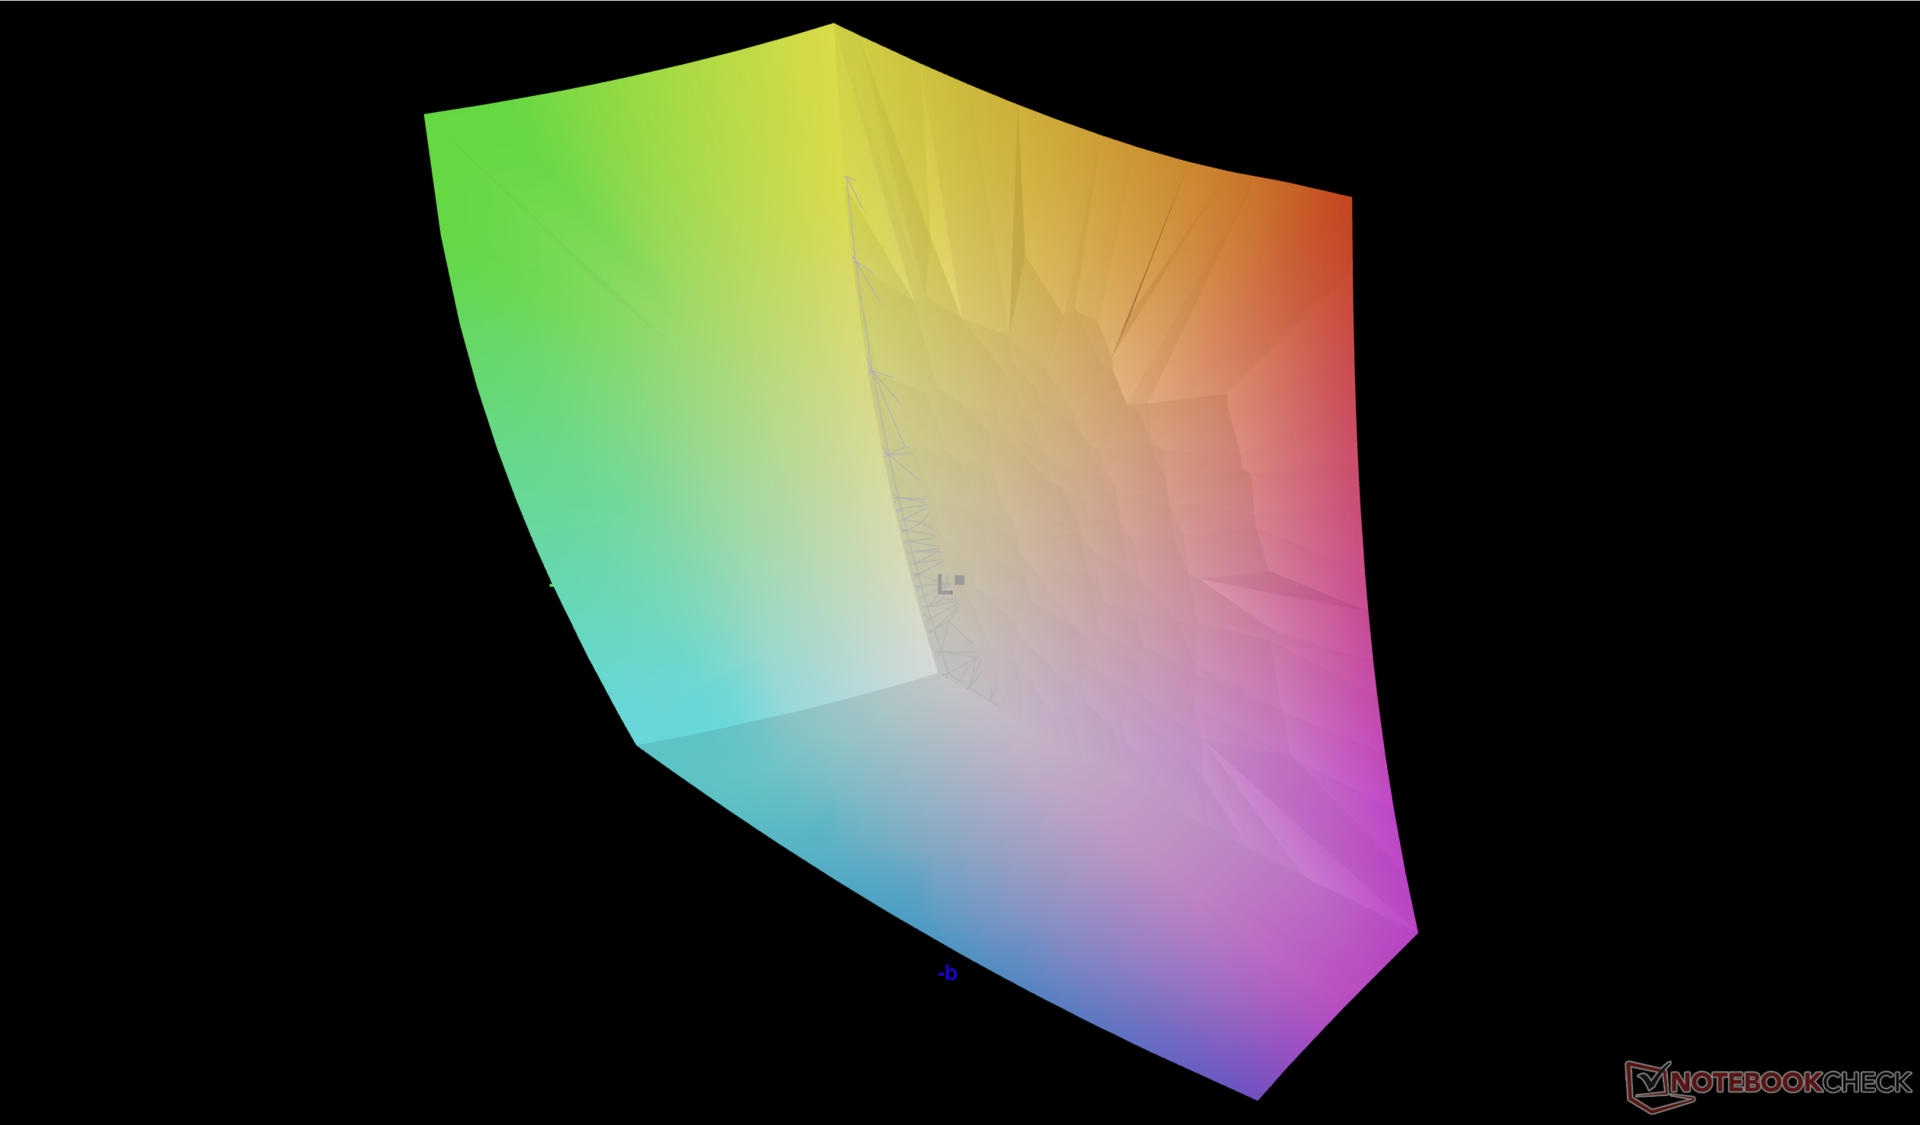
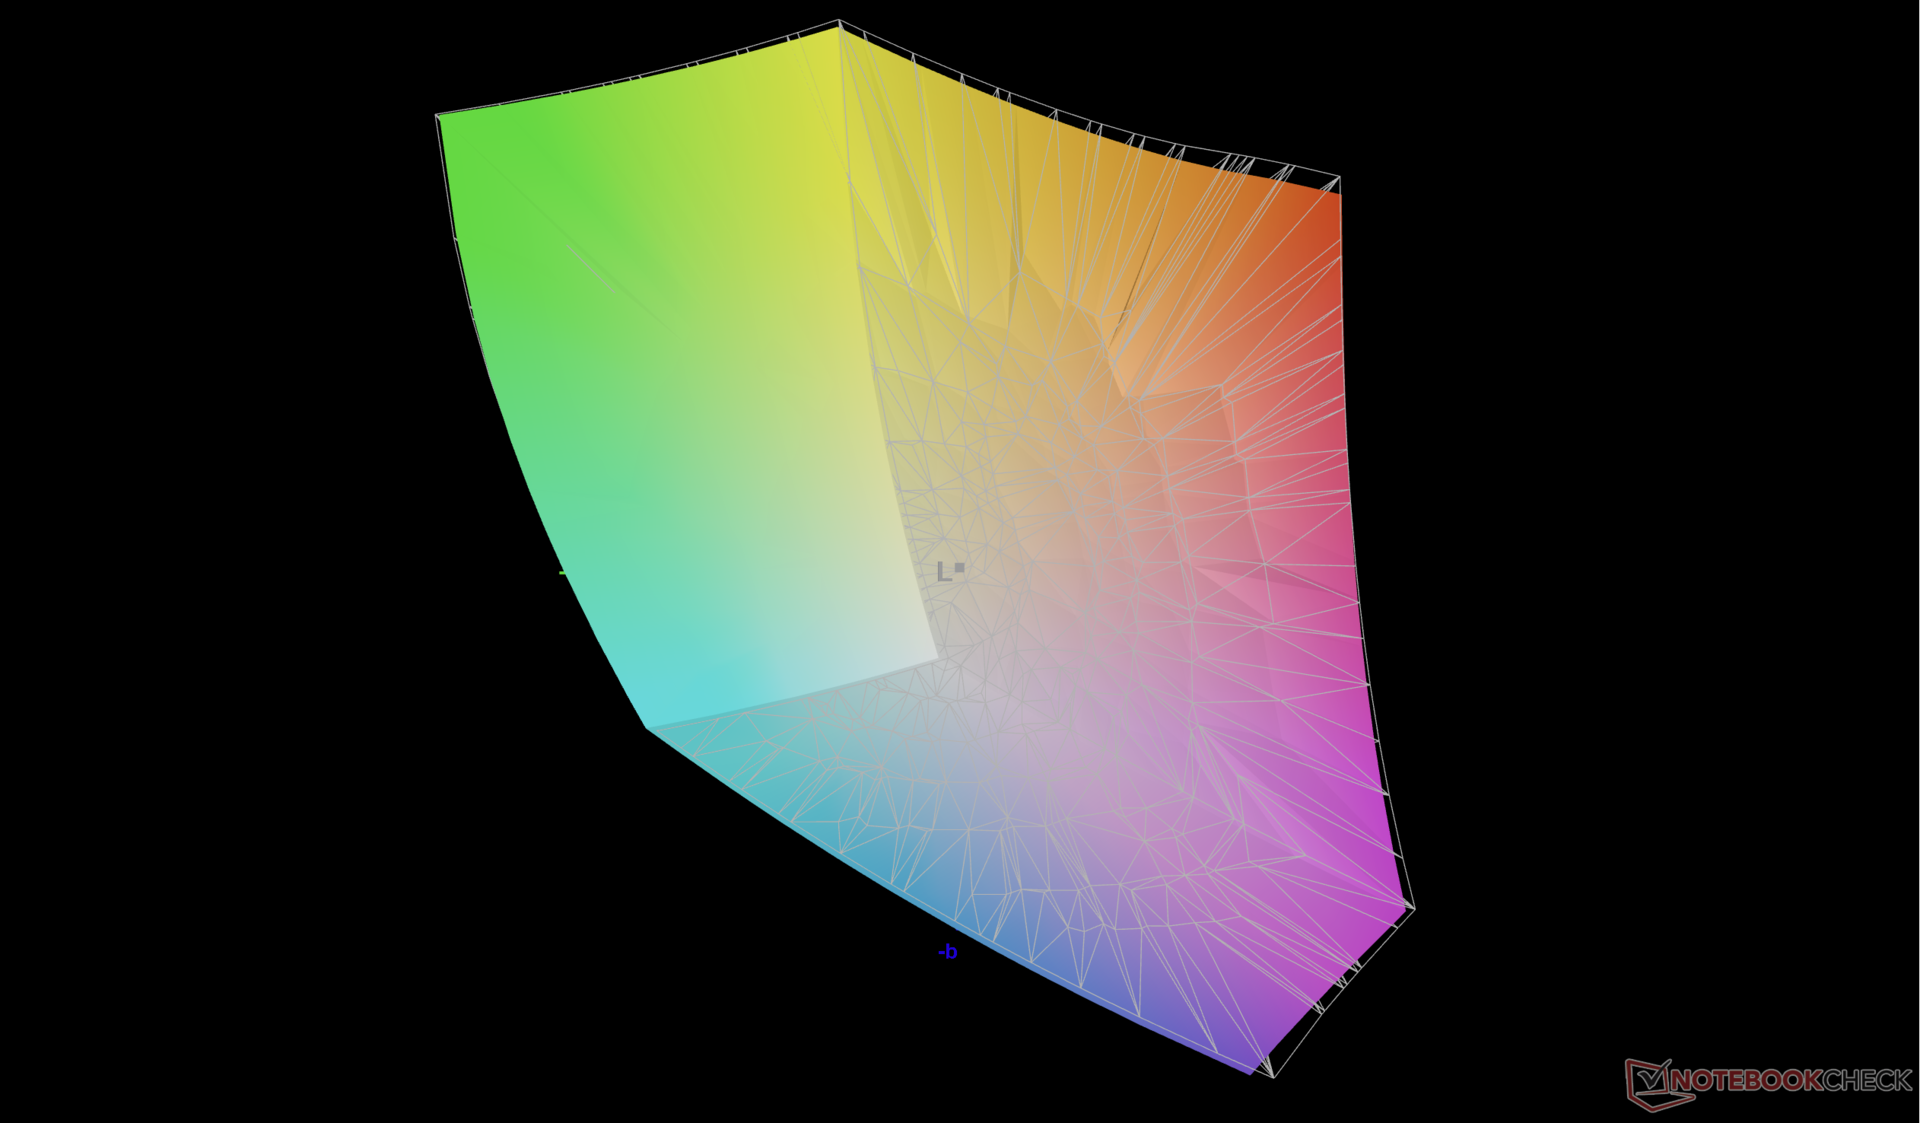
87% AdobeRGB 1998 (Argyll 3D)
99.7% sRGB (Argyll 3D)
97.7% Display P3 (Argyll 3D)
Gamma: 2.22
CCT: 6670 K
| Framework Laptop 16 2560x1600, 16" | MSI Prestige 16 B1MG-001US AU Optronics B160QAN03.R, IPS, 2560x1600, 16" | Lenovo ThinkPad Z16 Gen 2 Samsung ATNA60YV04-0, OLED, 3840x2400, 16" | Apple MacBook Pro 16 2023 M3 Max Mini-LED, 3456x2234, 16" | Dell Inspiron 16 Plus 7630 LG Philips 160WQ2, IPS, 2560x1600, 16" | HP Spectre x360 2-in-1 16-f1075ng AU Optronics AUO50A3, IPS, 3072x1920, 16" | |
|---|---|---|---|---|---|---|
| Display | -1% | 4% | 2% | -15% | -11% | |
| Display P3 Coverage (%) | 97.7 | 96.7 -1% | 99.7 2% | 99.2 2% | 70.1 -28% | 75.6 -23% |
| sRGB Coverage (%) | 99.7 | 99.8 0% | 100 0% | 99.6 0% | 100.2 1% | |
| AdobeRGB 1998 Coverage (%) | 87 | 84.6 -3% | 96.7 11% | 72.3 -17% | 77.2 -11% | |
| Response Times | -219% | 85% | -322% | -127% | -202% | |
| Response Time Grey 50% / Grey 80% * (ms) | 14.6 ? | 49.4 ? -238% | 1.86 ? 87% | 66.9 ? -358% | 35 ? -140% | 52 ? -256% |
| Response Time Black / White * (ms) | 11.3 ? | 33.9 ? -200% | 1.89 ? 83% | 43.6 ? -286% | 24.2 ? -114% | 28 ? -148% |
| PWM Frequency (Hz) | 60 ? | 14877 | ||||
| Screen | -70% | -6% | 15% | -50% | -120% | |
| Brightness middle (cd/m²) | 504.8 | 473.6 -6% | 390.1 -23% | 630 25% | 299.4 -41% | 425 -16% |
| Brightness (cd/m²) | 490 | 456 -7% | 393 -20% | 604 23% | 290 -41% | 406 -17% |
| Brightness Distribution (%) | 84 | 87 4% | 97 15% | 94 12% | 92 10% | 78 -7% |
| Black Level * (cd/m²) | 0.41 | 0.19 54% | 0.21 49% | 0.24 41% | ||
| Contrast (:1) | 1231 | 2493 103% | 1426 16% | 1771 44% | ||
| Colorchecker dE 2000 * | 1.23 | 5.9 -380% | 1.41 -15% | 1.2 2% | 4.25 -246% | 5.8 -372% |
| Colorchecker dE 2000 max. * | 3.74 | 9.37 -151% | 3.43 8% | 2.8 25% | 6.71 -79% | 11.03 -195% |
| Colorchecker dE 2000 calibrated * | 1.1 | 0.89 19% | 0.52 53% | 4.16 -278% | ||
| Greyscale dE 2000 * | 2 | 7.3 -265% | 2 -0% | 1.9 5% | 5.5 -175% | 7.57 -279% |
| Gamma | 2.22 99% | 1.9 116% | 2.22 99% | 2.29 96% | 2.35 94% | 6600 0% |
| CCT | 6670 97% | 7260 90% | 6324 103% | 6812 95% | 6368 102% | |
| Media totale (Programma / Settaggio) | -97% /
-77% | 28% /
13% | -102% /
-61% | -64% /
-54% | -111% /
-108% |
* ... Meglio usare valori piccoli
Il display viene fornito ben calibrato rispetto allo standard sRGB, anche se il pannello copre il 100% del DCI-P3. La calibrazione del display da parte nostra non migliorerebbe i suoi valori deltaE medi di un margine considerevole e quindi la calibrazione per l'utente finale non sarà necessaria per la maggior parte dei casi.

Tempi di risposta del Display
| ↔ Tempi di risposta dal Nero al Bianco | ||
|---|---|---|
| 11.3 ms ... aumenta ↗ e diminuisce ↘ combinato | ↗ 6.1 ms Incremento | 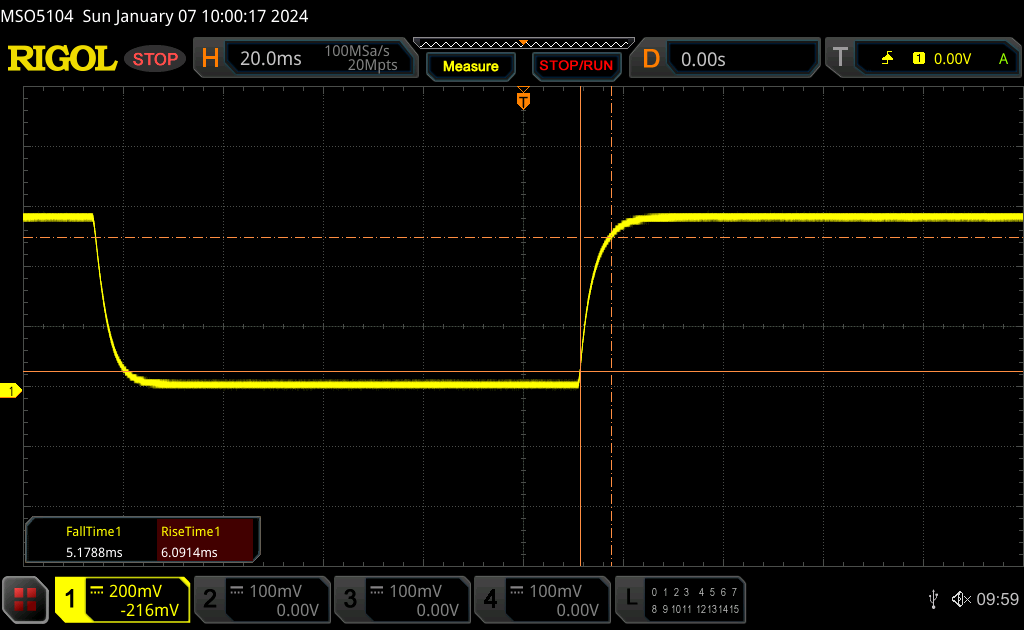 |
| ↘ 5.2 ms Calo | ||
| Lo schermo mostra buoni tempi di risposta durante i nostri tests, ma potrebbe essere troppo lento per i gamers competitivi. In confronto, tutti i dispositivi di test variano da 0.1 (minimo) a 240 (massimo) ms. » 31 % di tutti i dispositivi è migliore. Questo significa che i tempi di risposta rilevati sono migliori rispettto alla media di tutti i dispositivi testati (19.8 ms). | ||
| ↔ Tempo di risposta dal 50% Grigio all'80% Grigio | ||
| 14.6 ms ... aumenta ↗ e diminuisce ↘ combinato | ↗ 7.1 ms Incremento | 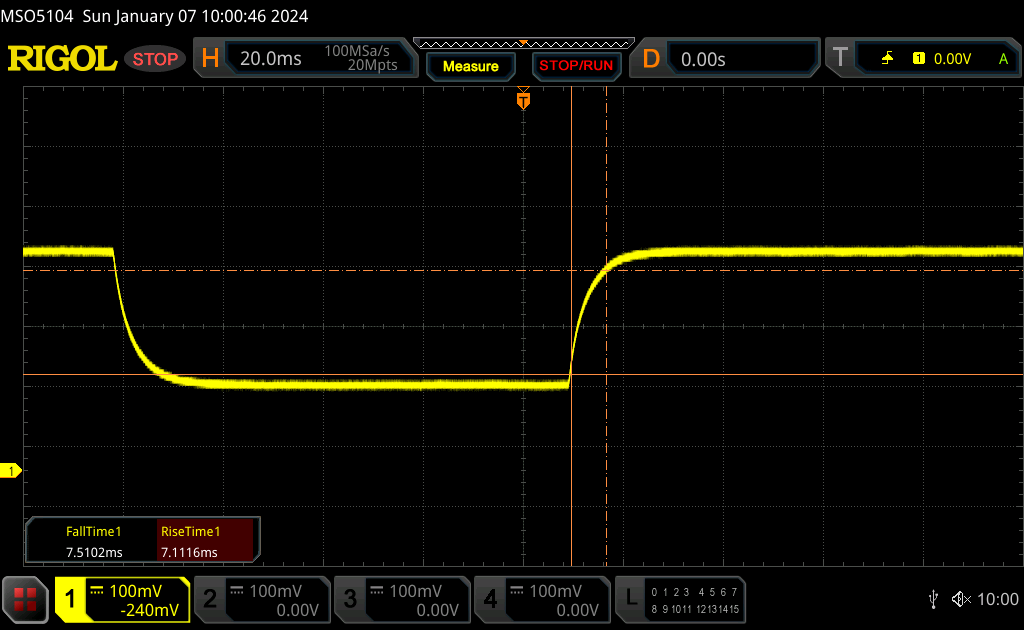 |
| ↘ 7.5 ms Calo | ||
| Lo schermo mostra buoni tempi di risposta durante i nostri tests, ma potrebbe essere troppo lento per i gamers competitivi. In confronto, tutti i dispositivi di test variano da 0.165 (minimo) a 636 (massimo) ms. » 29 % di tutti i dispositivi è migliore. Questo significa che i tempi di risposta rilevati sono migliori rispettto alla media di tutti i dispositivi testati (31 ms). | ||
Sfarfallio dello schermo / PWM (Pulse-Width Modulation)
| flickering dello schermo / PWM non rilevato |  | ||
In confronto: 52 % di tutti i dispositivi testati non utilizza PWM per ridurre la luminosita' del display. Se è rilevato PWM, una media di 7757 (minimo: 5 - massimo: 343500) Hz è stata rilevata. | |||
Con 500 nits, il display è più luminoso di molti altri computer portatili multimediali, compresi i pannelli OLED di ThinkPad Z16 Gen 2 o MSI Stealth 16. L'elevata luminosità e il pannello opaco rendono lo schermo più facile da vedere in condizioni esterne.
Prestazioni - Non sono necessari Intel o Nvidia
Condizioni del test
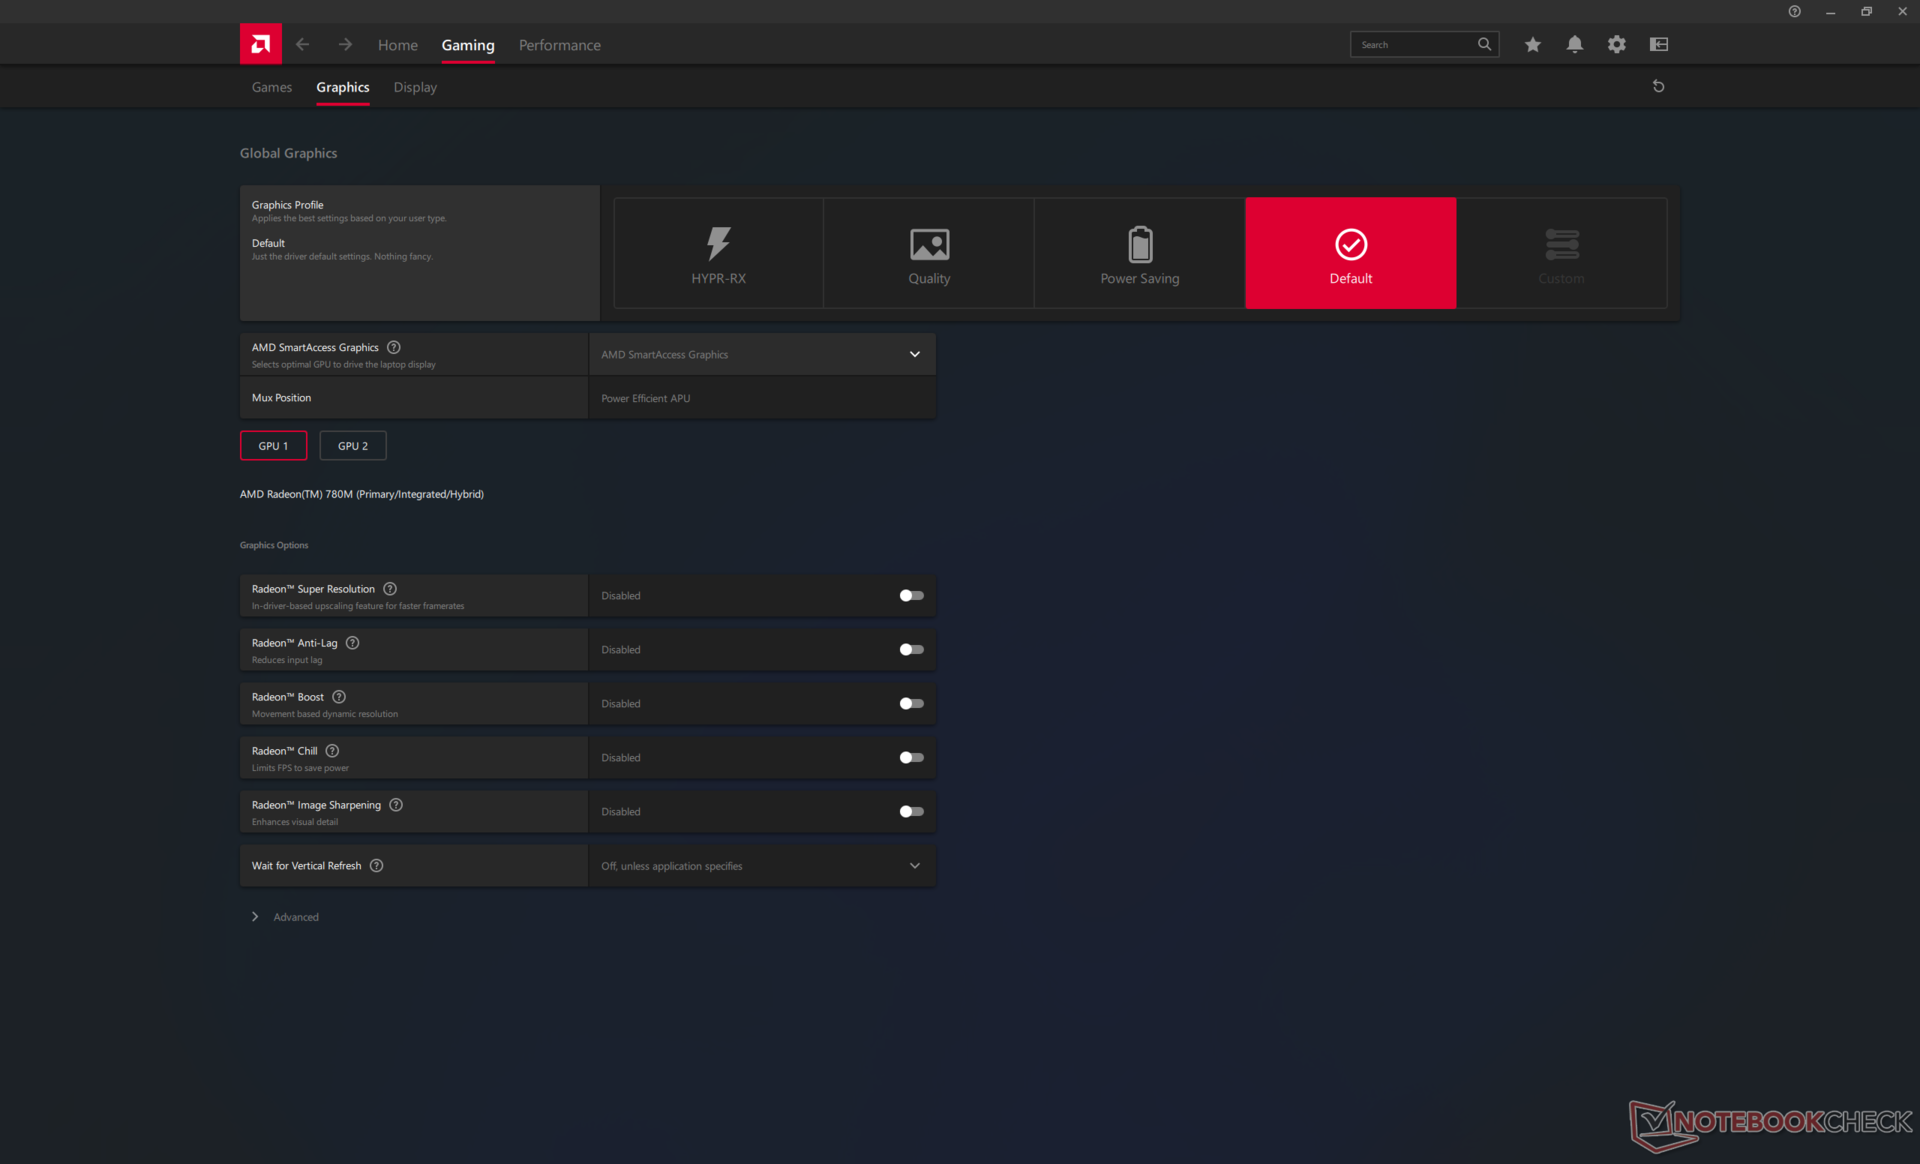
Abbiamo impostato Windows in modalità Prestazioni e AMD Adrenalin su Default prima di eseguire i benchmark qui sotto. SmartAccess Graphics è la soluzione MUX di AMD per passare automaticamente dall'iGPU alla dGPU a seconda dell'applicazione. Il problema è che, a differenza di quanto accade sui portatili GeForce, SmartAccess Graphics non offre una modalità "solo dGPU" o "solo iGPU" e quindi l'esperienza grafica si basa interamente sulla commutazione automatica. Il sistema deve bloccarsi per un paio di secondi ogni volta che rileva un'applicazione che richiede la GPU, il che può essere fastidioso quando si fa multi-tasking tra diverse finestre. L'implementazione di una modalità "solo dGPU" avrebbe risolto questo problema.
Processore
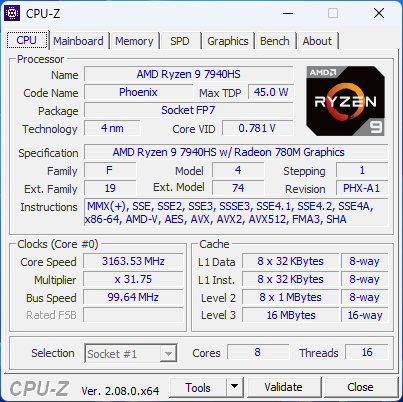
Il Ryzen 9 7940HS è comunemente presente nei portatili multimediali o da gioco veloci come l' Asus ROG Zephyrus G14 o TUF Gaming A17. È in concorrenza diretta con il Core i7-13700H di 13a generazione Core i7-13700H e quindi i due processori sono approssimativamente comparabili.
Framework offre il Ryzen 7 7840HS su configurazioni inferiori del Laptop 16. In base alla nostra esperienza con il Lenovo Legion Slim 7 16APH8tuttavia, il Ryzen 7 7840HS è essenzialmente un testa a testa con il Ryzen 9 7940HS, nonostante le differenze di prezzo e la convenzione di denominazione possano suggerire. Se non ha bisogno di quel 5 percento di prestazioni in più di Ryzen 9, può risparmiare centinaia di dollari scegliendo l'opzione Ryzen 7.
È un peccato che Framework non offra il Ryzen 9 Pro 7940HS, che avrebbe reso il Laptop 16 più interessante per i professionisti.
Cinebench R15 Multi Loop
Cinebench R23: Multi Core | Single Core
Cinebench R20: CPU (Multi Core) | CPU (Single Core)
Cinebench R15: CPU Multi 64Bit | CPU Single 64Bit
Blender: v2.79 BMW27 CPU
7-Zip 18.03: 7z b 4 | 7z b 4 -mmt1
Geekbench 5.5: Multi-Core | Single-Core
HWBOT x265 Benchmark v2.2: 4k Preset
LibreOffice : 20 Documents To PDF
R Benchmark 2.5: Overall mean
* ... Meglio usare valori piccoli
AIDA64: FP32 Ray-Trace | FPU Julia | CPU SHA3 | CPU Queen | FPU SinJulia | FPU Mandel | CPU AES | CPU ZLib | FP64 Ray-Trace | CPU PhotoWorxx
| Performance rating | |
| Framework Laptop 16 | |
| Media AMD Ryzen 9 7940HS | |
| Lenovo ThinkPad Z16 Gen 2 | |
| MSI Prestige 16 B1MG-001US | |
| Dell Inspiron 16 Plus 7630 | |
| HP Spectre x360 2-in-1 16-f1075ng | |
| AIDA64 / FP32 Ray-Trace | |
| Lenovo ThinkPad Z16 Gen 2 | |
| Framework Laptop 16 | |
| Media AMD Ryzen 9 7940HS (25226 - 29109, n=10) | |
| MSI Prestige 16 B1MG-001US | |
| Dell Inspiron 16 Plus 7630 | |
| HP Spectre x360 2-in-1 16-f1075ng | |
| AIDA64 / FPU Julia | |
| Lenovo ThinkPad Z16 Gen 2 | |
| Media AMD Ryzen 9 7940HS (106512 - 123214, n=10) | |
| Framework Laptop 16 | |
| MSI Prestige 16 B1MG-001US | |
| Dell Inspiron 16 Plus 7630 | |
| HP Spectre x360 2-in-1 16-f1075ng | |
| AIDA64 / CPU SHA3 | |
| Lenovo ThinkPad Z16 Gen 2 | |
| Framework Laptop 16 | |
| Media AMD Ryzen 9 7940HS (4566 - 5119, n=10) | |
| MSI Prestige 16 B1MG-001US | |
| Dell Inspiron 16 Plus 7630 | |
| HP Spectre x360 2-in-1 16-f1075ng | |
| AIDA64 / CPU Queen | |
| Lenovo ThinkPad Z16 Gen 2 | |
| Framework Laptop 16 | |
| Media AMD Ryzen 9 7940HS (118174 - 124783, n=10) | |
| Dell Inspiron 16 Plus 7630 | |
| MSI Prestige 16 B1MG-001US | |
| HP Spectre x360 2-in-1 16-f1075ng | |
| AIDA64 / FPU SinJulia | |
| Lenovo ThinkPad Z16 Gen 2 | |
| Media AMD Ryzen 9 7940HS (14663 - 15551, n=10) | |
| Framework Laptop 16 | |
| MSI Prestige 16 B1MG-001US | |
| Dell Inspiron 16 Plus 7630 | |
| HP Spectre x360 2-in-1 16-f1075ng | |
| AIDA64 / FPU Mandel | |
| Lenovo ThinkPad Z16 Gen 2 | |
| Media AMD Ryzen 9 7940HS (56839 - 66238, n=10) | |
| Framework Laptop 16 | |
| MSI Prestige 16 B1MG-001US | |
| Dell Inspiron 16 Plus 7630 | |
| HP Spectre x360 2-in-1 16-f1075ng | |
| AIDA64 / CPU AES | |
| Framework Laptop 16 | |
| Media AMD Ryzen 9 7940HS (86309 - 171350, n=10) | |
| HP Spectre x360 2-in-1 16-f1075ng | |
| Lenovo ThinkPad Z16 Gen 2 | |
| MSI Prestige 16 B1MG-001US | |
| Dell Inspiron 16 Plus 7630 | |
| AIDA64 / CPU ZLib | |
| Lenovo ThinkPad Z16 Gen 2 | |
| Media AMD Ryzen 9 7940HS (866 - 1152, n=10) | |
| MSI Prestige 16 B1MG-001US | |
| Framework Laptop 16 | |
| Dell Inspiron 16 Plus 7630 | |
| HP Spectre x360 2-in-1 16-f1075ng | |
| AIDA64 / FP64 Ray-Trace | |
| Lenovo ThinkPad Z16 Gen 2 | |
| Media AMD Ryzen 9 7940HS (13175 - 15675, n=10) | |
| Framework Laptop 16 | |
| MSI Prestige 16 B1MG-001US | |
| Dell Inspiron 16 Plus 7630 | |
| HP Spectre x360 2-in-1 16-f1075ng | |
| AIDA64 / CPU PhotoWorxx | |
| MSI Prestige 16 B1MG-001US | |
| Framework Laptop 16 | |
| Dell Inspiron 16 Plus 7630 | |
| Lenovo ThinkPad Z16 Gen 2 | |
| Media AMD Ryzen 9 7940HS (22477 - 41567, n=10) | |
| HP Spectre x360 2-in-1 16-f1075ng | |
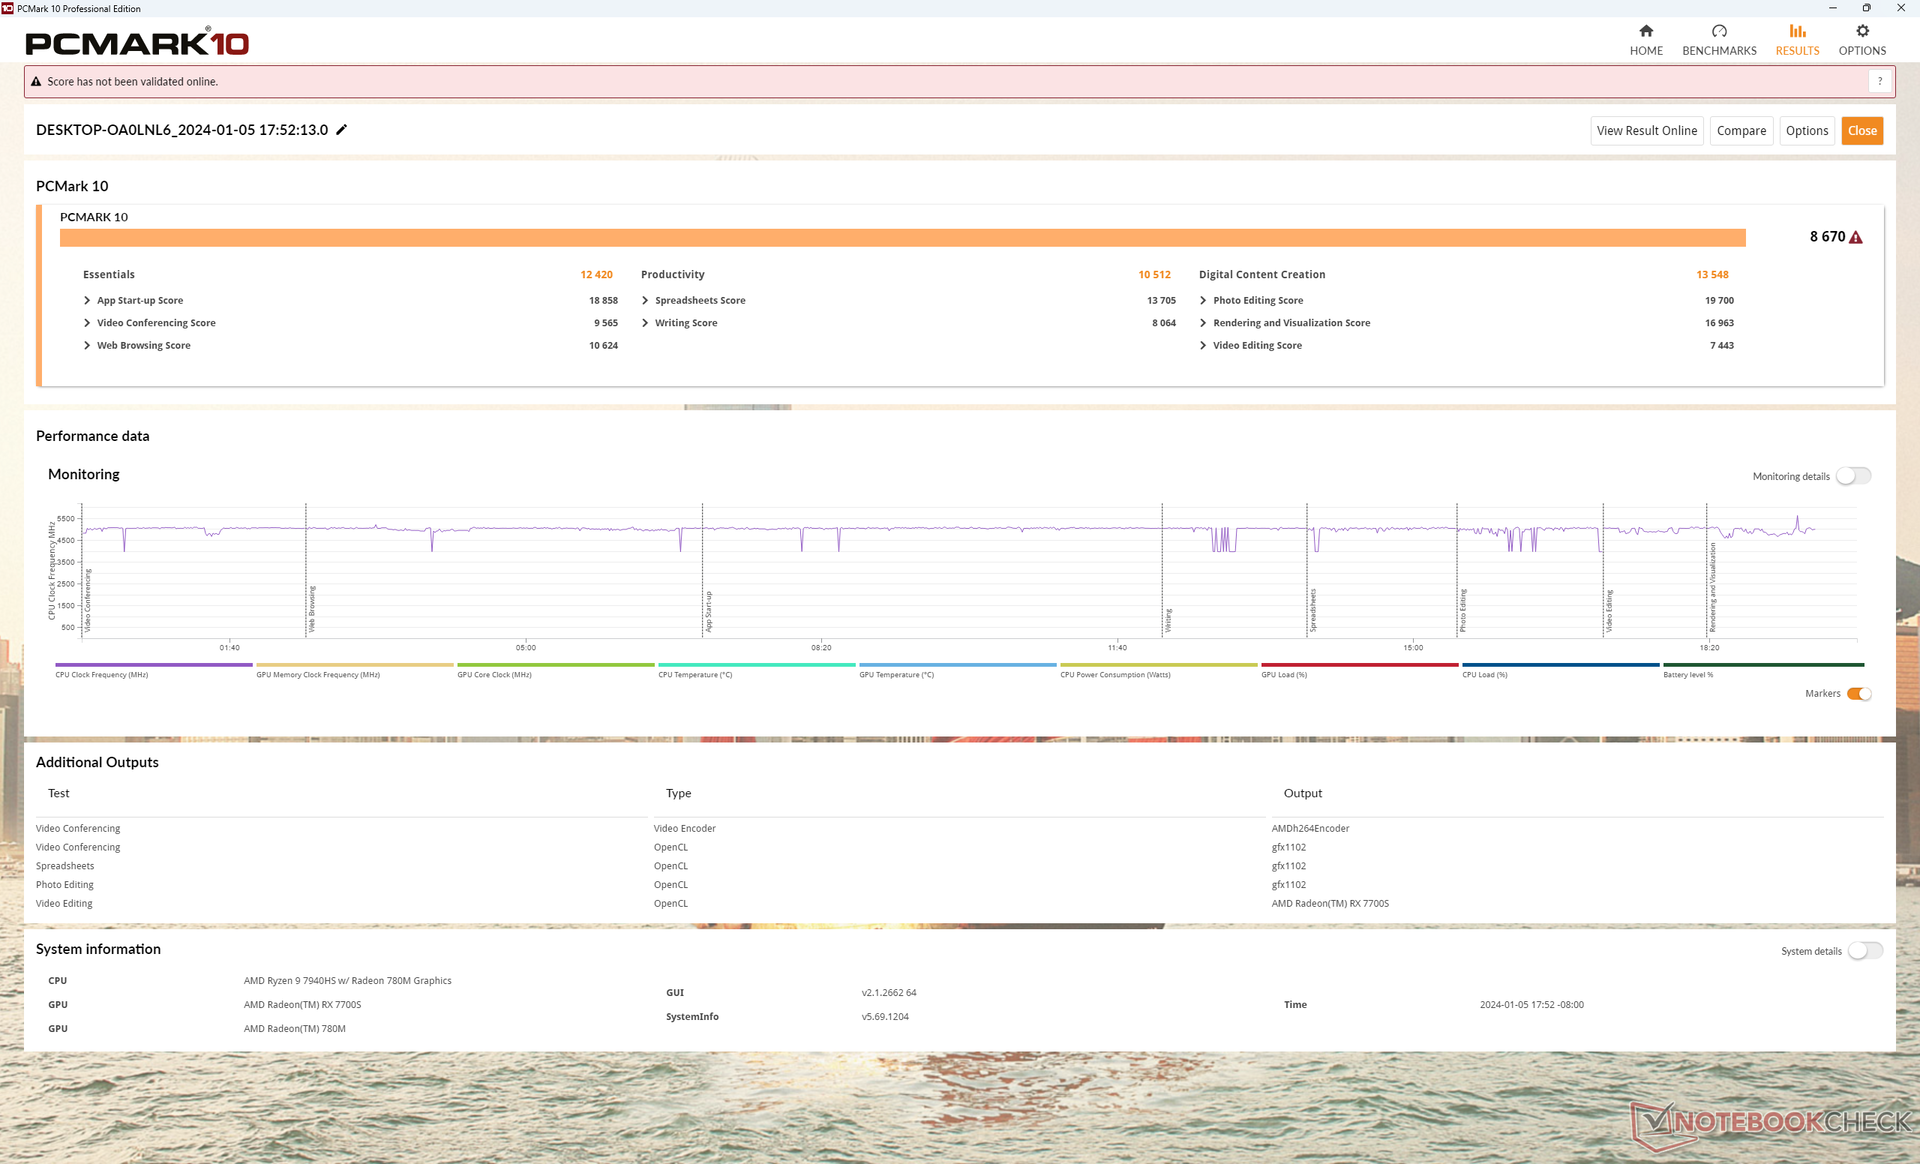
Prestazioni del sistema
I punteggi PCMark 10 sono tra i più alti di qualsiasi portatile multimediale da 16 pollici, grazie alla veloce CPU Ryzen 9 Zen 4 e alla grafica Radeon associata. I punteggi elevati di PCMark dimostrano che il Framework 16 può essere altrettanto veloce di altri portatili ad alte prestazioni nell'esecuzione di attività quotidiane, dai browser agli editor grafici.
CrossMark: Overall | Productivity | Creativity | Responsiveness
WebXPRT 3: Overall
WebXPRT 4: Overall
Mozilla Kraken 1.1: Total
| PCMark 10 / Score | |
| Framework Laptop 16 | |
| Media AMD Ryzen 9 7940HS, AMD Radeon RX 7700S (n=1) | |
| Lenovo ThinkPad Z16 Gen 2 | |
| Dell Inspiron 16 Plus 7630 | |
| MSI Prestige 16 B1MG-001US | |
| HP Spectre x360 2-in-1 16-f1075ng | |
| PCMark 10 / Essentials | |
| Framework Laptop 16 | |
| Media AMD Ryzen 9 7940HS, AMD Radeon RX 7700S (n=1) | |
| Lenovo ThinkPad Z16 Gen 2 | |
| Dell Inspiron 16 Plus 7630 | |
| MSI Prestige 16 B1MG-001US | |
| HP Spectre x360 2-in-1 16-f1075ng | |
| PCMark 10 / Productivity | |
| Framework Laptop 16 | |
| Media AMD Ryzen 9 7940HS, AMD Radeon RX 7700S (n=1) | |
| Lenovo ThinkPad Z16 Gen 2 | |
| Dell Inspiron 16 Plus 7630 | |
| MSI Prestige 16 B1MG-001US | |
| HP Spectre x360 2-in-1 16-f1075ng | |
| PCMark 10 / Digital Content Creation | |
| Framework Laptop 16 | |
| Media AMD Ryzen 9 7940HS, AMD Radeon RX 7700S (n=1) | |
| Dell Inspiron 16 Plus 7630 | |
| Lenovo ThinkPad Z16 Gen 2 | |
| MSI Prestige 16 B1MG-001US | |
| HP Spectre x360 2-in-1 16-f1075ng | |
| CrossMark / Overall | |
| Apple MacBook Pro 16 2023 M3 Max | |
| Dell Inspiron 16 Plus 7630 | |
| MSI Prestige 16 B1MG-001US | |
| HP Spectre x360 2-in-1 16-f1075ng | |
| Framework Laptop 16 | |
| Media AMD Ryzen 9 7940HS, AMD Radeon RX 7700S (n=1) | |
| Lenovo ThinkPad Z16 Gen 2 | |
| CrossMark / Productivity | |
| Apple MacBook Pro 16 2023 M3 Max | |
| Dell Inspiron 16 Plus 7630 | |
| HP Spectre x360 2-in-1 16-f1075ng | |
| MSI Prestige 16 B1MG-001US | |
| Framework Laptop 16 | |
| Media AMD Ryzen 9 7940HS, AMD Radeon RX 7700S (n=1) | |
| Lenovo ThinkPad Z16 Gen 2 | |
| CrossMark / Creativity | |
| Apple MacBook Pro 16 2023 M3 Max | |
| Dell Inspiron 16 Plus 7630 | |
| MSI Prestige 16 B1MG-001US | |
| Framework Laptop 16 | |
| Media AMD Ryzen 9 7940HS, AMD Radeon RX 7700S (n=1) | |
| Lenovo ThinkPad Z16 Gen 2 | |
| HP Spectre x360 2-in-1 16-f1075ng | |
| CrossMark / Responsiveness | |
| HP Spectre x360 2-in-1 16-f1075ng | |
| Dell Inspiron 16 Plus 7630 | |
| MSI Prestige 16 B1MG-001US | |
| Apple MacBook Pro 16 2023 M3 Max | |
| Framework Laptop 16 | |
| Media AMD Ryzen 9 7940HS, AMD Radeon RX 7700S (n=1) | |
| Lenovo ThinkPad Z16 Gen 2 | |
| WebXPRT 3 / Overall | |
| Apple MacBook Pro 16 2023 M3 Max | |
| Framework Laptop 16 | |
| Media AMD Ryzen 9 7940HS, AMD Radeon RX 7700S (n=1) | |
| Lenovo ThinkPad Z16 Gen 2 | |
| Dell Inspiron 16 Plus 7630 | |
| MSI Prestige 16 B1MG-001US | |
| HP Spectre x360 2-in-1 16-f1075ng | |
| WebXPRT 4 / Overall | |
| Dell Inspiron 16 Plus 7630 | |
| Framework Laptop 16 | |
| Media AMD Ryzen 9 7940HS, AMD Radeon RX 7700S (n=1) | |
| MSI Prestige 16 B1MG-001US | |
| Lenovo ThinkPad Z16 Gen 2 | |
| HP Spectre x360 2-in-1 16-f1075ng | |
| Mozilla Kraken 1.1 / Total | |
| Lenovo ThinkPad Z16 Gen 2 | |
| MSI Prestige 16 B1MG-001US | |
| HP Spectre x360 2-in-1 16-f1075ng | |
| Dell Inspiron 16 Plus 7630 | |
| Framework Laptop 16 | |
| Media AMD Ryzen 9 7940HS, AMD Radeon RX 7700S (n=1) | |
| Apple MacBook Pro 16 2023 M3 Max | |
* ... Meglio usare valori piccoli
| PCMark 10 Score | 8670 punti | |
Aiuto | ||
| AIDA64 / Memory Copy | |
| MSI Prestige 16 B1MG-001US | |
| Framework Laptop 16 | |
| Lenovo ThinkPad Z16 Gen 2 | |
| Media AMD Ryzen 9 7940HS (35327 - 78739, n=10) | |
| Dell Inspiron 16 Plus 7630 | |
| HP Spectre x360 2-in-1 16-f1075ng | |
| AIDA64 / Memory Read | |
| MSI Prestige 16 B1MG-001US | |
| Dell Inspiron 16 Plus 7630 | |
| Framework Laptop 16 | |
| Media AMD Ryzen 9 7940HS (30769 - 61836, n=10) | |
| Lenovo ThinkPad Z16 Gen 2 | |
| HP Spectre x360 2-in-1 16-f1075ng | |
| AIDA64 / Memory Write | |
| Lenovo ThinkPad Z16 Gen 2 | |
| Framework Laptop 16 | |
| Media AMD Ryzen 9 7940HS (42217 - 91567, n=10) | |
| MSI Prestige 16 B1MG-001US | |
| Dell Inspiron 16 Plus 7630 | |
| HP Spectre x360 2-in-1 16-f1075ng | |
| AIDA64 / Memory Latency | |
| MSI Prestige 16 B1MG-001US | |
| Lenovo ThinkPad Z16 Gen 2 | |
| Dell Inspiron 16 Plus 7630 | |
| Media AMD Ryzen 9 7940HS (87.6 - 111.1, n=10) | |
| Framework Laptop 16 | |
| HP Spectre x360 2-in-1 16-f1075ng | |
* ... Meglio usare valori piccoli
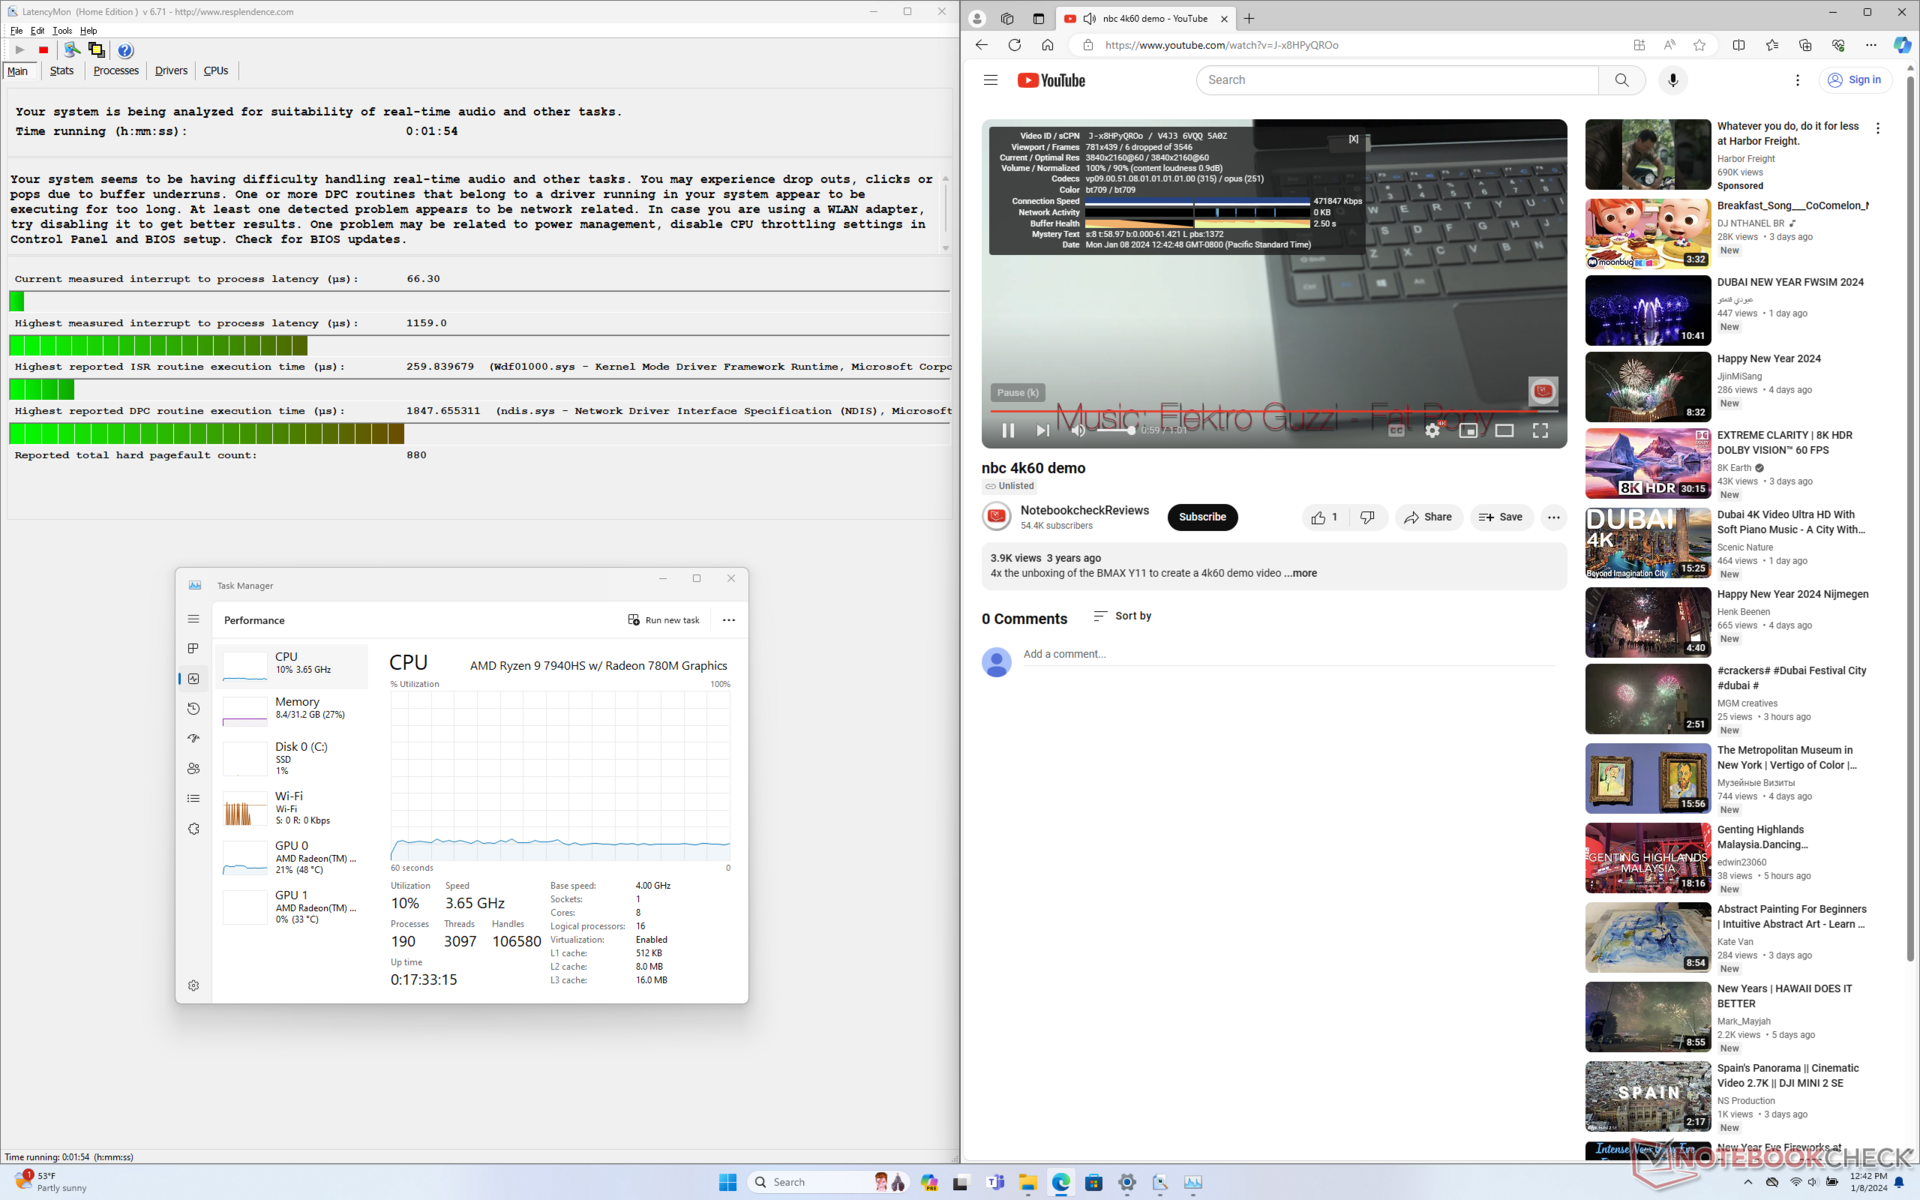
Latenza DPC
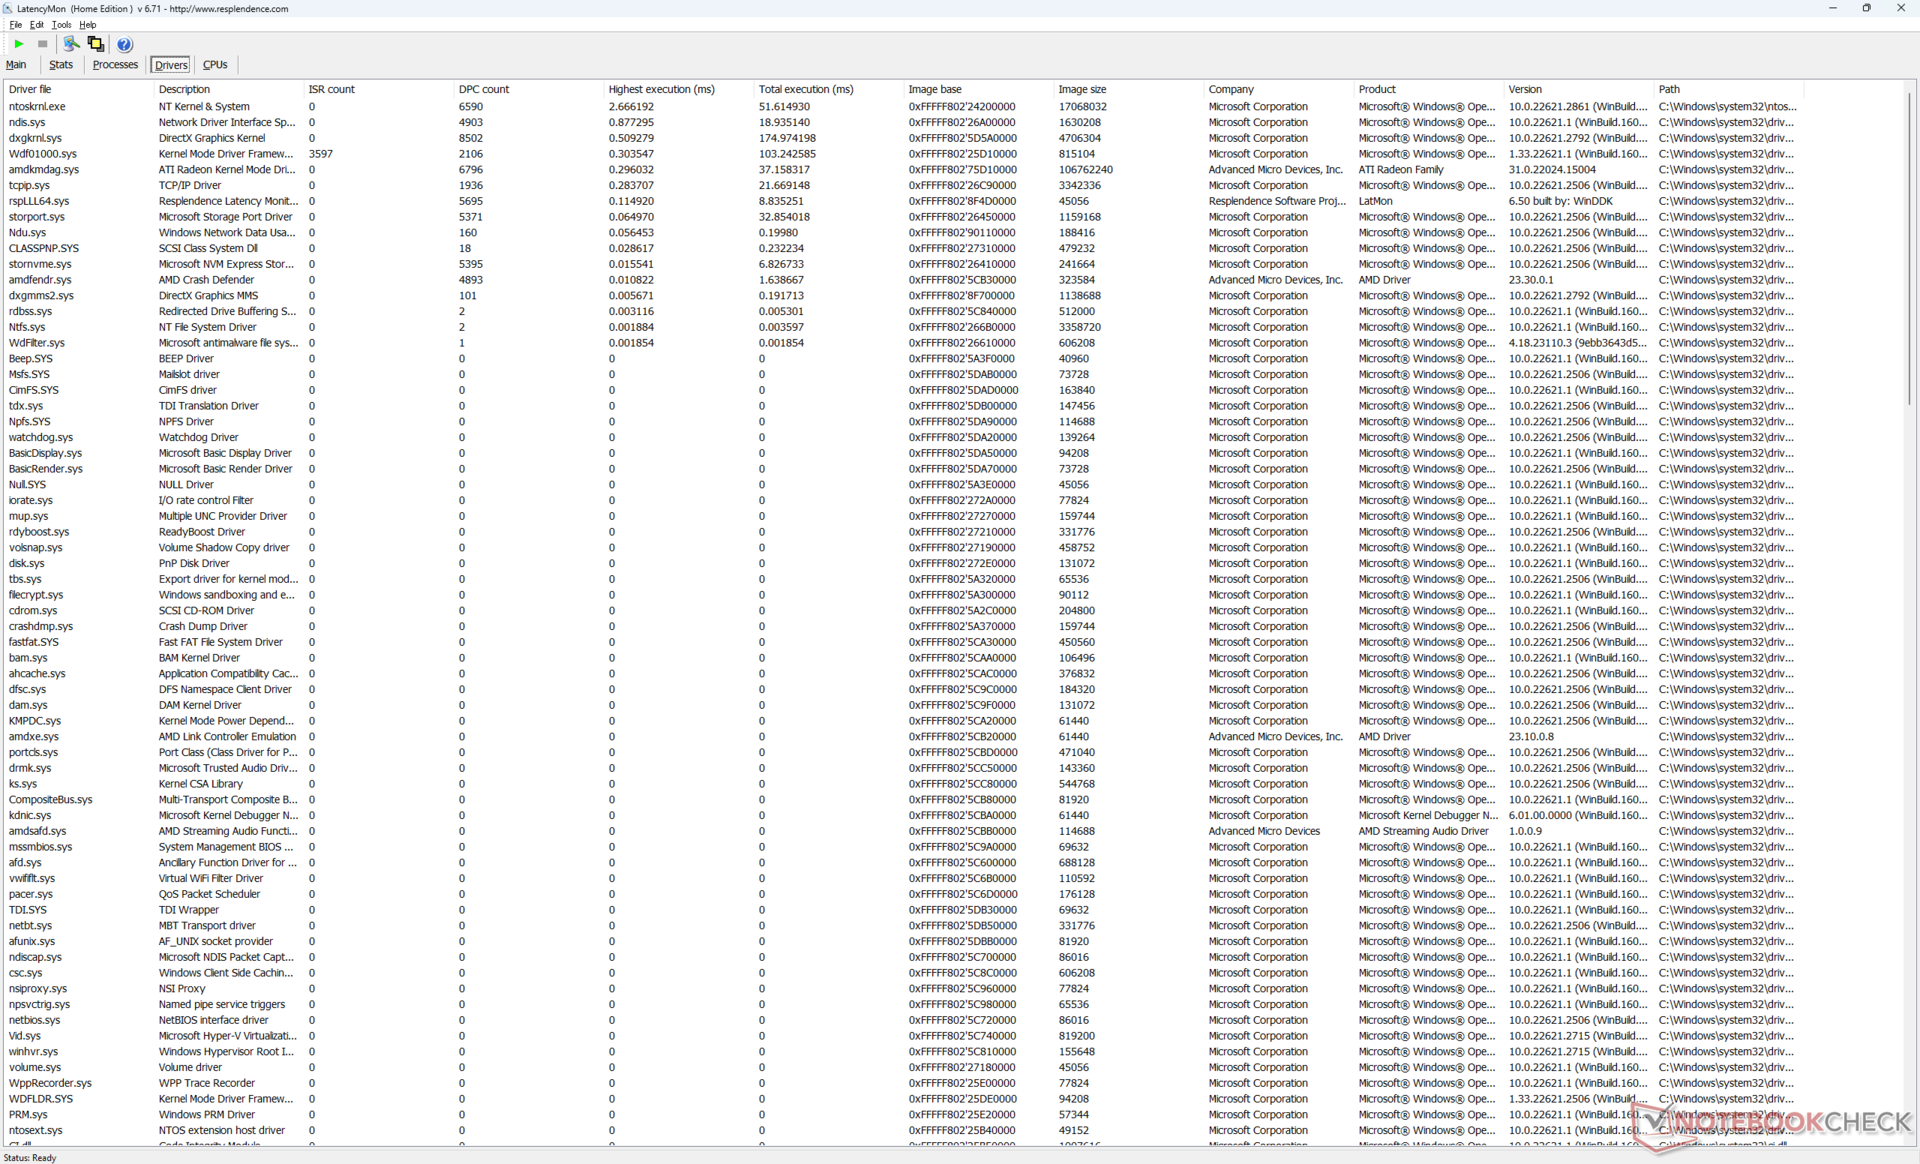
LatencyMon rivela problemi di DPC quando si aprono più schede del browser della nostra homepage. Inoltre, siamo in grado di registrare 6 fotogrammi caduti durante un periodo di tempo di un minuto durante la riproduzione di video 4K60. Ciascuna caduta di fotogrammi si è verificata a intervalli quasi regolari, suggerendo un problema di driver sottostante potenzialmente legato alle GPU AMD. Secondo la nostra esperienza, la maggior parte dei laptop basati su Intel non soffre di problemi simili ed è più probabile che non si verifichino cadute di fotogrammi quando si esegue lo stesso test.
| DPC Latencies / LatencyMon - interrupt to process latency (max), Web, Youtube, Prime95 | |
| Lenovo ThinkPad Z16 Gen 2 | |
| Framework Laptop 16 | |
| HP Spectre x360 2-in-1 16-f1075ng | |
| Dell Inspiron 16 Plus 7630 | |
| MSI Prestige 16 B1MG-001US | |
* ... Meglio usare valori piccoli
Dispositivi di archiviazione
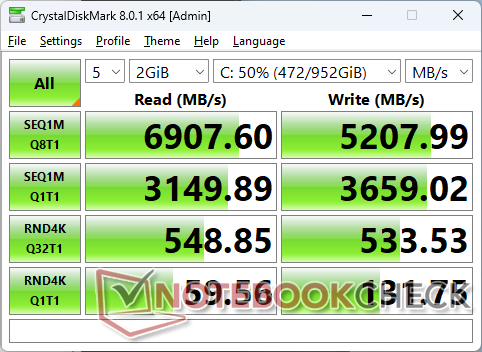
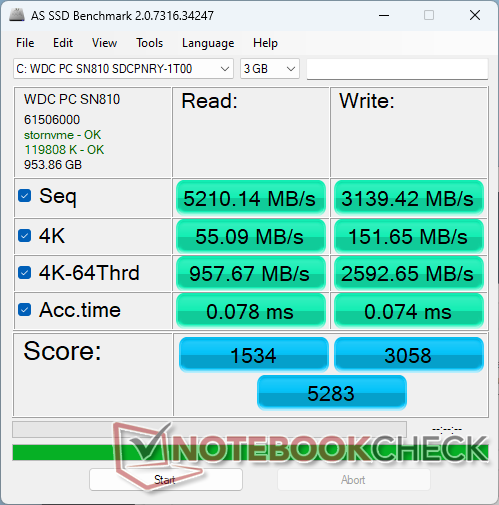
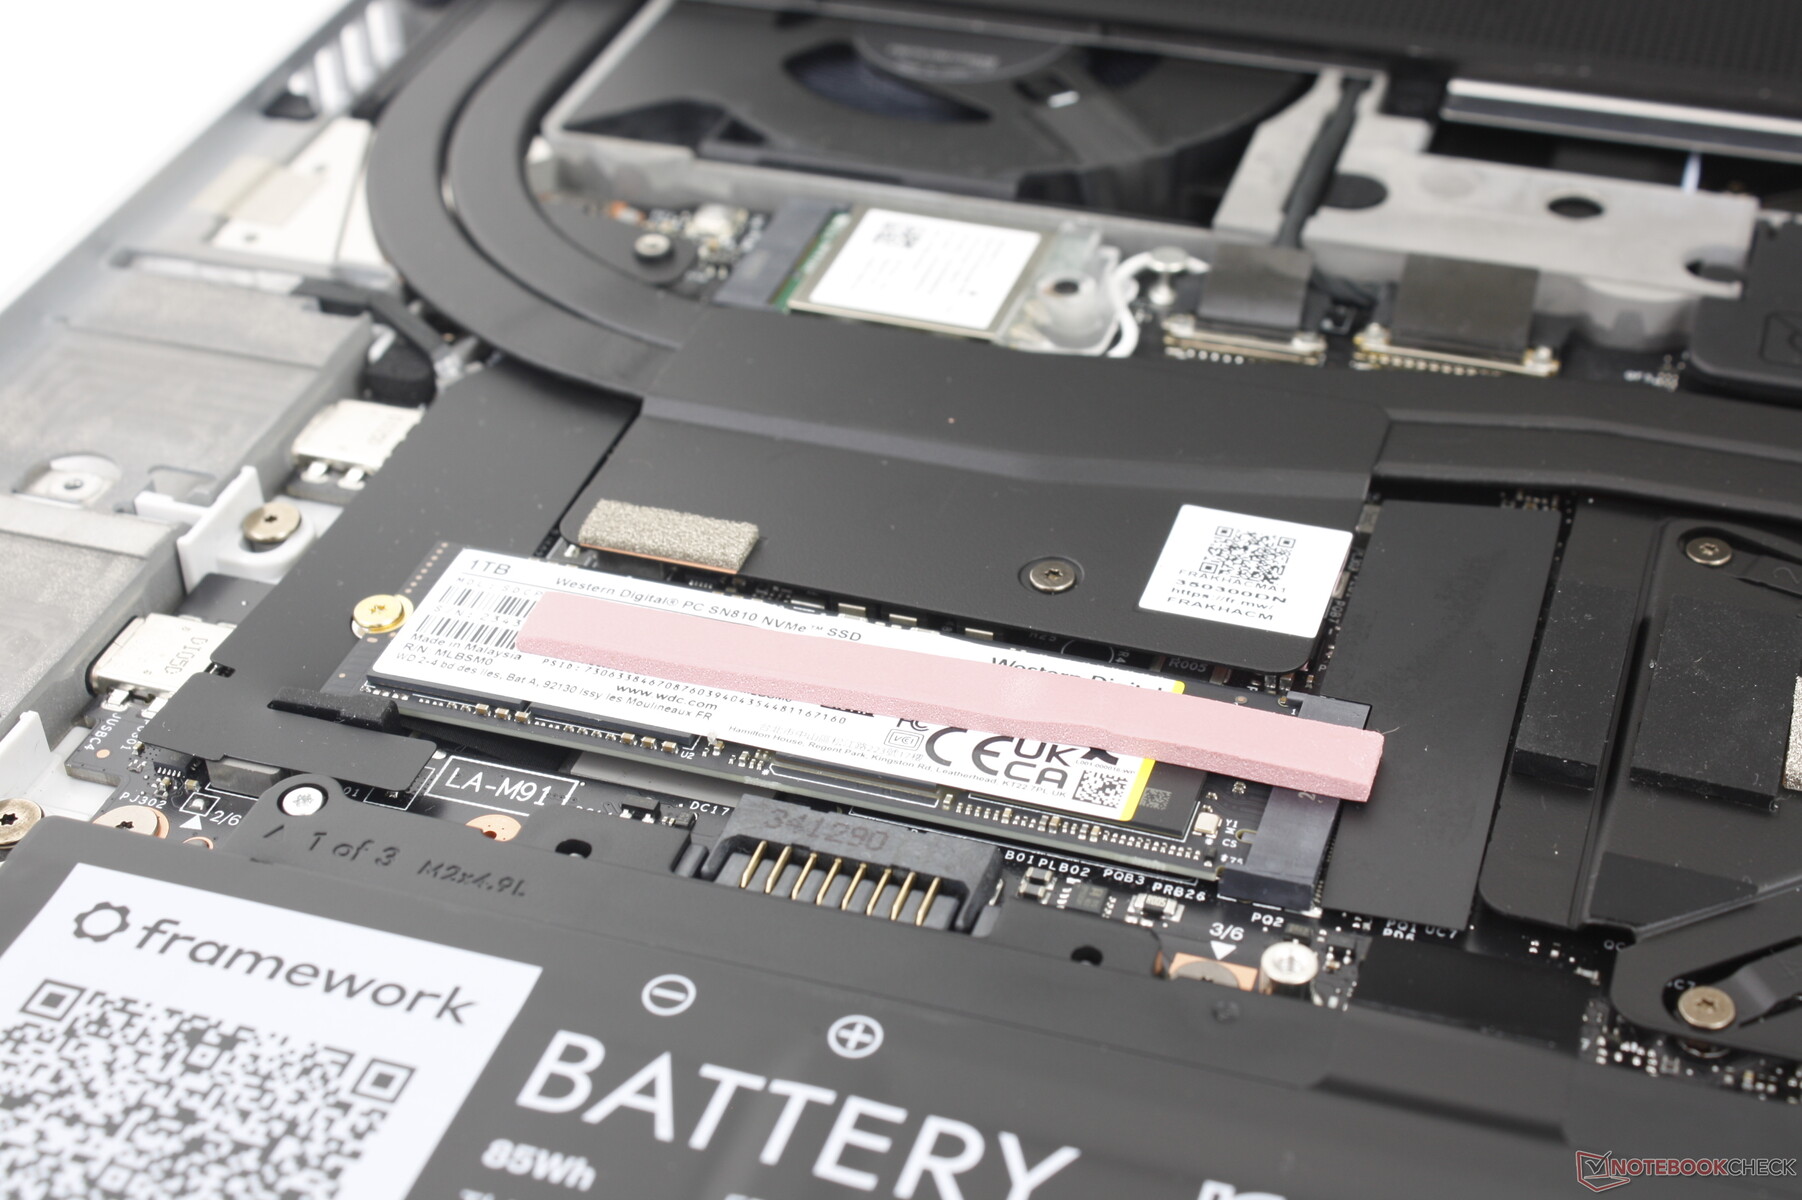
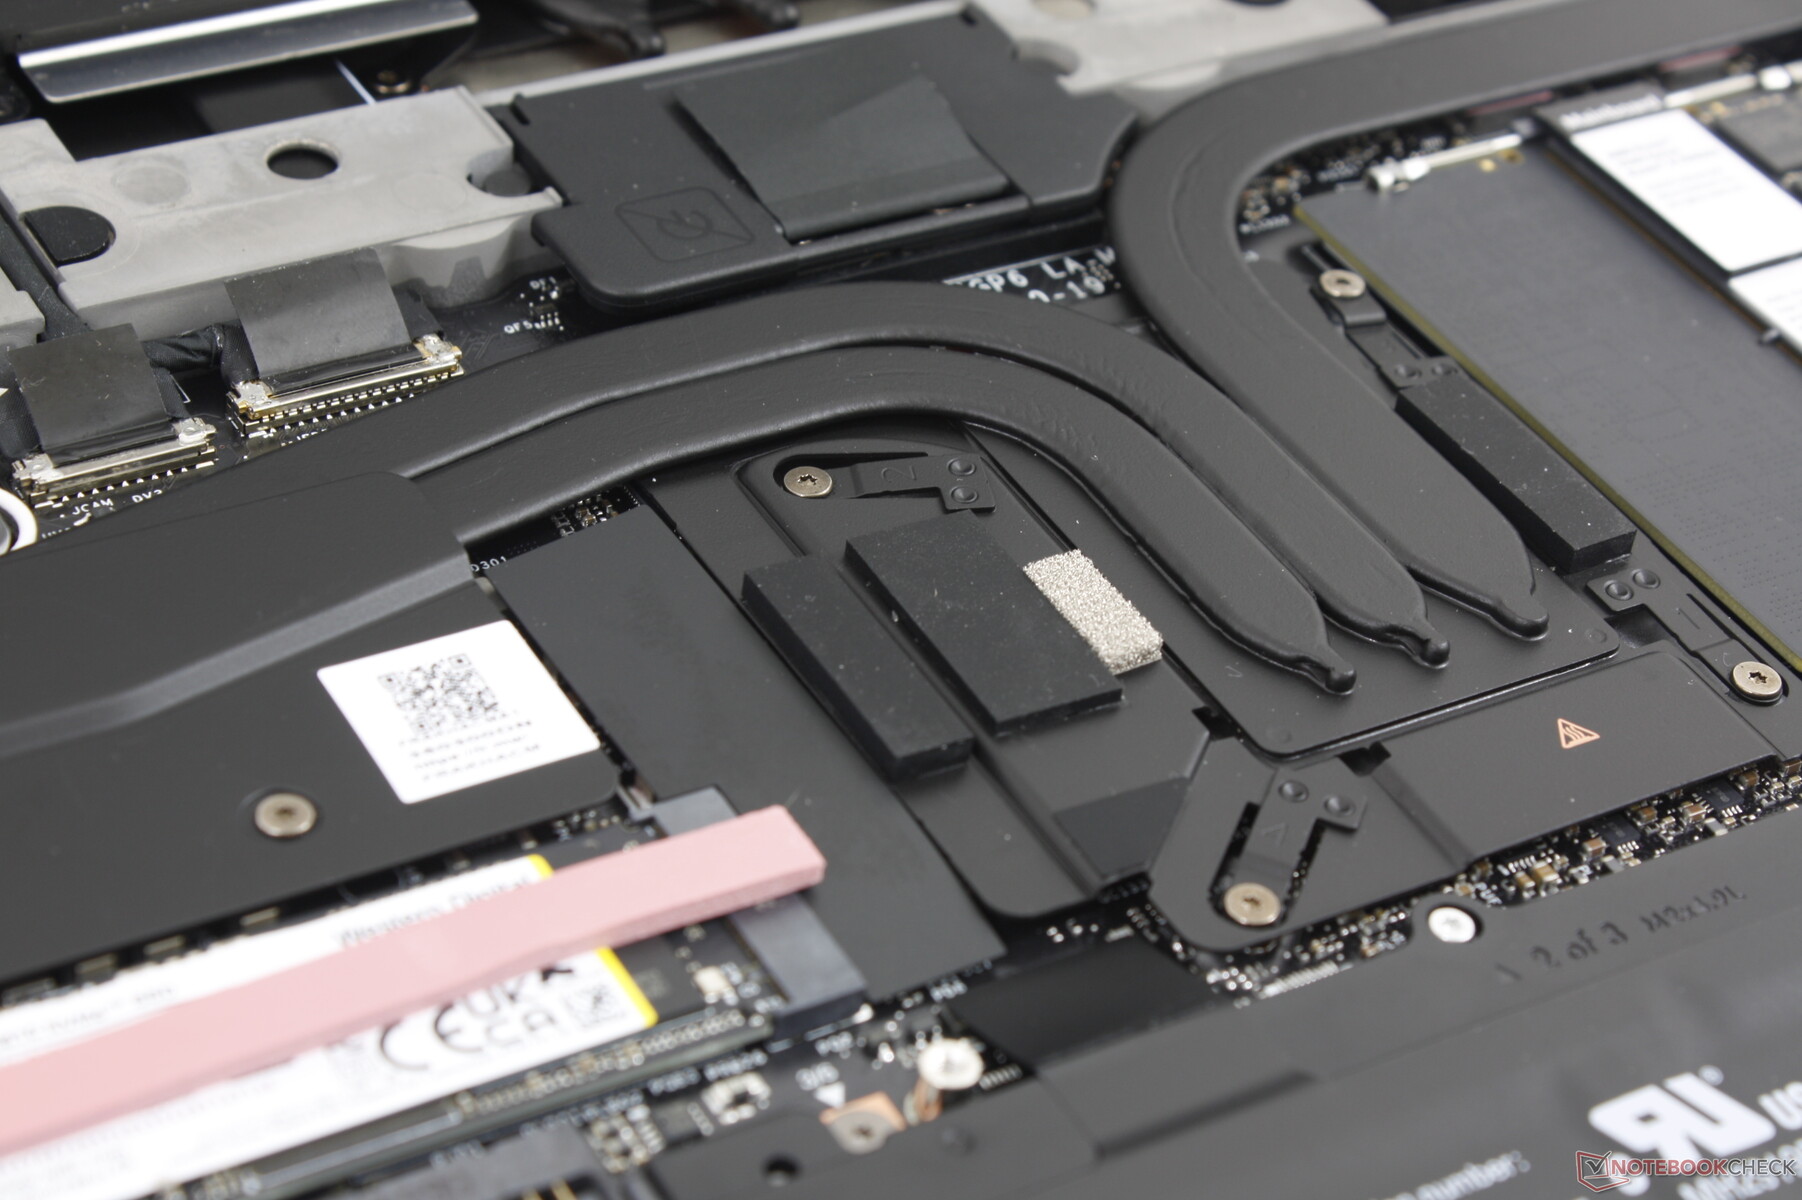
La nostra unità di prova viene fornita con il Western Digital SN810 SSD PCIe4 x4 NVMe, che rappresenta un aggiornamento rispetto all'SN740 attualmente disponibile sul Framework 13.5. L'unità non ha mostrato problemi nel mantenere una velocità di trasferimento di ~7000 MB/s per periodi prolungati, a differenza di quanto abbiamo osservato sul modello HP Pavilion Plus 14 equipaggiato con lo stesso SSD WD. Questo suggerisce che il Framework 16 è stato progettato tenendo conto di un migliore raffreddamento dell'SSD per evitare il rallentamento delle prestazioni.

| Drive Performance rating - Percent | |
| MSI Prestige 16 B1MG-001US | |
| Media WDC PC SN810 1TB | |
| Framework Laptop 16 | |
| HP Spectre x360 2-in-1 16-f1075ng | |
| Lenovo ThinkPad Z16 Gen 2 | |
| Dell Inspiron 16 Plus 7630 | |
* ... Meglio usare valori piccoli
Disk Throttling: DiskSpd Read Loop, Queue Depth 8
Prestazioni della GPU - RDNA 3 alla riscossa
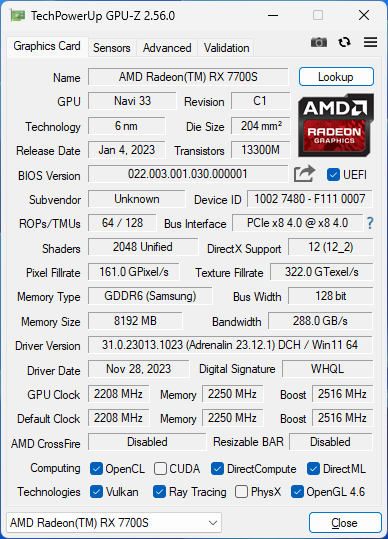
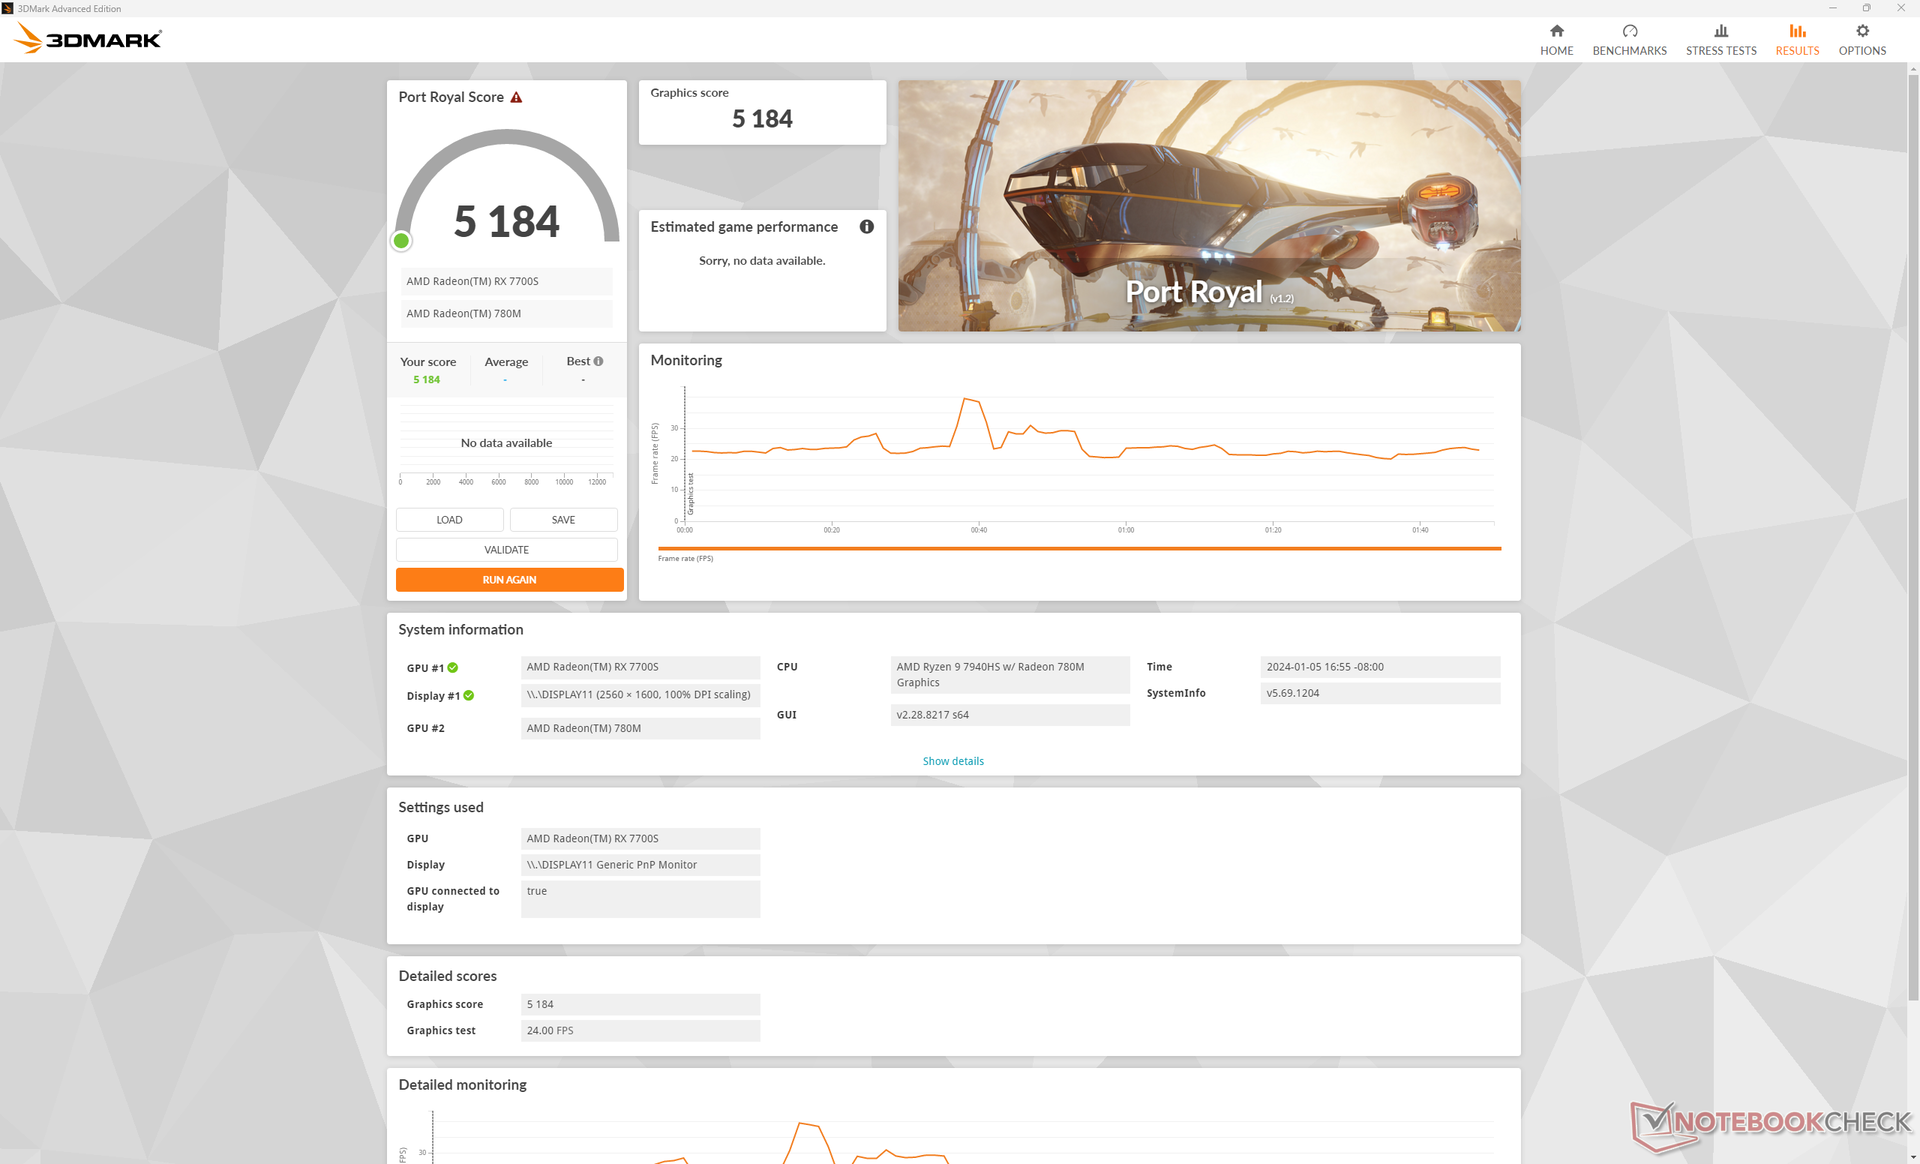
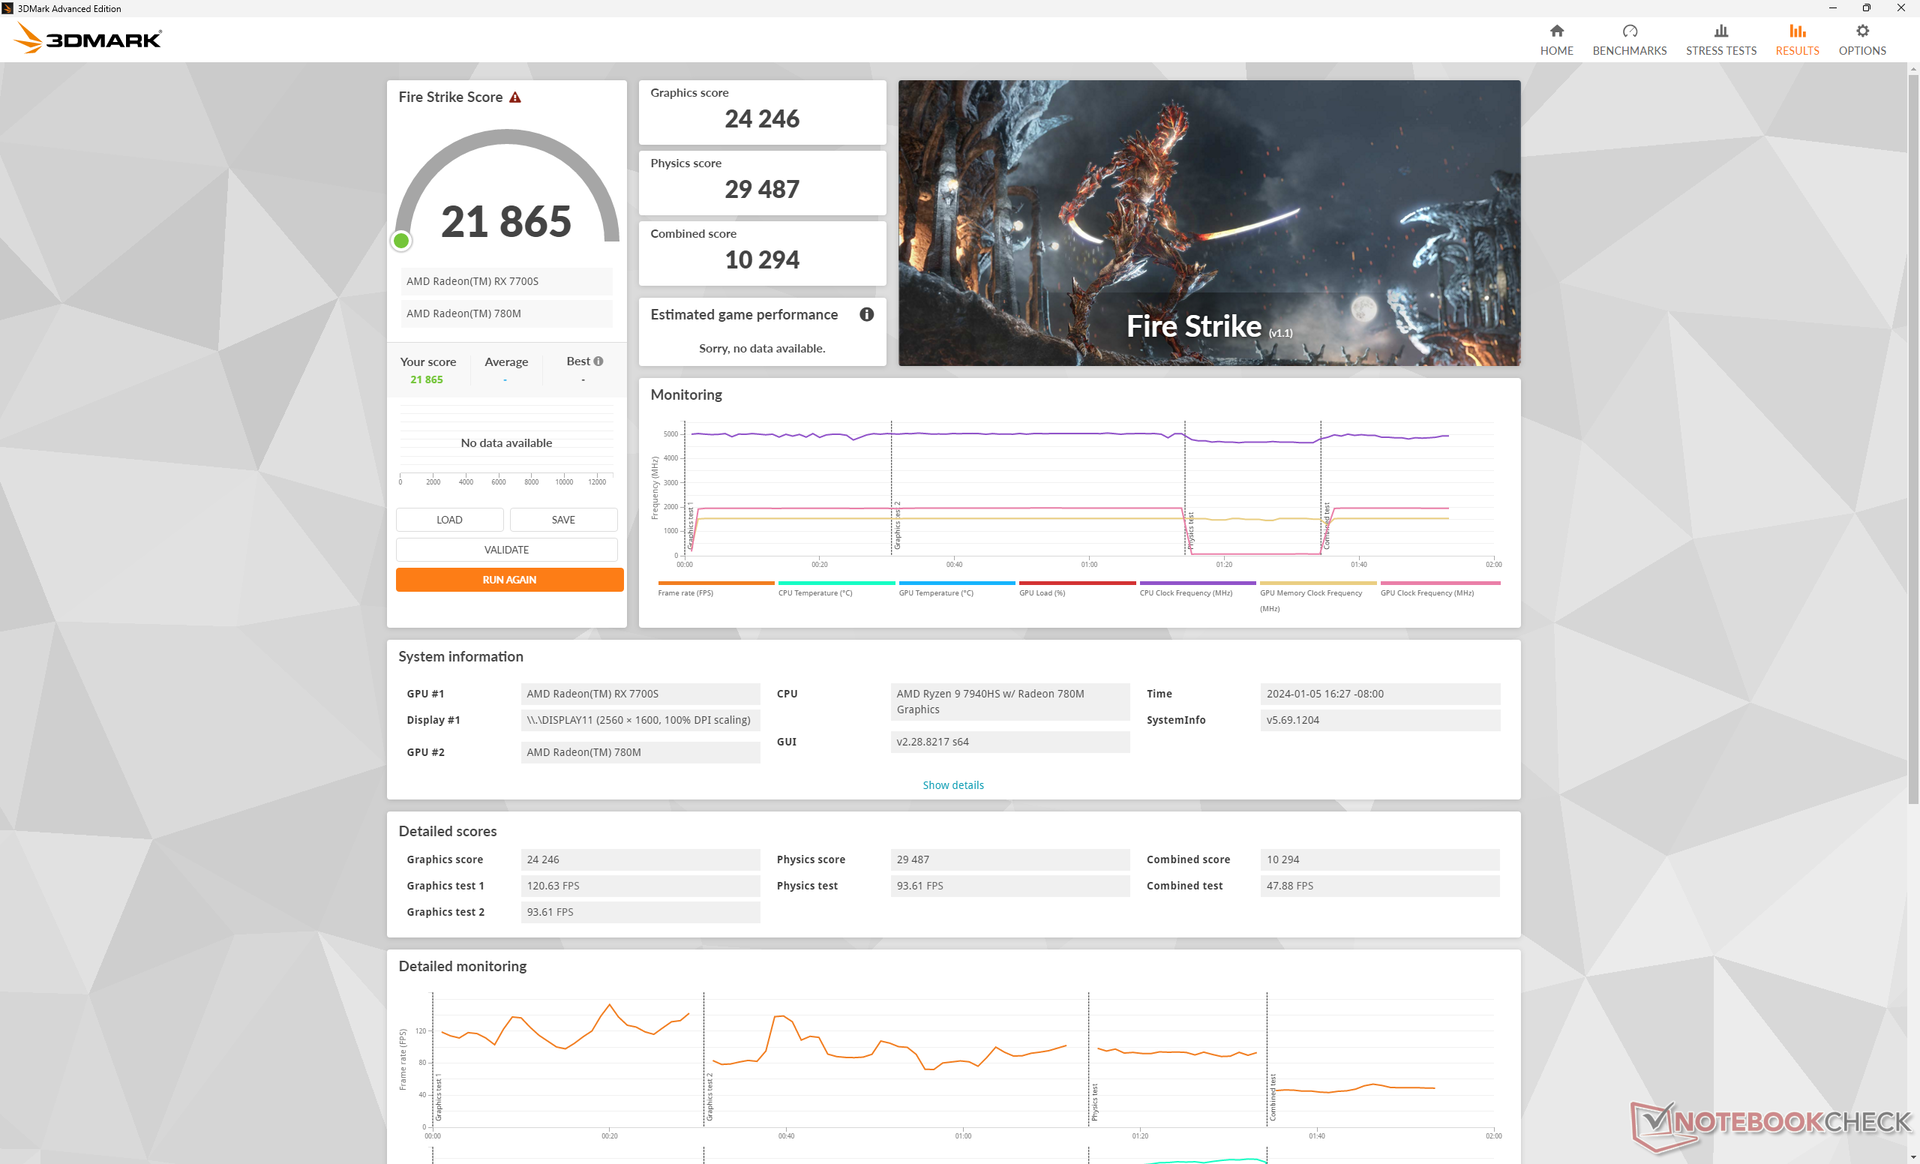
L'RDNA 3 Radeon RX 7700S succede direttamente all'RDNA 2 dello scorso anno Radeon RX 6700S. La nuova architettura, tuttavia, non ha migliorato di molto le prestazioni, a meno che il gioco non supporti DX12; i risultati di 3DMark Fire Strike sono quasi identici tra le due GPU, mentre i risultati di Time Spy sono più veloci del 20-25% rispetto a prima. I guadagni maggiori si notano nelle prestazioni RT, poiché questo era un punto debole con la vecchia architettura RDNA 2. Le prestazioni complessive sono paragonabili a quelle di un laptop con GeForce RTX 4060 come il modello Lenovo Legion Slim 7 16.
Anche con la dGPU rimossa, la Radeon RX 780M iGPU è ancora più che in grado di gestire le attività multimediali. La GPU AMD rimane una delle soluzioni iGPU più veloci disponibili, anche se di recente è stata superata dalla serie Serie Intel Arc.
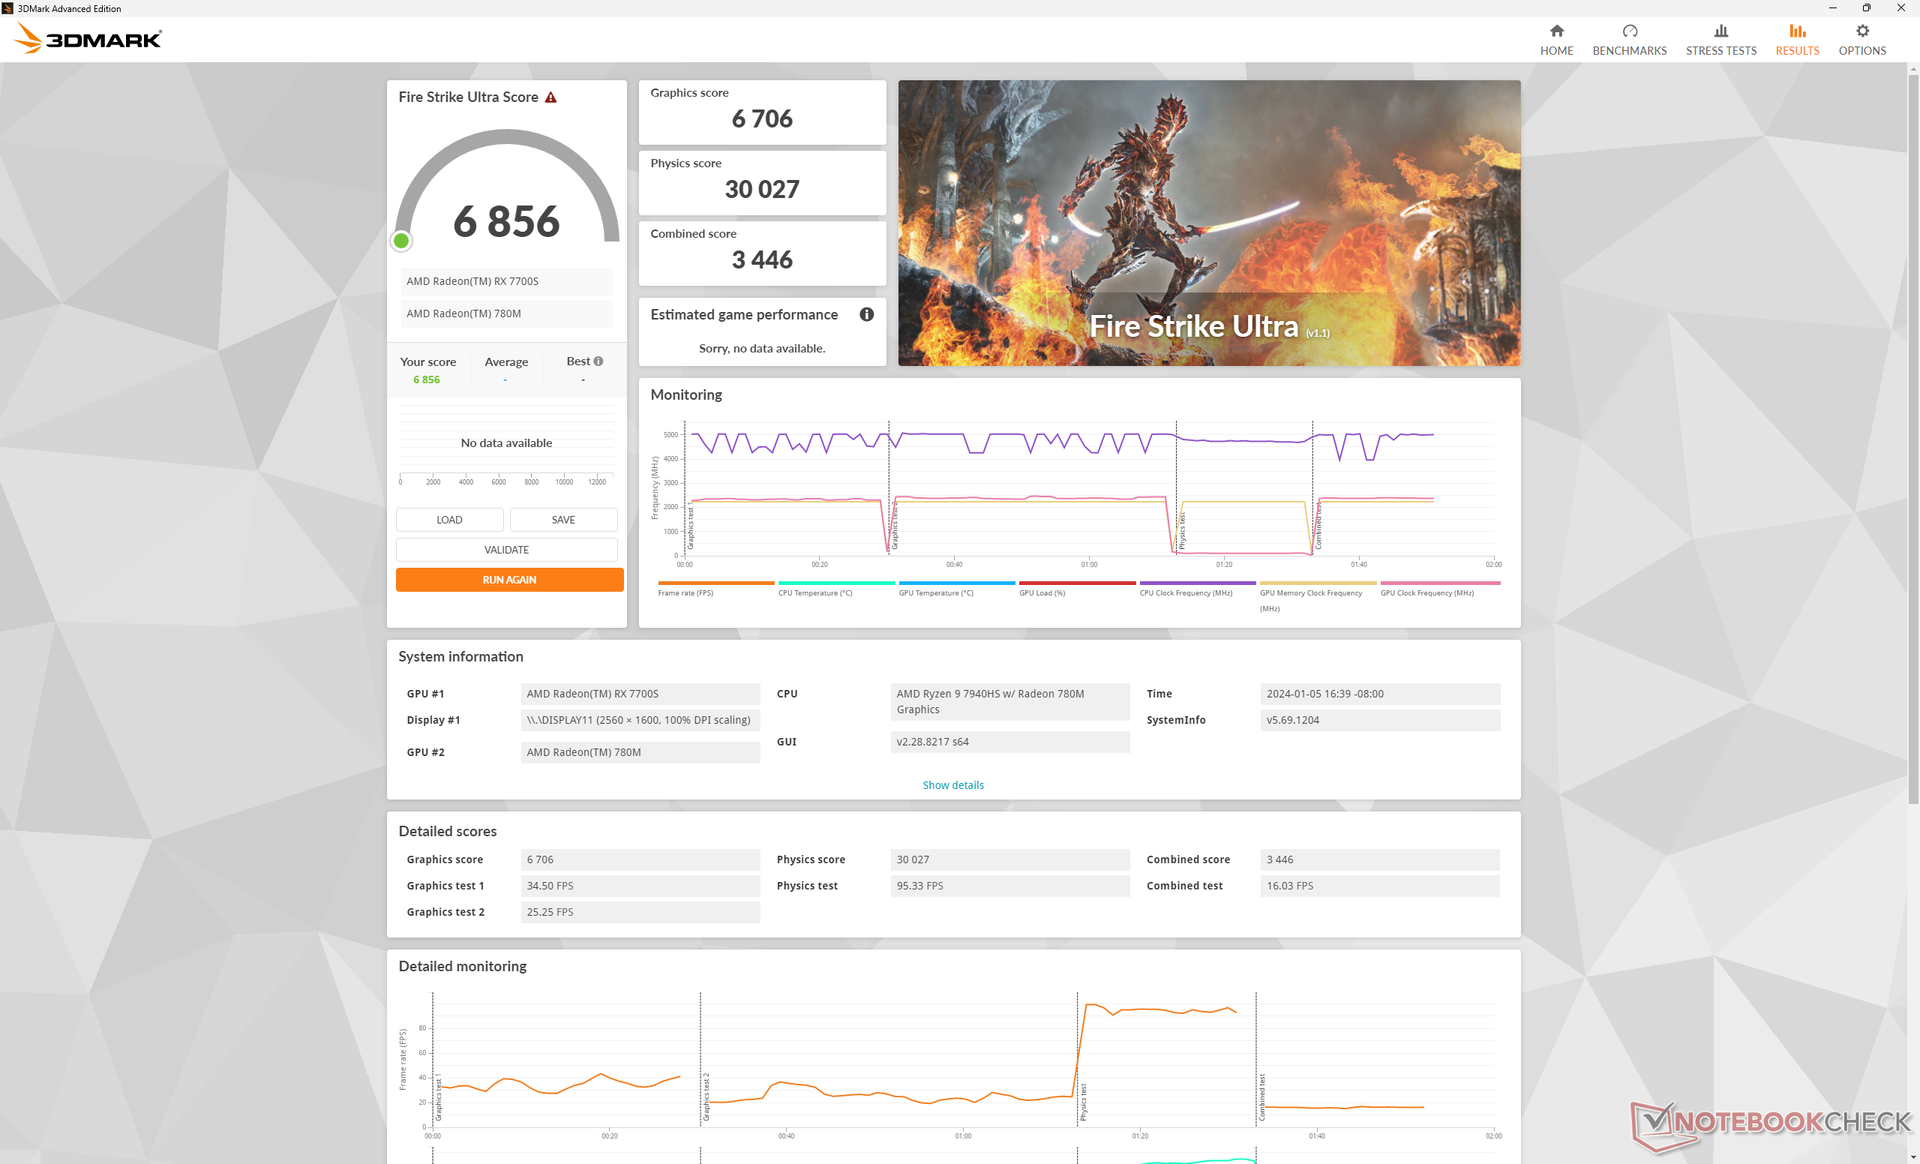
L'esecuzione in modalità Bilanciata di Windows anziché in modalità Prestazioni non sembra avere un impatto sulle prestazioni, come dimostra la nostra tabella dei risultati di Fire Strike qui sotto. Il funzionamento a batteria ridurrebbe le prestazioni di circa il 15 percento.
| Profilo energetico | Punteggio grafico | Punteggio Fisica | Punteggio combinato |
| Prestazioni | 24246 | 29487 | 10294 |
| Equilibrato | 24125 (-0%) | 29101 (-0%) | 10389 (-0%) |
| Modalità batteria | 20380 (-16%) | 25009 (-15%) | 6769 (-34%) |
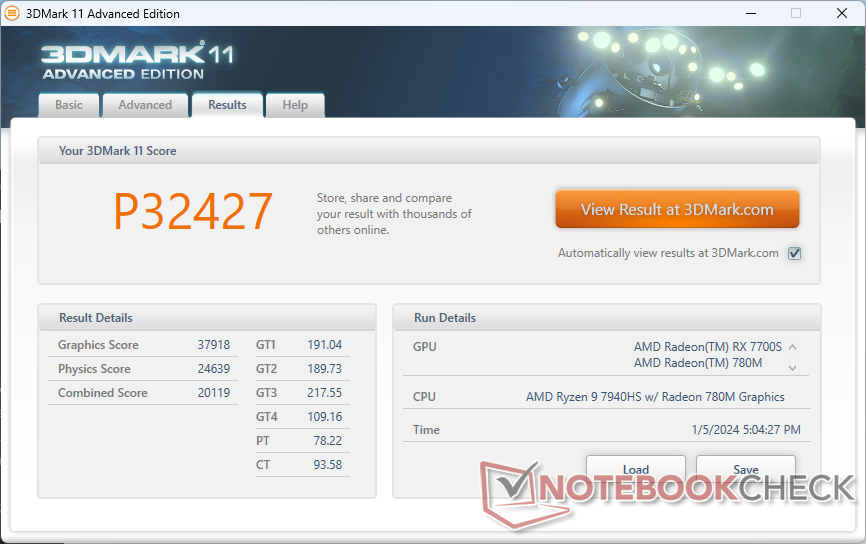
| 3DMark 11 Performance | 32427 punti | |
| 3DMark Fire Strike Score | 21865 punti | |
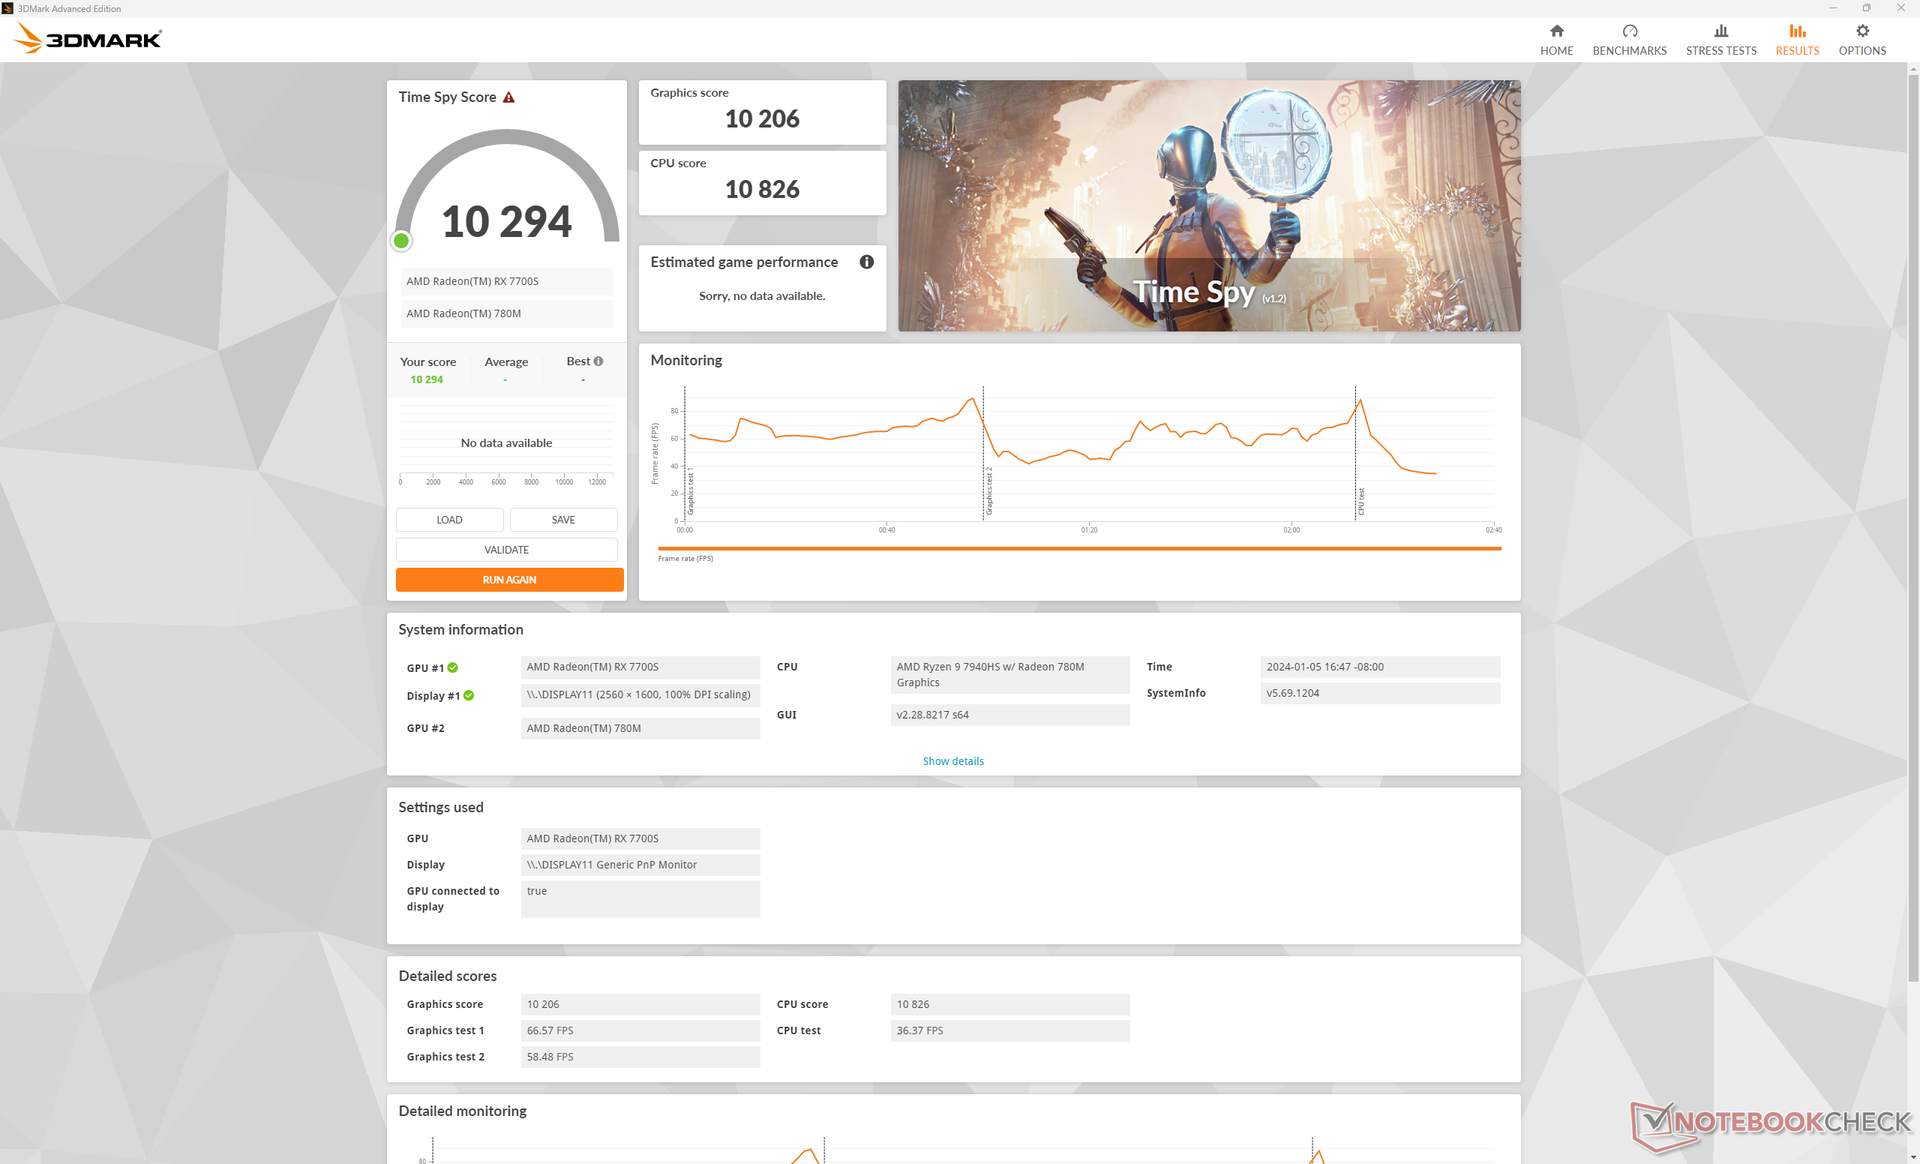
| 3DMark Time Spy Score | 10294 punti | |
Aiuto | ||
* ... Meglio usare valori piccoli
Prestazioni di gioco
Le prestazioni di gioco della Radeon RX 7700S da 100 W sono inferiori di circa il 10-30 percento rispetto alla RTX 4060 mobile GeForce, a seconda del TDP. Ad esempio, le prestazioni sono molto più vicine a quelle della RTX 4060 da 60 W nel modello Dell Inspiron 16 Plus 7630 mentre la RTX 4060 da 140 W supererebbe la nostra Radeon con margini più ampi. Pertanto, si aspetti che le prestazioni di gioco si collochino tra il modello rTX 4050 mobile e RTX 4060 mobile.
Le prestazioni sarebbero anche solo leggermente superiori a quelle della Radeon RX 6700S dello scorso anno nella maggior parte dei titoli testati. I guadagni maggiori si notano quando la RT è abilitata, proprio come previsto da 3DMark. F1 22, ad esempio, girerebbe dal 30 al 40 percento più veloce di prima quando le impostazioni RT sono attive, rispetto ai guadagni più modesti dal 5 al 15 percento quando le impostazioni RT sono disattivate.
| Baldur's Gate 3 | |
| 1920x1080 High Preset AA:T | |
| Alienware m18 R1 AMD | |
| Lenovo Legion Slim 7 16APH8 | |
| Framework Laptop 16 | |
| Media AMD Radeon RX 7700S (n=1) | |
| Lenovo ThinkPad Z16 Gen 2 | |
| MSI Prestige 16 B1MG-001US | |
| 1920x1080 Ultra Preset AA:T | |
| Alienware m18 R1 AMD | |
| Lenovo Legion Slim 7 16APH8 | |
| Framework Laptop 16 | |
| Media AMD Radeon RX 7700S (n=1) | |
| Lenovo ThinkPad Z16 Gen 2 | |
| MSI Prestige 16 B1MG-001US | |
| 2560x1440 Ultra Preset AA:T | |
| Alienware m18 R1 AMD | |
| Lenovo Legion Slim 7 16APH8 | |
| Framework Laptop 16 | |
| Media AMD Radeon RX 7700S (n=1) | |
| Lenovo ThinkPad Z16 Gen 2 | |
| 3840x2160 Ultra Preset AA:T | |
| Alienware m18 R1 AMD | |
| Framework Laptop 16 | |
| Media AMD Radeon RX 7700S (n=1) | |
Witcher 3 FPS Chart
| basso | medio | alto | ultra | QHD | 4K | |
|---|---|---|---|---|---|---|
| GTA V (2015) | 184 | 178.6 | 170.6 | 95.8 | 67.1 | 68.4 |
| The Witcher 3 (2015) | 392.2 | 277.5 | 147.1 | 84 | 43 | |
| Dota 2 Reborn (2015) | 174 | 159.8 | 156.5 | 136.8 | 85.3 | |
| Final Fantasy XV Benchmark (2018) | 206 | 106 | 74.8 | 54.5 | 29 | |
| X-Plane 11.11 (2018) | 97.6 | 79.3 | 65 | 46.8 | ||
| Far Cry 5 (2018) | 148 | 130 | 123 | 117 | 81 | 39 |
| Strange Brigade (2018) | 449 | 202 | 167.4 | 143.9 | 91.9 | 47.9 |
| Tiny Tina's Wonderlands (2022) | 183.5 | 140.4 | 92 | 71.2 | 47.3 | 23.1 |
| F1 22 (2022) | 251 | 221 | 168 | 47.7 | 29.9 | 11.3 |
| Baldur's Gate 3 (2023) | 106.8 | 88 | 76.4 | 73.6 | 51.1 | 24.7 |
| Cyberpunk 2077 (2023) | 100.7 | 80.5 | 68.1 | 60.7 | 37.3 | 15.8 |
Le prestazioni per watt quando funziona Witcher 3 con impostazioni Ultra è paragonabile a quella di un desktop GeForce RTX 4070 Ti o RTX 4080. Quindi, la GPU RDNA 3 è almeno efficiente, anche se non è neanche lontanamente potente come la più veloce di Nvidia. Nel frattempo, la più competitiva RTX 4060 mobile è ancora circa il 30% più efficiente e questo margine aumenta solo a favore di Nvidia quando si eseguono giochi abilitati RT.
Emissioni
Rumore del sistema - Forte sotto carico
Il rumore della ventola copre abbastanza bene entrambi gli estremi, nel senso che può essere molto silenzioso quando si eseguono carichi poco impegnativi e molto forte quando si eseguono carichi più impegnativi come i giochi. Durante la semplice navigazione o lo streaming video, ad esempio, il rumore della ventola tenderebbe a librarsi intorno ai 28,5 dB(A) contro uno sfondo silenzioso di 23,8 dB(A), per essere per lo più impercettibile. Quando si utilizza Witcher 3, tuttavia, il rumore della ventola può raggiungere quasi i 52 dB(A), tanto da essere rumoroso quanto quello del concorrente Inspiron 16 Plus o di alcuni portatili da gioco come il Razer Blade 16.
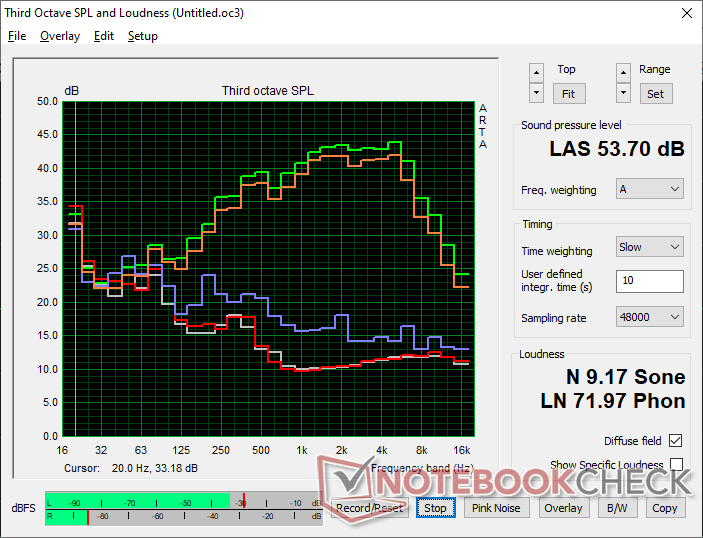
Rumorosità
| Idle |
| 23.9 / 23.9 / 23.9 dB(A) |
| Sotto carico |
| 28.5 / 53.7 dB(A) |
 | ||
30 dB silenzioso 40 dB(A) udibile 50 dB(A) rumoroso |
||
min: | ||
| Framework Laptop 16 Radeon RX 7700S, R9 7940HS, WDC PC SN810 1TB | MSI Prestige 16 B1MG-001US Arc 8-Core, Ultra 7 155H, Samsung PM9A1 MZVL22T0HBLB | Lenovo ThinkPad Z16 Gen 2 Radeon RX 6550M, R9 PRO 7940HS, Kioxia XG8 KXG8AZNV1T02 | Apple MacBook Pro 16 2023 M3 Max M3 Max 40-Core GPU, Apple M3 Max 16-Core, Apple SSD AP8192Z | Dell Inspiron 16 Plus 7630 GeForce RTX 4060 Laptop GPU, i7-13700H, WD PC SN740 SDDPTQD-1T00 | HP Spectre x360 2-in-1 16-f1075ng Iris Xe G7 96EUs, i7-12700H, SK Hynix PC711 1TB HFS001TDE9X073N | |
|---|---|---|---|---|---|---|
| Noise | -6% | -5% | -0% | -1% | -6% | |
| off /ambiente * (dB) | 23.8 | 24.5 -3% | 22.6 5% | 23.7 -0% | 23.2 3% | 26 -9% |
| Idle Minimum * (dB) | 23.9 | 24.5 -3% | 22.9 4% | 23.7 1% | 23.2 3% | 26 -9% |
| Idle Average * (dB) | 23.9 | 26.3 -10% | 29.4 -23% | 23.7 1% | 23.2 3% | 26 -9% |
| Idle Maximum * (dB) | 23.9 | 26.3 -10% | 29.4 -23% | 23.7 1% | 23.2 3% | 26 -9% |
| Load Average * (dB) | 28.5 | 36.5 -28% | 29.5 -4% | 40.8 -43% | 35.1 -23% | 42.9 -51% |
| Witcher 3 ultra * (dB) | 51.9 | 46.3 11% | 52 -0% | 42.8 18% | 52.5 -1% | 42.9 17% |
| Load Maximum * (dB) | 53.7 | 52.9 1% | 52 3% | 42.8 20% | 52.5 2% | 39.1 27% |
* ... Meglio usare valori piccoli
Temperatura
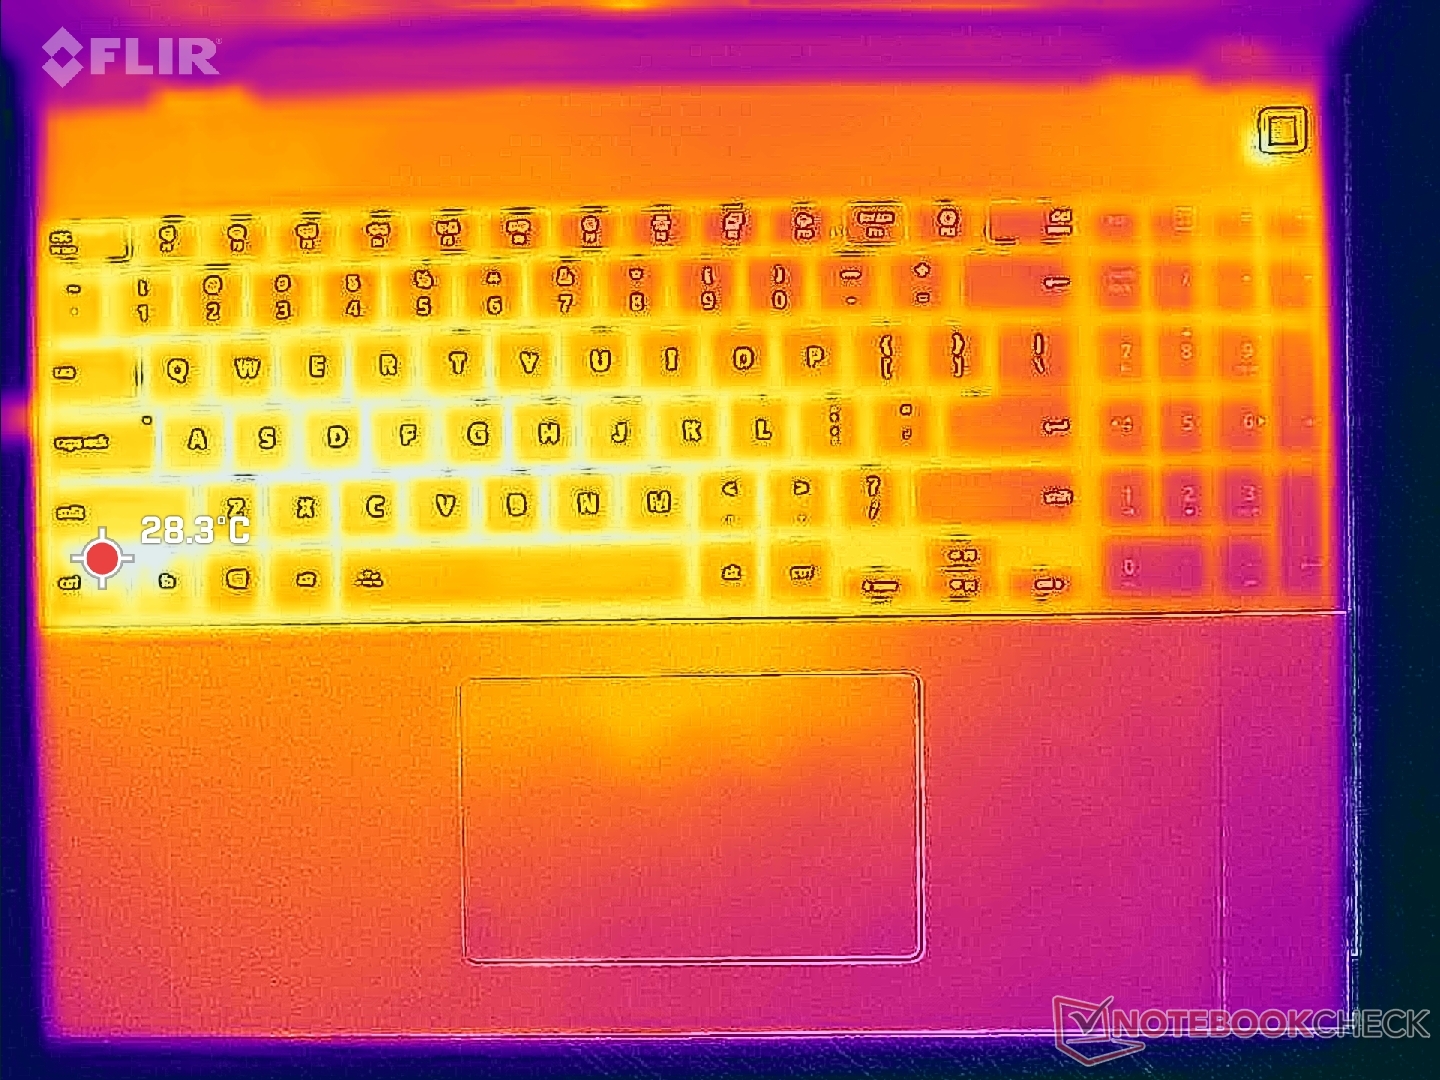
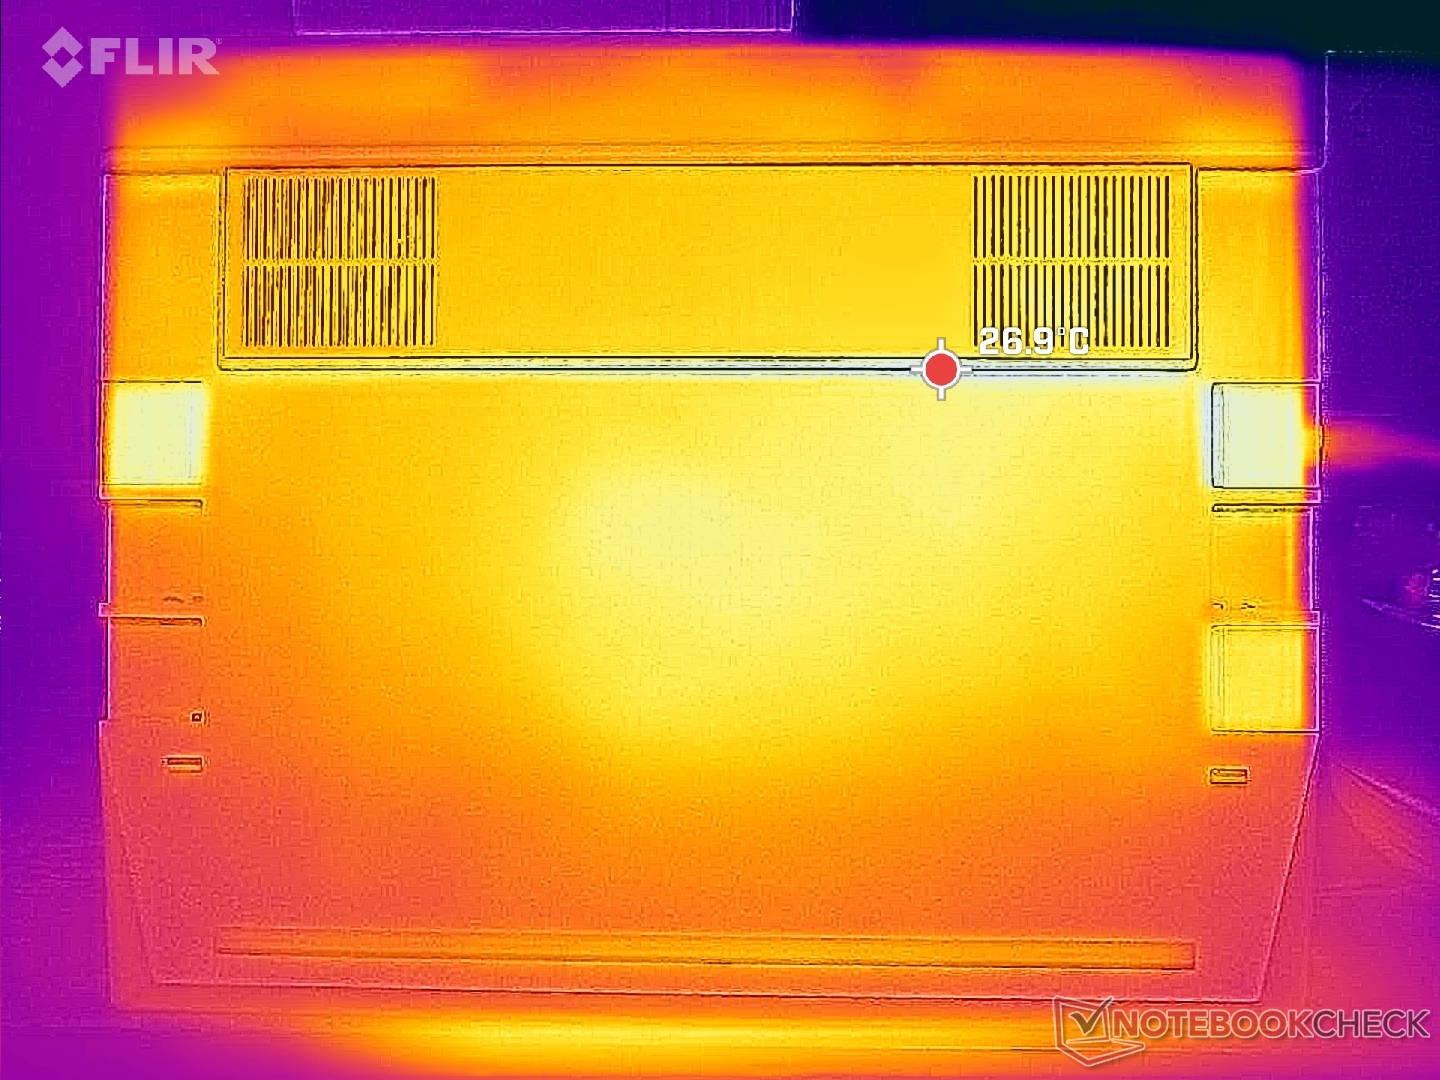
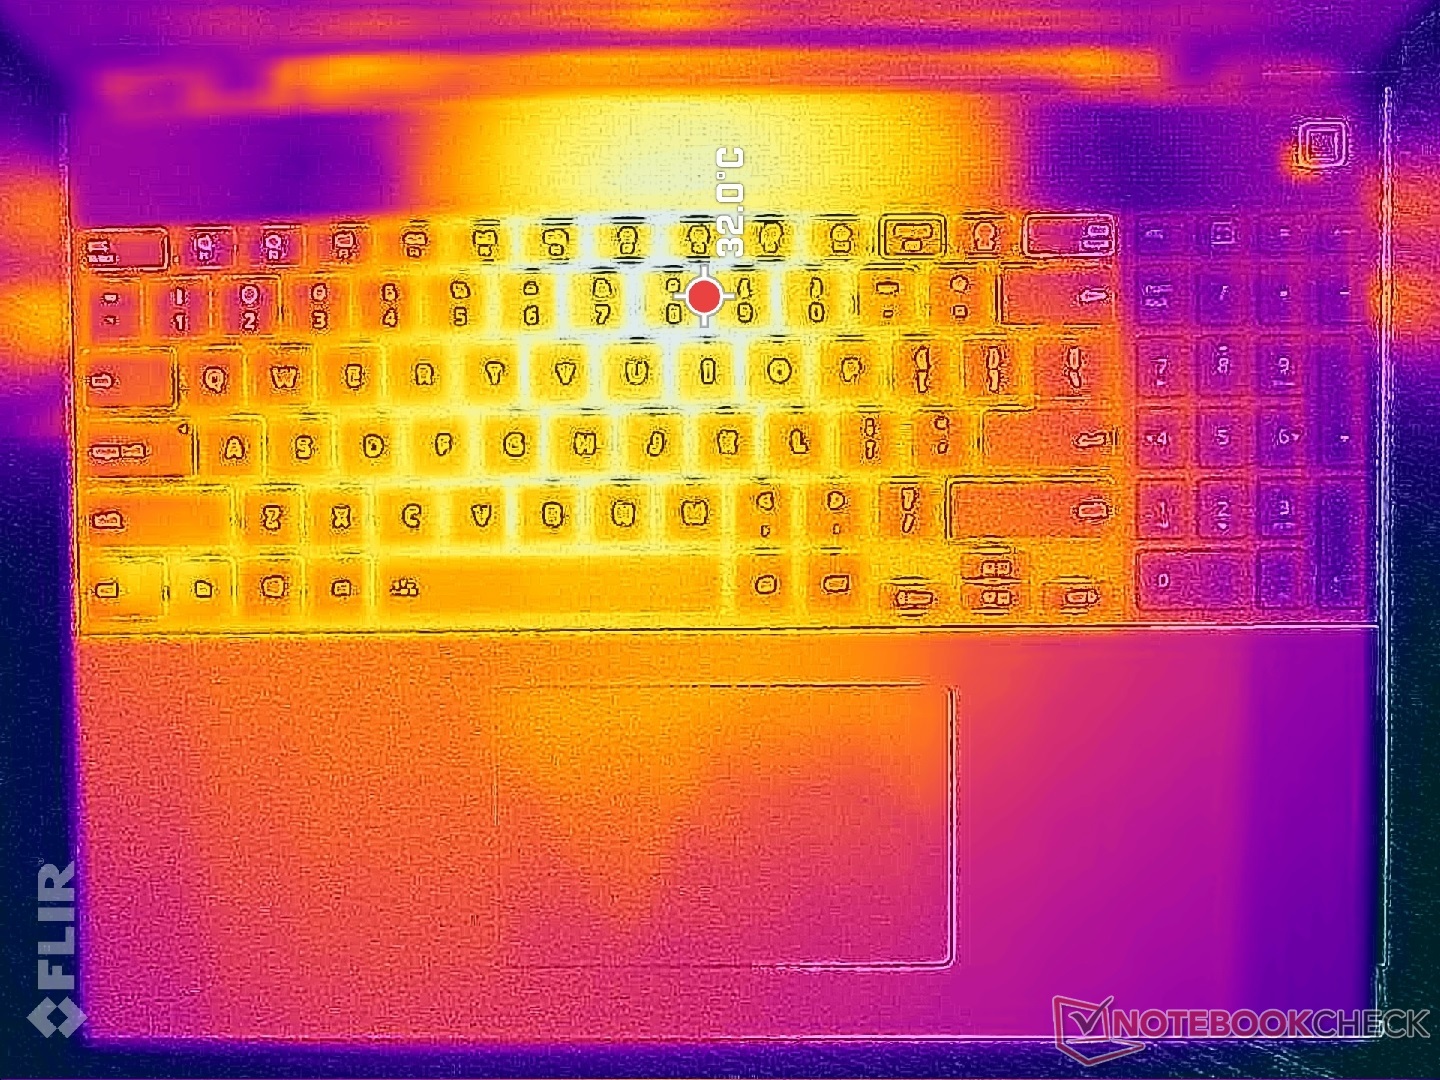
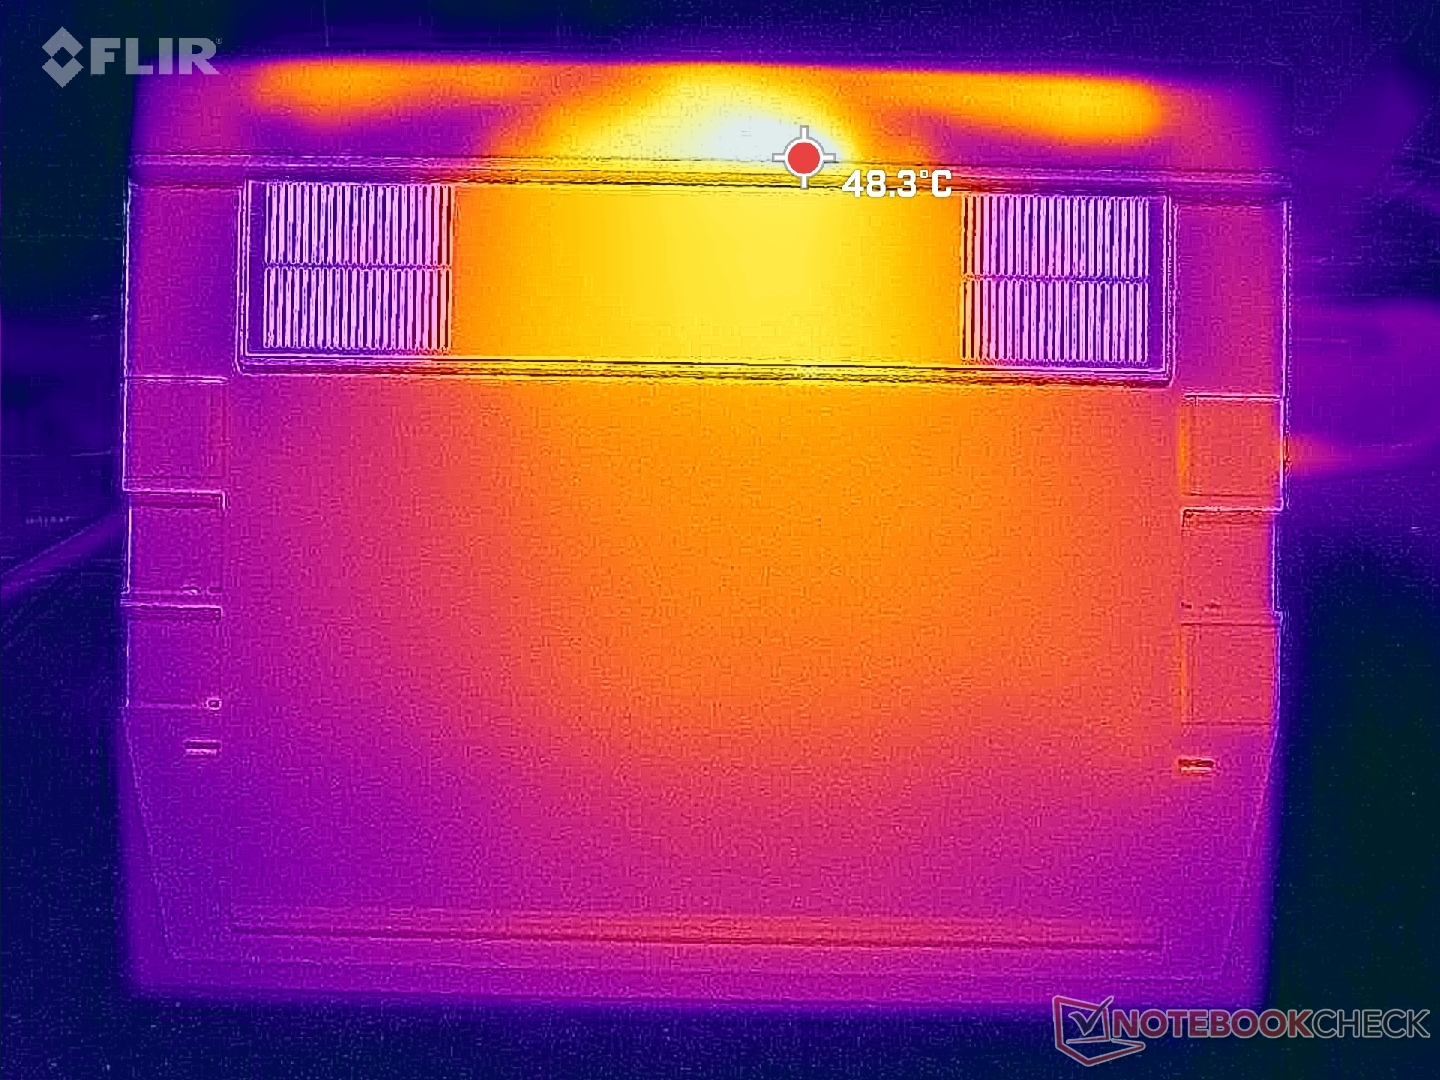
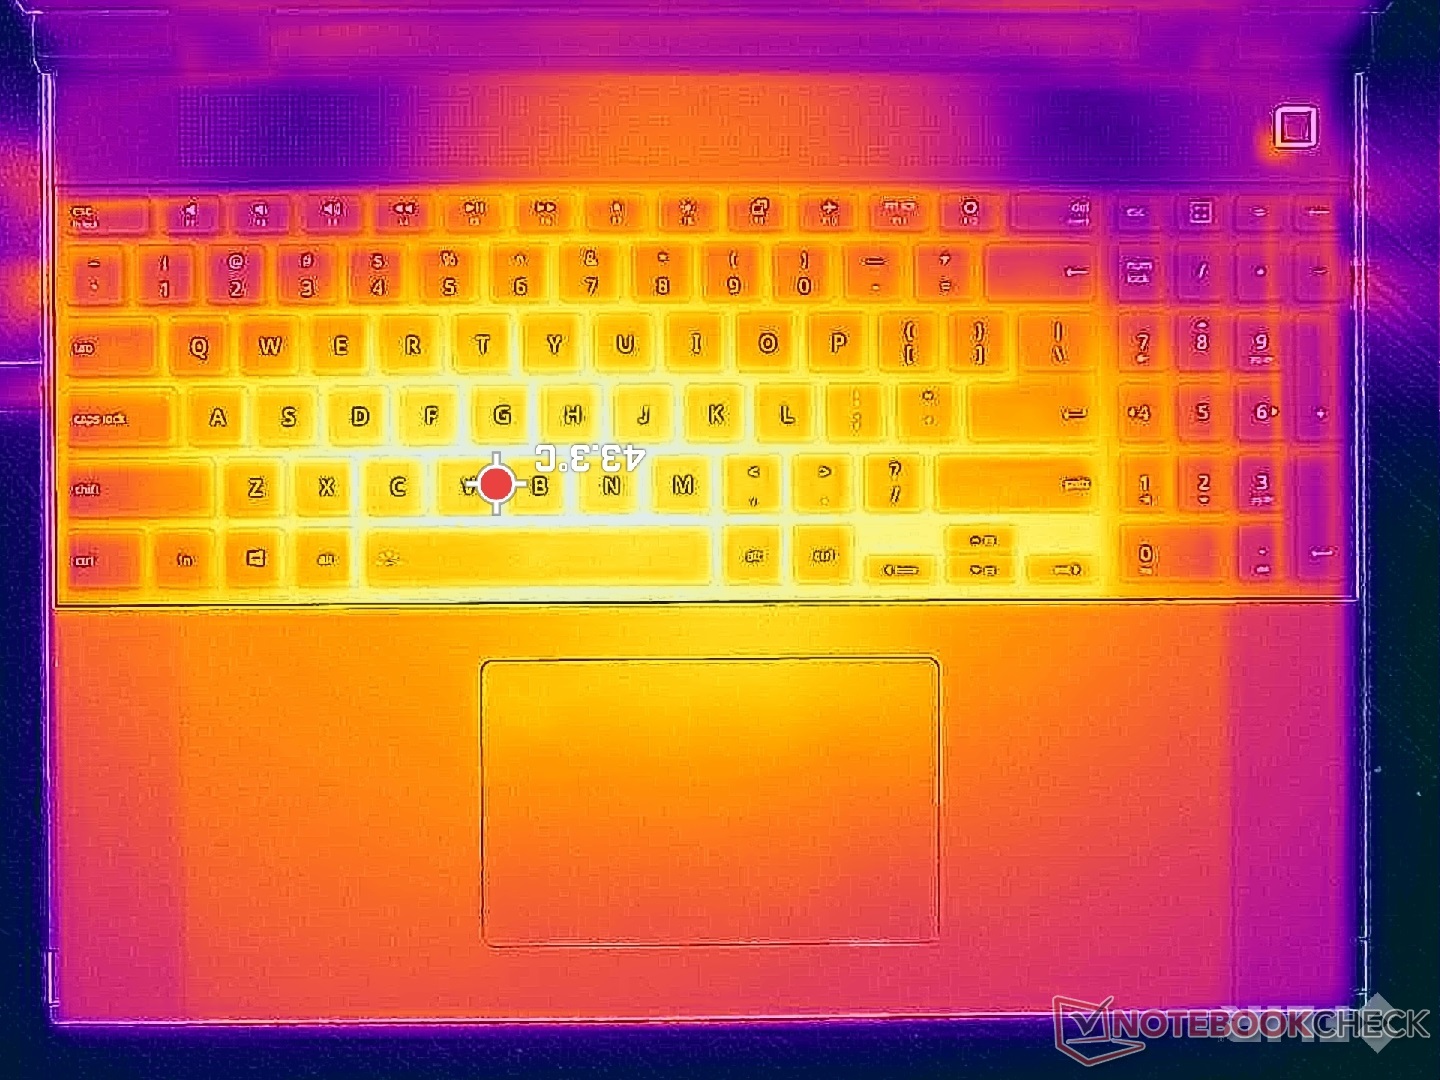
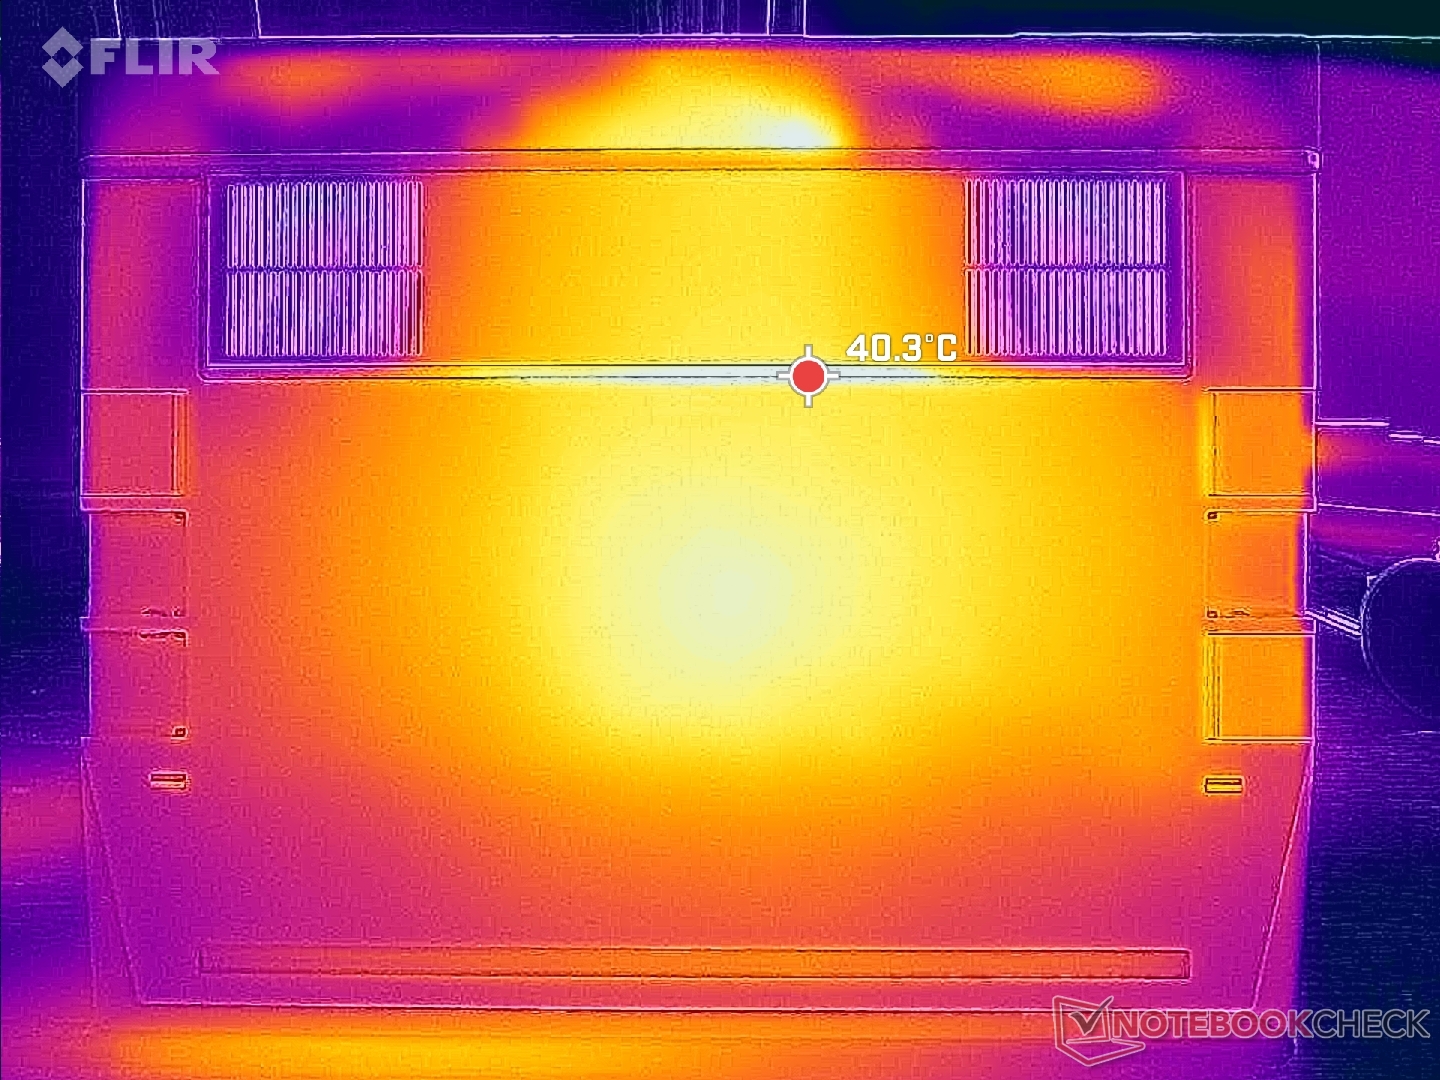
Le temperature di superficie sono sempre calde a causa del telaio in metallo e delle ventole poco efficienti. Quando si eseguono carichi più impegnativi come i giochi, i punti caldi possono raggiungere oltre 40 C sui lati superiore e inferiore della base del portatile. I punti caldi sono più vicini al centro del Laptop 16, mentre sono generalmente verso la parte posteriore della maggior parte degli altri portatili. Ciò significa che è più probabile che si noti il riscaldamento del sistema Framework durante l'uso, rispetto a qualcosa come il modello HP Spectre x360 16 dove i poggiapolsi e le aree frontali tendono ad essere più fredde. Tuttavia, non abbiamo mai trovato il Laptop 16 fastidiosamente caldo sulla pelle.
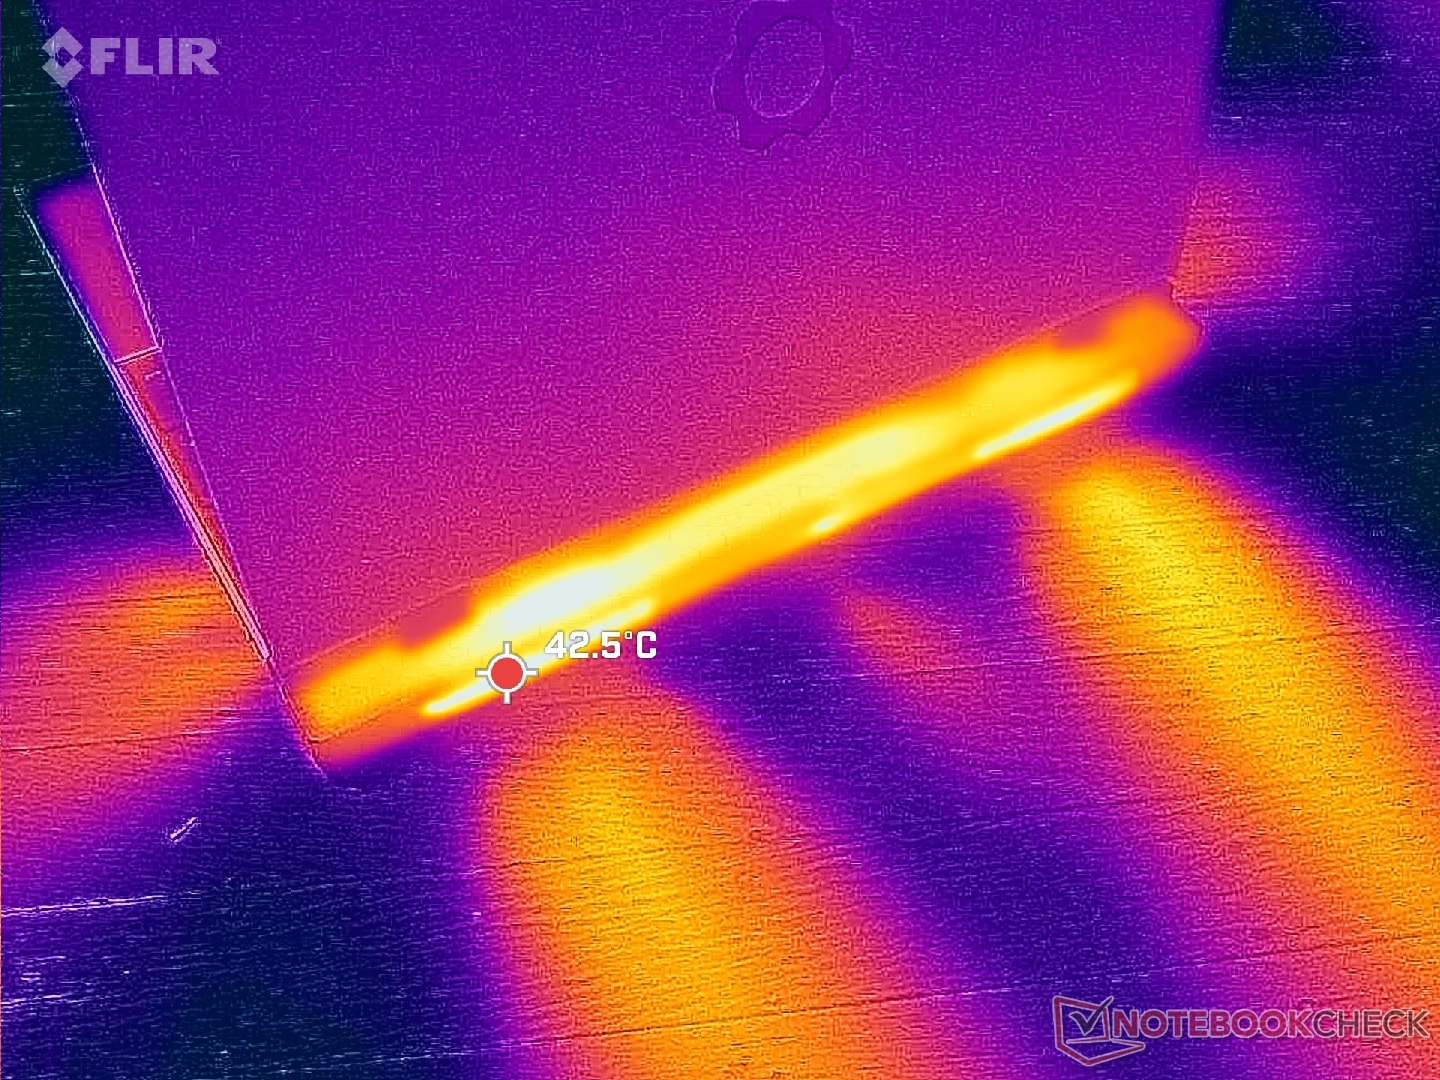
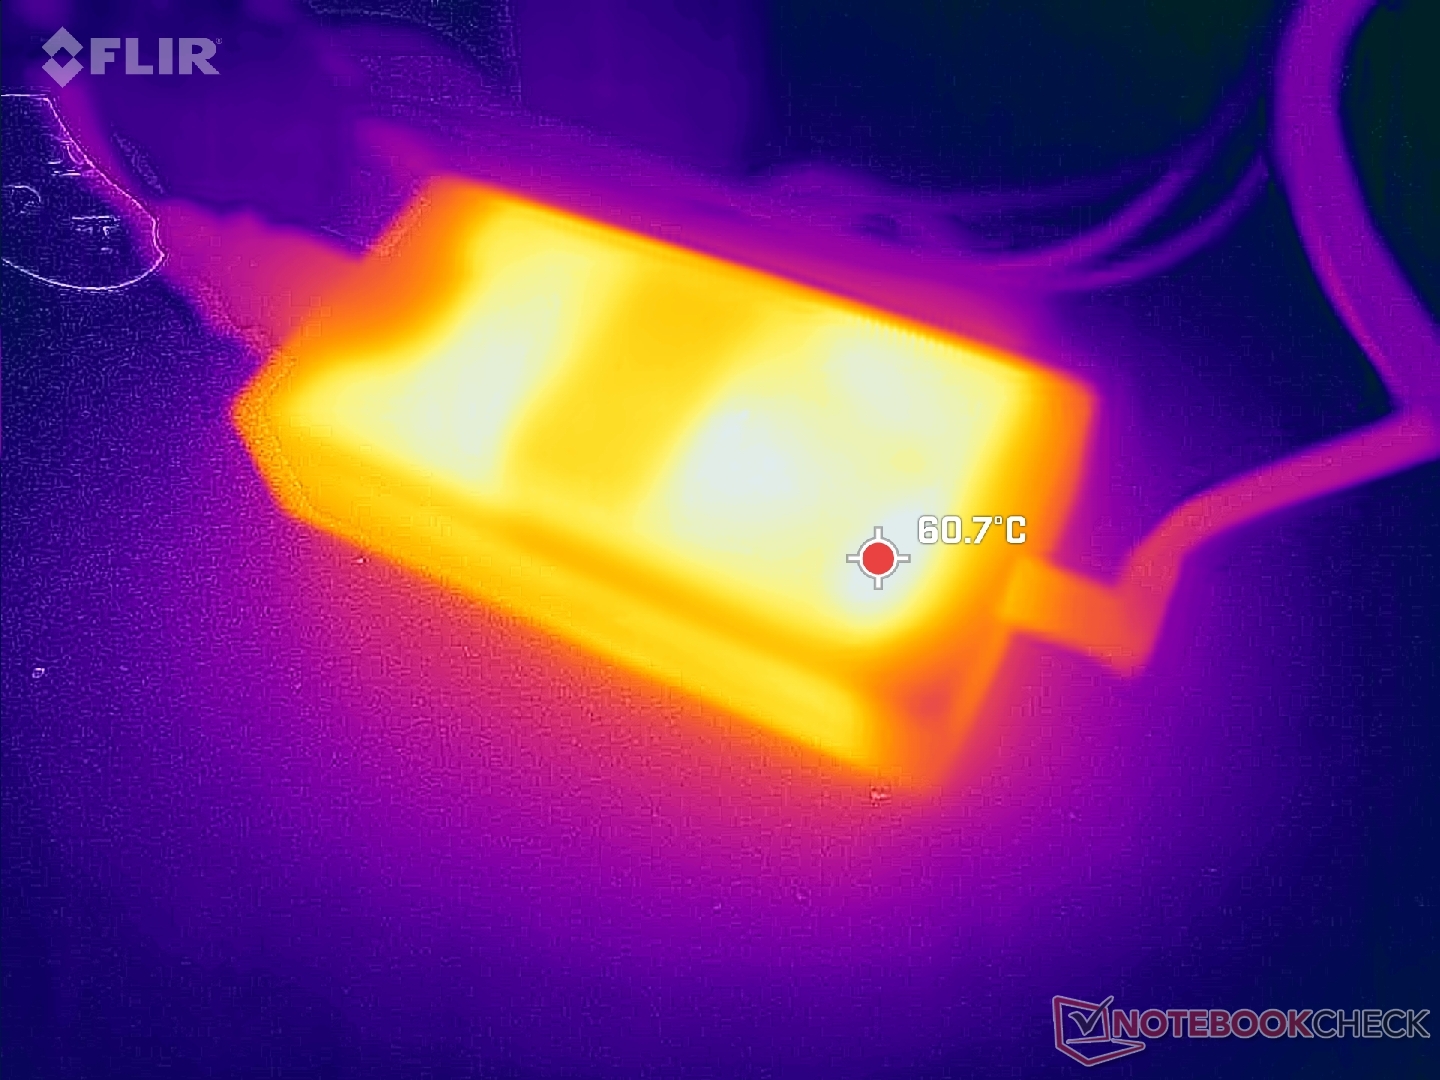
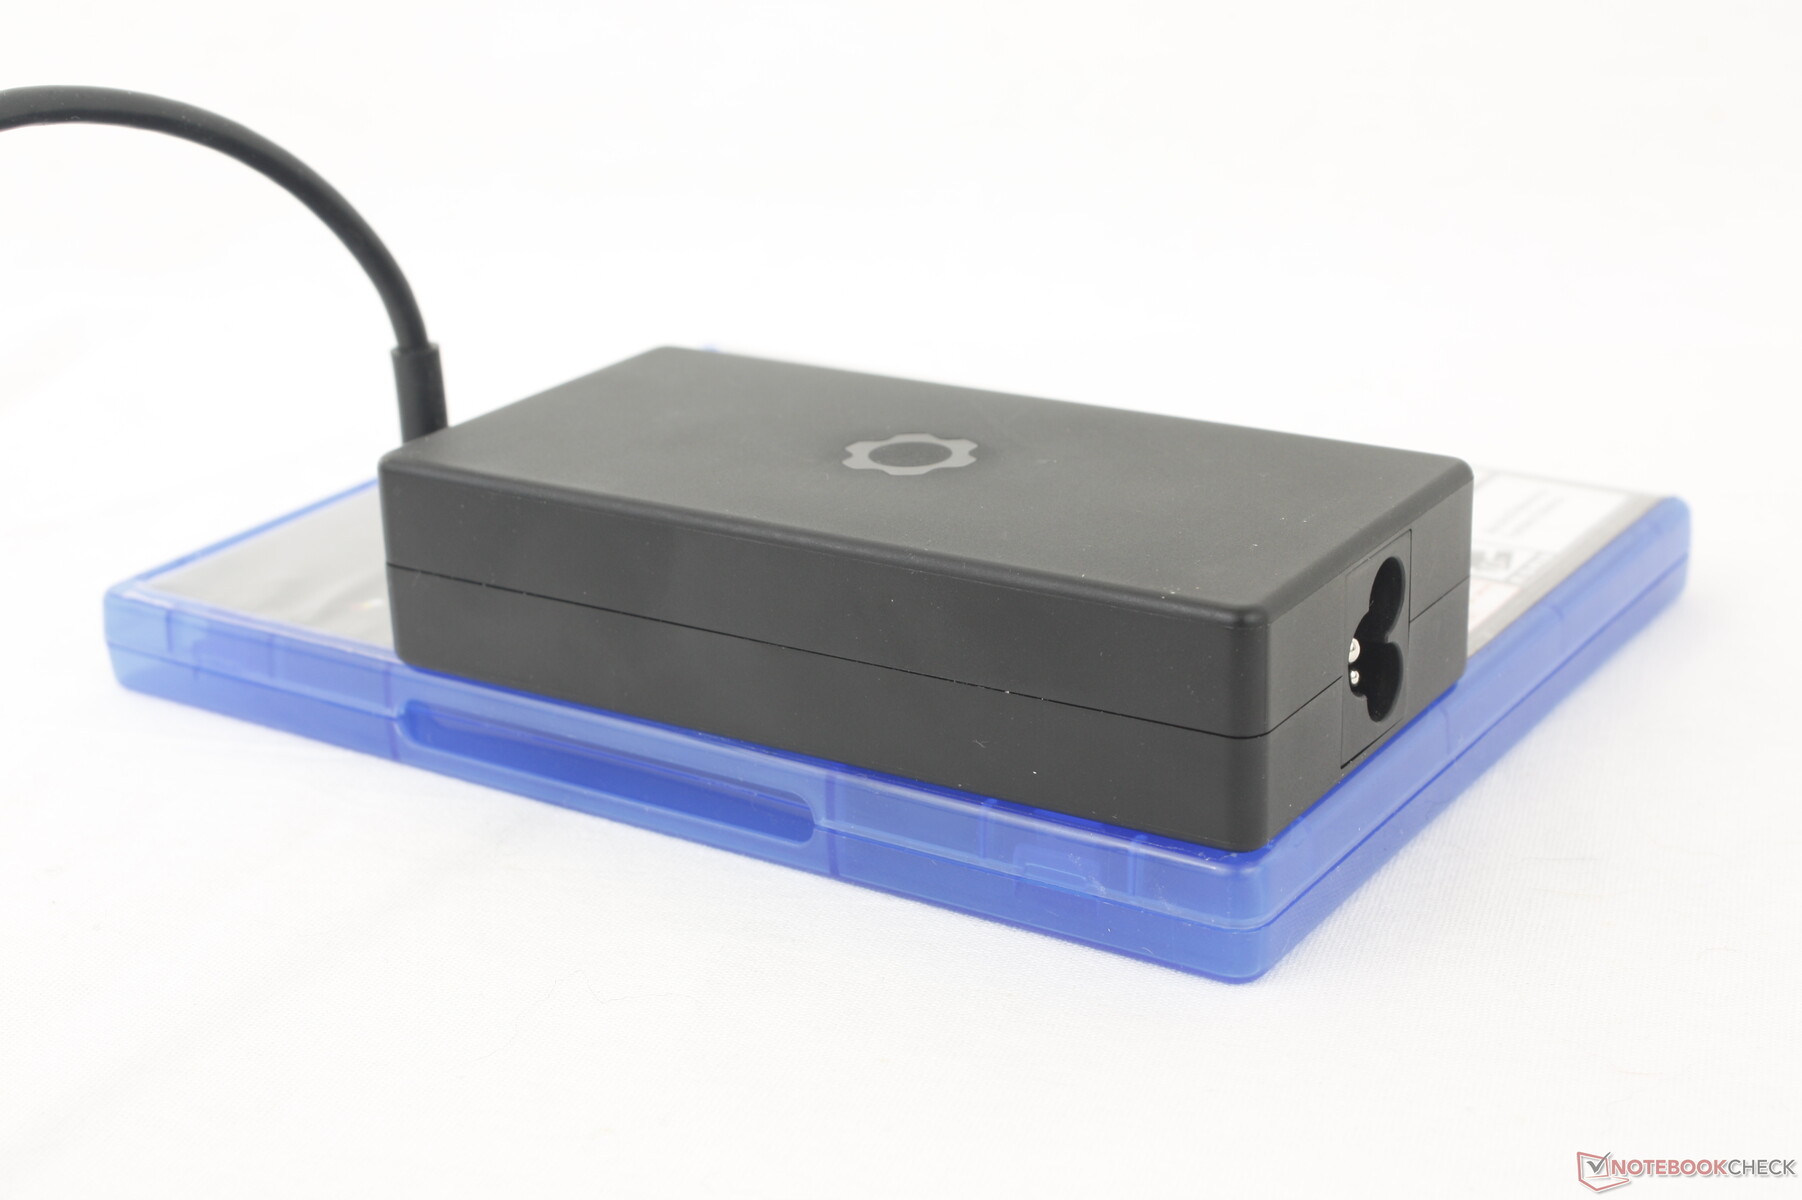
Tenga presente che l'adattatore CA USB-C da 180 W è uno dei più piccoli che abbiamo visto (~11,6 z 5,7 x 2,6 cm) per la sua potenza. Le sue dimensioni compatte sono rese possibili da transistor GaN, una tecnologia che Razer utilizza anche per i suoi adattatori CA. L'aspetto negativo del GaN è che gli adattatori stessi possono diventare molto caldi, a oltre 60 C, secondo la nostra esperienza. In confronto, i caricabatterie più grandi non-GaN si aggirano in genere tra i 40 C e i 50 C sotto carico.
(±) La temperatura massima sul lato superiore è di 42.4 °C / 108 F, rispetto alla media di 36.8 °C / 98 F, che varia da 21 a 71 °C per questa classe Multimedia.
(±) Il lato inferiore si riscalda fino ad un massimo di 40.8 °C / 105 F, rispetto alla media di 39.1 °C / 102 F
(+) In idle, la temperatura media del lato superiore è di 28.7 °C / 84 F, rispetto alla media deld ispositivo di 31.3 °C / 88 F.
(+) Riproducendo The Witcher 3, la temperatura media per il lato superiore e' di 30.2 °C / 86 F, rispetto alla media del dispositivo di 31.3 °C / 88 F.
(+) I poggiapolsi e il touchpad raggiungono la temperatura massima della pelle (33.2 °C / 91.8 F) e quindi non sono caldi.
(-) La temperatura media della zona del palmo della mano di dispositivi simili e'stata di 28.7 °C / 83.7 F (-4.5 °C / -8.1 F).
| Framework Laptop 16 AMD Ryzen 9 7940HS, AMD Radeon RX 7700S | MSI Prestige 16 B1MG-001US Intel Core Ultra 7 155H, Intel Arc 8-Core iGPU | Lenovo ThinkPad Z16 Gen 2 AMD Ryzen 9 PRO 7940HS, AMD Radeon RX 6550M | Apple MacBook Pro 16 2023 M3 Max Apple M3 Max 16-Core, Apple M3 Max 40-Core GPU | Dell Inspiron 16 Plus 7630 Intel Core i7-13700H, NVIDIA GeForce RTX 4060 Laptop GPU | HP Spectre x360 2-in-1 16-f1075ng Intel Core i7-12700H, Intel Iris Xe Graphics G7 96EUs | |
|---|---|---|---|---|---|---|
| Heat | 2% | 13% | 11% | -14% | 9% | |
| Maximum Upper Side * (°C) | 42.4 | 48.8 -15% | 43 -1% | 42.3 -0% | 47.8 -13% | 37.4 12% |
| Maximum Bottom * (°C) | 40.8 | 47.6 -17% | 41.6 -2% | 42 -3% | 42.2 -3% | 39.1 4% |
| Idle Upper Side * (°C) | 31.4 | 24.2 23% | 21.2 32% | 22.5 28% | 35.2 -12% | 27.1 14% |
| Idle Bottom * (°C) | 27.8 | 23.6 15% | 21.4 23% | 22.9 18% | 35 -26% | 26.3 5% |
* ... Meglio usare valori piccoli
Test da sforzo
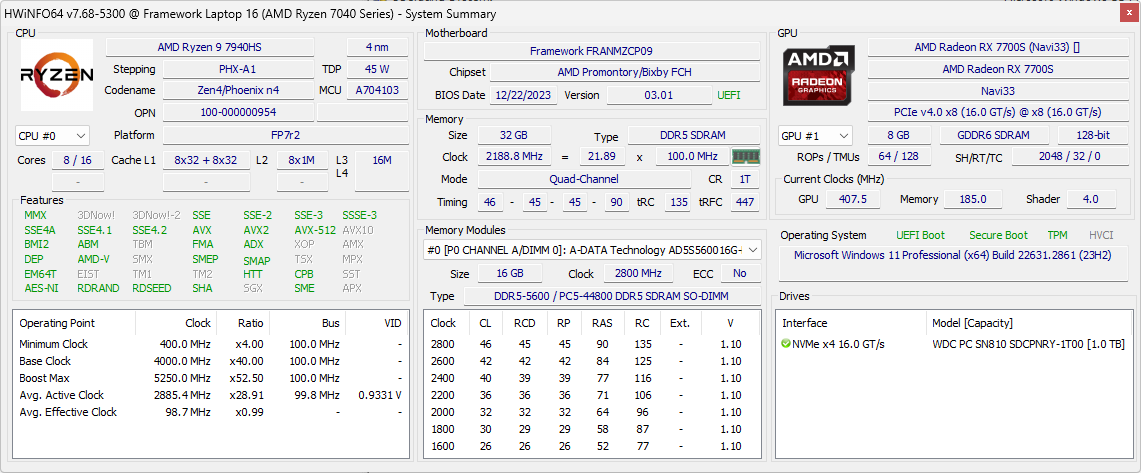
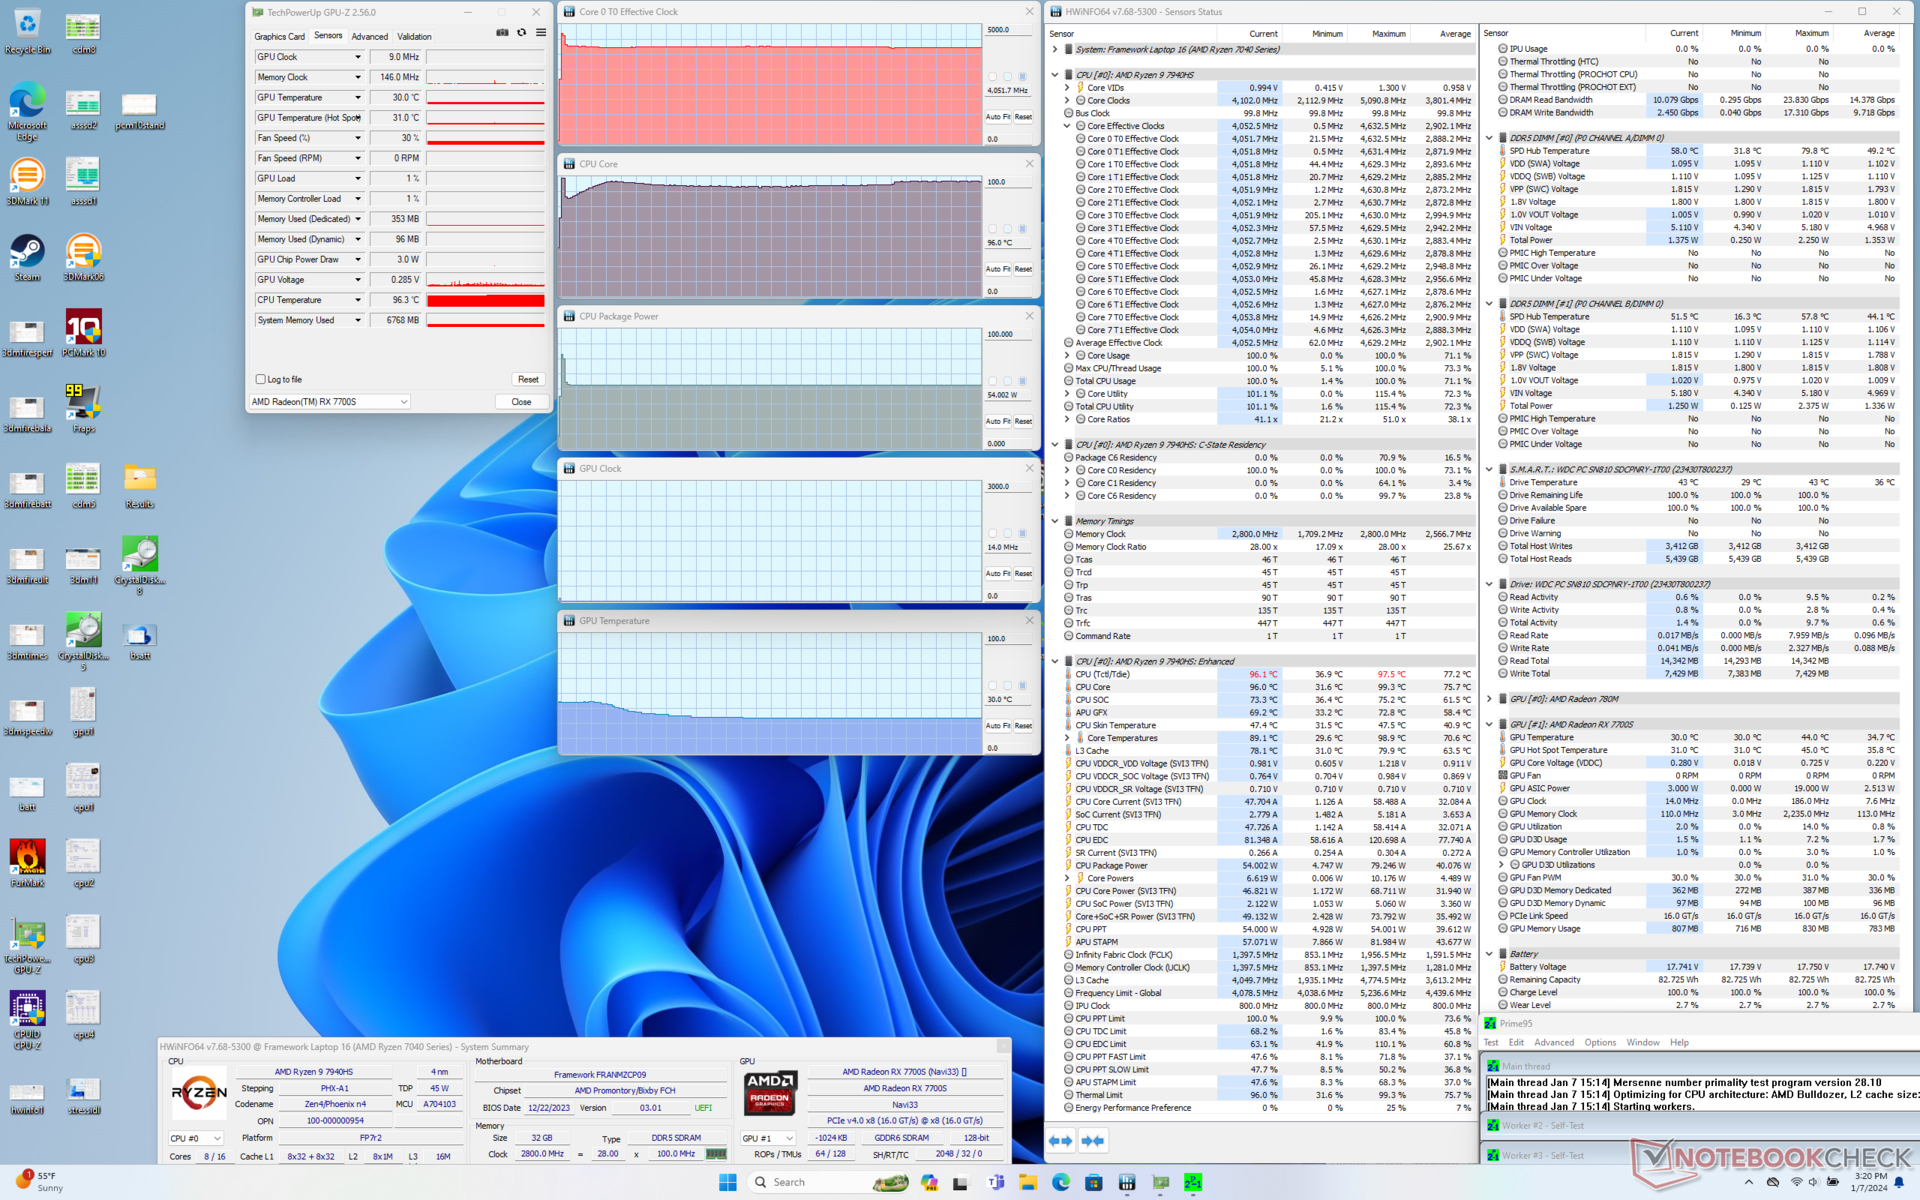
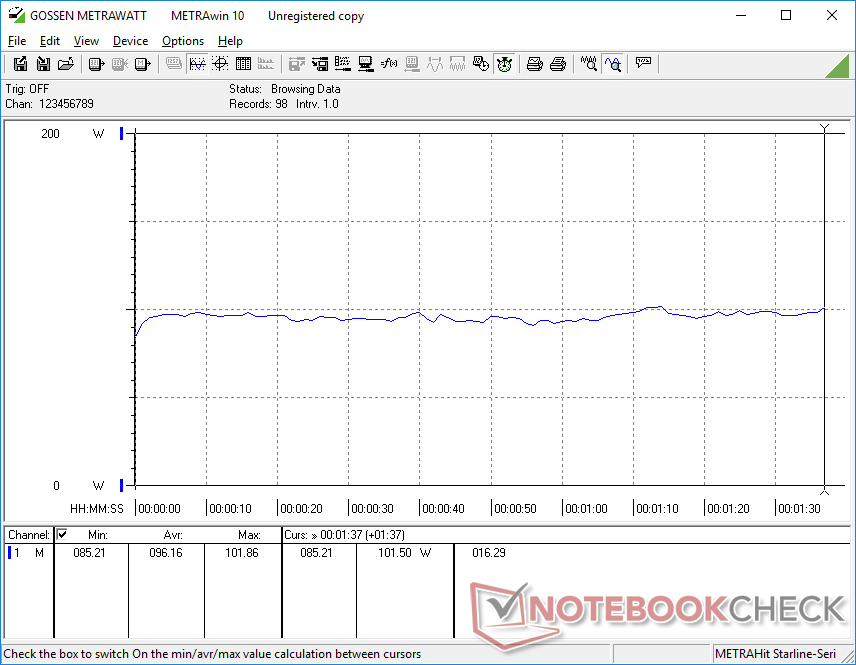
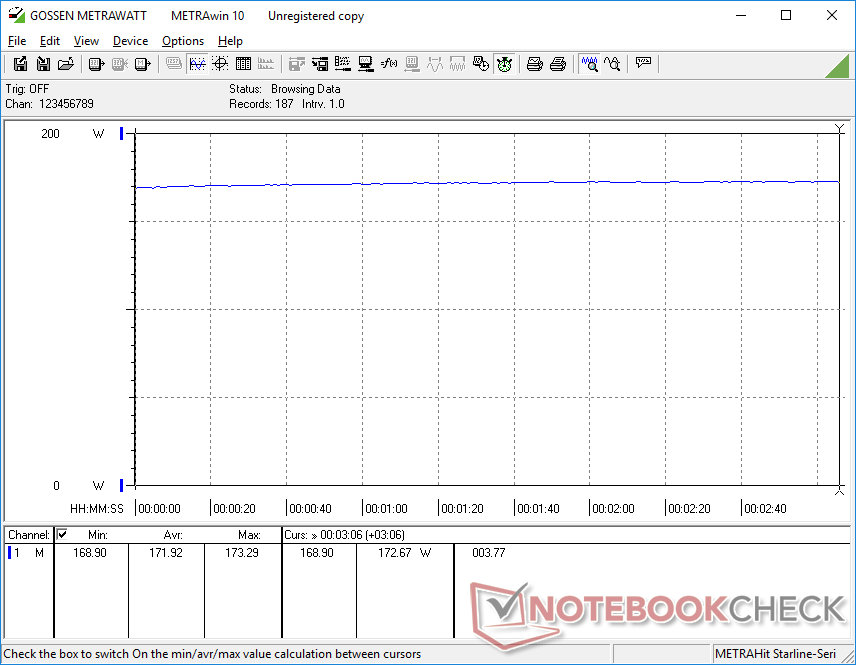
La CPU ha raggiunto i 4,6 GHz e gli 80 W per i primi due secondi quando è stato avviato lo stress Prime95, prima di scendere rapidamente e stabilizzarsi a 4,0 GHz, 54 W e 96 C, più bruschi del previsto Lenovo Slim Pro 9i 16 con il Core i9-13905H si otterrebbe una temperatura del core più bassa, pari a 82 C. Ciò suggerisce che Framework preferisce aumentare le prestazioni del processore e limitare il throttling, anche se ciò comporta temperature medie del core più elevate, che gli appassionati potrebbero apprezzare.
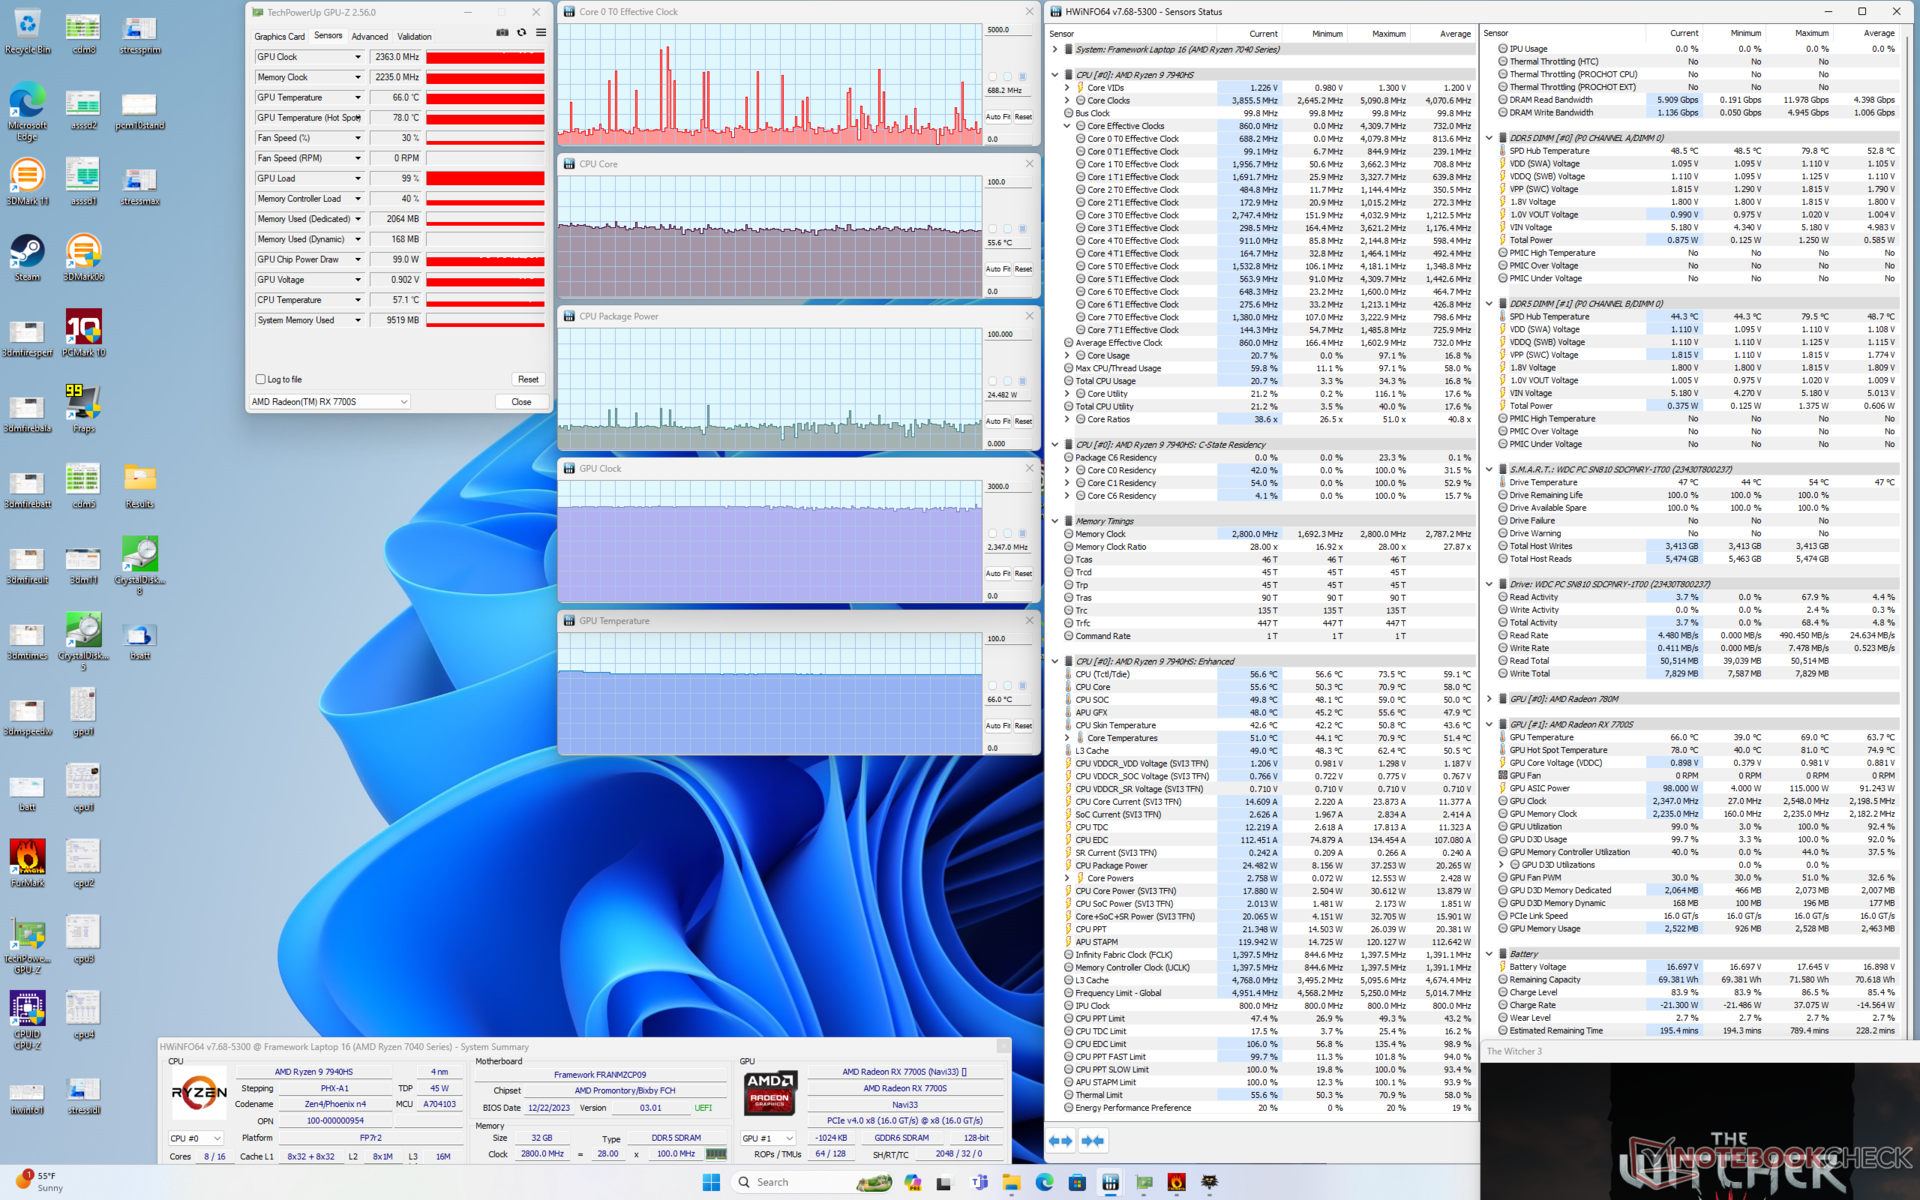
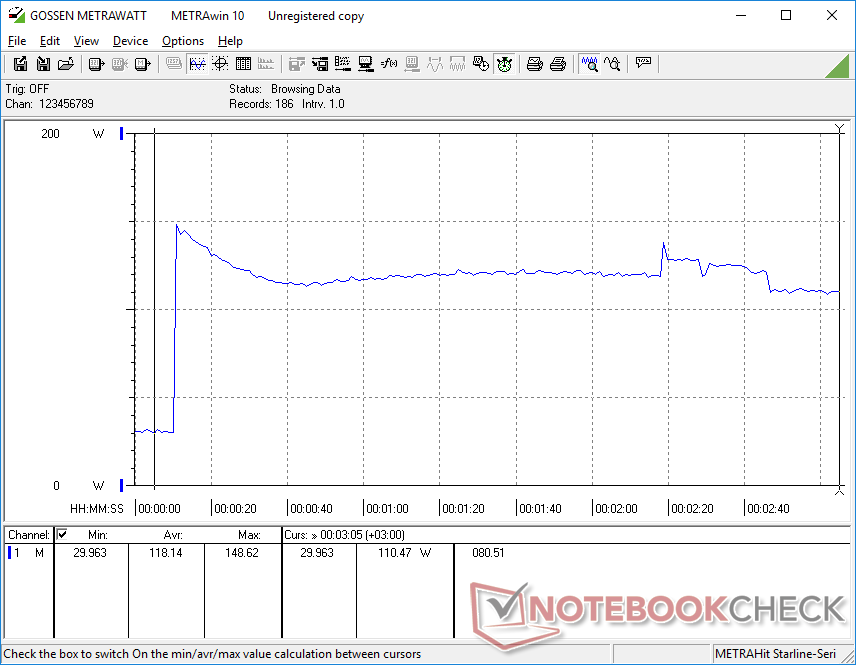
La GPU si stabilizzerebbe a 2363 MHz e 99 W quando è in funzione Witcher 3 il che significa che può utilizzare l'intero budget di 100 W durante il gioco. La temperatura del core rimarrebbe decentemente bassa a 66 C rispetto ai 62 C del già citato Lenovo con motore GeForce.
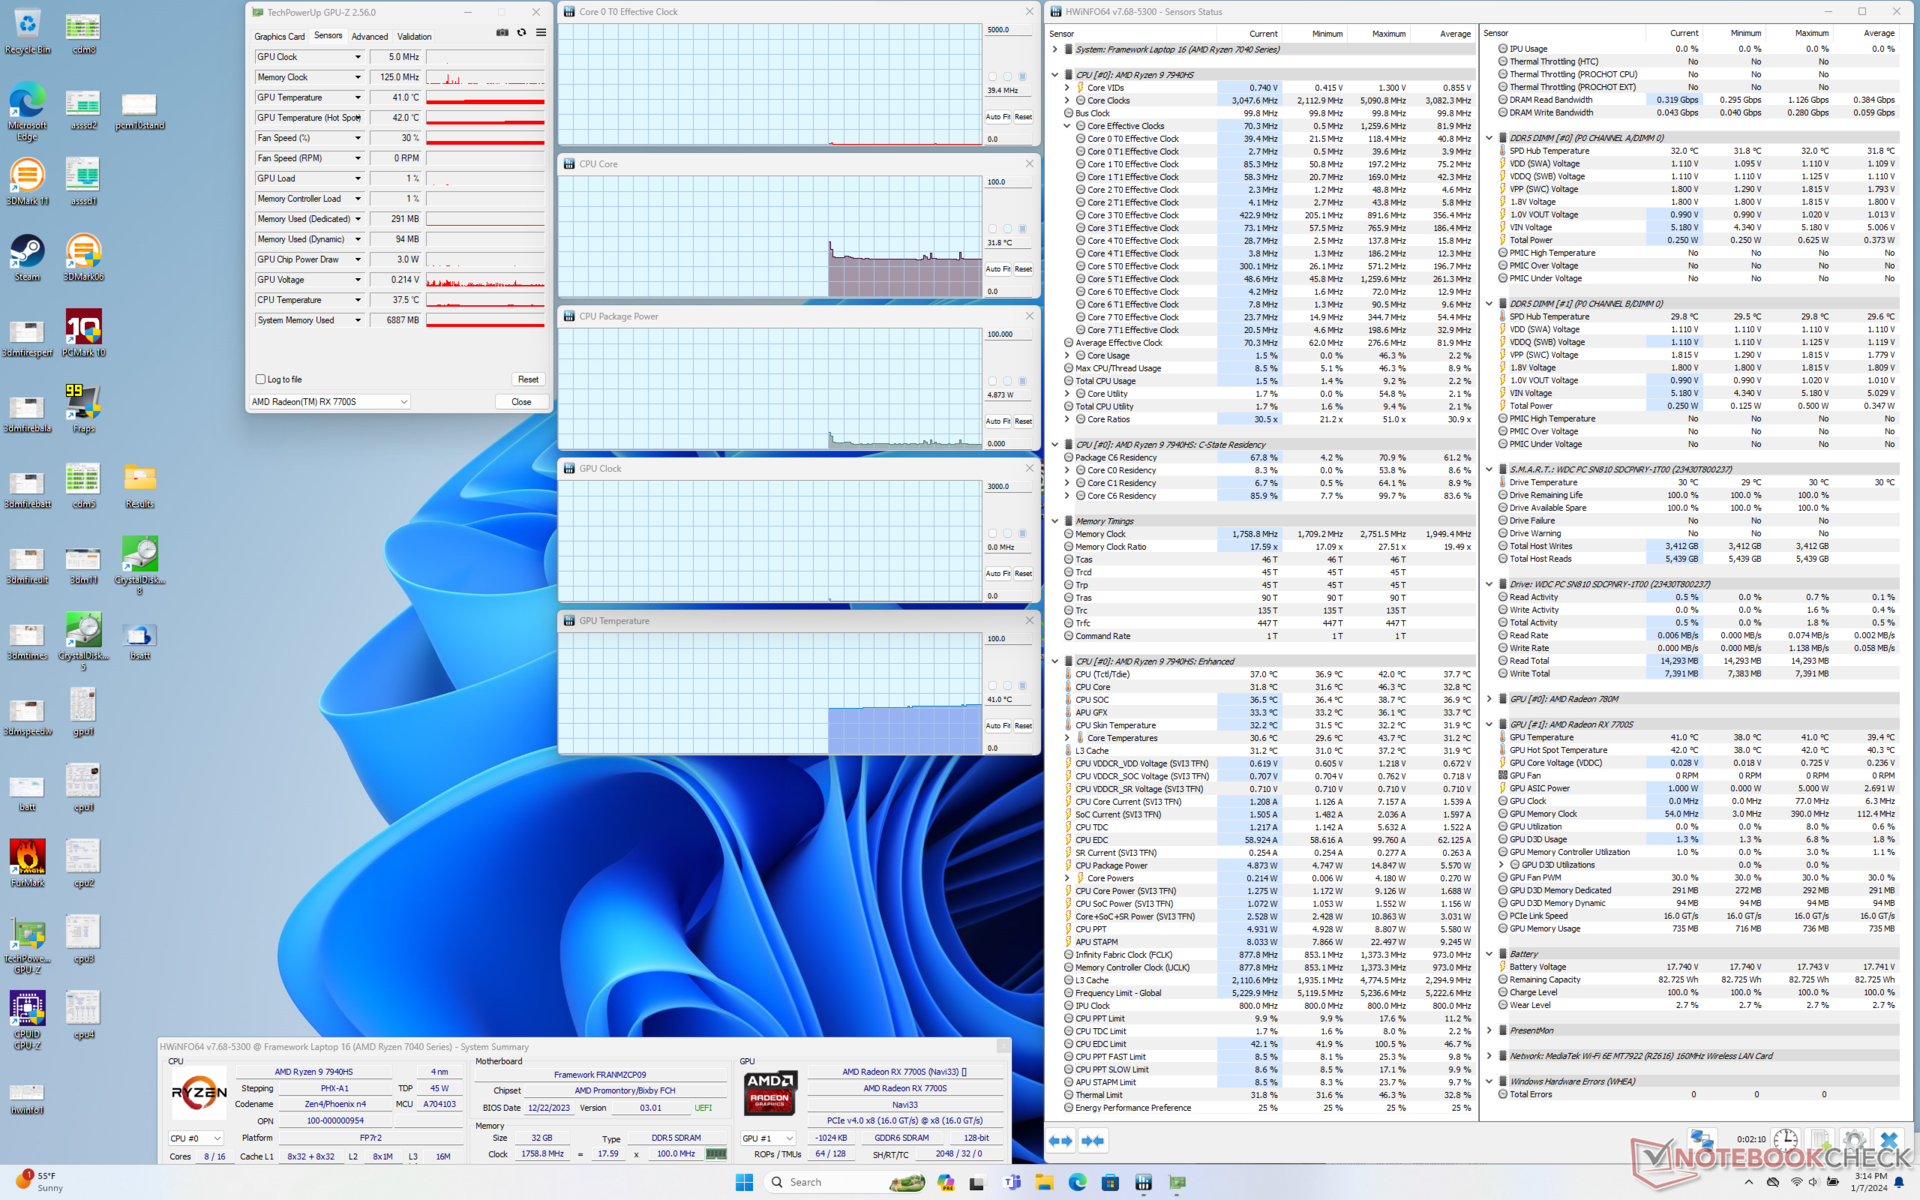
| Clock della CPU (GHz) | Clock della GPU (MHz) | Temperatura media della CPU (°C) | Temperatura media della GPU (°C) | |
| Sistema inattivo | -- | -- | 32 | 41 |
| Prime95 Stress | 4.0 | -- | 96 | 30 |
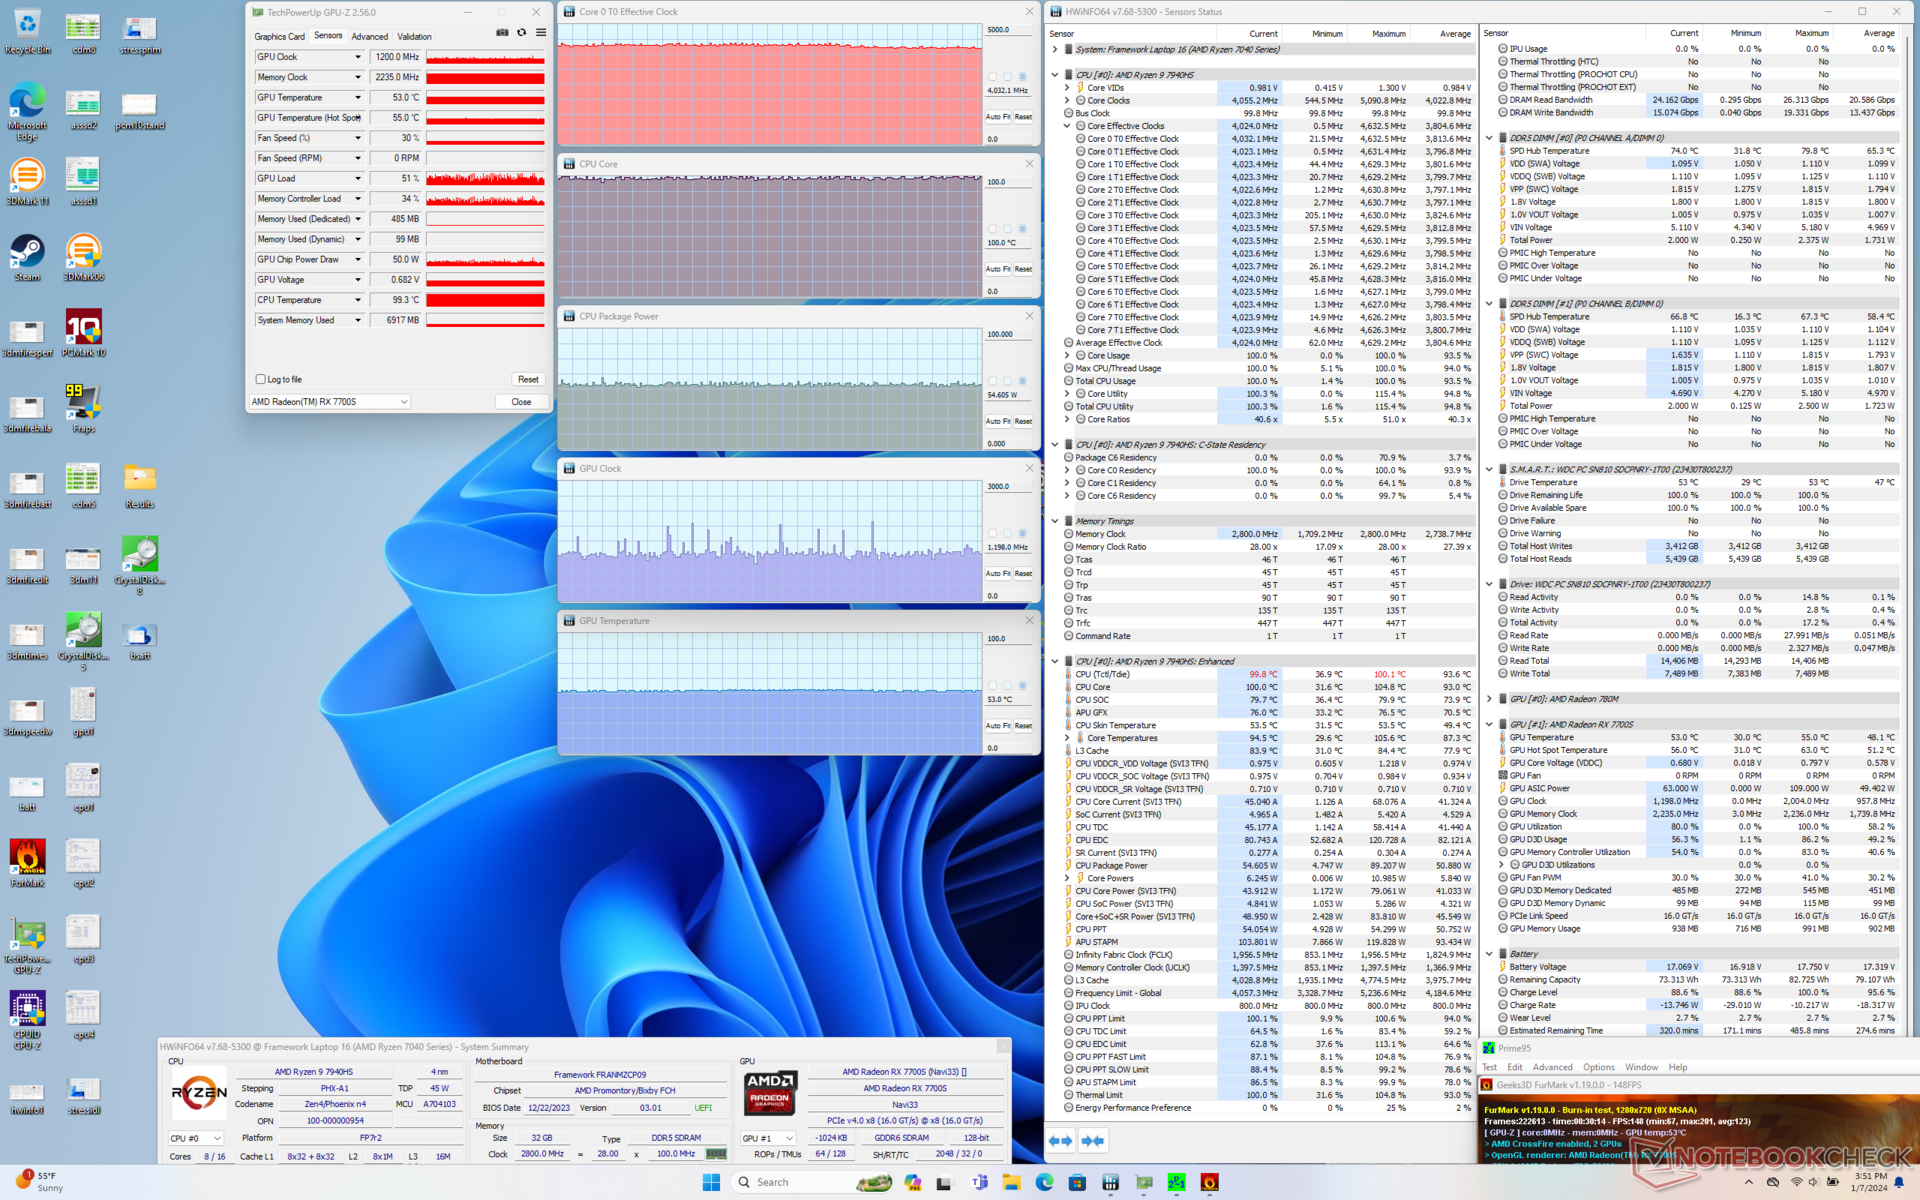
| Prime95 + FurMark Stress | 4,0 | 1200 | 100 | 53 |
| Witcher 3 Stress | ~0,7 | 2363 | 56 | 66 |
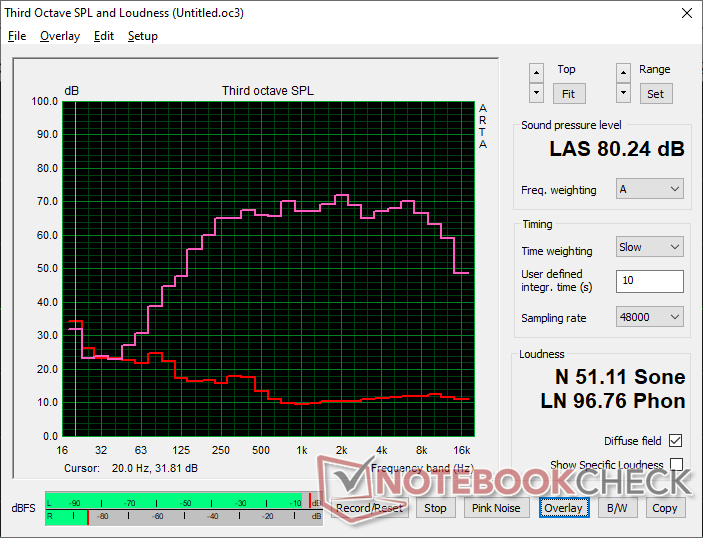
Altoparlanti
Framework Laptop 16 analisi audio
(±) | potenza degli altiparlanti media ma buona (80.2 dB)
Bassi 100 - 315 Hz
(±) | bassi ridotti - in media 9.6% inferiori alla media
(±) | la linearità dei bassi è media (8.1% delta rispetto alla precedente frequenza)
Medi 400 - 2000 Hz
(+) | medi bilanciati - solo only 2.2% rispetto alla media
(+) | medi lineari (3.8% delta rispetto alla precedente frequenza)
Alti 2 - 16 kHz
(+) | Alti bilanciati - appena 2% dalla media
(+) | alti lineari (4.9% delta rispetto alla precedente frequenza)
Nel complesso 100 - 16.000 Hz
(+) | suono nel complesso lineare (10.5% differenza dalla media)
Rispetto alla stessa classe
» 16% di tutti i dispositivi testati in questa classe è stato migliore, 1% simile, 83% peggiore
» Il migliore ha avuto un delta di 5%, medio di 17%, peggiore di 45%
Rispetto a tutti i dispositivi testati
» 5% di tutti i dispositivi testati in questa classe è stato migliore, 1% similare, 93% peggiore
» Il migliore ha avuto un delta di 4%, medio di 23%, peggiore di 134%
Apple MacBook Pro 16 2021 M1 Pro analisi audio
(+) | gli altoparlanti sono relativamente potenti (84.7 dB)
Bassi 100 - 315 Hz
(+) | bassi buoni - solo 3.8% dalla media
(+) | bassi in lineaa (5.2% delta rispetto alla precedente frequenza)
Medi 400 - 2000 Hz
(+) | medi bilanciati - solo only 1.3% rispetto alla media
(+) | medi lineari (2.1% delta rispetto alla precedente frequenza)
Alti 2 - 16 kHz
(+) | Alti bilanciati - appena 1.9% dalla media
(+) | alti lineari (2.7% delta rispetto alla precedente frequenza)
Nel complesso 100 - 16.000 Hz
(+) | suono nel complesso lineare (4.6% differenza dalla media)
Rispetto alla stessa classe
» 0% di tutti i dispositivi testati in questa classe è stato migliore, 0% simile, 100% peggiore
» Il migliore ha avuto un delta di 5%, medio di 17%, peggiore di 45%
Rispetto a tutti i dispositivi testati
» 0% di tutti i dispositivi testati in questa classe è stato migliore, 0% similare, 100% peggiore
» Il migliore ha avuto un delta di 4%, medio di 23%, peggiore di 134%
Gestione dell'energia
Consumo di energia
Il consumo energetico è paragonabile a quello del Dell Inspiron 16 Plus o del MacBook Pro 16 2023 quando è al minimo o quando esegue carichi poco impegnativi. Quando si eseguono carichi più elevati come i giochi, tuttavia, il consumo è più elevato del previsto. L'esecuzione Witcher 3 richiederebbe 172 W rispetto ai soli 122 W dell'Inspiron 16 Plus con RTX 4060. Se si considera che la RTX 4060 può spesso superare la Radeon RX 7700S in molti giochi, le prestazioni GPU-per-watt del Laptop 16 non sono altrettanto buone dell'alternativa di Nvidia, il che conferma le nostre affermazioni di cui sopra.
Anche la CPU può essere molto esigente, con un consumo a livello di sistema di 110 W durante l'esecuzione di Prime95, rispetto ai soli 75 W di MSI Stealth 16 MSI Stealth 16 alimentato dal Core i9-13900H.
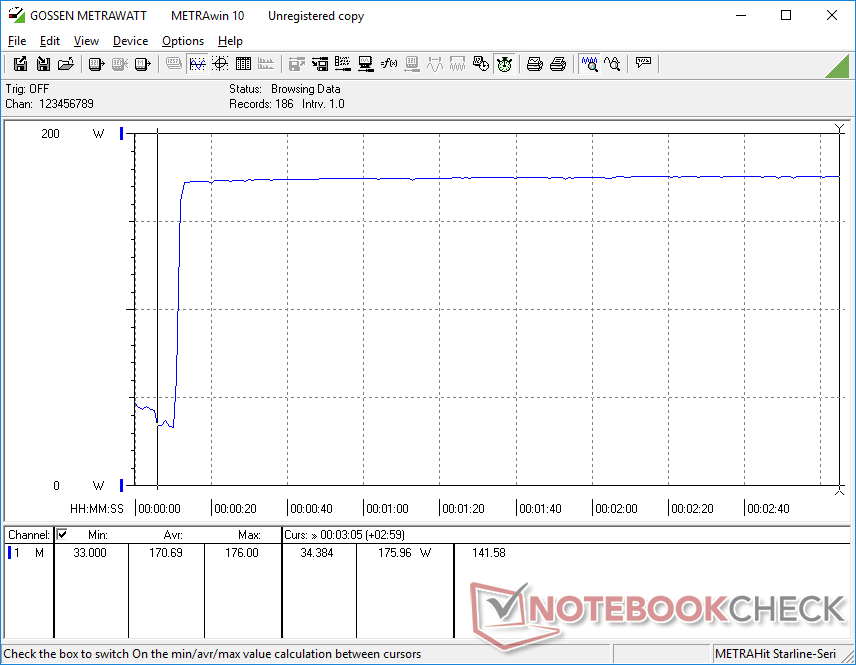
Siamo riusciti a registrare un consumo massimo di 176 W dal piccolo adattatore CA USB-C da 180 W quando si eseguono giochi o altri carichi estremi come Prime95 e FurMark. Questo è importante da notare, perché la limitatezza dell'adattatore CA può ostacolare le prestazioni o le capacità di ricarica del portatile. In questo caso, la velocità di carica viene influenzata quando si eseguono carichi impegnativi. Ad esempio, siamo in grado di osservare il calo della batteria dal 100% all'85% quando è collegato a una presa di corrente e in funzione Witcher 3 il che significa che non è possibile caricare la batteria a una velocità decente mentre si eseguono contemporaneamente carichi impegnativi. Questo scenario non si verificherebbe mai sulla maggior parte degli altri computer portatili.
| Off / Standby | |
| Idle | |
| Sotto carico |
|
Leggenda:
min: | |
| Framework Laptop 16 R9 7940HS, Radeon RX 7700S, WDC PC SN810 1TB, , 2560x1600, 16" | MSI Prestige 16 B1MG-001US Ultra 7 155H, Arc 8-Core, Samsung PM9A1 MZVL22T0HBLB, IPS, 2560x1600, 16" | Lenovo ThinkPad Z16 Gen 2 R9 PRO 7940HS, Radeon RX 6550M, Kioxia XG8 KXG8AZNV1T02, OLED, 3840x2400, 16" | Apple MacBook Pro 16 2023 M3 Max Apple M3 Max 16-Core, M3 Max 40-Core GPU, Apple SSD AP8192Z, Mini-LED, 3456x2234, 16" | Dell Inspiron 16 Plus 7630 i7-13700H, GeForce RTX 4060 Laptop GPU, WD PC SN740 SDDPTQD-1T00, IPS, 2560x1600, 16" | HP Spectre x360 2-in-1 16-f1075ng i7-12700H, Iris Xe G7 96EUs, SK Hynix PC711 1TB HFS001TDE9X073N, IPS, 3072x1920, 16" | |
|---|---|---|---|---|---|---|
| Power Consumption | 46% | 26% | 18% | -5% | 40% | |
| Idle Minimum * (Watt) | 9.5 | 3 68% | 7.5 21% | 5.2 45% | 15.6 -64% | 9 5% |
| Idle Average * (Watt) | 17 | 9.5 44% | 9.6 44% | 16.9 1% | 17.7 -4% | 11.1 35% |
| Idle Maximum * (Watt) | 17.2 | 12 30% | 18.5 -8% | 17.2 -0% | 20.6 -20% | 16.4 5% |
| Load Average * (Watt) | 96.2 | 68.3 29% | 57.1 41% | 90.5 6% | 87.4 9% | 38.3 60% |
| Witcher 3 ultra * (Watt) | 171.9 | 59.8 65% | 115.8 33% | 109 37% | 121.7 29% | 34.4 80% |
| Load Maximum * (Watt) | 175.7 | 104.8 40% | 131.7 25% | 145.2 17% | 138 21% | 82.5 53% |
* ... Meglio usare valori piccoli
Power Consumption Witcher 3 / Stresstest
Power Consumption external Monitor
Durata della batteria
L'autonomia della batteria da 85 Wh è rispettabile, con poco più di 9 ore di navigazione WLAN nel mondo reale, simile a quella del modello Dell Inspiron 16 Plus 7630 o HP Spectre x360 2-in-1. Consigliamo di impostare il display su una frequenza di aggiornamento variabile invece che sulla frequenza fissa e predefinita di 165 Hz, per sfruttare meglio la batteria. Con l'impostazione dinamica da 83 Hz a 165 Hz, ad esempio, siamo in grado di resistere 20 minuti in più nello stesso test WLAN. La maggior parte degli smartphone utilizza questa stessa tecnica per risparmiare sulla durata della batteria.
La ricarica da vuoto a pieno regime con l'adattatore CA incluso richiede circa 2 ore se il computer è al minimo o se si eseguono carichi poco impegnativi. Se si eseguono carichi più estremi, tuttavia, la batteria si caricherà molto più lentamente, come già detto. Un adattatore CA USB-C da 240 W più grande avrebbe potuto risolvere questo problema.
| Framework Laptop 16 R9 7940HS, Radeon RX 7700S, 85 Wh | MSI Prestige 16 B1MG-001US Ultra 7 155H, Arc 8-Core, 99.9 Wh | Lenovo ThinkPad Z16 Gen 2 R9 PRO 7940HS, Radeon RX 6550M, 72 Wh | Apple MacBook Pro 16 2023 M3 Max Apple M3 Max 16-Core, M3 Max 40-Core GPU, 99.6 Wh | Dell Inspiron 16 Plus 7630 i7-13700H, GeForce RTX 4060 Laptop GPU, 86 Wh | HP Spectre x360 2-in-1 16-f1075ng i7-12700H, Iris Xe G7 96EUs, 83 Wh | |
|---|---|---|---|---|---|---|
| Autonomia della batteria | 86% | -17% | 32% | 5% | 20% | |
| Reader / Idle (h) | 14.8 | 25.1 70% | 10.2 -31% | 17.6 19% | 20.6 39% | |
| WiFi v1.3 (h) | 9.1 | 18.3 101% | 6 -34% | 16.7 84% | 9.4 3% | 10.5 15% |
| Load (h) | 1.5 | 2.8 87% | 1.7 13% | 1.2 -20% | 1.4 -7% | 1.6 7% |
| H.264 (h) | 20.4 | 11.2 |
Pro
Contro
Verdetto - Una maggiore riparabilità significa un aumento delle dimensioni e del peso
La tendenza verso computer portatili più sottili e leggeri è resa possibile dalla fusione di un numero sempre maggiore di componenti sulla scheda principale. Lo svantaggio principale di questo approccio è che limita la riparabilità, in quanto anche un piccolo guasto può richiedere la sostituzione di intere schede. Framework è uno degli unici produttori a guardare dall'altra parte, nel tentativo di migliorare la personalizzazione e l'assistenza agli utenti finali. Non c'è dubbio che il Laptop 16 sia più facile da riparare rispetto a qualsiasi alternativa, ma questa caratteristica redditizia ha un costo in termini di dimensioni e peso, in quanto i singoli componenti devono essere facilmente sostituibili. Se intende aggiornare la RAM o l'SSD solo una o due volte nell'arco della vita di un portatile, allora le alternative da 16 pollici più compatte e comode da trasportare, come l' Inspiron 16 Plus o Asus VivoBook Pro 16 potrebbero servirla meglio a questo proposito.
La dGPU rimovibile è anche un'impresa rischiosa, poiché storicamente non ha avuto successo presso gli OEM più grandi come Dell e Lenovo. Il fatto che esistano opzioni eGPU universali basate su USB4 o Thunderbolt rende la dGPU specializzata del Laptop 16 molto meno interessante. Se vuole veramente una grafica discreta in viaggio, la RTX 4060 di GeForce può offrire prestazioni migliori e prestazioni per watt rispetto alla Radeon 7700S. Framework dovrà quindi supportare il design Laptop 16 dGPU per gli anni a venire, con future opzioni RDNA, per far sì che l'investimento valga la pena. Acquistare oggi significa affidarsi all'azienda per questo.
Il Framework Laptop 16 è più grande e più pesante di altri computer portatili da 16 pollici, in nome della riparabilità e della sostenibilità. Se fa spesso aggiornamenti o prevede riparazioni, il Laptop 16 può essere conveniente. In caso contrario, le alternative degli OEM più grandi tendono ad essere più veloci e più leggere.
Per i motivi di cui sopra, gli acquirenti interessati dovrebbero apprezzare le schede di espansione, l'angolo di sostenibilità e l'elevata riparabilità del girthy Laptop 16, in quanto le alternative tendono ad essere più sottili, più leggere e talvolta più veloci, soprattutto nella fascia dei 2000 dollari. Se Framework può in qualche modo eguagliare le dimensioni del Razer Blade 16 o MacBook Pro mantenendo la riparabilità, allora le future revisioni potranno potenzialmente diventare qualcosa di molto speciale. Per ora, dovrà sacrificare un po' di portabilità per poter godere di tutte le caratteristiche uniche di Framework.
Prezzo e disponibilità
Framework sta accettando i preordini per il Laptop 16 a partire da 1400 dollari per l'edizione base Ryzen 7 DIY, fino a oltre 2400 dollari se configurato con Ryzen 9, grafica discreta Radeon 7700S e schede e moduli di espansione multipli.
Framework Laptop 16
- 01/23/2024 v7 (old)
Allen Ngo
Transparency
La selezione dei dispositivi da recensire viene effettuata dalla nostra redazione. Il campione di prova è stato fornito all'autore come prestito dal produttore o dal rivenditore ai fini di questa recensione. L'istituto di credito non ha avuto alcuna influenza su questa recensione, né il produttore ne ha ricevuto una copia prima della pubblicazione. Non vi era alcun obbligo di pubblicare questa recensione. In quanto società mediatica indipendente, Notebookcheck non è soggetta all'autorità di produttori, rivenditori o editori.
Ecco come Notebookcheck esegue i test
Ogni anno, Notebookcheck esamina in modo indipendente centinaia di laptop e smartphone utilizzando procedure standardizzate per garantire che tutti i risultati siano comparabili. Da circa 20 anni sviluppiamo continuamente i nostri metodi di prova e nel frattempo stabiliamo gli standard di settore. Nei nostri laboratori di prova, tecnici ed editori esperti utilizzano apparecchiature di misurazione di alta qualità. Questi test comportano un processo di validazione in più fasi. Il nostro complesso sistema di valutazione si basa su centinaia di misurazioni e parametri di riferimento ben fondati, che mantengono l'obiettività.Price comparison

