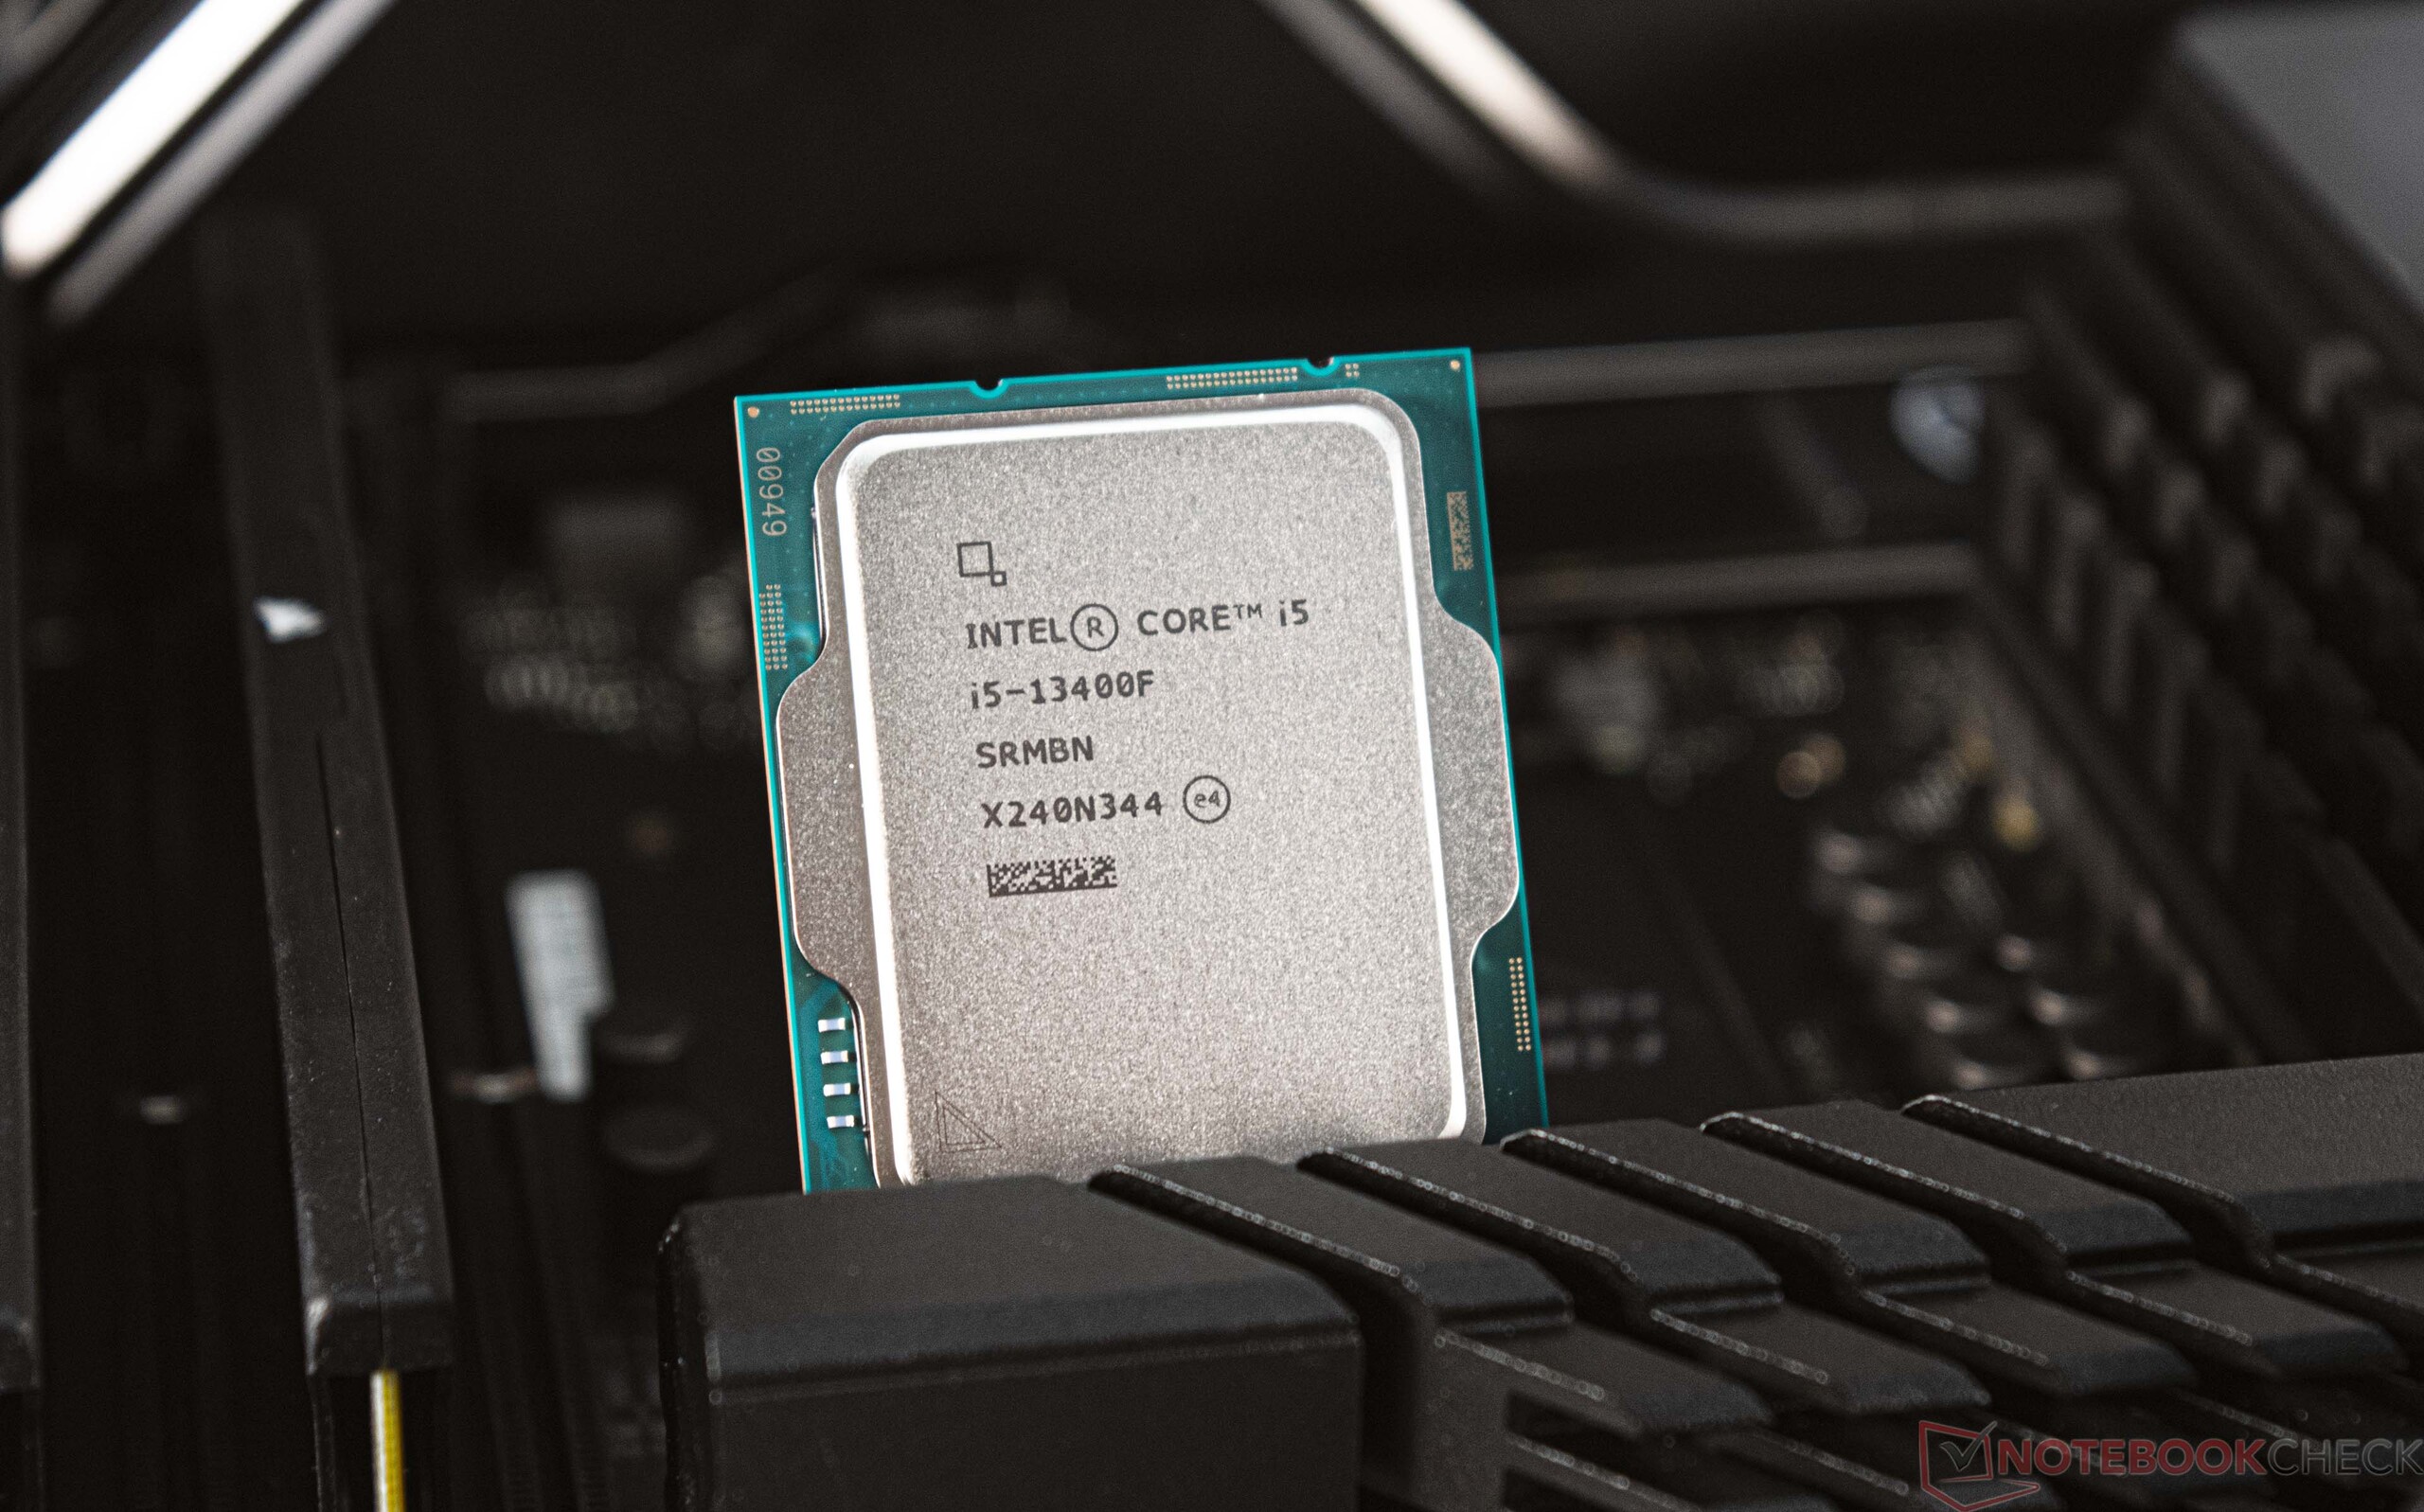
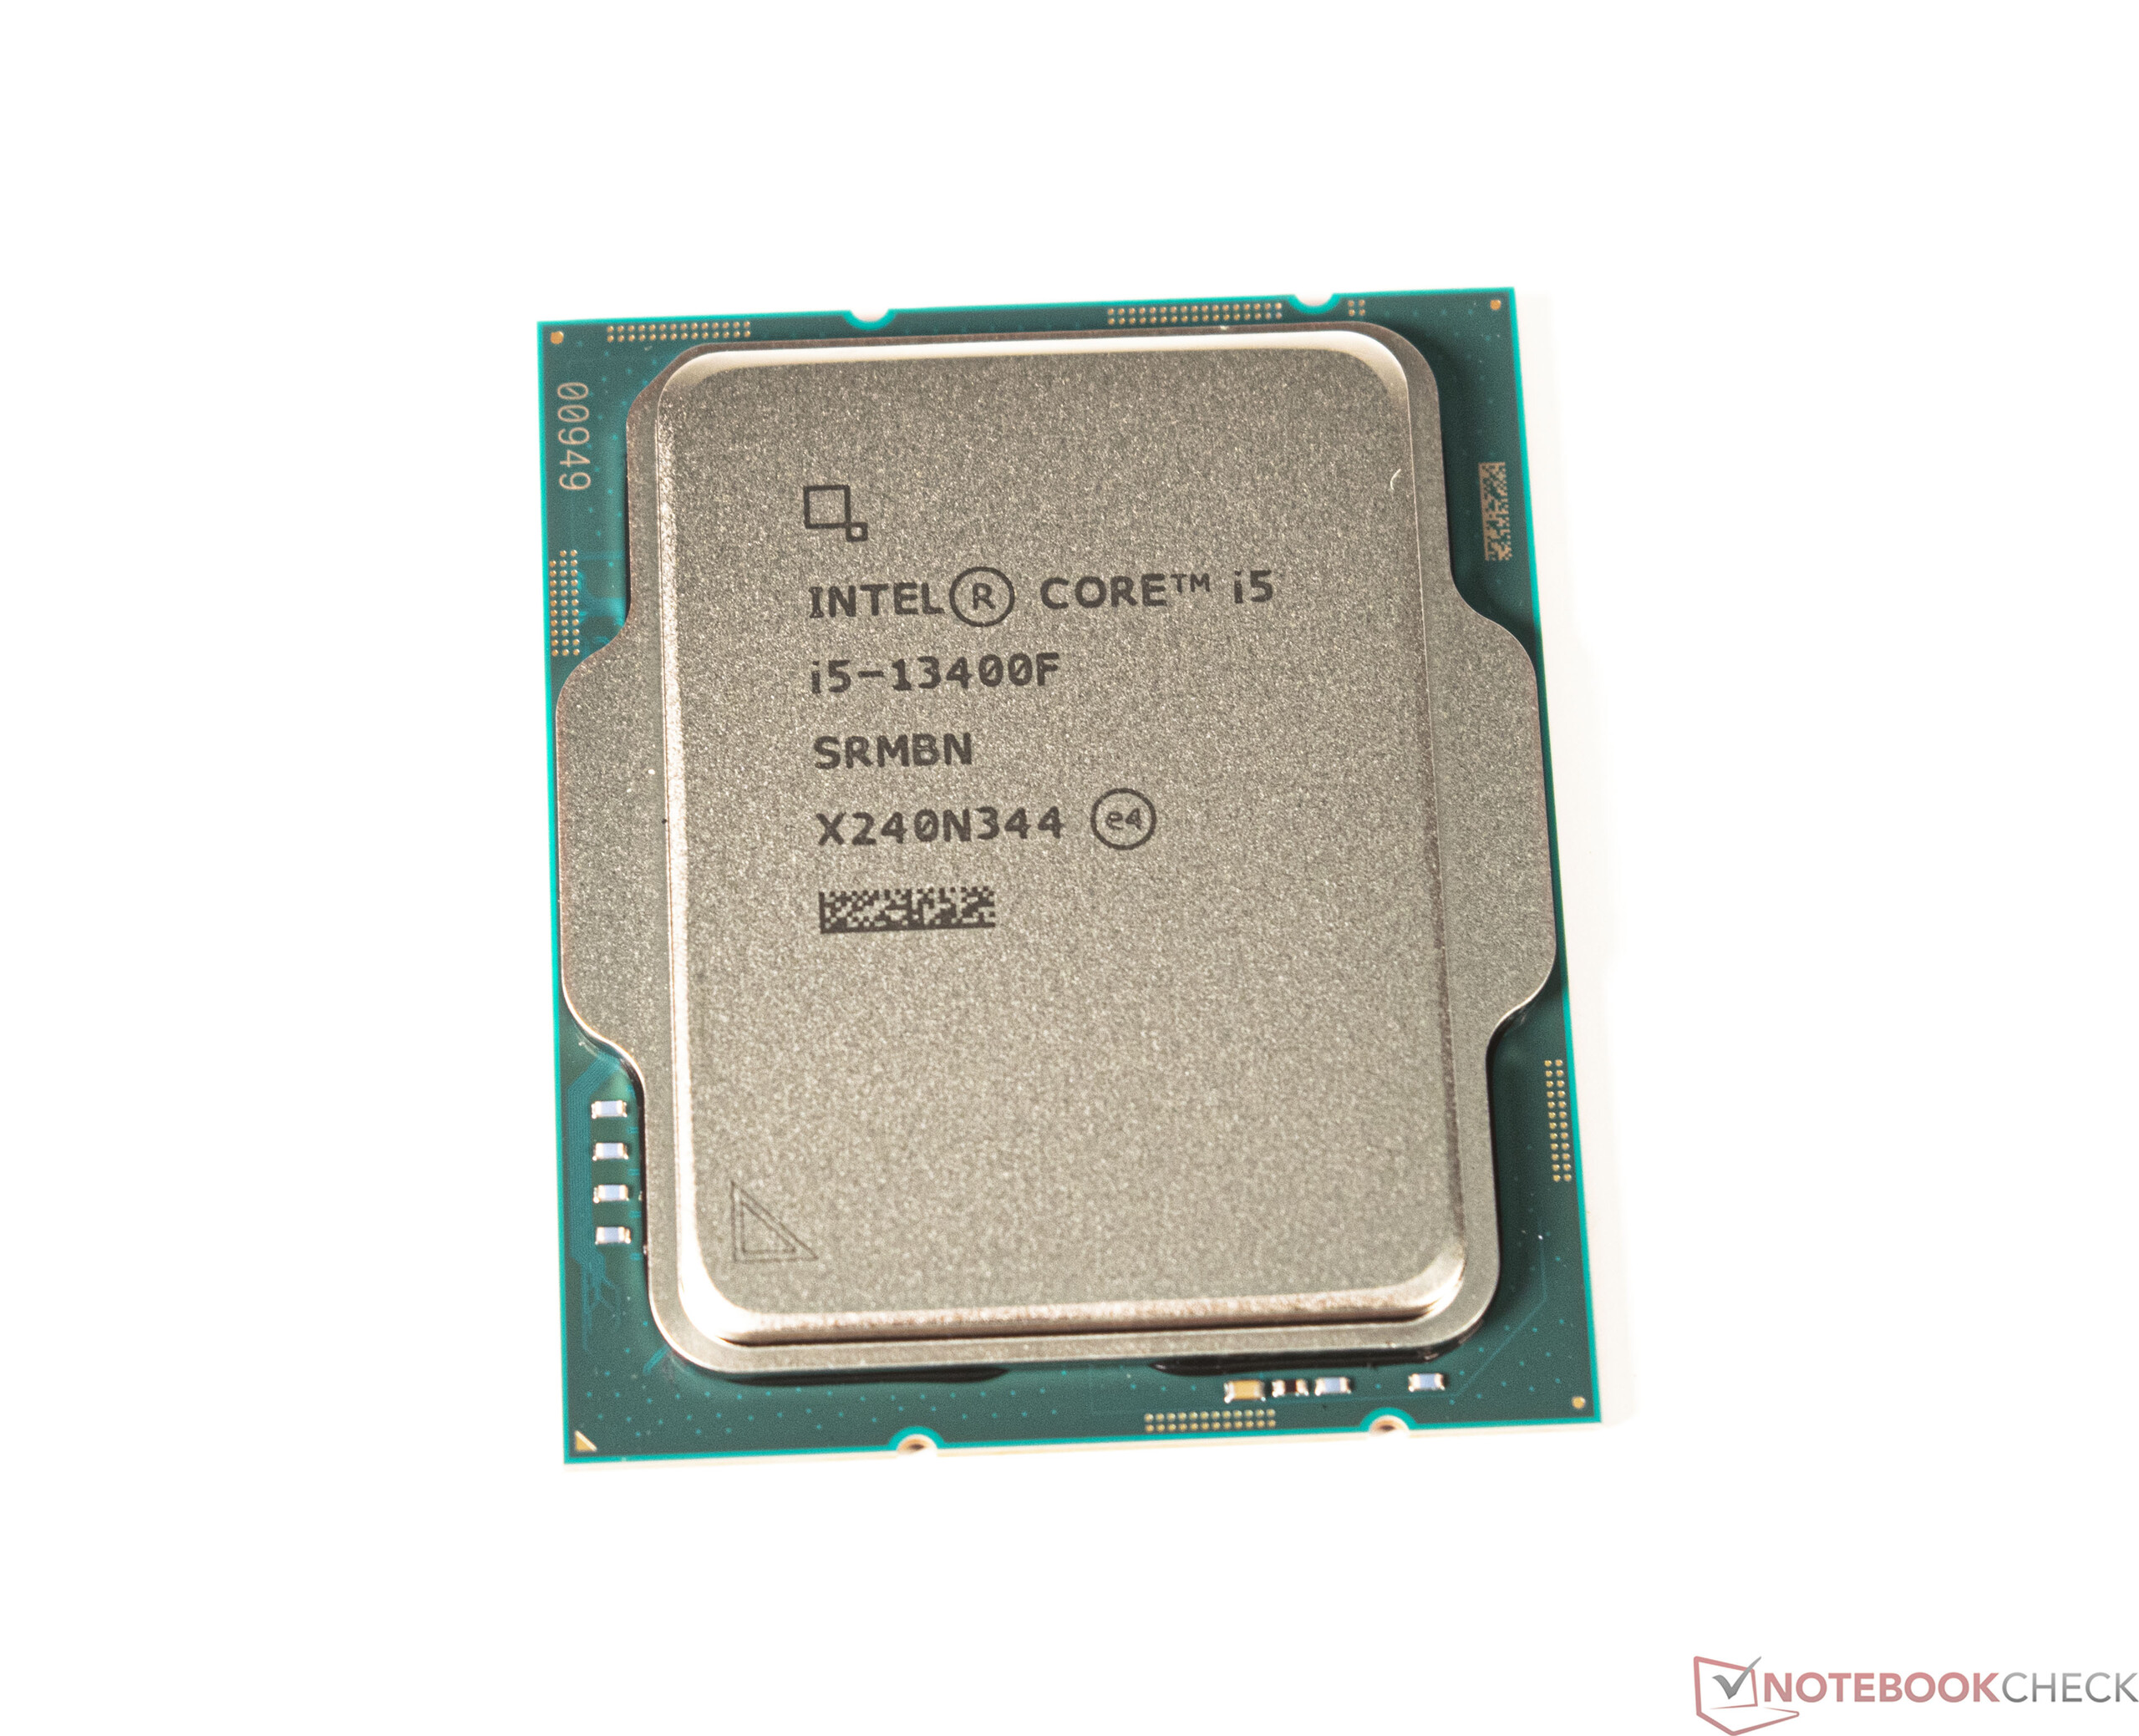
Recensione della CPU desktop Intel Core i5-13400F: Processore a 10 core economico e conveniente per il gaming e il lavoro

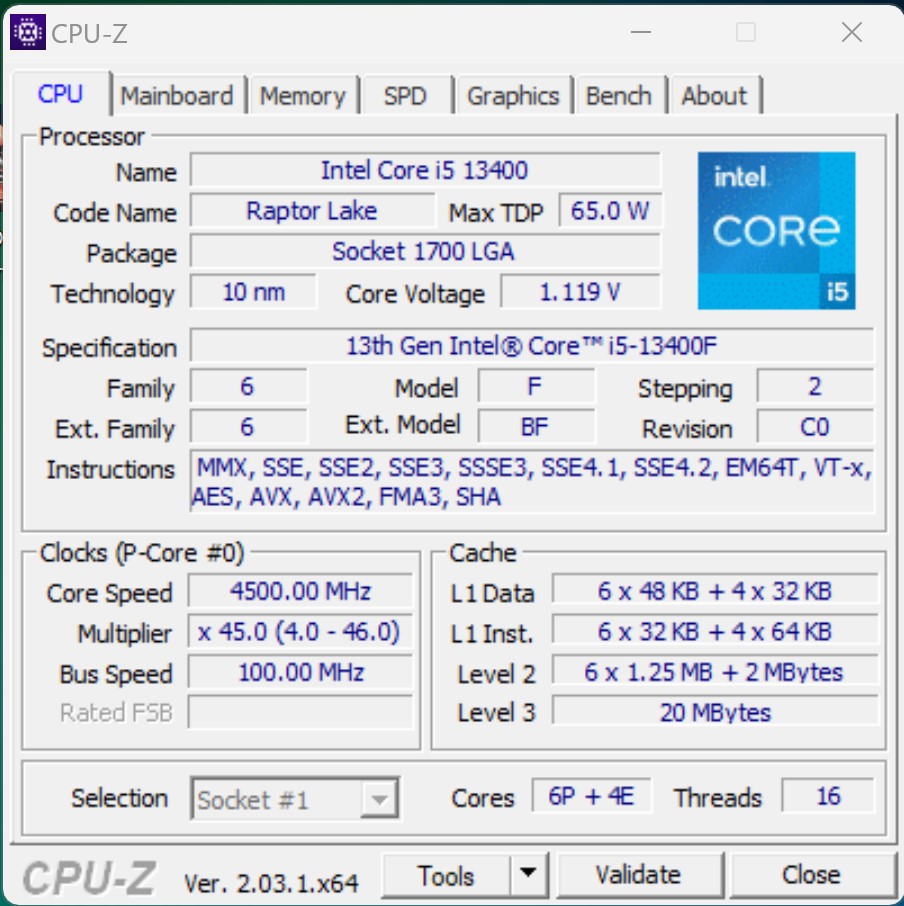
Con la serie Alder Lake Intel ha lanciato l'architettura ibrida delle CPU, che combina i cosiddetti core P ed E sotto un unico diffusore di calore. Finora i core E sono stati omessi dalle CPU entry-level, il che ha influito principalmente sulle prestazioni multi-thread. Con la 13a generazione di Core, Intel ha finalmente dotato il Core i5-13400F di 4 core E in più oltre ai 6 core P. Pertanto, ora è alla pari con un Intel Core i5-12600K della serie Alder Lake. Tuttavia, questi due modelli differiscono fortemente nel consumo energetico. Tuttavia, solo pochi punti percentuali separano i due modelli in termini di prestazioni, che possiamo rivelare a questo punto.
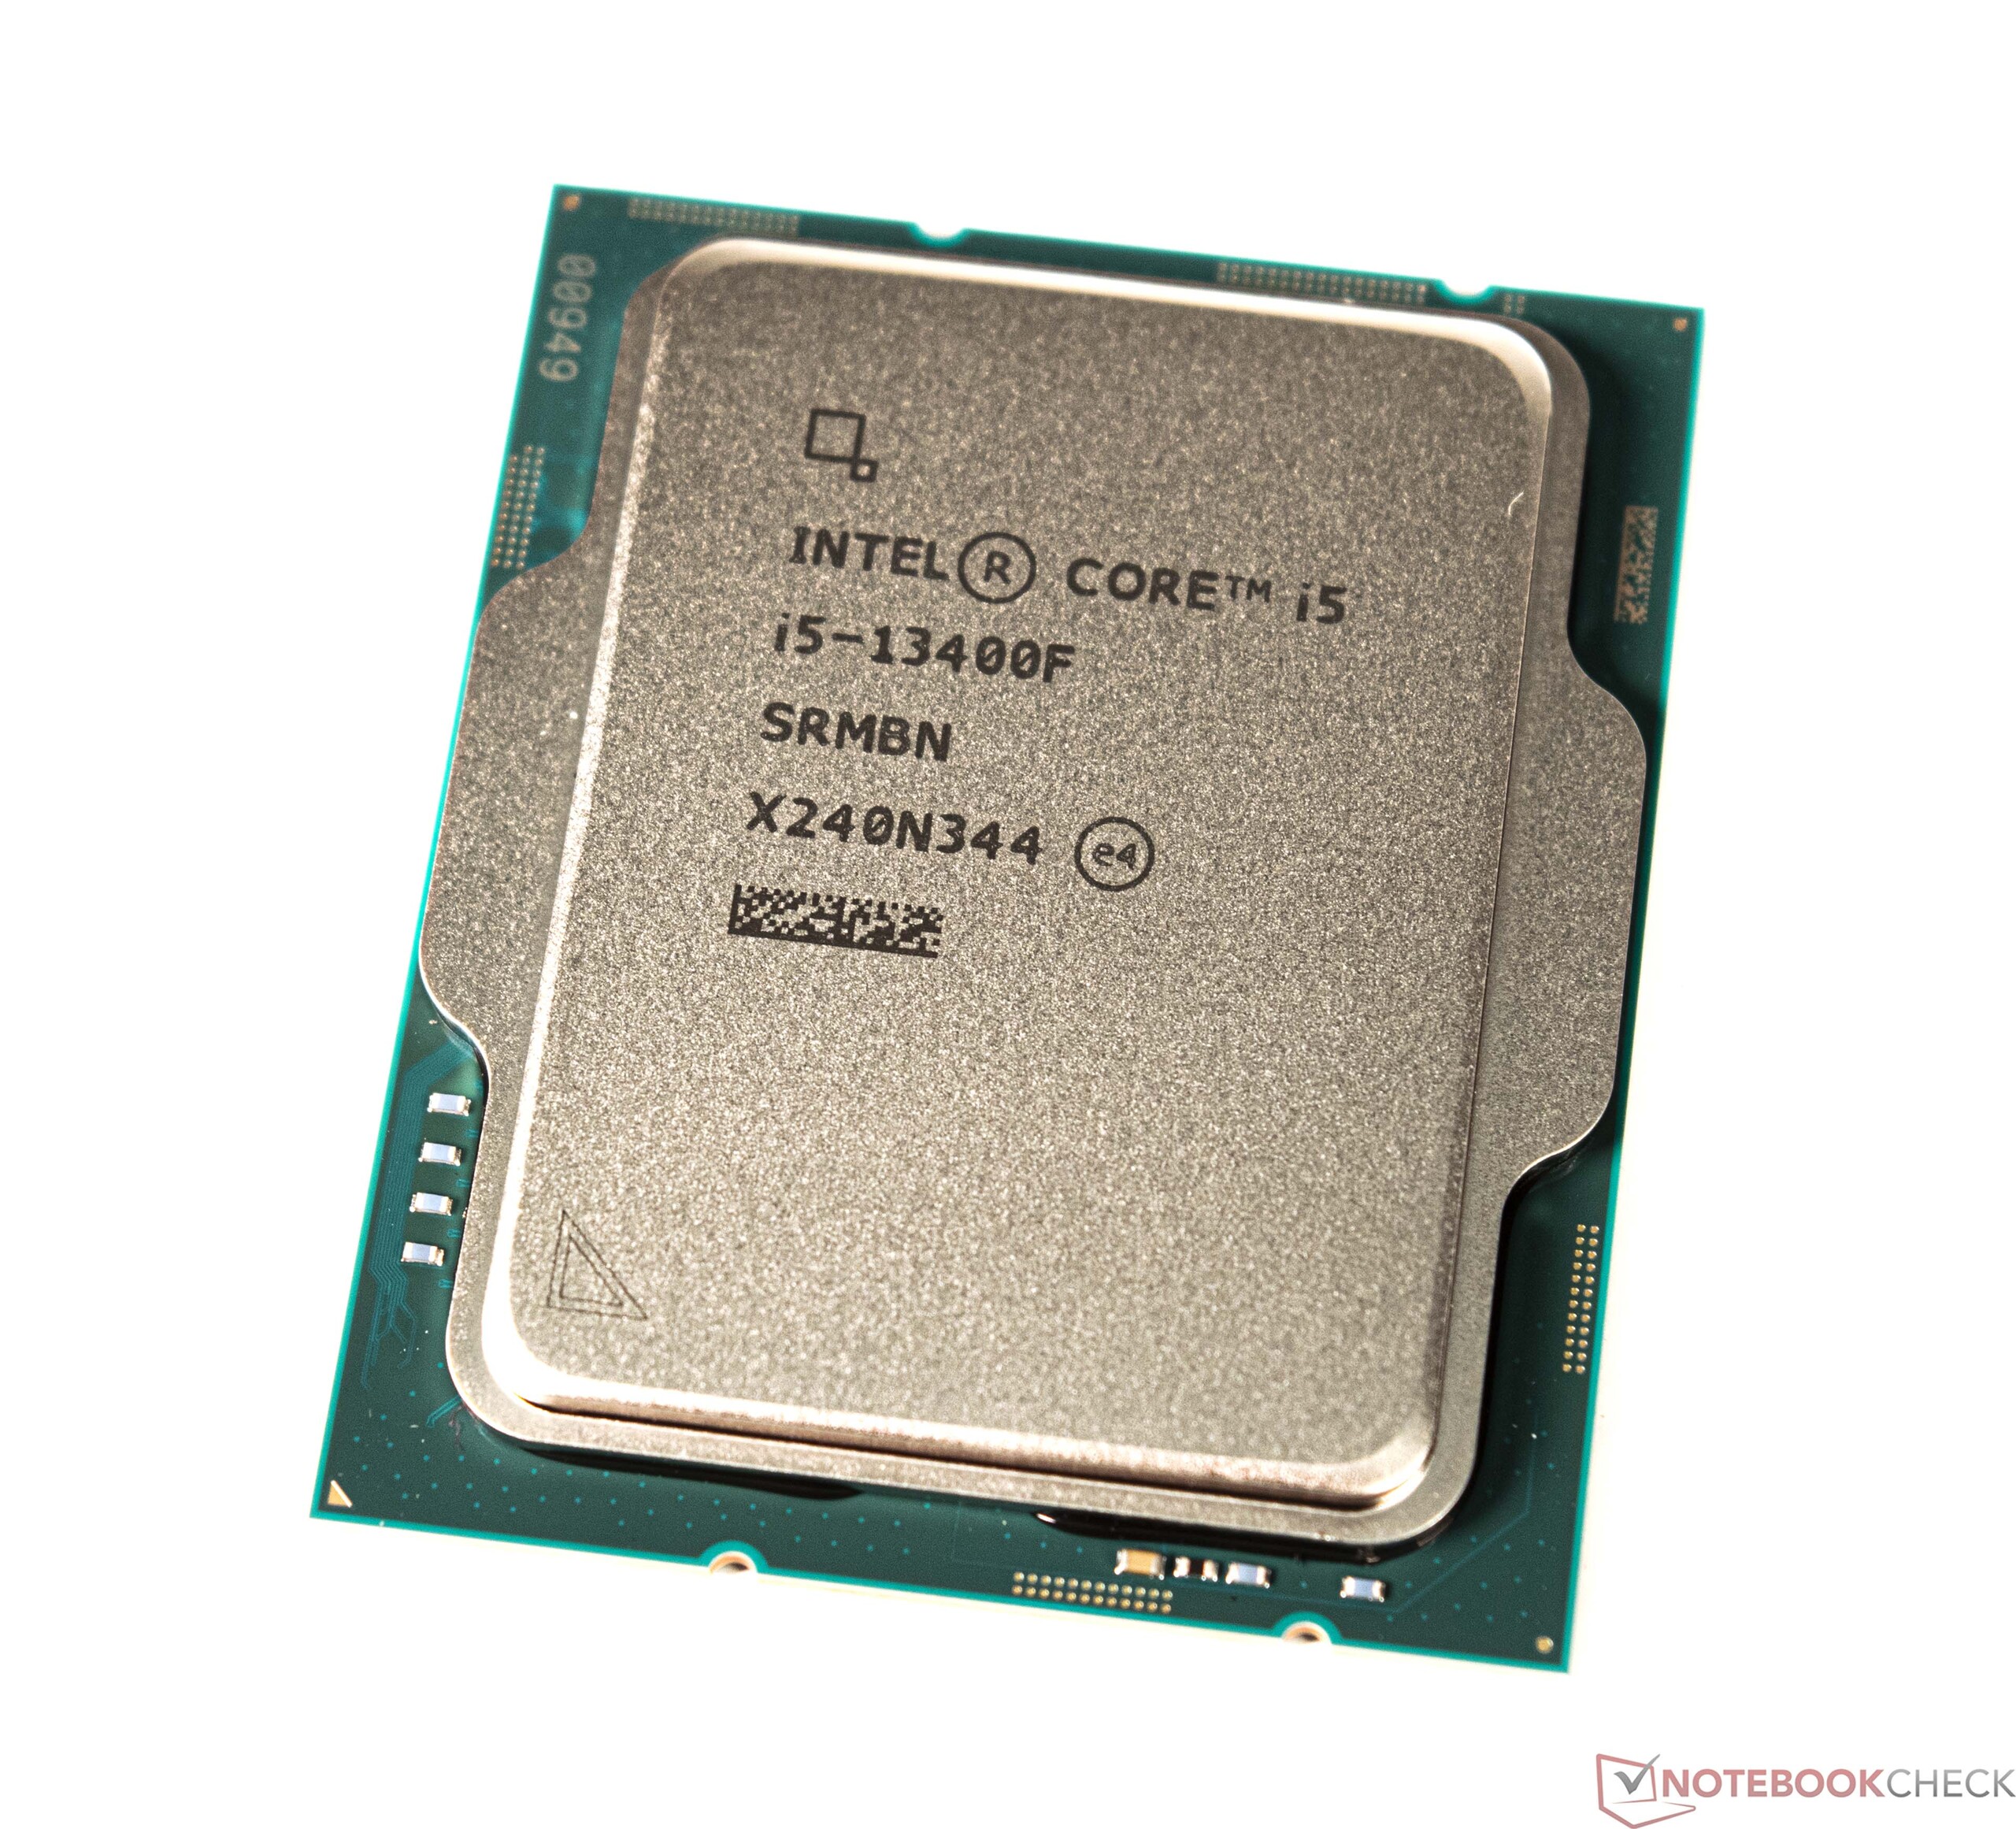
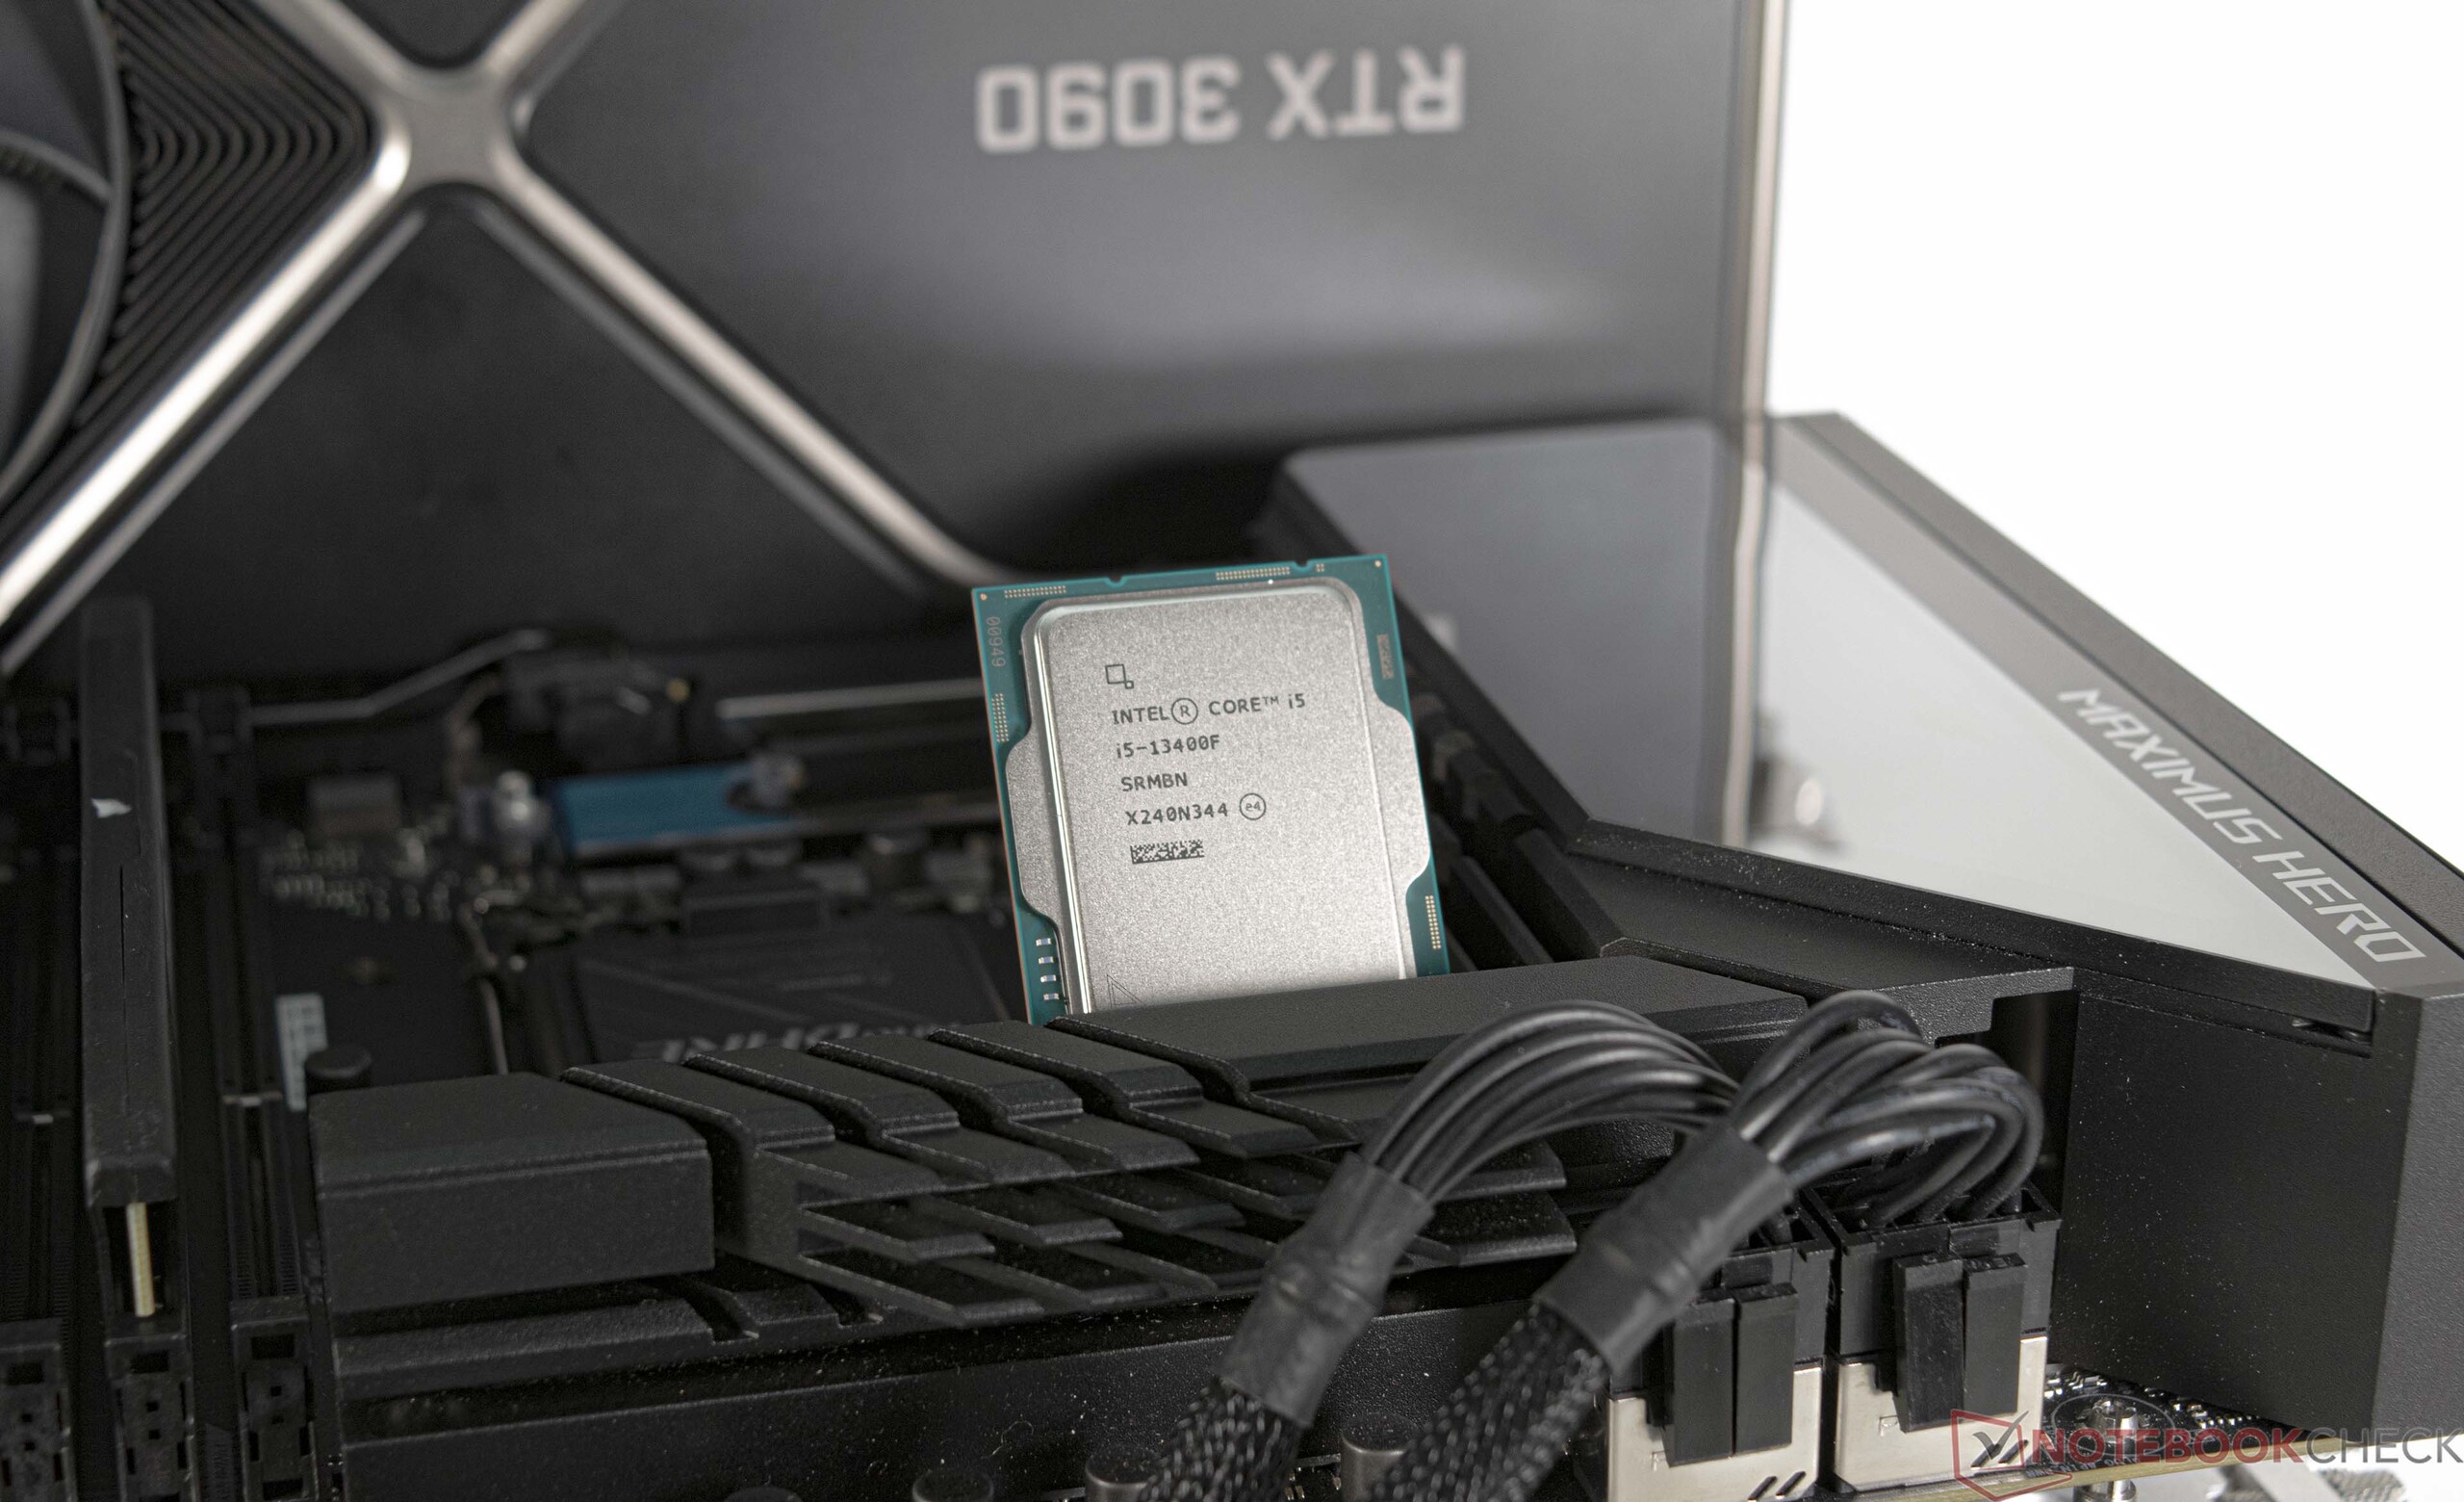
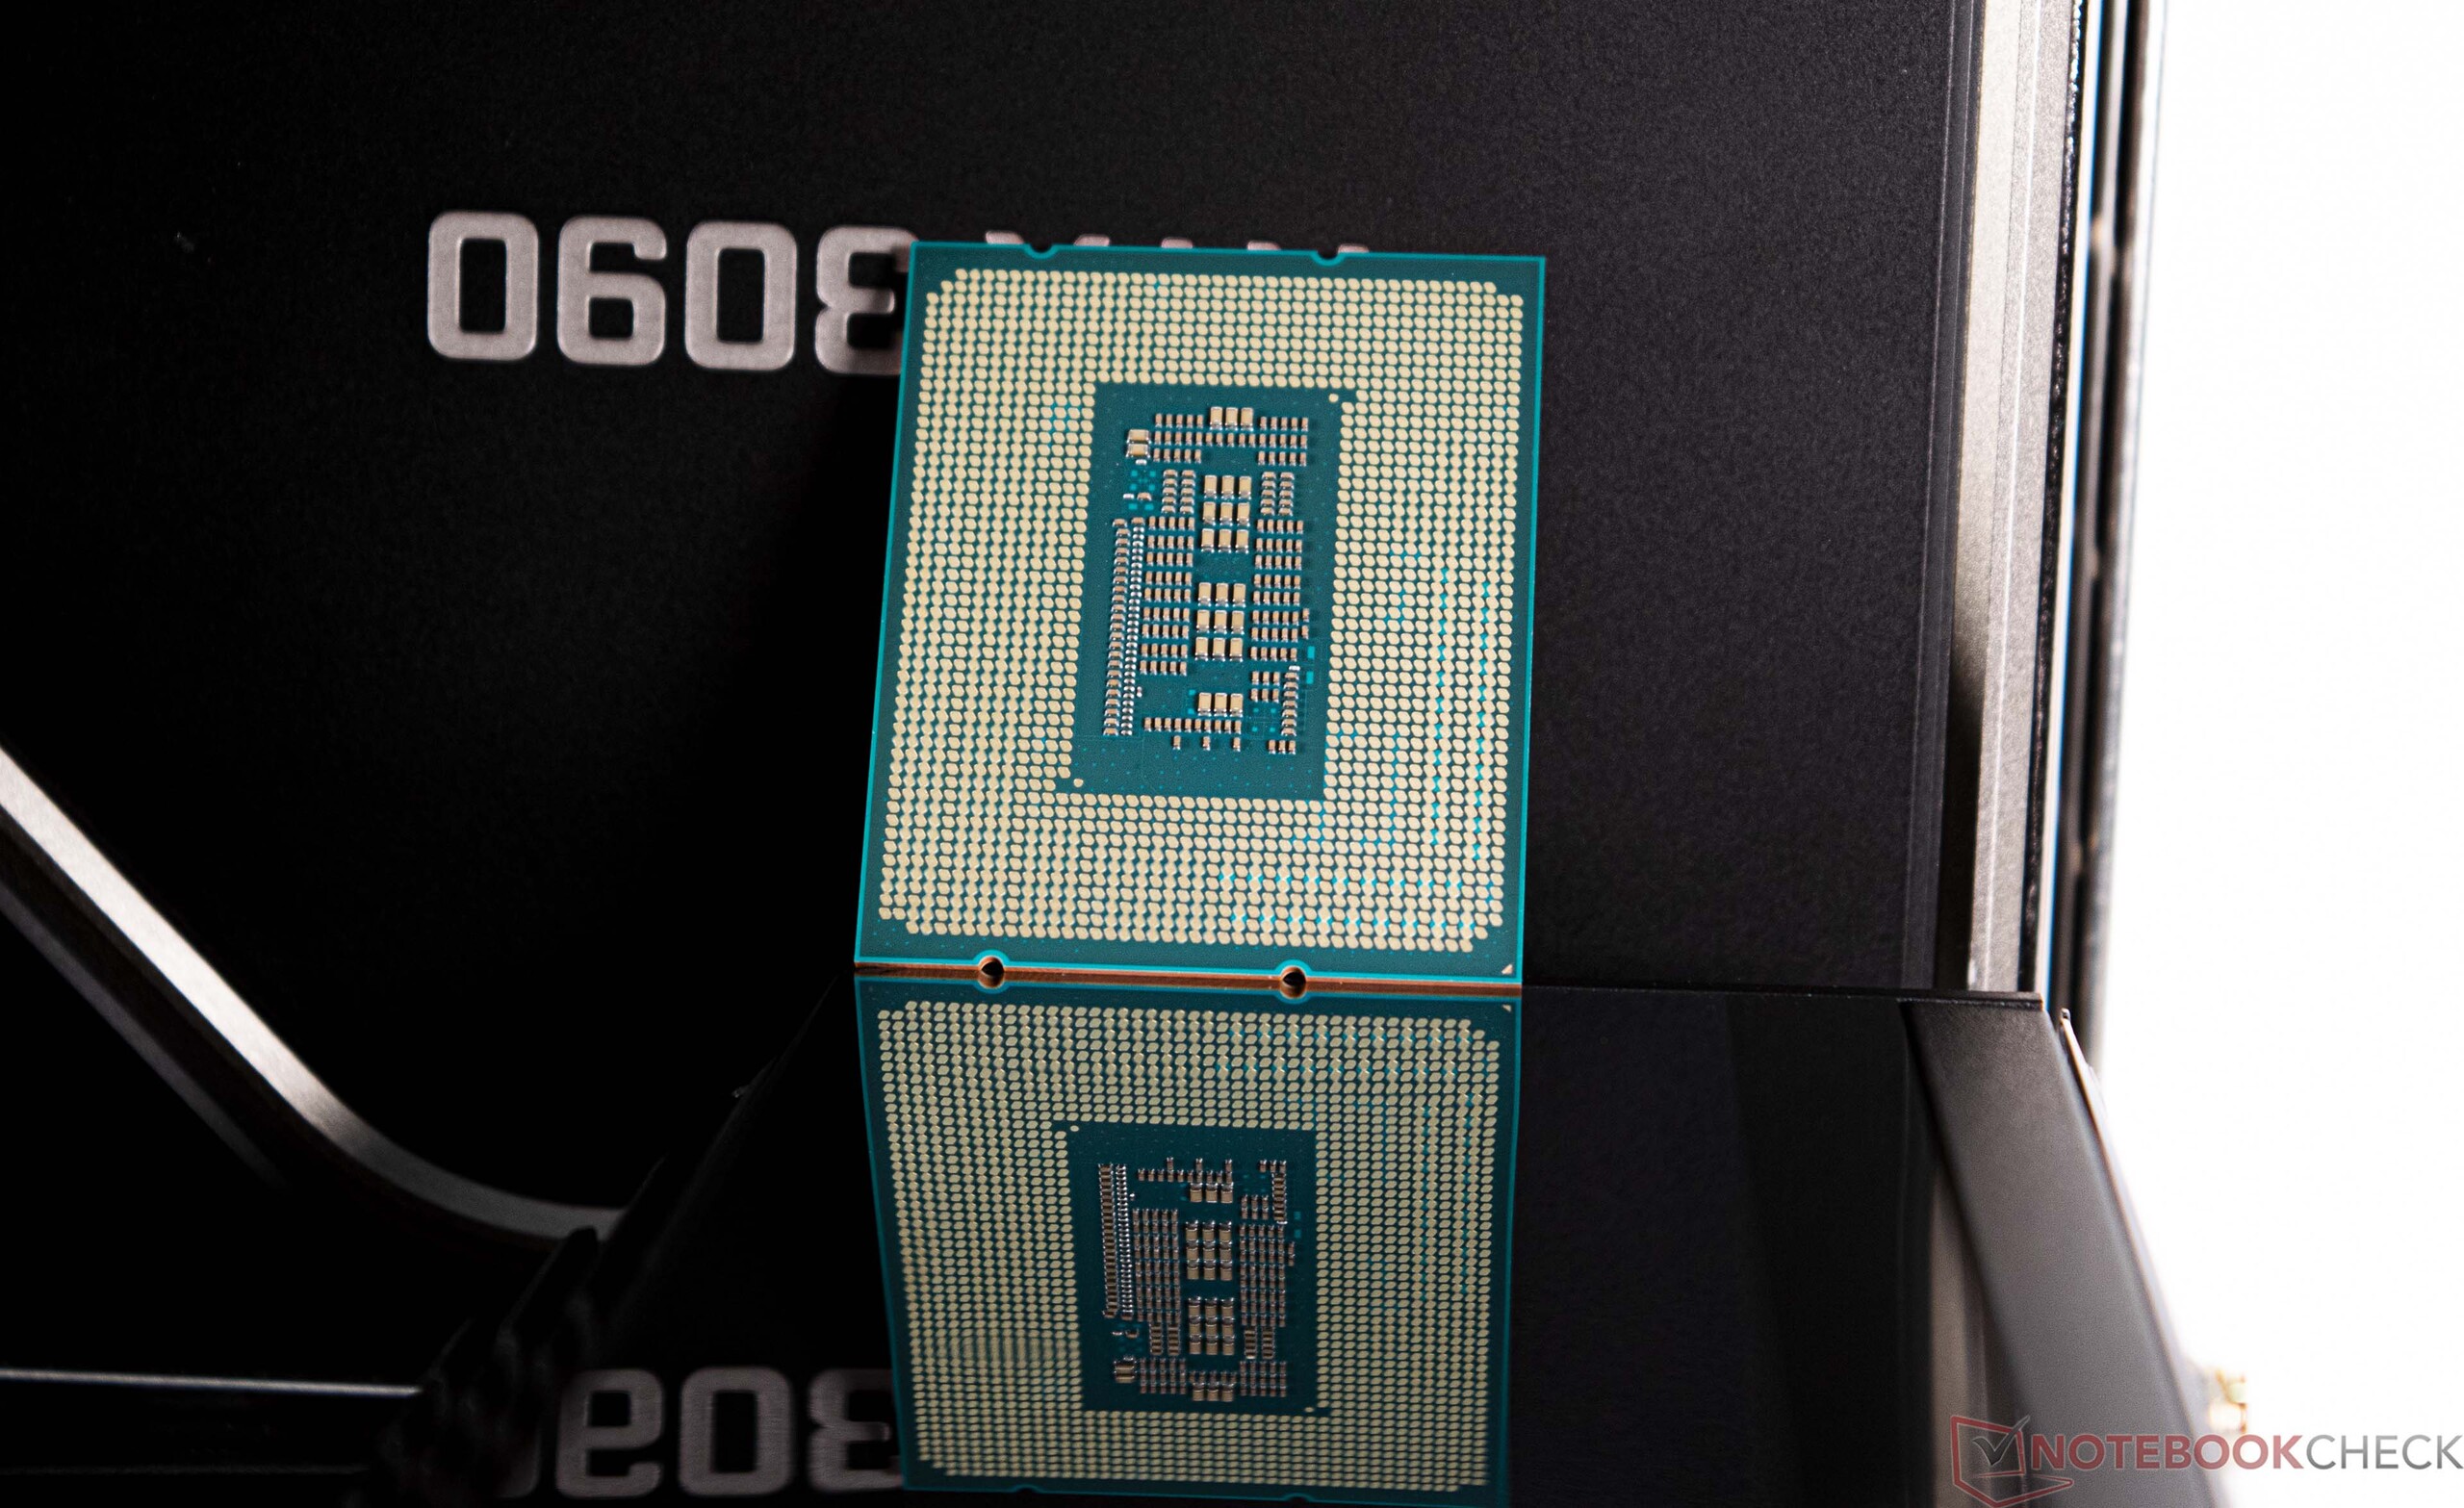
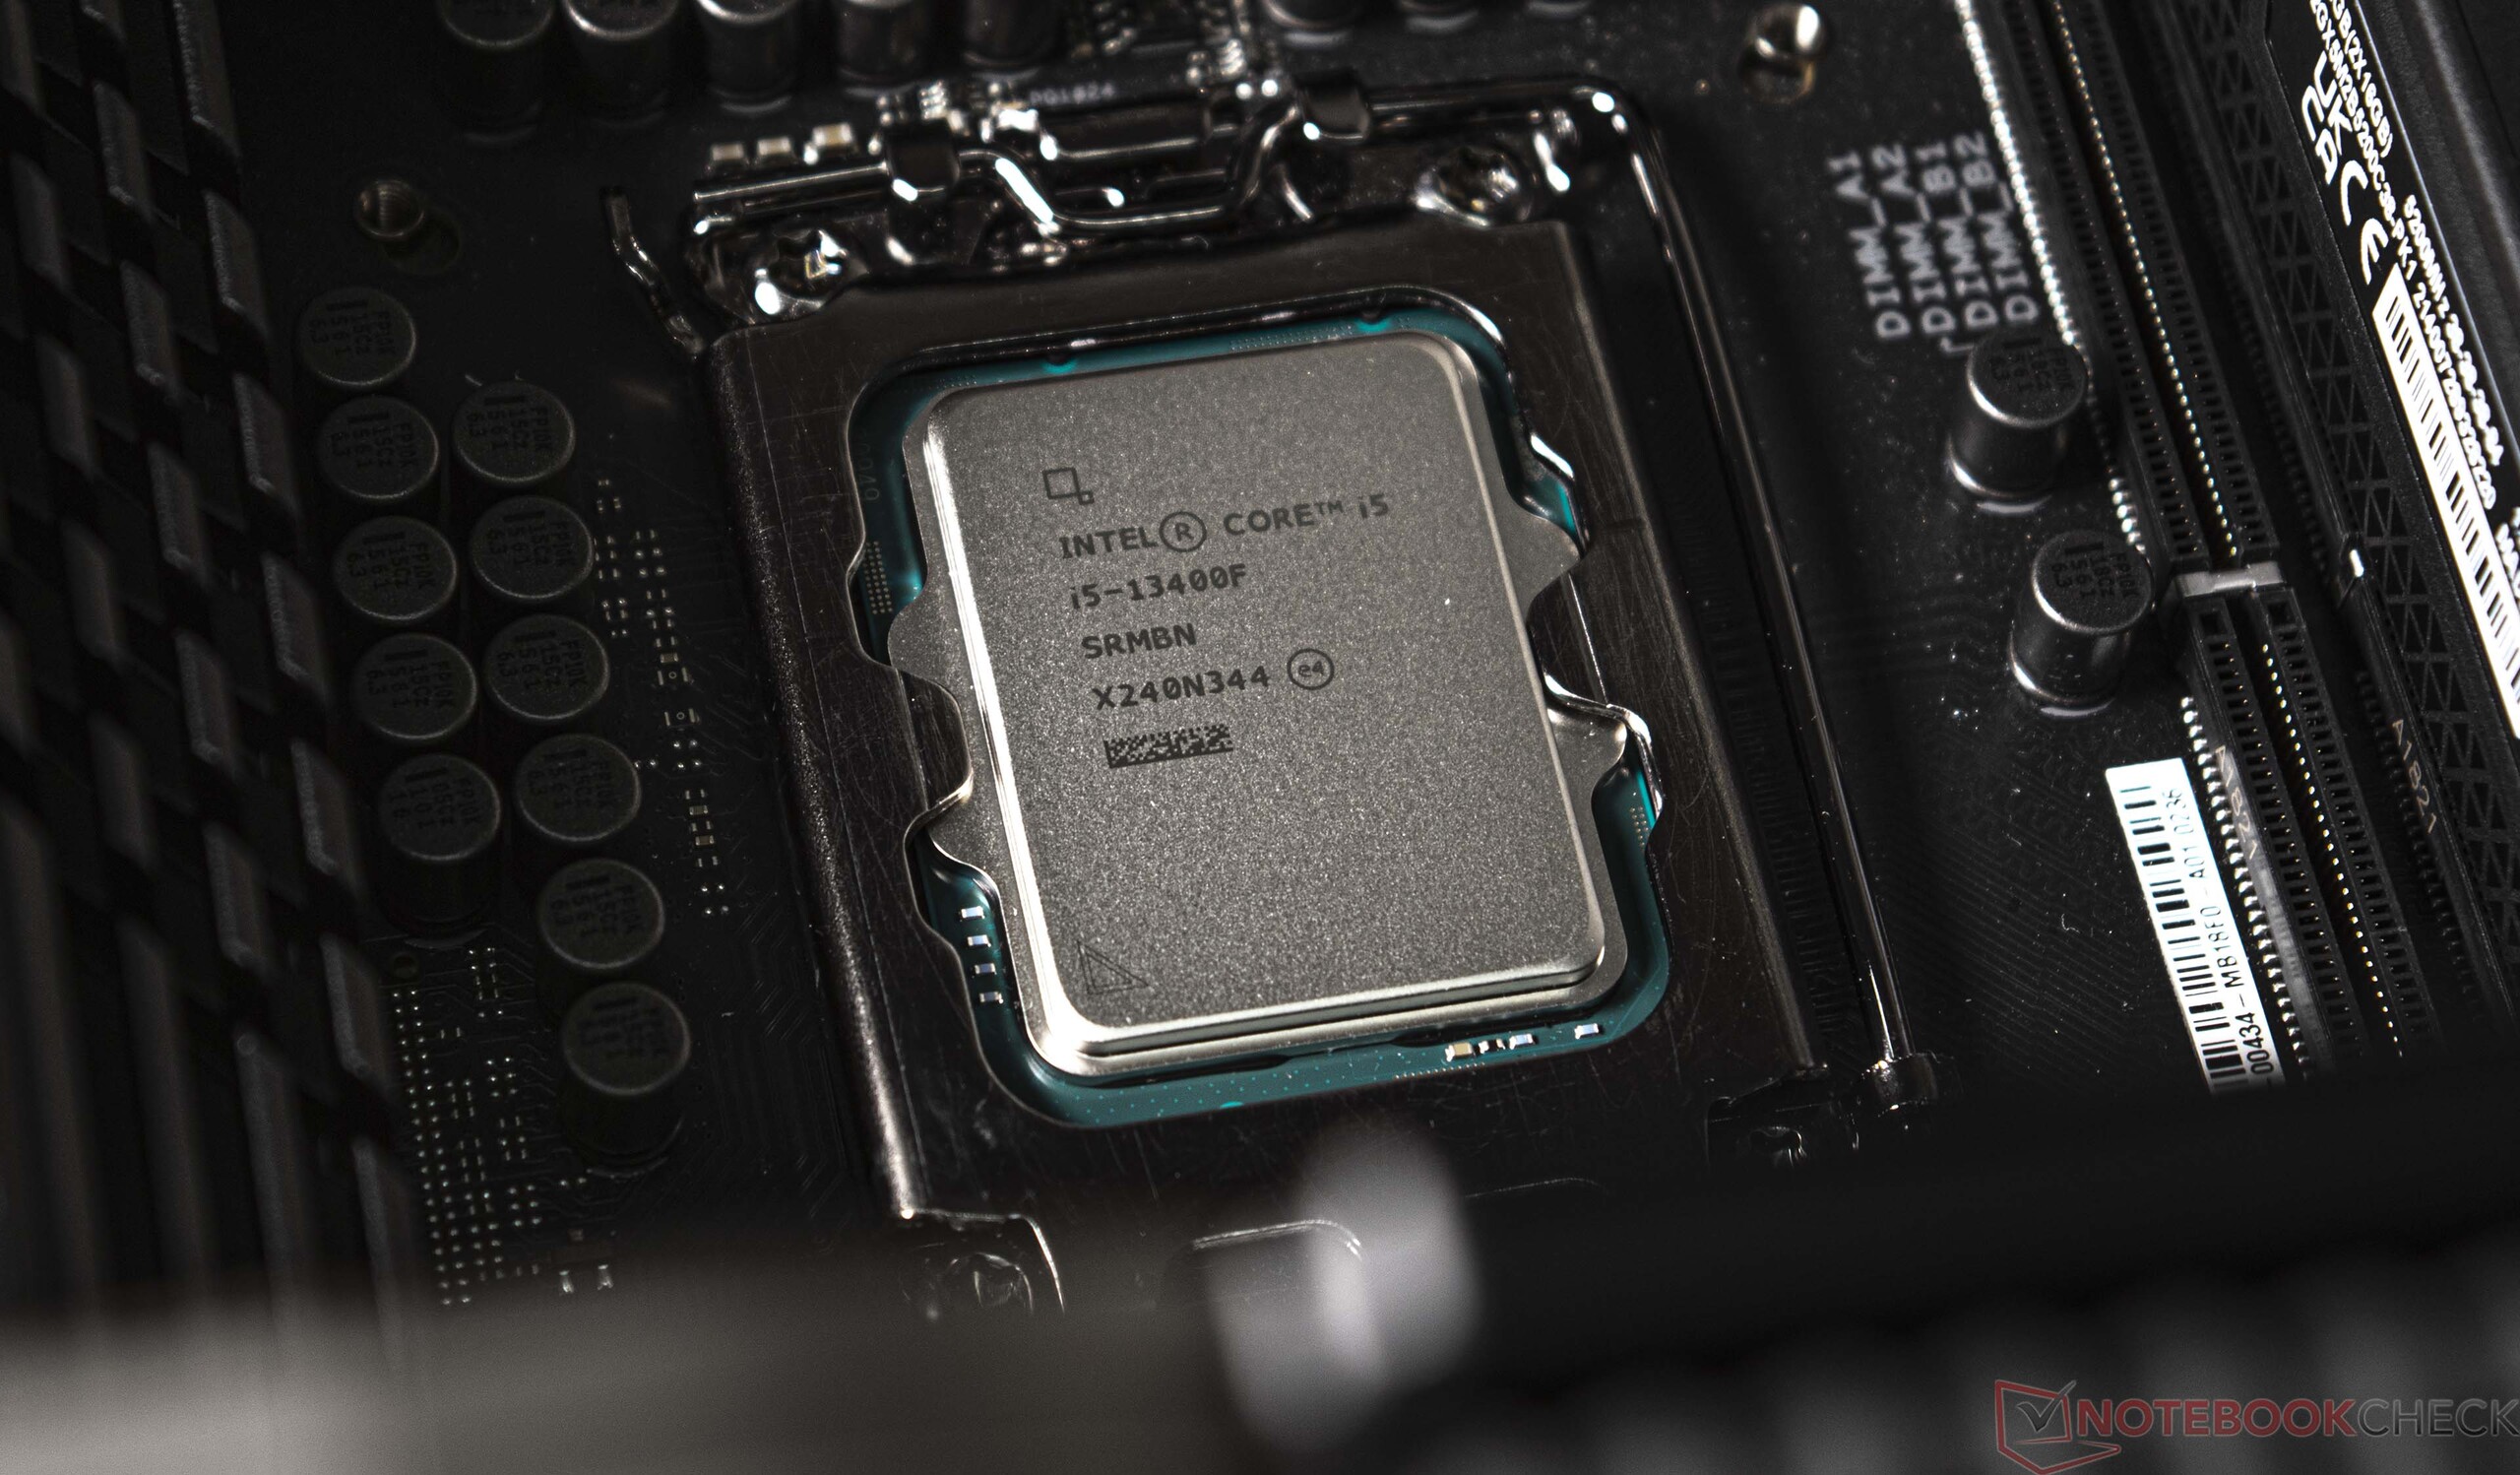
Intel Alder-Lake e Intel Raptor-Lake condividono entrambi il socket 1700 come sottostruttura. Pertanto, tutti i nuovi processori possono essere eseguiti anche sui vecchi chipset 600. Tuttavia, è necessario eseguire prima un aggiornamento del BIOS in modo che i processori più recenti vengano riconosciuti e supportati correttamente. A proposito di Alder-Lake e Raptor-Lake: L'Intel Core i5-13400F può essere disponibile opzionalmente con stepping B0 o C0. Lo stepping B0 si riferisce a un DIE Raptor-Lake, mentre un DIE Alder-Lake si trova sotto il dissipatore di calore nello stepping C0.
Nella tabella che segue, abbiamo raccolto per voi i principali rappresentanti della nuova famiglia Raptor Lake S. Ulteriori dettagli su Intel Core i5-13400F sono disponibili qui.
Processori Core di Intel a confronto
| Modello | Core / Threads |
Clock P-Core / Turbo | Clock E-Core / Turbo | Cache L2 + L3 | Grafica | PBP | MTB | Prezzo (MSRP) |
| Core i9-13900K | 24 (8P + 16E) /32 | 3,0 GHz / 5,8 GHz | 2,2 GHz / 4,3 GHz | 32 + 36 MB | UHD 770 | 125 Watt | 253 Watt | $ 589 |
| Core i9-13900KF | 16 (8P + 16E) /32 | 3,0 GHz / 5,8 GHz | 2,2 GHz / 4,3 GHz | 32 + 36 MB | - | 125 Watt | 253 Watt | $ 564 |
| Core i9-12900K | 16 (8P + 8E) /24 | 3,2 GHz / 5,1 GHz | 2,4 GHz / 3,9 GHz | 14 + 30 MB | UHD 770 | 125 Watt | 241 Watt | $ 589 |
| Core i9-12900KF | 16 (8P + 8E) /24 | 3,2 GHz / 5,1 GHz | 2,4 GHz / 3,9 GHz | 14 + 30 MB | - | 125 Watt | 241 Watt | $ 564 |
| Core i7-13700K | 16 (8P + 8E) /24 | 3,4 GHz / 5,4 GHz | 2,5 GHz / 4,2 GHz | 24 + 30 MB | UHD 770 | 125 Watt | 253 Watt | $ 409 |
| Core i7-13700KF | 16 (8P + 8E) /24 | 3,4 GHz / 5,4 GHz | 2,5 GHz / 4,2 GHz | 24 + 30 MB | - | 125 Watt | 253 Watt | $ 384 |
| Core i7-12700K | 12 (8P + 4E) /20 | 3,6 GHz / 4,9 GHz | 2,7 GHz / 3,8 GHz | 12 + 25 MB | UHD 770 | 125 Watt | 190 Watt | $ 409 |
| Core i7-12700KF | 12 (8P + 4E) /20 | 3,6 GHz / 4,9 GHz | 2,7 GHz / 3,8 GHz | 12 + 25 MB | - | 125 Watt | 190 Watt | $ 384 |
| Core i5-13600K | 14 (6P + 8E) /20 | 3,5 GHz / 5,1 GHz | 2,6 GHz / 3,9 GHz | 20 + 24 MB | UHD 770 | 125 Watt | 181 Watt | $ 319 |
| Core i5-13600KF | 14 (6P + 8E) /20 | 3,5 GHz / 5,1 GHz | 2,6 GHz / 3,9 GHz | 20 + 24 MB | - | 125 Wat | 181 Watt | $ 294 |
| Core i5-12600K | 10 (6P + 4E) /16 | 3,7 GHz / 4,9 GHz | 2,8 GHz / 3,6 GHz | 9,5 + 20 MB | UHD 770 | 125 Watt | 150 Watt | $ 289 |
| Core i5-12600KF | 10 (6P + 4E) /16 | 3,7 GHz / 4,9 GHz | 2,8 GHz / 3,6 GHz | 9,5 + 20 MB | - | 125 Watt | 150 Watt | $ 264 |
| Core i5-13400F | 10 (6P + 4E) /16 | 2,5 GHz / 4,6 GHz | 1,8 GHz / 3,3 GHz | 9,5 + 20 MB | - | 65 Watt | 148Watt | $ 196 |
| Core i5-12400F | 6 (6P + 0E) /12 | 2,5 GHz / 4,4 GHz | - | 7,5 + 18 MB | - | 65 Watt | 117 Watt | $ 194 |
Dettagli sul nostro sistema di test
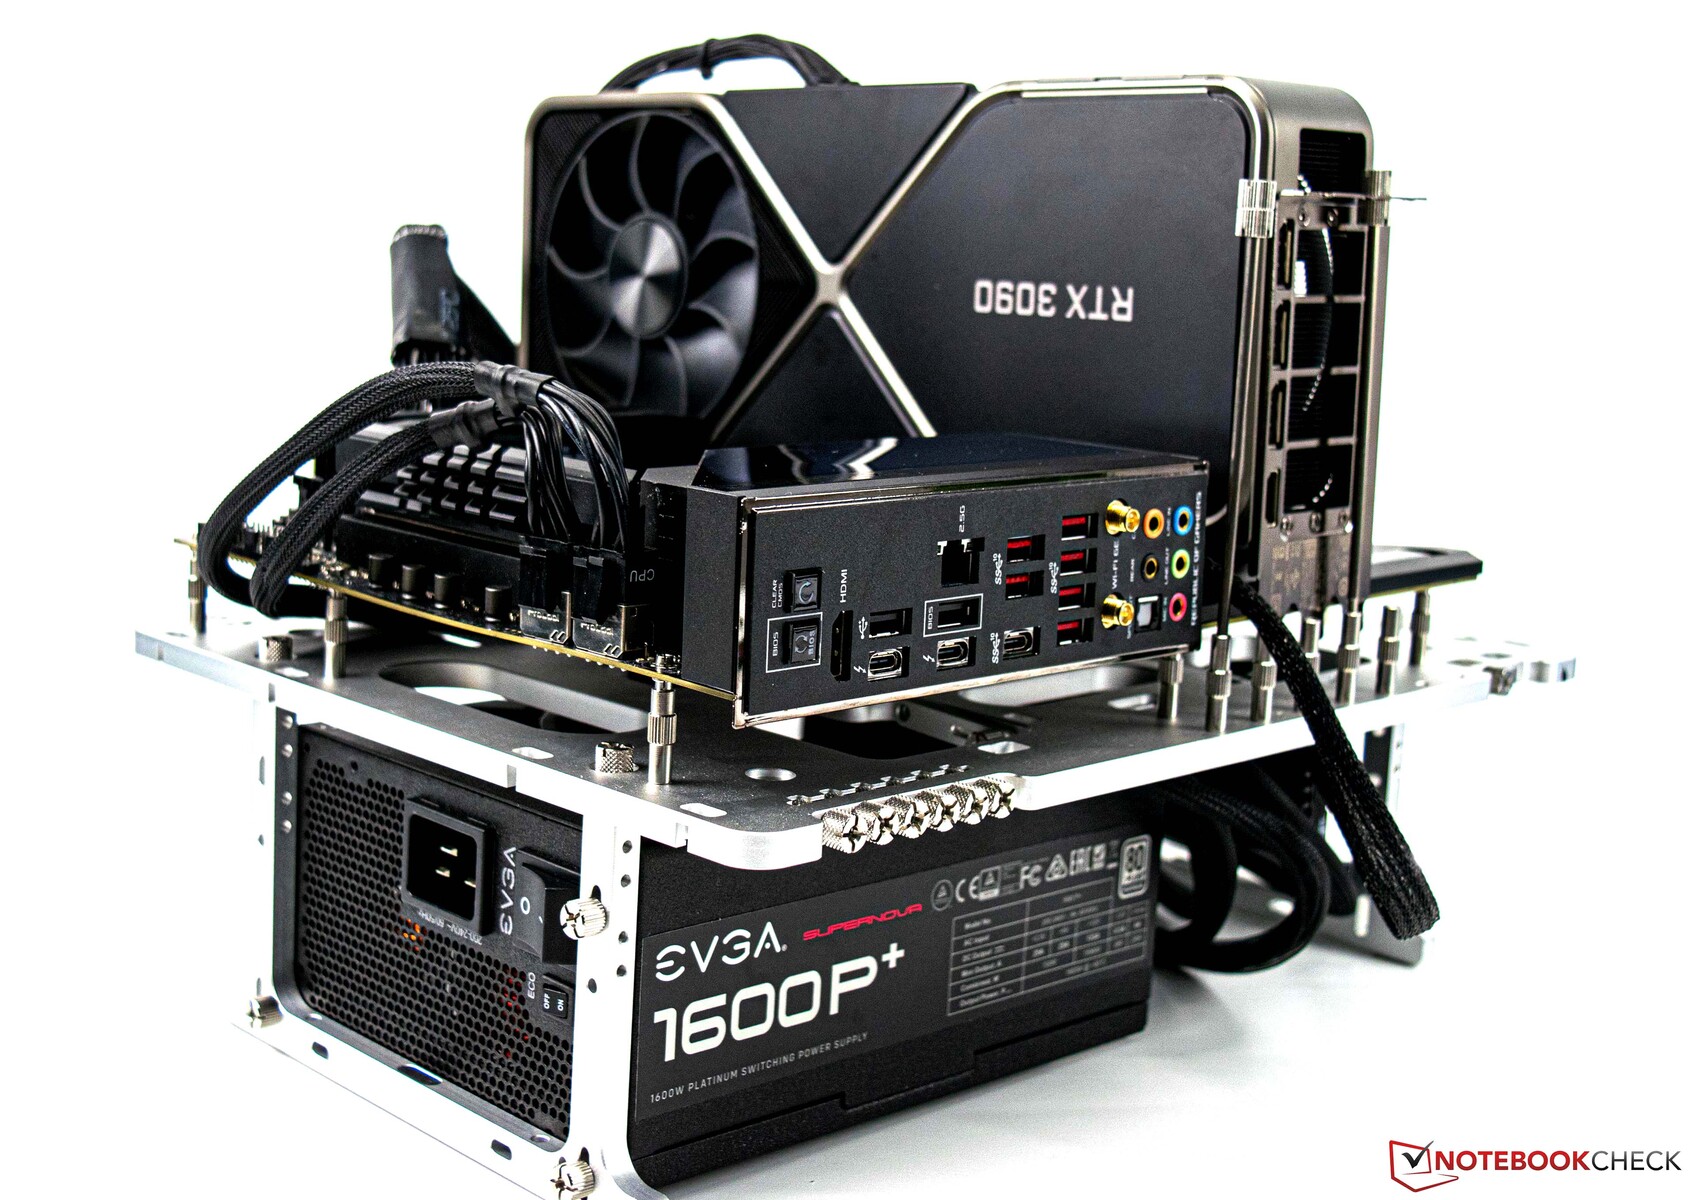
- Banco di prova aperto Streacom BC1 V2
- Intel Core i5-13400F
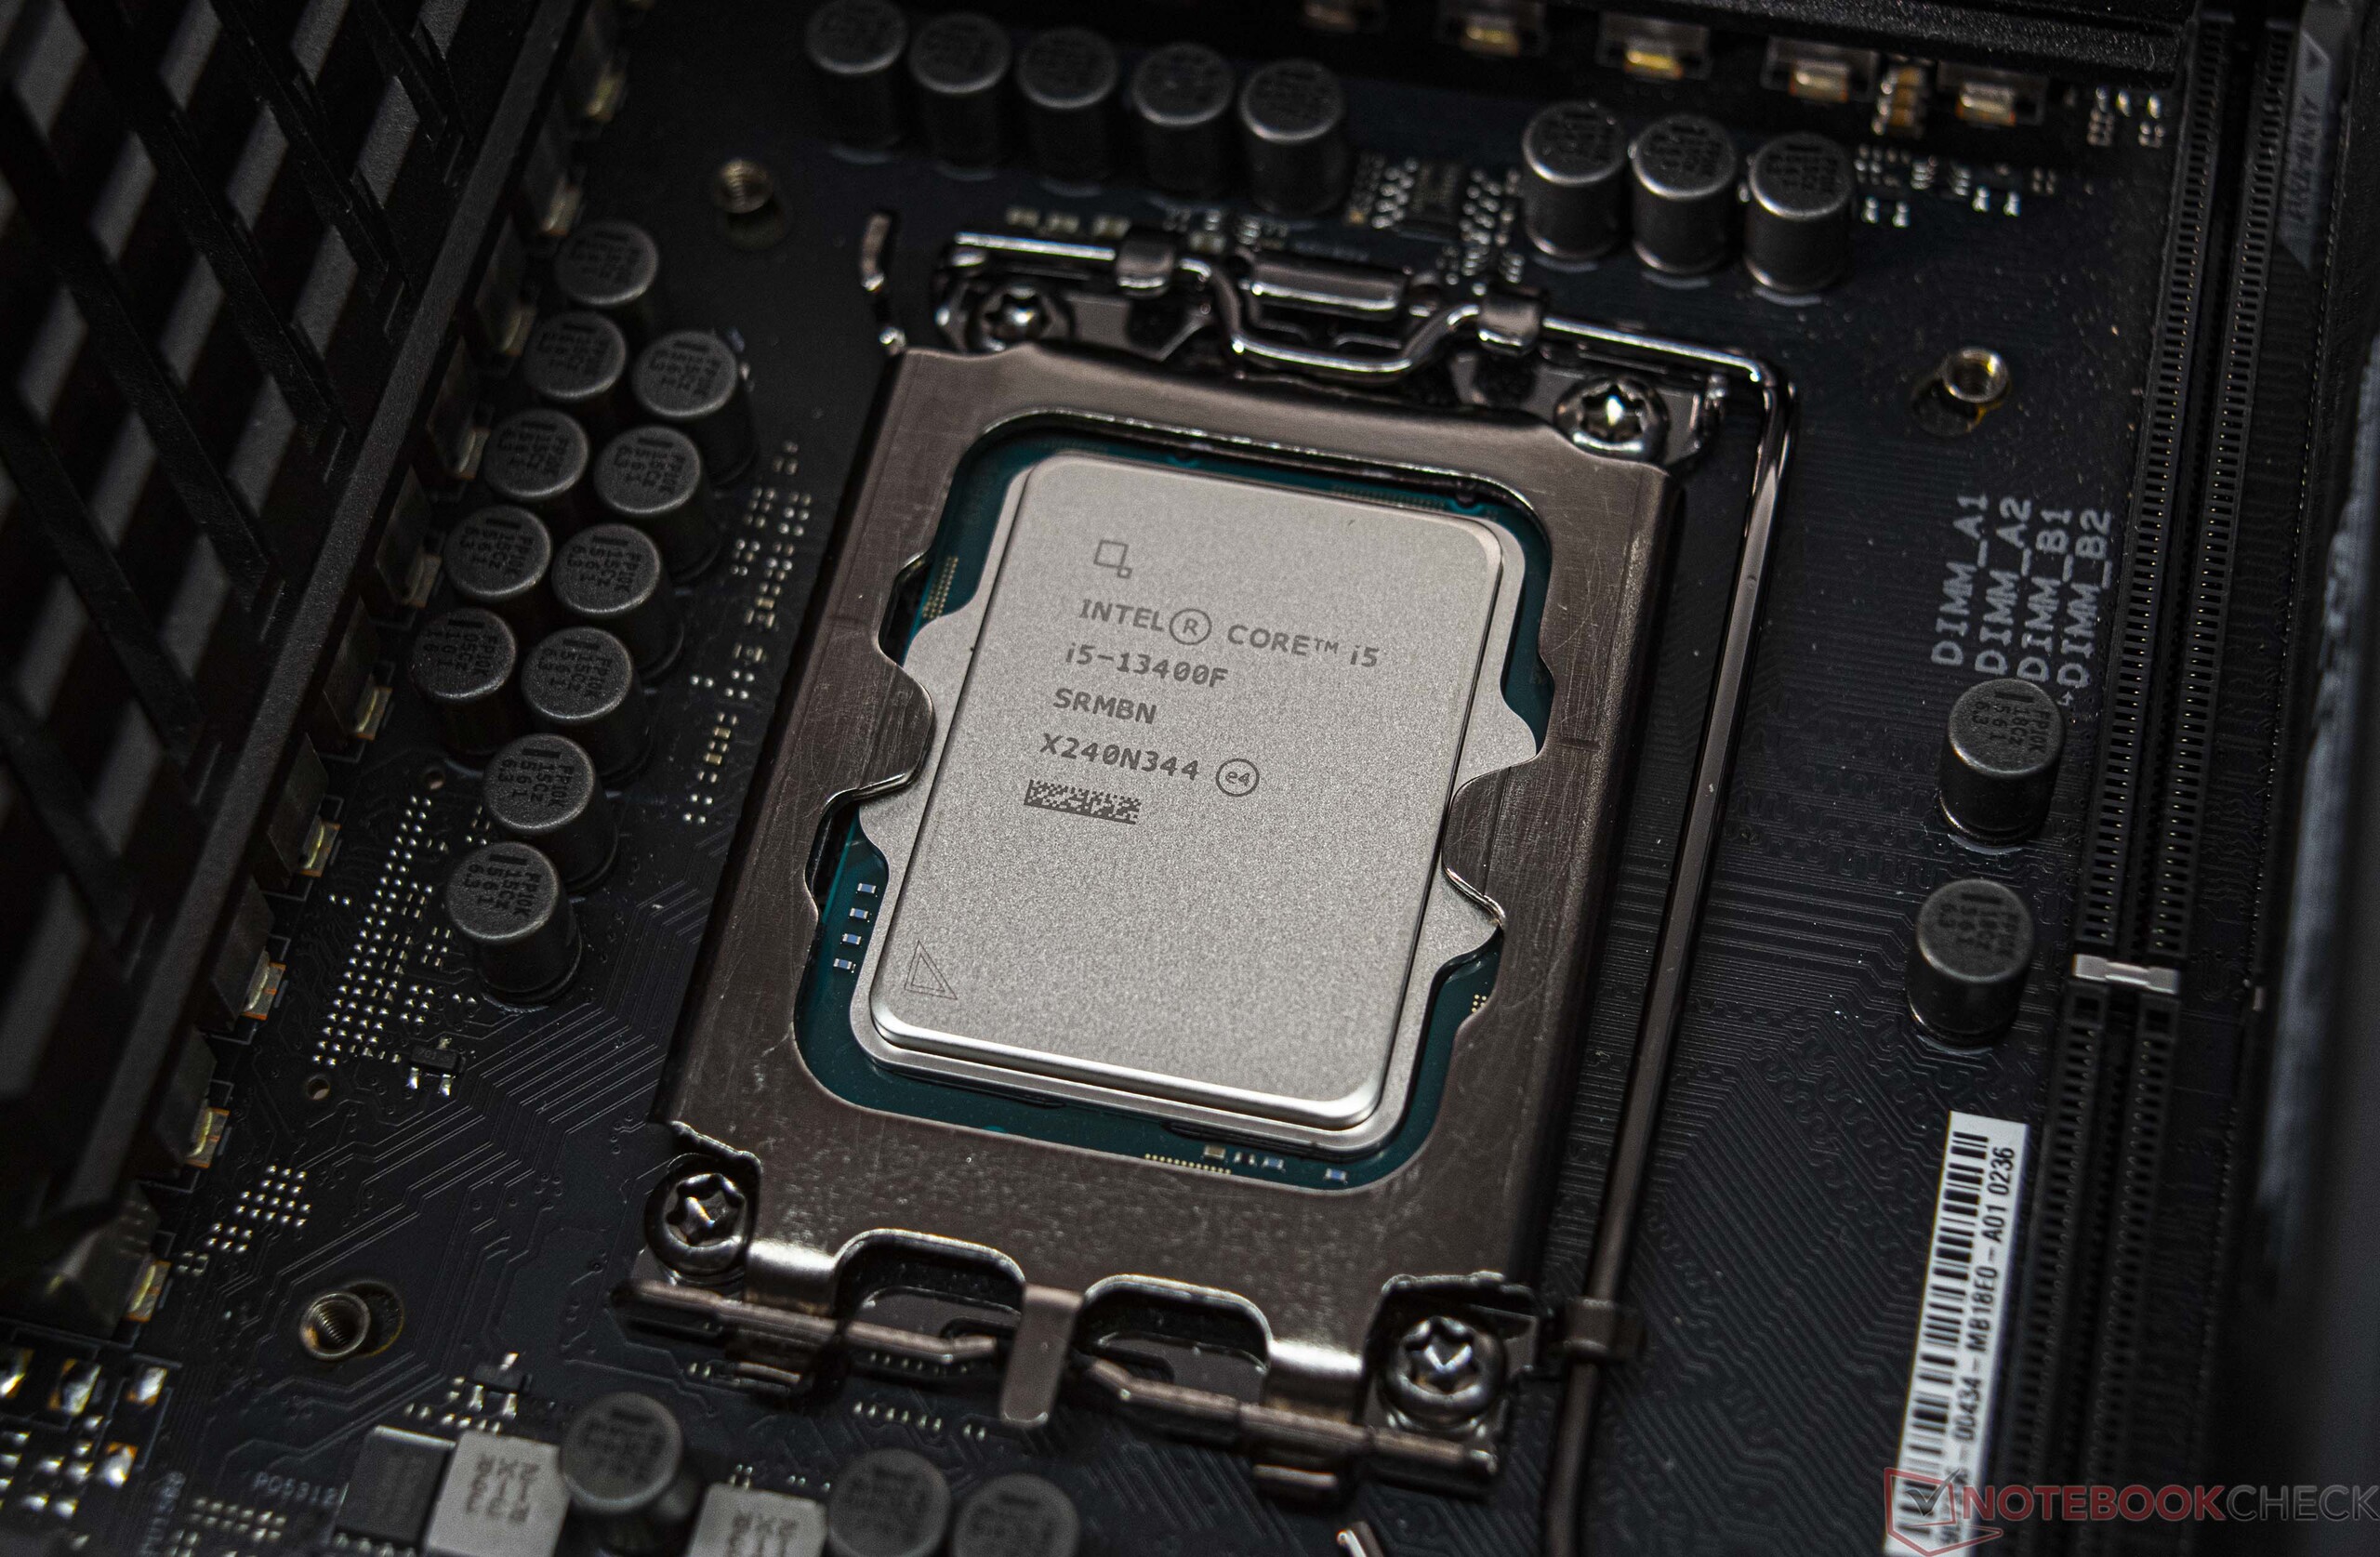
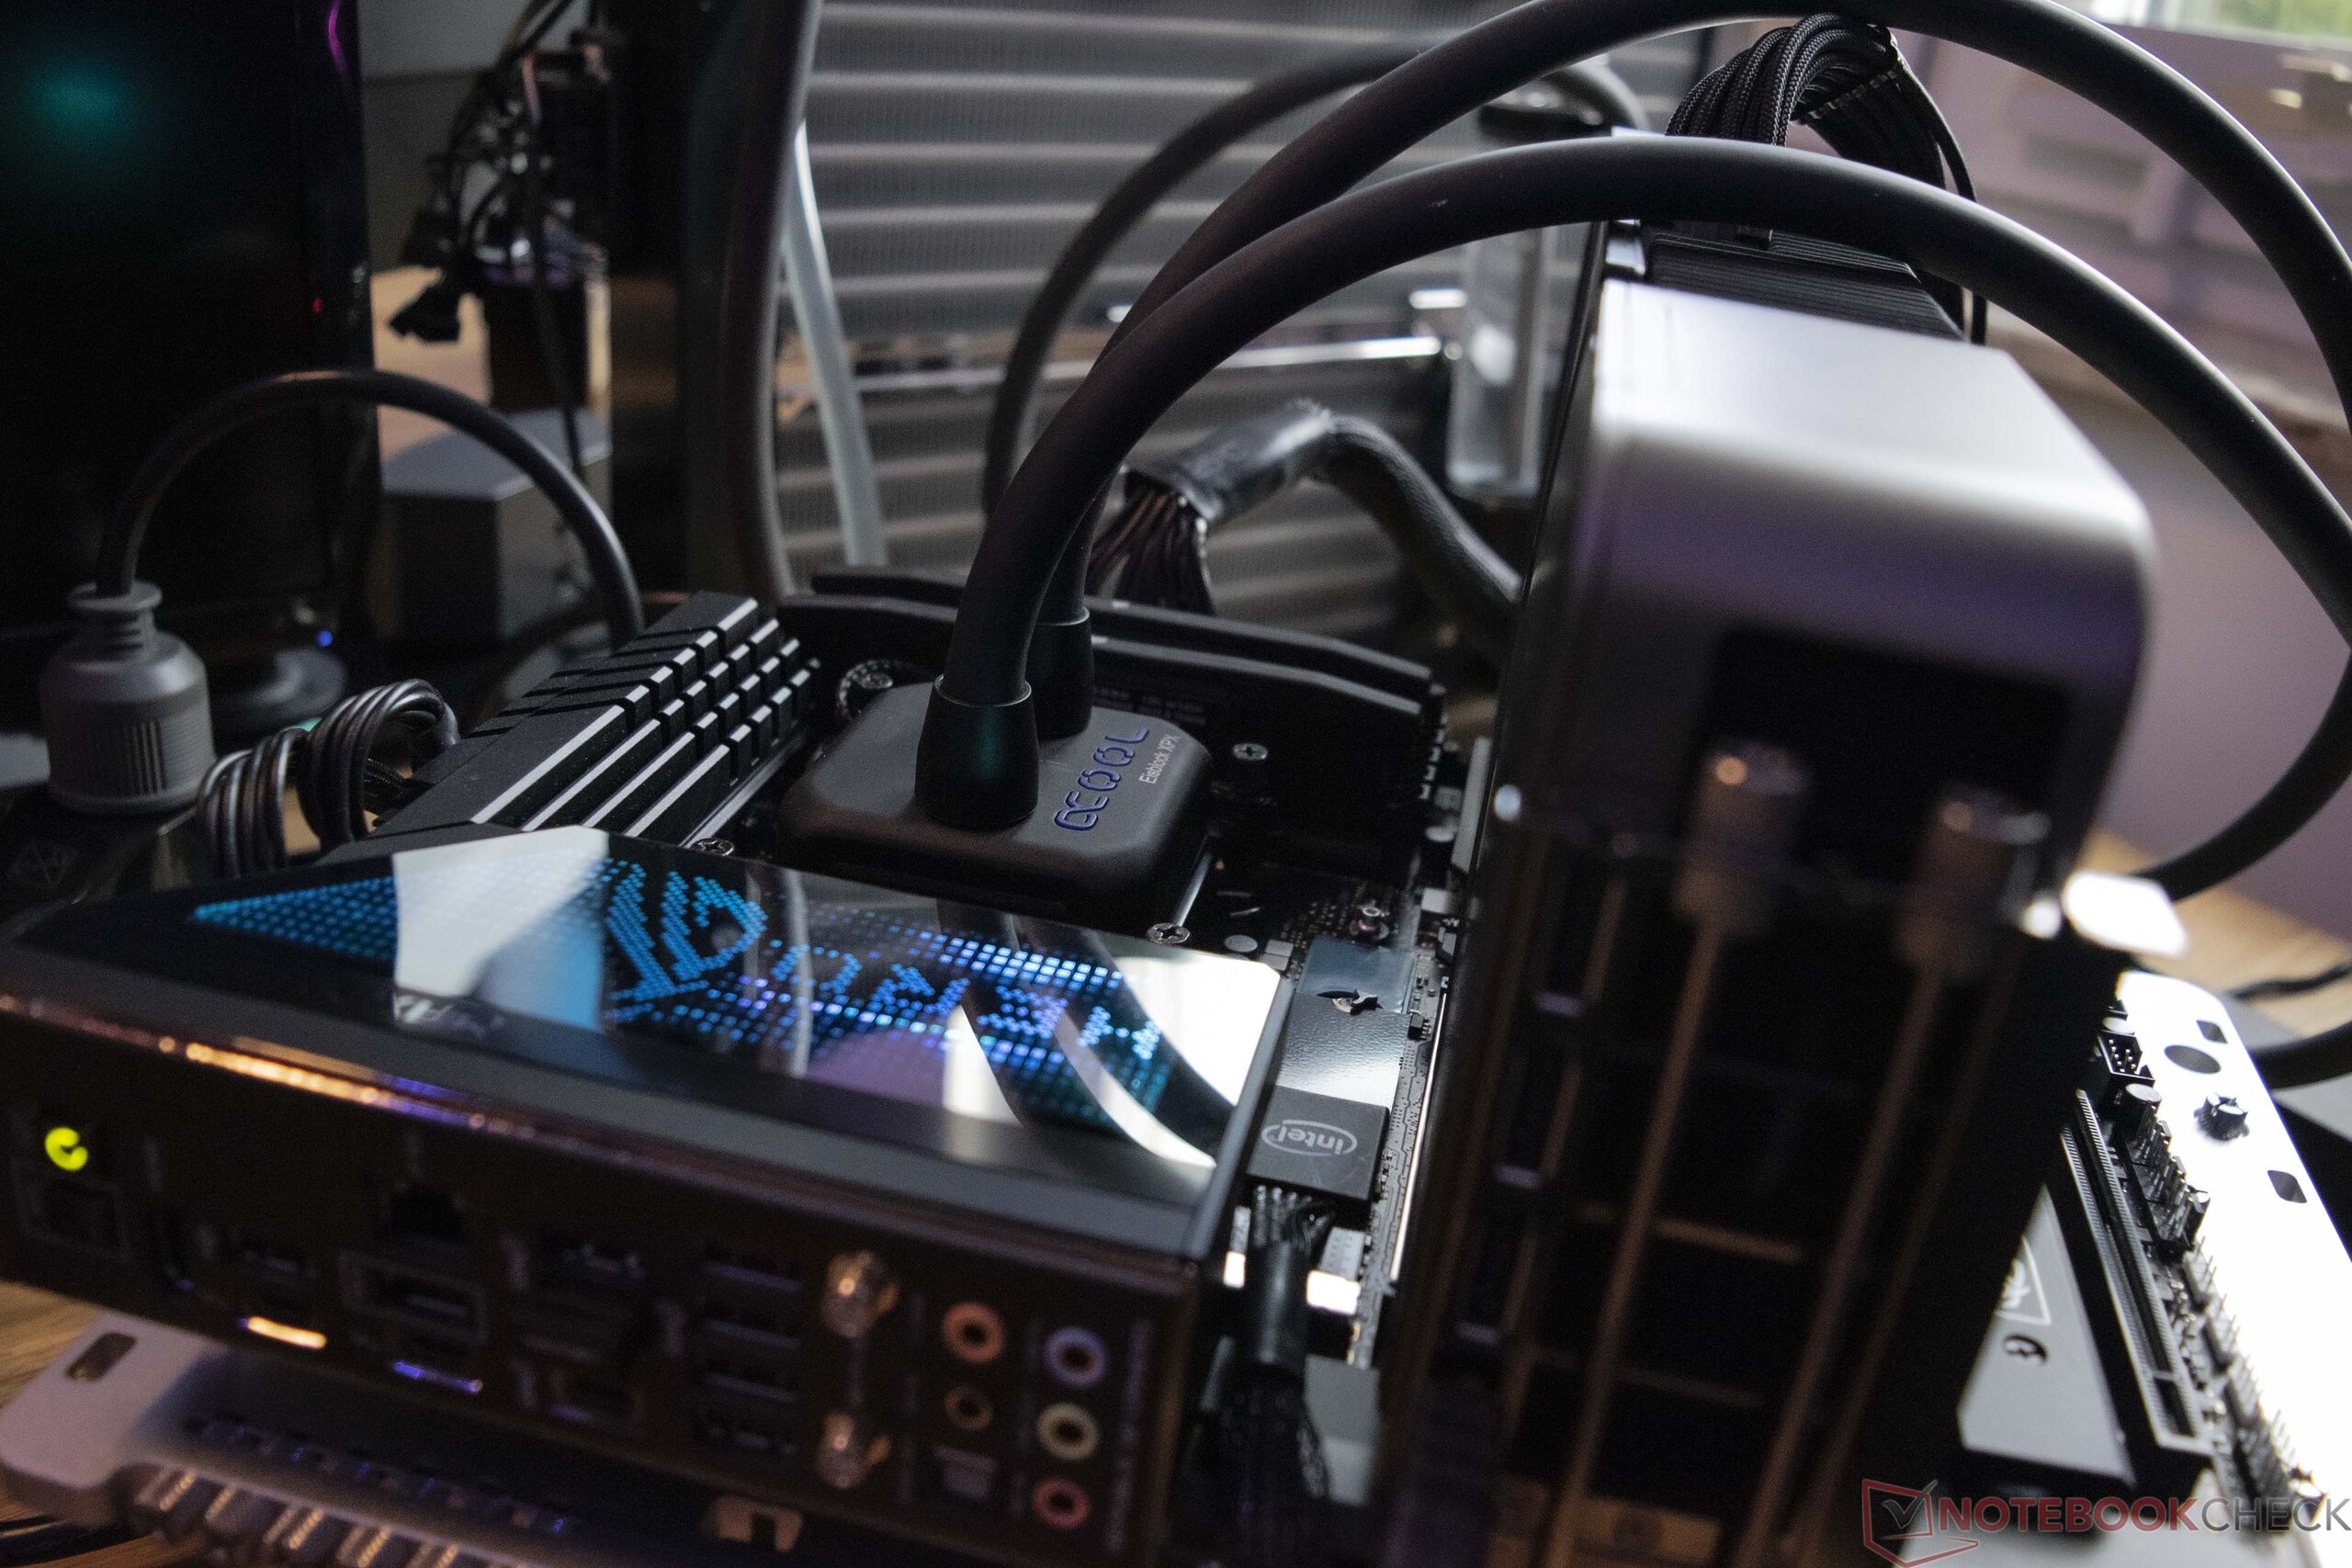
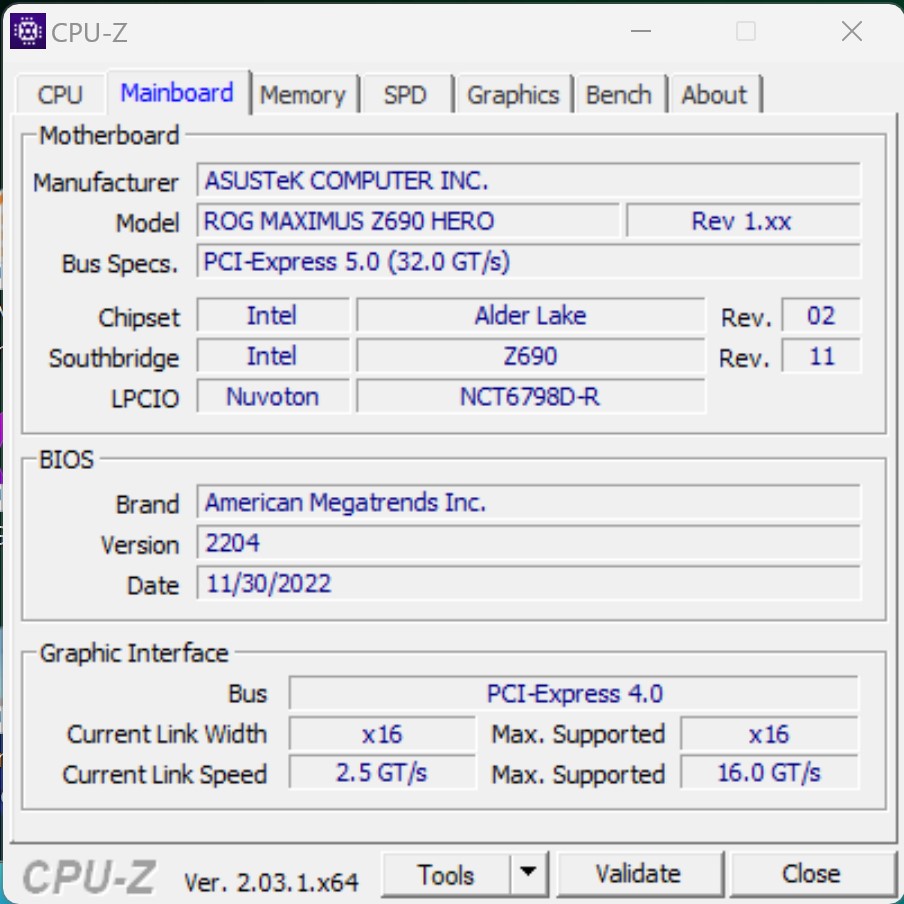
- Asus ROG Maximus Z690 Hero (BIOS v2204)
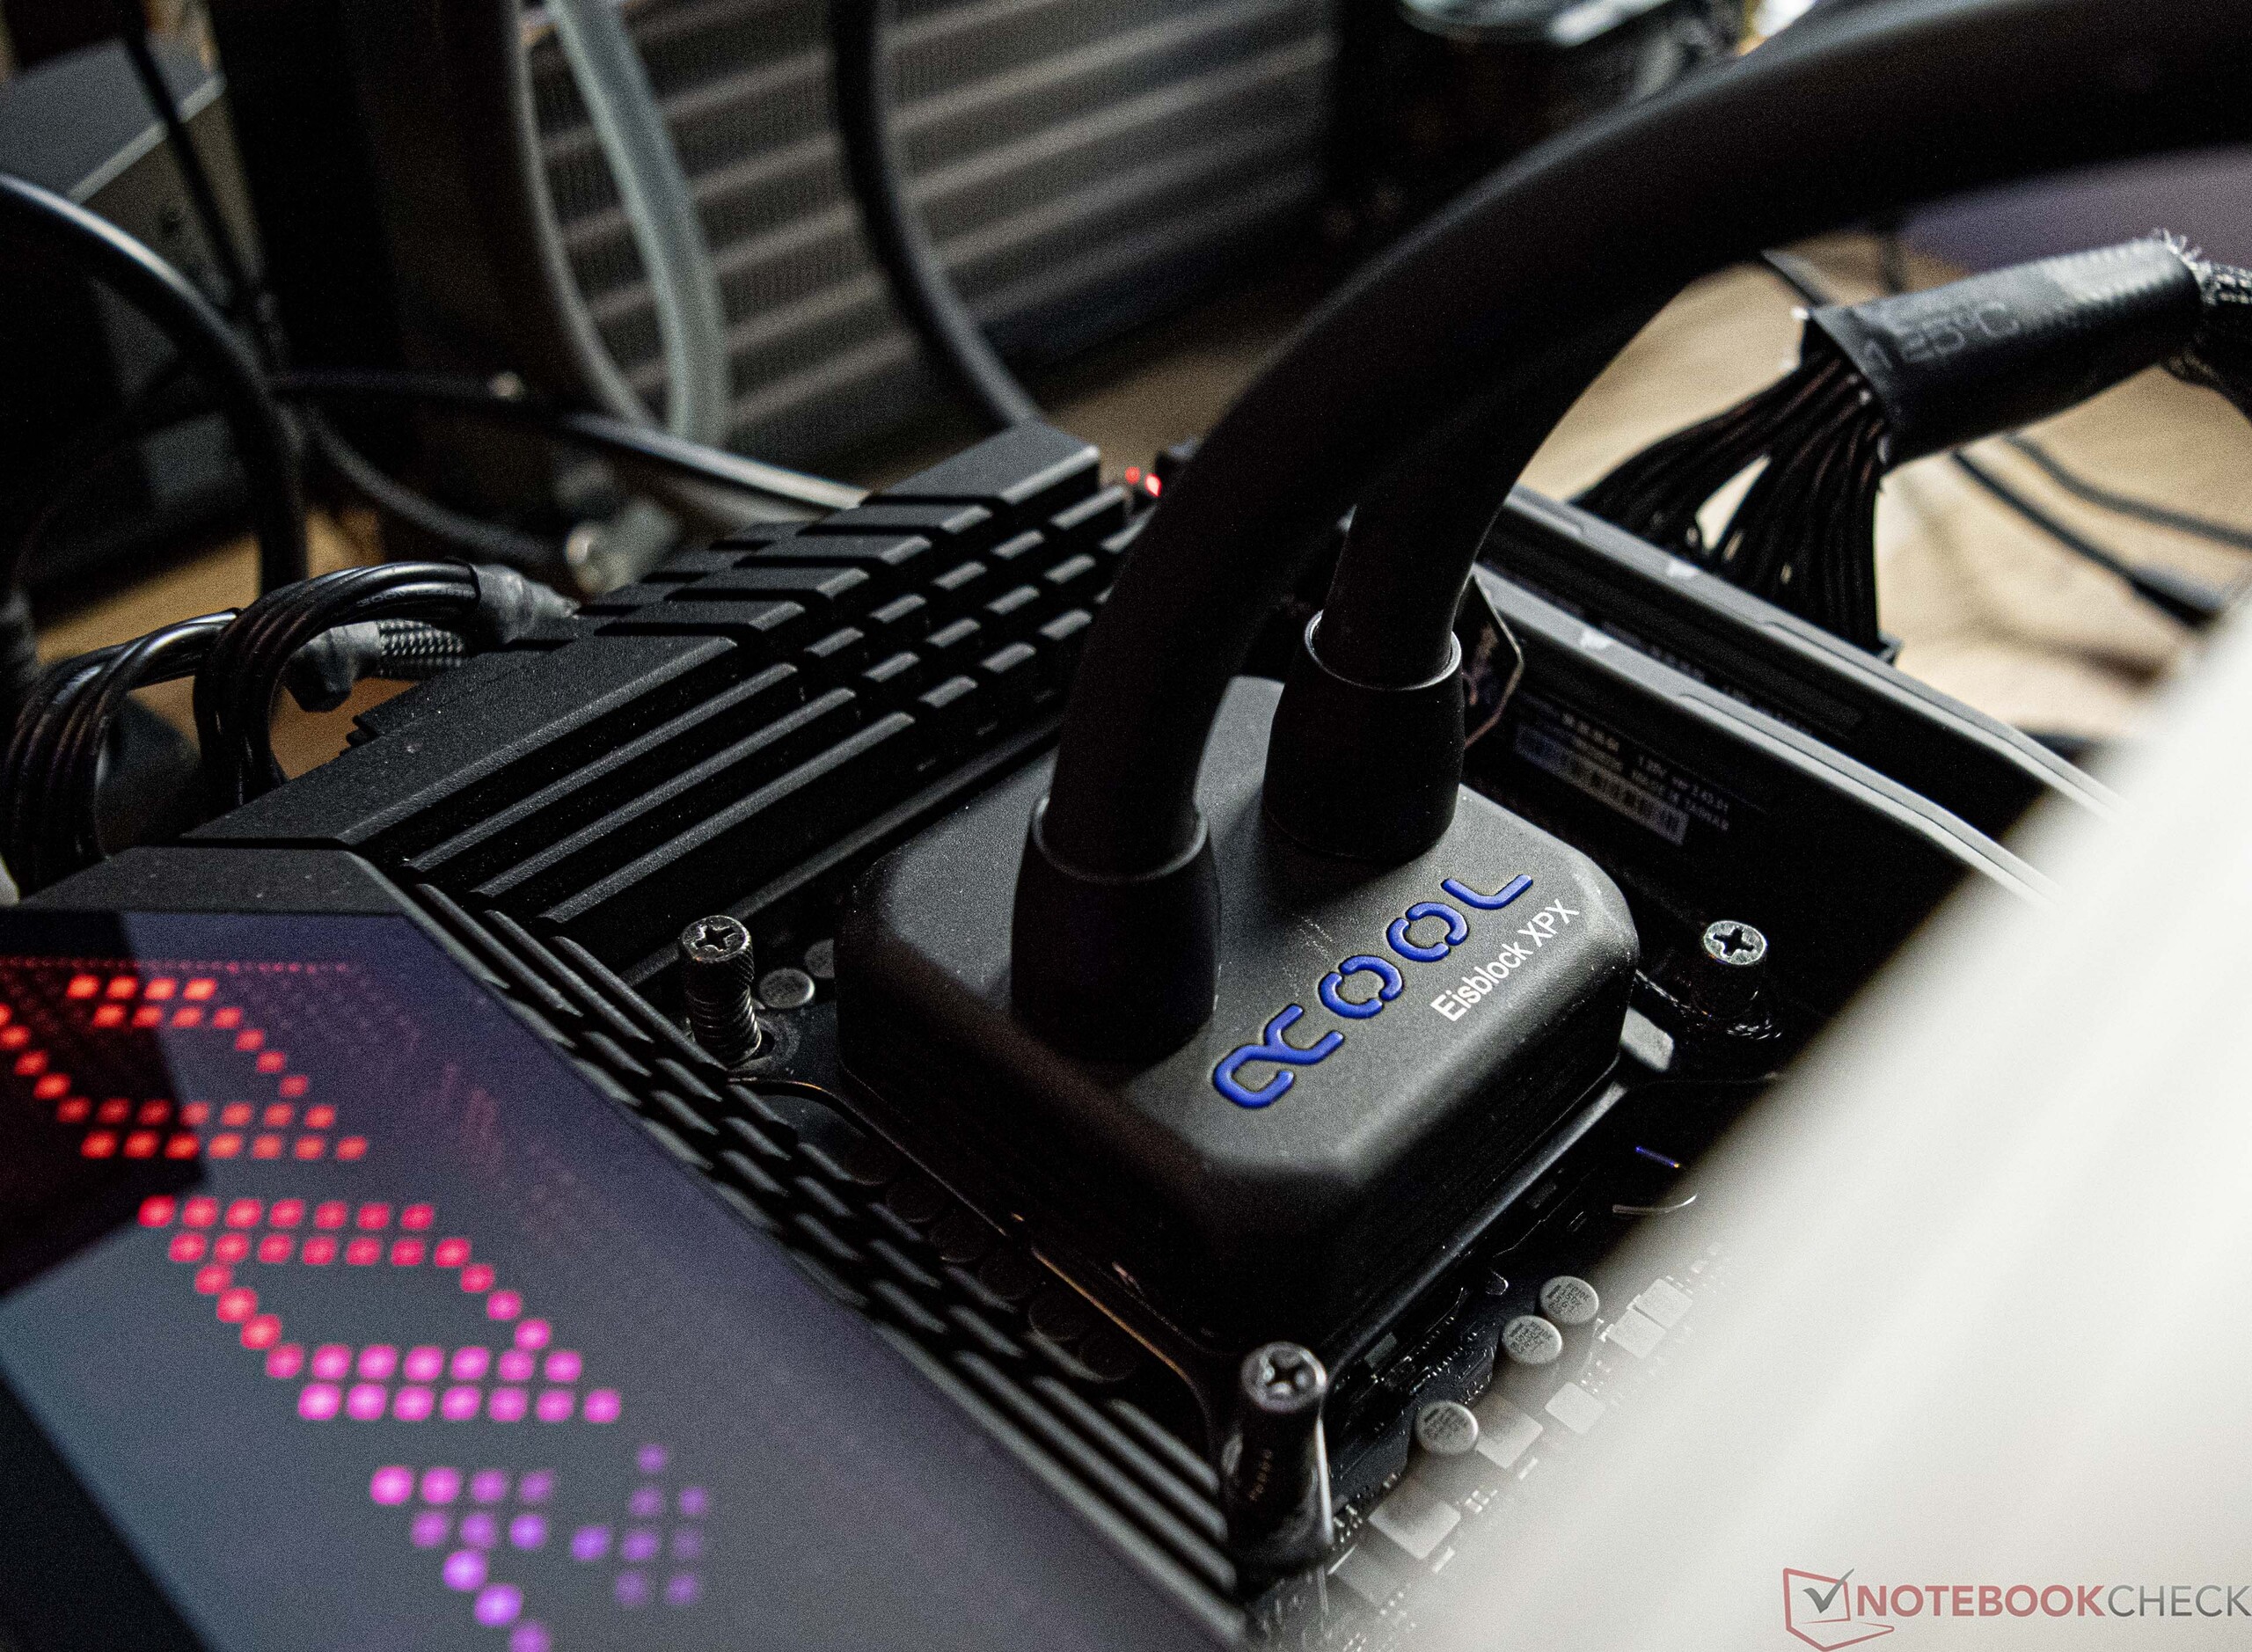
- Raffreddamento a circuito chiuso (pompa: Alphacool Aquastream XT Ultra, radiatore: EK MO-RA3 420 LT BLACK)
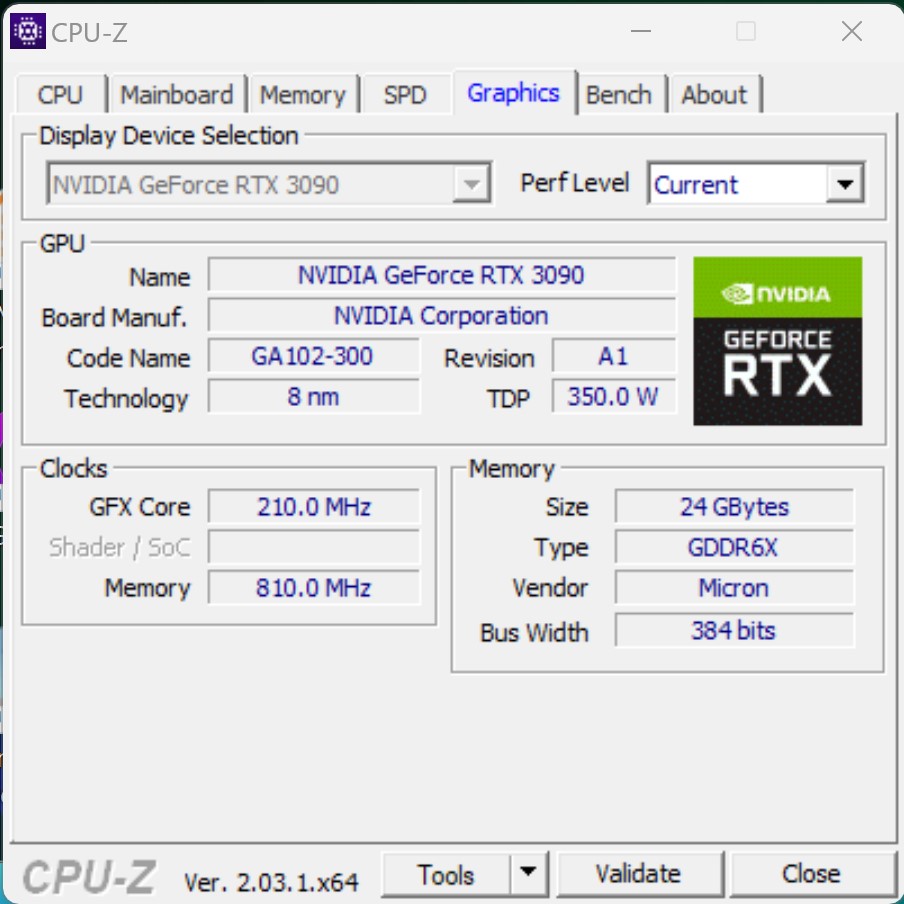
- Nvidia GeForce RTX 3090 Founders Edition (driver: 528.02)
- EVGA SuperNOVA P+ 1600W
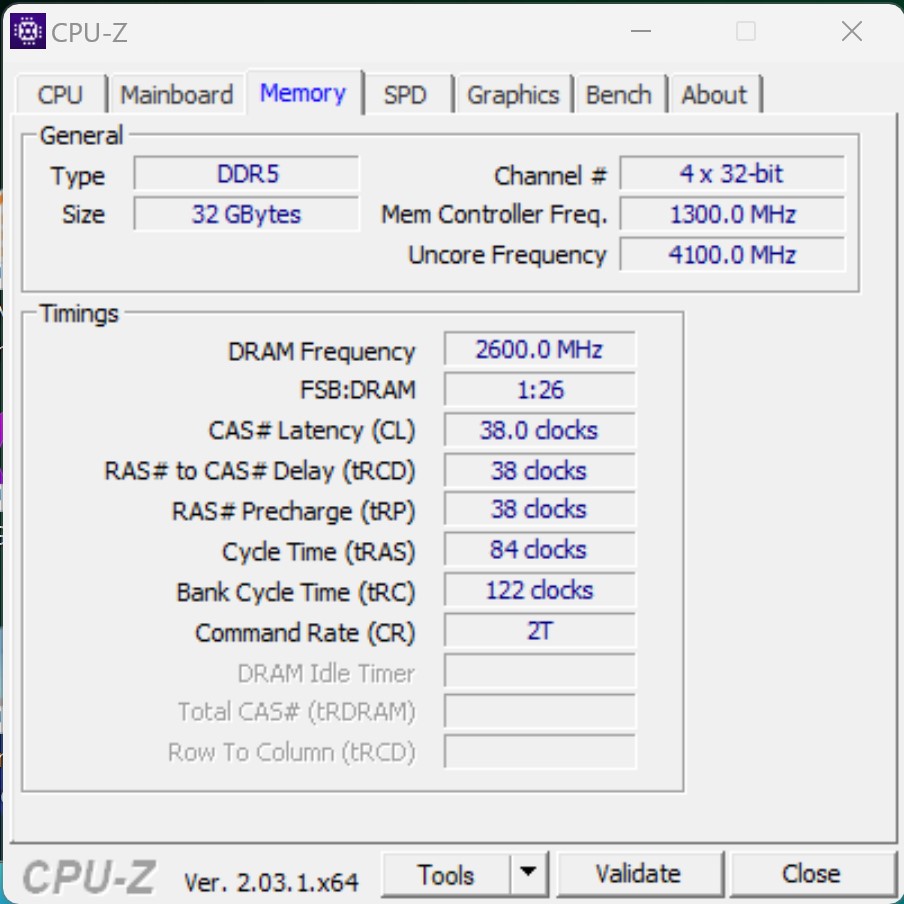
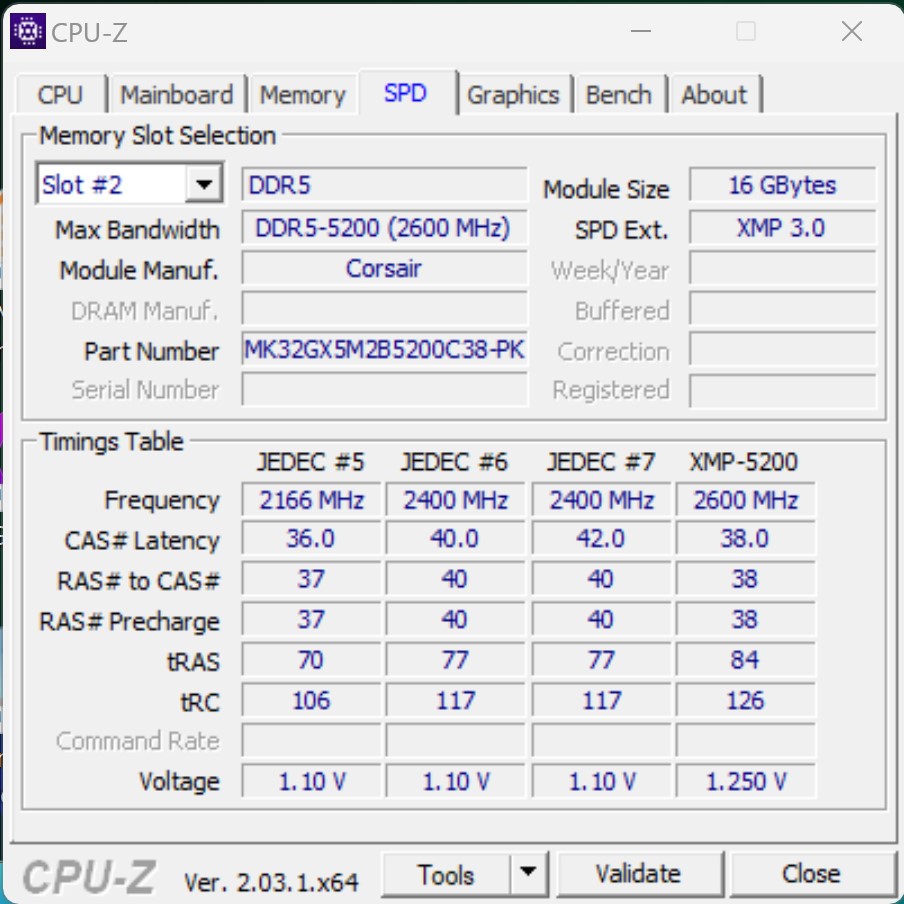
- G.Skill Ripjaws S5 (2x 16 GB - DDR5-5200 MT/s)
- Intel Optane 905p (480 GB di sistema + benchmark)
- Western Digital SN720 (giochi)
- Microsoft Windows 11 Professional 64-bit (versione 22H2)
Condizioni di test - Z690 ancora utilizzabile dopo l'aggiornamento del BIOS
Continuiamo ad utilizzare l'Asus ROG Maximus Z690 Hero come base per questo test, che è già stata la nostra scelta dall'introduzione dei processori Alder-Lake Processori Alder-Lake. Dopo alcuni problemi riscontrati durante il test con il processore Intel Core i9-13900Knon ci sono state complicazioni conIntel Core i5-13400F. Per avviare l'Intel Core i5-13400F è stato installato l'ultimo BIOS v2204. Fortunatamente, l'Asus ROG Maximus Z690 Hero offre la possibilità di aggiornare il BIOS senza CPU e RAM.
Tutti i test sono stati eseguiti con il BIOS più recente e il profilo XMP1 abilitato. Inoltre, tutte le limitazioni di potenza sono state disabilitate per accedere alle prestazioni complete dei processori.
Parametri di riferimento del processore
Purtroppo, in questo momento non possiamo fare un confronto diretto delle prestazioni con l'Intel Core i5-12400F. Tuttavia, nel nostro database abbiamo molti altri processori che possono essere utilizzati come riferimento. Pertanto, vediamo un vantaggio minimo per l'Intel Core i5-13400F rispetto all'Intel Core i7-12700F. In media, l'Intel Core i5-13400F può ottenere un risultato migliore, anche se i thread mancanti portano sicuramente a un punteggio peggiore nei singoli test. Il confronto diretto con l'AMD Ryzen 7 5800X mostra un quadro quasi identico AMD Ryzen 7 5800X. Come l'Intel Core i5-13400F, quest'ultimo offre 16 thread, ma può ottenere un punteggio migliore nei benchmark multi-thread puri.
Se avete bisogno di maggiori prestazioni, potete optare per un Intel Core i5-13600K. In questo caso le prestazioni sono superiori di circa il 20%. Lo stesso aumento di prestazioni può essere ottenuto anche con un AMD Ryzen 7 7700X.
Ulteriori benchmark sui processori possono essere trovatiqui.
| Blender - v2.79 BMW27 CPU | |
| Intel Core i5-11400F | |
| AMD Ryzen 5 5600X | |
| Intel Core i7-12700F | |
| Intel Core i5-13400F | |
| AMD Ryzen 7 5800X | |
| Intel Core i5-12600K | |
| AMD Ryzen 7 7700X | |
| Intel Core i5-13600K | |
| Intel Core i9-13900K | |
| WinRAR - Result | |
| AMD Ryzen 7 5800X | |
| AMD Ryzen 7 7700X | |
| Intel Core i9-13900K | |
| AMD Ryzen 5 5600X | |
| Intel Core i5-13600K | |
| Intel Core i7-12700F | |
| Intel Core i5-13400F | |
| Intel Core i5-11400F | |
| Intel Core i5-12600K | |
| WebXPRT 3 - Overall | |
| Intel Core i9-13900K | |
| AMD Ryzen 7 7700X | |
| Intel Core i5-13600K | |
| AMD Ryzen 7 5800X | |
| Intel Core i5-13400F | |
| Intel Core i5-12600K | |
| AMD Ryzen 5 5600X | |
| Intel Core i7-12700F | |
| Intel Core i5-11400F | |
| Mozilla Kraken 1.1 - Total | |
| Intel Core i5-11400F | |
| AMD Ryzen 5 5600X | |
| AMD Ryzen 7 5800X | |
| Intel Core i5-13400F | |
| Intel Core i7-12700F | |
| Intel Core i5-12600K | |
| Intel Core i5-13600K | |
| AMD Ryzen 7 7700X | |
| Intel Core i9-13900K | |
* ... Meglio usare valori piccoli
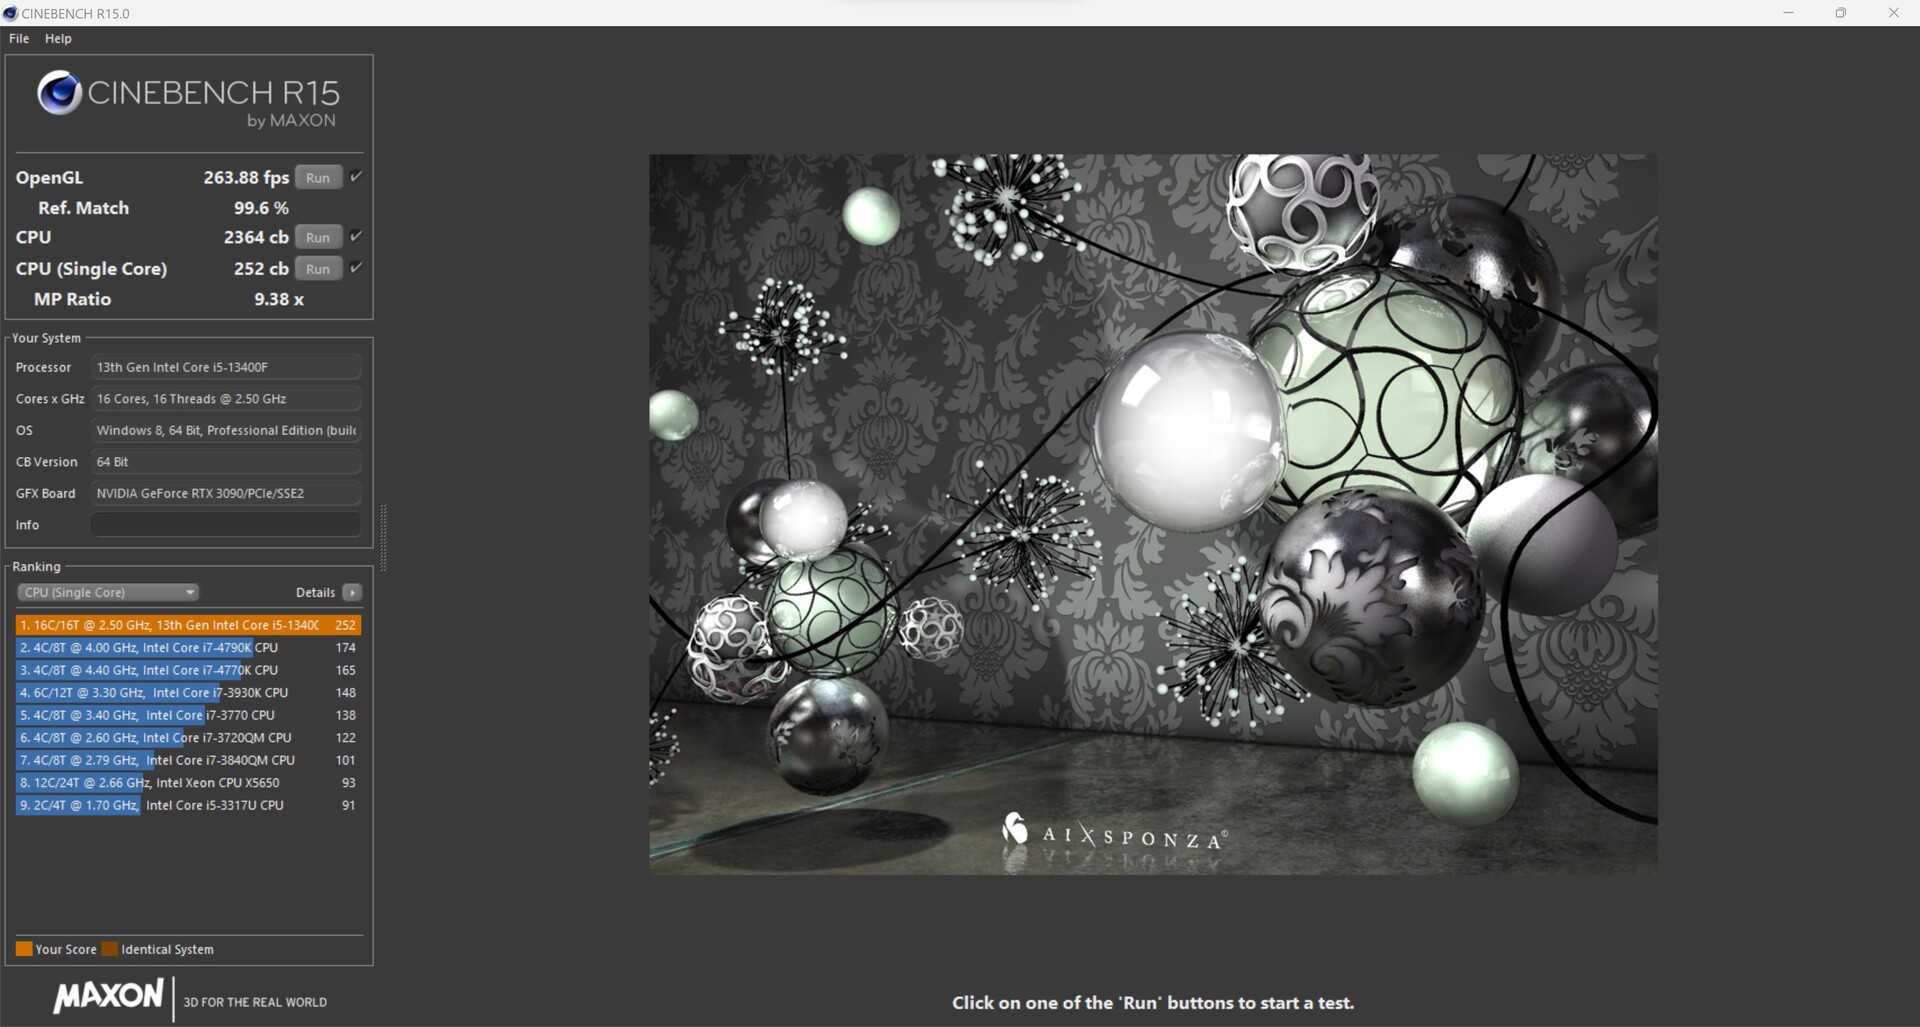
Intel Core i5-13400F vs. Cinebench R15 multi loop
Durante lo stress test, che eseguiamo con il ciclo continuo di Cinebench R15, non ci sono problemi in termini di sviluppo di potenza stabile. Con un massimo di 148 watt, che Intel consente al Core i5-13400F, il sistema di raffreddamento non viene messo particolarmente alla prova. L'Intel Core i5-13400F è solo marginalmente più lento dell'Intel Core i5-12600K, con una media di 2.338 punti su tutti i 50 cicli di lavoro Intel Core i5-12600K (2.545 punti).
Benchmark sintetici e prestazioni delle applicazioni
L'Intel Core i5-13400F è in grado di ottenere buoni risultati anche nei benchmark applicativi ed è pari ad un Intel Core i5-12600K in termini di prestazioni. Rispetto ai modelli K dei processori Raptor-Lake qui elencati, il nostro campione in prova deve però accettare un chiaro deficit. Tuttavia, l'Intel Core i5-13400F offre prestazioni solide nell'uso quotidiano, del tutto sufficienti per la maggior parte delle applicazioni.
| 3DMark 11 - 1280x720 Performance Physics | |
| Intel Core i9-13900K | |
| Intel Core i5-13600K | |
| Intel Core i9-12900K | |
| AMD Ryzen 5 7600X | |
| AMD Ryzen 9 5950X | |
| Intel Core i5-12600K | |
| Intel Core i5-13400F | |
| Intel Core i7-12700F | |
| Intel Core i9-12900K | |
| AMD Ryzen 9 5900X | |
| AMD Ryzen 5 5600X | |
| Intel Core i5-11400F | |
| CrossMark - Overall | |
| Intel Core i9-13900K | |
| Intel Core i5-13600K | |
| AMD Ryzen 5 7600X | |
| Intel Core i5-13400F | |
| Intel Core i7-12700F | |
| Intel Core i5-12600K | |
| AMD Ryzen 9 5900X | |
| AMD Ryzen 9 5950X | |
| AMD Ryzen 5 5600X | |
| AIDA64 / Memory Copy | |
| Intel Core i9-13900K | |
| Intel Core i5-13600K | |
| Intel Core i5-13400F | |
| Intel Core i5-12600K | |
| AMD Ryzen 9 5900X | |
| AMD Ryzen 5 7600X | |
| AMD Ryzen 9 5950X | |
| AMD Ryzen 5 5600X | |
| Media della classe (4514 - 234662, n=2223) | |
| AIDA64 / Memory Read | |
| Intel Core i9-13900K | |
| Intel Core i5-13400F | |
| Intel Core i5-12600K | |
| Intel Core i5-13600K | |
| AMD Ryzen 9 5900X | |
| AMD Ryzen 9 5950X | |
| AMD Ryzen 5 5600X | |
| AMD Ryzen 5 7600X | |
| Media della classe (4031 - 271066, n=2185) | |
| AIDA64 / Memory Write | |
| AMD Ryzen 5 7600X | |
| Intel Core i9-13900K | |
| Intel Core i5-12600K | |
| Intel Core i5-13600K | |
| Intel Core i5-13400F | |
| Media della classe (3506 - 242868, n=2190) | |
| AMD Ryzen 9 5900X | |
| AMD Ryzen 9 5950X | |
| AMD Ryzen 5 5600X | |
| AIDA64 / Memory Latency | |
| Media della classe (6.1 - 536, n=2251) | |
| Intel Core i5-12600K | |
| Intel Core i5-13600K | |
| Intel Core i5-13400F | |
| Intel Core i9-13900K | |
| AMD Ryzen 9 5950X | |
| AMD Ryzen 5 5600X | |
| AMD Ryzen 5 7600X | |
| AMD Ryzen 9 5900X | |
* ... Meglio usare valori piccoli
Parametri di gioco
Come in precedenza, il nostro campione in esame duella principalmente con l'Intel Core i5-12600K nei test di gioco. A risoluzioni elevate e con una preimpostazione alta, i rivali si avvicinano. Se si tratta di giocare, non si può sbagliare con l'Intel Core i5-13400F. Con i suoi 16 thread, tutti i giochi sono attualmente giocabili con la scheda grafica corrispondente. Nel nostro test abbiamo utilizzato una Nvidia GeForce RTX 3090 Founder Edition per confrontare le prestazioni del nostro campione di prova con quelle dei dispositivi di confronto. Se si desidera anche effettuare lo streaming contemporaneamente al gioco, attualmente consigliamo un Intel Core i9-13900K o un AMD Ryzen 9 7950X.
Gaming Performance
| Performance rating - Percent | |
| Intel Core i9-13900K | |
| AMD Ryzen 9 7900X | |
| AMD Ryzen 5 7600X | |
| Intel Core i9-12900K | |
| Intel Core i5-13600K | |
| Intel Core i5-13400F | |
| Intel Core i5-12600K | |
| F1 22 | |
| 1920x1080 Low Preset AA:T AF:16x | |
| AMD Ryzen 9 7900X | |
| AMD Ryzen 5 7600X | |
| Intel Core i5-13600K | |
| Intel Core i9-13900K | |
| Intel Core i9-12900K | |
| Intel Core i5-13400F | |
| Intel Core i5-12600K | |
| 1920x1080 Ultra High Preset AA:T AF:16x | |
| Intel Core i9-12900K | |
| Intel Core i5-12600K | |
| Intel Core i5-13600K | |
| Intel Core i5-13400F | |
| AMD Ryzen 5 7600X | |
| AMD Ryzen 9 7900X | |
| Intel Core i9-13900K | |
| Far Cry 5 | |
| 1920x1080 Ultra Preset AA:T | |
| Intel Core i9-13900K | |
| Intel Core i5-13600K | |
| Intel Core i9-12900K | |
| AMD Ryzen 9 7900X | |
| AMD Ryzen 5 7600X | |
| Intel Core i5-12600K | |
| Intel Core i5-13400F | |
| 1280x720 Low Preset AA:T | |
| Intel Core i9-13900K | |
| AMD Ryzen 9 7900X | |
| Intel Core i5-13600K | |
| AMD Ryzen 5 7600X | |
| Intel Core i9-12900K | |
| Intel Core i5-12600K | |
| Intel Core i5-13400F | |
| X-Plane 11.11 | |
| 1920x1080 high (fps_test=3) | |
| AMD Ryzen 9 7900X | |
| AMD Ryzen 5 7600X | |
| Intel Core i9-13900K | |
| Intel Core i9-12900K | |
| Intel Core i5-13600K | |
| Intel Core i5-13400F | |
| Intel Core i5-12600K | |
| 1280x720 low (fps_test=1) | |
| Intel Core i9-13900K | |
| AMD Ryzen 5 7600X | |
| AMD Ryzen 9 7900X | |
| Intel Core i9-12900K | |
| Intel Core i5-13600K | |
| Intel Core i5-13400F | |
| Intel Core i5-12600K | |
| Final Fantasy XV Benchmark | |
| 1920x1080 High Quality | |
| AMD Ryzen 9 7900X | |
| Intel Core i5-13600K | |
| Intel Core i9-13900K | |
| AMD Ryzen 5 7600X | |
| Intel Core i9-12900K | |
| Intel Core i5-13400F | |
| Intel Core i5-12600K | |
| 1280x720 Lite Quality | |
| AMD Ryzen 9 7900X | |
| Intel Core i5-13600K | |
| Intel Core i9-13900K | |
| Intel Core i9-12900K | |
| AMD Ryzen 5 7600X | |
| Intel Core i5-13400F | |
| Intel Core i5-12600K | |
| Dota 2 Reborn | |
| 1920x1080 ultra (3/3) best looking | |
| AMD Ryzen 9 7900X | |
| Intel Core i9-13900K | |
| AMD Ryzen 5 7600X | |
| Intel Core i5-13600K | |
| Intel Core i9-12900K | |
| Intel Core i5-12600K | |
| Intel Core i5-13400F | |
| 1280x720 min (0/3) fastest | |
| AMD Ryzen 5 7600X | |
| AMD Ryzen 9 7900X | |
| Intel Core i9-13900K | |
| Intel Core i5-13600K | |
| Intel Core i9-12900K | |
| Intel Core i5-12600K | |
| Intel Core i5-13400F | |
| GTA V | |
| 1920x1080 Highest AA:4xMSAA + FX AF:16x | |
| Intel Core i9-13900K | |
| AMD Ryzen 9 7900X | |
| AMD Ryzen 5 7600X | |
| Intel Core i5-13600K | |
| Intel Core i9-12900K | |
| Intel Core i5-12600K | |
| Intel Core i5-13400F | |
| 1024x768 Lowest Settings possible | |
| Intel Core i9-13900K | |
| AMD Ryzen 9 7900X | |
| AMD Ryzen 5 7600X | |
| Intel Core i5-13600K | |
| Intel Core i9-12900K | |
| Intel Core i5-13400F | |
| Intel Core i5-12600K | |
| basso | medio | alto | ultra | QHD | 4K | |
|---|---|---|---|---|---|---|
| GTA V (2015) | 187.5 | 187.5 | 187.1 | 161.4 | 151.8 | 182.2 |
| The Witcher 3 (2015) | 773 | 586 | 384 | 188.1 | 156.9 | |
| Dota 2 Reborn (2015) | 293.1 | 257 | 250.4 | 231.65 | 216.7 | |
| Final Fantasy XV Benchmark (2018) | 236 | 231 | 190.8 | 146.6 | 88.8 | |
| X-Plane 11.11 (2018) | 225 | 199.2 | 160.9 | 133.5 | ||
| Far Cry 5 (2018) | 244 | 211 | 203 | 186 | 176 | 110 |
| Strange Brigade (2018) | 741 | 479 | 380 | 329 | 249 | 153.1 |
| Shadow of the Tomb Raider (2018) | 314 | 261 | 251 | 234 | 172.2 | 99.6 |
| Far Cry New Dawn (2019) | 200 | 176 | 169 | 151 | 143 | 109 |
| Metro Exodus (2019) | 311 | 223 | 175.2 | 140.1 | 115.8 | 76.6 |
| Borderlands 3 (2019) | 244 | 213 | 190.8 | 164.1 | 131.6 | 75.3 |
| F1 2020 (2020) | 487 | 403 | 374 | 270 | 218 | 138.8 |
| F1 2021 (2021) | 648 | 548 | 441 | 224 | 175.4 | 105.3 |
| Cyberpunk 2077 1.6 (2022) | 214 | 213 | 174 | 173 | 88 | 46 |
| Tiny Tina's Wonderlands (2022) | 364 | 294 | 212 | 168.5 | 124 | 70.8 |
| F1 22 (2022) | 344 | 361 | 321 | 125.1 | 83.8 | 42.4 |
| The Quarry (2022) | 282 | 216 | 177.7 | 144.4 | 103.6 | 58.9 |
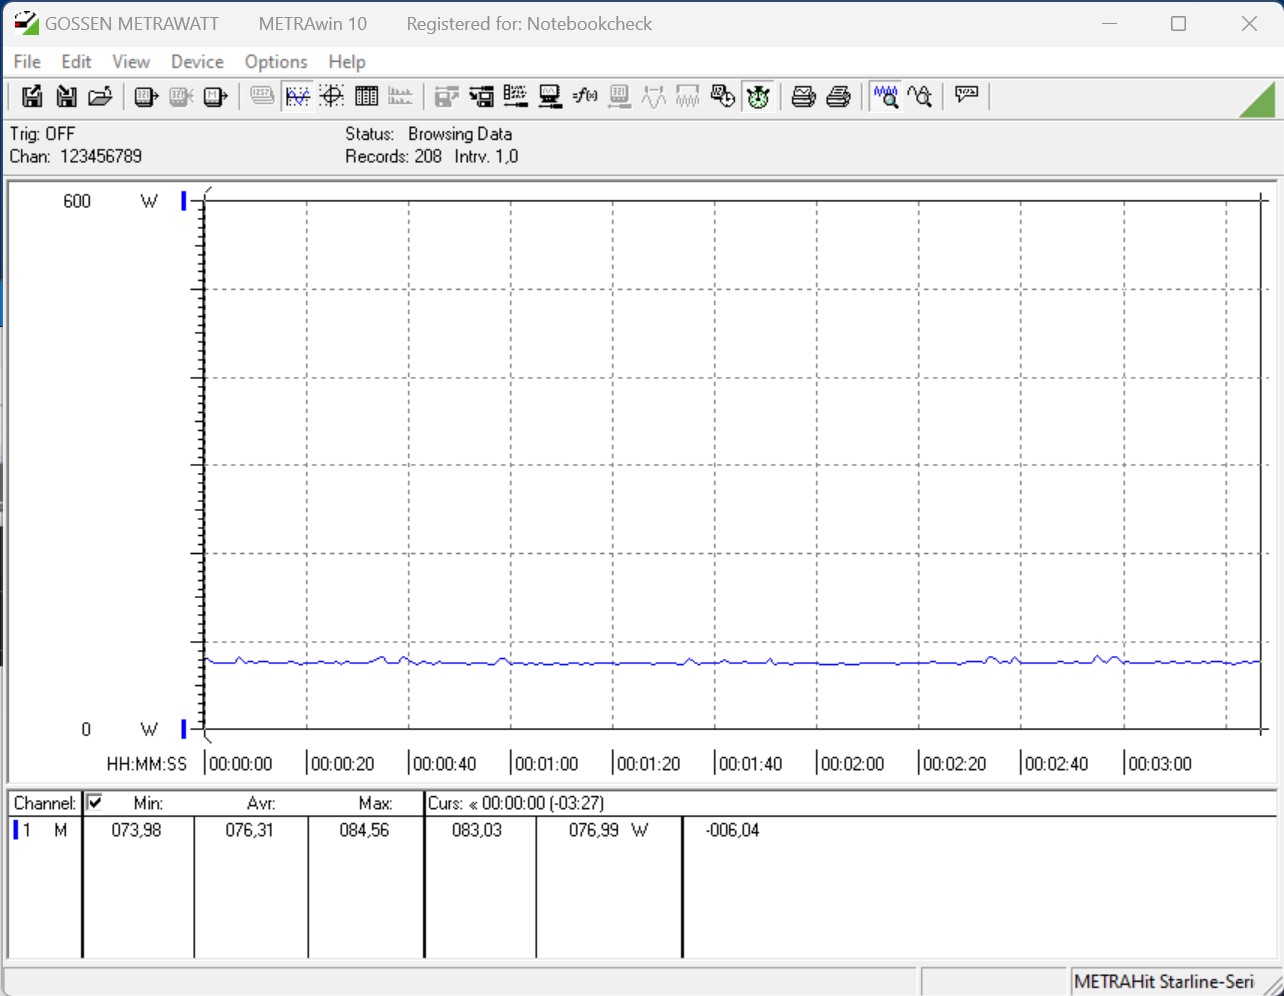
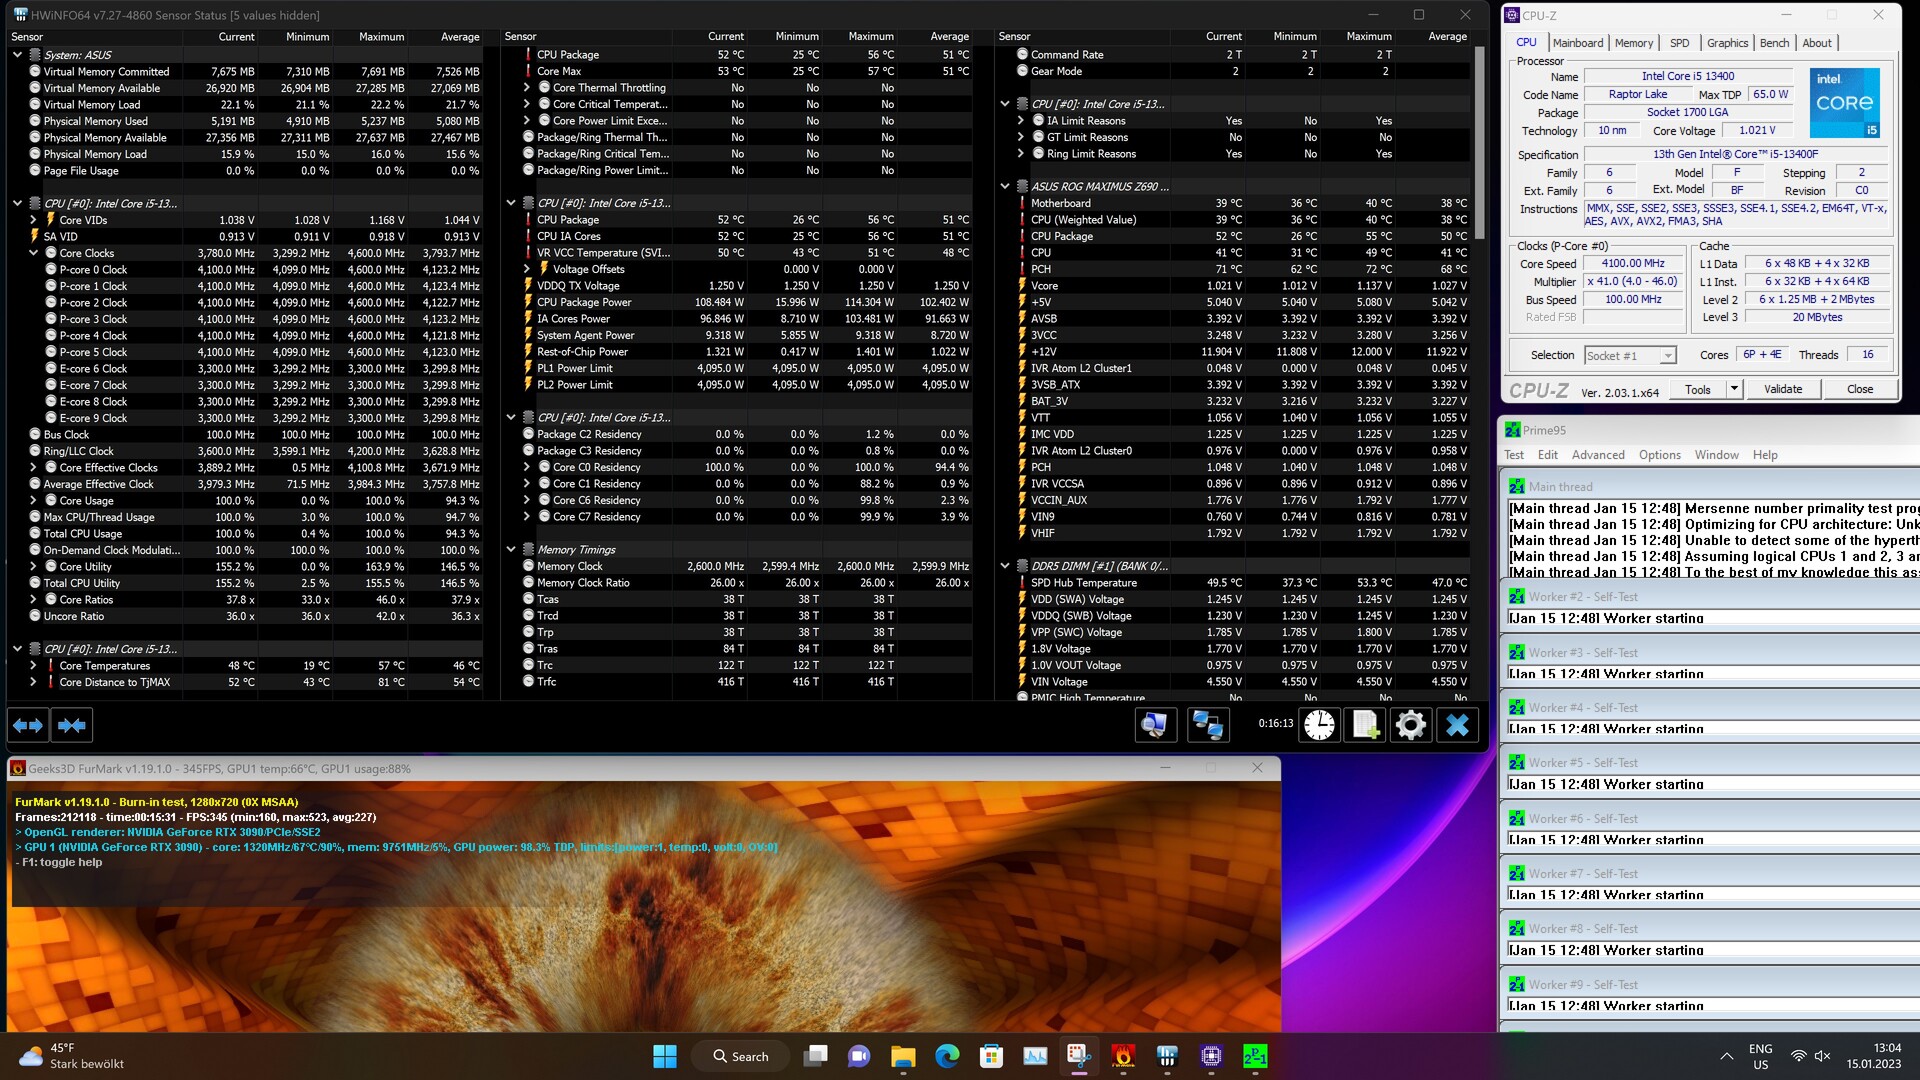
Consumo di energia
Secondo le specifiche tecniche dell'Intel Core i5-13400F, il consumo energetico è di 65 watt e può raggiungere i 148 watt sotto carico. Se le restrizioni del consumo energetico del processore non sono limitate nel BIOS, i 148 watt sono permanentemente attivi e non sono limitati temporalmente dal valore di rugiada. Tutti i test effettuati con il processore sono stati eseguiti senza alcuna limitazione. Registriamo il consumo energetico del sistema di test con soli 184 watt nel test multiplo Cinebench R15. Pertanto, l'Intel Core i5-13400F è notevolmente più parsimonioso di un Intel Core i5-12600K, che richiede poco meno di 206 watt nel nostro test. Notiamo un po' di più con 214 watt nello stress test. Tuttavia, il consumo energetico è piacevolmente basso.
Grazie al basso consumo energetico, l'Intel Core i5-13400F non ha bisogno di un grande raffreddamento. Pertanto, si può tranquillamente fare a meno di un AiO e un raffreddatore ad aria di alta qualità è del tutto sufficiente per questa CPU.
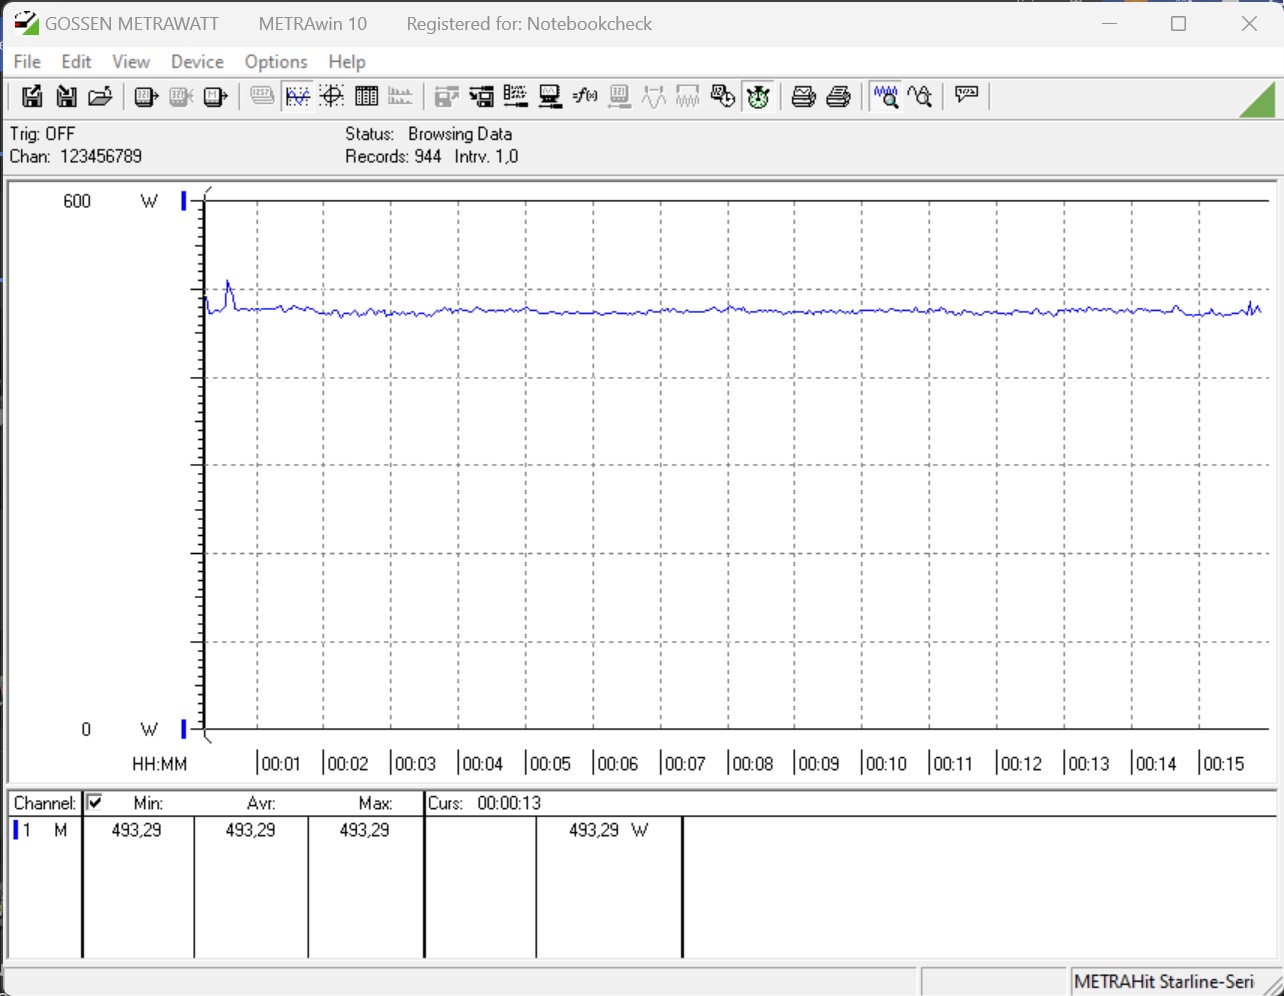
| Power Consumption / Cinebench R15 Multi (external Monitor) | |
| Intel Core i9-13900K | |
| Intel Core i9-12900K (Idle: 70.5 W) | |
| AMD Ryzen 9 7900X | |
| Intel Core i5-13600K | |
| AMD Ryzen 9 5900X (Idle: 78.1 W) | |
| AMD Ryzen 9 5950X (Idle: 78 W) | |
| AMD Ryzen 5 7600X | |
| Intel Core i5-12600K (Idle: 70.45 W) | |
| Intel Core i5-13400F | |
| AMD Ryzen 5 5600X (Idle: 79.23 W) | |
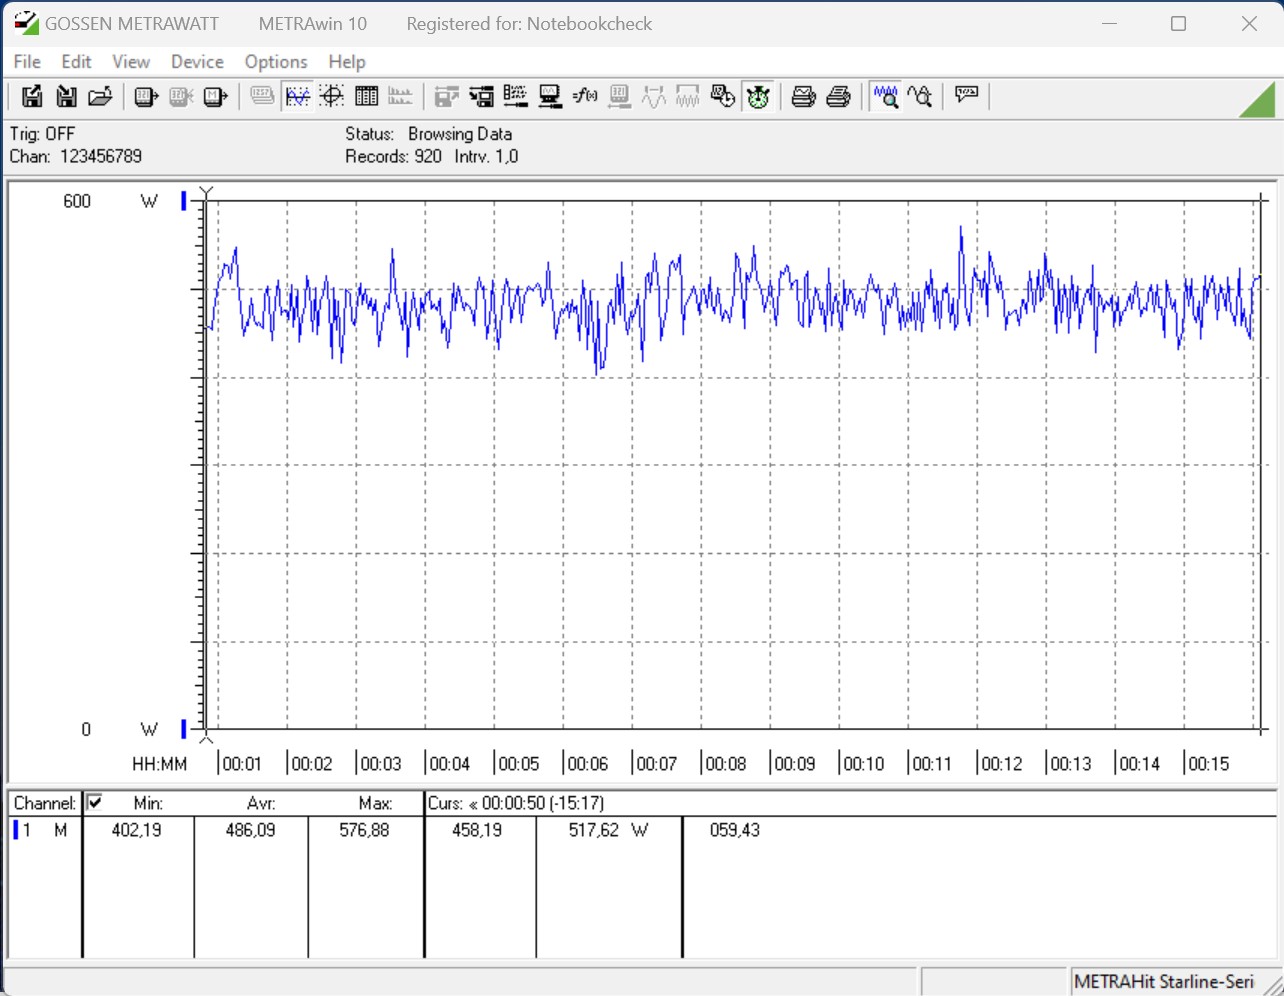
| Power Consumption / Prime95 V2810 Stress (external Monitor) | |
| Intel Core i9-13900K | |
| Intel Core i5-13600K | |
| AMD Ryzen 9 7900X | |
| Intel Core i9-12900K (Idle: 70.5 W) | |
| Intel Core i5-12600K (Idle: 70.45 W) | |
| AMD Ryzen 9 5950X (Idle: 78 W) | |
| AMD Ryzen 9 5900X (Idle: 78.1 W) | |
| AMD Ryzen 5 7600X | |
| Intel Core i5-13400F | |
| AMD Ryzen 5 5600X (Idle: 79.23 W) | |
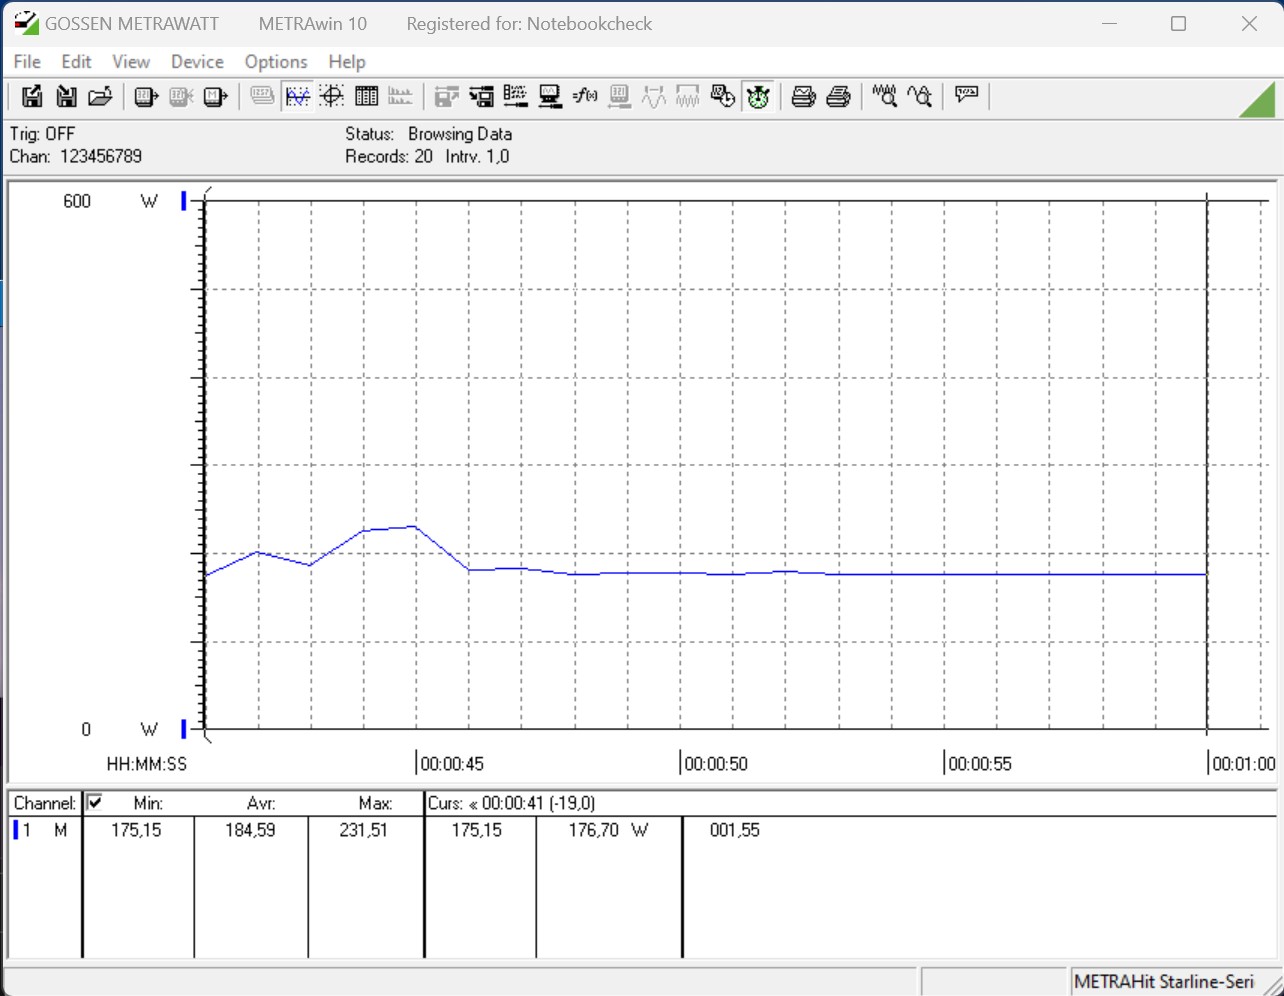
| Power Consumption / The Witcher 3 ultra (external Monitor) | |
| AMD Ryzen 9 7900X | |
| Intel Core i9-13900K | |
| AMD Ryzen 5 7600X | |
| Intel Core i5-13600K | |
| Intel Core i5-13400F | |
| Nvidia GeForce RTX 3090 Founders Edition (Idle: 91.1 W) | |
| Intel Core i9-12900K (Idle: 70.5 W) | |
| AMD Ryzen 9 5950X (Idle: 78 W) | |
| AMD Ryzen 9 5900X (Idle: 78.1 W) | |
| AMD Ryzen 5 5600X (Idle: 79.23 W) | |
| Intel Core i5-12600K (Idle: 70.45 W) | |
* ... Meglio usare valori piccoli
Power Consumption With External Monitor
Pro
Contro
Conclusione - Economico, veloce e facile da raffreddare


Intel ha già mandato in gara un venerabile successore della generazione Alder Lake con Raptor Lake. I modelli di fascia media ed entry-level sulla stessa base stanno arrivando gradualmente. Tuttavia, è necessario dare un'occhiata più da vicino e prestare attenzione allo stepping della CPU, perché non sempre si tratta di una CPU Raptor Lake. Nel nostro caso, abbiamo l'Intel Core i5-13400F con lo stepping C0, che indica che si tratta di una CPU Alder Lake. Solo il B0-stepping indica una CPU Raptor-Lake nativa. Entrambe le versioni dovrebbero essere disponibili e si presume che abbiano le stesse prestazioni.
Nel frattempo, Intel offre un frugale 10-core con l'Intel Core i5-13400F, che ha anche 4 E-cores oltre ai P-cores. Con una potenza massima di 148 watt, questo modello è relativamente frugale a pieno carico. Inoltre, le temperature sono facili da gestire e non richiedono un raffreddamento complesso e costoso. Nel test, l'Intel Core i5-13400F è in grado di tenere il passo con l'Intel Core i5-12600K, ma il confronto in termini di efficienza energetica è chiaramente a favore del modello più frugale. I processori Zen 4 di AMD non possono essere seguiti. In questo caso, il 10-core nativo del nostro test se la cava con un AMD Ryzen 7 5800X, che ha anche un totale di 16 thread.
L'Intel Core i5-13400F offre prestazioni solide per l'uso quotidiano e padroneggia anche i giochi più recenti. Grazie al basso TDP, il frugale processore può essere raffreddato senza problemi anche in case di piccole dimensioni.
Per l'unità di base è possibile utilizzare una scheda madre con chipset serie 600. Questo non grava troppo sul portafoglio in caso di aggiornamento. Tuttavia, bisogna considerare che non ci sarà più una nuova generazione Intel per il socket 1700. Le voci attuali dicono che il socket 1851 sarà introdotto con Meteor Lake. Ciò significa che sarà di nuovo obbligatorio acquistare una nuova scheda madre.
Prezzi e disponibilità
L'Intel Core i5-13400F è attualmente disponibile al prezzo di 227 Euro (~$247) presso Notebooksbilliger.de. Per 260 Euro(~$283) è possibile acquistarlo con un'unità grafica integrata, sempre su Notebooksbilliger.de.
