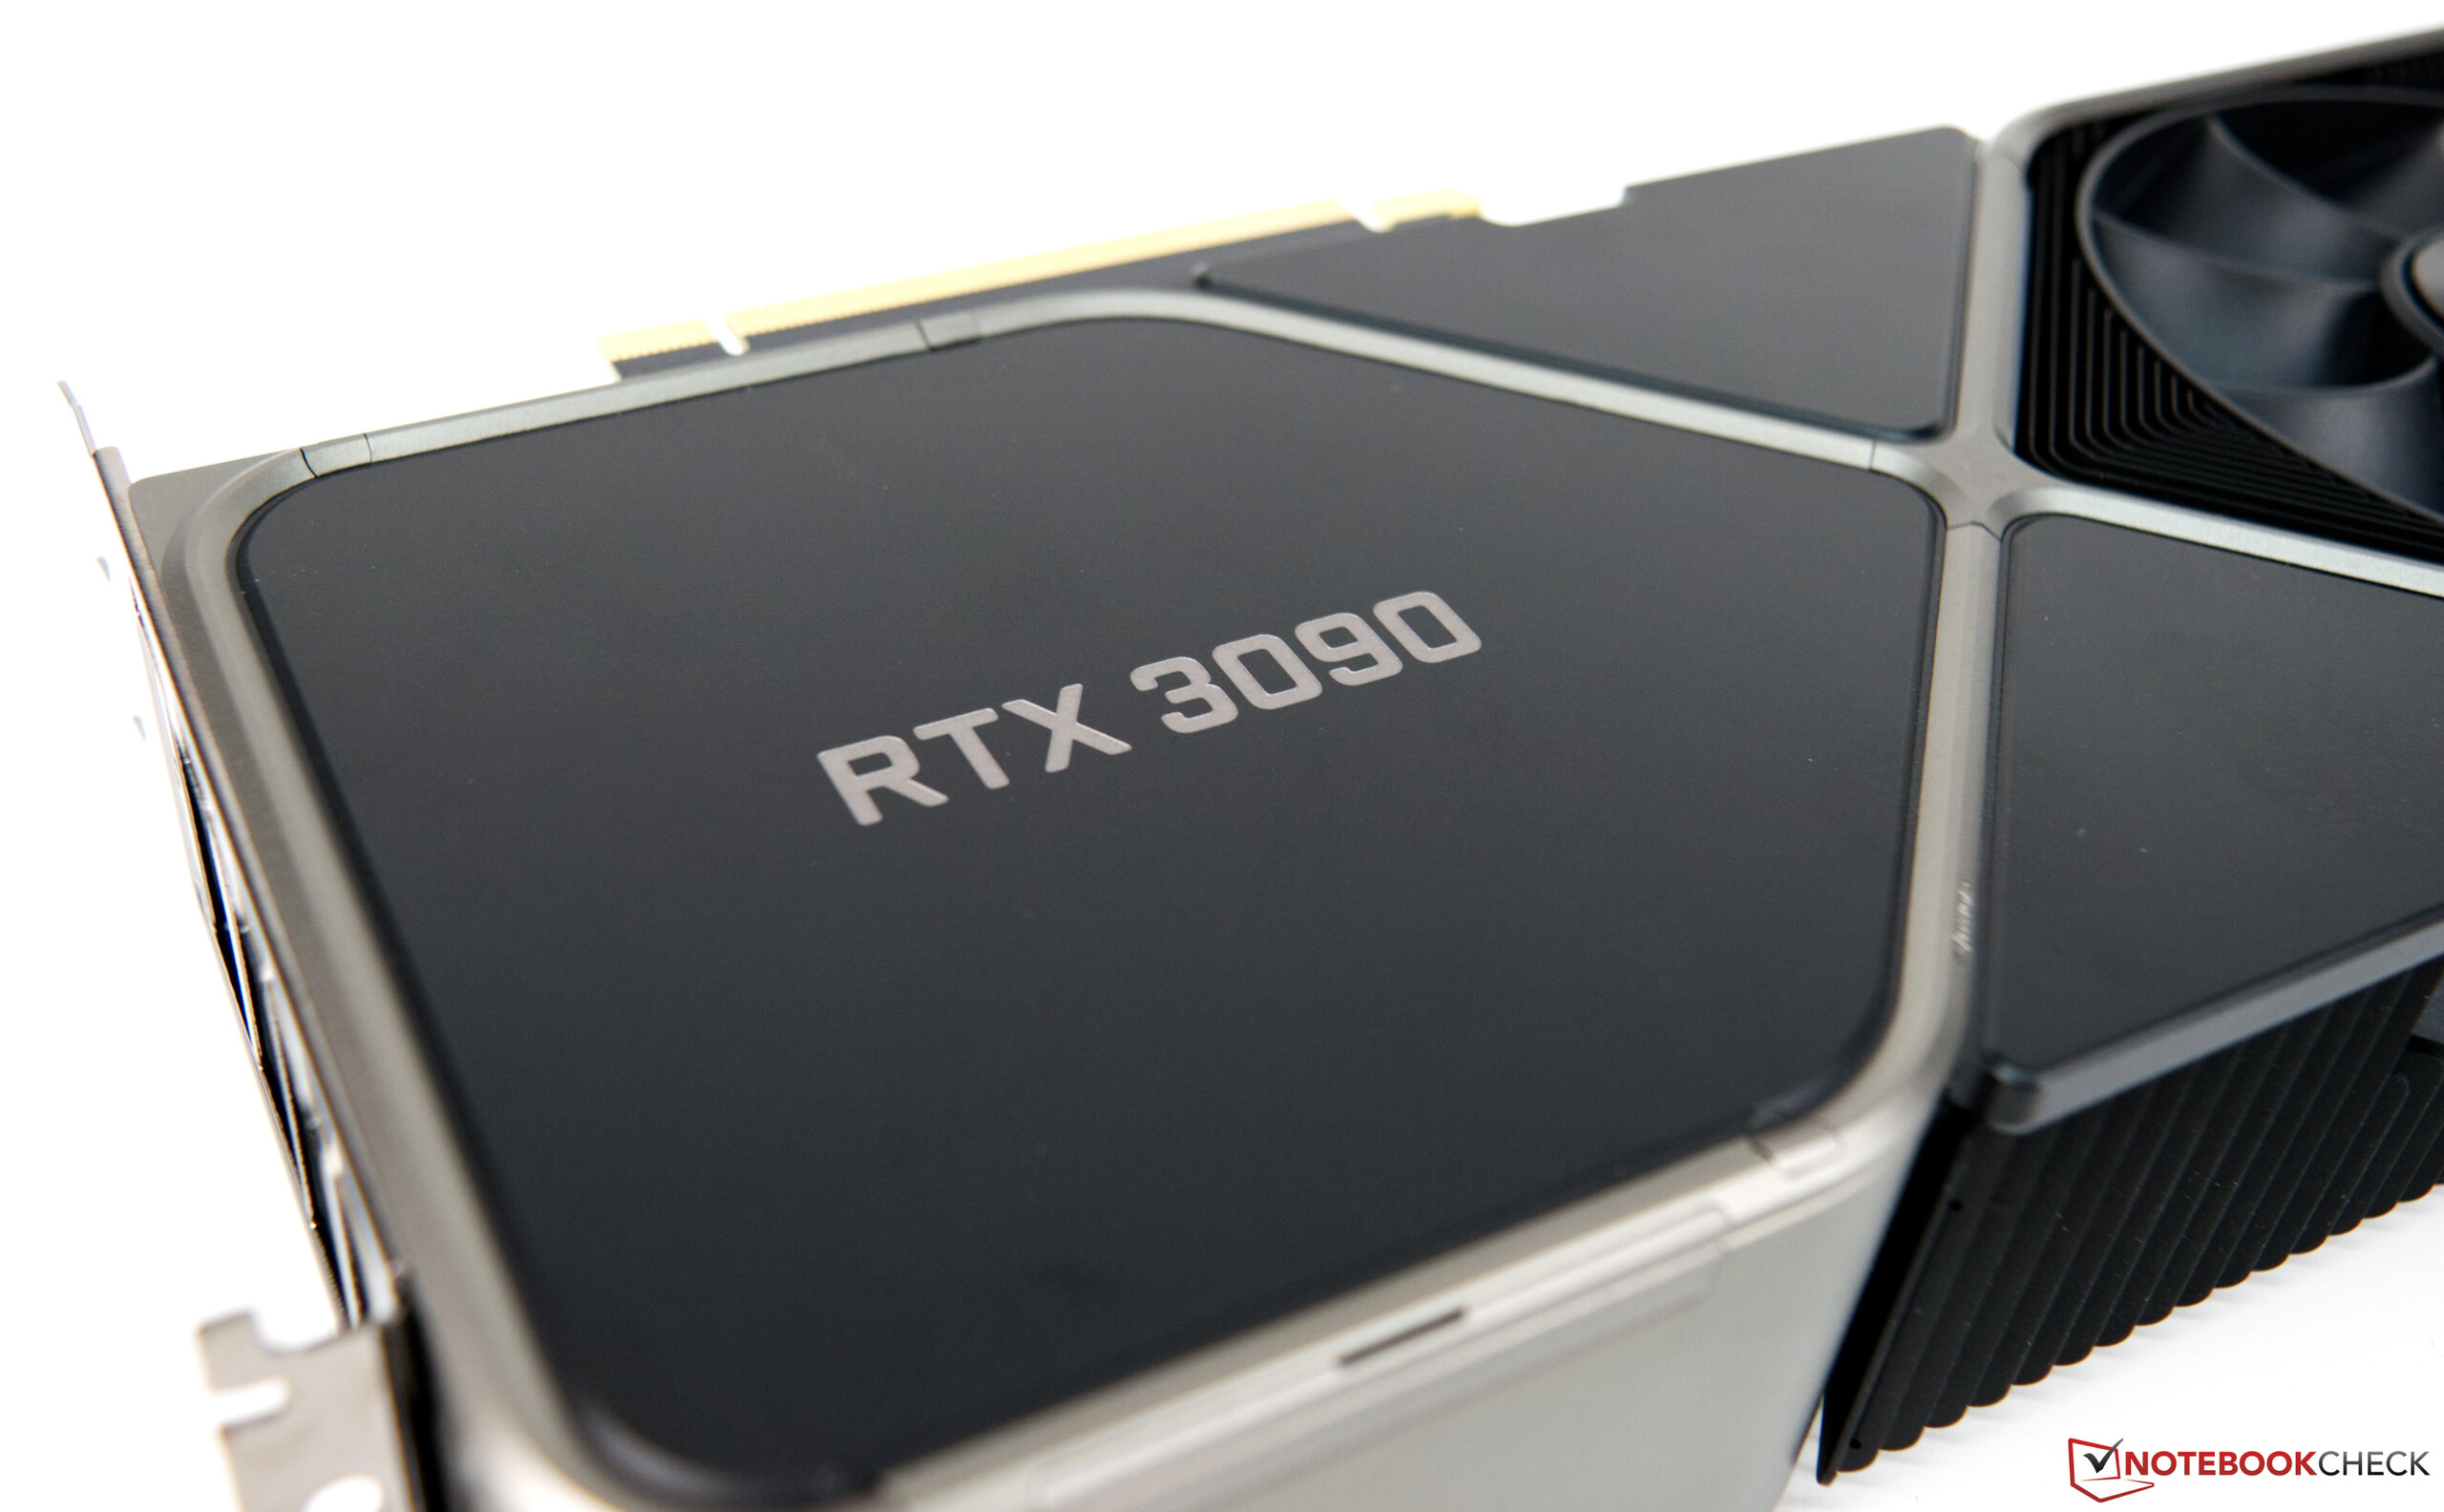
Nvidia GeForce RTX 3090 FE - Potenza grafica di fascia alta a un prezzo premium!

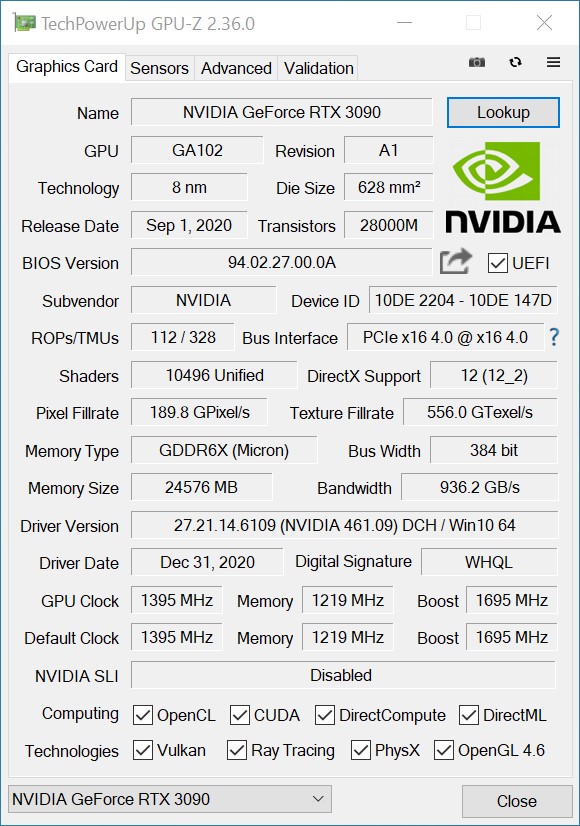
La nuova ammiraglia di Nvidia si chiama GeForce RTX 3090 e offre per la prima volta un enorme 24 GB di memoria grafica per il settore consumer. Queste dimensioni di memoria erano precedentemente disponibili solo in soluzioni grafiche professionali come i modelli Quadro o Titan. Una cosa è certa: Le critiche dovute alla troppa poca VRAM non vangono per la RTX 3090.
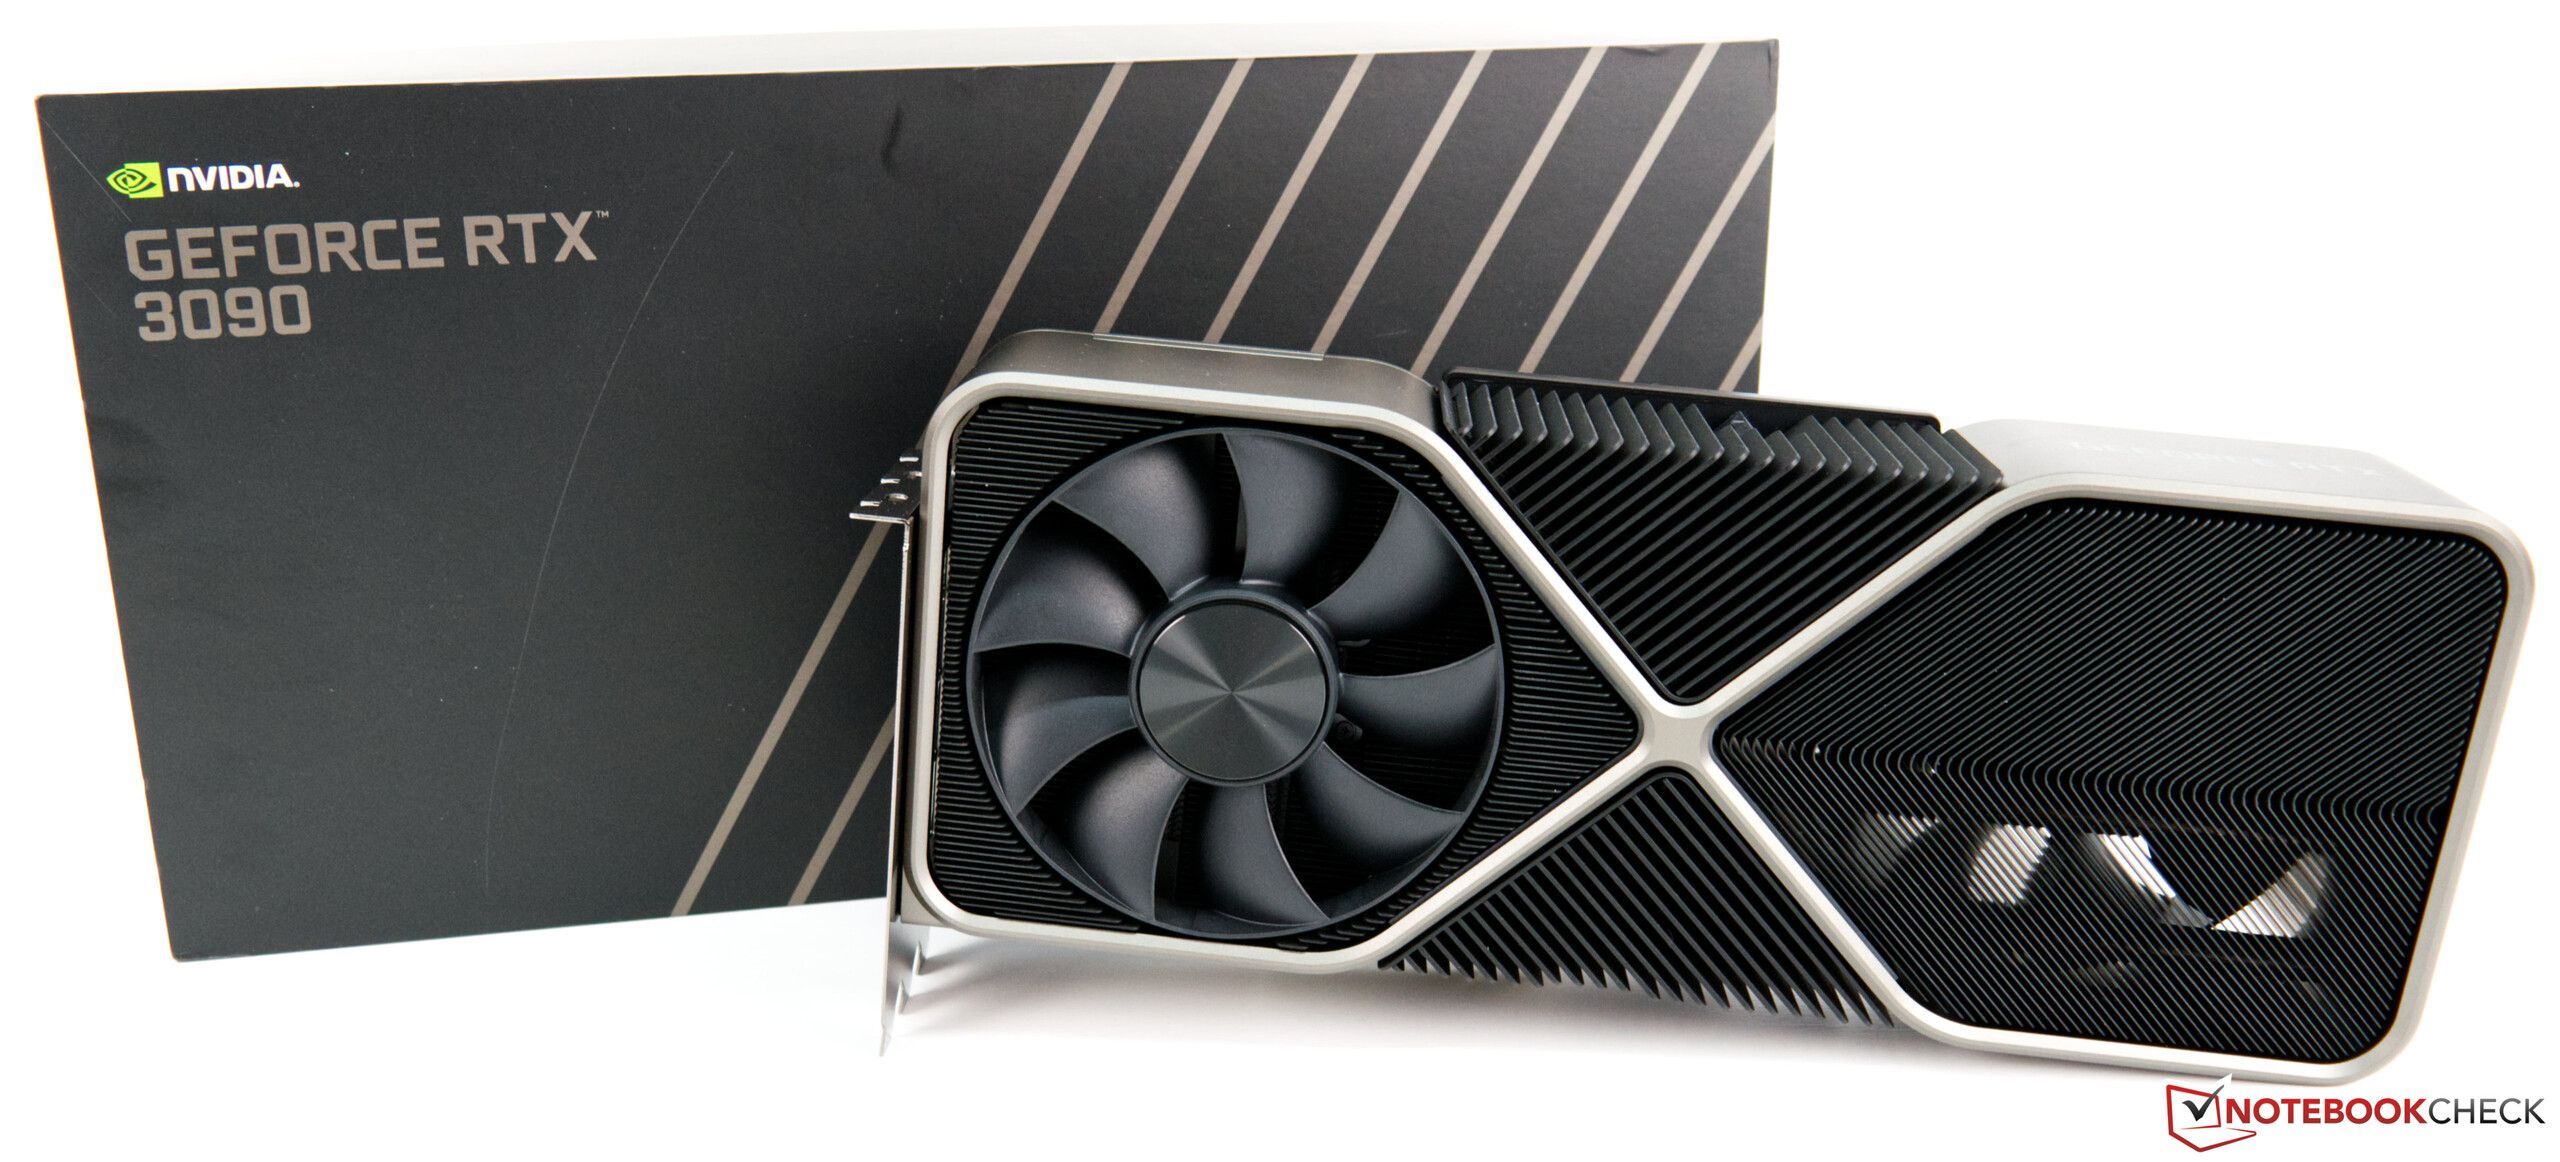
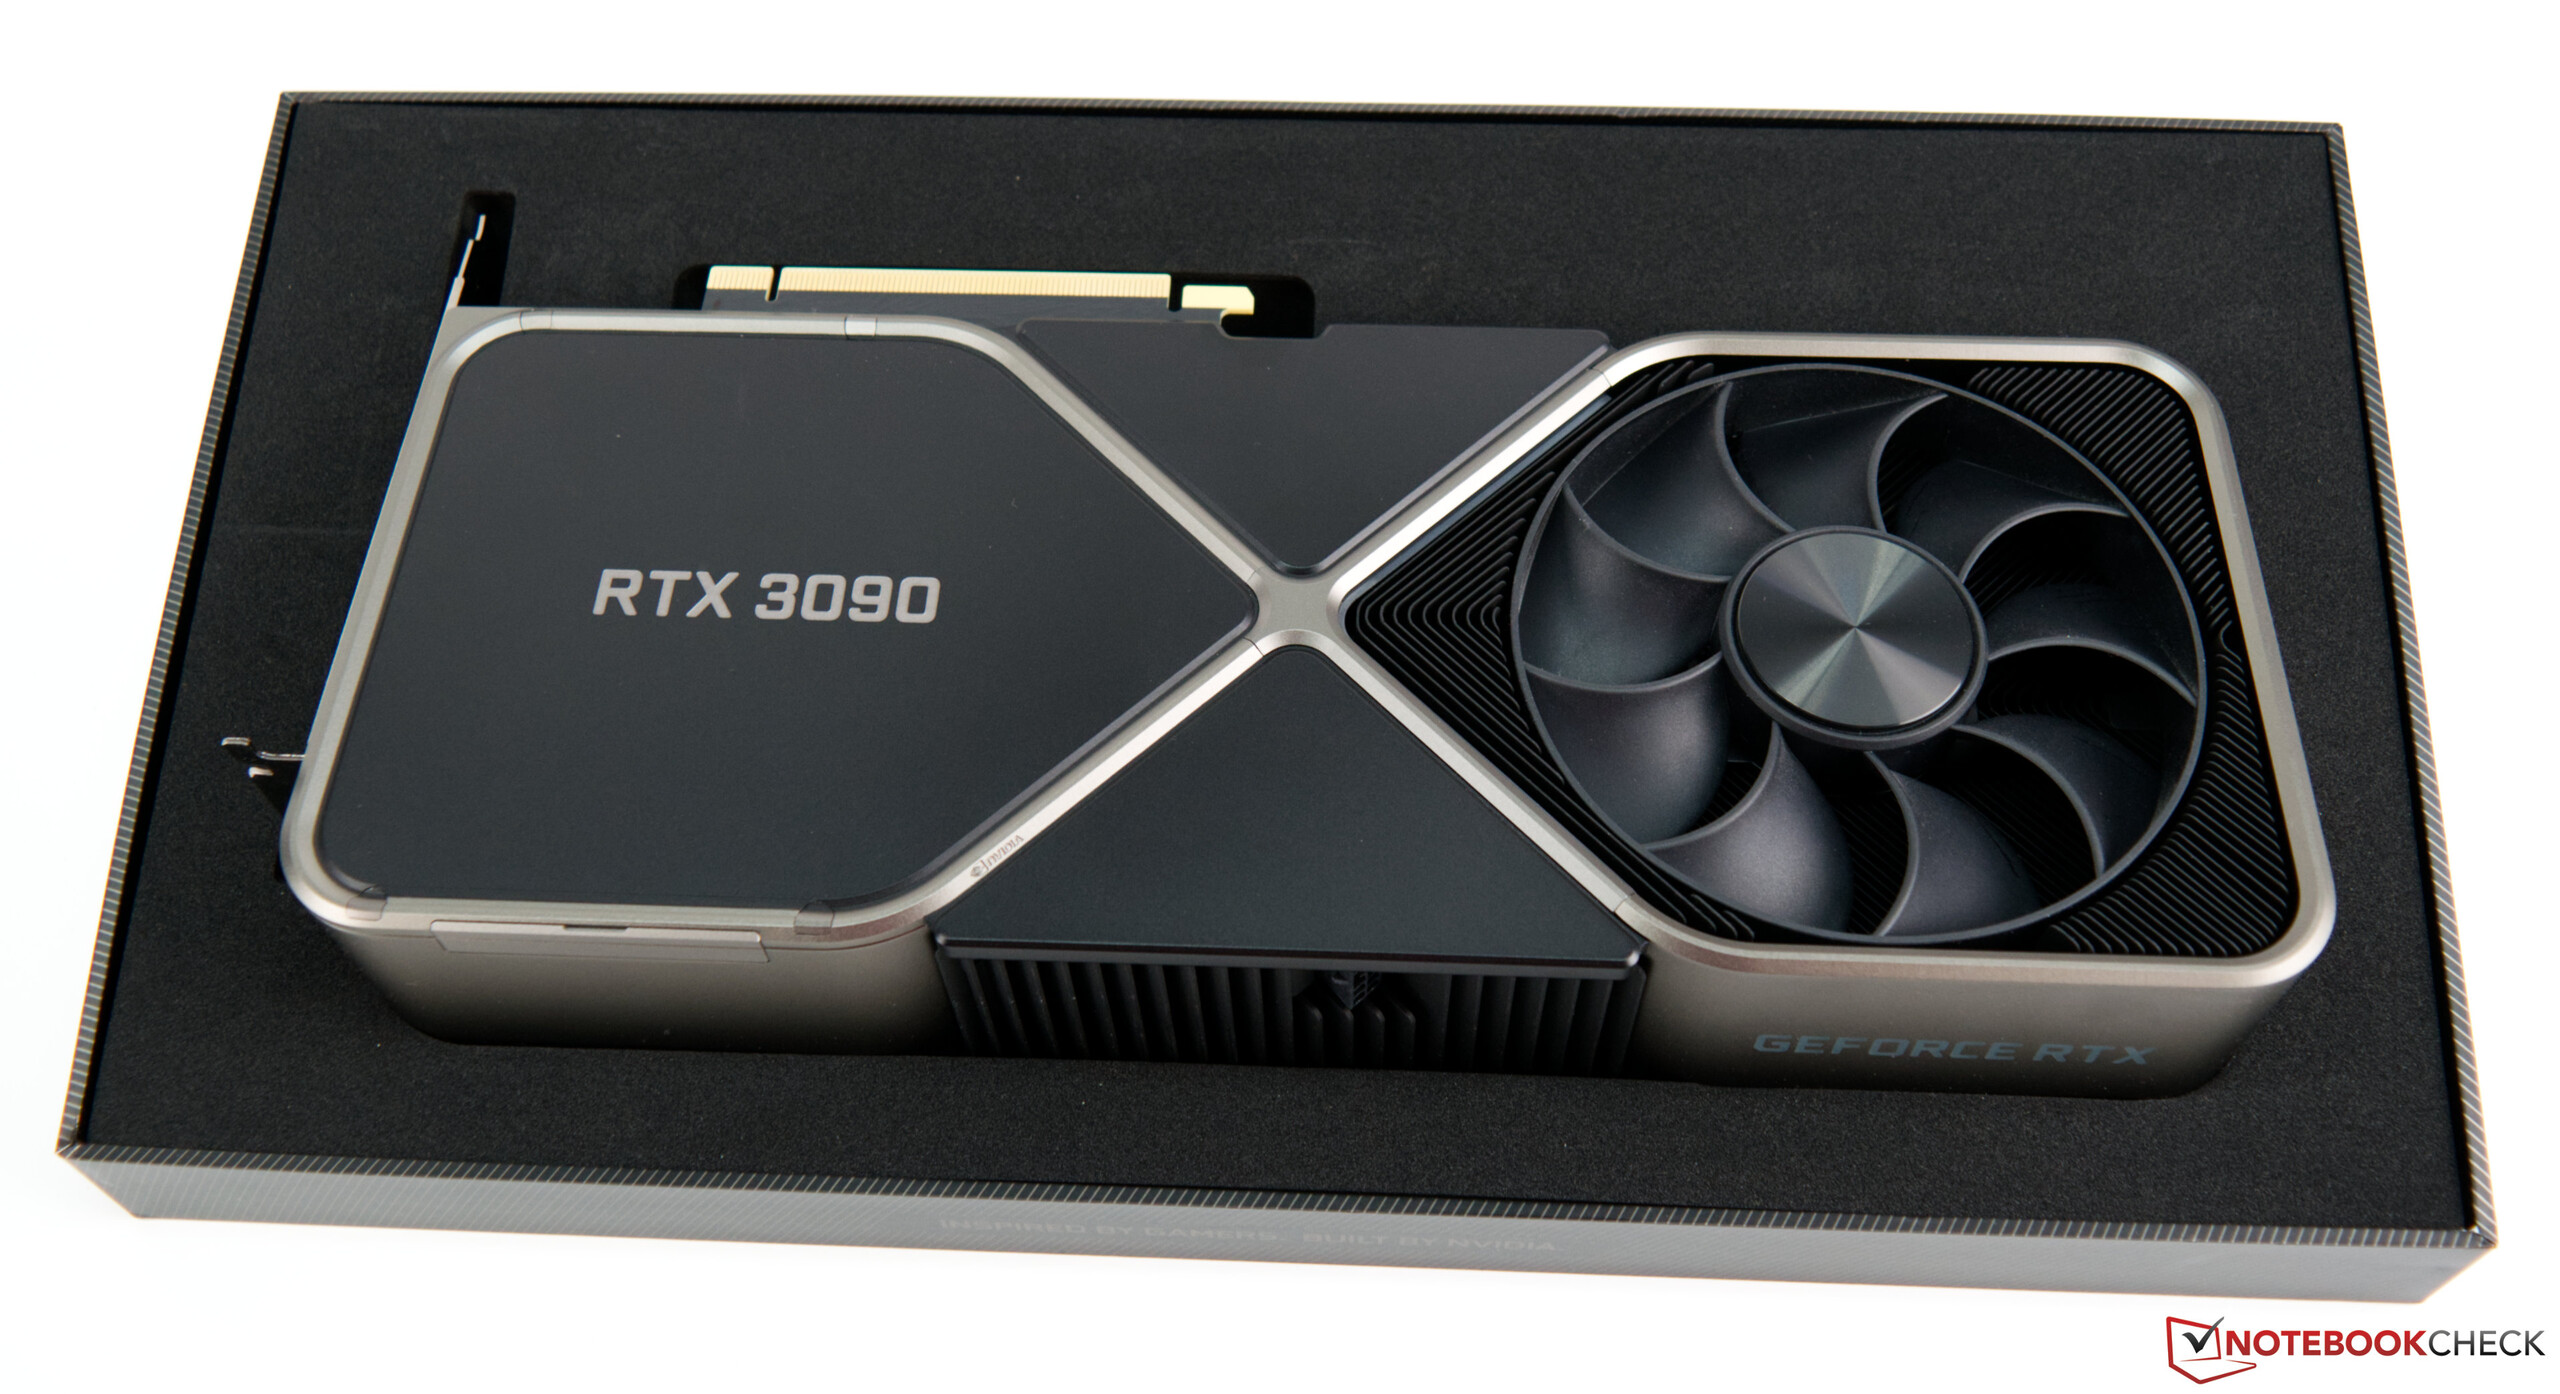
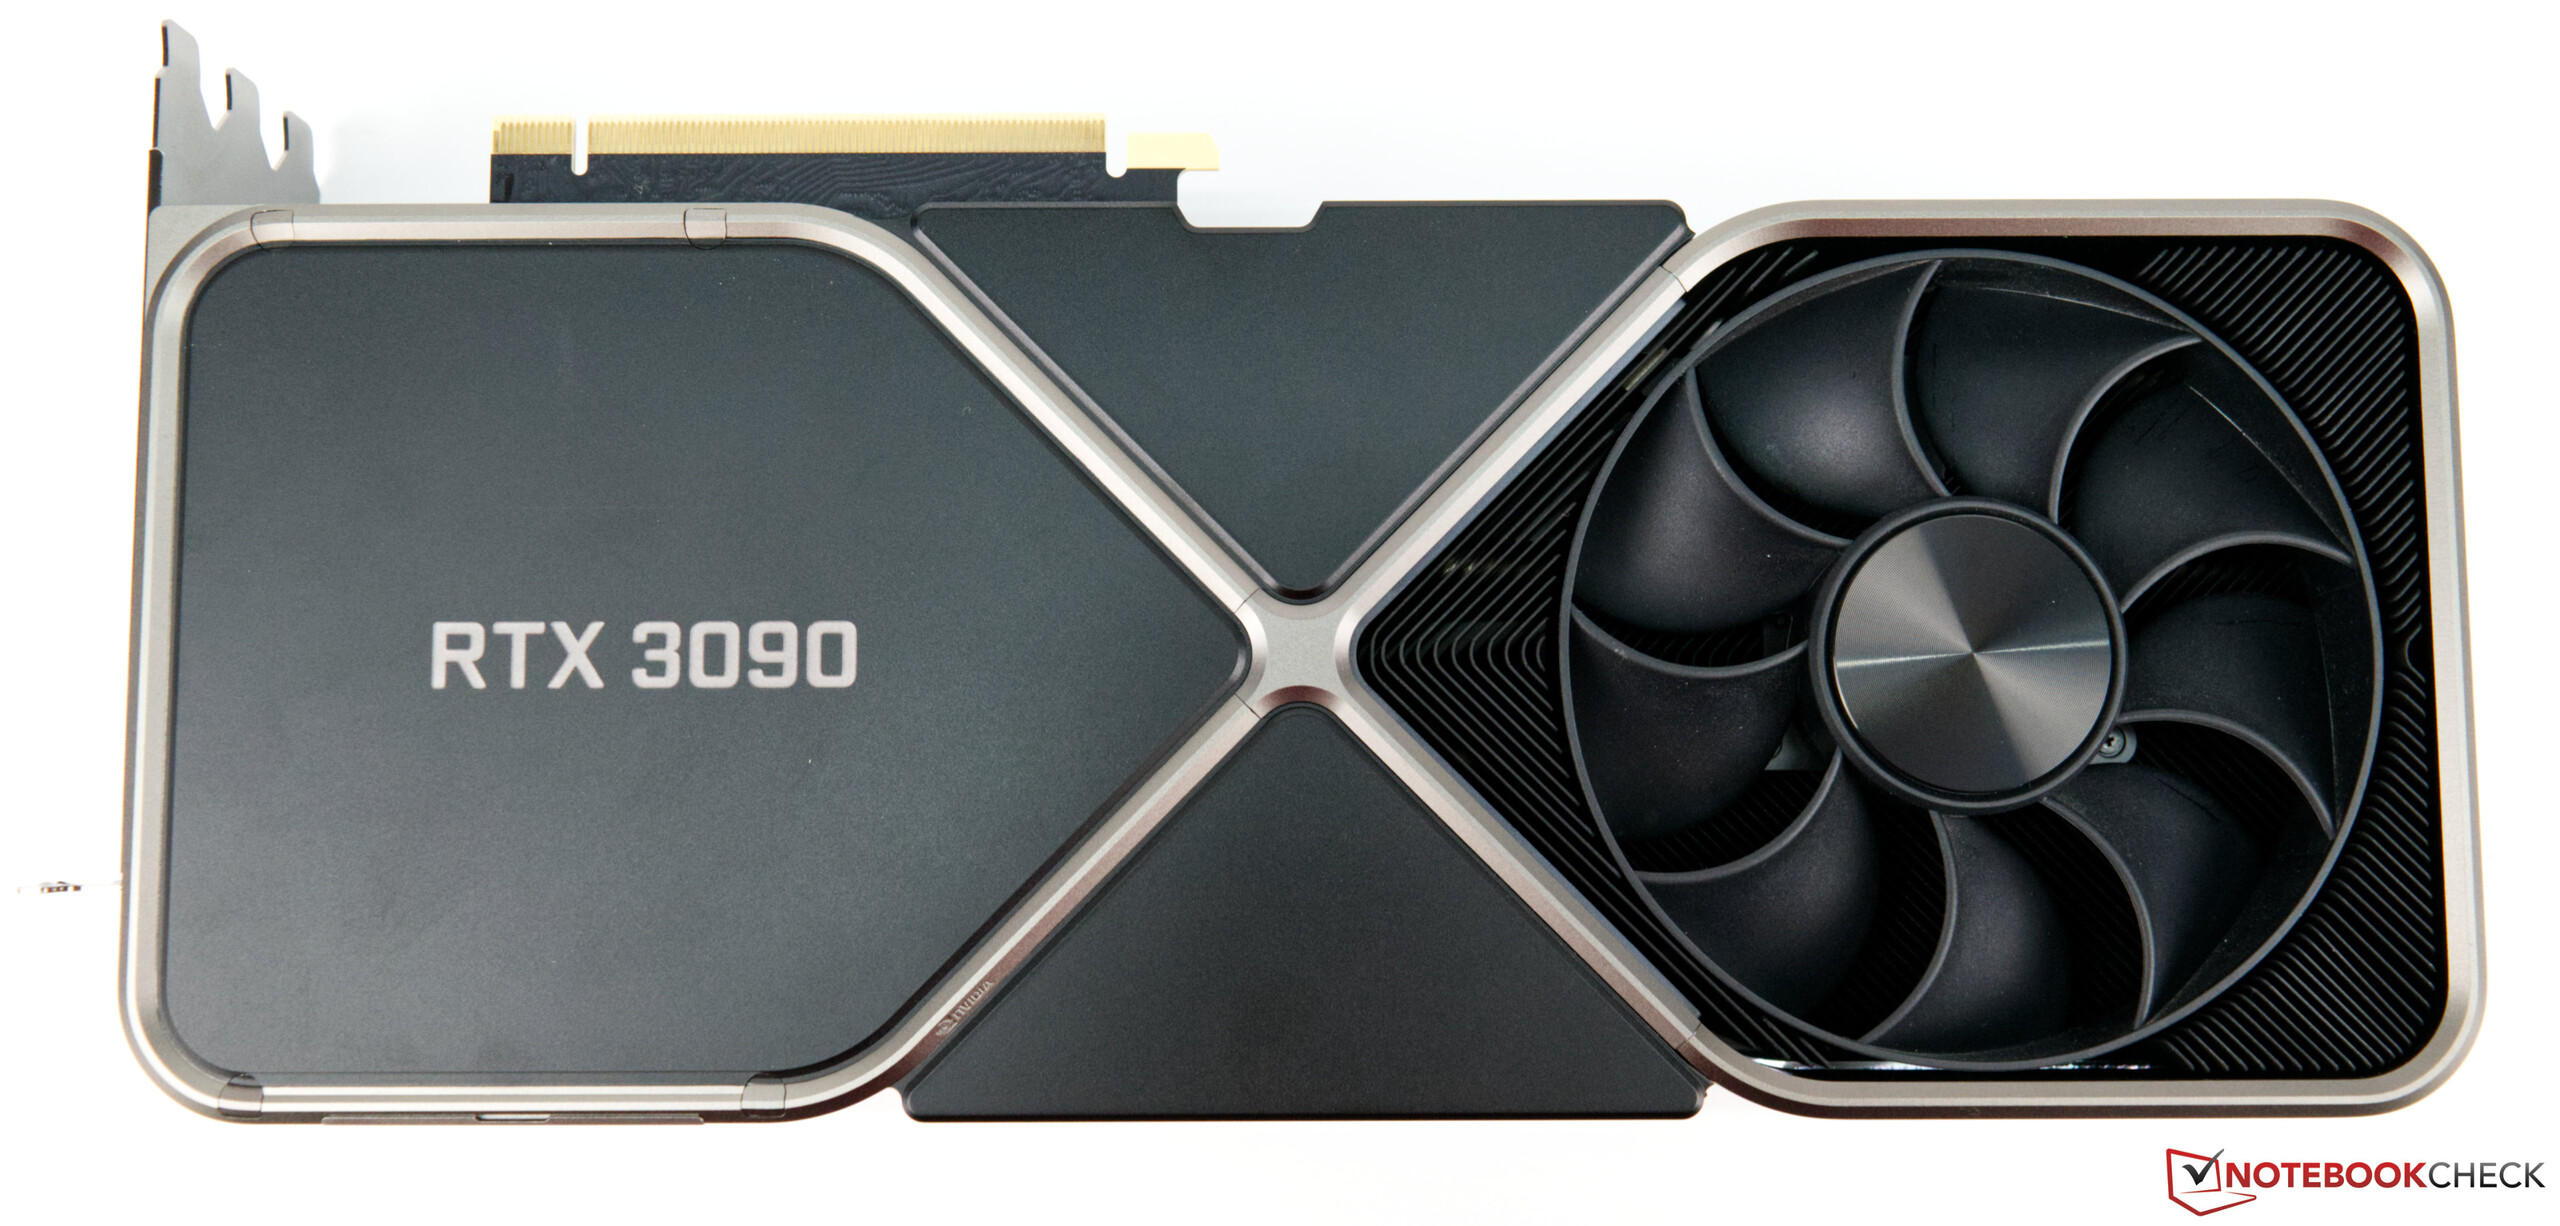
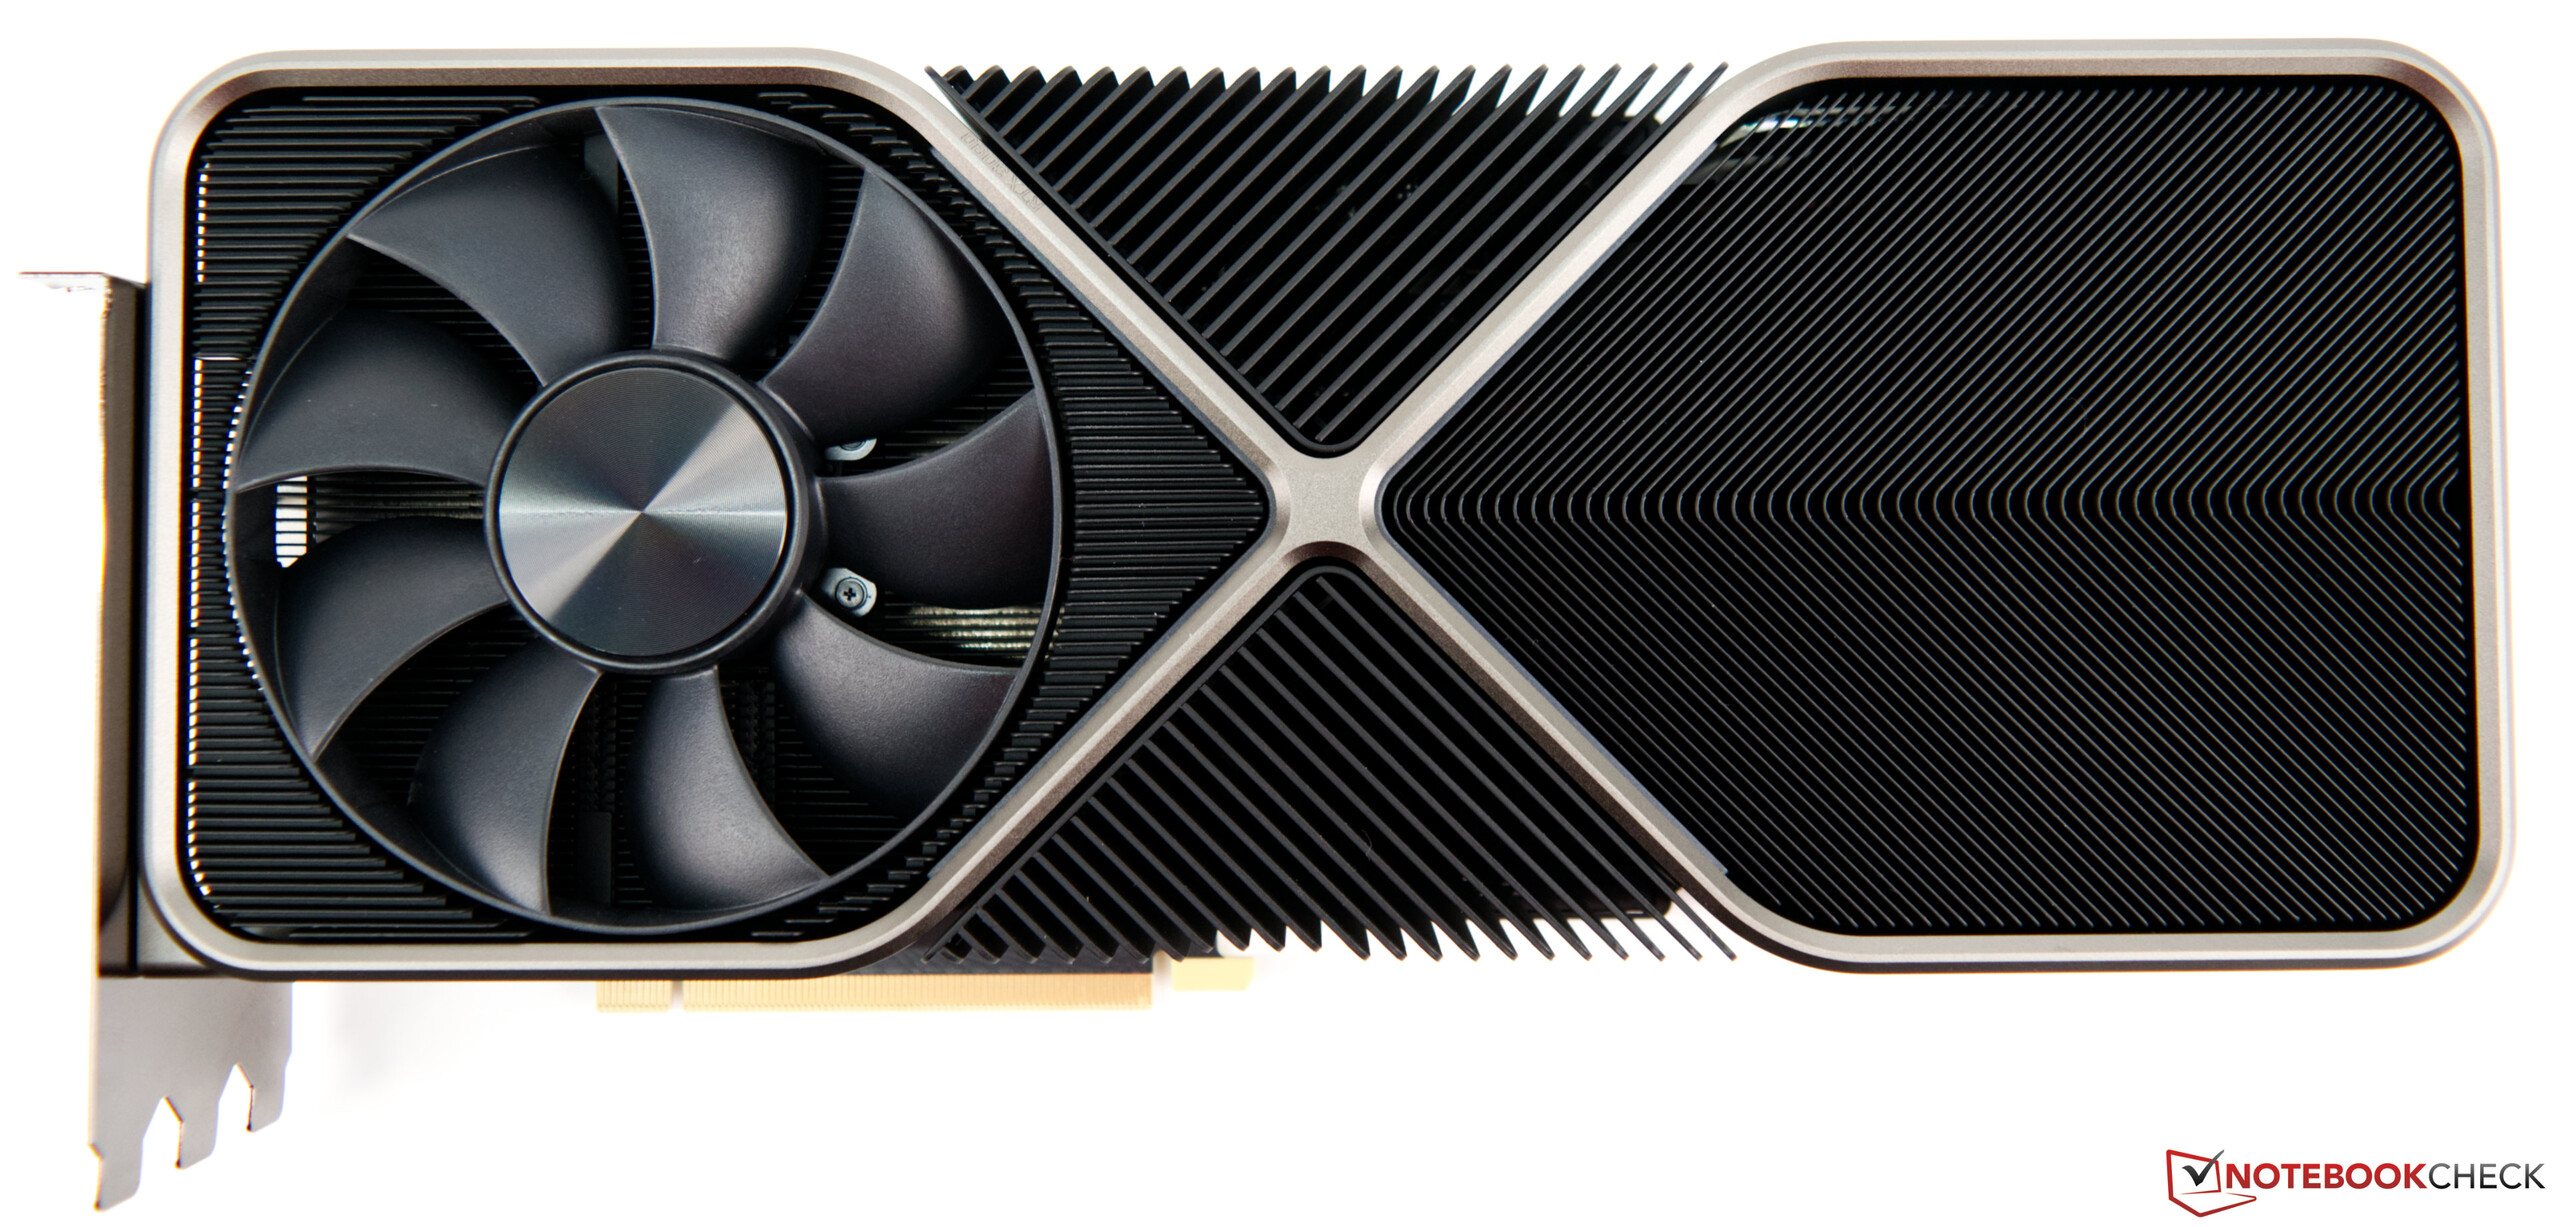
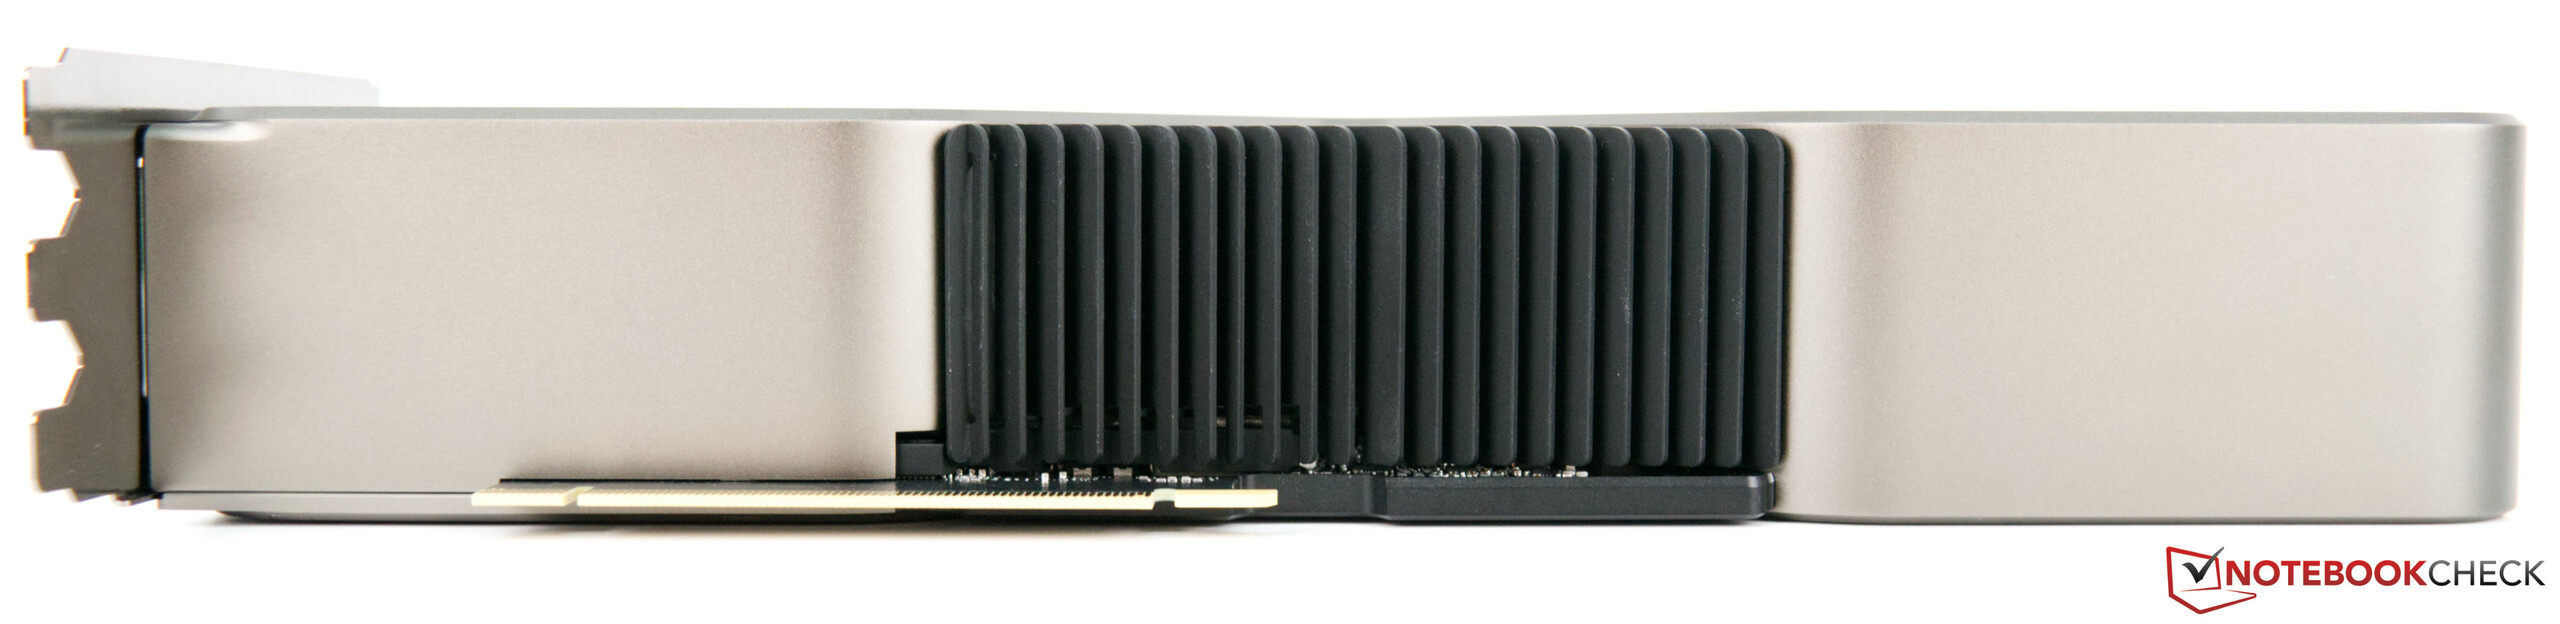
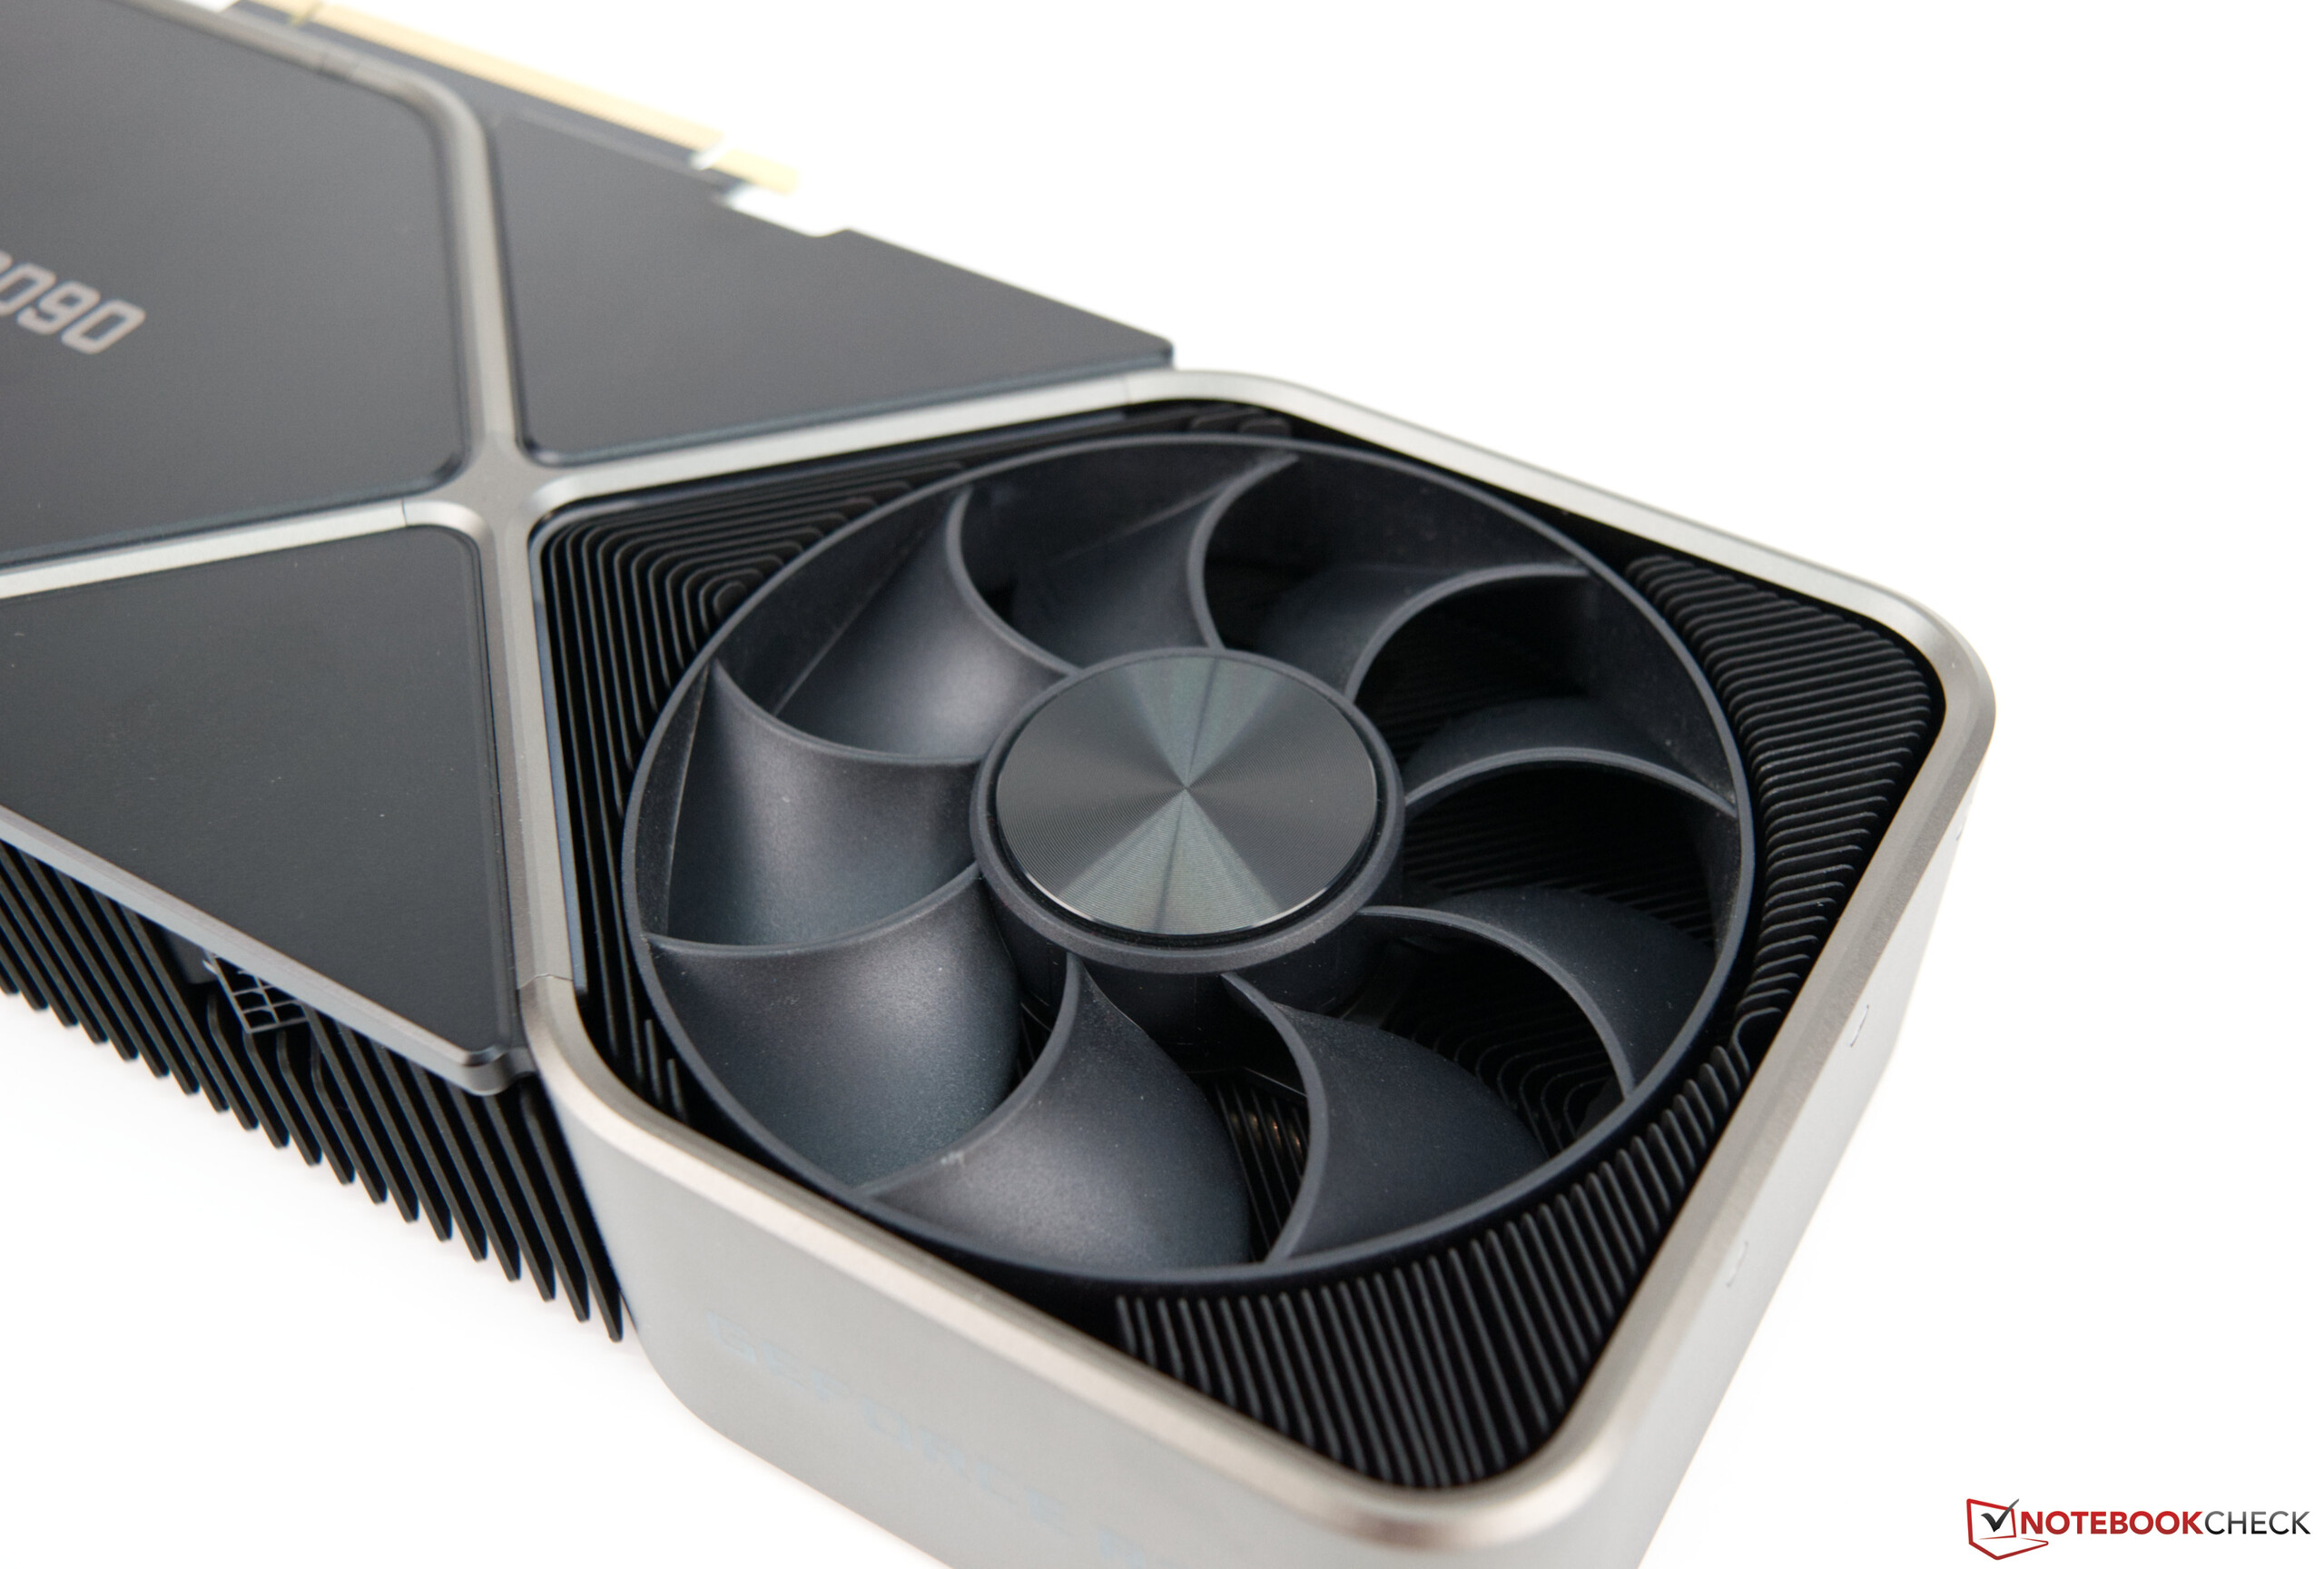
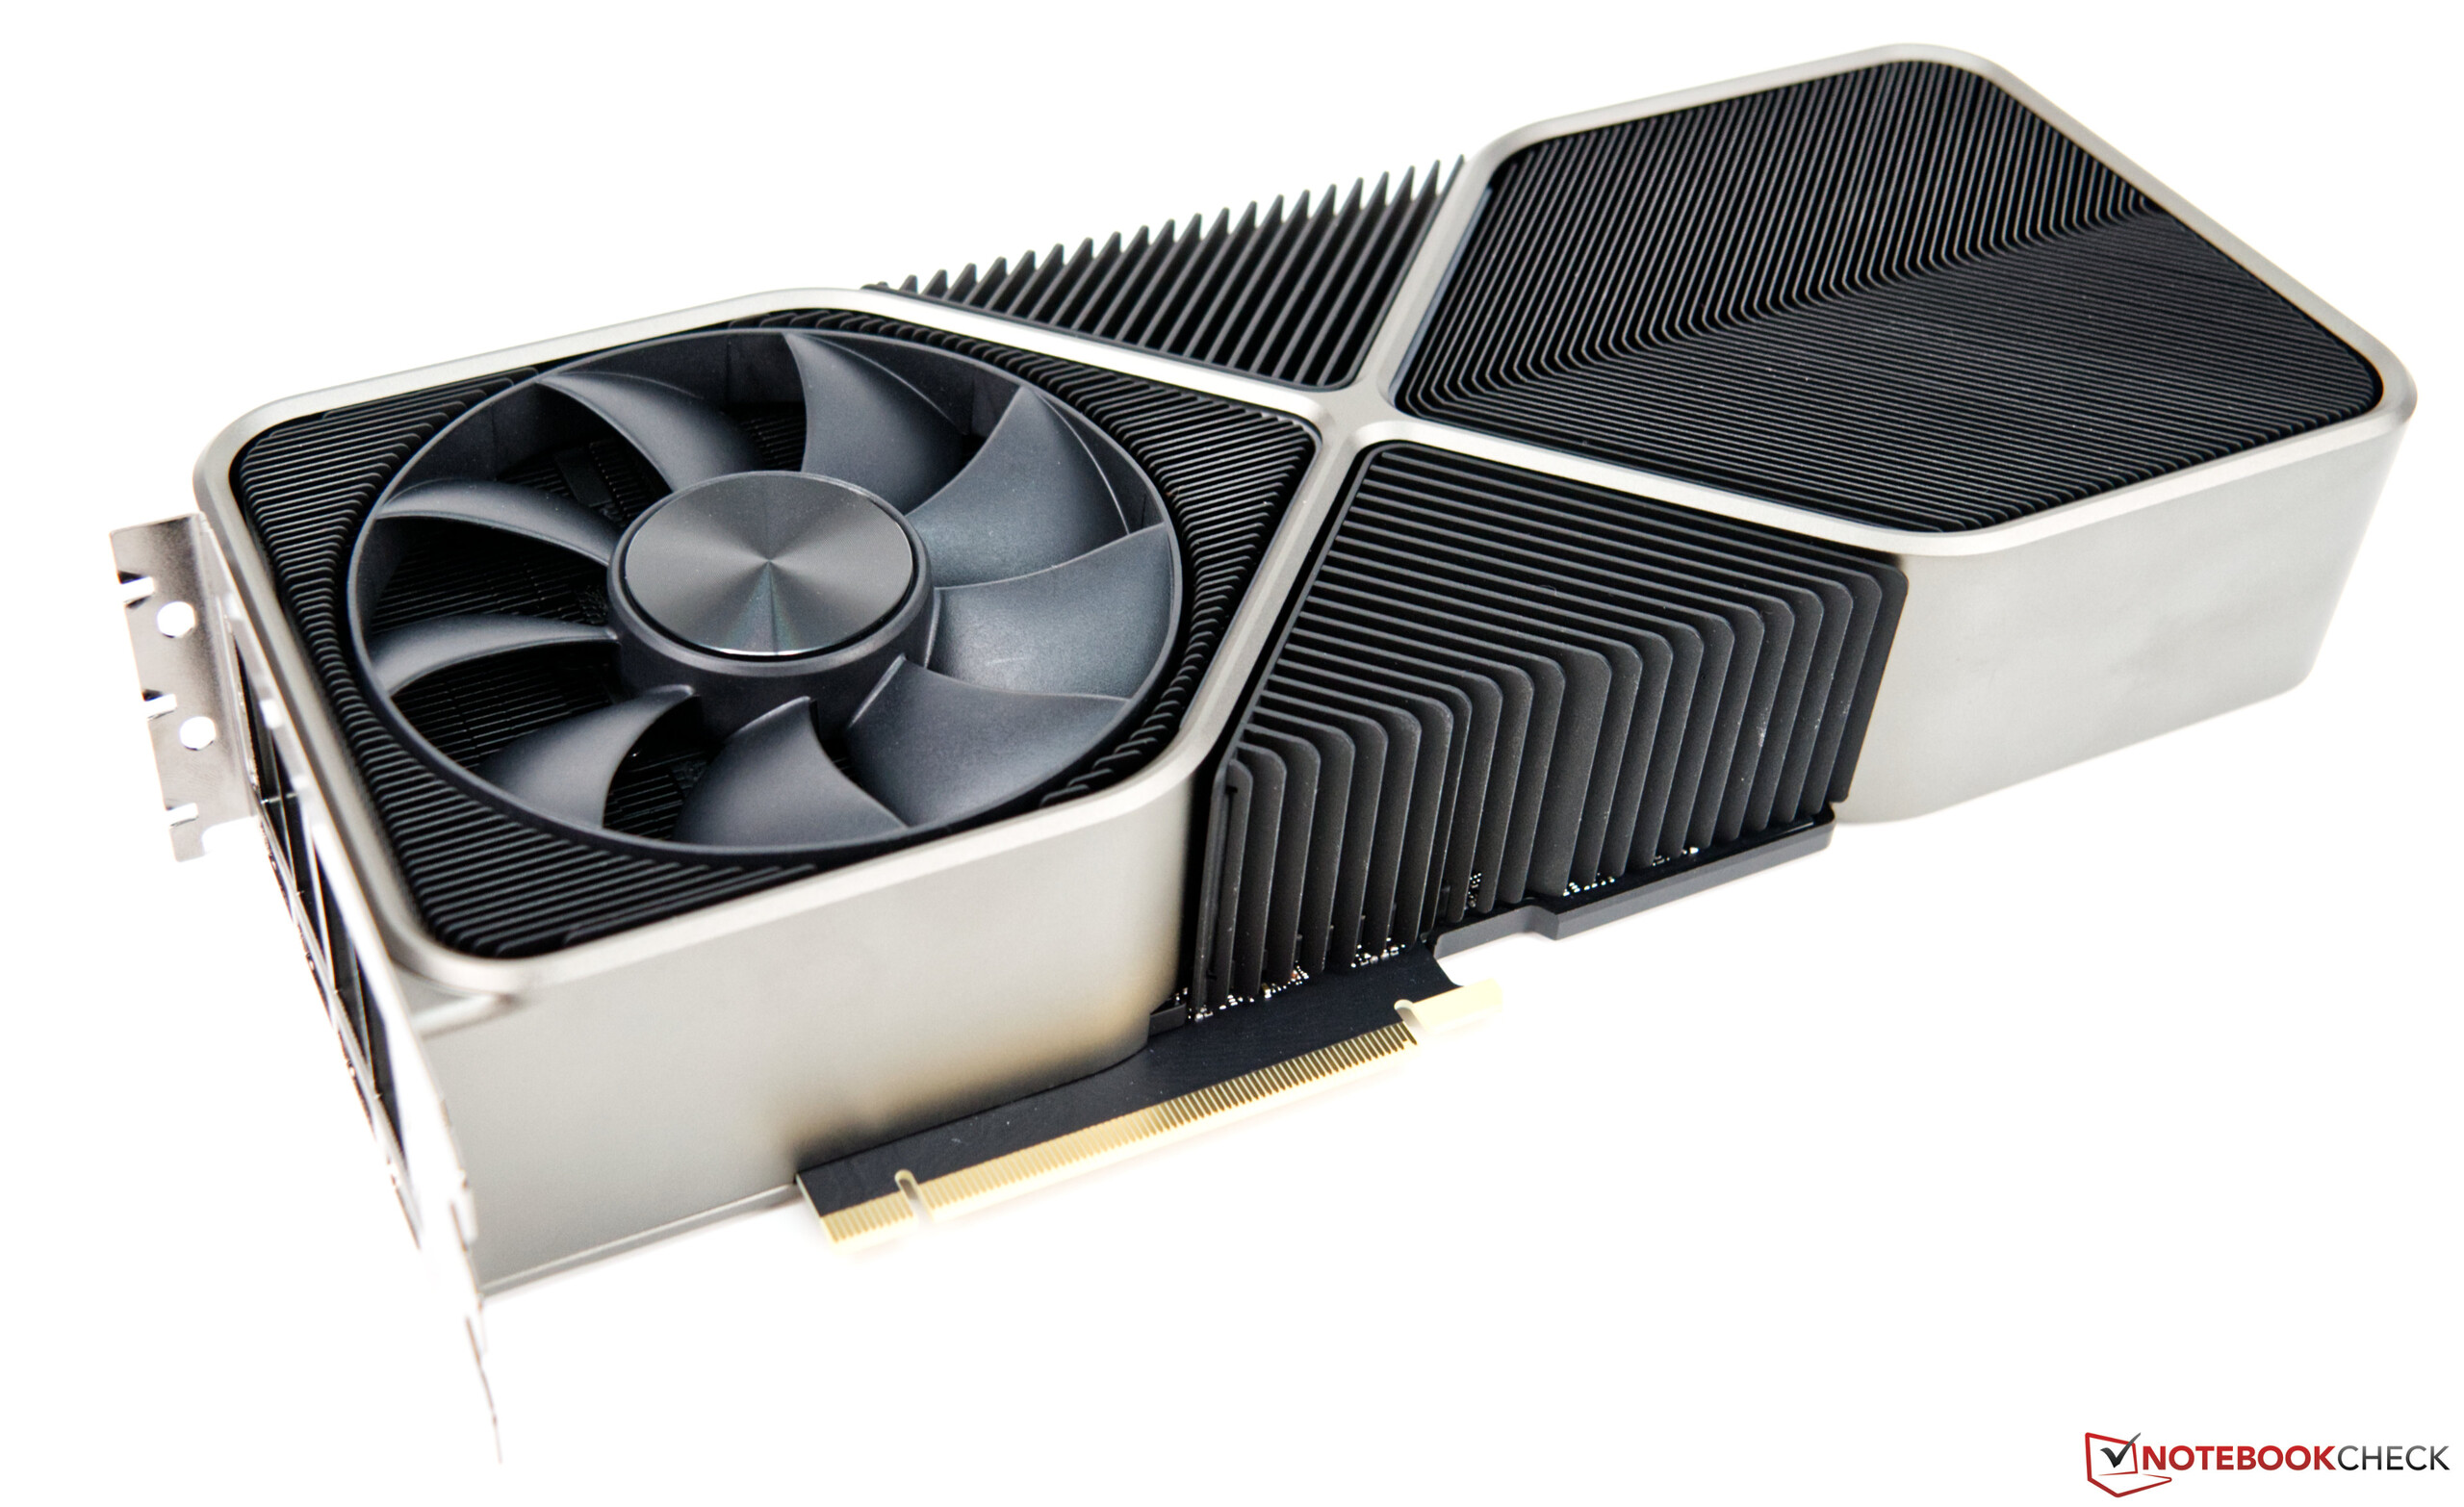
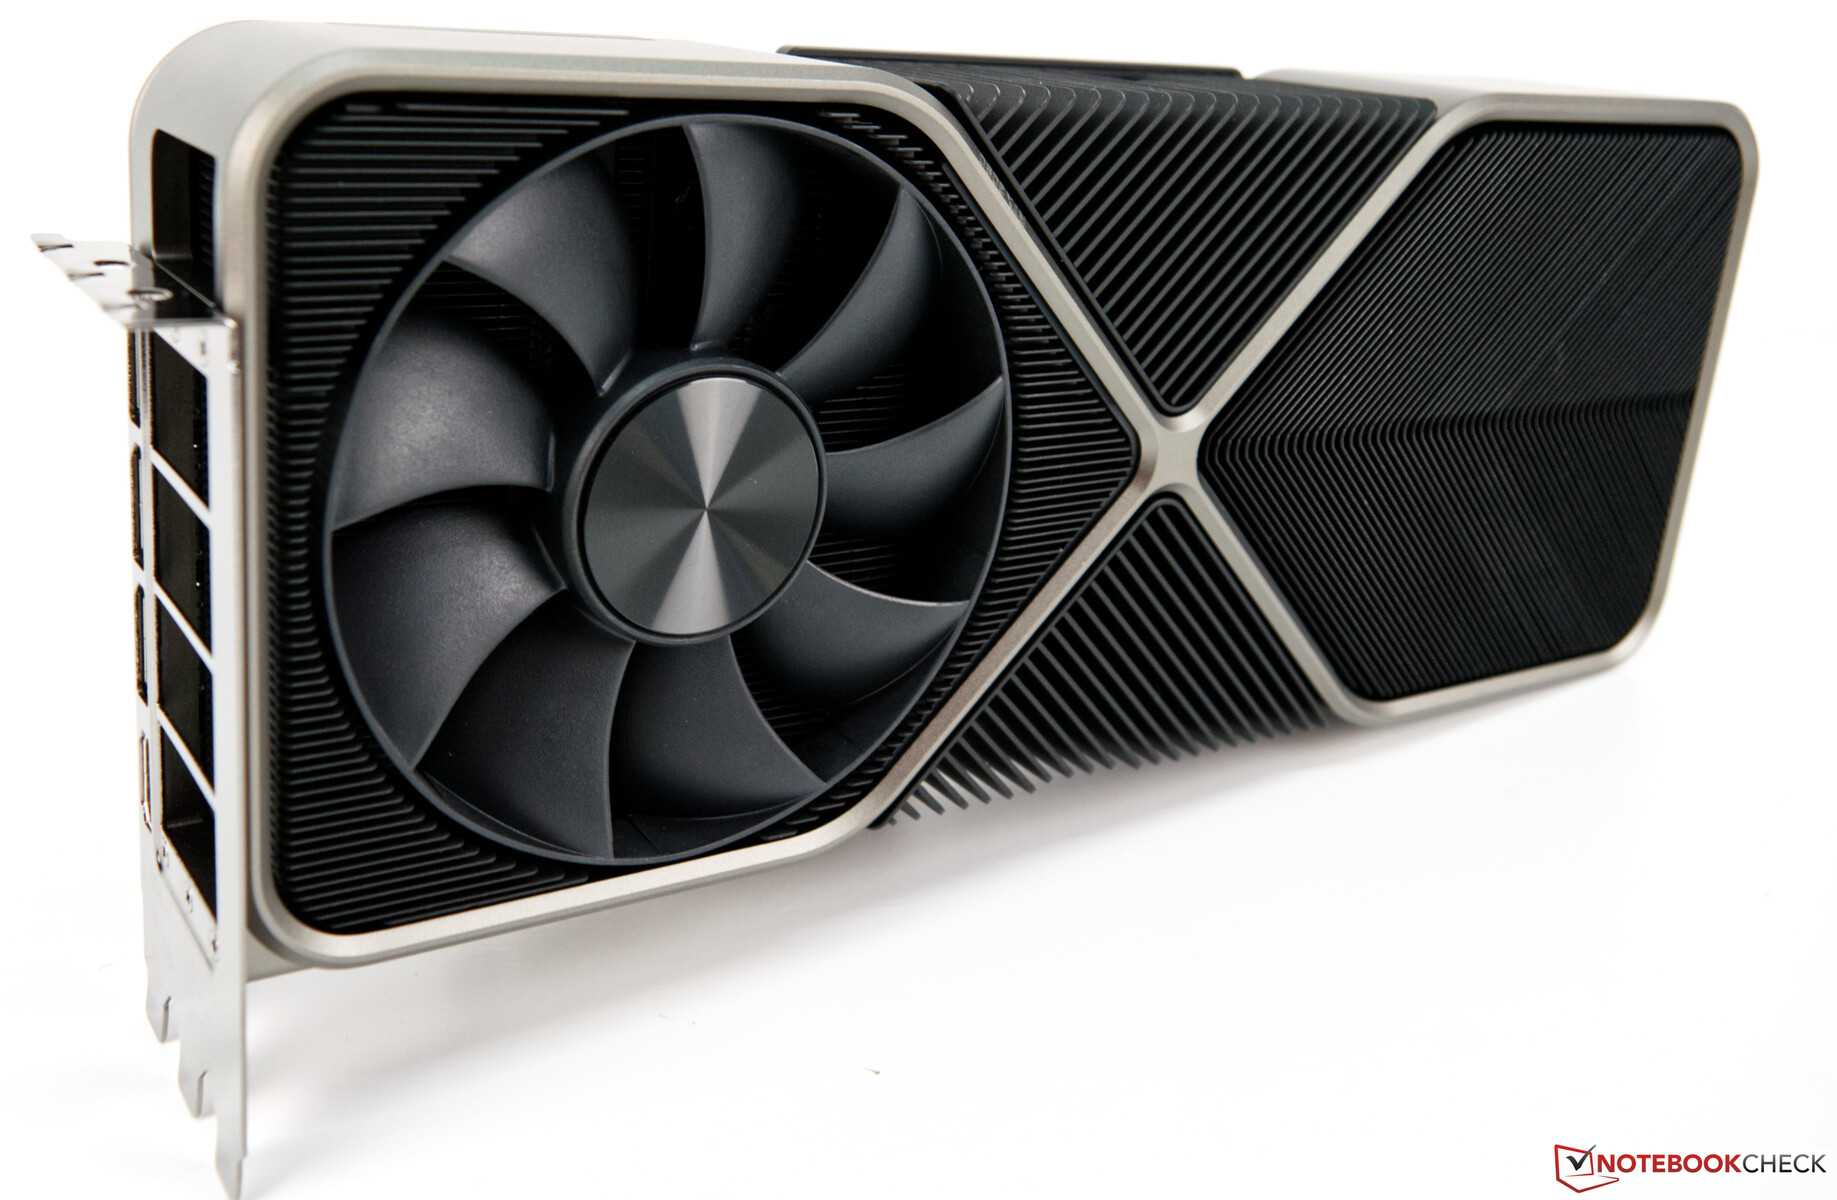
Nvidia si discosta chiaramente dal design di riferimento delle schede RTX 2000 in termini di progettazione del raffreddamento. L'unità di raffreddamento è stata sviluppata da zero, e anche tre slot sono occupati nella GeForce RTX 3090. In cambio, offre finalmente una modalità fan-stop, che riduce significativamente la rumorosità in modalità 2D. Nvidia mette anche una ventola assiale per lato, qualcosa che non avevamo visto in questa forma prima. Le grandi ventole da 110 millimetri spingono molta aria attraverso le alette di raffreddamento che sono distribuite su tutta la lunghezza della scheda grafica. Questo fornisce una superficie di raffreddamento molto grande per dissipare rapidamente la perdita di potenza dei 350 watt. La Nvidia GeForce RTX 3090 pesa ben 2 chilogrammi. Se installate la scheda grafica orizzontalmente nel vostro sistema, dovreste considerare un supporto. Lo slot PCI vi ringrazierà! A differenza della MSI GeForce RTX 3090 Suprim X Nvidia non include un supporto per la scheda grafica con il suo modello.
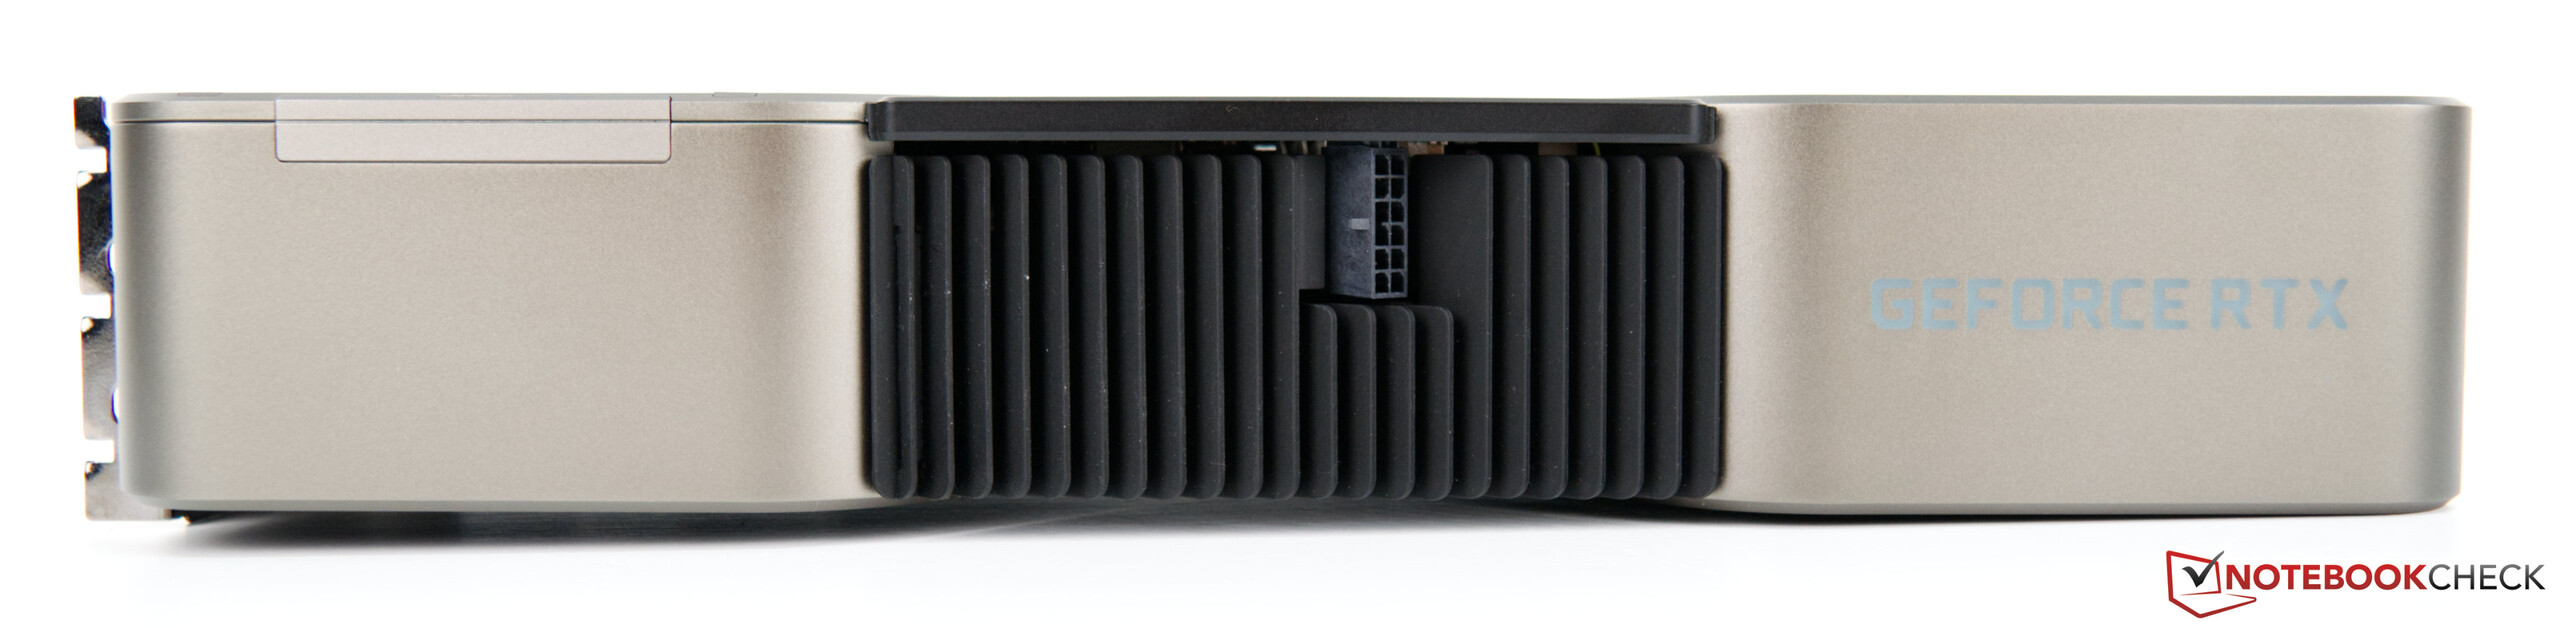
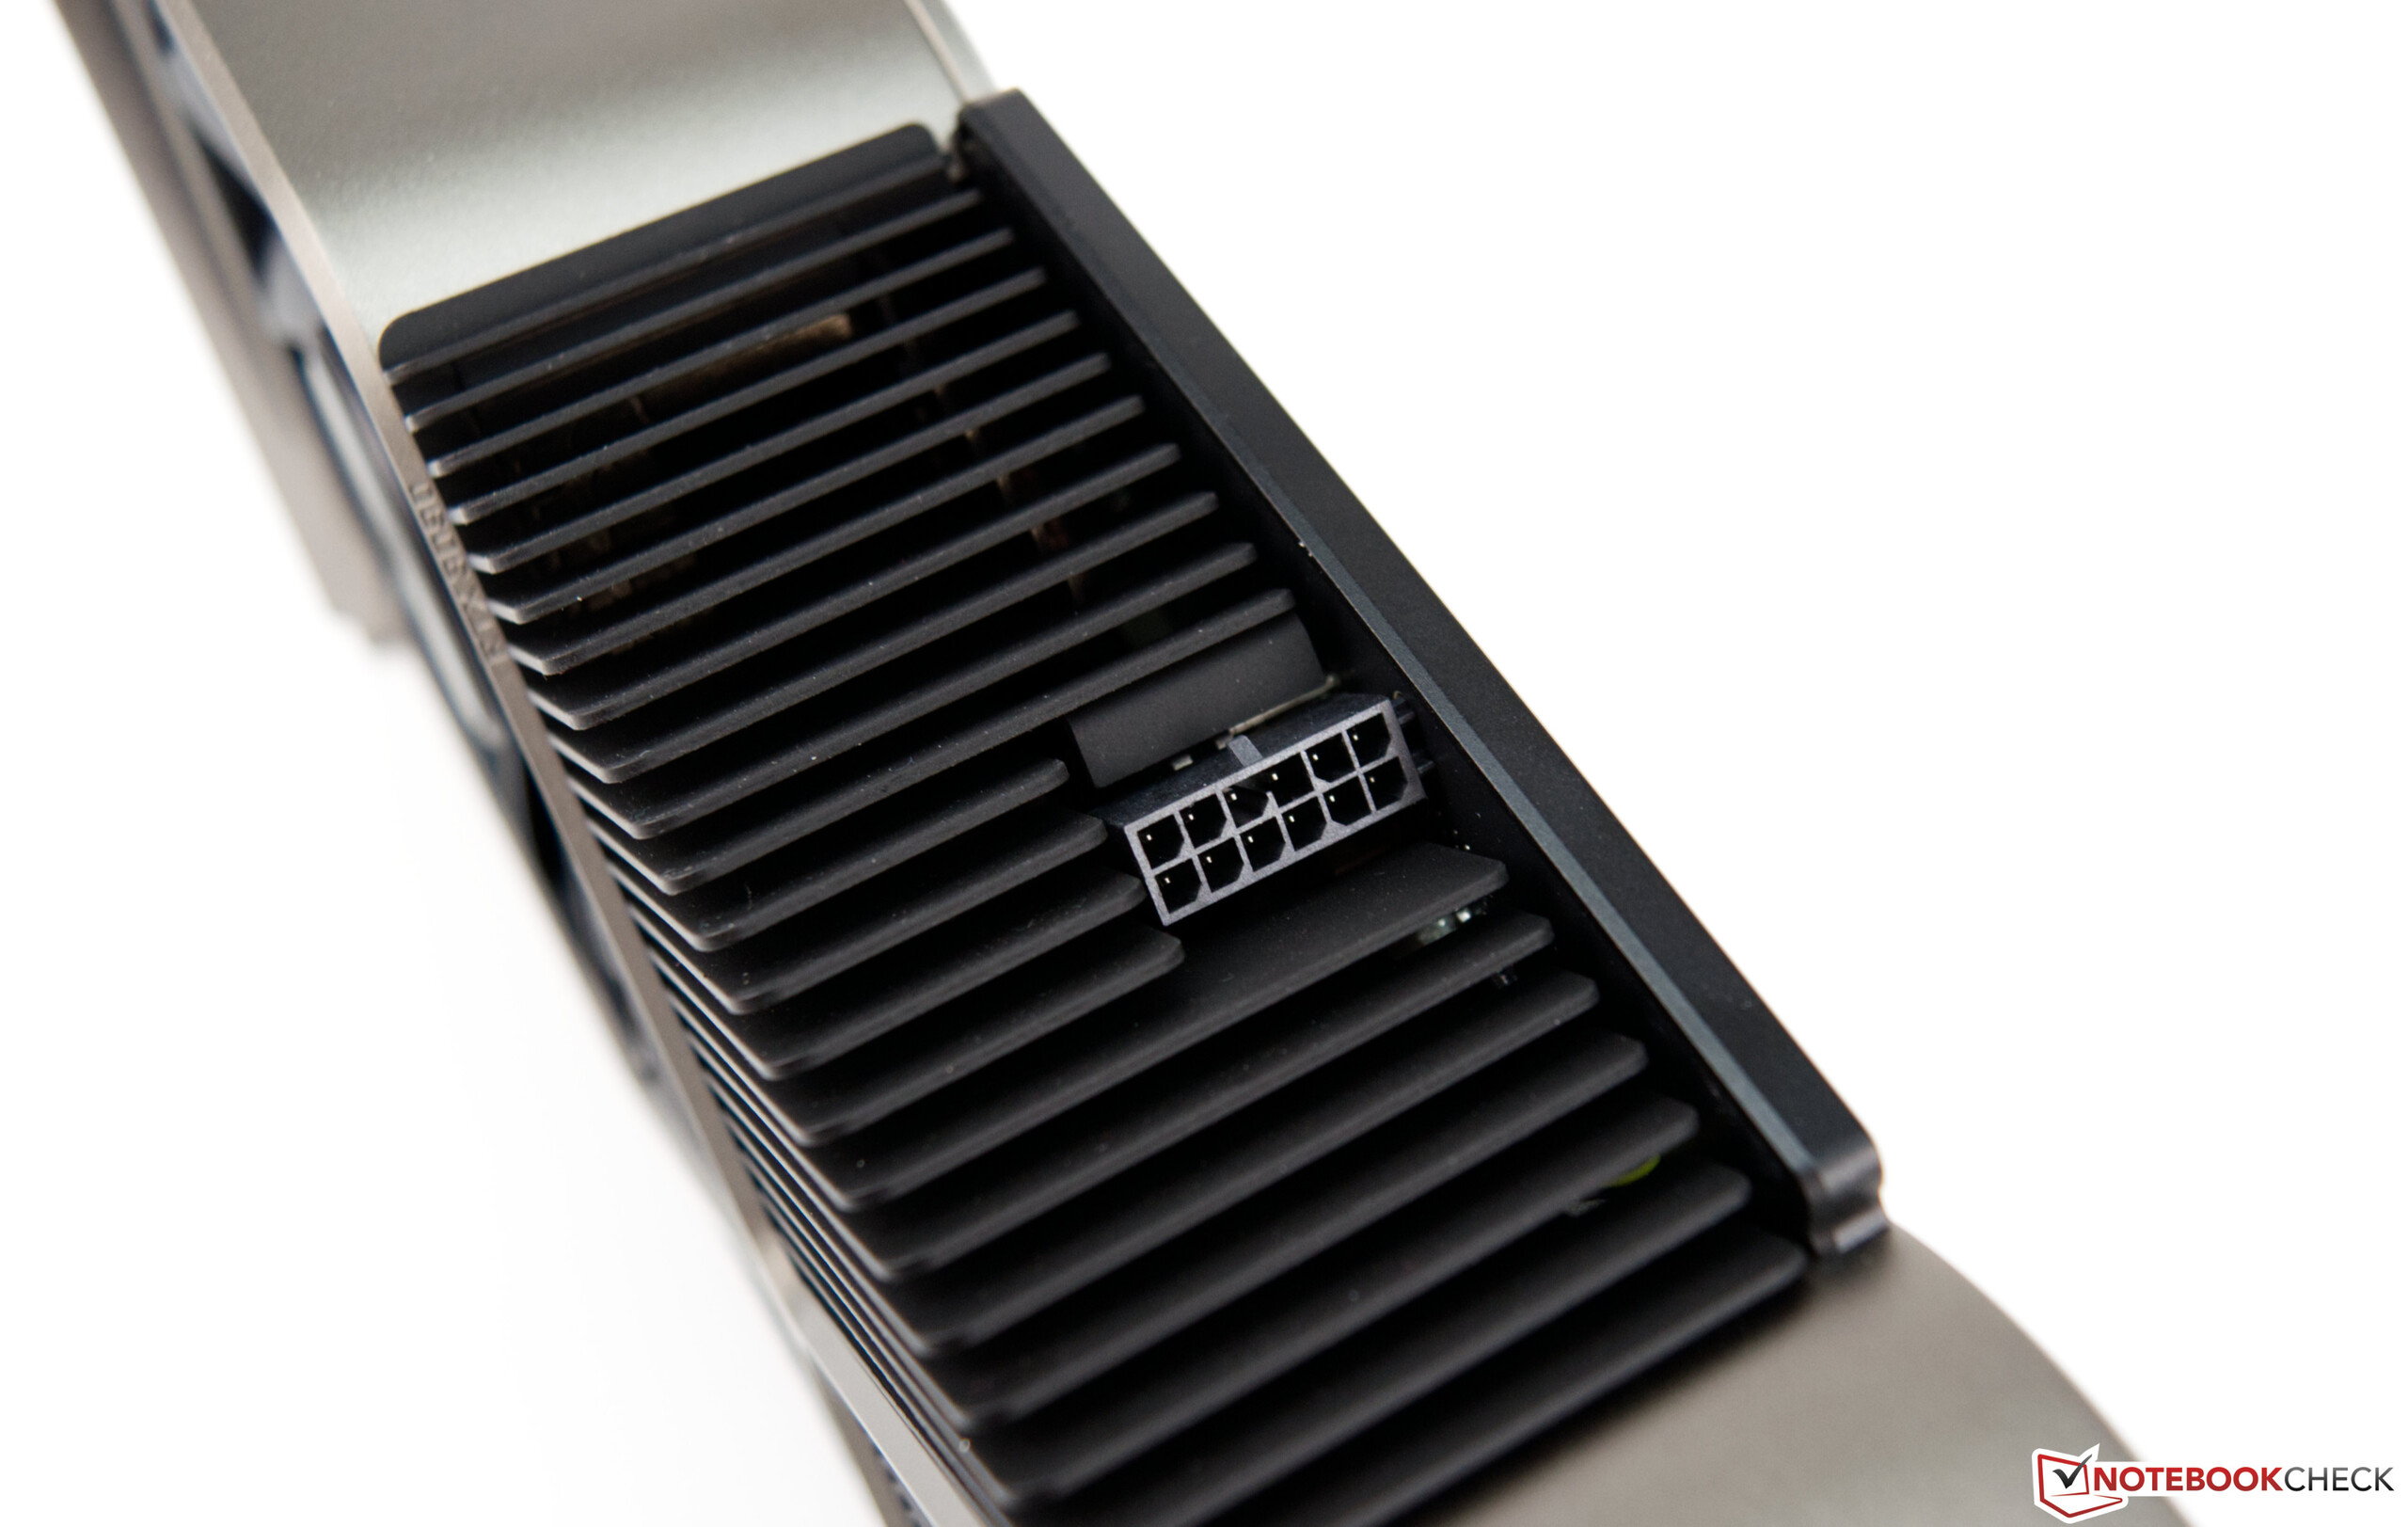
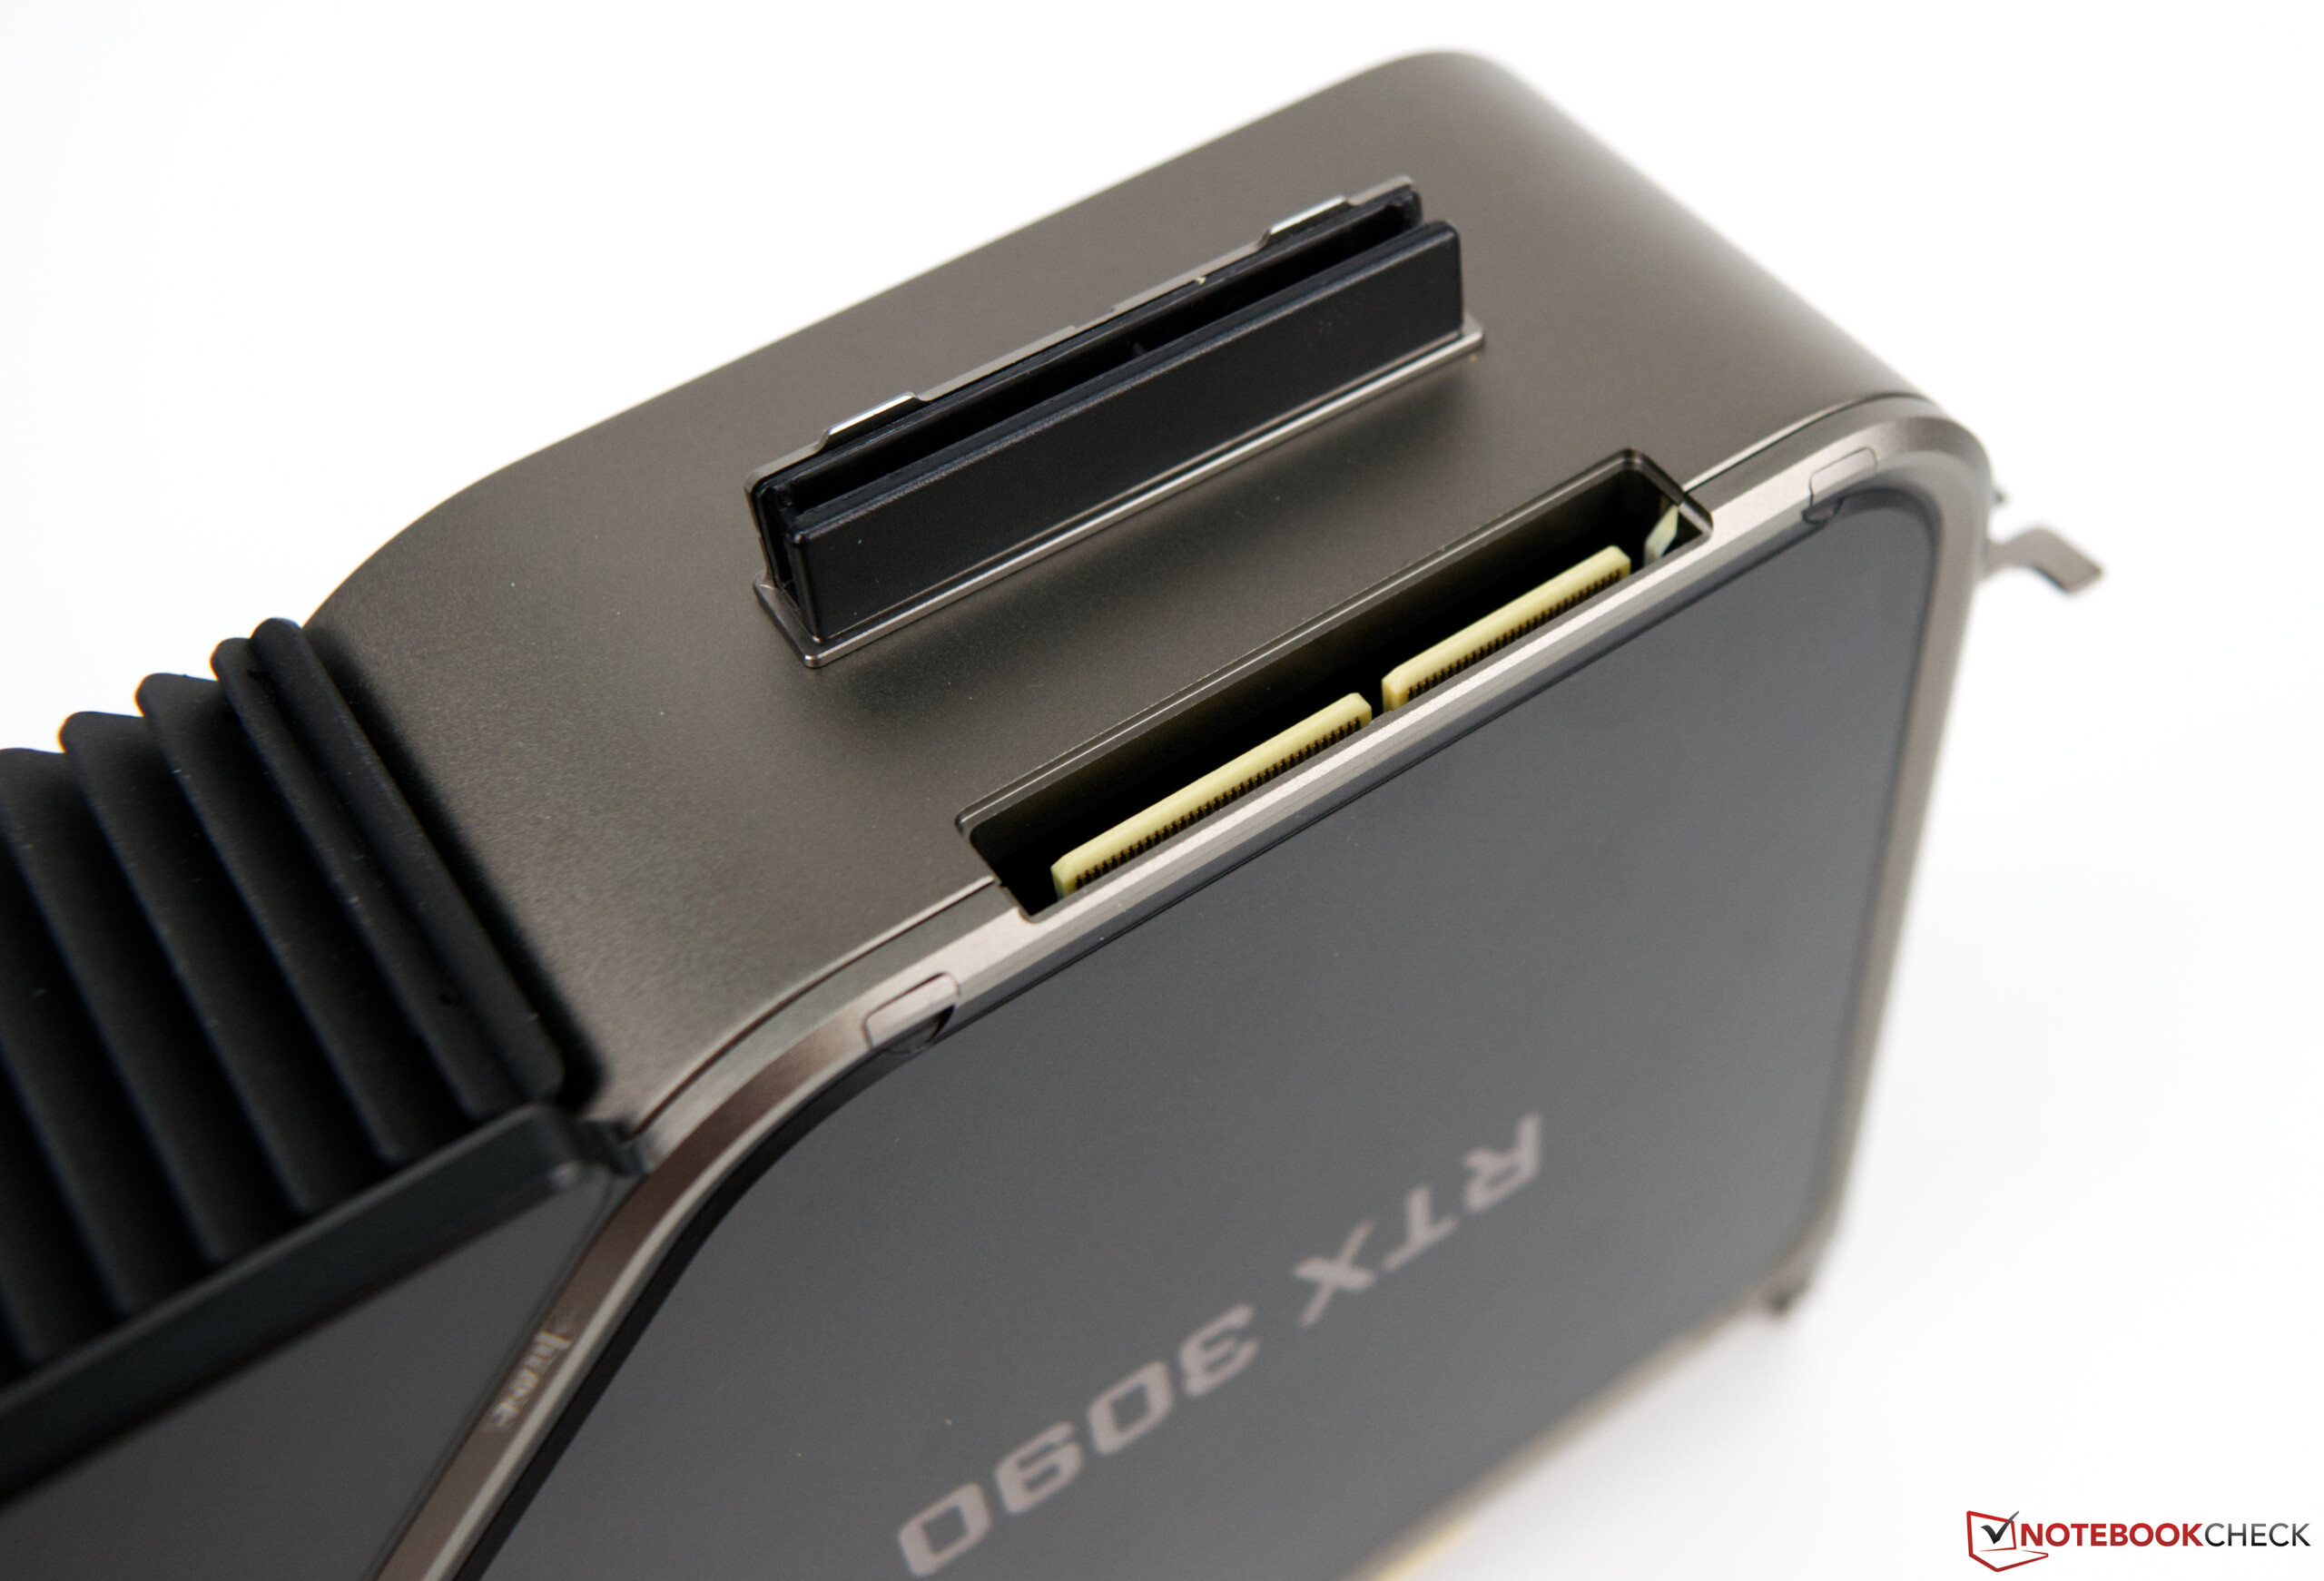
Un'altra nuova caratteristica è il connettore di alimentazione a 12-pin. Questo sostituisce i precedenti 2x connettori a 8 pin. Tuttavia, a nostro parere, il suo posizionamento non è molto ben progettato, perché coloro che utilizzano l'adattatore incluso avranno sempre un antiestetico groviglio di cavi davanti a loro nel loro campo visivo. Vari produttori di alimentatori hanno reagito e offrono cavi adatti ad essere usati l'adattatore incluso.
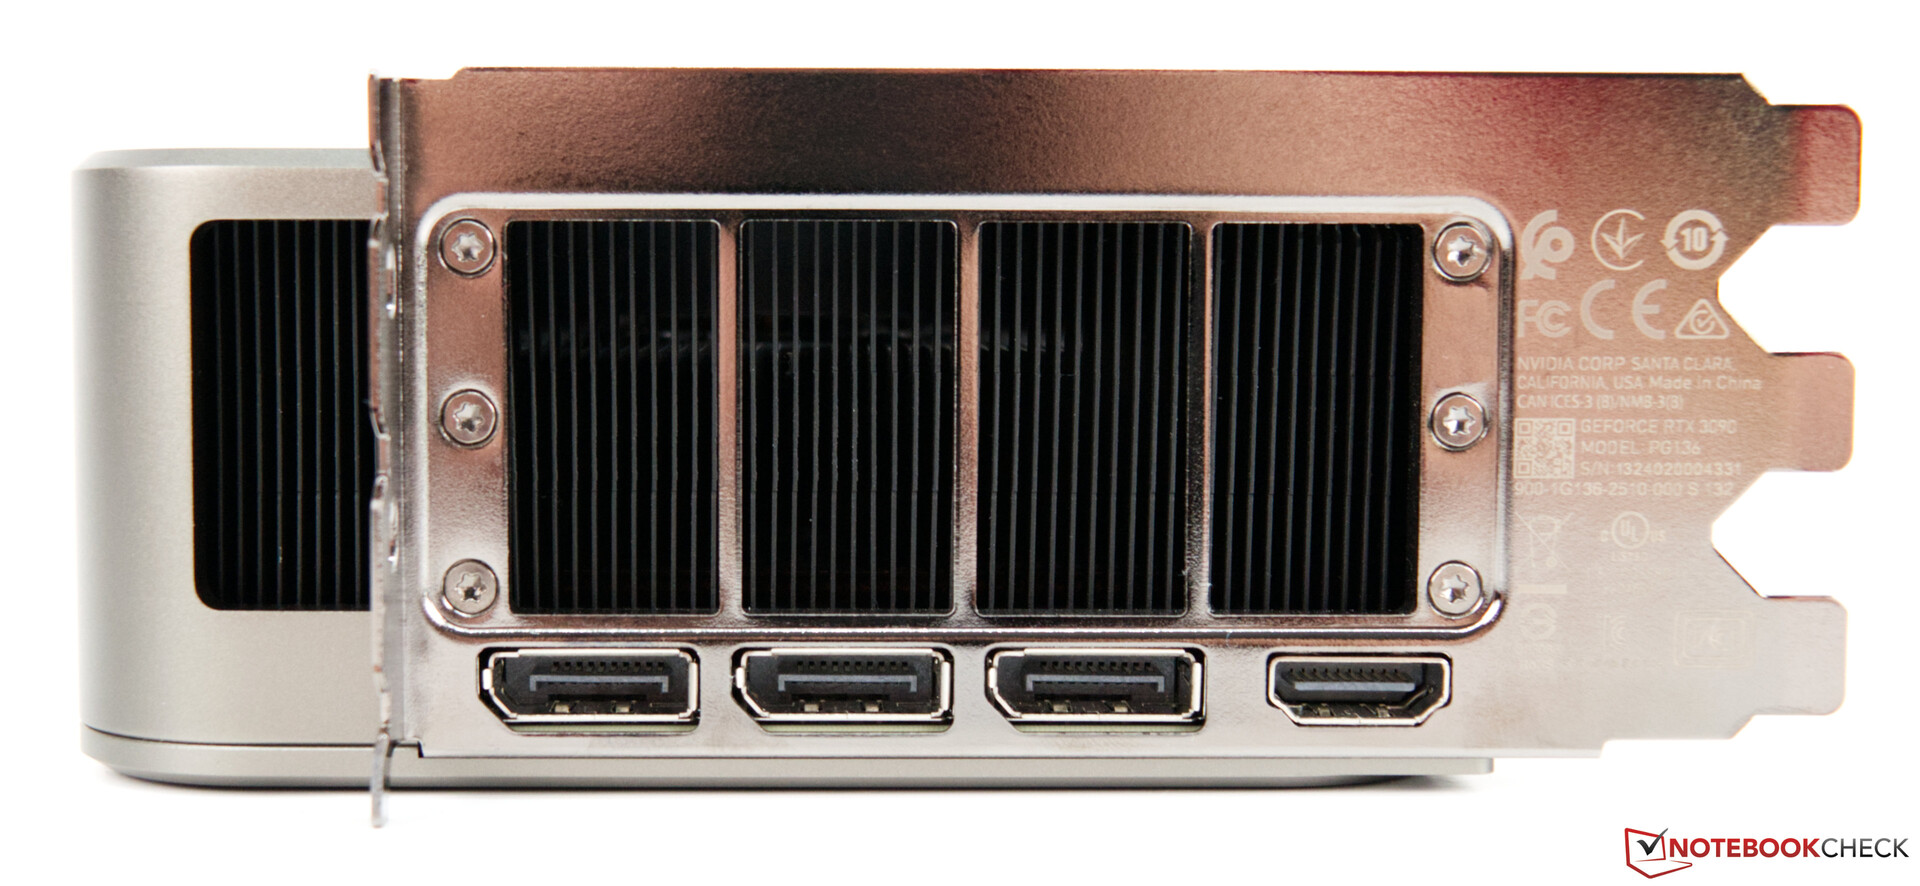
Esternamente, la Nvidia GeForce RTX 3090 Founders Edition offre 1x HDMI 2.1 e 3x DisplayPort 1.4a.

Le specifiche delle schede grafiche GeForce a confronto
| Specifiche | RTX3090 (FE) | RTX 3080 FE | RTX 3070 FE | Titan RTX | TITAN X Pascal | RTX 2080 Ti | RTX 2080 |
| Chip | GA102 | GA102 | GA104 | TU102 | GP102 | TU102 | TU104 |
| Processo FinFET | 8nm | 8 nm | 8 nm | 12 nm | 16 nm | 12 nm | |
| CUDAcores | 10,496 | 8,704 | 5,888 | 4,608 | 3,584 | 4,352 | 2,944 |
| Textureunits | 328 | 272 | 184 | 288 | 224 | 272 | 184 |
| Tensor cores | 3283rd Gen | 272 3rd Gen | 184 3rd Gen | 576 2nd Gen | - | 544 2nd Gen | 368 2nd Gen |
| RT core | 82 | 68 | 46 | 72 | - | 68 | 46 |
| GPU clock di base | 1,395 MHz | 1,440 MHz | 1,500 MHz | 1,350 MHz | 1,417 MHz | 1,350 MHz | 1,515 MHz |
| GPU boost clock | 1,695 MHz | 1,710 MHz | 1,750 MHz | 1,770 MHz | 1,531 MHz | 1,545 MHz | 1,710 MHz |
| Memoriabus | 384-bit | 320-bit | 256-bit | 384-bit | 384-bit | 352-bit | 256-bit |
| Larghezza di banda di memoria | 936GB/s | 760 GB/s | 448 GB/s | 672 GB/s | 480,4 GB/s | 616 GB/s | 448 GB/s |
| Memoria video | 24GB GDDR6X | 10 GB GDDR6X | 8 GB GDDR6 | 24 GB GDDR6 | 12 GB GDDR5X | 11 GB GDDR6 | 8 GB GDDR6 |
| Consumo energetico | 350W | 320 W | 220 W | 280 W | 250 W | 250 W | 215 W |
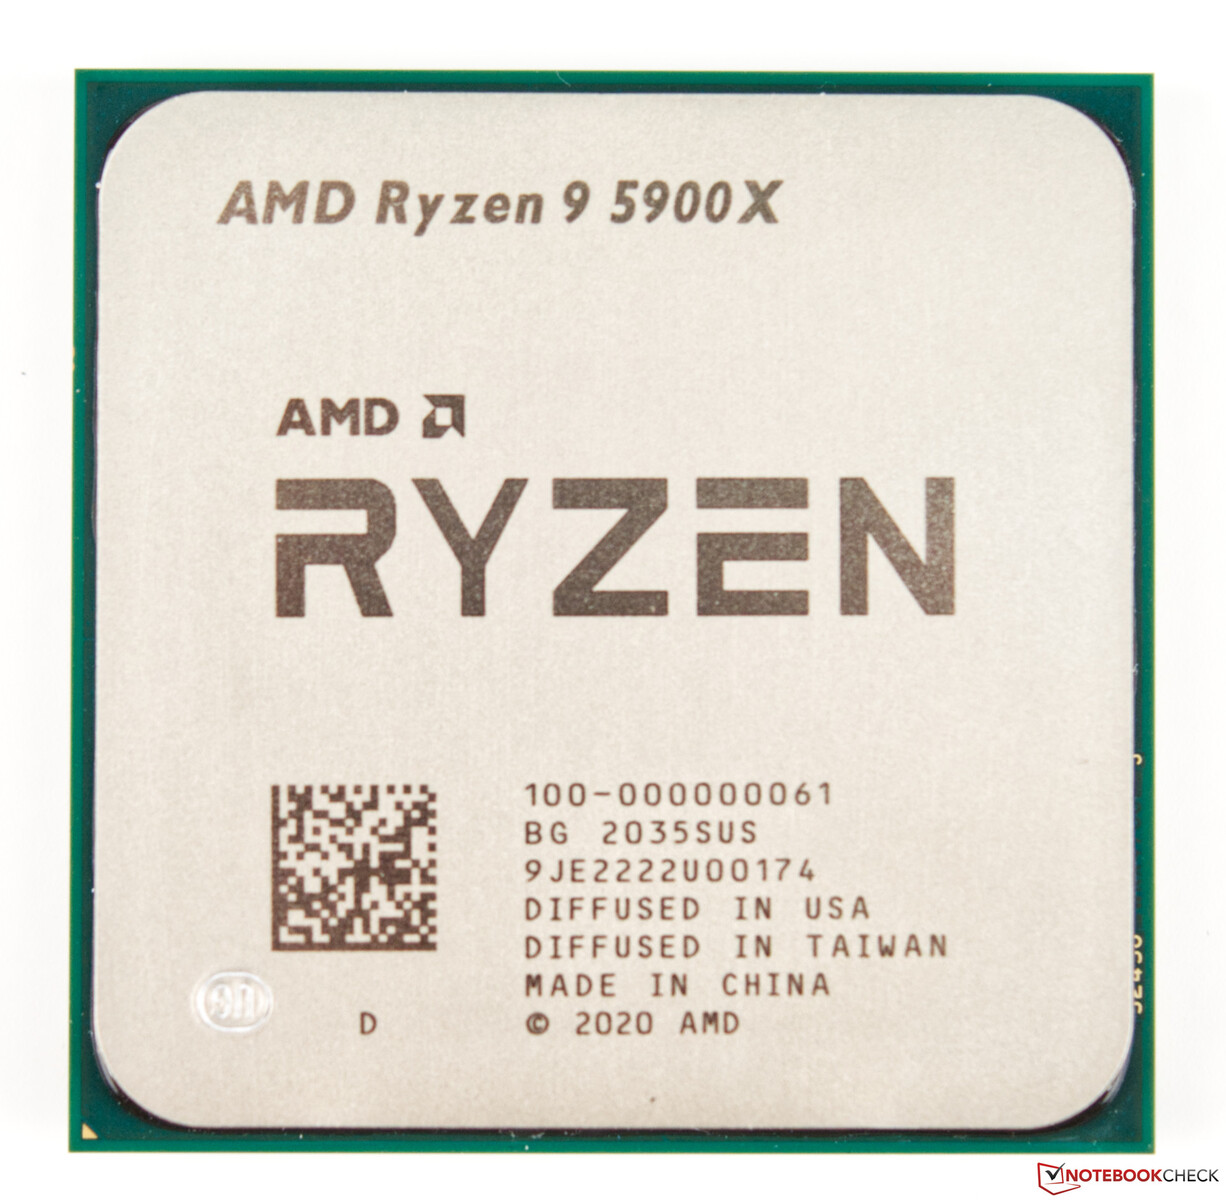
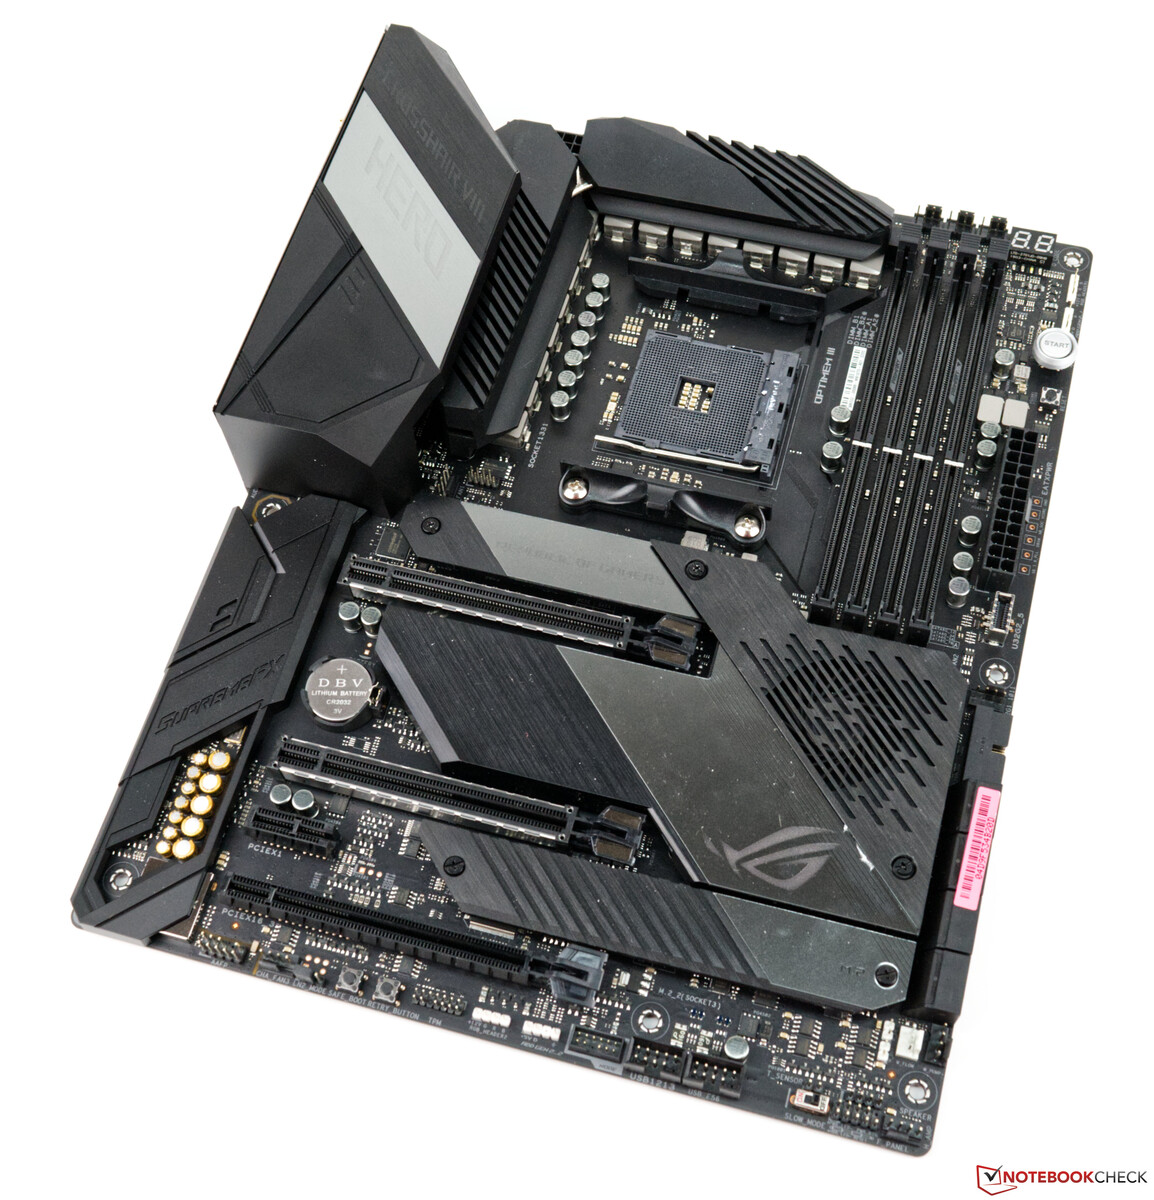
Il nostro sistema di prova basato su AMD Ryzen 9 5900X
Una piattaforma AMD attuale basata sull'Asus X570 ROG Crosshair VIII Hero Wi-Fi è usata come sistema di test. La CPU (AMD Ryzen 9 5900X) offre buone prestazioni, e usiamo un AIO (Alphacool Eisbaer Aurora 360 mm) per il raffreddamento. I 32 GB di RAM provengono da Corsair e hanno un clock di 4.000 MHz. Usiamo l'Acer Predator XB321HK come monitor. Non ci limita grazie alla sua capacità UHD. A questo punto, ringraziamo AMD per aver fornito la piattaforma di test e Corsair per il kit di RAM.
Per i prossimi benchmarks e test, usiamo il seguente sistema:
- Lian Li O11 Dynamic
- AMD Ryzen 9 5900X
- Nvidia GeForce RTX 3090 FE(Nvidia 461.09)
- Asus X570 ROG Crosshair VIII Hero Wi-Fi (BIOS 2402, impostazioni predefinite, XMP 1 per DDR4-4000)
- Alimentatore Corsair RM1000X da 1.000 watt
- Corsair Vengeance RGB Pro DDR4-4000 2x 16 GB kit di RAM
- SSD Corsair MP600 2 TB M.2 PCIe 4.0
- Crucial MX500 2 TB (per i giochi)
Benchmarks sintetici
Nei test sintetici, la Nvidia GeForce RTX 3090 FE mostra una prestazione solida, anche se la AMD Radeon RX 6800 XT rende le cose un po' difficili per l'ammiraglia di Nvidia di tanto in tanto. In alte risoluzioni con molti dettagli, la GeForce RTX 3090 può mostrare pienamente i suoi punti di forza come il test Unigine Superposition mostra molto bene. Tuttavia, il nostro modello di test perde il confronto con la MSI GeForce RTX 3090 Suprim X, il che era prevedibile anche a causa del TDP inferiore. Come promemoria, la MSI GeForce RTX 3090 Suprim X può consumare fino a 420 watt, che è 70 watt in più della Founders Edition che stiamo testando.
| 3DMark | |
| 1920x1080 Fire Strike Graphics | |
| AMD Radeon RX 6800 XT | |
| MSI GeForce RTX 3090 Suprim X | |
| Nvidia GeForce RTX 3090 Founders Edition | |
| MSI GeForce RTX 3080 Gaming X Trio | |
| AMD Ryzen 9 5900X | |
| MSI GeForce RTX 3070 Ventus 3X | |
| Fire Strike Extreme Graphics | |
| AMD Radeon RX 6800 XT | |
| MSI GeForce RTX 3090 Suprim X | |
| Nvidia GeForce RTX 3090 Founders Edition | |
| MSI GeForce RTX 3080 Gaming X Trio | |
| AMD Ryzen 9 5900X | |
| MSI GeForce RTX 3070 Ventus 3X | |
| 3840x2160 Fire Strike Ultra Graphics | |
| AMD Radeon RX 6800 XT | |
| MSI GeForce RTX 3090 Suprim X | |
| Nvidia GeForce RTX 3090 Founders Edition | |
| MSI GeForce RTX 3080 Gaming X Trio | |
| AMD Ryzen 9 5900X | |
| MSI GeForce RTX 3070 Ventus 3X | |
| 2560x1440 Time Spy Graphics | |
| MSI GeForce RTX 3090 Suprim X | |
| Nvidia GeForce RTX 3090 Founders Edition | |
| MSI GeForce RTX 3080 Gaming X Trio | |
| AMD Radeon RX 6800 XT | |
| AMD Ryzen 9 5900X | |
| MSI GeForce RTX 3070 Ventus 3X | |
| Unigine Superposition | |
| 1280x720 720p Low | |
| AMD Ryzen 9 5900X | |
| AMD Radeon RX 6800 XT | |
| Nvidia GeForce RTX 3090 Founders Edition | |
| MSI GeForce RTX 3070 Ventus 3X | |
| MSI GeForce RTX 3090 Suprim X | |
| MSI GeForce RTX 3080 Gaming X Trio | |
| 1920x1080 1080p High | |
| MSI GeForce RTX 3090 Suprim X | |
| Nvidia GeForce RTX 3090 Founders Edition | |
| AMD Radeon RX 6800 XT | |
| MSI GeForce RTX 3080 Gaming X Trio | |
| AMD Ryzen 9 5900X | |
| MSI GeForce RTX 3070 Ventus 3X | |
| 1920x1080 1080p Extreme | |
| MSI GeForce RTX 3090 Suprim X | |
| Nvidia GeForce RTX 3090 Founders Edition | |
| MSI GeForce RTX 3080 Gaming X Trio | |
| AMD Radeon RX 6800 XT | |
| AMD Ryzen 9 5900X | |
| MSI GeForce RTX 3070 Ventus 3X | |
| 3840x2160 4k Optimized | |
| MSI GeForce RTX 3090 Suprim X | |
| Nvidia GeForce RTX 3090 Founders Edition | |
| MSI GeForce RTX 3080 Gaming X Trio | |
| AMD Radeon RX 6800 XT | |
| AMD Ryzen 9 5900X | |
| MSI GeForce RTX 3070 Ventus 3X | |
| 7680x4320 8k Optimized | |
| MSI GeForce RTX 3090 Suprim X | |
| Nvidia GeForce RTX 3090 Founders Edition | |
| MSI GeForce RTX 3080 Gaming X Trio | |
| AMD Ryzen 9 5900X | |
| AMD Radeon RX 6800 XT | |
| MSI GeForce RTX 3070 Ventus 3X | |
| Unigine Heaven 4.0 | |
| Extreme Preset OpenGL | |
| MSI GeForce RTX 3090 Suprim X | |
| MSI GeForce RTX 3080 Gaming X Trio | |
| AMD Ryzen 9 5900X | |
| AMD Radeon RX 6800 XT | |
| MSI GeForce RTX 3070 Ventus 3X | |
| Nvidia GeForce RTX 3090 Founders Edition | |
| Extreme Preset DX11 | |
| MSI GeForce RTX 3090 Suprim X | |
| Nvidia GeForce RTX 3090 Founders Edition | |
| MSI GeForce RTX 3080 Gaming X Trio | |
| AMD Radeon RX 6800 XT | |
| AMD Ryzen 9 5900X | |
| MSI GeForce RTX 3070 Ventus 3X | |
| Unigine Valley 1.0 | |
| 1920x1080 Extreme HD DirectX AA:x8 | |
| MSI GeForce RTX 3090 Suprim X | |
| Nvidia GeForce RTX 3090 Founders Edition | |
| AMD Radeon RX 6800 XT | |
| MSI GeForce RTX 3080 Gaming X Trio | |
| AMD Ryzen 9 5900X | |
| MSI GeForce RTX 3070 Ventus 3X | |
| 1920x1080 Extreme HD Preset OpenGL AA:x8 | |
| MSI GeForce RTX 3090 Suprim X | |
| MSI GeForce RTX 3080 Gaming X Trio | |
| Nvidia GeForce RTX 3090 Founders Edition | |
| AMD Ryzen 9 5900X | |
| AMD Radeon RX 6800 XT | |
| MSI GeForce RTX 3070 Ventus 3X | |
| SiSoft Sandra 2016 | |
| GP Financial Analysis (FP High/Double Precision) | |
| AMD Radeon RX 6800 XT | |
| MSI GeForce RTX 3090 Suprim X | |
| Nvidia GeForce RTX 3090 Founders Edition | |
| MSI GeForce RTX 3080 Gaming X Trio | |
| MSI GeForce RTX 3070 Ventus 3X | |
| GP Cryptography (Higher Security AES256+SHA2-512) | |
| MSI GeForce RTX 3090 Suprim X | |
| Nvidia GeForce RTX 3090 Founders Edition | |
| MSI GeForce RTX 3080 Gaming X Trio | |
| AMD Radeon RX 6800 XT | |
| MSI GeForce RTX 3070 Ventus 3X | |
| Image Processing | |
| AMD Radeon RX 6800 XT | |
| MSI GeForce RTX 3090 Suprim X | |
| Nvidia GeForce RTX 3090 Founders Edition | |
| MSI GeForce RTX 3080 Gaming X Trio | |
| MSI GeForce RTX 3070 Ventus 3X | |
| LuxMark v2.0 64Bit | |
| Room GPUs-only | |
| Nvidia GeForce RTX 3090 Founders Edition | |
| MSI GeForce RTX 3090 Suprim X | |
| MSI GeForce RTX 3080 Gaming X Trio | |
| AMD Radeon RX 6800 XT | |
| MSI GeForce RTX 3070 Ventus 3X | |
| Sala GPUs-only | |
| AMD Radeon RX 6800 XT | |
| Nvidia GeForce RTX 3090 Founders Edition | |
| MSI GeForce RTX 3090 Suprim X | |
| MSI GeForce RTX 3080 Gaming X Trio | |
| MSI GeForce RTX 3070 Ventus 3X | |
Gaming Benchmarks
La GeForce RTX 3090 è una scheda grafica estremamente veloce che è perfettamente adatta al gaming 4K. Tuttavia, gli utenti della Founders Edition devono accontentarsi di una performance leggermente più debole. Le schede partner, che spesso offrono un TDP più alto, offrono frames al secondo leggermente più alti. Tuttavia, i giochi non girano in modo molto più veloce. Se guardiamo solo i risultati dei benchmarks Full HD, il duello contro la AMD Radeon RX 6800 XT non finisce definitivamente a favore di Nvidia. La AMD Radeon RX 6800 XT può spesso mettersi davanti alla GeForce RTX 3090 FE. Una AMD Radeon RX 6900 XT dovrebbe addirittura aumentare il vantaggio qui. Tuttavia, non abbiamo avuto la possibilità di esaminare un modello della Radeon RX 6900 XT finora, quindi non possiamo fornire risultati di benchmark in questo caso. Solo a risoluzioni più alte la GeForce RTX 3090 riesce a distinguersi. AMD non può più tenere il passo qui. Inoltre, Nvidia offre grandi caratteristiche con DLSS e ray tracing, che vengono utilizzate sempre più in molti giochi. Nel frattempo, AMD ha anche incluso i cores RT nelle sue GPU RX 6800, ma non possono tenere il passo con l'attuale generazione Ampere in termini di prestazioni tecniche.
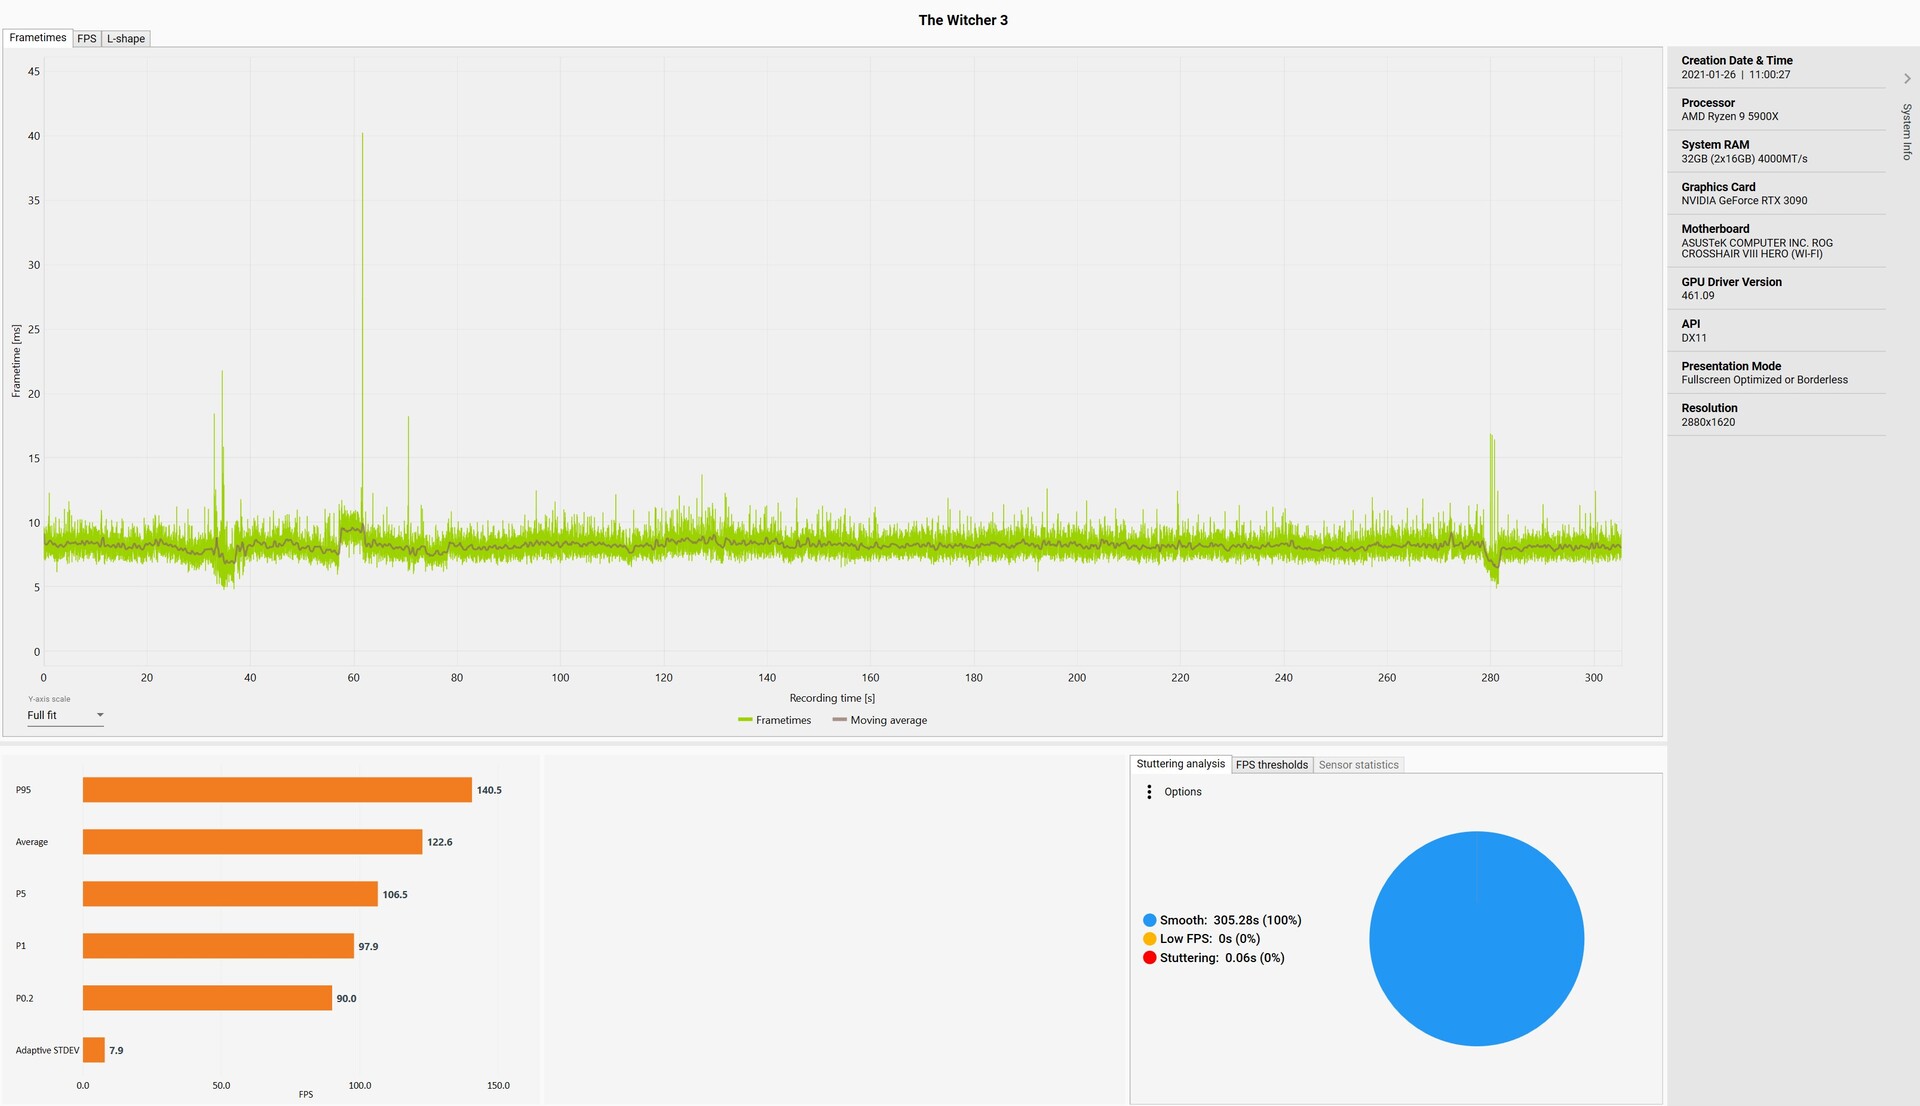
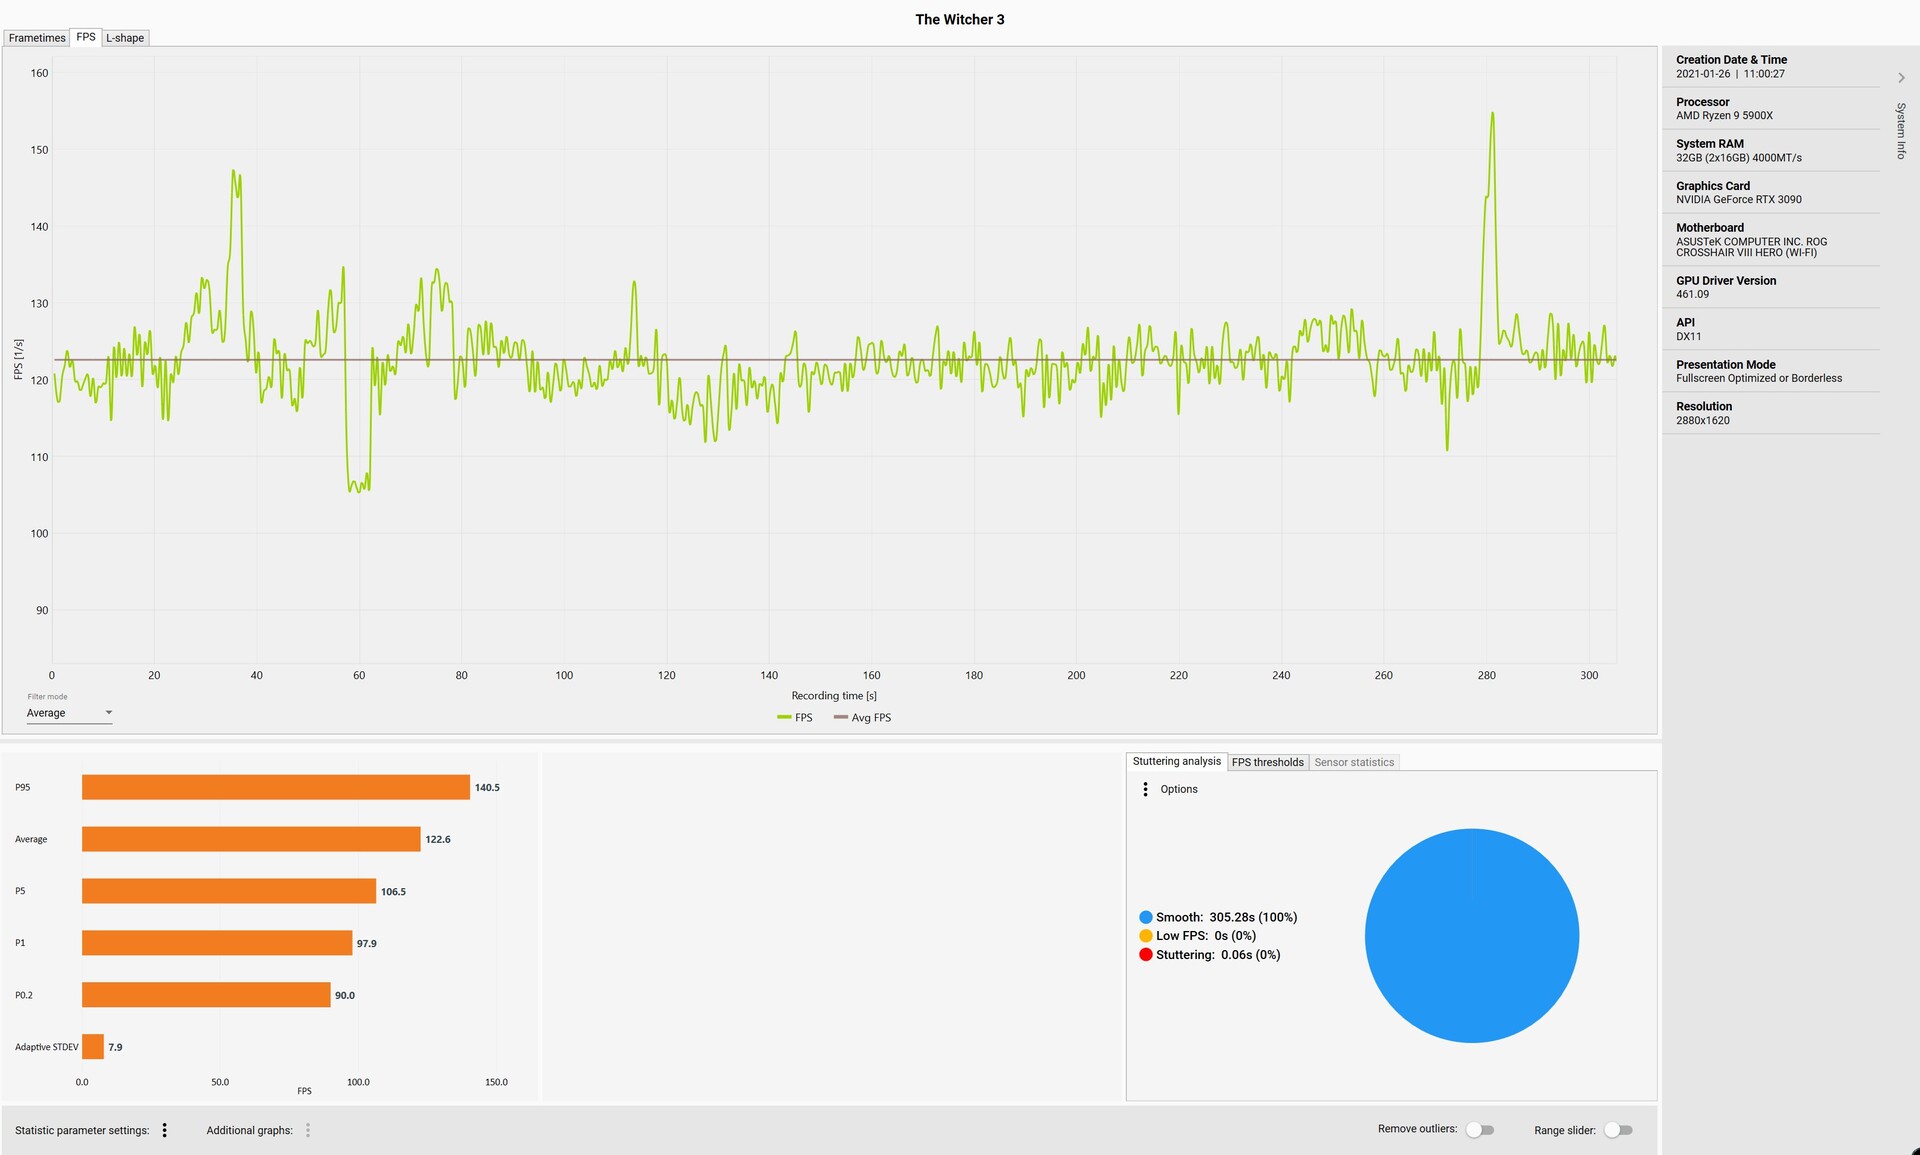
Usiamo il gioco The Witcher 3 (preset Ultra, 1080p) per misurare i tempi e i frame rates. Il gioco scala ancora molto bene con le schede grafiche attuali nonostante la sua età. Abbiamo registrato alcune anomalie nei tempi di frame, che sono visibili anche nei frame rates. Non abbiamo rilevato un impatto duraturo sulle prestazioni del gioco.
| The Witcher 3 | |
| 1920x1080 Ultra Graphics & Postprocessing (HBAO+) | |
| NVIDIA GeForce RTX 3090, AMD Ryzen 9 5900X | |
| AMD Radeon RX 6800 XT, AMD Ryzen 9 5950X | |
| NVIDIA GeForce RTX 3080, AMD Ryzen 9 5900X | |
| NVIDIA Titan RTX, AMD Ryzen 9 5900X | |
| NVIDIA Titan RTX, AMD Ryzen 9 3900X | |
| NVIDIA GeForce RTX 3070, AMD Ryzen 9 5900X | |
| 3840x2160 High Graphics & Postprocessing (Nvidia HairWorks Off) | |
| NVIDIA GeForce RTX 3090, AMD Ryzen 9 5900X | |
| NVIDIA GeForce RTX 3080, AMD Ryzen 9 5900X | |
| AMD Radeon RX 6800 XT, AMD Ryzen 9 5950X | |
| NVIDIA Titan RTX, AMD Ryzen 9 5900X | |
| NVIDIA Titan RTX, AMD Ryzen 9 3900X | |
| NVIDIA GeForce RTX 3070, AMD Ryzen 9 5900X | |
| Far Cry 5 | |
| 1920x1080 Ultra Preset AA:T | |
| NVIDIA Titan RTX, AMD Ryzen 9 5900X | |
| NVIDIA GeForce RTX 3070, AMD Ryzen 9 5900X | |
| NVIDIA GeForce RTX 3090, AMD Ryzen 9 5900X | |
| NVIDIA GeForce RTX 3080, AMD Ryzen 9 5900X | |
| AMD Radeon RX 6800 XT, AMD Ryzen 9 5950X | |
| NVIDIA Titan RTX, AMD Ryzen 9 3900X | |
| 3840x2160 Ultra Preset AA:T | |
| NVIDIA GeForce RTX 3090, AMD Ryzen 9 5900X | |
| AMD Radeon RX 6800 XT, AMD Ryzen 9 5950X | |
| NVIDIA GeForce RTX 3080, AMD Ryzen 9 5900X | |
| NVIDIA Titan RTX, AMD Ryzen 9 5900X | |
| NVIDIA Titan RTX, AMD Ryzen 9 3900X | |
| NVIDIA GeForce RTX 3070, AMD Ryzen 9 5900X | |
| Far Cry New Dawn | |
| 1920x1080 Ultra Preset | |
| NVIDIA Titan RTX, AMD Ryzen 9 5900X | |
| NVIDIA GeForce RTX 3070, AMD Ryzen 9 5900X | |
| AMD Radeon RX 6800 XT, AMD Ryzen 9 5950X | |
| NVIDIA GeForce RTX 3090, AMD Ryzen 9 5900X | |
| NVIDIA GeForce RTX 3080, AMD Ryzen 9 5900X | |
| NVIDIA Titan RTX, AMD Ryzen 9 3900X | |
| 3840x2160 Ultra Preset | |
| NVIDIA GeForce RTX 3090, AMD Ryzen 9 5900X | |
| AMD Radeon RX 6800 XT, AMD Ryzen 9 5950X | |
| NVIDIA GeForce RTX 3080, AMD Ryzen 9 5900X | |
| NVIDIA Titan RTX, AMD Ryzen 9 5900X | |
| NVIDIA Titan RTX, AMD Ryzen 9 3900X | |
| NVIDIA GeForce RTX 3070, AMD Ryzen 9 5900X | |
| Anno 1800 | |
| 1920x1080 Ultra Graphics Quality (DX11) | |
| NVIDIA GeForce RTX 3090, AMD Ryzen 9 5900X | |
| NVIDIA GeForce RTX 3080, AMD Ryzen 9 5900X | |
| NVIDIA GeForce RTX 3070, AMD Ryzen 9 5900X | |
| AMD Radeon RX 6800 XT, AMD Ryzen 9 5950X | |
| 3840x2160 Ultra Graphics Quality (DX11) | |
| NVIDIA GeForce RTX 3090, AMD Ryzen 9 5900X | |
| AMD Radeon RX 6800 XT, AMD Ryzen 9 5950X | |
| NVIDIA GeForce RTX 3080, AMD Ryzen 9 5900X | |
| NVIDIA GeForce RTX 3070, AMD Ryzen 9 5900X | |
| Crysis Remastered | |
| 1920x1080 Very High Preset AA:SM | |
| NVIDIA Titan RTX, AMD Ryzen 9 5900X | |
| NVIDIA GeForce RTX 3090, AMD Ryzen 9 5900X | |
| AMD Radeon RX 6800 XT, AMD Ryzen 9 5950X | |
| NVIDIA GeForce RTX 3070, AMD Ryzen 9 5900X | |
| NVIDIA GeForce RTX 3080, AMD Ryzen 9 5900X | |
| 3840x2160 Very High Preset AA:SM | |
| NVIDIA GeForce RTX 3090, AMD Ryzen 9 5900X | |
| AMD Radeon RX 6800 XT, AMD Ryzen 9 5950X | |
| NVIDIA GeForce RTX 3080, AMD Ryzen 9 5900X | |
| NVIDIA Titan RTX, AMD Ryzen 9 5900X | |
| NVIDIA GeForce RTX 3070, AMD Ryzen 9 5900X | |
| Dirt 5 | |
| 1920x1080 Ultra High Preset | |
| NVIDIA GeForce RTX 3090, AMD Ryzen 9 5900X | |
| AMD Radeon RX 6800 XT, AMD Ryzen 9 5950X | |
| NVIDIA GeForce RTX 3080, AMD Ryzen 9 5900X | |
| NVIDIA Titan RTX, AMD Ryzen 9 5900X | |
| NVIDIA GeForce RTX 3070, AMD Ryzen 9 5900X | |
| 3840x2160 Ultra High Preset | |
| NVIDIA GeForce RTX 3090, AMD Ryzen 9 5900X | |
| AMD Radeon RX 6800 XT, AMD Ryzen 9 5950X | |
| NVIDIA GeForce RTX 3080, AMD Ryzen 9 5900X | |
| NVIDIA Titan RTX, AMD Ryzen 9 5900X | |
| NVIDIA GeForce RTX 3070, AMD Ryzen 9 5900X | |
| Call of Duty Black Ops Cold War | |
| 1920x1080 Highest Settings | |
| NVIDIA GeForce RTX 3090, AMD Ryzen 9 5900X | |
| NVIDIA Titan RTX, AMD Ryzen 9 5900X | |
| AMD Radeon RX 6800 XT, AMD Ryzen 9 5950X | |
| NVIDIA GeForce RTX 3080, AMD Ryzen 9 5900X | |
| NVIDIA GeForce RTX 3070, AMD Ryzen 9 5900X | |
| 3840x2160 Highest Settings | |
| NVIDIA GeForce RTX 3090, AMD Ryzen 9 5900X | |
| NVIDIA GeForce RTX 3080, AMD Ryzen 9 5900X | |
| AMD Radeon RX 6800 XT, AMD Ryzen 9 5950X | |
| NVIDIA Titan RTX, AMD Ryzen 9 5900X | |
| NVIDIA GeForce RTX 3070, AMD Ryzen 9 5900X | |
| F1 2020 | |
| 1920x1080 Ultra High Preset AA:T AF:16x | |
| AMD Radeon RX 6800 XT, AMD Ryzen 9 5950X | |
| NVIDIA GeForce RTX 3090, AMD Ryzen 9 5900X | |
| NVIDIA Titan RTX, AMD Ryzen 9 3900X | |
| NVIDIA GeForce RTX 3070, AMD Ryzen 9 5900X | |
| NVIDIA GeForce RTX 3080, AMD Ryzen 9 5900X | |
| 3840x2160 Ultra High Preset AA:T AF:16x | |
| NVIDIA GeForce RTX 3090, AMD Ryzen 9 5900X | |
| AMD Radeon RX 6800 XT, AMD Ryzen 9 5950X | |
| NVIDIA GeForce RTX 3080, AMD Ryzen 9 5900X | |
| NVIDIA Titan RTX, AMD Ryzen 9 3900X | |
| NVIDIA GeForce RTX 3070, AMD Ryzen 9 5900X | |
| Death Stranding | |
| 1920x1080 Very High Preset | |
| AMD Radeon RX 6800 XT, AMD Ryzen 9 5950X | |
| NVIDIA GeForce RTX 3080, AMD Ryzen 9 5900X | |
| NVIDIA GeForce RTX 3090, AMD Ryzen 9 5900X | |
| NVIDIA GeForce RTX 3070, AMD Ryzen 9 5900X | |
| NVIDIA Titan RTX, AMD Ryzen 9 3900X | |
| 3840x2160 Very High Preset | |
| NVIDIA GeForce RTX 3090, AMD Ryzen 9 5900X | |
| NVIDIA GeForce RTX 3080, AMD Ryzen 9 5900X | |
| AMD Radeon RX 6800 XT, AMD Ryzen 9 5950X | |
| NVIDIA GeForce RTX 3070, AMD Ryzen 9 5900X | |
| NVIDIA Titan RTX, AMD Ryzen 9 3900X | |
| Mafia Definitive Edition | |
| 1920x1080 High Preset | |
| NVIDIA GeForce RTX 3090, AMD Ryzen 9 5900X | |
| NVIDIA GeForce RTX 3080, AMD Ryzen 9 5900X | |
| NVIDIA GeForce RTX 3070, AMD Ryzen 9 5900X | |
| NVIDIA Titan RTX, AMD Ryzen 9 3900X | |
| AMD Radeon RX 6800 XT, AMD Ryzen 9 5950X | |
| 3840x2160 High Preset | |
| NVIDIA GeForce RTX 3090, AMD Ryzen 9 5900X | |
| NVIDIA GeForce RTX 3080, AMD Ryzen 9 5900X | |
| NVIDIA Titan RTX, AMD Ryzen 9 3900X | |
| AMD Radeon RX 6800 XT, AMD Ryzen 9 5950X | |
| NVIDIA GeForce RTX 3070, AMD Ryzen 9 5900X | |
| Watch Dogs Legion | |
| 1920x1080 Ultra Preset (DX12) | |
| AMD Radeon RX 6800 XT, AMD Ryzen 9 5950X | |
| NVIDIA GeForce RTX 3090, AMD Ryzen 9 5900X | |
| NVIDIA GeForce RTX 3080, AMD Ryzen 9 5900X | |
| NVIDIA GeForce RTX 3070, AMD Ryzen 9 5900X | |
| NVIDIA Titan RTX, AMD Ryzen 9 3900X | |
| 3840x2160 Ultra Preset (DX12) | |
| NVIDIA GeForce RTX 3090, AMD Ryzen 9 5900X | |
| NVIDIA GeForce RTX 3080, AMD Ryzen 9 5900X | |
| AMD Radeon RX 6800 XT, AMD Ryzen 9 5950X | |
| NVIDIA Titan RTX, AMD Ryzen 9 3900X | |
| NVIDIA GeForce RTX 3070, AMD Ryzen 9 5900X | |
| Horizon Zero Dawn | |
| 1920x1080 Ultimate Quality | |
| AMD Radeon RX 6800 XT, AMD Ryzen 9 5950X | |
| NVIDIA GeForce RTX 3090, AMD Ryzen 9 5900X | |
| NVIDIA GeForce RTX 3080, AMD Ryzen 9 5900X | |
| NVIDIA GeForce RTX 3070, AMD Ryzen 9 5900X | |
| NVIDIA Titan RTX, AMD Ryzen 9 3900X | |
| 3840x2160 Ultimate Quality | |
| AMD Radeon RX 6800 XT, AMD Ryzen 9 5950X | |
| NVIDIA GeForce RTX 3090, AMD Ryzen 9 5900X | |
| NVIDIA GeForce RTX 3080, AMD Ryzen 9 5900X | |
| NVIDIA GeForce RTX 3070, AMD Ryzen 9 5900X | |
| NVIDIA Titan RTX, AMD Ryzen 9 3900X | |
| Shadow of the Tomb Raider | |
| 1920x1080 Highest Preset AA:T | |
| AMD Radeon RX 6800 XT, AMD Ryzen 9 5950X | |
| NVIDIA GeForce RTX 3090, AMD Ryzen 9 5900X | |
| NVIDIA GeForce RTX 3080, AMD Ryzen 9 5900X | |
| NVIDIA Titan RTX, AMD Ryzen 9 5900X | |
| NVIDIA GeForce RTX 3070, AMD Ryzen 9 5900X | |
| NVIDIA Titan RTX, AMD Ryzen 9 3900X | |
| 3840x2160 Highest Preset AA:T | |
| NVIDIA GeForce RTX 3090, AMD Ryzen 9 5900X | |
| NVIDIA GeForce RTX 3080, AMD Ryzen 9 5900X | |
| AMD Radeon RX 6800 XT, AMD Ryzen 9 5950X | |
| NVIDIA Titan RTX, AMD Ryzen 9 5900X | |
| NVIDIA Titan RTX, AMD Ryzen 9 3900X | |
| NVIDIA GeForce RTX 3070, AMD Ryzen 9 5900X | |
| Yakuza Like a Dragon | |
| 1920x1080 Ultra Preset | |
| AMD Radeon RX 6800 XT, AMD Ryzen 9 5950X | |
| NVIDIA GeForce RTX 3090, AMD Ryzen 9 5900X | |
| NVIDIA Titan RTX, AMD Ryzen 9 5900X | |
| NVIDIA GeForce RTX 3070, AMD Ryzen 9 5900X | |
| NVIDIA GeForce RTX 3080, AMD Ryzen 9 5900X | |
| 3840x2160 Ultra Preset | |
| NVIDIA GeForce RTX 3090, AMD Ryzen 9 5900X | |
| NVIDIA GeForce RTX 3080, AMD Ryzen 9 5900X | |
| AMD Radeon RX 6800 XT, AMD Ryzen 9 5950X | |
| NVIDIA Titan RTX, AMD Ryzen 9 5900X | |
| NVIDIA GeForce RTX 3070, AMD Ryzen 9 5900X | |
| basso | medio | alto | ultra | QHD | 4K | |
|---|---|---|---|---|---|---|
| GTA V (2015) | 180 | 174 | 168 | 105 | 100 | 151 |
| The Witcher 3 (2015) | 437.6 | 418.7 | 338.6 | 171.5 | 148 | |
| Dota 2 Reborn (2015) | 149.1 | 139.2 | 138.4 | 134.3 | 138.6 | |
| Rise of the Tomb Raider (2016) | 391.3 | 283.6 | 269.7 | 253.7 | 128.1 | |
| Final Fantasy XV Benchmark (2018) | 211 | 190 | 153 | 128 | 81.5 | |
| X-Plane 11.11 (2018) | 157 | 137 | 111 | 92.8 | ||
| Far Cry 5 (2018) | 186 | 162 | 155 | 142 | 139 | 105 |
| Strange Brigade (2018) | 402 | 342 | 330 | 315 | 244 | 150 |
| Shadow of the Tomb Raider (2018) | 206 | 194 | 199 | 187 | 159 | 94 |
| Battlefield V (2018) | 179.4 | 172.3 | 157.6 | 145.8 | 129.5 | 95.8 |
| Apex Legends (2019) | 144 | 144 | 144 | 144 | 144 | 142.3 |
| Far Cry New Dawn (2019) | 148 | 128 | 123 | 112 | 110 | 97 |
| Metro Exodus (2019) | 201 | 168 | 146 | 124 | 106 | 70.6 |
| The Division 2 (2019) | 249 | 210 | 177 | 152 | 121 | 72 |
| Anno 1800 (2019) | 179 | 155 | 103.5 | 54.5 | 53.5 | 51.3 |
| Control (2019) | 239.2 | 217 | 172.2 | 115.8 | 61.3 | |
| Borderlands 3 (2019) | 172 | 142 | 126 | 119 | 105 | 68 |
| Star Wars Jedi Fallen Order (2019) | 129.9 | 129.6 | 129.2 | 127.4 | 124.4 | |
| Red Dead Redemption 2 (2019) | 167.9 | 171.7 | 153.2 | 109.9 | 92.3 | 63.5 |
| Hunt Showdown (2020) | 239 | 206.5 | 192 | 184.4 | 112.8 | |
| Doom Eternal (2020) | 449.3 | 398.6 | 365.8 | 359.9 | 304.5 | 192.6 |
| F1 2020 (2020) | 379 | 320 | 316 | 250 | 207 | 135 |
| Death Stranding (2020) | 206.1 | 193.2 | 188.6 | 188.1 | 140.9 | 131 |
| Horizon Zero Dawn (2020) | 206 | 191 | 175 | 159 | 141 | 89 |
| Crysis Remastered (2020) | 233.3 | 222.4 | 220.6 | 97.1 | 82.6 | 60.5 |
| Serious Sam 4 (2020) | 175.1 | 130.4 | 121.4 | 115.2 | 113.5 | 97.4 |
| Mafia Definitive Edition (2020) | 188.4 | 163.6 | 158.8 | 142.3 | 84.5 | |
| Star Wars Squadrons (2020) | 448 | 412.3 | 397.8 | 384.2 | 297.2 | 188.3 |
| FIFA 21 (2020) | 212 | 206.5 | 202.4 | 199.9 | 199.9 | 203.3 |
| Watch Dogs Legion (2020) | 132 | 131 | 120 | 107 | 88.3 | 57.6 |
| Dirt 5 (2020) | 250.2 | 197 | 178.5 | 159.5 | 131.1 | 91.4 |
| Assassin´s Creed Valhalla (2020) | 138 | 114 | 105 | 91 | 79 | 57 |
| Call of Duty Black Ops Cold War (2020) | 264 | 231.2 | 195.4 | 161.1 | 124.7 | 74.6 |
| Yakuza Like a Dragon (2020) | 121.2 | 120 | 118.3 | 115 | 113.2 | 78.2 |
| Immortals Fenyx Rising (2020) | 164 | 144 | 138 | 130 | 114 | 83 |
| Cyberpunk 2077 1.0 (2020) | 143.1 | 138.6 | 124.1 | 109.7 | 78.1 | 41.5 |
| Hitman 3 (2021) | 267 | 224 | 223 | 223 | 190 | 115 |
| Outriders (2021) | 120 | 137 | 166 | 168 | 150 | 85.7 |
| Resident Evil Village (2021) | 305 | 304 | 304 | 285 | 213 | 116 |
| Mass Effect Legendary Edition (2021) | 117 | 112 | 107 | 109 | ||
| Days Gone (2021) | 180 | 177 | 175 | 164 | 133 | 81.2 |
| Monster Hunter Stories 2 (2021) | 144 | 144 | 144 | 144 | 144 | |
| F1 2021 (2021) | 433 | 408 | 340 | 192 | 165 | 102 |
| Deathloop (2021) | 122 | 119 | 120 | 116 | 107 | 64.2 |
| New World (2021) | 199 | 149 | 138 | 75.3 | 124 | |
| Alan Wake Remastered (2021) | 94 | 89.1 | 88.9 | 89.4 | ||
| Far Cry 6 (2021) | 142 | 130 | 116 | 113 | 107 | 78.3 |
| Back 4 Blood (2021) | 305 | 294 | 285 | 231 | 131 | |
| Guardians of the Galaxy (2021) | 134 | 135 | 136 | 134 | 133 | 106 |
| Riders Republic (2021) | 221 | 203 | 175 | 166 | 130 | 80 |
| Call of Duty Vanguard (2021) | 116 | 172 | 179 | 166 | 129 | 82 |
| Forza Horizon 5 (2021) | 255 | 174 | 159 | 111 | 100 | 77 |
| Battlefield 2042 (2021) | 105 | 145 | 138 | 129 | 119 | 81.7 |
| Farming Simulator 22 (2021) | 270 | 219 | 190 | 168 | 169 | 145 |
| Halo Infinite (2021) | 165 | 142 | 144 | 110 | 73.6 | |
| God of War (2022) | 187 | 180 | 157 | 115 | 96.9 | 67.8 |
| Rainbow Six Extraction (2022) | 360 | 286 | 278 | 241 | 175 | 99 |
| Dying Light 2 (2022) | 209 | 150 | 131 | 98.7 | 57.3 | |
| GRID Legends (2022) | 214.9 | 194.1 | 179.6 | 153.9 | 132.7 | 101.4 |
| Elden Ring (2022) | 59.8 | 59.9 | 59.9 | 59.9 | 59.9 | 59.9 |
| Cyberpunk 2077 1.6 (2022) | 79.1 | 78.8 | 78.6 | 78.6 | 78 | 43.9 |
| Ghostwire Tokyo (2022) | 221 | 221 | 219 | 218 | 179.2 | 102.6 |
| Tiny Tina's Wonderlands (2022) | 293 | 247 | 192.5 | 159.4 | 125.4 | 71.4 |
| Vampire Bloodhunt (2022) | 386 | 309 | 302 | 299 | 233 | 129 |
Emissioni della Nvidia GeForce RTX 3090 FE
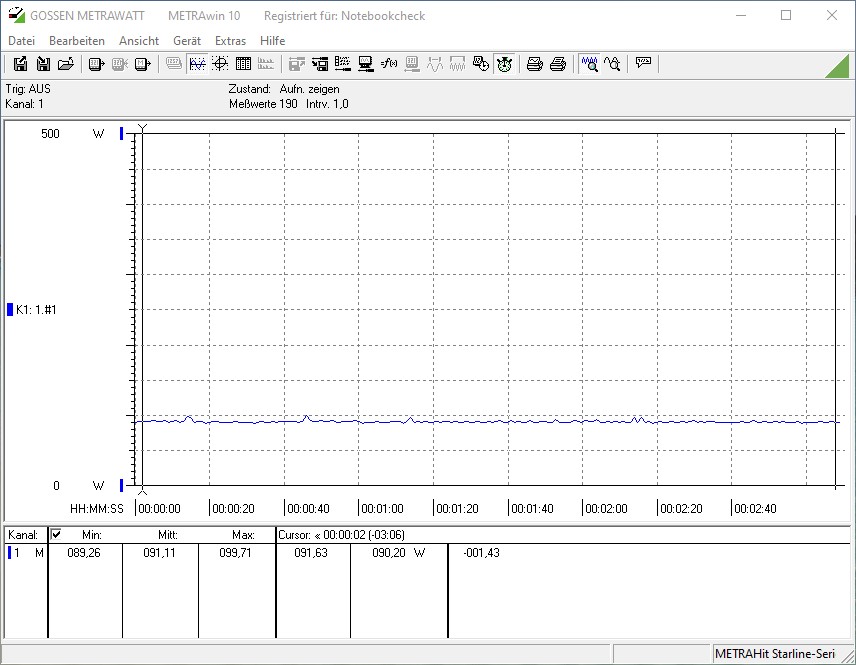
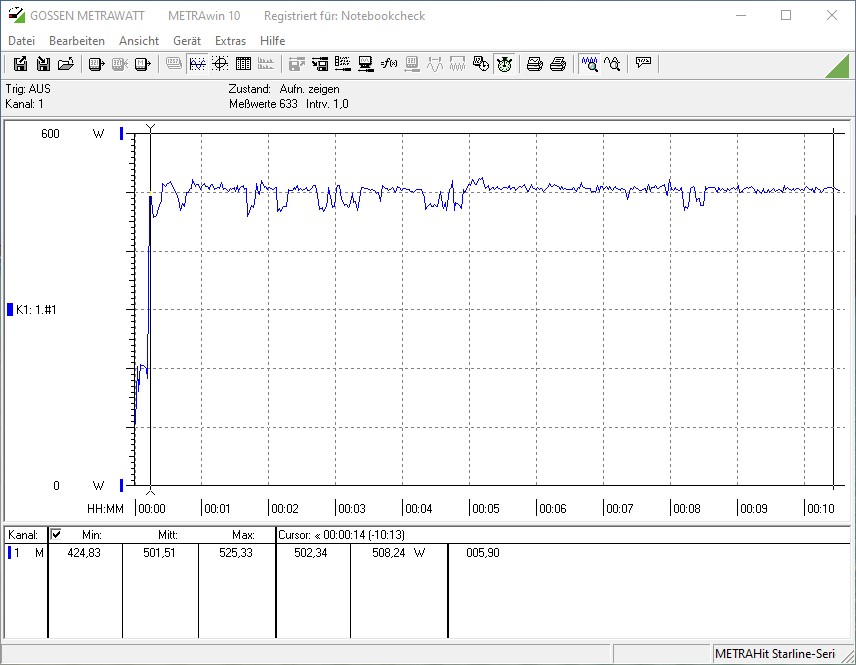
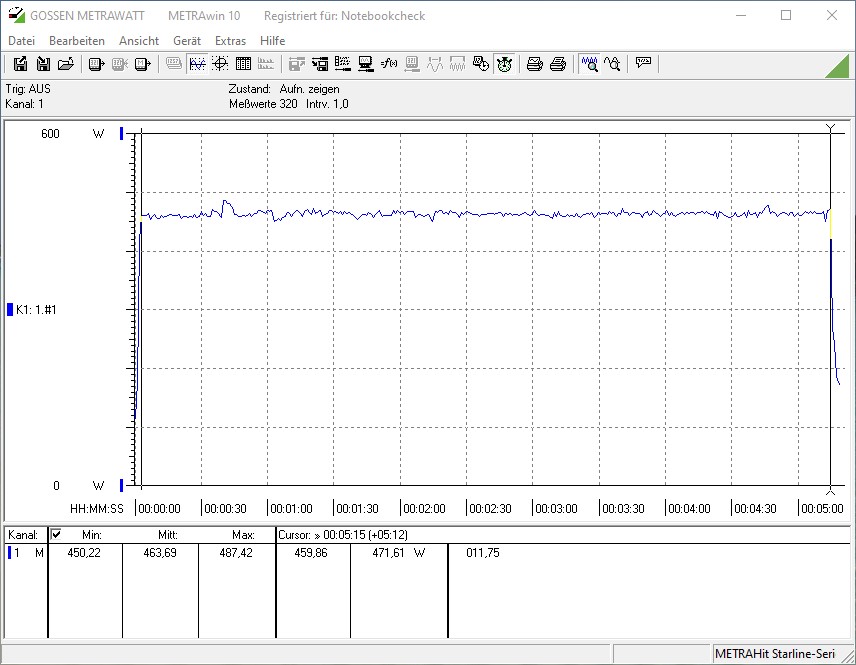
A causa del consumo di energia molto elevato, non dovreste prestare attenzione ad ogni singola cifra quando si tratta di consumo energetico. Il produttore specifica un massimo di 350 watt per la Founders Edition. Il modello recentemente recensito da MSI aveva addirittura un consumo di 420 watt secondo il foglio delle specifiche. Tuttavia, il sistema è altrettanto efficiente dal punto di vista energetico nell'uso inattivo a 91 watt come con altre schede grafiche moderne. Pertanto, la Nvidia GeForce RTX 3090 FE non è in svantaggio in questo caso. Il nostro dispositivo di misurazione mostra molto di più quando giochiamo a The Witcher 3. Una media di 463 watt è raggiunta qui. Un risultato relativamente buono se guardiamo la RTX 3080 di Asus o la RTX 3090 di MSI. Con 501 watt, il nostro sistema di test raggiunge quasi lo stesso valore della RTX 3080 di Asus nello stress test con FurMark.
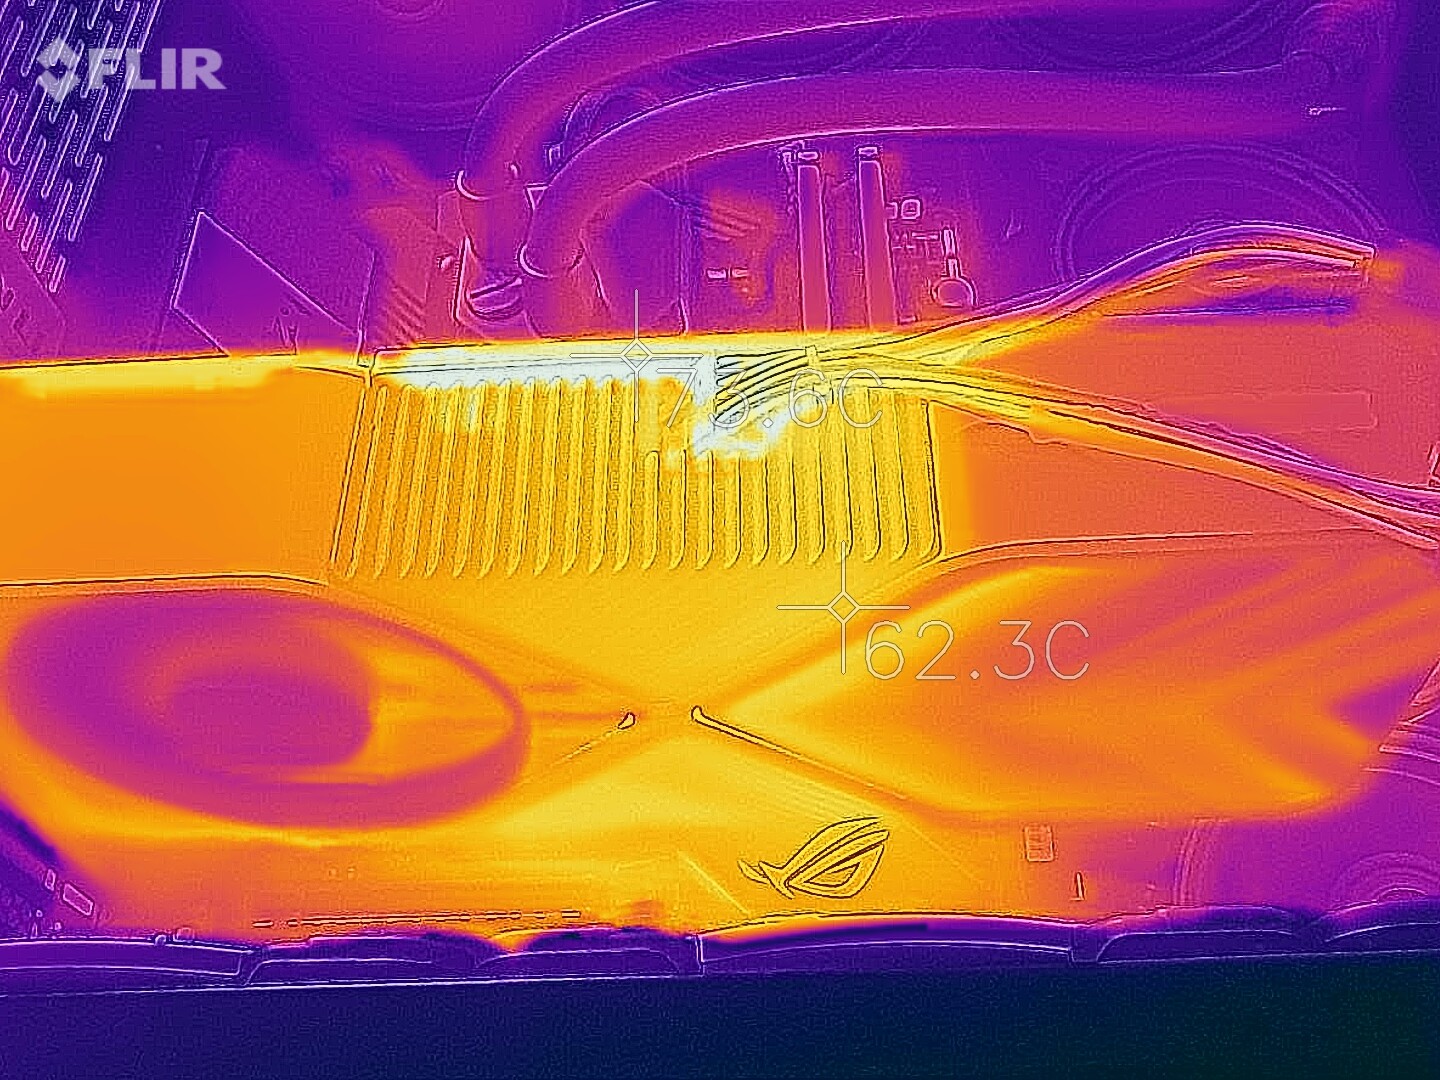
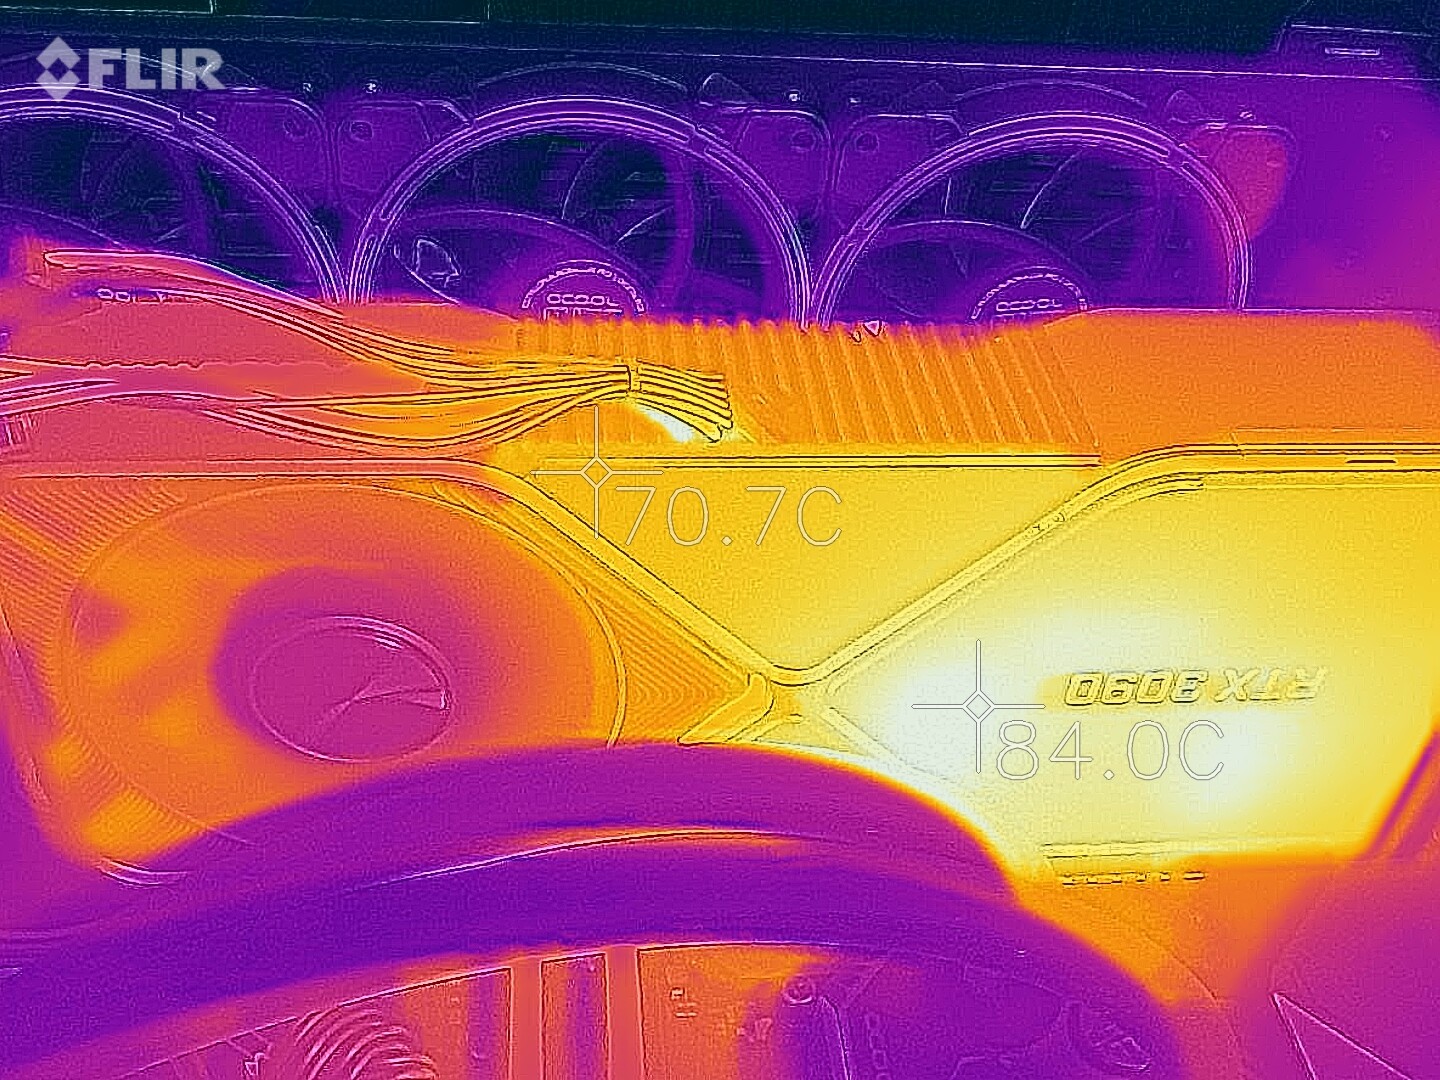
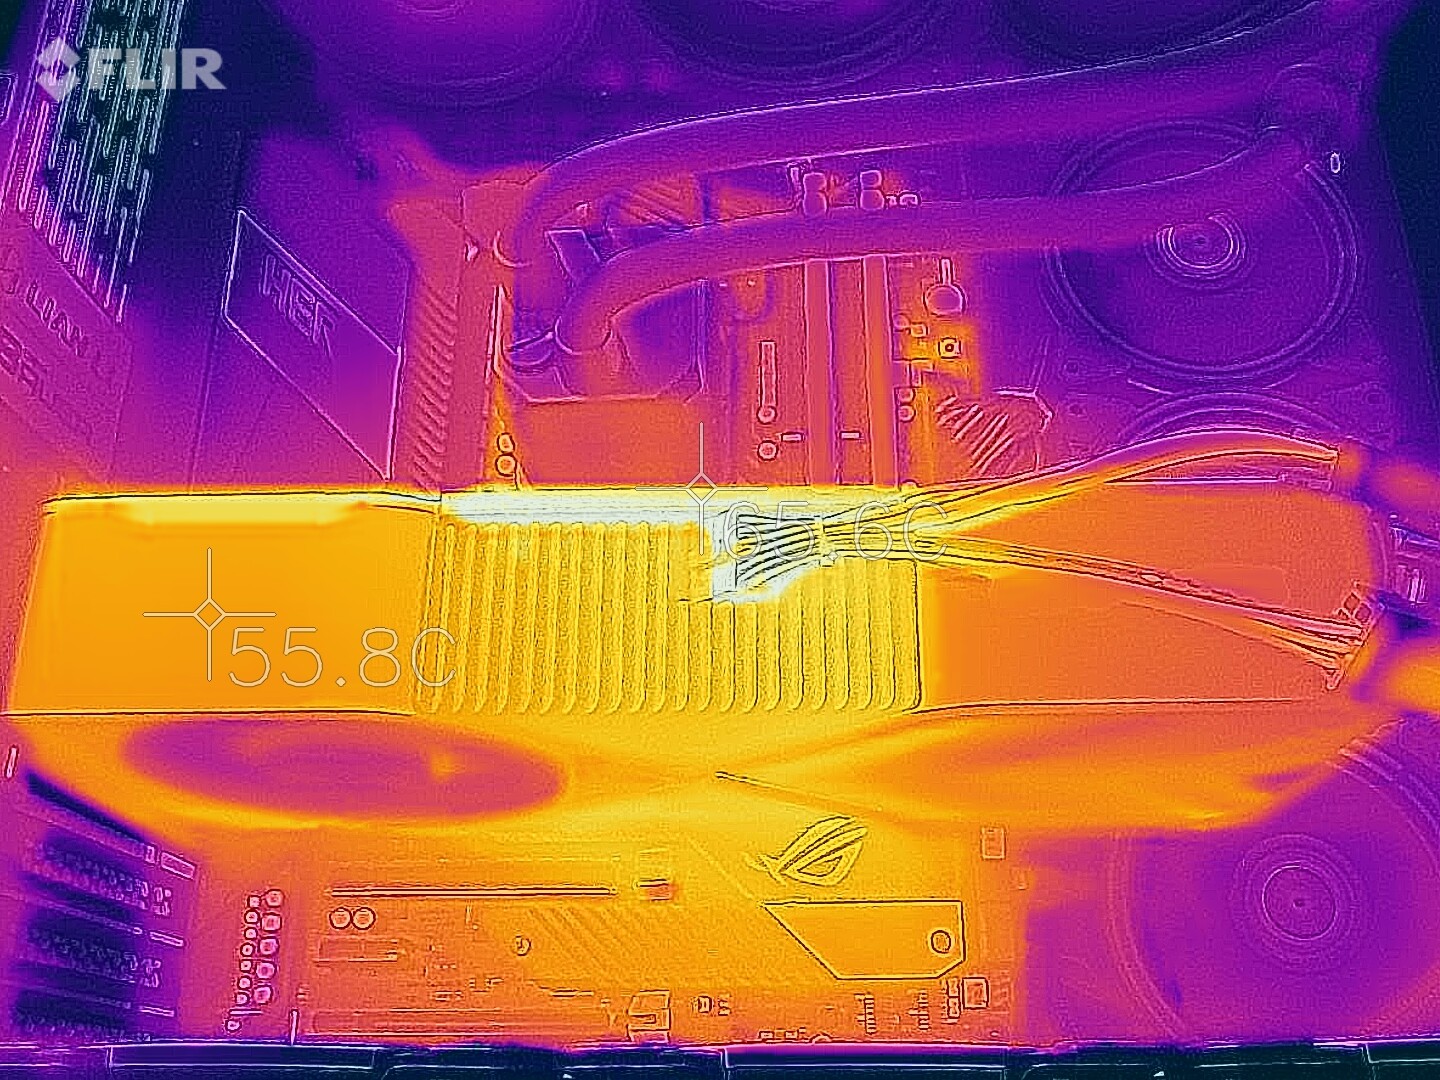
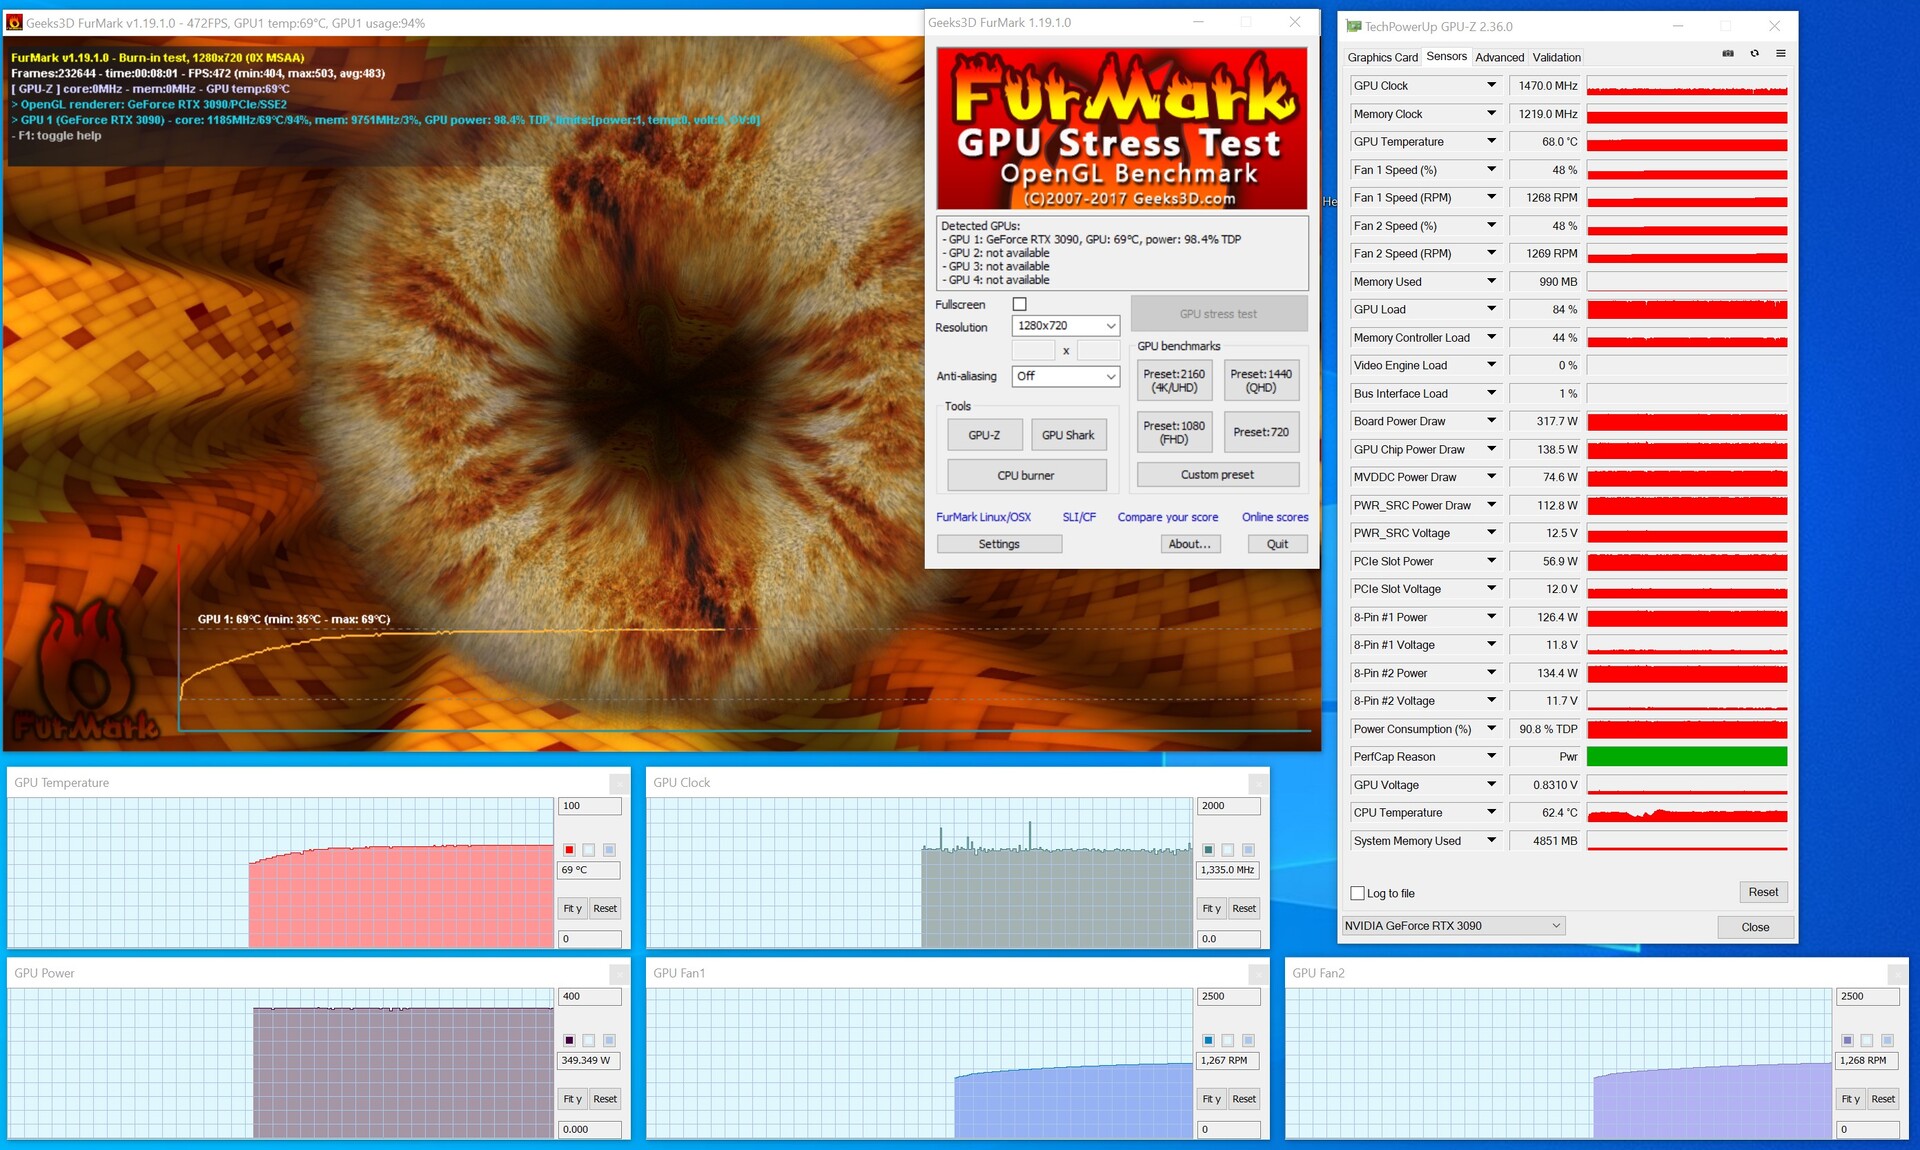
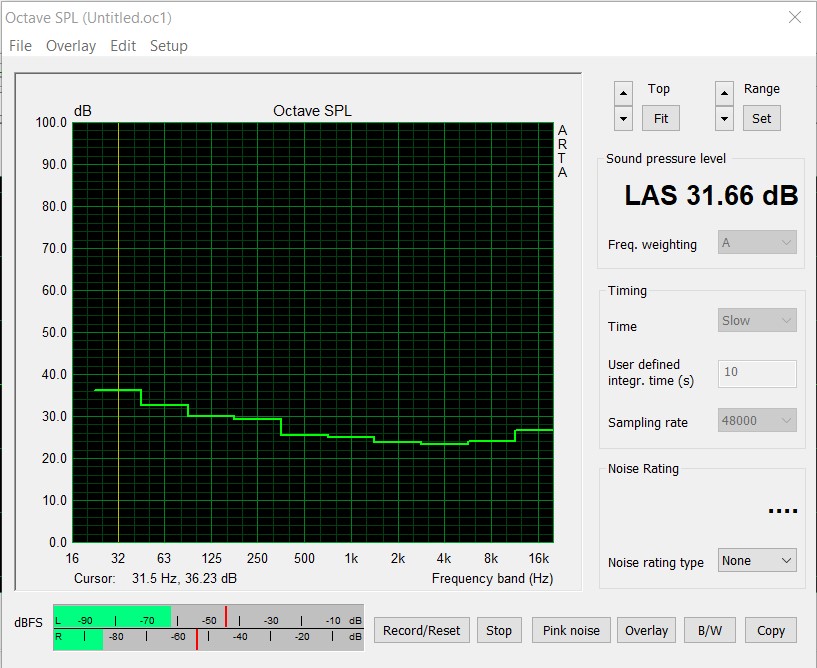
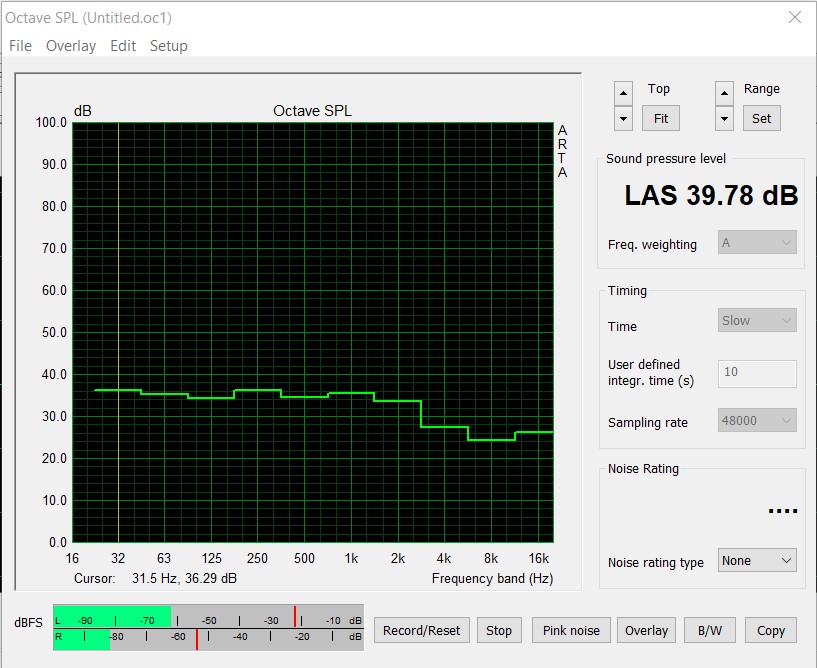
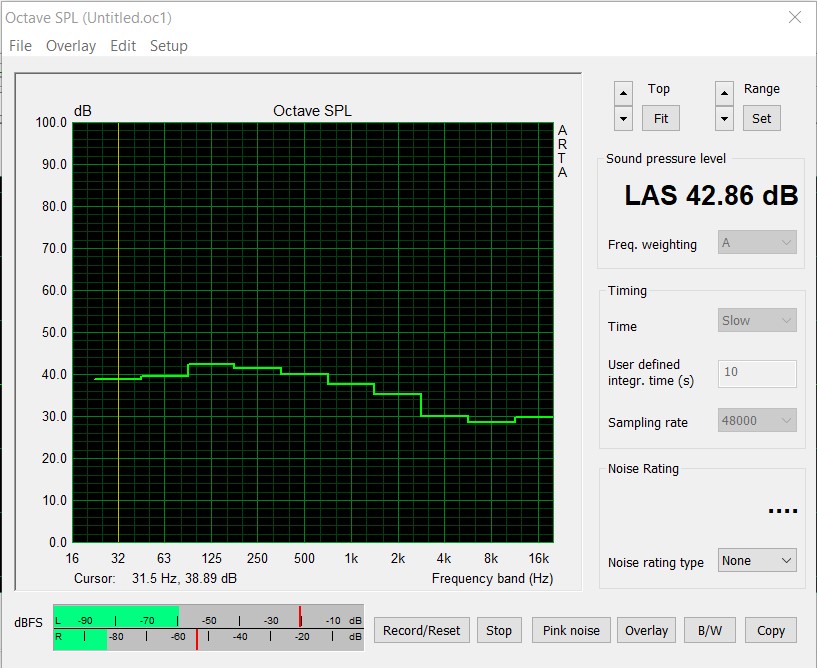
Il sistema di raffreddamento di nuova concezione funziona bene, e la modalità fan-stop permette ora un funzionamento 2D silenzioso. Le grandi ventole da 110 millimetri iniziano a ruotare solo sotto carico. Tuttavia, rimangono sorprendentemente silenziose sotto carico. Abbiamo misurato poco meno di 40 dB(A) nello stress test e poco meno di 43 dB(A) durante il gioco. Le ventole dell'AIO installato fanno aumentare un po' il rumore, dato che la CPU viene spinta più forte durante il gaming. Il case della scheda grafica si riscalda rapidamente, e le immagini della termocamera mostrano che il calore è ben distribuito. Tuttavia, ci sono punti caldi sul retro della scheda grafica che raggiungono gli 84 °C (~183 °F), il che è causato dalla VRAM che è installata sotto. La temperatura della GPU è sorprendentemente fresca a 69 °C (~156 °F). Tuttavia, la VRAM diventa molto più calda a circa 95 °C (~203 °F).
* ... Meglio usare valori piccoli
Pro
Contro
Valutazione complessiva - Grande, silenziosa e veloce

L'ammiraglia di Nvidia, la GeForce RTX 3090, è senza dubbio una delle schede grafiche più veloci sul mercato. Tuttavia, la Founders Edition deve ammettere la sconfitta contro i design personalizzati di alcuni produttori a causa del limite TDP di 350 watt. Nel frattempo, partner di schede come EVGA offrono GeForce RTX 3090 modelli fino a 500 watt. Tuttavia, la versione che abbiamo testato è adatta per giocare a risoluzioni molto alte senza restrizioni. La qualità costruttiva è molto buona, anche se il nuovo connettore di alimentazione a 12 pin è stato collocato in una posizione molto sfavorevole. La scheda grafica dà anche una sensazione di alta qualità, e il peso elevato beneficia del dissipatore di calore, che finalmente offre anche una modalità di arresto della ventola. Ma anche sotto carico, la scheda grafica non attira eccessiva attenzione su di sé. Le grandi ventole spingono molta aria attraverso le alette di raffreddamento e producono un rumore a bassa frequenza, che viene percepito come un po' più silenzioso di quello che indica il nostro dispositivo di misurazione.
Con la GeForce RTX 3090, Nvidia offre una scheda grafica di fascia alta per il gioco 4K senza compromessi.
Il grande vantaggio della GeForce RTX 3090 è la VRAM che ha ben 24 GB di capacità. Questo è più del doppio rispetto alla GeForce RTX 3080. AMD è nel campo medio con le sue attuali schede grafiche e le equipaggia con 16 GB. Tuttavia, la GeForce RTX 3090 può prevalere sulla concorrenza, soprattutto nel gioco 4K. Il punto va chiaramente alla RTX 3090 in questo caso.
A questo punto, possiamo solo ripeterci quando si parla di disponibilità. La situazione attuale è ancora invariata, e l'attuale prezzo di 1.549 euro (~$1.866) è ancora solo un sogno per molti utenti che vogliono acquistare la Nvidia GeForce RTX 3090 Founders Edition. Con un po' di fortuna, tuttavia, è possibile ottenere questo modello direttamente da Nvidia. Di tanto in tanto, il modello è elencato sul loro sito.
